Forest City Enterprises Boston Investor Day – October 7, 2014 EXHIBIT 99.1
INFORMATION RELATED TO FORWARD-LOOKING STATEMENTS Statements made in this presentation that state the Company’s or management's intentions, hopes, beliefs, expectations or predictions of the future are forward-looking statements. It is important to note that the Company's future events and actual results, financial or otherwise, could differ materially from those projected in such forward-looking statements. Additional information concerning factors that could cause future events or actual results to differ materially from those in the forward-looking statements are included in the “Risk Factors” section of the Company's SEC filings, including, but not limited to, the Company's Annual Report and quarterly reports. You are cautioned not to place undue reliance on such forward-looking statements. USE OF NON-GAAP MEASURES We frequently use the non‐GAAP measures of funds from operations (“FFO”), operating funds from operations (“Operating FFO”), net operating income (“NOI”), Comparable NOI, and measures based on the pro‐rata consolidation method (“pro‐rata”) to explain operating performance and assist investors in evaluating our business. In addition, we present a schedule of components to assist investors in determining the “net asset value” (“NAV”) of the Company and an implied cap rate, also non-GAAP measures. For a more thorough discussion of FFO, Operating FFO, NOI, Comparable NOI, pro‐rata measures, and NAV, including how we reconcile these applicable measures to their GAAP counterparts, please refer to the Supplemental Package furnished to the SEC on Form 8‐K on August 6, 2014. Copies of our quarterly and annual Supplemental Packages can be found on our website at www.forestcity.net, or on the SEC’s website at www.sec.gov. Please note: we periodically post updated investor presentations on the Investors page of our website at www.forestcity.net. It is possible the periodic updates may include information deemed to be material. Therefore, we encourage investors, the media, and other interested parties to review the Investors page of our website at www.forestcity.net for the most recent investor presentation. 2

Company Overview 3
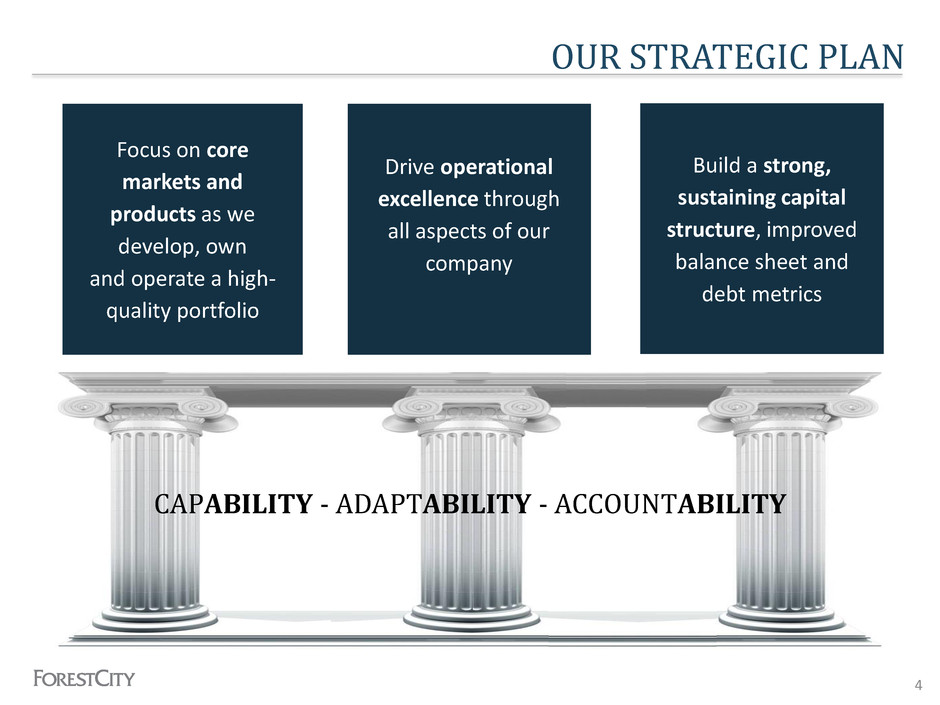
OUR STRATEGIC PLAN CAPABILITY - ADAPTABILITY - ACCOUNTABILITY Drive operational excellence through all aspects of our company Focus on core markets and products as we develop, own and operate a high- quality portfolio Build a strong, sustaining capital structure, improved balance sheet and debt metrics 4
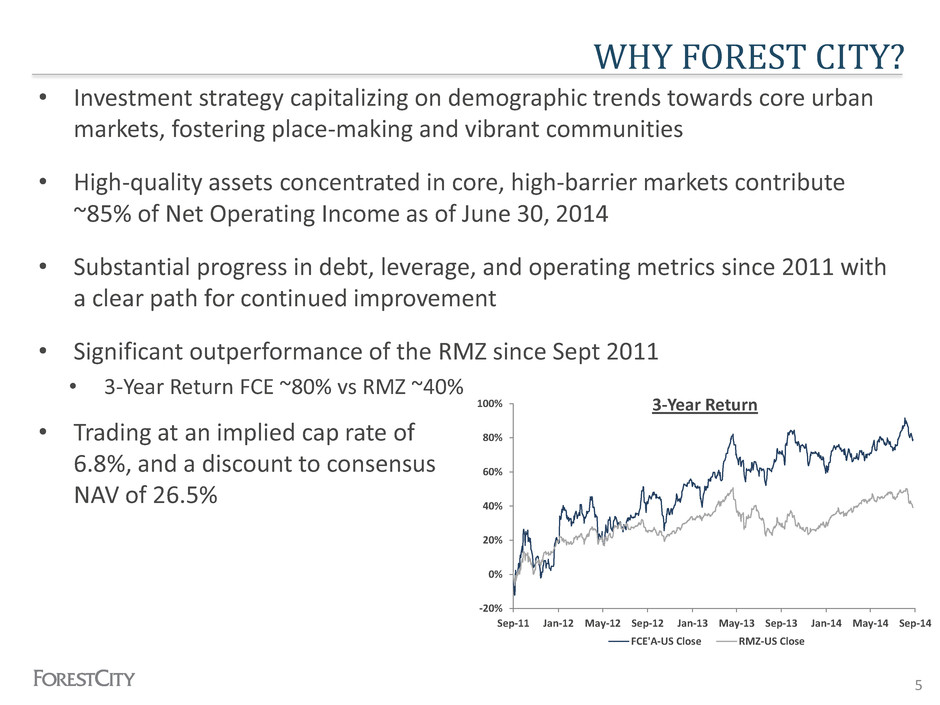
-20% 0% 20% 40% 60% 80% 100% Sep-11 Jan-12 May-12 Sep-12 Jan-13 May-13 Sep-13 Jan-14 May-14 Sep-14 3-Year Return FCE'A-US Close RMZ-US Close WHY FOREST CITY? 5 • Investment strategy capitalizing on demographic trends towards core urban markets, fostering place-making and vibrant communities • High-quality assets concentrated in core, high-barrier markets contribute ~85% of Net Operating Income as of June 30, 2014 • Substantial progress in debt, leverage, and operating metrics since 2011 with a clear path for continued improvement • Significant outperformance of the RMZ since Sept 2011 • 3-Year Return FCE ~80% vs RMZ ~40% • Trading at an implied cap rate of 6.8%, and a discount to consensus NAV of 26.5%
Operational Excellence 6
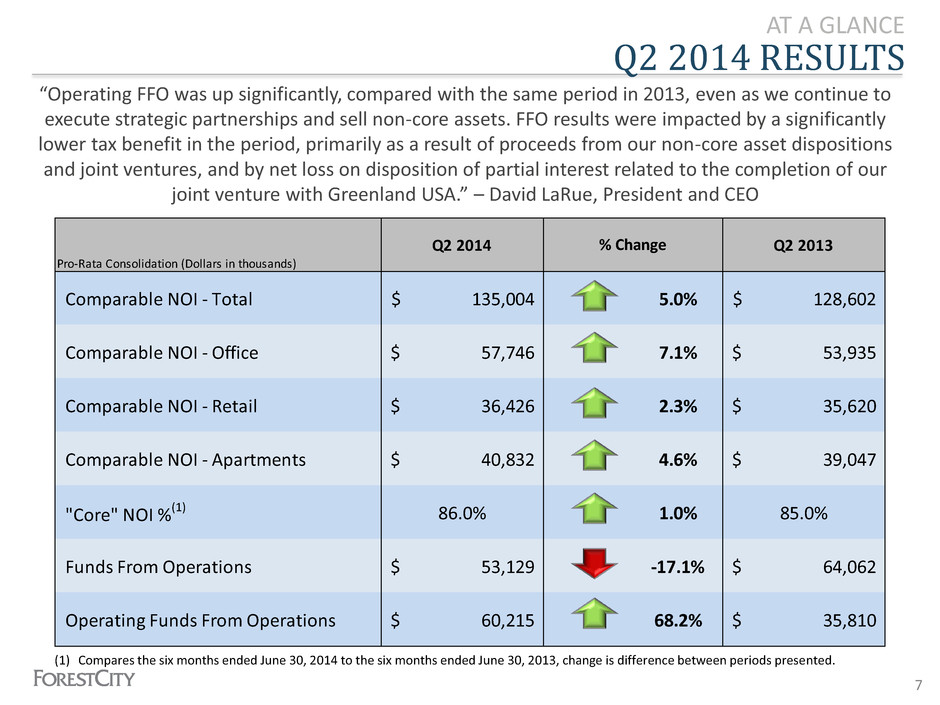
Pro-Rata Consolidation (Dollars in thousands) Q2 2014 Q2 2013 Comparable NOI - Total 135,004$ 5.0% 128,602$ Comparable NOI - Office 57,746$ 7.1% 53,935$ Comparable NOI - Retail 36,426$ 2.3% 35,620$ Comparable NOI - Apartments 40,832$ 4.6% 39,047$ "Core" NOI %(1) 86.0% 1.0% 85.0% Funds From Operations 53,129$ -17.1% 64,062$ Operating Funds From Operations 60,215$ 68.2% 35,810$ % Change AT A GLANCE “Operating FFO was up significantly, compared with the same period in 2013, even as we continue to execute strategic partnerships and sell non-core assets. FFO results were impacted by a significantly lower tax benefit in the period, primarily as a result of proceeds from our non-core asset dispositions and joint ventures, and by net loss on disposition of partial interest related to the completion of our joint venture with Greenland USA.” – David LaRue, President and CEO Q2 2014 RESULTS 7 (1) Compares the six months ended June 30, 2014 to the six months ended June 30, 2013, change is difference between periods presented.
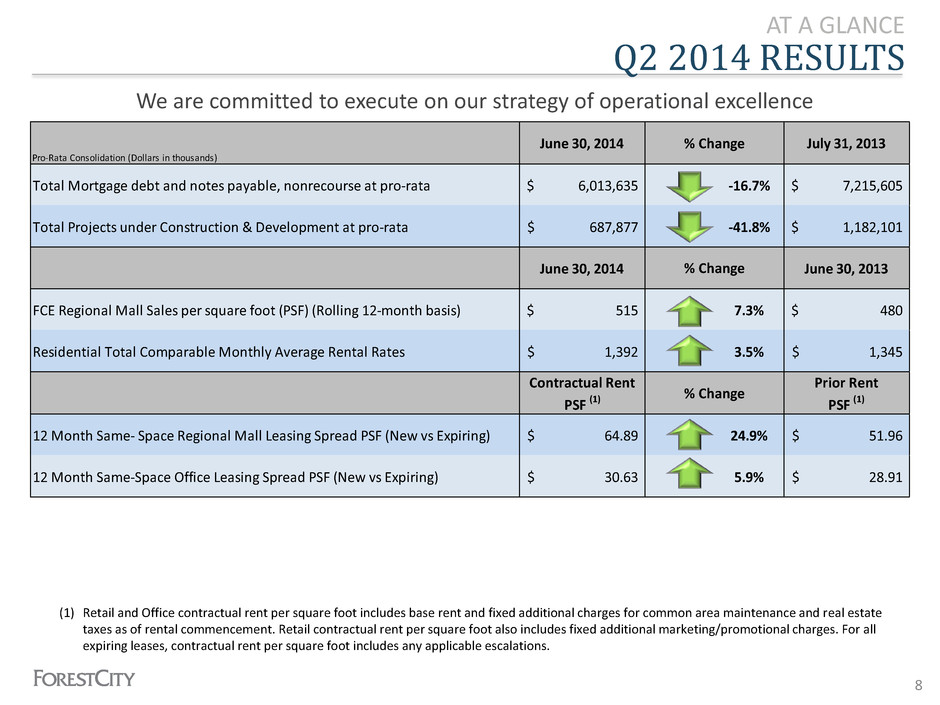
Pro-Rata Consolidation (Dollars in thousands) June 30, 2014 July 31, 2013 Total Mortgage debt and notes payable, nonrecourse at pro-rata 6,013,635$ -16.7% 7,215,605$ Total Projects under Construction & Development at pro-rata 687,877$ -41.8% 1,182,101$ June 30, 2014 June 30, 2013 FCE Regional Mall Sales per square foot (PSF) (Rolling 12-month basis) 515$ 7.3% 480$ Residential Total Comparable Monthly Average Rental Rates 1,392$ 3.5% 1,345$ Contractual Rent PSF (1) Prior Rent PSF (1) 12 Month Same- Space Regional Mall Leasing Spread PSF (New vs Expiring) 64.89$ 24.9% 51.96$ 12 Month Same-Space Office Leasing Spread PSF (New vs Expiring) 30.63$ 5.9% 28.91$ % Change % Change % Change AT A GLANCE We are committed to execute on our strategy of operational excellence Q2 2014 RESULTS 8 (1) Retail and Office contractual rent per square foot includes base rent and fixed additional charges for common area maintenance and real estate taxes as of rental commencement. Retail contractual rent per square foot also includes fixed additional marketing/promotional charges. For all expiring leases, contractual rent per square foot includes any applicable escalations.

Focus on the Core 9
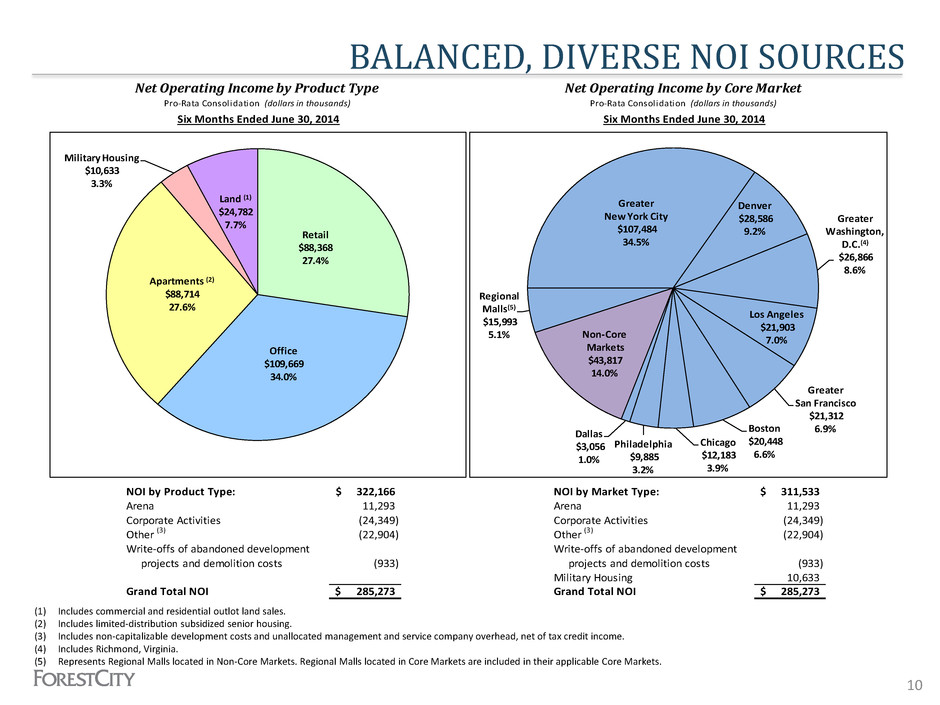
BALANCED, DIVERSE NOI SOURCES 10 (1) Includes commercial and residential outlot land sales. (2) Includes limited-distribution subsidized senior housing. (3) Includes non-capitalizable development costs and unallocated management and service company overhead, net of tax credit income. (4) Includes Richmond, Virginia. (5) Represents Regional Malls located in Non-Core Markets. Regional Malls located in Core Markets are included in their applicable Core Markets. NOI by Product Type: 322,166$ NOI by Market Type: 311,533$ Arena 11,293 Arena 11,293 Corporate Activities (24,349) Corporate Activities (24,349) Other (3) (22,904) Other (3) (22,904) Write-offs of abandoned development Write-offs of abandoned development projects and demolition costs (933) projects and demolition costs Military Housing 10,633 Grand Total NOI 285,273$ Grand Total NOI 285,273$ (933) Net Operating Income by Product Type Net Operating Income by Core Market Pro-Rata Consolidation (dollars in thousands) Pro-Rata Consolidation (dollars in thousands) Six Months Ended June 30, 2014 Six Months Ended June 30, 2014 Retail $88,368 27.4% Office $109,669 34.0% Apartments (2) $88,714 27.6% Military Housing $10,633 3.3% Land (1) $24,782 7.7% Greater New York City $107,484 34.5% Denver $28,586 9.2% Greater Washington, D.C.(4) $26,866 8.6% Los Angeles $21,903 7.0% Greater San Francisco $21,312 6.9%Boston $20,448 6.6% Chicago $12,183 3.9% Philadelphia $9,885 3.2% Dallas $3,056 1.0% Non-Core Markets $43,817 14.0% Regional Malls(5) $15,993 5.1%
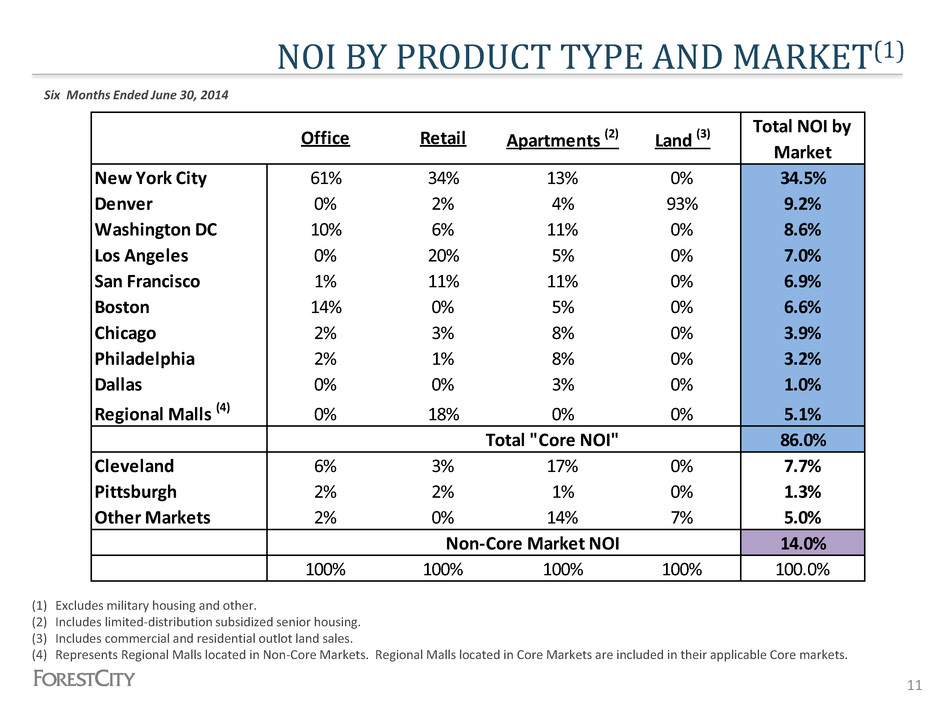
NOI BY PRODUCT TYPE AND MARKET(1) 11 (1) Excludes military housing and other. (2) Includes limited-distribution subsidized senior housing. (3) Includes commercial and residential outlot land sales. (4) Represents Regional Malls located in Non-Core Markets. Regional Malls located in Core Markets are included in their applicable Core markets. Six Months Ended June 30, 2014 New York City 61% 34% 13% 0% 34.5% Denver 0% 2% 4% 93% 9.2% Washington DC 10% 6% 11% 0% 8.6% Los Angeles 0% 20% 5% 0% 7.0% San Francisco 1% 11% 11% 0% 6.9% Boston 14% 0% 5% 0% 6.6% Chicago 2% 3% 8% 0% 3.9% Philadelphia 2% 1% 8% 0% 3.2% Dallas 0% 0% 3% 0% 1.0% Regional Malls (4) 0% 18% 0% 0% 5.1% Total "Core NOI" 86.0% Cleveland 6% 3% 17% 0% 7.7% Pittsburgh 2% 2% 1% 0% 1.3% Other Markets 2% 0% 14% 7% 5.0% Non-Core Market NOI 14.0% 100% 100% 100% 100% 100.0% Office Retail Apartments (2) Total NOI by Market Land (3)
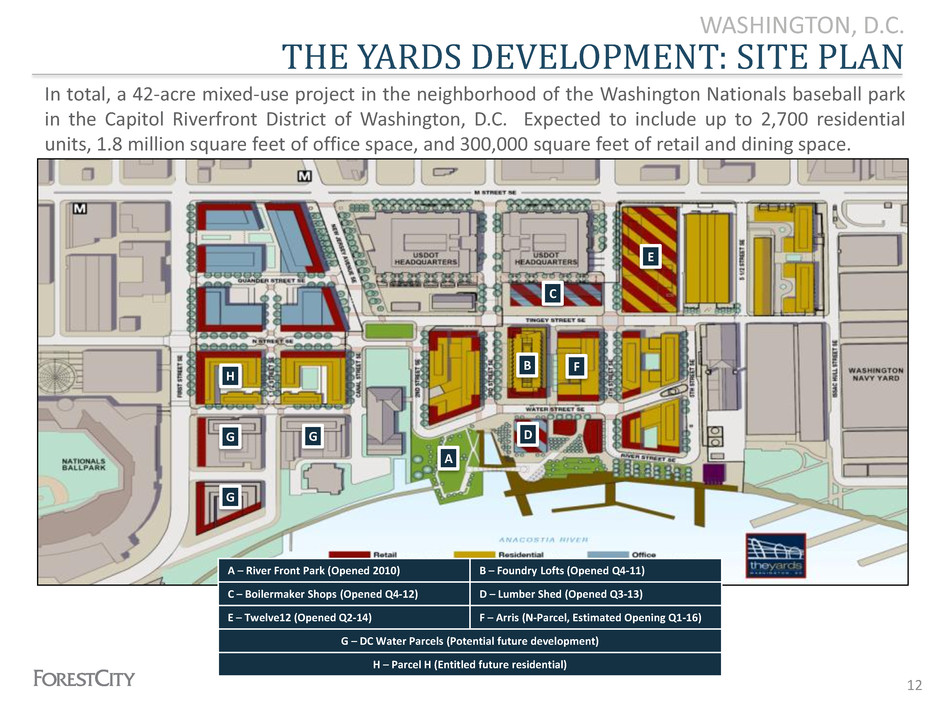
THE YARDS DEVELOPMENT: SITE PLAN WASHINGTON, D.C. In total, a 42-acre mixed-use project in the neighborhood of the Washington Nationals baseball park in the Capitol Riverfront District of Washington, D.C. Expected to include up to 2,700 residential units, 1.8 million square feet of office space, and 300,000 square feet of retail and dining space. A B C D E F G G G H A – River Front Park (Opened 2010) B – Foundry Lofts (Opened Q4-11) C – Boilermaker Shops (Opened Q4-12) D – Lumber Shed (Opened Q3-13) E – Twelve12 (Opened Q2-14) F – Arris (N-Parcel, Estimated Opening Q1-16) G – DC Water Parcels (Potential future development) H – Parcel H (Entitled future residential) 12
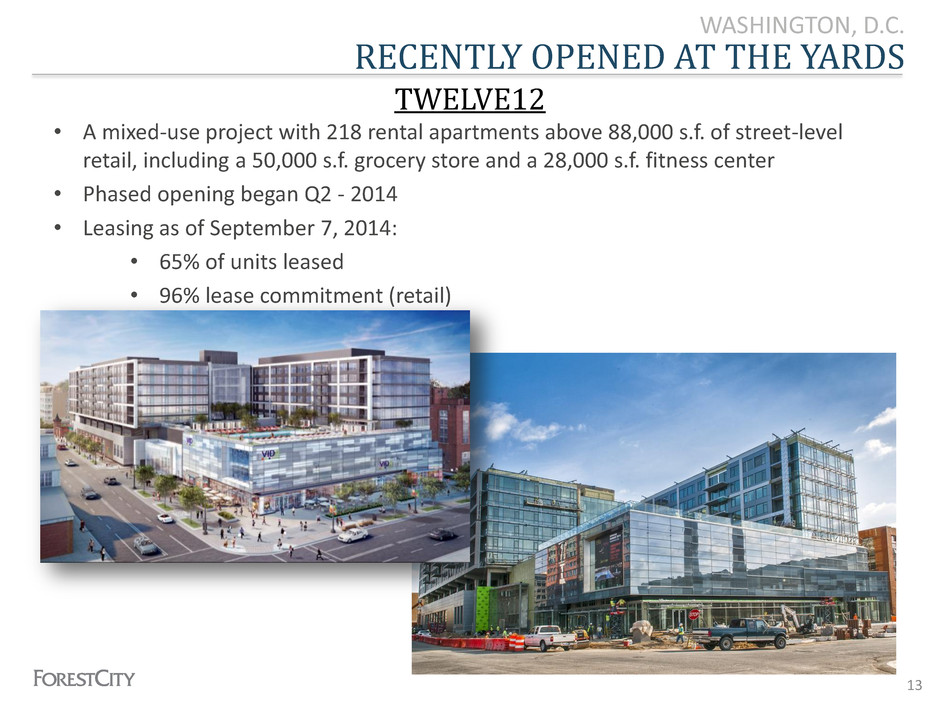
RECENTLY OPENED AT THE YARDS WASHINGTON, D.C. • A mixed-use project with 218 rental apartments above 88,000 s.f. of street-level retail, including a 50,000 s.f. grocery store and a 28,000 s.f. fitness center • Phased opening began Q2 - 2014 • Leasing as of September 7, 2014: • 65% of units leased • 96% lease commitment (retail) TWELVE12 13
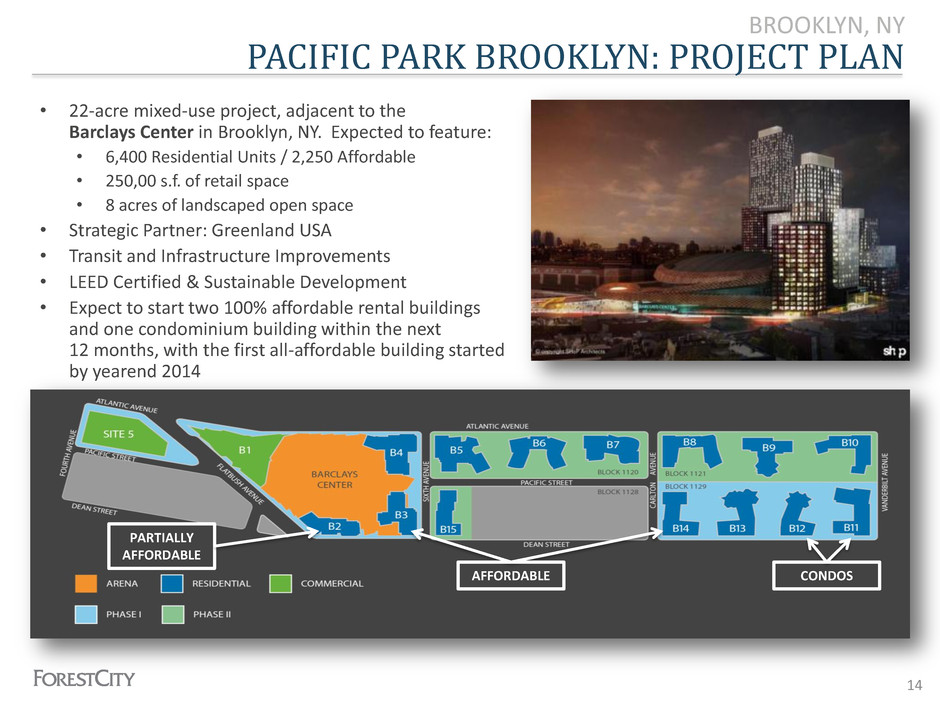
PACIFIC PARK BROOKLYN: PROJECT PLAN BROOKLYN, NY • 22-acre mixed-use project, adjacent to the Barclays Center in Brooklyn, NY. Expected to feature: • 6,400 Residential Units / 2,250 Affordable • 250,00 s.f. of retail space • 8 acres of landscaped open space • Strategic Partner: Greenland USA • Transit and Infrastructure Improvements • LEED Certified & Sustainable Development • Expect to start two 100% affordable rental buildings and one condominium building within the next 12 months, with the first all-affordable building started by yearend 2014 14 PARTIALLY AFFORDABLE AFFORDABLE CONDOS
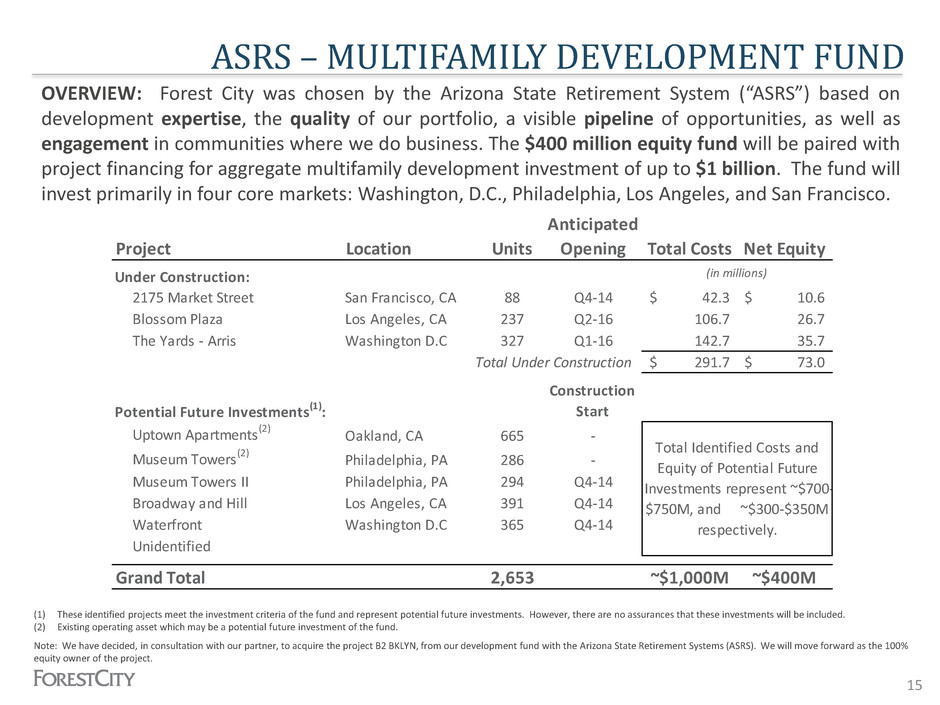
ASRS – MULTIFAMILY DEVELOPMENT FUND 15 OVERVIEW: Forest City was chosen by the Arizona State Retirement System (“ASRS”) based on development expertise, the quality of our portfolio, a visible pipeline of opportunities, as well as engagement in communities where we do business. The $400 million equity fund will be paired with project financing for aggregate multifamily development investment of up to $1 billion. The fund will invest primarily in four core markets: Washington, D.C., Philadelphia, Los Angeles, and San Francisco. (1) These identified projects meet the investment criteria of the fund and represent potential future investments. However, there are no assurances that these investments will be included. (2) Existing operating asset which may be a potential future investment of the fund. Note: We have decided, in consultation with our partner, to acquire the project B2 BKLYN, from our development fund with the Arizona State Retirement Systems (ASRS). We will move forward as the 100% equity owner of the project. Anticipated Project Location Units Opening Total Costs Net Equity Under Construction: 2175 Market Street San Francisco, CA 88 Q4-14 42.3$ 10.6$ Blossom Plaza Los Angeles, CA 237 Q2-16 106.7 26.7 The Yards - Arris Washington D.C 327 Q1-16 142.7 35.7 Total Under Construction 291.7$ 73.0$ Potential Future Investments(1): Uptown Apartments(2) Oakland, CA 665 - Museu Towers(2) Philadelphia, PA 286 - Mus u Towers II Philadelphia, PA 294 Q4-14 Broadway and Hill Los Angeles, CA 391 Q4-14 Waterfront Washington D.C 365 Q4-14 Unidentified Grand Total 2,653 ~$1,000M ~$400M Total Identified Costs and Equity of Potential Future Investments represent ~$700- $750M, and ~$300-$350M respectively. Construction Start (in millions)
Sustainable Capital Structure 16
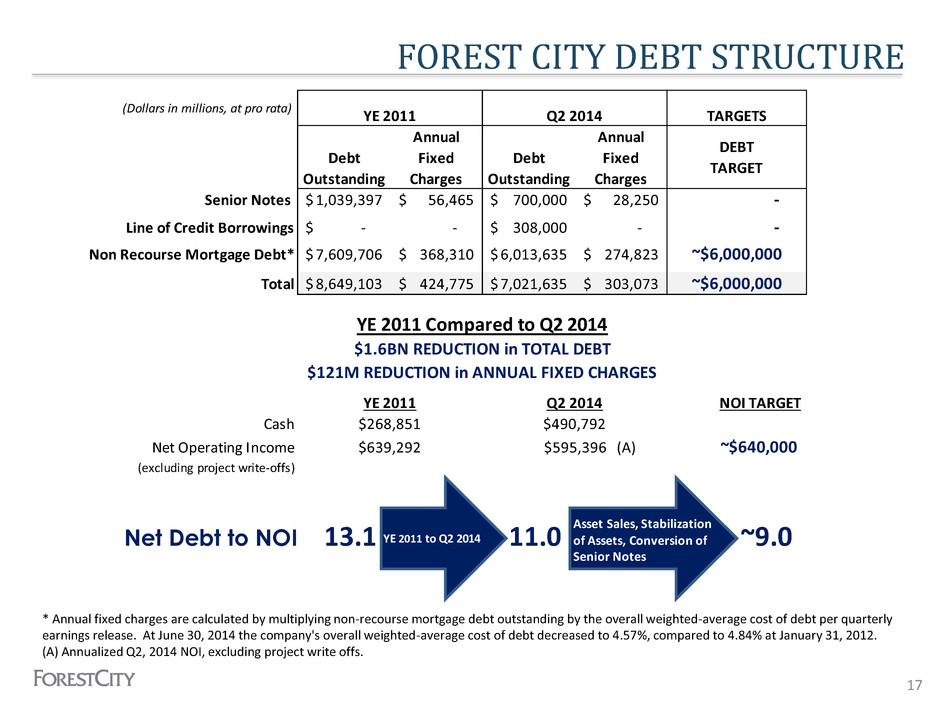
FOREST CITY DEBT STRUCTURE 17 * Annual fixed charges are calculated by multiplying non-recourse mortgage debt outstanding by the overall weighted-average cost of debt per quarterly earnings release. At June 30, 2014 the company's overall weighted-average cost of debt decreased to 4.57%, compared to 4.84% at January 31, 2012. (A) Annualized Q2, 2014 NOI, excluding project write offs. (Dollars in millions, at pro rata) Debt Outstanding Annual Fixed Charges Debt Outstanding Annual Fixed Charges Senior Notes 1,039,397$ 56,465$ 700,000$ 28,250$ Line of Credit Borrowings -$ - 308,000$ - Non Recourse Mortgage Debt* 7,609,706$ 368,310$ 6,013,635$ 274,823$ Total 8,649,103$ 424,775$ 7,021,635$ 303,073$ NOI TARGET Cash Net Operating Income (excluding project write-offs) Net Debt to NOI 13.1 11.0 YE 2011 Compared to Q2 2014 $1.6BN REDUCTION in TOTAL DEBT $121M REDUCTION in ANNUAL FIXED CHARGES YE 2011 $268,851 $639,292 Q2 2014 $490,792 $595,396 (A) ~$640,000 ~9.0 YE 2011 Q2 2014 TARGETS DEBT TARGET - - ~$6,000,000 ~$6,000,000 YE 2011 to Q2 2014 Asset Sales, Stabilization of Assets, Conversion of Senior Notes
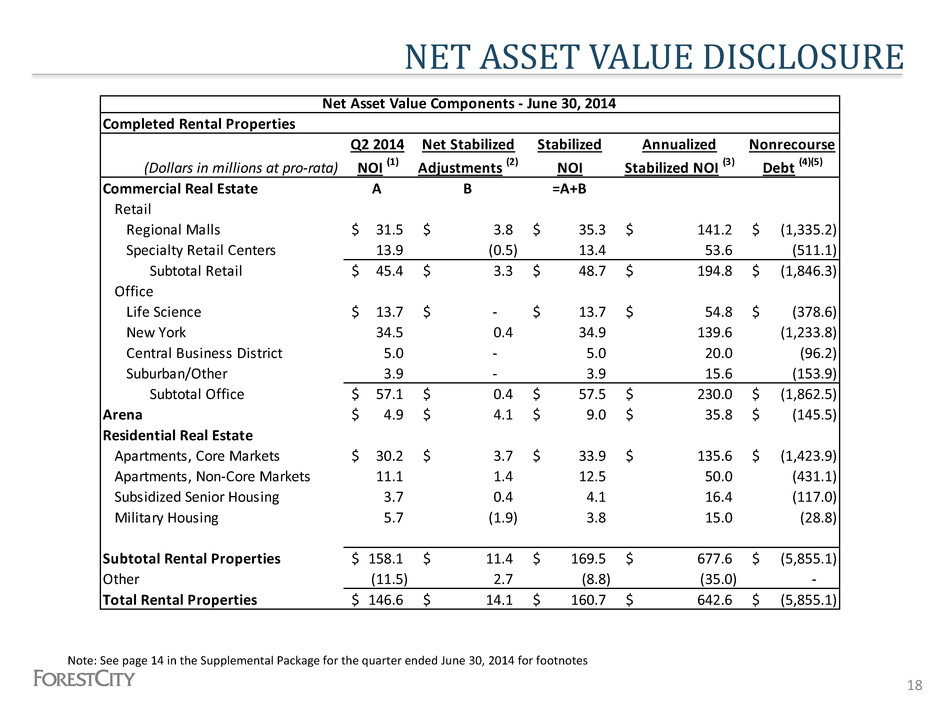
NET ASSET VALUE DISCLOSURE Note: See page 14 in the Supplemental Package for the quarter ended June 30, 2014 for footnotes 18 Q2 2014 Net Stabilized Stabilized Annualized Nonrecourse (Dollars in millions at pro-rata) NOI (1) Adjustments (2) NOI Stabilized NOI (3) Debt (4)(5) Commercial Real Estate A B =A+B Retail Regional Malls 31.5$ 3.8$ 35.3$ 141.2$ (1,335.2)$ Specialty Retail Centers 13.9 (0.5) 13.4 53.6 (511.1) Subtotal Retail 45.4$ 3.3$ 48.7$ 194.8$ (1,846.3)$ Office Life Science 13.7$ -$ 13.7$ 54.8$ (378.6)$ New York 34.5 0.4 34.9 139.6 (1,233.8) Central Business District 5.0 - 5.0 20.0 (96.2) Suburban/Other 3.9 - 3.9 15.6 (153.9) Subtotal Office 57.1$ 0.4$ 57.5$ 230.0$ (1,862.5)$ Arena 4.9$ 4.1$ 9.0$ 35.8$ (145.5)$ Residential Real Estate Apartments, Core Markets 30.2$ 3.7$ 33.9$ 135.6$ (1,423.9)$ Apartments, Non-Core Markets 11.1 1.4 12.5 50.0 (431.1) Subsidized Senior Housing 3.7 0.4 4.1 16.4 (117.0) Military Housing 5.7 (1.9) 3.8 15.0 (28.8) Subtotal Rental Properties 158.1$ 11.4$ 169.5$ 677.6$ (5,855.1)$ Other (11.5) 2.7 (8.8) (35.0) - Total Rental Properties 146.6$ 14.1$ 160.7$ 642.6$ (5,855.1)$ Net Asset Value Components - June 30, 2014 Completed Rental Properties

NET ASSET VALUE DISCLOSURE 19 As of June 30, 2014 (Dollars in millions at pro-rata) Nonrecourse Net Book Book Value (4) Debt (4)(5) Value Development Pipeline Projects under construction (5) 134.1$ (46.1)$ $ 88.0 Projects under development 478.9$ (103.9)$ $ 375.0 Land inventory 117.2$ (8.6)$ $ 108.6 $ 571.6 Cash and equivalents 490.8$ $ 490.8 Restricted cash and escrowed funds 315.8$ $ 315.8 Notes and accounts receivable, net (6) 534.7$ $ 534.7 Net investments and advances to unconsolidated entities 137.0$ $ 137.0 Prepaid expenses and other deferred costs, net 144.3$ $ 144.3 $ 1,622.6 Revolving credit facility (308.0)$ $ (308.0) Convertible senior debt (700.0)$ $ (700.0) Less: convertible debt 700.0$ $ 700.0 Construction payables (117.7)$ $ (117.7) (667.5)$ $ (667.5) $ (1,093.2) Weighted Average Shares Outstanding - Diluted Other Tangible Assets Recourse Debt and Other Liabilities Operating accounts payable and accrued expenses (7) Note: See page 14 in the Supplemental Package for the quarter ended June 30, 2014 for footnotes
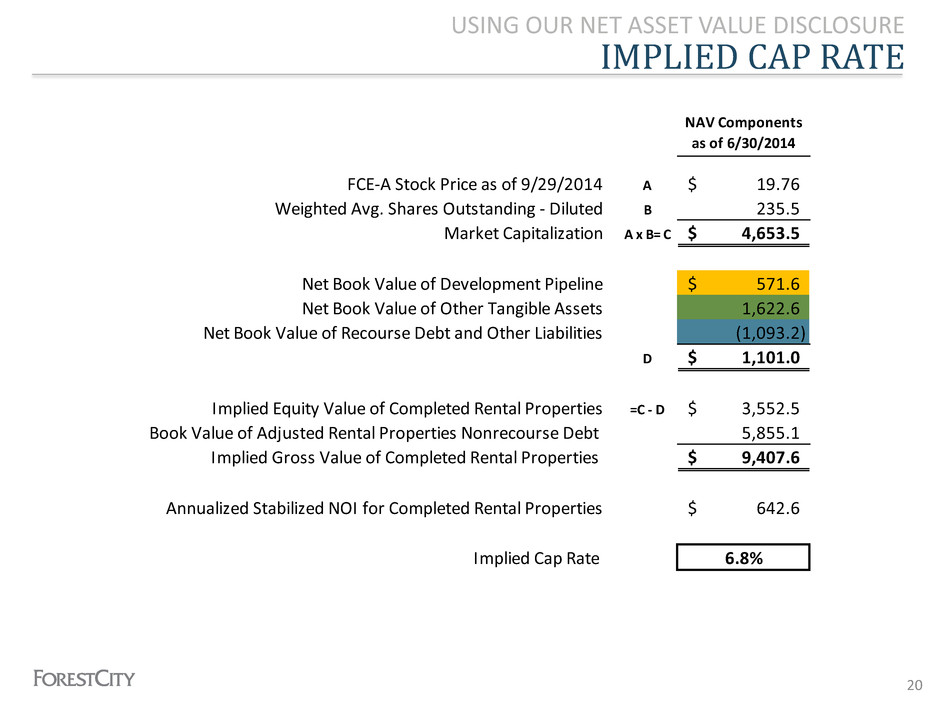
IMPLIED CAP RATE USING OUR NET ASSET VALUE DISCLOSURE 20 NAV Components as of 6/30/2014 FCE-A Stock Price as of 9/29/2014 A 19.76$ Weighted Avg. Shares Outstanding - Diluted B 235.5 Market Capitalization A x B= C 4,653.5$ Net Book Value of Development Pipeline 571.6$ Net Book Value of Other Tangible Assets 1,622.6 Net Book Value of Recourse Debt and Other Liabilities (1,093.2) D 1,101.0$ Implied Equity Value of Completed Rental Properties =C - D 3,552.5$ Book Value of Adjusted Rental Properties Nonrecourse Debt 5,855.1 Implied Gross Value of Completed Rental Properties 9,407.6$ Annualized Stabilized NOI for Completed Rental Properties 642.6$ Implied Cap Rate 6.8%
Forest City Boston Frank Wuest 21
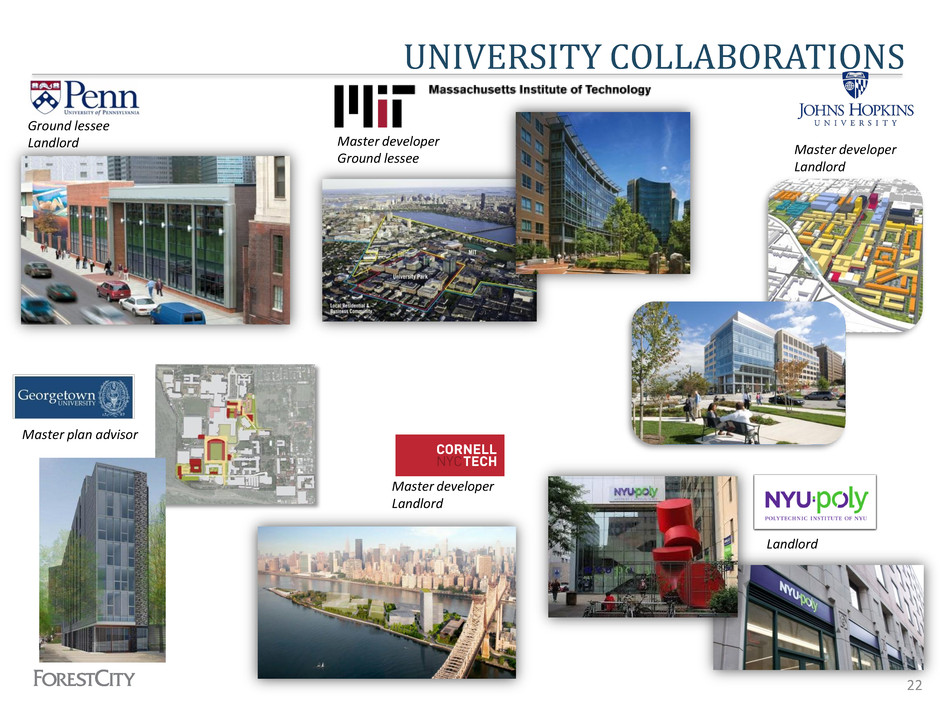
Master developer Ground lessee Ground lessee Landlord Master developer Landlord Landlord Master developer Landlord Master plan advisor UNIVERSITY COLLABORATIONS 22
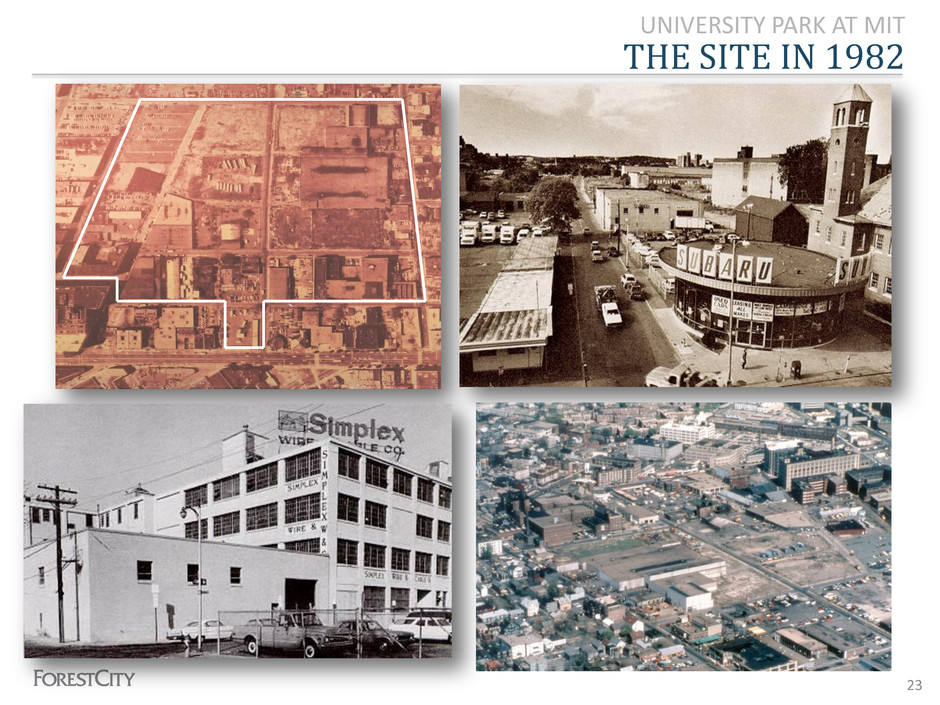
THE SITE IN 1982 UNIVERSITY PARK AT MIT 23
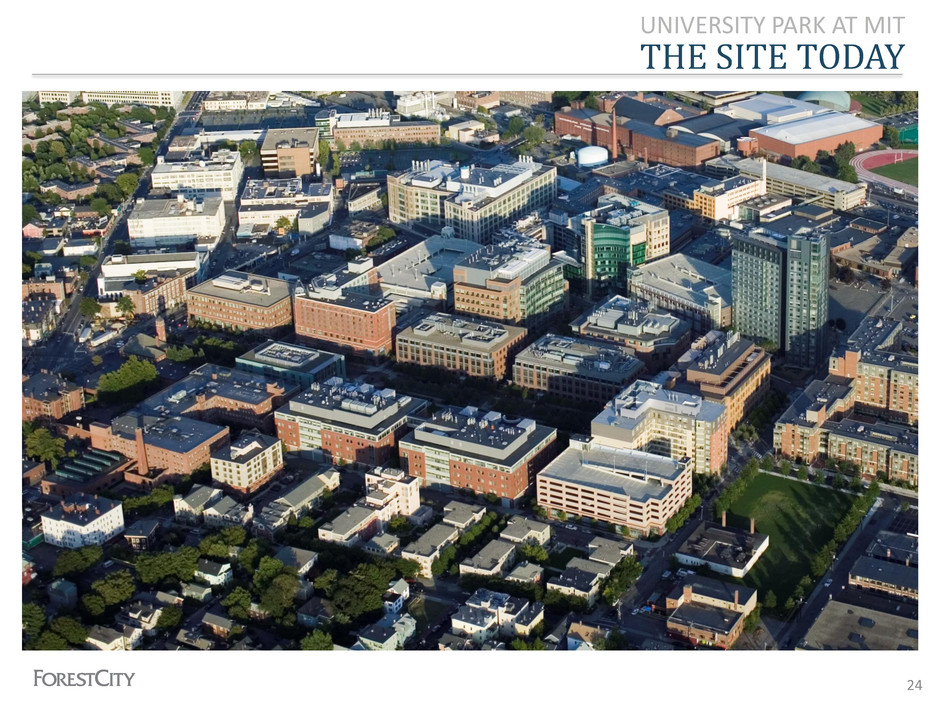
THE SITE TODAY UNIVERSITY PARK AT MIT 24
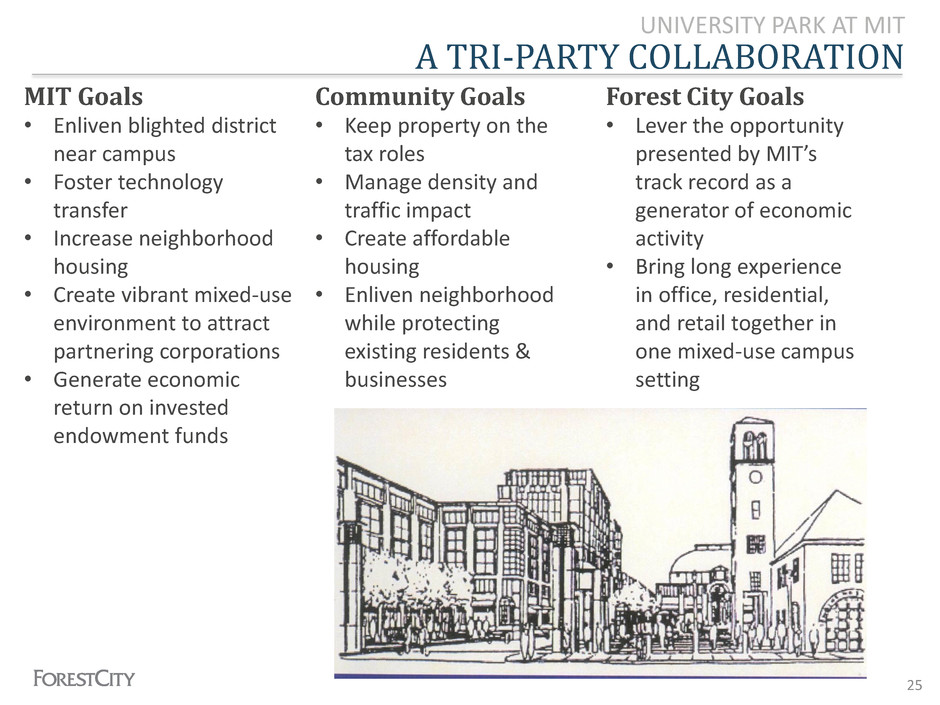
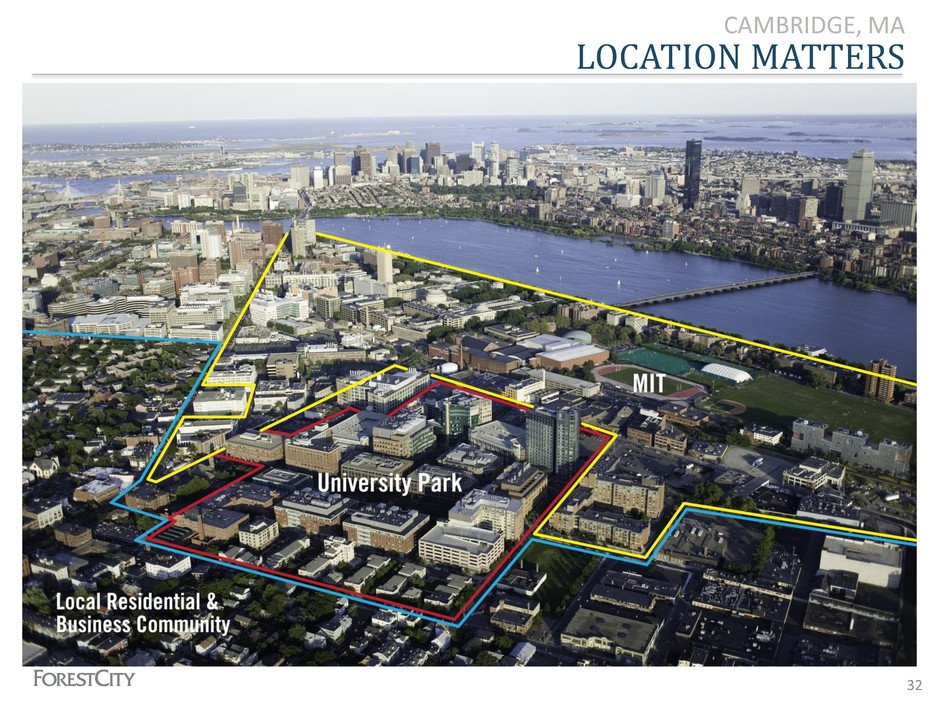
A TRI-PARTY COLLABORATION UNIVERSITY PARK AT MIT MIT Goals • Enliven blighted district near campus • Foster technology transfer • Increase neighborhood housing • Create vibrant mixed-use environment to attract partnering corporations • Generate economic return on invested endowment funds Forest City Goals • Lever the opportunity presented by MIT’s track record as a generator of economic activity • Bring long experience in office, residential, and retail together in one mixed-use campus setting Community Goals • Keep property on the tax roles • Manage density and traffic impact • Create affordable housing • Enliven neighborhood while protecting existing residents & businesses 25
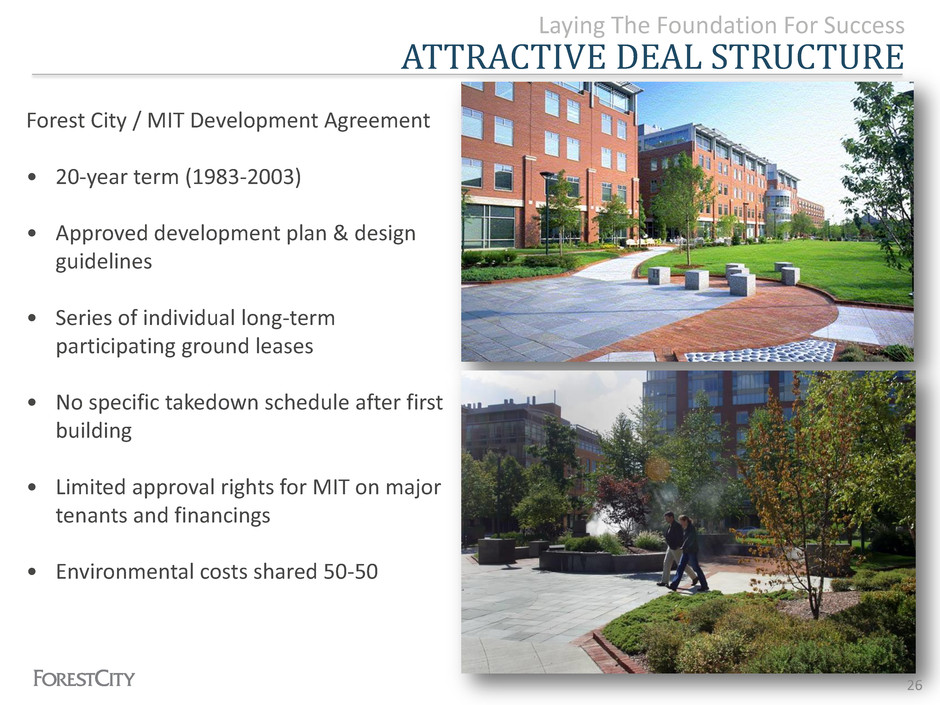
ATTRACTIVE DEAL STRUCTURE Laying The Foundation For Success Forest City / MIT Development Agreement • 20-year term (1983-2003) • Approved development plan & design guidelines • Series of individual long-term participating ground leases • No specific takedown schedule after first building • Limited approval rights for MIT on major tenants and financings • Environmental costs shared 50-50 26
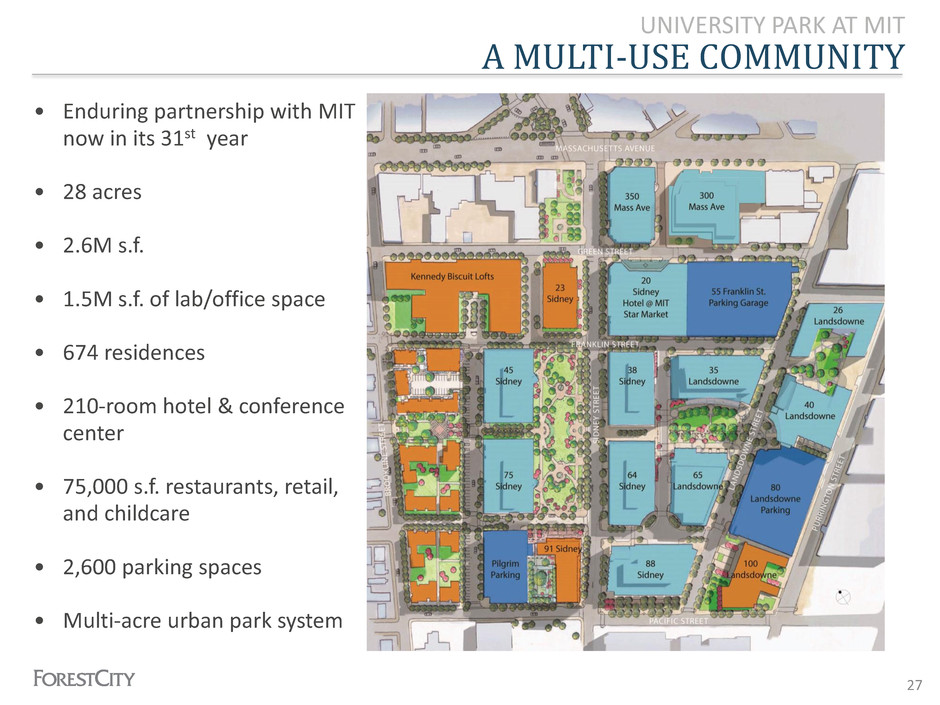
A MULTI-USE COMMUNITY UNIVERSITY PARK AT MIT • Enduring partnership with MIT now in its 31st year • 28 acres • 2.6M s.f. • 1.5M s.f. of lab/office space • 674 residences • 210-room hotel & conference center • 75,000 s.f. restaurants, retail, and childcare • 2,600 parking spaces • Multi-acre urban park system 27
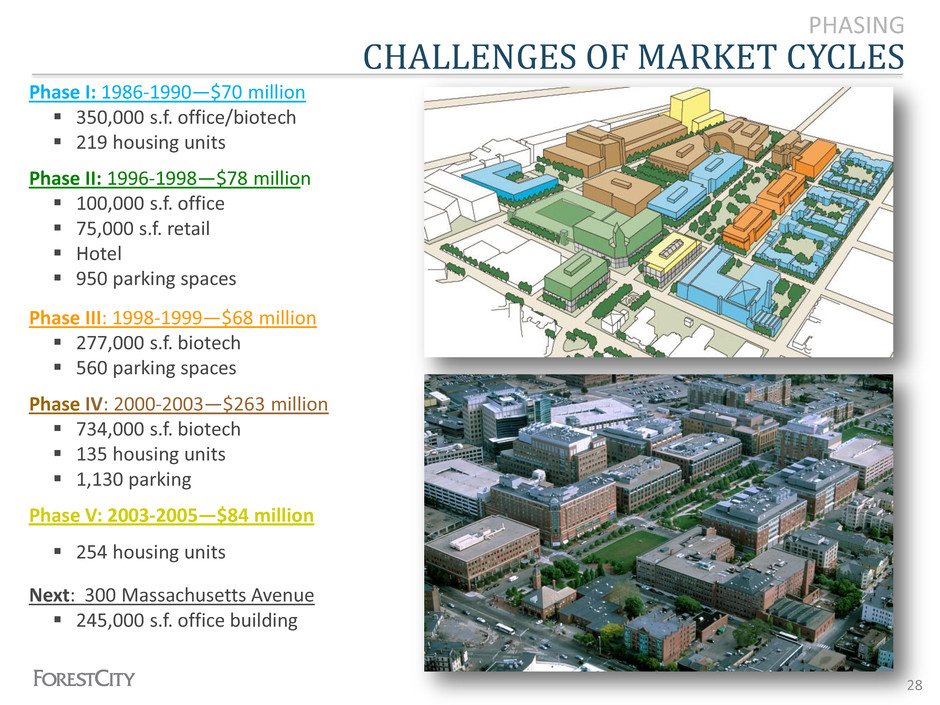
CHALLENGES OF MARKET CYCLES PHASING Phase I: 1986-1990—$70 million 350,000 s.f. office/biotech 219 housing units Phase II: 1996-1998—$78 million 100,000 s.f. office 75,000 s.f. retail Hotel 950 parking spaces Phase III: 1998-1999—$68 million 277,000 s.f. biotech 560 parking spaces Phase IV: 2000-2003—$263 million 734,000 s.f. biotech 135 housing units 1,130 parking spaces Phase V: 2003-2005—$84 million 254 housing units Next: 300 Massachusetts Avenue 245,000 s.f. office building 28
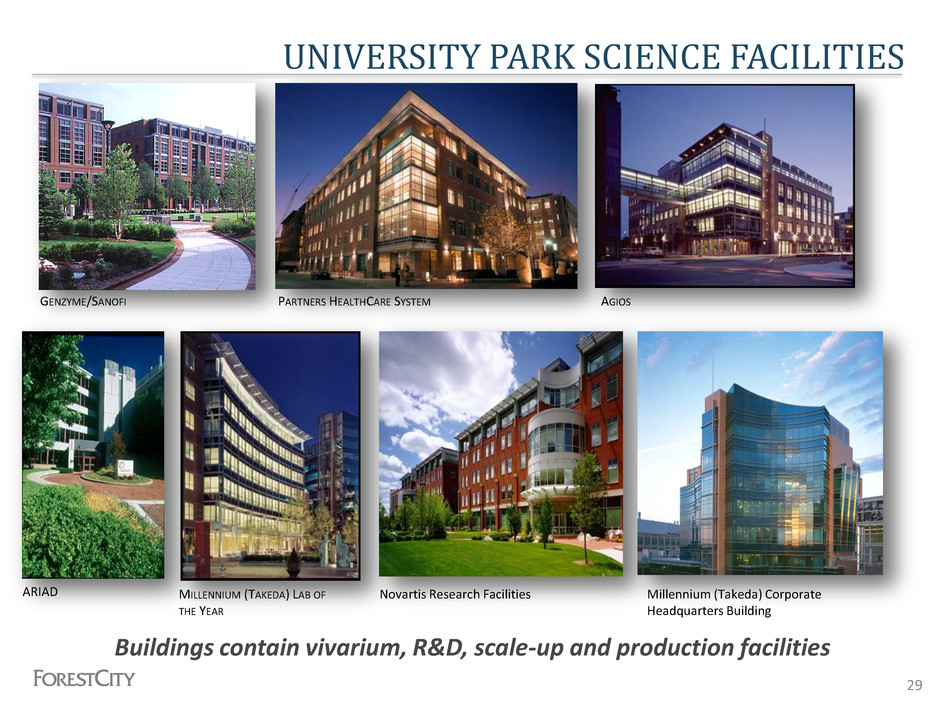
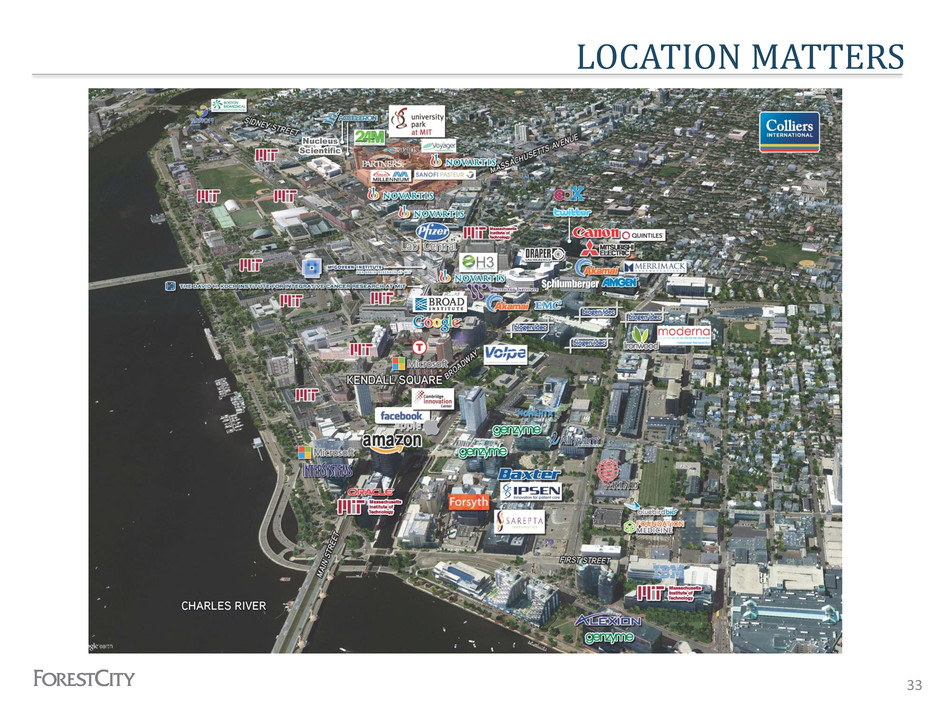
UNIVERSITY PARK SCIENCE FACILITIES GENZYME/SANOFI AGIOS PARTNERS HEALTHCARE SYSTEM ARIAD Novartis Research Facilities MILLENNIUM (TAKEDA) LAB OF THE YEAR Millennium (Takeda) Corporate Headquarters Building Buildings contain vivarium, R&D, scale-up and production facilities 29
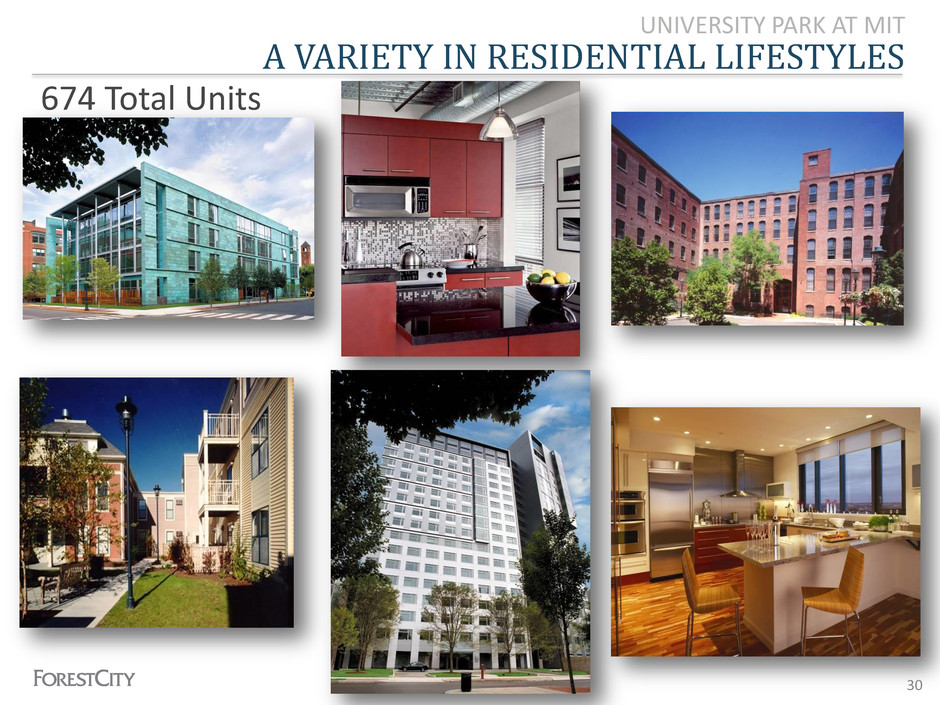
A VARIETY IN RESIDENTIAL LIFESTYLES UNIVERSITY PARK AT MIT 674 Total Units 30
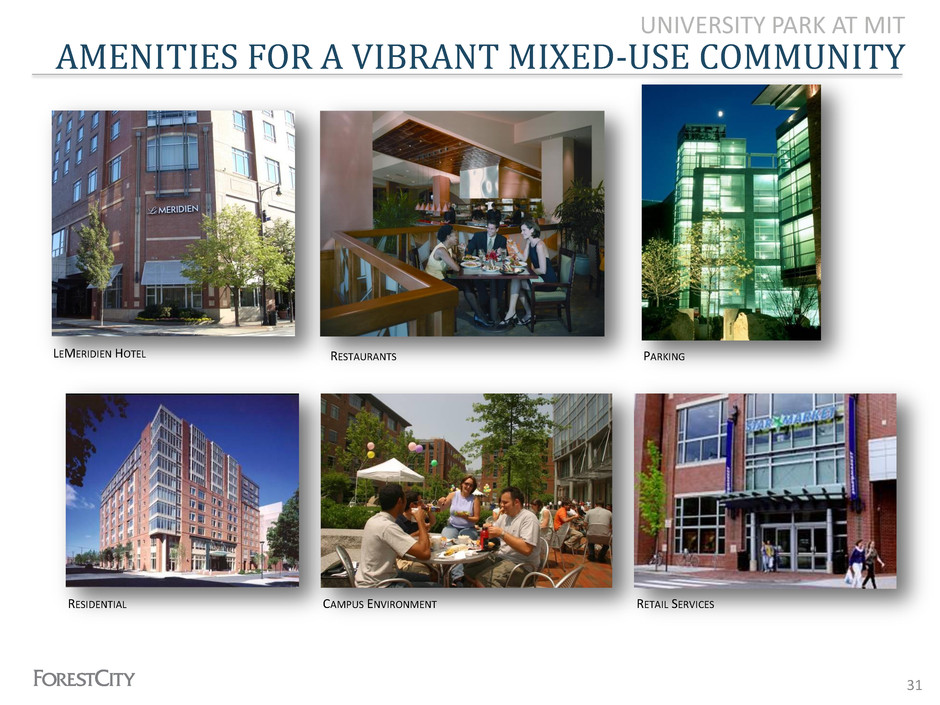
AMENITIES FOR A VIBRANT MIXED-USE COMMUNITY UNIVERSITY PARK AT MIT LEMERIDIEN HOTEL RESTAURANTS PARKING RESIDENTIAL CAMPUS ENVIRONMENT RETAIL SERVICES 31
LOCATION MATTERS CAMBRIDGE, MA 32
LOCATION MATTERS 33
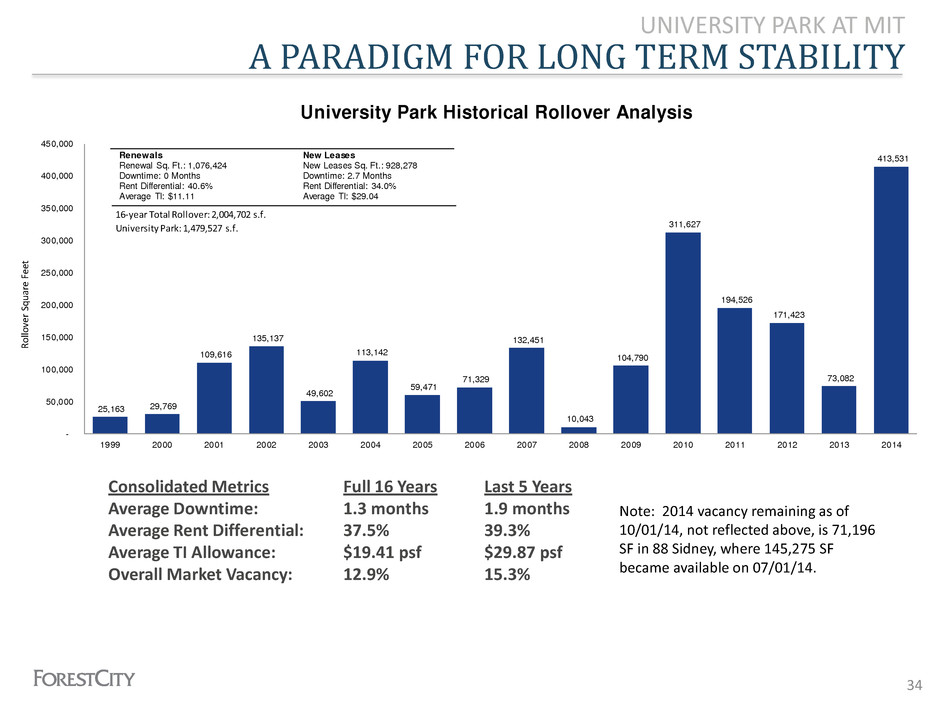
A PARADIGM FOR LONG TERM STABILITY UNIVERSITY PARK AT MIT Consolidated Metrics Full 16 Years Last 5 Years Average Downtime: 1.3 months 1.9 months Average Rent Differential: 37.5% 39.3% Average TI Allowance: $19.41 psf $29.87 psf Overall Market Vacancy: 12.9% 15.3% 34 Note: 2014 vacancy remaining as of 10/01/14, not reflected above, is 71,196 SF in 88 Sidney, where 145,275 SF became available on 07/01/14. University Park Historical Rollover Analysis 25,163 29,769 109,616 135,137 49,602 113,142 59,471 71,329 132,451 10,043 104,790 311,627 194,526 171,423 73,082 413,531 - 50,000 100,000 150,000 200,000 250,000 300,000 350,000 400,000 450,000 1999 2000 2001 2002 2003 2004 2005 2006 2007 2008 2009 2010 2011 2012 2013 2014 Ro llov er Sq uar e F eet 1 Renewals Renewal Sq. Ft.: 1,076,424 Downtime: 0 Months Rent Differential: 40.6% Average TI: $11.11 New Leases New Leases Sq. Ft.: 928,278 Downtime: 2.7 Months Rent Differential: 34.0% Average TI: $29.04 16-year Total Rollover: 2,004,702 s.f. University Park: 1,479,527 s.f. R o llo ve r Sq u ar e F ee t
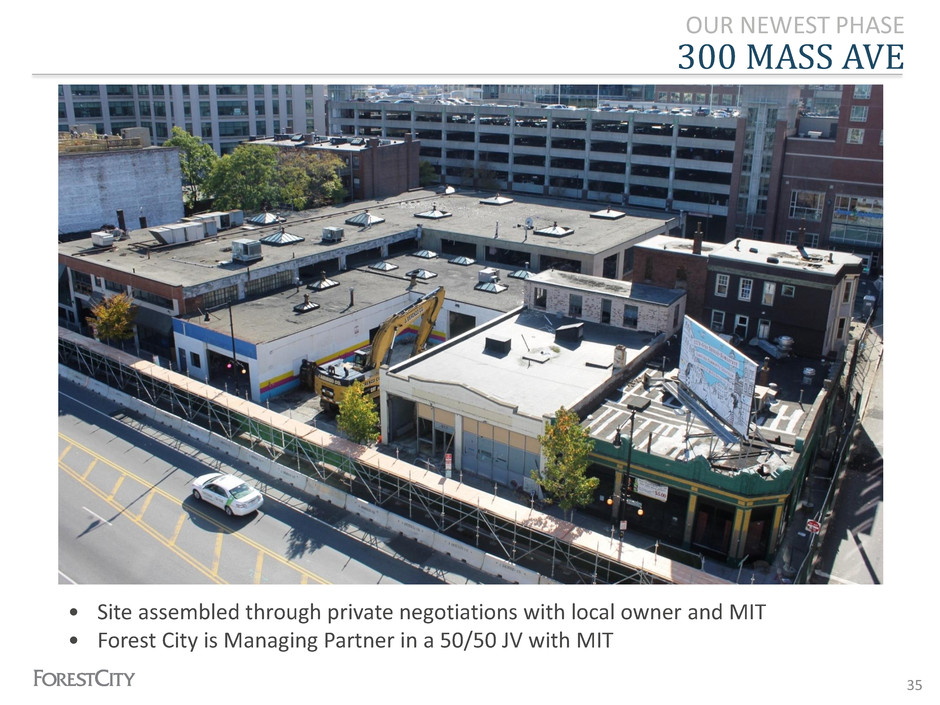
300 MASS AVE OUR NEWEST PHASE • Site assembled through private negotiations with local owner and MIT • Forest City is Managing Partner in a 50/50 JV with MIT 35
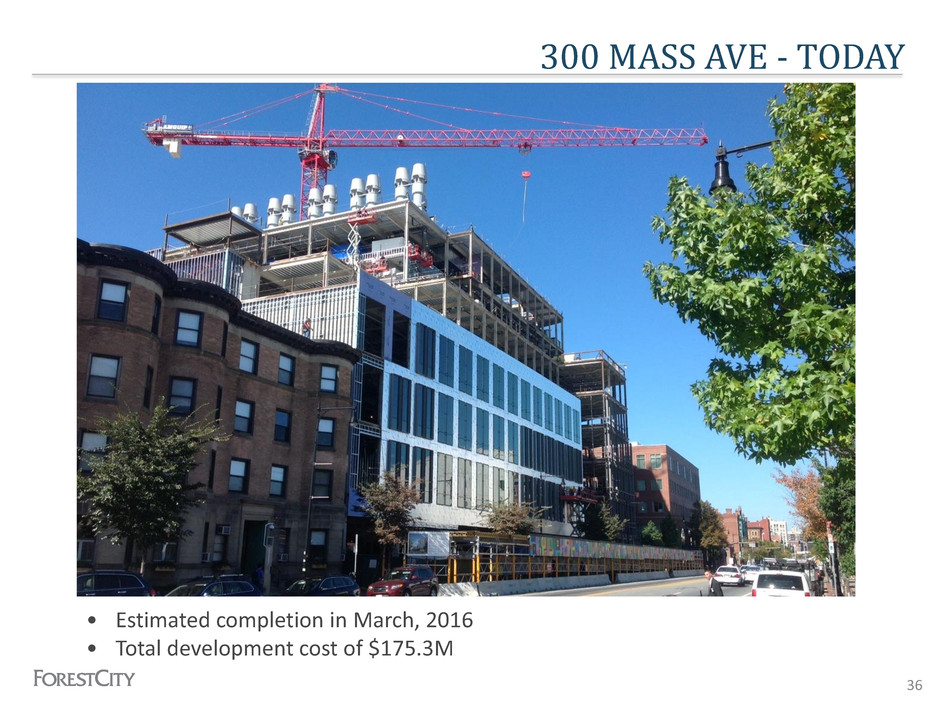
300 MASS AVE - TODAY • Estimated completion in March, 2016 • Total development cost of $175.3M 36
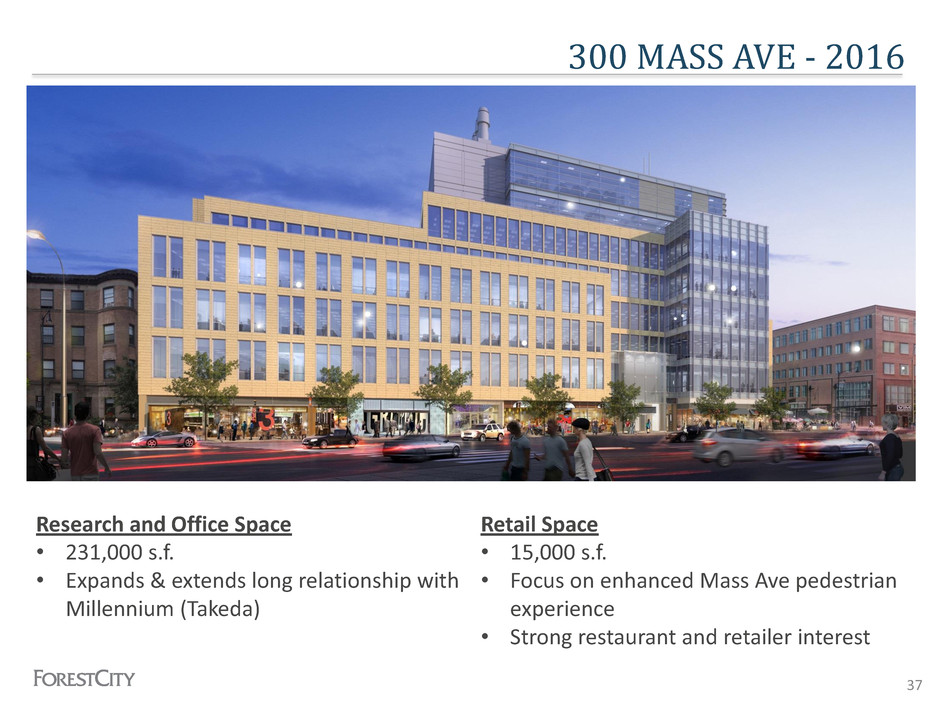
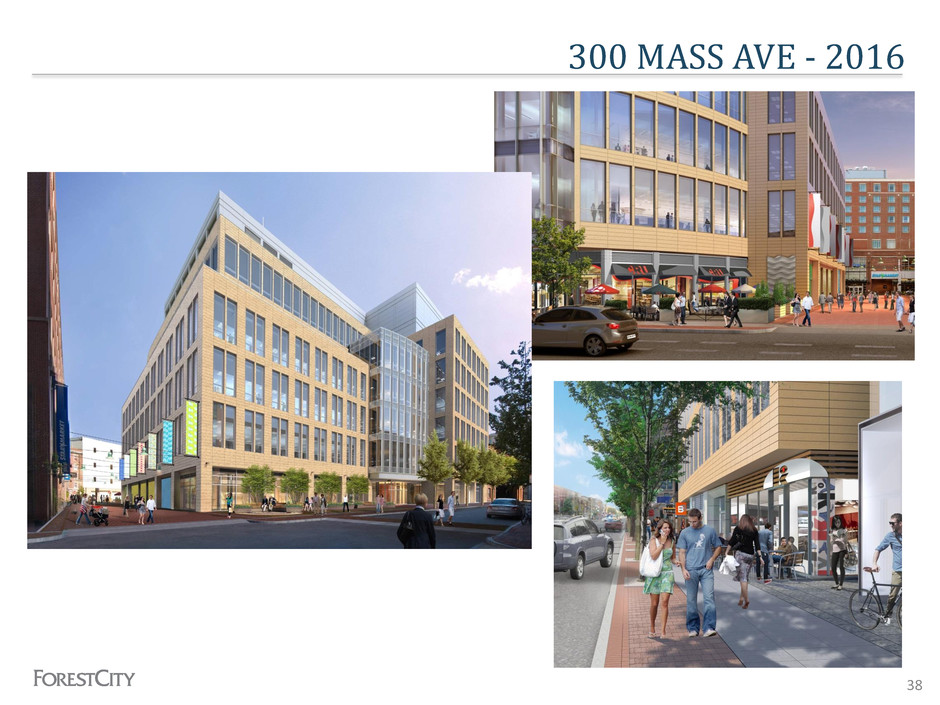
300 MASS AVE - 2016 Research and Office Space • 231,000 s.f. • Expands & extends long relationship with Millennium (Takeda) Retail Space • 15,000 s.f. • Focus on enhanced Mass Ave pedestrian experience • Strong restaurant and retailer interest 37
300 MASS AVE - 2016 38
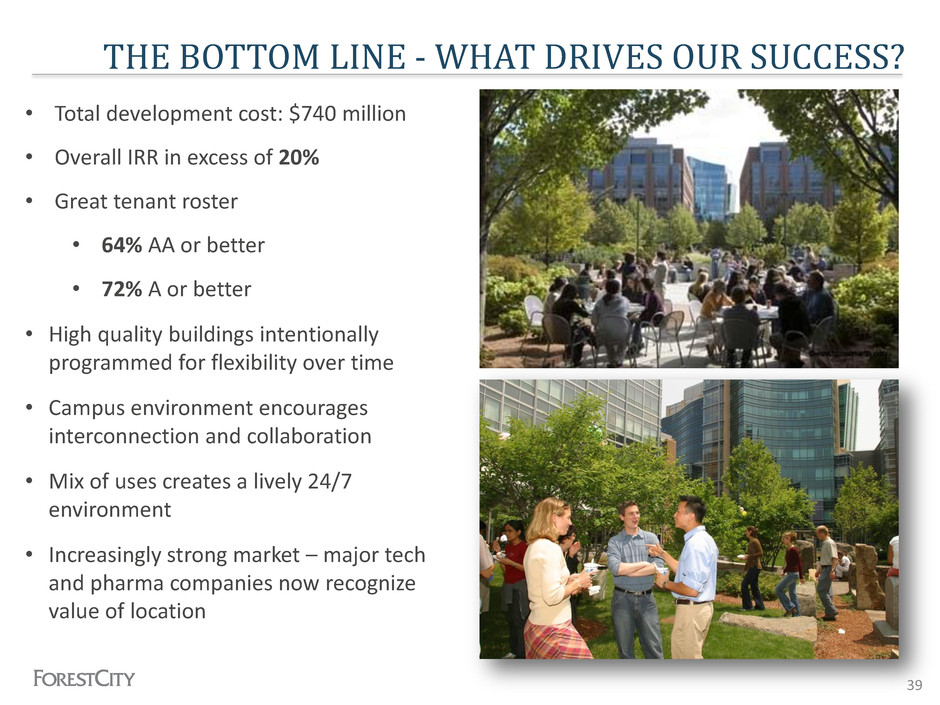
THE BOTTOM LINE - WHAT DRIVES OUR SUCCESS? • Total development cost: $740 million • Overall IRR in excess of 20% • Great tenant roster • 64% AA or better • 72% A or better • High quality buildings intentionally programmed for flexibility over time • Campus environment encourages interconnection and collaboration • Mix of uses creates a lively 24/7 environment • Increasingly strong market – major tech and pharma companies now recognize value of location 39
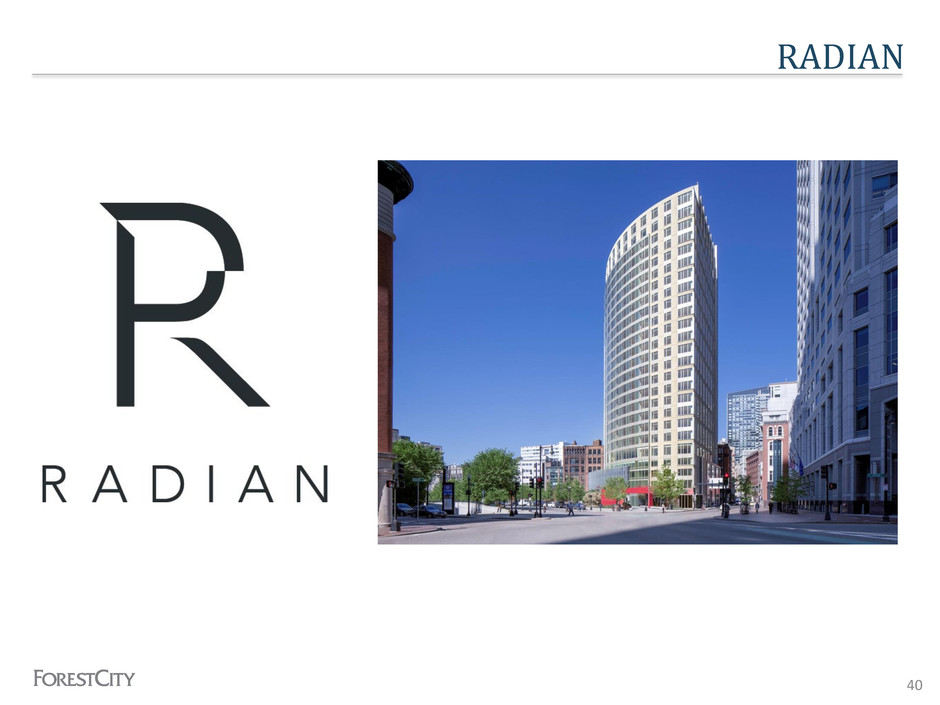
RADIAN 40
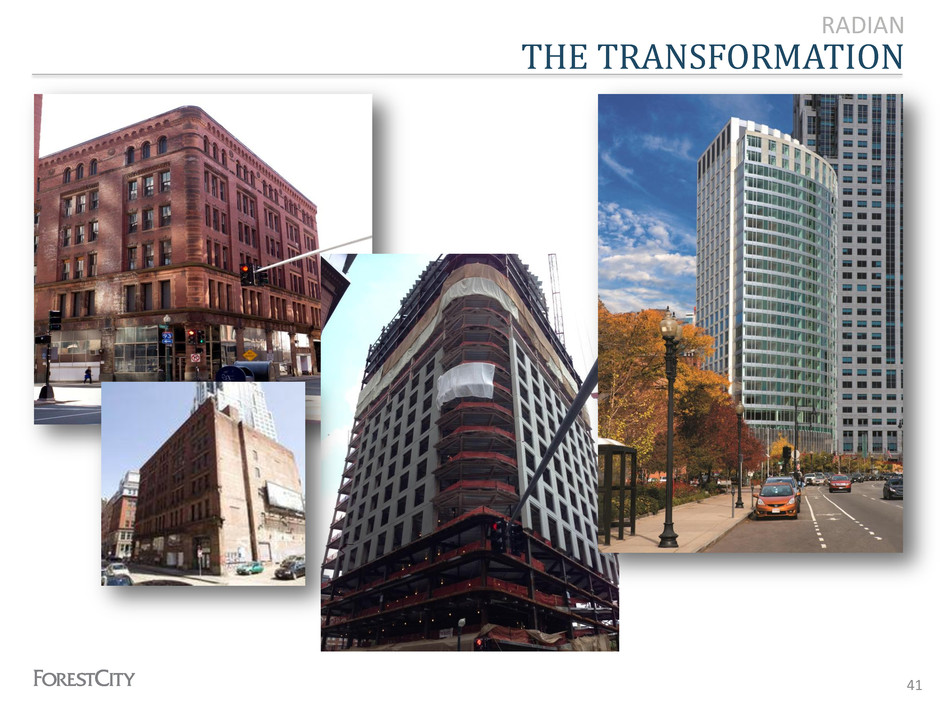
THE TRANSFORMATION RADIAN 41
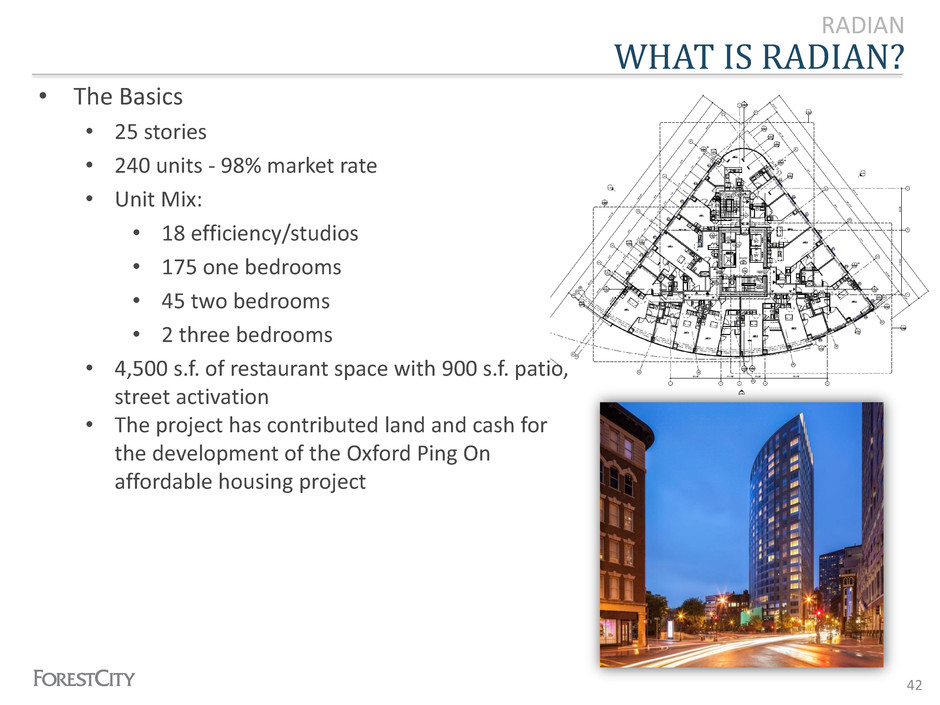
WHAT IS RADIAN? RADIAN • The Basics • 25 stories • 240 units - 98% market rate • Unit Mix: • 18 efficiency/studios • 175 one bedrooms • 45 two bedrooms • 2 three bedrooms • 4,500 s.f. of restaurant space with 900 s.f. patio, street activation • The project has contributed land and cash for the development of the Oxford Ping On affordable housing project 42
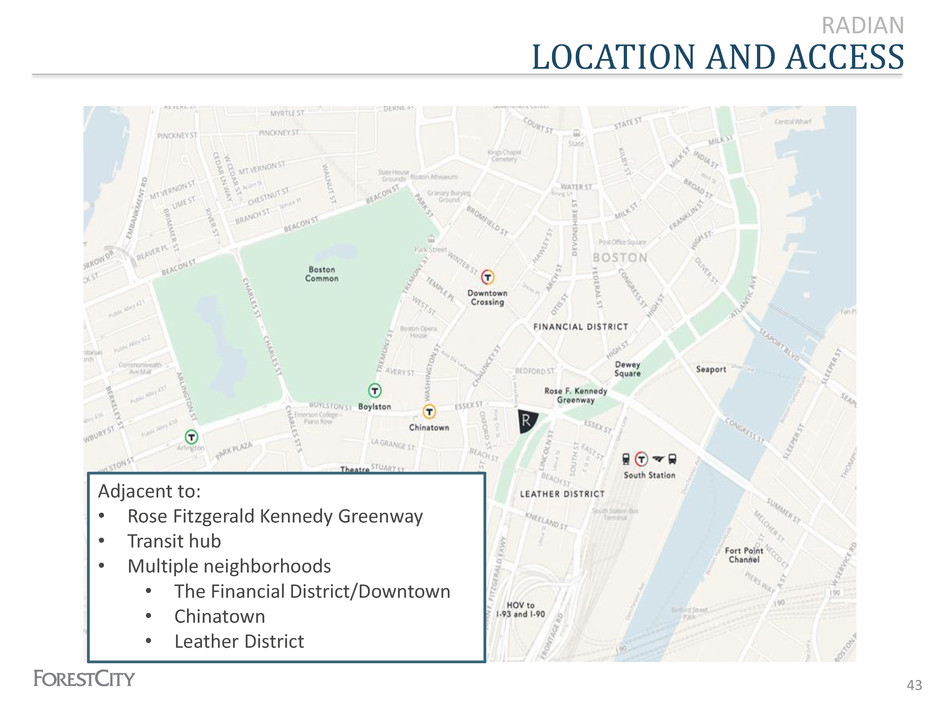
LOCATION AND ACCESS RADIAN Adjacent to: • Rose Fitzgerald Kennedy Greenway • Transit hub • Multiple neighborhoods • The Financial District/Downtown • Chinatown • Leather District 43
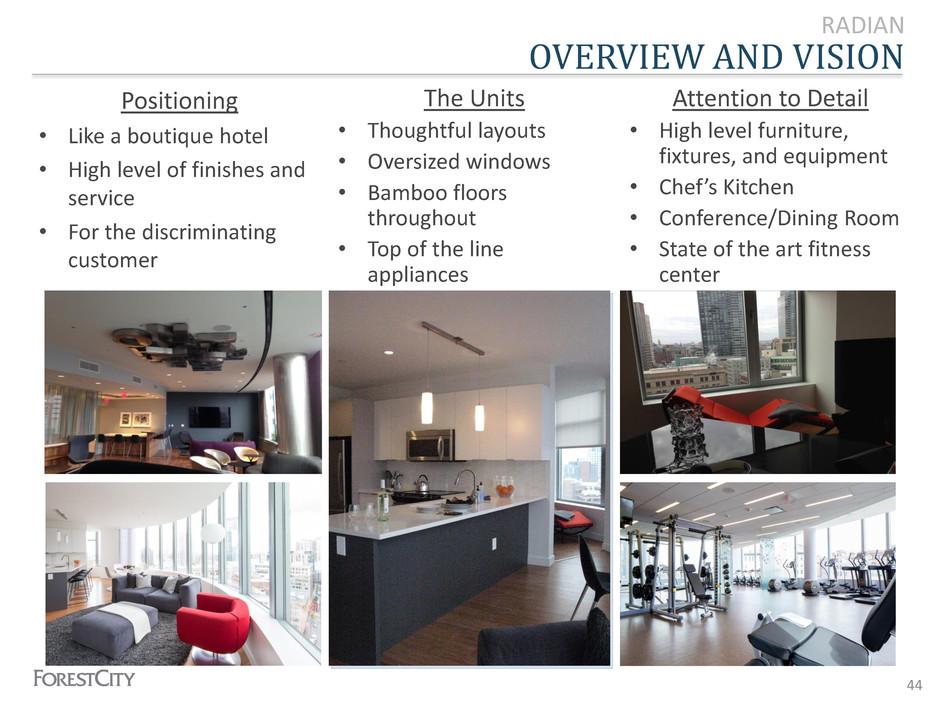
OVERVIEW AND VISION RADIAN Positioning • Like a boutique hotel • High level of finishes and service • For the discriminating customer 44 The Units • Thoughtful layouts • Oversized windows • Bamboo floors throughout • Top of the line appliances Attention to Detail • High level furniture, fixtures, and equipment • Chef’s Kitchen • Conference/Dining Room • State of the art fitness center
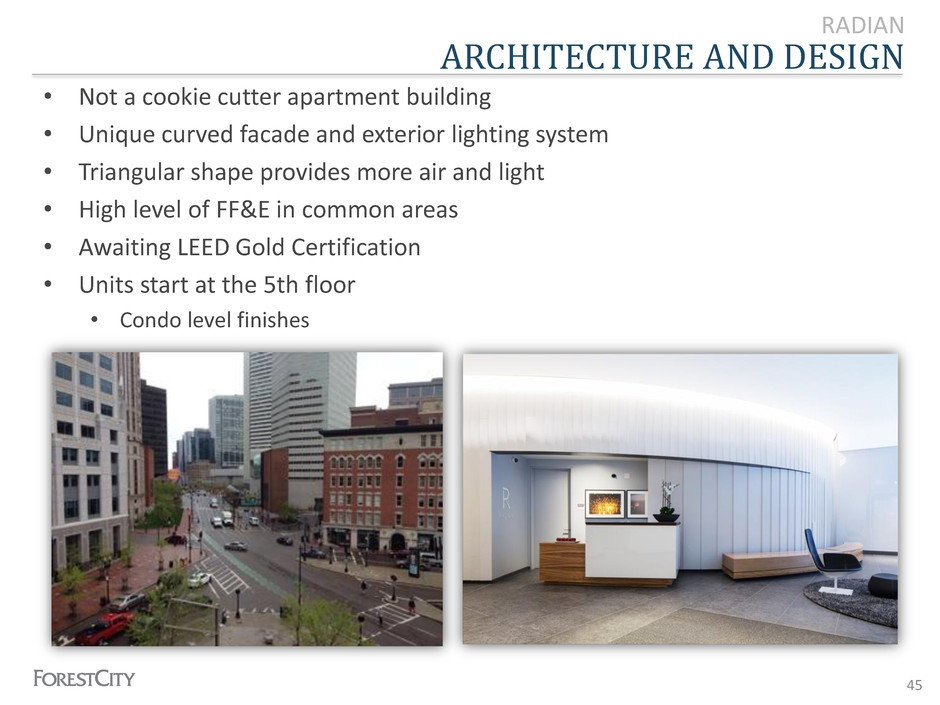
ARCHITECTURE AND DESIGN RADIAN • Not a cookie cutter apartment building • Unique curved facade and exterior lighting system • Triangular shape provides more air and light • High level of FF&E in common areas • Awaiting LEED Gold Certification • Units start at the 5th floor • Condo level finishes 45
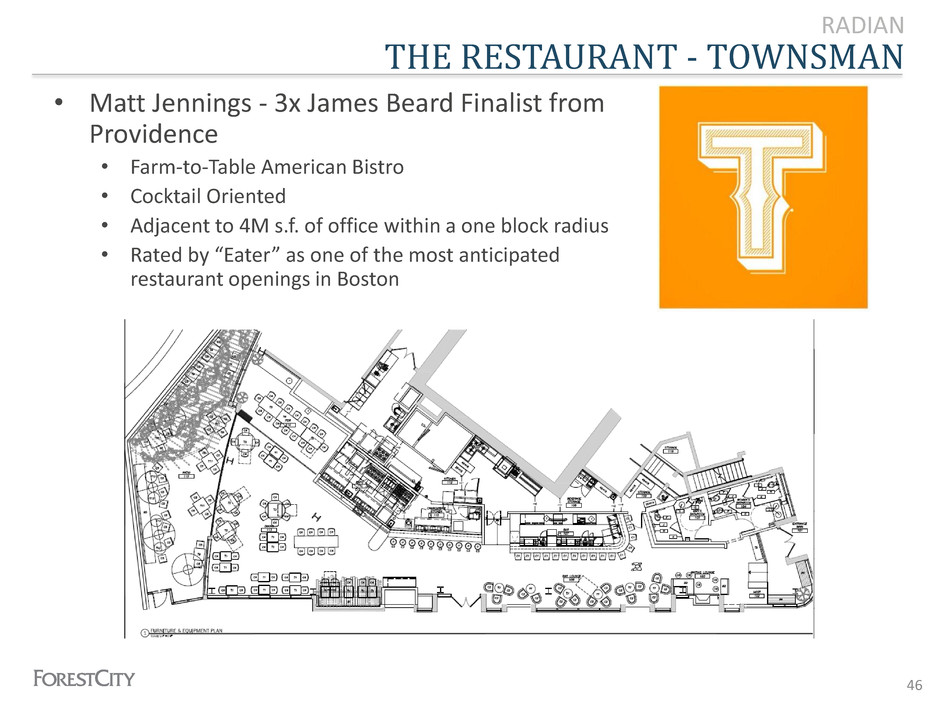
THE RESTAURANT - TOWNSMAN RADIAN • Matt Jennings - 3x James Beard Finalist from Providence • Farm-to-Table American Bistro • Cocktail Oriented • Adjacent to 4M s.f. of office within a one block radius • Rated by “Eater” as one of the most anticipated restaurant openings in Boston 46
47
Forest City Enterprises, Inc., is an NYSE-listed national real estate company with $8.6 billion in total assets (6/30/2014). The Company is principally engaged in the ownership, development, management and acquisition of commercial and residential real estate and land throughout the United States. Founded in 1920 and based in Cleveland, Ohio, Forest City’s diverse portfolio includes hundreds of premier properties located throughout the United States. We are especially active in our Core Markets – Boston, Chicago, Dallas, Denver, Los Angeles, Philadelphia and the greater metropolitan areas of New York City, San Francisco and Washington D.C.– where we have overcome high barriers to entry and developed a unique franchise. These are great urban markets with strong demographics and good growth potential. Investor Relations Contacts: Jeff Frericks 216-416-3546 jeffreyfrericks@forestcity.net Dale Koler 216-416-3341 dalekoler@forestcity.net


