Exhibit 99.1
Forest City Enterprises, Inc.
Supplemental Package
Three and Six Months Ended July 31, 2011 and 2010
Forest City Enterprises, Inc. and Subsidiaries
Three and Six Months Ended July 31, 2011 and 2010
Supplemental Package
NYSE: FCEA, FCEB
Index
| | | | |
Corporate Overview | | | 2-3 | |
| |
Selected Financial Information | | | | |
Forest City Enterprises, Inc. | | | | |
Consolidated Balance Sheet Information | | | 4-7 | |
Consolidated Earnings Information | | | 8-11 | |
| |
Supplemental Operating Information | | | | |
Occupancy Data | | | 12 | |
Comparable Net Operating Income (NOI) | | | 13 | |
Comparable NOI Detail | | | 14-15 | |
NOI By Product Type | | | 16 | |
NOI By Core Market | | | 17 | |
Reconciliation of NOI to Net Earnings | | | 18-19 | |
Results of Operations Discussion | | | 20-23 | |
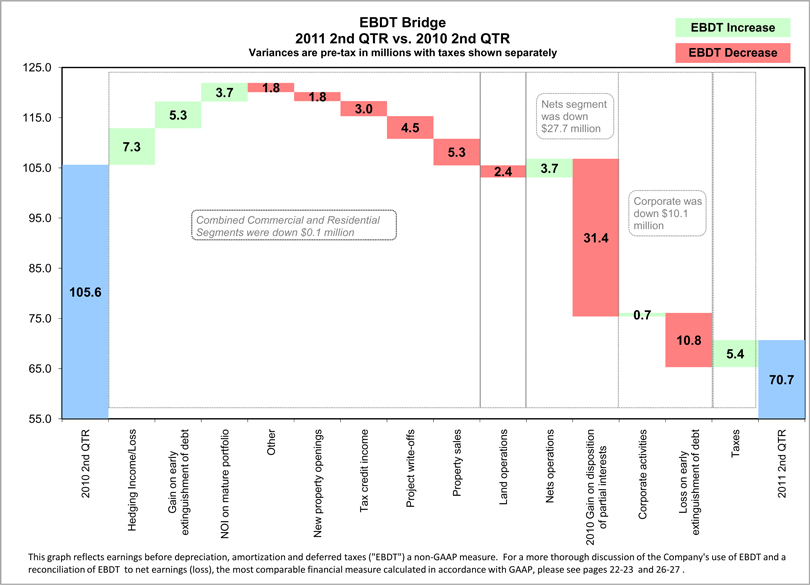
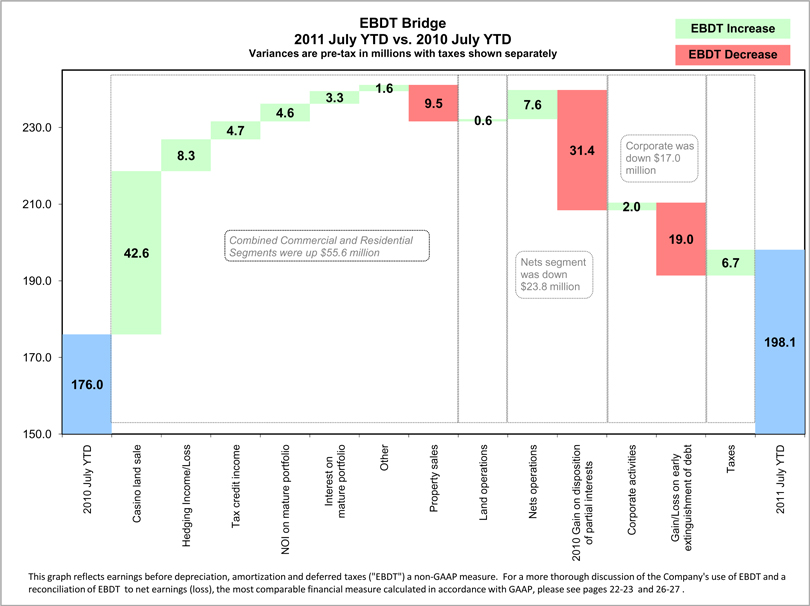
EBDT Bridge | | | 24-25 | |
Reconciliation of Net Earnings to EBDT | | | 26-27 | |
Schedules of Lease Expirations | | | 28-29 | |
Schedules of Significant Tenants | | | 30-31 | |
Development Pipeline | | | 32-38 | |
| |
Supplemental Financial Information | | | | |
Projects under Construction and Development Debt and Non-Recourse Debt | | | 39 | |
Scheduled Maturities Table | | | 40-41 | |
Investments in Unconsolidated Entities | | | 42-44 | |
Summary of EBDT | | | 45-56 | |
This Supplemental Package, together with other statements and information publicly disseminated by us, contains “forward-looking statements” within the meaning of Section 27A of the Securities Act of 1933, as amended, and Section 21E of the Securities Exchange Act of 1934, as amended. Such statements reflect management’s current views with respect to financial results related to future events and are based on assumptions and expectations that may not be realized and are inherently subject to risks and uncertainties, many of which cannot be predicted with accuracy and some of which might not even be anticipated. Future events and actual results, financial or otherwise, may differ from the results discussed in the forward-looking statements. Risk factors discussed in Item 1A of our Form 10-K for the year ended January 31, 2011 and other factors that might cause differences, some of which could be material, include, but are not limited to, the impact of current lending and capital market conditions on our liquidity, ability to finance or refinance projects and repay our debt, the impact of the current economic environment on the ownership, development and management of our real estate portfolio, general real estate investment and development risks, vacancies in our properties, further downturns in the housing market, competition, illiquidity of real estate investments, bankruptcy or defaults of tenants, anchor store consolidations or closings, international activities, the impact of terrorist acts, risks associated with an investment in a professional sports team, our substantial debt leverage and the ability to obtain and service debt, the impact of restrictions imposed by our credit facility and senior debt, exposure to hedging agreements, the level and volatility of interest rates, the continued availability of tax-exempt government financing, the impact of credit rating downgrades, effects of uninsured or underinsured losses, effects of a downgrade or failure of our insurance carriers, environmental liabilities, conflicts of interest, risks associated with the sale of tax credits, risks associated with developing and managing properties in partnership with others, the ability to maintain effective internal controls, compliance with governmental regulations, increased legislative and regulatory scrutiny of the financial services industry, volatility in the market price of our publicly traded securities, inflation risks, litigation risks, as well as other risks listed from time to time in our reports filed with the Securities and Exchange Commission. We have no obligation to revise or update any forward-looking statements, other than imposed by law, as a result of future events or new information. Readers are cautioned not to place undue reliance on such forward-looking statements.
1
Forest City Enterprises, Inc. and Subsidiaries
Supplemental Financial and Operating Information
Corporate Overview
We principally engage in the ownership, development, management and acquisition of commercial and residential real estate and land throughout the United States. We operate through three strategic business units and five reportable segments. TheCommercial Group, our largest strategic business unit, owns, develops, acquires and operates regional malls, specialty/urban retail centers, office and life science buildings, hotels and mixed-use projects. TheResidential Group owns, develops, acquires and operates residential rental properties, including upscale and middle-market apartments and adaptive re-use developments. Additionally, the Residential Group develops for-sale condominium projects and also owns interests in entities that develop and manage military family housing. The Land Development Group acquires and sells both land and developed lots to residential, commercial and industrial customers. It also owns and develops land into master-planned communities and mixed-use projects.Real Estate Groups are the combined Commercial, Residential and Land Development Groups.Corporate Activities and theNets, a member of the National Basketball Association (“NBA”) in which we account for our investment on the equity method of accounting, are other reportable segments of the Company.
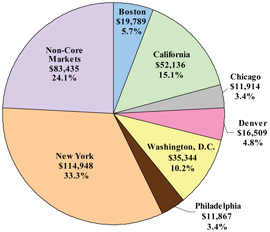
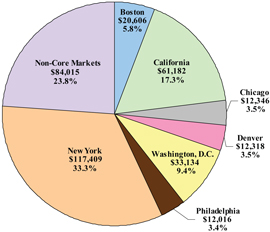
We have approximately $10.7 billion of assets in 26 states and the District of Columbia at July 31, 2011. Our core markets include Boston, the state of California, Chicago, Denver, New York City/Philadelphia metropolitan area and the Greater Washington, D.C./Baltimore metropolitan area. Our core markets account for approximately 76 percent of the cost of our real estate portfolio at July 31, 2011. We have offices in Albuquerque, Boston, Chicago, Dallas, Denver, London (England), Los Angeles, New York City, San Francisco, Washington, D.C. and our corporate headquarters in Cleveland, Ohio.
SUPPLEMENTAL FINANCIAL AND OPERATING INFORMATION
We recommend that this supplemental package be read in conjunction with our Form 10-Q for the three and six months ended July 31, 2011. This supplemental package contains certain measures prepared in accordance with generally accepted accounting principles (“GAAP”) under the full consolidation accounting method and certain measures prepared under the pro-rata consolidation method, a non-GAAP measure. Along with net earnings, we use an additional measure, Earnings Before Depreciation, Amortization and Deferred Taxes (“EBDT”), to report operating results. EBDT is a non-GAAP measure and may not be directly comparable to similarly-titled measures reported by other companies. The non-GAAP financial measures presented under the pro-rata consolidation method, comparable net operating income (“NOI”) and EBDT, provide supplemental information about our operations. Although these measures are not presented in accordance with GAAP, we believe they are necessary to understand our business and operating results, along with net earnings and other GAAP measures. Our investors can use these non-GAAP measures as supplementary information to evaluate our business. Our non-GAAP measures are not intended to be performance measures that should be regarded as alternatives to, or more meaningful than, our GAAP measures.
Consolidation Methods
We present certain financial amounts under the pro-rata consolidation method because we believe this information is useful to investors as this method reflects the manner in which we operate our business. In line with industry practice, we have made a large number of investments in which our economic ownership is less than 100% as a means of procuring opportunities and sharing risk. Under the pro-rata consolidation method, we generally present our investments proportionate to our economic share of ownership. Under GAAP, the full consolidation method is used to report partnership assets and liabilities consolidated at 100% if deemed to be under our control or if we are deemed to be the primary beneficiary of the variable interest entity (“VIE”), even if our ownership is not 100%. We provide reconciliations from the full consolidation method to the pro-rata consolidation method throughout our supplemental package. Please refer to our property listing for the detail of our consolidated and non-consolidated properties in our supplemental package for the year ended January 31, 2011 on pages 63-74.
EBDT
We believe that EBDT, along with net earnings, provides additional information about our core operations. While property dispositions, acquisitions or other factors can affect net earnings in the short-term, we believe EBDT presents a more consistent view of the overall financial performance of our business from period-to-period. EBDT is used by the chief operating decision maker and management to assess performance and resource allocations by strategic business unit and on a consolidated basis. EBDT is similar to Funds From Operations, a measure of performance used by publicly traded Real Estate Investment Trusts, but may not be directly comparable to similarly titled measures reported by other companies. For additional discussion of EBDT as well as a reconciliation of net earnings to EBDT see pages 22-27.
2
Forest City Enterprises, Inc. and Subsidiaries
Selected Financial Information
Supplemental Operating Information
The operating information contained in this document includes: occupancy data, comparable NOI, NOI by product type and core market, reconciliation of NOI to net earnings, results of operations discussion, EBDT bridge, reconciliation of net earnings to EBDT, retail and office lease expirations, significant retail and office tenants, and our development pipeline. We believe this information will give interested parties a better understanding and more information about our operating performance. The term “comparable,” which is used throughout this document, is generally defined as including properties that were open and operated in both the three and six months ended July 31, 2011 and 2010.
We believe occupancy rates, retail and office lease expirations, base rent, and significant retail and office tenant listings represent meaningful operating statistics about us.
Comparable NOI is useful because it measures the performance of the same properties on a period-to-period basis and, along with EBDT (as discussed on pages 22-23), is used to assess operating performance and resource allocation of our strategic business units. While property dispositions, acquisitions or other factors can impact net earnings in the short term, we believe comparable NOI gives a more consistent view of our overall performance from quarter-to-quarter and year-to-year. A reconciliation of NOI to net earnings, the most comparable financial measure calculated in accordance with GAAP and a reconciliation of NOI to net earnings for each strategic business unit are provided on pages 18-19 and 45-56 of this document. A reconciliation from NOI to comparable NOI can be found on pages 14-15.
Corporate Headquarters
Forest City Enterprises, Inc.
Terminal Tower
50 Public Square, Suite 1100
Cleveland, Ohio 44113
Annual Report on Form 10-K
A copy of the Annual Report on Form 10-K as filed with the Securities and Exchange Commission for the fiscal year ended January 31, 2011 can be found on our website under SEC Filings or may be obtained without charge upon written request to:
Thomas T. Kmiecik
Assistant Treasurer
tomkmiecik@forestcity.net
Website
www.forestcity.net
The information contained on this website is not incorporated herein by reference and does not constitute a part of this supplemental package.
Investor Relations
Robert G. O’Brien
Executive Vice President, Chief Financial Officer and Treasurer
Transfer Agent and Registrar
Wells Fargo
Shareowner Services
P.O. Box 64854
St. Paul, MN 55164-9440
(800) 468-9716
www.shareowneronline.com
Stock Exchange Listing
NYSE: FCEA and FCEB
Dividend Reinvestment and Stock Purchase Plan
We offer our shareholders the opportunity to purchase additional shares of common stock through the Forest City Enterprises, Inc. Dividend Reinvestment and Stock Purchase Plan (the “Plan”) at 97% of current market value. You may obtain a copy of the Plan prospectus and an enrollment card by contacting Wells Fargo Shareowner Services at (800) 468-9716 or by visiting www.shareowneronline.com.
3
(THIS PAGE INTENTIONALLY LEFT BLANK)
Forest City Enterprises, Inc. and Subsidiaries
Selected Financial Information
As discussed earlier, we present certain financial amounts under the pro-rata consolidation method (a non-GAAP measure). This information is useful to our investors because we believe that it more accurately reflects the manner in which we operate our business. This is because, in line with industry practice, we have a large number of investments in which our economic ownership is less than 100% as a means of procuring opportunities and sharing risk. The tables below present amounts for both full consolidation, a GAAP measure, and pro-rata consolidation, providing a reconciliation of the difference between the two methods. Under the pro-rata consolidation method, we present our partnership investments proportionate to our share of ownership for each line item of our consolidated financial statements. Under full consolidation, partnership assets and liabilities are reported as consolidated at 100% if deemed to be under our control or if we are deemed to be the primary beneficiary for our investments in a VIE. Partnership assets and liabilities are reported on the equity or cost method of accounting if we do not have control, or, in the case of investments in VIEs, we are not deemed the primary beneficiary.
Consolidated Balance Sheet Information – July 31, 2011 (Unaudited)
| | | | | | | | | | | | | | | | |
| | | Full
Consolidation
(GAAP) | | | Less
Noncontrolling
Interest | | | Plus
Unconsolidated
Investments at
Pro-Rata | | | Pro-Rata
Consolidation
(Non-GAAP) | |
| | | (in thousands) | |
| | | | |
Assets | | | | | | | | | | | | | | | | |
Real Estate | | | | | | | | | | | | | | | | |
Completed rental properties | | | | | | | | | | | | | | | | |
Residential | | $ | 1,515,512 | | | $ | 26,022 | | | $ | 1,118,880 | | | $ | 2,608,370 | |
Commercial | | | | | | | | | | | | | | | | |
Retail centers | | | 2,544,242 | | | | 99,462 | | | | 1,175,409 | | | | 3,620,189 | |
Office and other buildings | | | 3,031,660 | | | | 93,870 | | | | 379,161 | | | | 3,316,951 | |
Corporate and other equipment | | | 10,017 | | | | – | | | | – | | | | 10,017 | |
Total completed rental properties | | | 7,101,431 | | | | 219,354 | | | | 2,673,450 | | | | 9,555,527 | |
| | | | |
Projects under construction | | | | | | | | | | | | | | | | |
Residential | | | 46,671 | | | | – | | | | 182,494 | | | | 229,165 | |
Commercial | | | | | | | | | | | | | | | | |
Retail centers | | | 677,303 | | | | 689 | | | | 10,897 | | | | 687,511 | |
Office and other buildings | | | 400,264 | | | | 247,896 | | | | 3,675 | | | | 156,043 | |
Total projects under construction | | | 1,124,238 | | | | 248,585 | | | | 197,066 | | | | 1,072,719 | |
Projects under development | | | | | | | | | | | | | | | | |
Residential | | | 753,760 | | | | 154,957 | | | | 6,063 | | | | 604,866 | |
Commercial | | | | | | | | | | | | | | | | |
Retail centers | | | 37,969 | | | | 98 | | | | 10,893 | | | | 48,764 | |
Office and other buildings | | | 254,888 | | | | 25,300 | | | | 6,804 | | | | 236,392 | |
Total projects under development | | | 1,046,617 | | | | 180,355 | | | | 23,760 | | | | 890,022 | |
Total projects under construction and development | | | 2,170,855 | | | | 428,940 | | | | 220,826 | | | | 1,962,741 | |
Land held for development or sale | | | 263,224 | | | | 21,871 | | | | 96,725 | | | | 338,078 | |
Total Real Estate | | | 9,535,510 | | | | 670,165 | | | | 2,991,001 | | | | 11,856,346 | |
Less accumulated depreciation | | | (1,501,353 | ) | | | (51,729 | ) | | | (516,556 | ) | | | (1,966,180 | ) |
Real Estate, net | | | 8,034,157 | | | | 618,436 | | | | 2,474,445 | | | | 9,890,166 | |
| | | | |
Cash and equivalents | | | 412,348 | | | | 16,719 | | | | 60,556 | | | | 456,185 | |
Restricted cash and escrowed funds | | | 502,373 | | | | 109,232 | | | | 123,018 | | | | 516,159 | |
Notes and accounts receivable, net | | | 394,324 | | | | 18,365 | | | | 170,474 | | | | 546,433 | |
Investments in and advances to affiliates | | | 685,627 | | | | (154,263 | ) | | | (672,277 | ) | | | 167,613 | |
Lease and mortgage procurement costs, net | | | 302,067 | | | | 16,668 | | | | 50,677 | | | | 336,076 | |
Prepaid expenses and other deferred costs, net | | | 220,574 | | | | 37,101 | | | | 20,676 | | | | 204,149 | |
Intangible assets, net | | | 114,709 | | | | 4 | | | | 10,521 | | | | 125,226 | |
| | | | |
Total Assets | | $ | 10,666,179 | | | $ | 662,262 | | | $ | 2,238,090 | | | $ | 12,242,007 | |
4
Forest City Enterprises, Inc. and Subsidiaries
Selected Financial Information
Consolidated Balance Sheet Information – July 31, 2011 (Unaudited)
| | | | | | | | | | | | | | | | |
| | | Full
Consolidation
(GAAP) | | | Less
Noncontrolling
Interest | | | Plus
Unconsolidated
Investments at
Pro-Rata | | | Pro-Rata
Consolidation
(Non-GAAP) | |
| | | (in thousands) | |
| | | | |
Liabilities and Equity | | | | | | | | | | | | | | | | |
Liabilities | | | | | | | | | | | | | | | | |
Mortgage debt and notes payable, nonrecourse | | | | | | | | | | | | | | | | |
Completed rental properties | | | | | | | | | | | | | | | | |
Residential | | $ | 950,943 | | | $ | 18,818 | | | $ | 891,888 | | | $ | 1,824,013 | |
Commercial | | | | | | | | | | | | | | | | |
Retail centers | | | 1,789,570 | | | | 101,627 | | | | 911,556 | | | | 2,599,499 | |
Office and other buildings | | | 2,134,147 | | | | 76,611 | | | | 310,780 | | | | 2,368,316 | |
Total completed rental properties | | | 4,874,660 | | | | 197,056 | | | | 2,114,224 | | | | 6,791,828 | |
| | | | |
Projects under construction | | | | | | | | | | | | | | | | |
Residential | | | 47,700 | | | | – | | | | 116,416 | | | | 164,116 | |
Commercial | | | | | | | | | | | | | | | | |
Retail centers | | | 370,172 | | | | – | | | | – | | | | 370,172 | |
Office and other buildings | | | 98,560 | | | | 57,183 | | | | – | | | | 41,377 | |
Total projects under construction | | | 516,432 | | | | 57,183 | | | | 116,416 | | | | 575,665 | |
Projects under development | | | | | | | | | | | | | | | | |
Residential | | | 152,644 | | | | 35,341 | | | | – | | | | 117,303 | |
Commercial | | | | | | | | | | | | | | | | |
Retail centers | | | – | | | | – | | | | – | | | | – | |
Office and other buildings | | | 41,800 | | | | 4,180 | | | | 2,887 | | | | 40,507 | |
Total projects under development | | | 194,444 | | | | 39,521 | | | | 2,887 | | | | 157,810 | |
Total projects under construction and development | | | 710,876 | | | | 96,704 | | | | 119,303 | | | | 733,475 | |
Land held for development or sale | | | 36,151 | | | | 3,313 | | | | 29,479 | | | | 62,317 | |
Total Mortgage debt and notes payable, nonrecourse | | | 5,621,687 | | | | 297,073 | | | | 2,263,006 | | | | 7,587,620 | |
Bank revolving credit facility | | | – | | | | – | | | | – | | | | – | |
Senior and subordinated debt | | | 1,084,831 | | | | – | | | | – | | | | 1,084,831 | |
| | | | |
Construction payables | | | 156,037 | | | | 48,502 | | | | 19,089 | | | | 126,624 | |
Operating accounts payable and accrued expenses | | | 629,753 | | | | 32,746 | | | | 158,024 | | | | 755,031 | |
Accrued derivative liability | | | 152,600 | | | | – | | | | 13,937 | | | | 166,537 | |
Deferred profit on NY retail joint venture transaction | | | 115,388 | | | | – | | | | – | | | | 115,388 | |
Total Accounts payable and accrued expenses | | | 1,053,778 | | | | 81,248 | | | | 191,050 | | | | 1,163,580 | |
Cash distributions and losses in excess of investments in unconsolidated investments | | | 282,955 | | | | (38,267 | ) | | | (215,966 | ) | | | 105,256 | |
Deferred income taxes | | | 494,413 | | | | – | | | | – | | | | 494,413 | |
Total Liabilities | | | 8,537,664 | | | | 340,054 | | | | 2,238,090 | | | | 10,435,700 | |
| | | | |
Redeemable Noncontrolling Interest | | | 226,936 | | | | 226,936 | | | | – | | | | – | |
| | | | |
Equity | | | | | | | | | | | | | | | | |
Shareholders’ Equity | | | | | | | | | | | | | | | | |
Shareholders’ equity before accumulated other comprehensive loss | | | 1,726,445 | | | | – | | | | – | | | | 1,726,445 | |
Accumulated other comprehensive loss | | | (106,159 | ) | | | – | | | | – | | | | (106,159 | ) |
Total Shareholders’ Equity | | | 1,620,286 | | | | – | | | | – | | | | 1,620,286 | |
| | | | |
Noncontrolling interest | | | 281,293 | | | | 95,272 | | | | – | | | | 186,021 | |
| | | | |
Total Equity | | | 1,901,579 | | | | 95,272 | | | | – | | | | 1,806,307 | |
| | | | |
Total Liabilities and Equity | | $ | 10,666,179 | | | $ | 662,262 | | | $ | 2,238,090 | | | $ | 12,242,007 | |
5
Forest City Enterprises, Inc. and Subsidiaries
Selected Financial Information
Consolidated Balance Sheet Information – January 31, 2011 (Unaudited)
| | | | | | | | | | | | | | | | |
| | | Full
Consolidation
(GAAP) | | | Less
Noncontrolling
Interest | | | Plus
Unconsolidated
Investments at
Pro-Rata | | | Pro-Rata
Consolidation
(Non-GAAP) | |
| | | (in thousands) | |
Assets | | | | | | | | | | | | | | | | |
Real Estate | | | | | | | | | | | | | | | | |
Completed rental properties | | | | | | | | | | | | | | | | |
Residential | | $ | 1,664,490 | | | $ | 26,028 | | | $ | 826,356 | | | $ | 2,464,818 | |
Commercial | | | | | | | | | | | | | | | | |
Retail centers | | | 3,226,717 | | | | 113,193 | | | | 718,593 | | | | 3,832,117 | |
Office and other buildings | | | 3,314,371 | | | | 253,604 | | | | 378,863 | | | | 3,439,630 | |
Corporate and other equipment | | | 9,847 | | | | – | | | | 1 | | | | 9,848 | |
Total completed rental properties | | | 8,215,425 | | | | 392,825 | | | | 1,923,813 | | | | 9,746,413 | |
| | | | |
Projects under construction | | | | | | | | | | | | | | | | |
Residential | | | 771,245 | | | | 213,988 | | | | 3,642 | | | | 560,899 | |
Commercial | | | | | | | | | | | | | | | | |
Retail centers | | | 703,397 | | | | 532 | | | | 50,220 | | | | 753,085 | |
Office and other buildings | | | 297,069 | | | | 199,241 | | | | 1,981 | | | | 99,809 | |
Total projects under construction | | | 1,771,711 | | | | 413,761 | | | | 55,843 | | | | 1,413,793 | |
| | | | |
Projects under development | | | | | | | | | | | | | | | | |
Residential | | | 687,125 | | | | 222,514 | | | | 6,063 | | | | 470,674 | |
Commercial | | | | | | | | | | | | | | | | |
Retail centers | | | 17,837 | | | | 99 | | | | 10,890 | | | | 28,628 | |
Office and other buildings | | | 229,562 | | | | 58,830 | | | | 6,807 | | | | 177,539 | |
Total projects under development | | | 934,524 | | | | 281,443 | | | | 23,760 | | | | 676,841 | |
Total projects under construction and development | | | 2,706,235 | | | | 695,204 | | | | 79,603 | | | | 2,090,634 | |
Land held for development or sale | | | 244,879 | | | | 18,683 | | | | 115,607 | | | | 341,803 | |
Total Real Estate | | | 11,166,539 | | | | 1,106,712 | | | | 2,119,023 | | | | 12,178,850 | |
Less accumulated depreciation | | | (1,614,399 | ) | | | (63,987 | ) | | | (424,331 | ) | | | (1,974,743 | ) |
Real Estate, net | | | 9,552,140 | | | | 1,042,725 | | | | 1,694,692 | | | | 10,204,107 | |
| | | | |
Cash and equivalents | | | 193,372 | | | | 13,979 | | | | 48,583 | | | | 227,976 | |
Restricted cash and escrowed funds | | | 720,180 | | | | 240,709 | | | | 78,890 | | | | 558,361 | |
Notes and accounts receivable, net | | | 403,101 | | | | 20,329 | | | | 86,729 | | | | 469,501 | |
Investments in and advances to affiliates | | | 431,509 | | | | (278,671 | ) | | | (323,995 | ) | | | 386,185 | |
Lease and mortgage procurement costs, net | | | 356,804 | | | | 30,171 | | | | 33,025 | | | | 359,658 | |
Prepaid expenses and other deferred costs, net | | | 266,689 | | | | 44,536 | | | | 10,443 | | | | 232,596 | |
Intangible assets, net | | | 135,906 | | | | 5 | | | | 1,289 | | | | 137,190 | |
| | | | |
Total Assets | | $ | 12,059,701 | | | $ | 1,113,783 | | | $ | 1,629,656 | | | $ | 12,575,574 | |
6
Forest City Enterprises, Inc. and Subsidiaries
Selected Financial Information
Consolidated Balance Sheet Information – January 31, 2011 (Unaudited)
| | | | | | | | | | | | | | | | |
| |
| | | Full
Consolidation
(GAAP) | | | Less
Noncontrolling
Interest | | | Plus
Unconsolidated
Investments at
Pro-Rata | | | Pro-Rata
Consolidation
(Non-GAAP) | |
| |
| | | (in thousands) | |
Liabilities and Equity | | | | | | | | | | | | | | | | |
Liabilities | | | | | | | | | | | | | | | | |
Mortgage debt and notes payable, nonrecourse | | | | | | | | | | | | | | | | |
Completed rental properties | | | | | | | | | | | | | | | | |
Residential | | $ | 1,110,095 | | | $ | 18,998 | | | $ | 709,846 | | | $ | 1,800,943 | |
Commercial | | | | | | | | | | | | | | | | |
Retail centers | | | 2,322,539 | | | | 120,042 | | | | 655,162 | | | | 2,857,659 | |
Office and other buildings | | | 2,346,189 | | | | 219,327 | | | | 295,641 | | | | 2,422,503 | |
| | | | |
Total completed rental properties | | | 5,778,823 | | | | 358,367 | | | | 1,660,649 | | | | 7,081,105 | |
| | | | |
Projects under construction | | | | | | | | | | | | | | | | |
Residential | | | 717,700 | | | | 203,681 | | | | – | | | | 514,019 | |
Commercial | | | | | | | | | | | | | | | | |
Retail centers | | | 379,363 | | | | – | | | | – | | | | 379,363 | |
Office and other buildings | | | 82,157 | | | | 60,108 | | | | – | | | | 22,049 | |
| | | | |
Total projects under construction | | | 1,179,220 | | | | 263,789 | | | | – | | | | 915,431 | |
Projects under development | | | | | | | | | | | | | | | | |
Residential | | | 155,890 | | | | 61,760 | | | | – | | | | 94,130 | |
Commercial | | | | | | | | | | | | | | | | |
Retail centers | | | – | | | | – | | | | – | | | | – | |
Office and other buildings | | | 42,200 | | | | 16,880 | | | | 2,887 | | | | 28,207 | |
| | | | |
Total projects under development | | | 198,090 | | | | 78,640 | | | | 2,887 | | | | 122,337 | |
| | | | |
Total projects under construction and development | | | 1,377,310 | | | | 342,429 | | | | 2,887 | | | | 1,037,768 | |
Land held for development or sale | | | 51,085 | | | | 3,500 | | | | 49,831 | | | | 97,416 | |
| | | | |
Total Mortgage debt and notes payable, nonrecourse | | | 7,207,218 | | | | 704,296 | | | | 1,713,367 | | | | 8,216,289 | |
Bank revolving credit facility | | | 137,152 | | | | – | | | | – | | | | 137,152 | |
Senior and subordinated debt | | | 773,683 | | | | – | | | | – | | | | 773,683 | |
| | | | |
Construction payables | | | 179,601 | | | | 44,490 | | | | 4,670 | | | | 139,781 | |
Operating accounts payable and accrued expenses | | | 737,854 | | | | 28,443 | �� | | | 105,075 | | | | 814,486 | |
Accrued derivative liability | | | 156,587 | | | | 3,327 | | | | 15,163 | | | | 168,423 | |
| | | | |
Total Accounts payable and accrued expenses | | | 1,074,042 | | | | 76,260 | | | | 124,908 | | | | 1,122,690 | |
Cash distributions and losses in excess of investments in unconsolidated investments | | | 290,492 | | | | (38,493 | ) | | | (208,619 | ) | | | 120,366 | |
| | | | |
Deferred income taxes | | | 489,974 | | | | – | | | | – | | | | 489,974 | |
| | | | |
Total Liabilities | | | 9,972,561 | | | | 742,063 | | | | 1,629,656 | | | | 10,860,154 | |
| | | | |
Redeemable Noncontrolling Interest | | | 226,829 | | | | 226,829 | | | | – | | | | – | |
| | | | |
Equity | | | | | | | | | | | | | | | | |
Shareholders’ Equity | | | | | | | | | | | | | | | | |
Shareholders’ equity before accumulated other comprehensive loss | | | 1,623,828 | | | | – | | | | – | | | | 1,623,828 | |
Accumulated other comprehensive loss | | | (94,429 | ) | | | – | | | | – | | | | (94,429) | |
| | | | |
Total Shareholders’ Equity | | | 1,529,399 | | | | – | | | | – | | | | 1,529,399 | |
| | | | |
Noncontrolling interest | | | 330,912 | | | | 144,891 | | | | – | | | | 186,021 | |
| | | | |
| | | | |
Total Equity | | | 1,860,311 | | | | 144,891 | | | | – | | | | 1,715,420 | |
| | | | |
| | | | |
Total Liabilities and Equity | | $ | 12,059,701 | | | $ | 1,113,783 | | | $ | 1,629,656 | | | $ | 12,575,574 | |
| | | | |
7
Forest City Enterprises, Inc. and Subsidiaries
Selected Financial Information
Consolidated Earnings Information – Three Months Ended July 31, 2011 (Unaudited)
| | | | | | | | | | | | | | | | | | | | |
| |
| | | Full
Consolidation
(GAAP) | | | Less
Noncontrolling
Interest | | | Plus
Unconsolidated
Investments at
Pro-Rata | | | Plus
Discontinued
Operations | | | Pro-Rata
Consolidation
(Non-GAAP) | |
| |
| | | (in thousands) | |
| | | | | |
Revenues from real estate operations | | $ | 253,205 | | | $ | 12,279 | | | $ | 94,643 | | | $ | 1,494 | | | $ | 337,063 | |
| | | | | |
Expenses | | | | | | | | | | | | | | | | | | | | |
Operating expenses | | | 159,771 | | | | 7,903 | | | | 45,037 | | | | 446 | | | | 197,351 | |
Depreciation and amortization | | | 54,538 | | | | 1,171 | | | | 16,010 | | | | 238 | | | | 69,615 | |
Impairment of real estate | | | 235 | | | | – | | | | – | | | | – | | | | 235 | |
| | | | |
| | | 214,544 | | | | 9,074 | | | | 61,047 | | | | 684 | | | | 267,201 | |
| | | | |
| | | | | |
Interest expense | | | (64,064) | | | | (3,558) | | | | (25,183) | | | | (180) | | | | (85,869) | |
Amortization of mortgage procurement costs | | | (2,727) | | | | (130) | | | | (734) | | | | (84) | | | | (3,415) | |
Loss on early extinguishment of debt | | | (5,471) | | | | – | | | | (2,355) | | | | – | | | | (7,826) | |
| | | | | |
Interest and other income | | | 15,315 | | | | 534 | | | | 268 | | | | – | | | | 15,049 | |
Net gain on disposition of rental properties | | | – | | | | – | | | | – | | | | 29,899 | | | | 29,899 | |
| | | | |
| | | | | |
Earnings (loss) before income taxes | | | (18,286) | | | | 51 | | | | 5,592 | | | | 30,445 | | | | 17,700 | |
| | | | |
| | | | | |
Income tax expense (benefit) | | | | | | | | | | | | | | | | | | | | |
Current | | | (1,679) | | | | – | | | | – | | | | 1,543 | | | | (136) | |
Deferred | | | (4,492) | | | | – | | | | – | | | | 10,845 | | | | 6,353 | |
| | | | |
| | | (6,171) | | | | – | | | | – | | | | 12,388 | | | | 6,217 | |
| | | | |
| | | | | |
Equity in earnings (loss) of unconsolidated entities | | | 2,385 | | | | 142 | | | | (5,592) | | | | – | | | | (3,349) | |
| | | | |
| | | | | |
Earnings (loss) from continuing operations | | | (9,730) | | | | 193 | | | | – | | | | 18,057 | | | | 8,134 | |
| | | | | |
Discontinued operations, net of tax: | | | | | | | | | | | | | | | | | | | | |
Operating earnings from rental properties | | | 1,000 | | | | 665 | | | | – | | | | (335) | | | | – | |
Gain on disposition of rental properties | | | 99,087 | | | | 81,365 | | | | – | | | | (17,722) | | | | – | |
| | | | |
| | | 100,087 | | | | 82,030 | | | | – | | | | (18,057) | | | | – | |
| | | | |
| | | | | |
Net earnings | | | 90,357 | | | | 82,223 | | | | – | | | | – | | | | 8,134 | |
| | | | | |
Noncontrolling Interests | | | | | | | | | | | | | | | | | | | | |
Earnings from continuing operations attributable to noncontrolling interests | | | (193) | | | | (193) | | | | – | | | | – | | | | – | |
Earnings from discontinued operations attributable to noncontrolling interests | | | (82,030) | | | | (82,030) | | | | – | | | | – | | | | – | |
| | | | |
| | | (82,223) | | | | (82,223) | | | | – | | | | – | | | | – | |
| | | | |
| | | | | |
Net earnings attributable to Forest City Enterprises, Inc. | | $ | 8,134 | | | $ | – | | | $ | – | | | $ | – | | | $ | 8,134 | |
| | | | |
| | | | | |
Preferred dividends | | | (3,850) | | | | – | | | | – | | | | – | | | | (3,850) | |
| | | | |
Net earnings attributable to Forest City Enterprises, Inc. common shareholders | | $ | 4,284 | | | $ | – | | | $ | – | | | $ | – | | | $ | 4,284 | |
| | | | |
8
Forest City Enterprises, Inc. and Subsidiaries
Selected Financial Information
Consolidated Earnings Information – Six Months Ended July 31, 2011 (Unaudited)
| | | | | | | | | | | | | | | | | | | | |
| |
| | | Full
Consolidation
(GAAP) | | | Less
Noncontrolling
Interest | | | Plus
Unconsolidated
Investments at
Pro-Rata | | | Plus
Discontinued
Operations | | | Pro-Rata
Consolidation
(Non-GAAP) | |
| |
| | | (in thousands) | |
| | | | | |
Revenues from real estate operations | | $ | 561,629 | | | $ | 24,868 | | | $ | 177,357 | | | $ | 6,593 | | | $ | 720,711 | |
| | | | | |
Expenses | | | | | | | | | | | | | | | | | | | | |
Operating expenses | | | 322,679 | | | | 15,341 | | | | 82,721 | | | | 2,944 | | | | 393,003 | |
Depreciation and amortization | | | 111,245 | | | | 2,829 | | | | 29,700 | | | | 1,030 | | | | 139,146 | |
Impairment of real estate | | | 5,070 | | | | – | | | | – | | | | – | | | | 5,070 | |
| | | | |
| | | 438,994 | | | | 18,170 | | | | 112,421 | | | | 3,974 | | | | 537,219 | |
| | | | |
| | | | | |
Interest expense | | | (130,979) | | | | (7,420) | | | | (48,290) | | | | (712) | | | | (172,561) | |
Amortization of mortgage procurement costs | | | (5,622) | | | | (260) | | | | (1,352) | | | | (333) | | | | (7,047) | |
Loss on early extinguishment of debt | | | (5,767) | | | | (4) | | | | (2,355) | | | | – | | | | (8,118) | |
| | | | | |
Interest and other income | | | 30,822 | | | | 394 | | | | 385 | | | | – | | | | 30,813 | |
Net gain on disposition of rental properties and partial interests in rental properties | | | 9,561 | | | | – | | | | 12,567 | | | | 39,937 | | | | 62,065 | |
| | | | |
| | | | | |
Earnings (loss) before income taxes | | | 20,650 | | | | (592) | | | | 25,891 | | | | 41,511 | | | | 88,644 | |
| | | | |
| | | | | |
Income tax expense (benefit) | | | | | | | | | | | | | | | | | | | | |
Current | | | 15,134 | | | | – | | | | – | | | | 2,941 | | | | 18,075 | |
Deferred | | | (3,392) | | | | – | | | | – | | | | 14,558 | | | | 11,166 | |
| | | | |
| | | 11,742 | | | | – | | | | – | | | | 17,499 | | | | 29,241 | |
| | | | |
| | | | | |
Equity in earnings (loss) of unconsolidated entities | | | 22,379 | | | | 190 | | | | (25,891) | | | | – | | | | (3,702) | |
| | | | |
| | | | | |
Earnings (loss) from continuing operations | | | 31,287 | | | | (402) | | | | – | | | | 24,012 | | | | 55,701 | |
| | | | | |
Discontinued operations, net of tax: | | | | | | | | | | | | | | | | | | | | |
Operating earnings from rental properties | | | 2,961 | | | | 1,997 | | | | – | | | | (964) | | | | – | |
Gain on disposition of rental properties | | | 104,806 | | | | 81,758 | | | | – | | | | (23,048) | | | | – | |
| | | | |
| | | 107,767 | | | | 83,755 | | | | – | | | | (24,012) | | | | – | |
| | | | |
| | | | | |
Net earnings | | | 139,054 | | | | 83,353 | | | | – | | | | – | | | | 55,701 | |
| | | | | |
Noncontrolling Interests | | | | | | | | | | | | | | | | | | | | |
Loss from continuing operations attributable to noncontrolling interests | | | 402 | | | | 402 | | | | – | | | | – | | | | – | |
Earnings from discontinued operations attributable to noncontrolling interests | | | (83,755) | | | | (83,755) | | | | – | | | | – | | | | – | |
| | | | |
| | | (83,353) | | | | (83,353) | | | | – | | | | – | | | | – | |
| | | | |
| | | | | |
Net earnings attributable to Forest City Enterprises, Inc. | | $ | 55,701 | | | $ | – | | | $ | – | | | $ | – | | | $ | 55,701 | |
| | | | |
| | | | | |
Preferred dividends | | | (7,700) | | | | – | | | | – | | | | – | | | | (7,700) | |
| | | | |
Net earnings attributable to Forest City Enterprises, Inc. common shareholders | | $ | 48,001 | | | $ | – | | | $ | – | | | $ | – | | | $ | 48,001 | |
| | | | |
9
Forest City Enterprises, Inc. and Subsidiaries
Selected Financial Information
Consolidated Earnings Information – Three Months Ended July 31, 2010 (Unaudited)
| | | | | | | | | | | | | | | | | | | | |
| |
| | | Full
Consolidation
(GAAP) | | | Less
Noncontrolling
Interest | | | Plus
Unconsolidated
Investments at
Pro-Rata | | | Plus
Discontinued
Operations | | | Pro-Rata
Consolidation
(Non-GAAP) | |
| |
| | | (in thousands) | |
| | | | | |
Revenues from real estate operations | | $ | 294,221 | | | $ | 14,854 | | | $ | 80,162 | | | $ | 12,396 | | | $ | 371,925 | |
| | | | | |
Expenses | | | | | | | | | | | | | | | | | | | | |
Operating expenses | | | 169,516 | | | | 9,368 | | | | 39,807 | | | | 7,433 | | | | 207,388 | |
Depreciation and amortization | | | 58,040 | | | | 1,906 | | | | 12,267 | | | | 2,573 | | | | 70,974 | |
Impairment of real estate | | | 1,100 | | | | – | | | | 2,282 | | | | 45,410 | | | | 48,792 | |
| | | | |
| | | 228,656 | | | | 11,274 | | | | 54,356 | | | | 55,416 | | | | 327,154 | |
| | | | |
| | | | | |
Interest expense | | | (84,795) | | | | (4,164) | | | | (19,162) | | | | (2,355) | | | | (102,148) | |
Amortization of mortgage procurement costs | | | (2,721) | | | | (112) | | | | (598) | | | | (426) | | | | (3,633) | |
Gain on early extinguishment of debt | | | 1,896 | | | | – | | | | – | | | | – | | | | 1,896 | |
| | | | | |
Interest and other income | | | 16,231 | | | | 133 | | | | (56) | | | | 3 | | | | 16,045 | |
Net gain (loss) on disposition of rental properties and partial interests in rental properties | | | 204,269 | | | | – | | | | (878) | | | | 1,993 | | | | 205,384 | |
Net gain on disposition of partial interests in other investment | | | 55,112 | | | | 23,675 | | | | – | | | | – | | | | 31,437 | |
| | | | |
| | | | | |
Earnings (loss) before income taxes | | | 255,557 | | | | 23,112 | | | | 5,112 | | | | (43,805) | | | | 193,752 | |
| | | | |
| | | | | |
Income tax expense (benefit) | | | | | | | | | | | | | | | | | | | | |
Current | | | 5,478 | | | | – | | | | – | | | | (553) | | | | 4,925 | |
Deferred | | | 76,088 | | | | – | | | | – | | | | (16,313) | | | | 59,775 | |
| | | | |
| | | 81,566 | | | | – | | | | – | | | | (16,866) | | | | 64,700 | |
| | | | |
| | | | | |
Equity in earnings (loss) of unconsolidated entities, including impairment | | | (996) | | | | 98 | | | | (5,112) | | | | – | | | | (6,206) | |
| | | | |
| | | | | |
Earnings (loss) from continuing operations | | | 172,995 | | | | 23,210 | | | | – | | | | (26,939) | | | | 122,846 | |
| | | | | |
Discontinued operations, net of tax: | | | | | | | | | | | | | | | | | | | | |
Operating earnings (loss) from rental properties | | | (152) | | | | 86 | | | | – | | | | 238 | | | | – | |
Impairment of real estate | | | (27,800) | | | | – | | | | – | | | | 27,800 | | | | – | |
Gain on disposition of rental properties | | | 5,310 | | | | 4,211 | | | | – | | | | (1,099) | | | | – | |
| | | | |
| | | (22,642) | | | | 4,297 | | | | – | | | | 26,939 | | | | – | |
| | | | |
| | | | | |
Net earnings | | | 150,353 | | | | 27,507 | | | | – | | | | – | | | | 122,846 | |
| | | | | |
Noncontrolling Interests | | | | | | | | | | | | | | | | | | | | |
Earnings from continuing operations attributable to noncontrolling interests | | | (23,210) | | | | (23,210) | | | | – | | | | – | | | | – | |
Earnings from discontinued operations attributable to noncontrolling interests | | | (4,297) | | | | (4,297) | | | | – | | | | – | | | | – | |
| | | | |
| | | (27,507) | | | | (27,507) | | | | – | | | | – | | | | – | |
| | | | |
| | | | | |
Net earnings attributable to Forest City Enterprises, Inc. | | $ | 122,846 | | | $ | – | | | $ | – | | | $ | – | | | $ | 122,846 | |
| | | | |
| | | | | |
Preferred dividends | | | (4,107) | | | | – | | | | – | | | | – | | | | (4,107) | |
| | | | |
Net earnings attributable to Forest City Enterprises, Inc. common shareholders | | $ | 118,739 | | | $ | – | | | $ | – | | | $ | – | | | $ | 118,739 | |
| | | | |
10
Forest City Enterprises, Inc. and Subsidiaries
Selected Financial Information
Consolidated Earnings Information – Six Months Ended July 31, 2010 (Unaudited)
| | | | | | | | | | | | | | | | | | | | |
| |
| | | Full Consolidation (GAAP) | | | Less Noncontrolling Interest | | | Plus Unconsolidated Investments at Pro-Rata | | | Plus Discontinued Operations | | | Pro-Rata Consolidation (Non-GAAP) | |
| |
| | | (in thousands) | |
| | | | | |
Revenues from real estate operations | | $ | 563,003 | | | $ | 26,668 | | | $ | 153,635 | | | $ | 23,980 | | | $ | 713,950 | |
| | | | | |
Expenses | | | | | | | | | | | | | | | | | | | | |
Operating expenses | | | 324,644 | | | | 15,641 | | | | 93,443 | | | | 13,153 | | | | 415,599 | |
Depreciation and amortization | | | 117,366 | | | | 3,281 | | | | 24,513 | | | | 4,776 | | | | 143,374 | |
Impairment of real estate | | | 1,100 | | | | – | | | | 15,181 | | | | 45,410 | | | | 61,691 | |
| | | | |
| | | 443,110 | | | | 18,922 | | | | 133,137 | | | | 63,339 | | | | 620,664 | |
| | | | |
| | | | | |
Interest expense | | | (165,977) | | | | (9,201) | | | | (39,118) | | | | (4,045) | | | | (199,939) | |
Amortization of mortgage procurement costs | | | (5,333) | | | | (201) | | | | (1,151) | | | | (481) | | | | (6,764) | |
Gain on early extinguishment of debt | | | 8,193 | | | | – | | | | – | | | | – | | | | 8,193 | |
| | | | | |
Interest and other income | | | 23,045 | | | | 1,032 | | | | 14,760 | | | | 6 | | | | 36,779 | |
Net gain (loss) on disposition of rental properties and partial interests in rental properties | | | 205,135 | | | | – | | | | (830) | | | | 1,993 | | | | 206,298 | |
Net gain on disposition of partial interests in other investment | | | 55,112 | | | | 23,675 | | | | – | | | | – | | | | 31,437 | |
| | | | |
| | | | | |
Earnings (loss) before income taxes | | | 240,068 | | | | 23,051 | | | | (5,841) | | | | (41,886) | | | | 169,290 | |
| | | | |
| | | | | |
Income tax expense (benefit) | | | | | | | | | | | | | | | | | | | | |
Current | | | 11,570 | | | | – | | | | – | | | | 104 | | | | 11,674 | |
Deferred | | | 60,626 | | | | – | | | | – | | | | (16,227) | | | | 44,399 | |
| | | | |
| | | 72,196 | | | | – | | | | – | | | | (16,123) | | | | 56,073 | |
| | | | |
| | | | | |
Equity in earnings (loss) of unconsolidated entities, including impairment | | | (18,120) | | | | (6,346) | | | | 5,841 | | | | – | | | | (5,933) | |
| | | | |
| | | | | |
Earnings (loss) from continuing operations | | | 149,752 | | | | 16,705 | | | | – | | | | (25,763) | | | | 107,284 | |
| | | | | |
Discontinued operations, net of tax: | | | | | | | | | | | | | | | | | | | | |
Operating earnings from rental properties | | | 1,727 | | | | 789 | | | | – | | | | (938) | | | | – | |
Impairment of real estate | | | (27,800) | | | | – | | | | – | | | | 27,800 | | | | – | |
Gain on disposition of rental properties | | | 5,310 | | | | 4,211 | | | | – | | | | (1,099) | | | | – | |
| | | | |
| | | (20,763) | | | | 5,000 | | | | – | | | | 25,763 | | | | – | |
| | | | |
| | | | | |
Net earnings | | | 128,989 | | | | 21,705 | | | | – | | | | – | | | | 107,284 | |
| | | | | |
Noncontrolling Interests | | | | | | | | | | | | | | | | | | | | |
Earnings from continuing operations attributable to noncontrolling interests | | | (16,705) | | | | (16,705) | | | | – | | | | – | | | | – | |
Earnings from discontinued operations attributable to noncontrolling interests | | | (5,000) | | | | (5,000) | | | | – | | | | – | | | | – | |
| | | | |
| | | (21,705) | | | | (21,705) | | | | – | | | | – | | | | – | |
| | | | |
Net earnings attributable to Forest City Enterprises, Inc. | | $ | 107,284 | | | $ | – | | | $ | – | | | $ | – | | | $ | 107,284 | |
| | | | |
| | | | | |
Preferred dividends | | | (4,107) | | | | – | | | | – | | | | – | | | | (4,107) | |
| | | | |
Net earnings attributable to Forest City Enterprises, Inc. common shareholders | | $ | 103,177 | | | $ | – | | | $ | – | | | $ | – | | | $ | 103,177 | |
| | | | |
11
Forest City Enterprises, Inc. and Subsidiaries
Supplemental Operating Information
Occupancy Data – July 31, 2011 and 2010
Retail and office occupancy as of July 31, 2011 and 2010 is based on square feet leased at the end of the fiscal quarter. Average Occupancy Year-to-Date as of July 31, 2011 and 2010 for retail and office is calculated by dividing the sum of leased square feet at the beginning and end of the period by two. Residential occupancy as of July 31, 2011 and 2010 represents total units occupied divided by total units available. Average Occupancy as of July 31, 2011 and 2010 for residential is calculated by dividing gross potential rent less vacancy by gross potential rent. Average Daily Rate (“ADR”) is calculated by dividing revenue by the number of rooms sold for the six months ended July 31, 2011 and 2010.
We analyze our occupancy percentages by each of our major product lines as follows:
| | | | | | | | | | | | | | | | |
| | | Occupancy
As of
July 31, 2011 | | | Average
Occupancy
Year-to-Date
July 31, 2011 | | | Occupancy
As of
July 31, 2010 | | | Average
Occupancy
Year-to-Date
July 31, 2010 | |
Retail | | | | | | | | | | | | | | | | |
Comparable | | | 90.3% | | | | 90.5% | | | | 90.2% | | | | 90.1% | |
Total | | | 90.4% | | | | 90.8% | | | | 90.7% | | | | 89.7% | |
Office | | | | | | | | | | | | | | | | |
Comparable | | | 90.3% | | | | 89.8% | | | | 90.9% | | | | 90.9% | |
Total | | | 88.8% | | | | 88.3% | | | | 89.9% | | | | 89.8% | |
Residential(1) (2) | | | | | | | | | | | | | | | | |
Comparable | | | 93.6% | | | | 94.8% | | | | 92.8% | | | | 93.0% | |
Total | | | 93.0% | | | | 91.7% | | | | 91.6% | | | | 89.6% | |
Hotels | | | | | | | | | | | | | | | | |
Comparable and Total | | | | | | | 65.5% | | | | | | | | 66.3% | |
Comparable and Total ADR | | | | | | $ | 148.27 | | | | | | | $ | 139.24 | |
The table below provides occupancy as reported in previous quarters. These amounts may differ from above because the properties that qualify as comparable change from period to period.
| | | | | | | | | | | | | | | | | | | | | | | | | | | | | | | | | | | | | | | | |
Occupancy Recap of Quarterly Supplemental Packages | | | | | | | | | | | | | | | | | | | | | | | | | | | | | |
| | | Occupancy As of | | | Average Occupancy Year-to-Date | |
| | | July 31,
2011 | | | April 30,
2011 | | | January 31,
2011 | | | October 31,
2010 | | | July 31,
2010 | | | July 31,
2011 | | | April 30,
2011 | | | January 31,
2011 | | | October 31,
2010 | | | July 31,
2010 | |
Retail | | | | | | | | | | | | | | | | | | | | | | | | | | | | | | | | | | | | | | | | |
Comparable | | | 90.3% | | | | 91.2% | | | | 91.2% | | | | 90.6% | | | | 90.9% | | | | 90.5% | | | | 91.2% | | | | 90.7% | | | | 90.4% | | | | 90.5% | |
Total | | | 90.4% | | | | 91.1% | | | | 91.2% | | | | 90.4% | | | | 90.7% | | | | 90.8% | | | | 91.1% | | | | 90.0% | | | | 89.6% | | | | 89.7% | |
Office | | | | | | | | | | | | | | | | | | | | | | | | | | | | | | | | | | | | | | | | |
Comparable | | | 90.3% | | | | 90.7% | | | | 88.4% | | | | 90.5% | | | | 90.0% | | | | 89.8% | | | | 90.0% | | | | 89.2% | | | | 90.3% | | | | 90.0% | |
Total | | | 88.8% | | | | 89.6% | | | | 87.8% | | | | 90.3% | | | | 89.9% | | | | 88.3% | | | | 88.7% | | | | 88.7% | | | | 90.0% | | | | 89.8% | |
Residential(1) (2) | | | | | | | | | | | | | | | | | | | | | | | | | | | | | | | | | | | | | | | | |
Comparable | | | 93.6% | | | | 93.7% | | | | 93.7% | | | | 93.7% | | | | 92.9% | | | | 94.8% | | | | 94.8% | | | | 93.8% | | | | 93.8% | | | | 93.2% | |
Total | | | 93.0% | | | | 92.6% | | | | 92.7% | | | | 92.2% | | | | 91.6% | | | | 91.7% | | | | 91.5% | | | | 89.6% | | | | 89.3% | | | | 92.1% | |
Hotels | | | | | | | | | | | | | | | | | | | | | | | | | | | | | | | | | | | | | | | | |
Comparable and Total | | | | | | | | | | | | | | | | | | | | | | | 65.5% | | | | 56.9% | | | | 69.0% | | | | 69.9% | | | | 66.3% | |
Comparable and Total ADR | | | | | | | | | | | | | | | | | | | | | | $ | 148.27 | | | $ | 145.29 | | | $ | 140.03 | | | $ | 138.92 | | | $ | 139.24 | |
| (1) | Excludes military and subsidized senior housing units. |
| (2) | Prior periods have been recasted to exclude subsidized senior housing. The Company believes this change will improve disclosure by allowing investors to see results for the conventional apartment portfolio separated from those of the limited-dividend senior-housing properties. |
12
Forest City Enterprises, Inc. and Subsidiaries
Supplemental Operating Information
We use NOI, along with EBDT as discussed on page 2, to assess operating performance. Comparable NOI is defined as NOI from properties opened and operated in the three and six months ended July 31, 2011 and 2010. The schedules below present Pro-Rata Comparable NOI for the three and six months ended July 31, 2011. The following schedules on pages 14-15 present comparable NOI for each of our major product lines, as well as strategic business units under which these product lines operate. A reconciliation of NOI to the most comparable GAAP measure, net earnings, is presented on pages 18-19. A reconciliation of NOI to net earnings for each strategic business unit can be found on pages 45-56.
Comparable Net Operating Income (NOI) (% change over same period prior year)
| | | | | | | | |
| | | Three Months Ended
July 31, 2011 | | | Six Months Ended
July 31, 2011 | |
| | |
Retail | | | 1.6% | | | | 2.2% | |
| | |
Office | | | 3.1% | | | | 0.2% | |
| | |
Residential(1) | | | 3.1% | | | | 4.3% | |
| | |
Hotel | | | 1.6% | | | | (10.4%) | |
| | |
Total | | | 2.5% | | | | 1.6% | |
The tables below provide the percentage change of Comparable Net Operating Income (NOI) as reported in previous quarters. GAAP reconciliations for previous quarters can be found in prior supplemental packages.
| | | | | | | | | | | | | | | | | | | | | | | | | | | | | | | | | | | | |
Quarterly Historical Trends | | | | | | | | | | | | | | | | | Annual Historical Trends | | | | | |
| | | | | |
| | | Three Months Ended | | | | | | | Year Ended | |
| | | July 31, 2011 | | | April 30, 2011 | | | January 31, 2011 | | | October 31, 2010 | | | July 31, 2010 | | | | | | | January 31, 2011 | | | January 31, 2010 | | | January 31, 2009 | |
| | | | | | | | | | | |
Retail | | | 1.6% | | | | 2.6% | | | | 3.4% | | | | 4.1% | | | | 3.2% | | | | | Retail | | | 2.2% | | | | (3.9%) | | | | 0.3% | |
| | | | | | | | | | | |
Office | | | 3.1% | | | | (2.5%) | | | | 0.2% | | | | 2.2% | | | | 1.6% | | | | | Office | | | 2.1% | | | | 5.4% | | | | 1.2% | |
| | | | | | | | | | | |
Residential (1) | | | 3.1% | | | | 4.8% | | | | 2.0% | | | | 7.0% | | | | 8.2% | | | | | Residential (1) | | | 4.3% | | | | (3.9%) | | | | 1.4% | |
| | | | | | | | | | | |
Hotel | | | 1.6% | | | | (54.2%) | | | | (13.4%) | | | | (20.3%) | | | | 7.9% | | | | | Hotel | | | (3.9%) | | | | (9.9%) | | | | (4.9%) | |
| | | | | | | | | | | |
Total | | | 2.5% | | | | 0.5% | | | | 1.6% | | | | 3.0% | | | | 3.6% | | | | | Total | | | 2.4% | | | | (0.9%) | | | | 0.7% | |
| (1) | Prior periods have been recasted to exclude subsidized senior housing. The Company believes this change will improve disclosure by allowing investors to see results for the conventional apartment portfolio separated from those of the limited-dividend senior-housing properties. |
13
Forest City Enterprises, Inc. and Subsidiaries
Supplemental Operating Information
| | | | | | | | | | | | | | | | | | | | | | | | | | | | | | | | | | | | | | | | | | | | | | | | |
| | | | | | | | | | | | | | | | | | | Net Operating Income(dollars in thousands) | | | | | | | | | | | |
| | | | | | | |
| | | | | | | Three Months Ended July 31, 2011 | | | Three Months Ended July 31, 2010 | | | % Change |
| | | | | | | |
| | | | | | | Full
Consolidation
(GAAP) | | | Less
Noncontrolling
Interest | | | Plus
Unconsolidated
Investments at
Pro-Rata | | | Plus
Discontinued
Operations | | | Pro-Rata
Consolidation
(Non-GAAP) | | | Full
Consolidation
(GAAP) | | | Less
Noncontrolling
Interest | | | Plus
Unconsolidated
Investments at
Pro-Rata | | | Plus
Discontinued
Operations | | | Pro-Rata
Consolidation
(Non-GAAP) | | | Full
Consolidation
(GAAP) | | Pro-Rata
Consolidation
(Non-GAAP) |
| | | | | | | |
Commercial Group | | | | | | | | | | | | | | | | | | | | | | | | | | | | | | | | | | | | | | | | | | | | |
| | Retail | | | | | | | | | | | | | | | | | | | | | | | | | | | | | | | | | | | | | | | | | | | | |
| | | | Comparable | | $ | 48,461 | | | $ | 2,986 | | | $ | 9,611 | | | $ | – | | | $ | 55,086 | | | $ | 51,519 | | | $ | 2,612 | | | $ | 5,291 | | | $ | – | | | $ | 54,198 | | | (5.9%) | | 1.6% |
| | | | | | | | | |
| | | | Total | | | 50,499 | | | | 2,501 | | | | 10,976 | | | | – | | | | 58,974 | | | | 61,911 | | | | 2,791 | | | | 5,675 | | | | 2,225 | | | | 67,020 | | | | | |
| | Office Buildings | | | | | | | | | | | | | | | | | | | | | | | | | | | | | | | | | | | | | | | | | | | | |
| | | | Comparable | | | 57,716 | | | | 1,410 | | | | 4,842 | | | | – | | | | 61,148 | | | | 57,049 | | | | 2,588 | | | | 4,833 | | | | – | | | | 59,294 | | | 1.2% | | 3.1% |
| | | | | | | | | |
| | | | Total | | | 64,404 | | | | 1,646 | | | | 3,179 | | | | 831 | | | | 66,768 | | | | 60,913 | | | | 2,921 | | | | 2,240 | | | | 1,208 | | | | 61,440 | | | | | |
| | Hotels | | | | | | | | | | | | | | | | | | | | | | | | | | | | | | | | | | | | | | | | | | | | |
| | | | Comparable | | | 3,347 | | | | – | | | | 413 | | | | – | | | | 3,760 | | | | 3,329 | | | | – | | | | 370 | | | | – | | | | 3,699 | | | 0.5% | | 1.6% |
| | | | | | | | | |
| | | | Total | | | 5,847 | | | | – | | | | 413 | | | | – | | | | 6,260 | | | | 3,329 | | | | – | | | | 370 | | | | 774 | | | | 4,473 | | | | | |
| | Earnings from Commercial | | | | | | | | | | | | | | | | | | | | | | | | | | | | | | | | | | | | | | | | | | | | |
| | | | Land Sales | | | 773 | | | | – | | | | – | | | | – | | | | 773 | | | | 2,612 | | | | – | | | | – | | | | – | | | | 2,612 | | | | | |
| | Other(1) | | | (7,779 | ) | | | (533 | ) | | | 1,970 | | | | – | | | | (5,276 | ) | | | 858 | | | | (1,092 | ) | | | 1,966 | | | | – | | | | 3,916 | | | | | |
| | | | | | | |
Total Commercial Group | | | | | | | | | | | | | | | | | | | | | | | | | | | | | | | | | | | | | | | | | | | | |
| | | | Comparable | | | 109,524 | | | | 4,396 | | | | 14,866 | | | | – | | | | 119,994 | | | | 111,897 | | | | 5,200 | | | | 10,494 | | | | – | | | | 117,191 | | | (2.1%) | | 2.4% |
| | | | | | | | | |
| | | | Total | | | 113,744 | | | | 3,614 | | | | 16,538 | | | | 831 | | | | 127,499 | | | | 129,623 | | | | 4,620 | | | | 10,251 | | | | 4,207 | | | | 139,461 | | | | | |
Residential Group | | | | | | | | | | | | | | | | | | | | | | | | | | | | | | | | | | | | | | | | | | | | |
| | Apartments | | | | | | | | | | | | | | | | | | | | | | | | | | | | | | | | | | | | | | | | | |
| | | | Comparable | | | 24,958 | | | | 353 | | | | 5,079 | | | | – | | | | 29,684 | | | | 24,075 | | | | 473 | | | | 5,177 | | | | – | | | | 28,779 | | | 3.7% | | 3.1% |
| | | | | | | | | |
| | | | Total | | | 26,196 | | | | 942 | | | | 7,245 | | | | – | | | | 32,499 | | | | 24,765 | | | | 679 | | | | 6,120 | | | | 251 | | | | 30,457 | | | | | |
| | Subsidized Senior Housing | | | 2,317 | | | | 154 | | | | 1,700 | | | | – | | | | 3,863 | | | | 3,593 | | | | 131 | | | | 1,842 | | | | – | | | | 5,304 | | | | | |
| | Military Housing | | | 4,806 | | | | 238 | | | | 393 | | | | – | | | | 4,961 | | | | 6,525 | | | | – | | | | 379 | | | | – | | | | 6,904 | | | | | |
| | Other(1) | | | (3,675 | ) | | | (54 | ) | | | 1,609 | | | | – | | | | (2,012 | ) | | | 1,461 | | | | 119 | | | | 452 | | | | – | | | | 1,794 | | | | | |
| | | | | | | |
Total Residential Group | | | | | | | | | | | | | | | | | | | | | | | | | | | | | | | | | | | | | | | | | | | | |
| | | | Comparable | | | 24,958 | | | | 353 | | | | 5,079 | | | | – | | | | 29,684 | | | | 24,075 | | | | 473 | | | | 5,177 | | | | – | | | | 28,779 | | | 3.7% | | 3.1% |
| | | | | | | | | |
| | | | Total | | | 29,644 | | | | 1,280 | | | | 10,947 | | | | – | | | | 39,311 | | | | 36,344 | | | | 929 | | | | 8,793 | | | | 251 | | | | 44,459 | | | | | |
Total Rental Properties | | | | | | | | | | | | | | | | | | | | | | | | | | | | | | | | | | | | | | | | | | | | |
| | | | Comparable | | | 134,482 | | | | 4,749 | | | | 19,945 | | | | – | | | | 149,678 | | | | 135,972 | | | | 5,673 | | | | 15,671 | | | | – | | | | 145,970 | | | (1.1%) | | 2.5% |
| | | | | | | | | |
| | | | Total | | | 143,388 | | | | 4,894 | | | | 27,485 | | | | 831 | | | | 166,810 | | | | 165,967 | | | | 5,549 | | | | 19,044 | | | | 4,458 | | | | 183,920 | | | | | |
Land Development Group | | | 590 | | | | 158 | | | | 53 | | | | – | | | | 485 | | | | 2,327 | | | | 188 | | | | 118 | | | | – | | | | 2,257 | | | | | |
The Nets | | | | | | | | | | | | | | | | | | | | | | | | | | | | | | | | | | | | | | | | | | | | |
| | Operations | | | (3,382 | ) | | | – | | | | – | | | | – | | | | (3,382 | ) | | | (7,161 | ) | | | (20 | ) | | | – | | | | – | | | | (7,141) | | | | | |
| | Gain on disposition of partial interest | | | – | | | | – | | | | – | | | | – | | | | – | | | | 55,112 | | | | 23,675 | | | | – | | | | – | | | | 31,437 | | | | | |
| | | | | | | |
| | | | Total | | | (3,382 | ) | | | – | | | | – | | | | – | | | | (3,382 | ) | | | 47,951 | | | | 23,655 | | | | – | | | | – | | | | 24,296 | | | | | |
Corporate Activities | | | (10,104 | ) | | | – | | | | – | | | | – | | | | (10,104 | ) | | | (9,801 | ) | | | – | | | | – | | | | – | | | | (9,801) | | | | | |
| | | | | |
Grand Total | | $ | 130,492 | | | $ | 5,052 | | | $ | 27,538 | | | $ | 831 | | | $ | 153,809 | | | $ | 206,444 | | | $ | 29,392 | | | $ | 19,162 | | | $ | 4,458 | | | $ | 200,672 | | | | | |
| | | | | |
| (1) | Includes write-offs of abandoned development projects, non-capitalizable development costs and unallocated management and service company overhead, net of tax credit income. |
14
Forest City Enterprises, Inc. and Subsidiaries
Supplemental Operating Information
| | | | | | | | | | | | | | | | | | | | | | | | | | | | | | | | | | | | | | | | | | | | | | | | |
| | | | | | | | | | | | | | | | | | | Net Operating Income(dollars in thousands) | | | | | | | | | | | |
| | | | | | | Six Months Ended July 31, 2011 | | | Six Months Ended July 31, 2010 | | | % Change |
| | | | | | | Full
Consolidation
(GAAP) | | | Less
Noncontrolling
Interest | | | Plus
Unconsolidated
Investments at
Pro-Rata | | | Plus
Discontinued
Operations | | | Pro-Rata
Consolidation
(Non-GAAP) | | | Full
Consolidation
(GAAP) | | | Less
Noncontrolling
Interest | | | Plus
Unconsolidated
Investments at
Pro-Rata | | | Plus
Discontinued
Operations | | | Pro-Rata
Consolidation
(Non-GAAP) | | | Full
Consolidation
(GAAP) | | Pro-Rata
Consolidation
(Non-GAAP) |
Commercial Group | | | | | | | | | | | | | | | | | | | | | | | | | | | | | |
| | Retail | | | | | | | | | | | | | | | | | | | | | | | | | | | | | | | | | | | | | | | | | | | | |
| | | | Comparable | | $ | 105,749 | | | $ | 5,970 | | | $ | 15,886 | | | $ | – | | | $ | 115,665 | | | $ | 107,913 | | | $ | 5,461 | | | $ | 10,740 | | | $ | – | | | $ | 113,192 | | | (2.0%) | | 2.2% |
| | | | Total | | | 109,488 | | | | 5,393 | | | | 19,347 | | | | – | | | | 123,442 | | | | 123,532 | | | | 5,715 | | | | 11,258 | | | | 5,161 | | | | 134,236 | | | | | |
| | Office Buildings | | | | | | | | | | | | | | | | | | | | | | | | | | | | | | | | | | | | | | | | | | | | |
| | | | Comparable | | | 113,140 | | | | 3,498 | | | | 9,659 | | | | – | | | | 119,301 | | | | 115,395 | | | | 5,213 | | | | 8,910 | | | | – | | | | 119,092 | | | (2.0%) | | 0.2% |
| | | | Total | | | 122,301 | | | | 3,669 | | | | 6,363 | | | | 3,032 | | | | 128,027 | | | | 121,490 | | | | 5,592 | | | | 6,315 | | | | 2,535 | | | | 124,748 | | | | | |
| | Hotels | | | | | | | | | | | | | | | | | | | | | | | | | | | | | | | | | | | | | | | | | | | | |
| | | | Comparable | | | 3,450 | | | | – | | | | 773 | | | | – | | | | 4,223 | | | | 3,974 | | | | – | | | | 738 | | | | – | | | | 4,712 | | | (13.2%) | | (10.4%) |
| | | | Total | | | 5,950 | | | | – | | | | 773 | | | | 46 | | | | 6,769 | | | | 3,974 | | | | – | | | | 738 | | | | 1,566 | | | | 6,278 | | | | | |
| | Earnings from Commercial | | | | | | | | | | | | | | | | | | | | | | | | | | | | | | | | | | | | | | | | | | | | |
| | | | Land Sales (2) | | | 43,357 | | | | (782) | | | | – | | | | – | | | | 44,139 | | | | 2,901 | | | | 14 | | | | – | | | | – | | | | 2,887 | | | | | |
| | Other(1) | | | (6,712) | | | | (583) | | | | 3,907 | | | | – | | | | (2,222) | | | | (4,665) | | | | (734) | | | | 3,198 | | | | – | | | | (733) | | | | | |
Total Commercial Group | | | | | | | | | | | | | | | | | | | | | | | | | | | | | |
| | | | Comparable | | | 222,339 | | | | 9,468 | | | | 26,318 | | | | – | | | | 239,189 | | | | 227,282 | | | | 10,674 | | | | 20,388 | | | | – | | | | 236,996 | | | (2.2%) | | 0.9% |
| | | | Total | | | 274,384 | | | | 7,697 | | | | 30,390 | | | | 3,078 | | | | 300,155 | | | | 247,232 | | | | 10,587 | | | | 21,509 | | | | 9,262 | | | | 267,416 | | | | | |
Residential Group | | | | | | | | | | | | | | | | | | | | | | | | | | | | | |
| | Apartments | | | | | | | | | | | | | | | | | | | | | | | | | | | | | | | | | | | | | | | | | | | | |
| | | | Comparable | | | 48,617 | | | | 824 | | | | 10,194 | | | | – | | | | 57,987 | | | | 46,242 | | | | 761 | | | | 10,136 | | | | – | | | | 55,617 | | | 5.1% | | 4.3% |
| | | | Total | | | 53,050 | | | | 1,920 | | | | 13,794 | | | | – | | | | 64,924 | | | | 48,534 | | | | 1,107 | | | | 11,786 | | | | 900 | | | | 60,113 | | | | | |
| | Subsidized Senior Housing | | | 4,559 | | | | 251 | | | | 3,424 | | | | – | | | | 7,732 | | | | 6,236 | | | | 167 | | | | 3,624 | | | | – | | | | 9,693 | | | | | |
| | Military Housing | | | 10,396 | | | | 238 | | | | 771 | | | | – | | | | 10,929 | | | | 13,002 | | | | – | | | | 749 | | | | – | | | | 13,751 | | | | | |
| | Land Sales | | | 158 | | | | 16 | | | | – | | | | – | | | | 142 | | | | – | | | | – | | | | – | | | | – | | | | – | | | | | |
| | Other(1) | | | (5,255) | | | | (445) | | | | 2,064 | | | | – | | | | (2,746) | | | | (2,419) | | | | (111) | | | | 452 | | | | – | | | | (1,856) | | | | | |
Total Residential Group | | | | | | | | | | | | | | | | | | | | | | | | | | | | | |
| | | | Comparable | | | 48,617 | | | | 824 | | | | 10,194 | | | | – | | | | 57,987 | | | | 46,242 | | | | 761 | | | | 10,136 | | | | – | | | | 55,617 | | | 5.1% | | 4.3% |
| | | | Total | | | 62,908 | | | | 1,980 | | | | 20,053 | | | | – | | | | 80,981 | | | | 65,353 | | | | 1,163 | | | | 16,611 | | | | 900 | | | | 81,701 | | | | | |
Total Rental Properties | | | | | | | | | | | | | | | | | | | | | | | | | | | | | |
| | | | Comparable | | | 270,956 | | | | 10,292 | | | | 36,512 | | | | – | | | | 297,176 | | | | 273,524 | | | | 11,435 | | | | 30,524 | | | | – | | | | 292,613 | | | (0.9%) | | 1.6% |
| | | | Total | | | 337,292 | | | | 9,677 | | | | 50,443 | | | | 3,078 | | | | 381,136 | | | | 312,585 | | | | 11,750 | | | | 38,120 | | | | 10,162 | | | | 349,117 | | | | | |
Land Development Group | | | 2,692 | | | | 434 | | | | 202 | | | | – | | | | 2,460 | | | | 1,674 | | | | 206 | | | | (148) | | | | – | | | | 1,320 | | | | | |
The Nets | | | | | | | | | | | | | | | | | | | | | | | | | | | | | |
| | Operations | | | (3,686) | | | | – | | | | – | | | | – | | | | (3,686) | | | | (17,591) | | | | (6,243) | | | | 1,146 | | | | – | | | | (10,202) | | | | | |
| | Gain on disposition of partial interest | | | – | | | | – | | | | – | | | | – | | | | – | | | | 55,112 | | | | 23,675 | | | | – | | | | – | | | | 31,437 | | | | | |
| | | | Total | | | (3,686) | | | | – | | | | – | | | | – | | | | (3,686) | | | | 37,521 | | | | 17,432 | | | | 1,146 | | | | – | | | | 21,235 | | | | | |
Corporate Activities | | | (25,035) | | | | – | | | | – | | | | – | | | | (25,035) | | | | (21,147) | | | | – | | | | – | | | | – | | | | (21,147) | | | | | |
Grand Total | | $ | 311,263 | | | $ | 10,111 | | | $ | 50,645 | | | $ | 3,078 | | | $ | 354,875 | | | $ | 330,633 | | | $ | 29,388 | | | $ | 39,118 | | | $ | 10,162 | | | $ | 350,525 | | | | | |
| (1) | Includes write-offs of abandoned development projects, non-capitalizable development costs and unallocated management and service company overhead, net of tax credit income. |
| (2) | Includes $42,622 of NOI generated from the casino land sale at full and pro-rata consolidation. |
15
Forest City Enterprises, Inc. and Subsidiaries
Supplemental Operating Information
Net Operating Income by Product Type
Pro-Rata Consolidation (dollars in thousands)
Six Months Ended July 31, 2011
| | | | |
NOI by Product Type: | | $ | 345,942 | |
Casino Land Sale | | | 42,622 | |
The Nets | | | | |
Operations | | | (3,686) | |
Gain on disposition of partial interest | | | – | |
| | | | |
Total Nets | | | (3,686) | |
| | | | |
Corporate Activities | | | (25,035) | |
Other(1) | | | (4,968) | |
| | | | |
Grand Total NOI | | $ | 354,875 | |
| | | | |
Six Months Ended July 31, 2010
| | | | |
NOI by Product Type: | | $ | 353,026 | |
Casino Land Sale | | | – | |
The Nets | | | | |
Operations | | | (10,202) | |
Gain on disposition of partial interest | | | 31,437 | |
| | | | |
Total Nets | | | 21,235 | |
| | | | |
Corporate Activities | | | (21,147) | |
Other(1) | | | (2,589) | |
| | | | |
Grand Total NOI | | $ | 350,525 | |
| | | | |
(1) Includes write-offs of abandoned development projects, non-capitalizable development costs and unallocated management and service company overhead, net of tax credit income.
(2) Includes subsidized senior housing.
16
Forest City Enterprises, Inc. and Subsidiaries
Supplemental Operating Information
Net Operating Income by Core Market
Pro-Rata Consolidation (dollars in thousands)
Six Months Ended July 31, 2011
| | | | |
NOI by Market: | | $ | 345,942 | |
Casino Land Sale | | | 42,622 | |
The Nets | | | | |
Operations | | | (3,686) | |
Gain on disposition of partial interest | | | – | |
| | | | |
Total Nets | | | (3,686) | |
| | | | |
Corporate Activities | | | (25,035) | |
Other(1) | | | (4,968) | |
| | | | |
Grand Total NOI | | $ | 354,875 | |
| | | | |
Six Months Ended July 31, 2010
| | | | |
NOI by Market: | | $ | 353,026 | |
Casino Land Sale | | | – | |
The Nets | | | | |
Operations | | | (10,202) | |
Gain on disposition of partial interest | | | 31,437 | |
| | | | |
Total Nets | | | 21,235 | |
| | | | |
Corporate Activities | | | (21,147) | |
Other(1) | | | (2,589) | |
| | | | |
Grand Total NOI | | $ | 350,525 | |
| | | | |
(1) Includes write-offs of abandoned development projects, non-capitalizable development costs and unallocated management and service company overhead, net of tax credit income.
17
Forest City Enterprises, Inc. and Subsidiaries
Supplemental Operating Information
Reconciliation of Net Operating Income (non-GAAP) to Net Earnings (GAAP) (in thousands)
| | | | | | | | | | | | | | | | | | | | | | | | | | | | | | | | | | | | | | | | | | | | | | |
| | | | | Three Months Ended July 31, 2011 | | Three Months Ended July 31, 2010 | |
| | | | Full
Consolidation
(GAAP) | | | Less
Noncontrolling
Interest | | | Plus
Unconsolidated
Investments at
Pro-Rata | | | Plus
Discontinued
Operations | | | Pro-Rata
Consolidation
(Non-GAAP) | | | | | Full
Consolidation
(GAAP) | | | Less
Noncontrolling
Interest | | | Plus
Unconsolidated
Investments at
Pro-Rata | | | Plus
Discontinued
Operations | | | Pro-Rata
Consolidation
(Non-GAAP) | |
Revenues from real estate operations | | | | $ | 253,205 | | | $ | 12,279 | | | $ | 94,643 | | | $ | 1,494 | | | $ | 337,063 | | | | | $ | 294,221 | | | $ | 14,854 | | | $ | 80,162 | | | $ | 12,396 | | | $ | 371,925 | |
Exclude straight-line rent adjustment (1) | | | | | 1,619 | | | | – | | | | – | | | | (217 | ) | | | 1,402 | | | | | | (5,451 | ) | | | – | | | | – | | | | (508 | ) | | | (5,959 | ) |
Adjusted revenues | | | | | 254,824 | | | | 12,279 | | | | 94,643 | | | | 1,277 | | | | 338,465 | | | | | | 288,770 | | | | 14,854 | | | | 80,162 | | | | 11,888 | | | | 365,966 | |
Add interest and other income | | | | | 15,315 | | | | 534 | | | | 268 | | | | – | | | | 15,049 | | | | | | 16,231 | | | | 133 | | | | (56 | ) | | | 3 | | | | 16,045 | |
Add gain on disposition of partial interests in other investment – Nets | | | | | – | | | | – | | | | – | | | | – | | | | – | | | | | | 55,112 | | | | 23,675 | | | | – | | | | – | | | | 31,437 | |
Add equity in earnings (loss) of unconsolidated entities, including impairment | | | | | 2,385 | | | | 142 | | | | (5,592 | ) | | | – | | | | (3,349 | ) | | | | | (996 | ) | | | 98 | | | | (5,112 | ) | | | – | | | | (6,206 | ) |
Exclude loss on disposition of unconsolidated entities | | | | | – | | | | – | | | | – | | | | – | | | | – | | | | | | 878 | | | | – | | | | (878 | ) | | | – | | | | – | |
Exclude impairment of unconsolidated real estate | | | | | – | | | | – | | | | – | | | | – | | | | – | | | | | | 2,282 | | | | – | | | | (2,282 | ) | | | – | | | | – | |
Exclude depreciation and amortization of unconsolidated entities (see below) | | | | | 16,744 | | | | – | | | | (16,744 | ) | | | – | | | | – | | | | | | 12,865 | | | | – | | | | (12,865 | ) | | | – | | | | – | |
Adjusted total income | | | | | 289,268 | | | | 12,955 | | | | 72,575 | | | | 1,277 | | | | 350,165 | | | | | | 375,142 | | | | 38,760 | | | | 58,969 | | | | 11,891 | | | | 407,242 | |
Operating expenses | | | | | 159,771 | | | | 7,903 | | | | 45,037 | | | | 446 | | | | 197,351 | | | | | | 169,516 | | | | 9,368 | | | | 39,807 | | | | 7,433 | | | | 207,388 | |
Add back non-Real Estate depreciation and amortization (b) | | | | | 686 | | | | – | | | | – | | | | – | | | | 686 | | | | | | 1,185 | | | | – | | | | – | | | | – | | | | 1,185 | |
Exclude straight-line rent adjustment (2) | | | | | (1,095 | ) | | | – | | | | – | | | | – | | | | (1,095 | ) | | | | | (1,417 | ) | | | – | | | | – | | | | – | | | | (1,417 | ) |
Exclude preference payment | | | | | (586 | ) | | | – | | | | – | | | | – | | | | (586 | ) | | | | | (586 | ) | | | – | | | | – | | | | – | | | | (586 | ) |
Adjusted operating expenses | | | | | 158,776 | | | | 7,903 | | | | 45,037 | | | | 446 | | | | 196,356 | | | | | | 168,698 | | | | 9,368 | | | | 39,807 | | | | 7,433 | | | | 206,570 | |
Net operating income | | | | | 130,492 | | | | 5,052 | | | | 27,538 | | | | 831 | | | | 153,809 | | | | | | 206,444 | | | | 29,392 | | | | 19,162 | | | | 4,458 | | | | 200,672 | |
Interest expense | | | | | (64,064 | ) | | | (3,558 | ) | | | (25,183 | ) | | | (180 | ) | | | (85,869 | ) | | | | | (84,795 | ) | | | (4,164 | ) | | | (19,162 | ) | | | (2,355 | ) | | | (102,148 | ) |
Gain (loss) on early extinguishment of debt | | | | | (5,471 | ) | | | – | | | | (2,355 | ) | | | – | | | | (7,826 | ) | | | | | 1,896 | | | | – | | | | – | | | | – | | | | 1,896 | |
Equity in earnings (loss) of unconsolidated entities, including impairment | | | | | (2,385 | ) | | | (142 | ) | | | 5,592 | | | | – | | | | 3,349 | | | | | | 996 | | | | (98 | ) | | | 5,112 | | | | – | | | | 6,206 | |
Loss on disposition of unconsolidated entities | | | | | – | | | | – | | | | – | | | | – | | | | – | | | | | | (878 | ) | | | – | | | | – | | | | – | | | | (878 | ) |
Impairment of unconsolidated real estate | | | | | – | | | | – | | | | – | | | | – | | | | – | | | | | | (2,282 | ) | | | – | | | | – | | | | – | | | | (2,282 | ) |
Depreciation and amortization of unconsolidated entities (see above) | | | | | (16,744 | ) | | | – | | | | 16,744 | | | | – | | | | – | | | | | | (12,865 | ) | | | – | | | | 12,865 | | | | – | | | | – | |
Net gain on disposition of rental properties and partial interests in rental properties | | | | | – | | | | – | | | | – | | | | 29,899 | | | | 29,899 | | | | | | 204,269 | | | | – | | | | – | | | | 1,993 | | | | 206,262 | |
Impairment of consolidated real estate | | | | | (235 | ) | | | – | | | | – | | | | – | | | | (235 | ) | | | | | (1,100 | ) | | | – | | | | – | | | | (45,410 | ) | | | (46,510 | ) |
Depreciation and amortization – Real Estate Groups (a) | | | | | (53,852 | ) | | | (1,171 | ) | | | (16,010 | ) | | | (238 | ) | | | (68,929 | ) | | | | | (56,855 | ) | | | (1,906 | ) | | | (12,267 | ) | | | (2,573 | ) | | | (69,789 | ) |
Amortization of mortgage procurement costs – Real Estate Groups (c) | | | | | (2,727 | ) | | | (130 | ) | | | (734 | ) | | | (84 | ) | | | (3,415 | ) | | | | | (2,721 | ) | | | (112 | ) | | | (598 | ) | | | (426 | ) | | | (3,633 | ) |
Straight-line rent adjustment (1) + (2) | | | | | (2,714 | ) | | | – | | | | – | | | | 217 | | | | (2,497 | ) | | | | | 4,034 | | | | – | | | | – | | | | 508 | | | | 4,542 | |
Preference payment | | | | | (586 | ) | | | – | | | | – | | | | – | | | | (586 | ) | | | | | (586 | ) | | | – | | | | – | | | | – | | | | (586 | ) |
Earnings (loss) before income taxes | | | | | (18,286 | ) | | | 51 | | | | 5,592 | | | | 30,445 | | | | 17,700 | | | | | | 255,557 | | | | 23,112 | | | | 5,112 | | | | (43,805 | ) | | | 193,752 | |
Income tax provision | | | | | 6,171 | | | | – | | | | – | | | | (12,388 | ) | | | (6,217 | ) | | | | | (81,566 | ) | | | – | | | | – | | | | 16,866 | | | | (64,700 | ) |
Equity in earnings (loss) of unconsolidated entities, including impairment | | | | | 2,385 | | | | 142 | | | | (5,592 | ) | | | – | | | | (3,349 | ) | | | | | (996 | ) | | | 98 | | | | (5,112 | ) | | | – | | | | (6,206 | ) |
Earnings (loss) from continuing operations | | | | | (9,730 | ) | | | 193 | | | | – | | | | 18,057 | | | | 8,134 | | | | | | 172,995 | | | | 23,210 | | | | – | | | | (26,939 | ) | | | 122,846 | |
Discontinued operations, net of tax | | | | | 100,087 | | | | 82,030 | | | | – | | | | (18,057 | ) | | | – | | | | | | (22,642 | ) | | | 4,297 | | | | – | | | | 26,939 | | | | – | |
Net earnings | | | | | 90,357 | | | | 82,223 | | | | – | | | | – | | | | 8,134 | | | | | | 150,353 | | | | 27,507 | | | | – | | | | – | | | | 122,846 | |
Noncontrolling interests | | | | | | | | | | | | | | | | | | | | | | | | | | | | | | | | | | | | | | | | | | | | |
Earnings from continuing operations attributable to noncontrolling interests | | | | | (193 | ) | | | (193 | ) | | | – | | | | – | | | | – | | | | | | (23,210 | ) | | | (23,210 | ) | | | – | | | | – | | | | – | |
Earnings from discontinued operations attributable to noncontrolling interests | | | | | (82,030 | ) | | | (82,030 | ) | | | – | | | | – | | | | – | | | | | | (4,297 | ) | | | (4,297 | ) | | | – | | | | – | | | | – | |
Noncontrolling interests | | | | | (82,223 | ) | | | (82,223 | ) | | | – | | | | – | | | | – | | | | | | (27,507 | ) | | | (27,507 | ) | | | – | | | | – | | | | – | |
Net earnings attributable to Forest City Enterprises, Inc. | | | | $ | 8,134 | | | $ | – | | | $ | – | | | $ | – | | | $ | 8,134 | | | | | $ | 122,846 | | | $ | – | | | $ | – | | | $ | – | | | $ | 122,846 | |
Preferred dividends | | | | | (3,850 | ) | | | – | | | | – | | | | – | | | | (3,850 | ) | | | | | (4,107 | ) | | | – | | | | – | | | | – | | | | (4,107 | ) |
Net earnings attributable to Forest City Enterprises, Inc. common shareholders | | | | $ | 4,284 | | | $ | – | | | $ | – | | | $ | – | | | $ | 4,284 | | | | | $ | 118,739 | | | $ | – | | | $ | – | | | $ | – | | | $ | 118,739 | |
(a) | | Depreciation and amortization – Real Estate Groups | | | | $ | 53,852 | | | $ | 1,171 | | | $ | 16,010 | | | $ | 238 | | | $ | 68,929 | | | | | $ | 56,855 | | | $ | 1,906 | | | $ | 12,267 | | | $ | 2,573 | | | $ | 69,789 | |
(b) | | Depreciation and amortization – Non-Real Estate | | | | | 686 | | | | – | | | | – | | | | – | | | | 686 | | | | | | 1,185 | | | | – | | | | – | | | | – | | | | 1,185 | |
| | Total depreciation and amortization | | | | $ | 54,538 | | | $ | 1,171 | | | $ | 16,010 | | | $ | 238 | | | $ | 69,615 | | | | | $ | 58,040 | | | $ | 1,906 | | | $ | 12,267 | | | $ | 2,573 | | | $ | 70,974 | |
(c) | | Amortization of mortgage procurement costs – Real Estate Groups | | | | $ | 2,727 | | | $ | 130 | | | $ | 734 | | | $ | 84 | | | $ | 3,415 | | | | | $ | 2,721 | | | $ | 112 | | | $ | 598 | | | $ | 426 | | | $ | 3,633 | |
(d) | | Amortization of mortgage procurement costs – Non-Real Estate | | | | | – | | | | – | | | | – | | | | – | | | | – | | | | | | – | | | | – | | | | – | | | | – | | | | – | |
| | Total amortization of mortgage procurement costs | | | | $ | 2,727 | | | $ | 130 | | | $ | 734 | | | $ | 84 | | | $ | 3,415 | | | | | $ | 2,721 | | | $ | 112 | | | $ | 598 | | | $ | 426 | | | $ | 3,633 | |
18
Forest City Enterprises, Inc. and Subsidiaries
Supplemental Operating Information
Reconciliation of Net Operating Income (non-GAAP) to Net Earnings (GAAP) (in thousands)(continued)
| | | | | | | | | | | | | | | | | | | | | | | | | | | | | | | | | | | | | | | | |
| | | Six Months Ended July 31, 2011 | | | Six Months Ended July 31, 2010 | |
| | | | | | | | | Plus | | | | | | | | | | | | | | | Plus | | | | | | | |
| | | Full | | | Less | | | Unconsolidated | | | Plus | | | Pro-Rata | | | Full | | | Less | | | Unconsolidated | | | Plus | | | Pro-Rata | |
| | | Consolidation | | | Noncontrolling | | | Investments at | | | Discontinued | | | Consolidation | | | Consolidation | | | Noncontrolling | | | Investments at | | | Discontinued | | | Consolidation | |
| | | (GAAP) | | | Interest | | | Pro-Rata | | | Operations | | | (Non-GAAP) | | | (GAAP) | | | Interest | | | Pro-Rata | | | Operations | | | (Non-GAAP) | |
Revenues from real estate operations | | $ | 561,629 | | | $ | 24,868 | | | $ | 177,357 | | | $ | 6,593 | | | $ | 720,711 | | | $ | 563,003 | | | $ | 26,668 | | | $ | 153,635 | | | $ | 23,980 | | | $ | 713,950 | |
Exclude straight-line rent adjustment (1) | | | (1,462 | ) | | | – | | | | – | | | | (571 | ) | | | (2,033 | ) | | | (9,568 | ) | | | – | | | | – | | | | (671 | ) | | | (10,239 | ) |
Adjusted revenues | | | 560,167 | | | | 24,868 | | | | 177,357 | | | | 6,022 | | | | 718,678 | | | | 553,435 | | | | 26,668 | | | | 153,635 | | | | 23,309 | | | | 703,711 | |
Add interest and other income | | | 30,822 | | | | 394 | | | | 385 | | |
| –
|
| | | 30,813 | | | | 23,045 | | | | 1,032 | | | | 14,760 | | | | 6 | | | | 36,779 | |
Add gain on disposition of partial interests in other investment – Nets | | | – | | | | – | | | | – | | | | – | | | | – | | | | 55,112 | | | | 23,675 | | | | – | | | | – | | | | 31,437 | |
Add equity in earnings (loss) of unconsolidated entities, including impairment | | | 22,379 | | | | 190 | | | | (25,891 | ) | | | – | | | | (3,702 | ) | | | (18,120 | ) | | | (6,346 | ) | | | 5,841 | | | | – | | | | (5,933 | ) |
Exclude gain (loss) on disposition of unconsolidated entities | | | (12,567 | ) | | | – | | | | 12,567 | | | | – | | | | – | | | | 830 | | | | – | | | | (830 | ) | | | – | | | | – | |
Exclude impairment of unconsolidated real estate | | | – | | | | – | | | | – | | | | – | | | | – | | | | 15,181 | | | | – | | | | (15,181 | ) | | | – | | | | – | |
Exclude depreciation and amortization of unconsolidated entities (see below) | | | 31,052 | | | | – | | | | (31,052 | ) | | | – | | | | – | | | | 24,717 | | | | – | | | | (24,717 | ) | | | – | | | | – | |
Adjusted total income | | | 631,853 | | | | 25,452 | | | | 133,366 | | | | 6,022 | | | | 745,789 | | | | 654,200 | | | | 45,029 | | | | 133,508 | | | | 23,315 | | | | 765,994 | |
Operating expenses | | | 322,679 | | | | 15,341 | | | | 82,721 | | | | 2,944 | | | | 393,003 | | | | 324,644 | | | | 15,641 | | | | 93,443 | | | | 13,153 | | | | 415,599 | |
Add back non-Real Estate depreciation and amortization (b) | | | 1,388 | | | | – | | | | – | | | | – | | | | 1,388 | | | | 2,753 | | | | – | | | | 878 | | | | – | | | | 3,631 | |
Add back amortization of mortgage procurement costs for non-Real Estate Groups (d) | | | – | | | | – | | | | – | | | | – | | | | – | | | | – | | | | – | | | | 69 | | | | – | | | | 69 | |
Exclude straight-line rent adjustment (2) | | | (2,306 | ) | | | – | | | | – | | | | – | | | | (2,306 | ) | | | (2,659 | ) | | | – | | | | – | | | | – | | | | (2,659 | ) |
Exclude preference payment | | | (1,171 | ) | | | – | | | | – | | | | – | | | | (1,171 | ) | | | (1,171 | ) | | | – | | | | – | | | | – | | | | (1,171 | ) |
Adjusted operating expenses | | | 320,590 | | | | 15,341 | | | | 82,721 | | | | 2,944 | | | | 390,914 | | | | 323,567 | | | | 15,641 | | | | 94,390 | | | | 13,153 | | | | 415,469 | |
Net operating income | | | 311,263 | | | | 10,111 | | | | 50,645 | | | | 3,078 | | | | 354,875 | | | | 330,633 | | | | 29,388 | | | | 39,118 | | | | 10,162 | | | | 350,525 | |
Interest expense | | | (130,979 | ) | | | (7,420 | ) | | | (48,290 | ) | | | (712 | ) | | | (172,561 | ) | | | (165,977 | ) | | | (9,201 | ) | | | (39,118 | ) | | | (4,045 | ) | | | (199,939 | ) |
Gain (loss) on early extinguishment of debt | | | (5,767 | ) | | | (4 | ) | | | (2,355 | ) | | | – | | | | (8,118 | ) | | | 8,193 | | | | – | | | | – | | | | – | | | | 8,193 | |
Equity in earnings (loss) of unconsolidated entities, including impairment | | | (22,379 | ) | | | (190 | ) | | | 25,891 | | | | – | | | | 3,702 | | | | 18,120 | | | | 6,346 | | | | (5,841 | ) | | | – | | | | 5,933 | |
Gain (loss) on disposition of unconsolidated entities | | | 12,567 | | | | – | | | | – | | | | – | | | | 12,567 | | | | (830 | ) | | | – | | | | – | | | | – | | | | (830 | ) |
Impairment of unconsolidated real estate | | | – | | | | – | | | | – | | | | – | | | | – | | | | (15,181 | ) | | | – | | | | – | | | | – | | | | (15,181 | ) |
Depreciation and amortization of unconsolidated entities (see above) | | | (31,052 | ) | | | – | | | | 31,052 | | | | – | | | | – | | | | (24,717 | ) | | | – | | | | 24,717 | | | | – | | | | – | |
Net gain on disposition of rental properties and partial interests in rental properties | | | 9,561 | | | | – | | | | – | | | | 39,937 | | | | 49,498 | | | | 205,135 | | | | – | | | | – | | | | 1,993 | | | | 207,128 | |
Impairment of consolidated real estate | | | (5,070 | ) | | | – | | | | – | | | | – | | | | (5,070 | ) | | | (1,100 | ) | | | – | | | | – | | | | (45,410 | ) | | | (46,510 | ) |
Depreciation and amortization – Real Estate Groups (a) | | | (109,857 | ) | | | (2,829 | ) | | | (29,700 | ) | | | (1,030 | ) | | | (137,758 | ) | | | (114,613 | ) | | | (3,281 | ) | | | (23,635 | ) | | | (4,776 | ) | | | (139,743 | ) |
Amortization of mortgage procurement costs – Real Estate Groups (c) | | | (5,622 | ) | | | (260 | ) | | | (1,352 | ) | | | (333 | ) | | | (7,047 | ) | | | (5,333 | ) | | | (201 | ) | | | (1,082 | ) | | | (481 | ) | | | (6,695 | ) |
Straight-line rent adjustment (1) + (2) | | | (844 | ) | | | – | | | | – | | | | 571 | | | | (273 | ) | | | 6,909 | | | | – | | | | – | | | | 671 | | | | 7,580 | |
Preference payment | | | (1,171 | ) | | | – | | | | – | | | | – | | | | (1,171 | ) | | | (1,171 | ) | | | – | | | | – | | | | – | | | | (1,171 | ) |
Earnings (loss) before income taxes | | | 20,650 | | | | (592 | ) | | | 25,891 | | | | 41,511 | | | | 88,644 | | | | 240,068 | | | | 23,051 | | | | (5,841 | ) | | | (41,886 | ) | | | 169,290 | |
Income tax provision | | | (11,742 | ) | | | – | | | | – | | | | (17,499 | ) | | | (29,241 | ) | | | (72,196 | ) | | | – | | | | – | | | | 16,123 | | | | (56,073 | ) |
Equity in earnings (loss) of unconsolidated entities, including impairment | | | 22,379 | | | | 190 | | | | (25,891 | ) | | | – | | | | (3,702 | ) | | | (18,120 | ) | | | (6,346 | ) | | | 5,841 | | | | – | | | | (5,933 | ) |
Earnings (loss) from continuing operations | | | 31,287 | | | | (402 | ) | | | – | | | | 24,012 | | | | 55,701 | | | | 149,752 | | | | 16,705 | | | | – | | | | (25,763 | ) | | | 107,284 | |
Discontinued operations, net of tax | | | 107,767 | | | | 83,755 | | | | – | | | | (24,012 | ) | | | – | | | | (20,763 | ) | | | 5,000 | | | | – | | | | 25,763 | | | | – | |
Net earnings | | | 139,054 | | | | 83,353 | | | | – | | | | – | | | | 55,701 | | | | 128,989 | | | | 21,705 | | | | – | | | | – | | | | 107,284 | |
Noncontrolling interests | | | | | | | | | | | | | | | | | | | | | | | | | | | | | | | | | | | | | | | | |
(Earnings) loss from continuing operations attributable to noncontrolling interests | | | 402 | | | | 402 | | | | – | | | | – | | | | – | | | | (16,705 | ) | | | (16,705 | ) | | | – | | | | – | | | | – | |
Earnings from discontinued operations attributable to noncontrolling interests | | | (83,755 | ) | | | (83,755 | ) | | | – | | | | – | | | | – | | | | (5,000 | ) | | | (5,000 | ) | | | – | | | | – | | | | – | |
Noncontrolling interests | | | (83,353 | ) | | | (83,353 | ) | | | – | | | | – | | | | – | | | | (21,705 | ) | | | (21,705 | ) | | | – | | | | – | | | | – | |
Net earnings attributable to Forest City Enterprises, Inc. | | $ | 55,701 | | | $ | – | | | $ | – | | | $ | – | | | $ | 55,701 | | | $ | 107,284 | | | $ | – | | | $ | – | | | $ | – | | | $ | 107,284 | |
Preferred dividends | | | (7,700 | ) | | | – | | | | – | | | | – | | | | (7,700 | ) | | | (4,107 | ) | | | – | | | | – | | | | – | | | | (4,107 | ) |
Net earnings attributable to Forest City Enterprises, Inc. common shareholders | | $ | 48,001 | | | $ | – | | | $ | – | | | $ | – | | | $ | 48,001 | | | $ | 103,177 | | | $ | – | | | $ | – | | | $ | – | | | $ | 103,177 | |
(a) Depreciation and amortization – Real Estate Groups | | $ | 109,857 | | | $ | 2,829 | | | $ | 29,700 | | | $ | 1,030 | | | $ | 137,758 | | | $ | 114,613 | | | $ | 3,281 | | | $ | 23,635 | | | $ | 4,776 | | | $ | 139,743 | |
(b) Depreciation and amortization – Non-Real Estate | | | 1,388 | | | | – | | | | – | | | | – | | | | 1,388 | | | | 2,753 | | | | – | | | | 878 | | | | – | | | | 3,631 | |
Total depreciation and amortization | | $ | 111,245 | | | $ | 2,829 | | | $ | 29,700 | | | $ | 1,030 | | | $ | 139,146 | | | $ | 117,366 | | | $ | 3,281 | | | $ | 24,513 | | | $ | 4,776 | | | $ | 143,374 | |
(c) Amortization of mortgage procurement costs – Real Estate Groups | | $ | 5,622 | | | $ | 260 | | | $ | 1,352 | | | $ | 333 | | | $ | 7,047 | | | $ | 5,333 | | | $ | 201 | | | $ | 1,082 | | | $ | 481 | | | $ | 6,695 | |
(d) Amortization of mortgage procurement costs – Non-Real Estate | | | – | | | | – | | | | – | | | | – | | | | – | | | | – | | | | – | | | | 69 | | | | – | | | | 69 | |
Total amortization of mortgage procurement costs | | $ | 5,622 | | | $ | 260 | | | $ | 1,352 | | | $ | 333 | | | $ | 7,047 | | | $ | 5,333 | | | $ | 201 | | | $ | 1,151 | | | $ | 481 | | | $ | 6,764 | |
19
Forest City Enterprises, Inc. and Subsidiaries
Supplemental Operating Information
Results of Operations
Net Earnings Attributable to Forest City Enterprises, Inc. – Net earnings attributable to Forest City Enterprises, Inc. for the three months ended July 31, 2011 was $8,134,000 versus $122,846,000 for the three months ended July 31, 2010. Although we have substantial recurring revenue from our properties, we also periodically enter into significant transactions, which can create substantial variances in net earnings between periods. This variance to the prior year is primarily attributable to the following decreases, which are net of noncontrolling interest:
| | • | | $204,269,000 related to the 2010 gain on disposition of partial interest in seven mixed-useUniversity Park life science properties in Cambridge, Massachusetts, related to the formation of a new joint venture with an outside partner; |
| | • | | $31,437,000 related to the 2010 gain on disposition of partial interest in The Nets; |
| | • | | $10,800,000 related to the 2011 loss on early extinguishment of debt on the exchange of a portion of our Senior Notes due 2016 for Class A common stock; and |
| | • | | $3,318,000 (which includes $91,000 for unconsolidated entities) related to a decrease in income recognized on the sale of state and federal Historic Preservation Tax Credits and New Market Tax Credits in 2011 compared to 2010. |
These decreases were partially offset by the following increases, net of noncontrolling interest:
| | • | | $48,557,000 related to the 2011 decrease in impairment charges of consolidated (including discontinued operations) and unconsolidated entities; |
| | • | | $27,907,000 related to the 2011 gain on disposition of rental properties exceeding 2010 gains. The 2011 gain on disposition primarily related toWaterfront Station – East 4th & West 4th Buildings, while the 2010 gain related to the disposition of101 San Fernando, an apartment community in San Jose, California; |
| | • | | $7,342,000 related to the change in fair market value of certain derivatives between the comparable periods, which was marked to market through interest expense as a result of the derivatives not qualifying for hedge accounting; |
| | • | | $5,329,000 related to the 2011 gain on early extinguishment of Urban Development Action Grant (“UDAG”) loans onAvenue at Tower City Center, a specialty retail center in Cleveland, Ohio; |
| | • | | $3,759,000 related to a 2011 decrease in allocated losses from our equity investment in The Nets; and |
| | • | | $58,483,000 due to decreased income tax expense primarily related to the various transactions noted above. |
Net earnings attributable to Forest City Enterprises, Inc. for the six months ended July 31, 2011 was $55,701,000 versus $107,284,000 for the six months ended July 31, 2010. The variance to the prior year is primarily attributable to the following decreases, which are net of noncontrolling interest:
| | • | | $175,793,000 related to the 2010 gain on disposition of partial interest in seven mixed-useUniversity Park life science properties, related to the formation of a new joint venture with an outside partner; |
| | • | | $31,437,000 related to the 2010 gain on disposition of partial interest in The Nets; |
| | • | | $29,342,000 related to the 2010 gain on disposition of partial interest inThe Grand,Lenox Club andLenox Park, apartment communities in the Washington, D.C. metropolitan area, related to the formation of a new joint venture with an outside partner; and |
| | • | | $18,993,000 related to the 2011 loss on early extinguishment of debt on the exchange of a portion of our Senior Notes due 2016 for Class A common stock and the 2010 gain on early extinguishment of debt on the exchange of a portion of our Senior Notes due 2011, 2015 and 2017 for a new issue of Series A preferred stock and purchase of a portion of our Senior Notes due 2011 and 2017. |
These decreases were partially offset by the following increases, net of noncontrolling interest:
| | • | | $56,621,000 related to the 2011 decrease in impairment charges of consolidated (including discontinued operations) and unconsolidated entities; |
20
Forest City Enterprises, Inc. and Subsidiaries
Supplemental Operating Information
| | • | | $42,622,000 related to the 2011 sale of land and air rights to Rock Ohio Caesars Cleveland, LLC (“Rock Ohio”) for development of a casino in downtown Cleveland, Ohio (“Casino land sale”); |
| | • | | $37,945,000 related to the 2011 gains on disposition ofWaterfront Station – East 4th & West 4th BuildingsandCharleston Marriott, a hotel in Charleston, West Virginia, offset by the 2010 gain on disposition of101 San Fernando; |
| | • | | $12,567,000 related to the 2011 gains on disposition of our unconsolidated investments inMetropolitan Lofts andTwin Lake Towers, apartment communities in Los Angeles, California and Denver, Colorado, respectively; |
| | • | | $9,561,000 due to the 2011 gain on disposition of partial interests in 15 retail properties in the New York City metropolitan area, related to the formation of new joint venture agreements with an outside partner; |
| | • | | $8,413,000 related to the change in fair market value of certain derivatives between the comparable periods, which was marked to market through interest expense as a result of the derivatives not qualifying for hedge accounting; |
| | • | | $7,662,000 related to a 2011 decrease in allocated losses from our equity investment in The Nets; |
| | • | | $5,329,000 related to the 2011 gain on early extinguishment of UDAG loans onAvenue at Tower City Center; |
| | • | | $3,217,000 related to an increase in income recognized on the sale of state and federal Historic Preservation Tax Credits and New Market Tax Credits in 2011 compared to 2010; and |
| | • | | $26,832,000 due to decreased income tax expense primarily related to the various transactions noted above. |
Net Operating Income (NOI) from Real Estate Groups– NOI, a non-GAAP measure, is defined as revenues (excluding straight-line rent adjustments) less operating expenses (including depreciation and amortization and amortization of mortgage procurement costs for non-real estate groups) plus interest income plus equity in earnings (loss) of unconsolidated entities (excluding gain on disposition and impairment of unconsolidated entities) plus depreciation and amortization of unconsolidated entities. We believe NOI provides us, as well as our investors, additional information about our core business operations and, along with earnings, is necessary to understand our business and operating results.
Full Consolidation – Under the full consolidation method (GAAP), NOI from the combination of the Commercial Group and the Residential Group (“Rental Properties”) for the three months ended July 31, 2011 was $143,388,000 compared to $165,967,000 for the three months ended July 31, 2010, a 13.6% decrease. NOI for the six months ended July 31, 2011 was $337,292,000 compared to $312,585,000 for the six months ended July 31, 2010, a 7.9% increase. The primary drivers of the six month increase were the NOI generated from the casino land sale within the Commercial Group of $42,622,000 partially offset by reduced NOI resulting from our joint venture transactions. A reconciliation of NOI to the most comparable GAAP measure, net earnings, is presented on pages 18-19. A reconciliation of NOI to net earnings (loss) for each strategic business unit can be found on pages 45-56.
Pro-Rata Consolidation – Management also analyzes property NOI using the pro-rata consolidation method because it provides operating data at our ownership share, and we publicly disclose and discuss our performance using this method of consolidation to complement our GAAP disclosures. Under the pro-rata consolidation method, NOI from Rental Properties for the three months ended July 31, 2011 was $166,810,000 compared to $183,920,000 for the three months ended July 31, 2010, a 9.3% decrease. NOI for the six months ended July 31, 2011 was $381,136,000 compared to $349,117,000 for the six months ended July 31, 2010, a 9.2% increase. The primary drivers of the six month increase were the NOI generated from the casino land sale within the Commercial Group of $42,622,000 partially offset by reduced NOI resulting from our joint venture transactions.
Comparable NOI increased 2.5% for the three months ended July 31, 2011 compared to the prior year. Retail, office and hotel comparable NOI increased 1.6%, 3.1% and 1.6%, respectively, and our residential portfolio increased 3.1%. Comparable NOI increased 1.6% for the six months ended July 31, 2011 compared to the prior year. Retail, office, and residential comparable NOI increased 2.2%, 0.2% and 4.3%, respectively, while hotel comparable NOI decreased 10.4%.
Capital Improvements to our Operating Portfolio – Our diversified real estate portfolio requires certain capital improvements to maintain and improve its operating performance. During the six months ended July 31, 2011 we invested $29,829,000 at pro-rata consolidation ($22,622,000 at full consolidation) in capital improvements to our operating portfolio as compared to $20,561,000 at pro-rata consolidation ($15,693,000 at full consolidation) during the six months ended July 31, 2010.
21
Forest City Enterprises, Inc. and Subsidiaries
Supplemental Operating Information
EBDT – We use an additional measure, along with net earnings, to report our operating results. This non-GAAP measure, referred to as EBDT, is not a measure of operating results or cash flows from operations as defined by GAAP and may not be directly comparable to similarly-titled measures reported by other companies.
We believe that EBDT provides additional information about our core operations and, along with net earnings, is necessary to understand our operating results. EBDT is used by the chief operating decision maker and management in assessing operating performance and to consider capital requirements and allocation of resources by segment and on a consolidated basis. We believe EBDT is important to investors because it provides another method for the investor to measure our long-term operating performance as net earnings can vary from year to year due to property dispositions, acquisitions and other factors that have a short-term impact.
EBDT is defined as net earnings excluding the following items: i) gain (loss) on disposition of rental properties, divisions and other investments (net of tax); ii) the adjustment to recognize rental revenues and rental expense using the straight-line method; iii) non-cash charges for real estate depreciation, amortization, and amortization of mortgage procurement costs; iv) deferred income taxes; v) preferred payment which is classified as noncontrolling interest expense on our Consolidated Statement of Operations; vi) impairment of real estate (net of tax); vii) extraordinary items (net of tax); and viii) cumulative or retrospective effect of change in accounting principle (net of tax).
EBDT is reconciled to net earnings (loss), the most comparable financial measure calculated in accordance with GAAP, on page 25. The adjustment to recognize rental revenues and rental expenses on the straight-line method is excluded because it is management’s opinion that rental revenues and expenses should be recognized when due from the tenants or due to the landlord. We exclude depreciation and amortization expense related to real estate operations from EBDT because we believe the values of our properties, in general, have appreciated over time in excess of their original cost. Deferred income taxes, which are the result of timing differences of certain income and expense items which are to be realized in a future year for federal income tax purposes, are excluded until the year in which they are reflected in our current tax provision. The impairment of real estate is excluded from EBDT because it varies from year to year based on factors unrelated to our overall financial performance and is related to the ultimate gain on dispositions of operating properties. Our EBDT may not be directly comparable to similarly-titled measures reported by other companies.
Effective during the six months ended July 31, 2011, under the direction of the Company’s chief operating decision maker, EBDT which is provided in order to assess performance for the Real Estate Groups and The Nets was on a pre-tax basis. The Corporate Activity segment controls the tax strategies and evaluates results on a consolidated basis. As a result, beginning February 1, 2011, the Company will no longer allocate income tax expense (benefit) to the Real Estate Groups or The Nets. In addition, based on the consolidated evaluation of income taxes, it was determined that EBDT would exclude all deferred income taxes instead of just those attributable to the Real Estate Groups.
Our EBDT for the three months ended July 31, 2011 decreased by $34,854,000 or 33.0% to $70,706,000 from $105,560,000 for the three months ended July 31, 2010. The fluctuations in EBDT by Segment are as follows:
| | • | | Our Commercial and Residential Segments remained about flat. This is primarily the result of increased EBDT from the change in fair market value of derivatives between the comparable periods which were marked to market through interest expense of $7,322,000, the 2011 gain on early extinguishment of Urban Development Action Grant (UDAG) loans of $5,329,000, and increased NOI on our mature portfolio of $3,708,000. These increases in the portfolio were partially offset by reduced EBDT from properties sold of $5,316,000, increased write-offs of abandoned projects of $4,494,000, decreased income recognized from state and federal Historic Preservation and New Market tax credits of $2,997,000, and reduced EBDT from new properties of $1,800,000 primarily due to lease up losses at8 Spruce Street andPresidio Landmark partially offset by the ramp up of other new property openings; |
| | • | | Our Land Segment provided a pre-tax EBDT decrease of $2,399,000, primarily due to lower margins on land sales; |
| | • | | The Nets provided a pre-tax EBDT decrease of $27,678,000, primarily due to the nonrecurring 2010 gain on disposition of partial interest of $31,437,000, partially offset by the decrease in our allocated losses of $3,759,000; |
| | • | | Corporate pre-tax EBDT decreased $10,109,000. This pre-tax EBDT decrease is primarily due to the 2011 loss on early extinguishment of debt of $10,800,000 on the exchange of a portion of our Senior Notes for Class A common stock; and |
| | • | | EBDT was favorably impacted by a larger tax benefit of $5,452,000 compared to prior year. |
22
Forest City Enterprises, Inc. and Subsidiaries
Supplemental Operating Information
Our EBDT for the six months ended July 31, 2011 increased by $22,055,000 or 12.5% to $198,082,000 from $176,027,000 for the six months ended July 31, 2010. The fluctuations in EBDT by Segment are as follows:
| | • | | Our Commercial and Residential Segments combined provided a pre-tax EBDT increase of $55,624,000. This is primarily related to the 2011 sale of land and air rights to Rock Ohio of $42,622,000, increased EBDT from the change in fair market value of derivatives between the comparable periods which were marked to market through interest expense of $8,309,000, increased income recognized from state and federal Historic Preservation and New Market tax credits of $4,713,000, increased NOI on our mature portfolio of $4,564,000, and decreased interest expense on our mature portfolio of $3,276,000. These increases in the portfolio were partially offset by reduced EBDT from properties sold of $9,543,000; |
| | • | | Our Land Segment provided a pre-tax EBDT increase of $614,000, primarily due to increased sales; |
| | • | | The Nets provided a pre-tax EBDT decrease of $23,775,000, primarily due to the nonrecurring 2010 gain on disposition of partial interest of $31,437,000, partially offset by the decrease in our allocated losses of $7,662,000; |
| | • | | Corporate pre-tax EBDT decreased $17,046,000. This pre-tax EBDT decrease includes the 2011 loss on early extinguishment of debt on the exchange of a portion of our Senior Notes for Class A common stock of $10,800,000 and the nonrecurring 2010 gain on early extinguishment of debt related to the exchange of our Senior Notes of $8,193,000; and |
| | • | | EBDT was favorably impacted by a larger tax benefit of $6,638,000 compared to prior year. |
23
Forest City Enterprises, Inc. and Subsidiaries
Supplemental Operating Information
24
Forest City Enterprises, Inc. and Subsidiaries
Supplemental Operating Information
25
Forest City Enterprises, Inc. and Subsidiaries
Supplemental Operating Information
Summary of EBDT – The information in the following tables present amounts for both full consolidation and pro-rata consolidation, providing a reconciliation of the difference between the two methods, as well as a reconciliation from NOI to EBDT to net earnings (loss). Under the pro-rata consolidation method, we present our partnership investments proportionate to our pro-rata share for each line item of our consolidated financial statements. Under full consolidation, partnership assets and liabilities are reported as consolidated at 100% if deemed under our control or if we are deemed to be the primary beneficiary for investments in VIEs, or on the equity method of accounting if we do not have control or are not the primary beneficiary for investments in VIEs.
Reconciliation of Net Earnings to Earnings Before Depreciation, Amortization and Deferred Taxes (EBDT)
| | | 00000000000 | | | | 00000000000 | | | | 00000000000 | | | | 00000000000 | |
| | | Three Months Ended July 31, | | | Six Months Ended July 31, | |
| | | | | | | | |
| | | 2011 | | | 2010 | | | 2011 | | | 2010 | |
| | | | | |
| | | (in thousands) | | | (in thousands) | |
| | | | |
Net earnings attributable to Forest City Enterprises, Inc. | | $ | 8,134 | | | $ | 122,846 | | | $ | 55,701 | | | $ | 107,284 | |
Depreciation and amortization – Real Estate Groups(4) | | | 68,929 | | | | 69,789 | | | | 137,758 | | | | 139,743 | |
Amortization of mortgage procurement costs – Real Estate Groups(4) | | | 3,415 | | | | 3,633 | | | | 7,047 | | | | 6,695 | |
Deferred income tax expense(5) | | | 6,353 | | | | 59,775 | | | | 11,166 | | | | 44,399 | |
Remove non-Real Estate deferred taxes for 2010 only(5) | | | – | | | | (11,790) | | | | – | | | | (6,657) | |
| | | | |
Current income tax expense on non-operating earnings:(5) | | | | | | | | | | | | | | | | |
Gain on disposition of rental properties and partial interest in rental properties | | | 8,865 | | | | 21,740 | | | | 39,169 | | | | 35,464 | |
Gain on disposition included in discontinued operations | | | 1,591 | | | | 115 | | | | 2,792 | | | | 115 | |
| | | | |
Straight-line rent adjustment(2) | | | 2,497 | | | | (4,542) | | | | 273 | | | | (7,580) | |
Preference payment(3) | | | 586 | | | | 586 | | | | 1,171 | | | | 1,171 | |
Impairment of consolidated real estate | | | 235 | | | | 1,100 | | | | 5,070 | | | | 1,100 | |
Impairment of unconsolidated real estate | | | – | | | | 2,282 | | | | – | | | | 15,181 | |
Gain on disposition of rental properties and partial interest in rental properties | | | – | | | | (204,269) | | | | (9,561 | ) | | | (205,135) | |
Gain on disposition of unconsolidated entities | | | – | | | | 878 | | | | (12,567 | ) | | | 830 | |
Discontinued operations:(1) | | | | | | | | | | | | | | | | |
Gain on disposition of rental properties | | | (111,264 | ) | | | (6,204) | | | | (121,695 | ) | | | (6,204) | |
Impairment of real estate | | | – | | | | 45,410 | | | | – | | | | 45,410 | |
Noncontrolling interest - Gain on disposition | | | 81,365 | | | | 4,211 | | | | 81,758 | | | | 4,211 | |
| | | | | | | | |
| | | | |
Earnings Before Depreciation, Amortization and Deferred Taxes (EBDT) | | $ | 70,706 | | | $ | 105,560 | | | $ | 198,082 | | | $ | 176,027 | |
| | | | | | | | |
| | | | | | | | | | | | | | | | |
| | | | | |
EBDT Per Share | | | | | | | | | | | | | | | | |
Numerator(in thousands): | | | | | | | | | | | | | | | | |
EBDT | | $ | 70,706 | | | $ | 105,560 | | | $ | 198,082 | | | $ | 176,027 | |
If-Converted Method (Pro forma numerator
adjustment for interest, net of tax): | | | | | | | | | | | | | | | | |
3.625% Puttable Senior Notes due 2014 | | | 1,110 | | | | 1,110 | | | | 2,219 | | | | 2,219 | |
5% Convertile Senior Notes due 2016 | | | 413 | | | | 1,530 | | | | 1,102 | | | | 3,061 | |
4.25% Convertible Senior Notes due 2018 | | | 329 | | | | – | | | | 329 | | | | – | |
| | | | | | | | |
EBDT for per share data | | $ | 72,558 | | | $ | 108,200 | | | $ | 201,732 | | | $ | 181,307 | |
| | | | | | | | |
| | | | |
Denominator | | | | | | | | | | | | | | | | |
Weighted average shares outstanding – Basic | | | 168,788,754 | | | | 155,456,575 | | | | 167,171,093 | | | | 155,405,179 | |
Effect of stock options and restricted stock | | | 1,019,210 | | | | 442,299 | | | | 1,036,656 | | | | 468,164 | |
Effect of convertible preferred stock | | | 14,550,257 | | | | 14,550,257 | | | | 14,550,257 | | | | 11,656,283 | |
Effect of convertible debt | | | 19,912,982 | | | | 28,133,038 | | | | 20,066,506 | | | | 28,133,038 | |
Effect of convertible Class A Common Units | | | 3,646,755 | | | | 3,646,755 | | | | 3,646,755 | | | | 3,646,755 | |
| | | | | | | | |
Weighted average shares outstanding – Diluted | | | 207,917,958 | | | | 202,228,924 | | | | 206,471,267 | | | | 199,309,419 | |
| | | | | | | | |
| | | | |
EBDT Per Share | | $ | 0.35 | | | $ | 0.54 | | | $ | 0.98 | | | $ | 0.91 | |
| | | | | | | | | | | | | | | | | | | | | | |
| EBDT Per Share | | | | | | | | | | | | | | | | | |
| Quarterly Historical Trends | | | | Three Months Ended | |
| | | | | July 31, 2011 | | | April 30, 2011 | | | January 31, 2011 | | | October 31, 2010 | | | July 31, 2010 | |
Numerator(in thousands): | | | | | | | | | | | | | | | | | | | | | | |
EBDT | | | | $ | 70,706 | | | $ | 127,376 | | | $ | 43,149 | | | $ | 90,699 | | | $ | 105,560 | |
If-Converted Method (Pro forma numerator
adjustment for interest, net of tax): | | | | | | | | | | | | | | | | | | | | | | |
3.625% Puttable Senior Notes due 2014 | | | | | 1,110 | | | | 1,110 | | | | 1,110 | | | | 1,110 | | | | 1,110 | |
5% Convertible Senior Notes due 2016 | | | | | 413 | | | | 688 | | | | 1,521 | | | | 1,530 | | | | 1,530 | |
4.25% Convertible Senior Notes due 2018 | | | | | 329 | | | | – | | | | – | | | | – | | | | – | |
EBDT for per share data | | | | $ | 72,558 | | | $ | 129,174 | | | $ | 45,780 | | | $ | 93,339 | | | $ | 108,200 | |
| | | | | | |
Denominator | | | | | | | | | | | | | | | | | | | | | | |
Weighted average shares outstanding – Basic | | | | | 168,788,754 | | | | 165,498,904 | | | | 155,643,554 | | | | 155,484,451 | | | | 155,456,575 | |
Effect of stock options and restricted stock | | | | | 1,019,210 | | | | 1,054,102 | | | | 803,779 | | | | 462,812 | | | | 442,299 | |
Effect of convertible preferred stock | | | | | 14,550,257 | | | | 14,550,257 | | | | 14,550,257 | | | | 14,550,257 | | | | 14,550,257 | |
Effect of convertible debt | | | | | 19,912,982 | | | | 20,225,204 | | | | 28,047,083 | | | | 28,133,038 | | | | 28,133,038 | |
Effect of convertible Class A Common Units | | | | | 3,646,755 | | | | 3,646,755 | | | | 3,646,755 | | | | 3,646,755 | | | | 3,646,755 | |
Weighted average shares outstanding – Diluted | | | | | 207,917,958 | | | | 204,975,222 | | | | 202,691,428 | | | | 202,277,313 | | | | 202,228,924 | |
| | | | | | |
EBDT Per Share | | | | $ | 0.35 | | | $ | 0.63 | | | $ | 0.23 | | | $ | 0.46 | | | $ | 0.54 | |
26
Forest City Enterprises, Inc. and Subsidiaries
Supplemental Operating Information
| (1) | All earnings of properties which have been sold or are held for sale are reported as discontinued operations assuming no significant continuing involvement. |
| (2) | The Company recognizes minimum rents on a straight-line basis over the term of the related lease pursuant to accounting for leases. The straight-line rent adjustment is recorded as an increase or decrease to revenue or operating expense from Forest City Rental Properties Corporation, a wholly-owned subsidiary of Forest City Enterprises, Inc., with the applicable offset to either accounts receivable or accounts payable, as appropriate. |
| (3) | The preference payment represents the respective period’s share of the annual preferred payment in connection with the issuance of Class A Common Units in exchange for Bruce C. Ratner’s noncontrolling interest in the Forest City Ratner Companies portfolio. |
| (4) | The following table provides detail of depreciation and amortization and amortization of mortgage procurement costs presented in thousands. |
| | | | | | | | | | | | | | | | | | | | | | | | | | | | | | | | | | |
| | | Depreciation and Amortization | | | | | Amortization of Mortgage Procurement Costs | |
| | | | | | | |
| | | Three Months Ended July 31, | | | Six Months Ended July 31, | | | | | Three Months Ended July 31, | | | Six Months Ended July 31, | |
| | | | | | | |
| | | 2011 | | | 2010 | | | 2011 | | | 2010 | | | | | 2011 | | | 2010 | | | 2011 | | | 2010 | |
| | | | | | | |
| | | | | | | | | |
Full Consolidation | | $ | 54,538 | | | $ | 58,040 | | | $ | 111,245 | | | $ | 117,366 | | | | | $ | 2,727 | | | $ | 2,721 | | | $ | 5,622 | | | $ | 5,333 | |
Non-Real Estate | | | (686) | | | | (1,185) | | | | (1,388) | | | | (2,753) | | | | | | – | | | | – | | | | – | | | | – | |
| | | | | | | |
Real Estate Groups Full Consolidation | | | 53,852 | | | | 56,855 | | | | 109,857 | | | | 114,613 | | | | | | 2,727 | | | | 2,721 | | | | 5,622 | | | | 5,333 | |
Real Estate Groups related to noncontrolling interest | | | (1,171) | | | | (1,906) | | | | (2,829) | | | | (3,281) | | | | | | (130) | | | | (112) | | | | (260) | | | | (201) | |
Real Estate Groups Unconsolidated | | | 16,010 | | | | 12,267 | | | | 29,700 | | | | 23,635 | | | | | | 734 | | | | 598 | | | | 1,352 | | | | 1,082 | |
Real Estate Groups Discontinued Operations | | | 238 | | | | 2,573 | | | | 1,030 | | | | 4,776 | | | | | | 84 | | | | 426 | | | | 333 | | | | 481 | |
| | | | | | | |
Real Estate Groups Pro-Rata Consolidation | | $ | 68,929 | | | $ | 69,789 | | | $ | 137,758 | | | $ | 139,743 | | | | | $ | 3,415 | | | $ | 3,633 | | | $ | 7,047 | | | $ | 6,695 | |
| | | | | | | |
| (5) | The following table provides detail of Income Tax Expense (Benefit): |
| | | | | | | | | | | | | | | | |
| | | | | | | | |
| | | Three Months Ended July 31, | | | Six Months Ended July 31, | |
| | | 2011 | | | 2010 | | | 2011 | | | 2010 | |
| | | | | | | | |
| | | (in thousands) | | | (in thousands) | |
| | | | |
Current taxes | | | | | | | | | | | | | | | | |
Operating earnings | | $ | (10,544) | | | $ | (16,262) | | | $ | (24,035) | | | $ | (23,894) | |
Gain on disposition of rental properties and partial interest in rental properties | | | 8,865 | | | | 21,740 | | | | 39,169 | | | | 35,464 | |
| | | | | | | | |
Subtotal | | | (1,679) | | | | 5,478 | | | | 15,134 | | | | 11,570 | |
| | | | | | | | |
| | | | |
Discontinued operations | | | | | | | | | | | | | | | | |
Operating earnings | | | (48) | | | | (668) | | | | 149 | | | | (11) | |
Gain on disposition of rental properties and partial interest in rental properties | | | 1,591 | | | | 115 | | | | 2,792 | | | | 115 | |
| | | | | | | | |
Subtotal | | | 1,543 | | | | (553) | | | | 2,941 | | | | 104 | |
| | | | | | | | |
| | | | |
Total Current taxes | | | (136) | | | | 4,925 | | | | 18,075 | | | | 11,674 | |
| | | | | | | | |
| | | | |
Deferred taxes | | | | | | | | | | | | | | | | |
Continuing operations | | | (4,492) | | | | 76,088 | | | | (3,392) | | | | 60,626 | |
Discontinued operations | | | 10,845 | | | | (16,313) | | | | 14,558 | | | | (16,227) | |
| | | | | | | | |
| | | | |
Total Deferred taxes | | | 6,353 | | | | 59,775 | | | | 11,166 | | | | 44,399 | |
| | | | | | | | |
| | | | |
Grand Total | | $ | 6,217 | | | $ | 64,700 | | | $ | 29,241 | | | $ | 56,073 | |
| | | | | | | | |
| | | | |
2010 Recap of Grand Total: | | | | | | | | | | | | | | | | |
Real Estate Groups | | | | | | | | | | | | | | | | |
Current | | | | | | $ | 11,537 | | | | | | | $ | 20,056 | |
Deferred | | | | | | | 47,985 | | | | | | | | 37,742 | |
| | | | | | | | | | | | | | | | |
| | | | | | | 59,522 | | | | | | | | 57,798 | |
| | | | | | | | | | | | | | | | |
| | | | |
Non-Real Estate Groups | | | | | | | | | | | | | | | | |
Current | | | | | | | (6,612) | | | | | | | | (8,382) | |
Deferred | | | | | | | 11,790 | | | | | | | | 6,657 | |
| | | | | | | | | | | | | | | | |
| | | | | | | 5,178 | | | | | | | | (1,725) | |
| | | | | | | | | | | | | | | | |
| | | | |
Grand Total | | | | | | $ | 64,700 | | | | | | | $ | 56,073 | |
| | | | | | | | | | | | | | | | |
27
Forest City Enterprises, Inc. and Subsidiaries
Supplemental Operating Information
Retail Lease Expirations as of July 31, 2011
| | | | | | | | | | | | | | | | | | | | | | | | |
EXPIRATION YEAR | | NUMBER OF EXPIRING LEASES | | | SQUARE FEET OF EXPIRING LEASES(3) | | | PERCENTAGE OF TOTAL LEASED GLA (1) | | | NET BASE RENT EXPIRING(2) | | | PERCENTAGE OF TOTAL BASE RENT | | | AVERAGE BASE RENT PER SQUARE FEET EXPIRING(3) | |
| | | | | | |
| 2011 | | | 250 | | | | 778,326 | | | | 6.11 % | | | $ | 18,207,261 | | | | 7.21 % | | | $ | 30.45 | |
| 2012 | | | 271 | | | | 950,123 | | | | 7.46 | | | | 19,349,688 | | | | 7.66 | | | | 27.94 | |
| 2013 | | | 308 | | | | 1,128,314 | | | | 8.86 | | | | 24,321,749 | | | | 9.63 | | | | 27.20 | |
| 2014 | | | 258 | | | | 1,107,037 | | | | 8.69 | | | | 20,677,933 | | | | 8.19 | | | | 27.39 | |
| 2015 | | | 203 | | | | 832,758 | | | | 6.54 | | | | 18,533,723 | | | | 7.34 | | | | 29.29 | |
| 2016 | | | 232 | | | | 1,319,394 | | | | 10.36 | | | | 29,226,406 | | | | 11.57 | | | | 36.39 | |
| 2017 | | | 151 | | | | 1,003,259 | | | | 7.88 | | | | 20,836,073 | | | | 8.25 | | | | 26.58 | |
| 2018 | | | 151 | | | | 705,639 | | | | 5.54 | | | | 17,756,176 | | | | 7.03 | | | | 26.89 | |
| 2019 | | | 118 | | | | 1,043,200 | | | | 8.19 | | | | 19,780,065 | | | | 7.83 | | | | 24.83 | |
| 2020 | | | 115 | | | | 903,266 | | | | 7.09 | | | | 17,404,950 | | | | 6.89 | | | | 29.21 | |
| 2021 | | | 60 | | | | 869,916 | | | | 6.83 | | | | 15,658,405 | | | | 6.20 | | | | 29.95 | |
| Thereafter | | | 68 | | | | 2,097,653 | | | | 16.45 | | | | 30,766,321 | | | | 12.20 | | | | 20.60 | |
| | | | | | | | |
| Total | | | 2,185 | | | | 12,738,885 | | | | 100.00 % | | | $ | 252,518,750 | | | | 100.00 % | | | $ | 27.54 | |
| | | | | | | | |
| (1) | GLA = Gross Leasable Area. |
| (2) | Net base rent expiring is an operating statistic and is not comparable to rental revenue, a GAAP financial measure. The primary differences arise because net base rent is determined using the tenant’s contractual rental agreements at our ownership share of the base rental income from expiring leases as determined within the rent agreement and it does not include adjustments such as the impact of straight-line rent, amortization of above and below market lease values in-place, and contingent rental payments (which are not reasonably estimable). |
| (3) | Square feet of expiring leases and average base rent per square feet are operating statistics that represent 100% of the square footage and base rental income per square foot from expiring leases. |
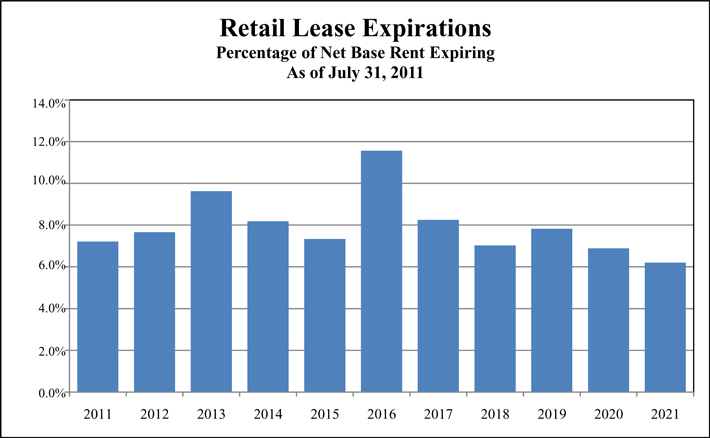
28
Forest City Enterprises, Inc. and Subsidiaries
Supplemental Operating Information
Office Lease Expirations as of July 31, 2011
| | | | | | | | | | | | | | | | | | | | | | | | |
EXPIRATION YEAR | | NUMBER OF EXPIRING LEASES | | | SQUARE FEET OF EXPIRING LEASES(3) | | | PERCENTAGE OF TOTAL LEASED GLA (1) | | | NET BASE RENT EXPIRING(2) | | | PERCENTAGE OF TOTAL BASE RENT | | | AVERAGE BASE RENT PER SQUARE FEET EXPIRING(3) | |
| | | | | | |
2011 | | | 53 | | | | 363,105 | | | | 3.27 % | | | $ | 6,853,161 | | | | 2.33 % | | | $ | 19.93 | |
2012 | | | 92 | | | | 989,473 | | | | 8.91 | | | | 25,054,936 | | | | 8.50 | | | | 31.42 | |
2013 | | | 92 | | | | 1,162,933 | | | | 10.48 | | | | 24,912,299 | | | | 8.46 | | | | 22.29 | |
2014 | | | 63 | | | | 968,391 | | | | 8.72 | | | | 18,067,606 | | | | 6.13 | | | | 30.44 | |
2015 | | | 44 | | | | 480,655 | | | | 4.33 | | | | 8,882,161 | | | | 3.02 | | | | 21.28 | |
2016 | | | 48 | | | | 766,037 | | | | 6.90 | | | | 16,894,263 | | | | 5.73 | | | | 28.73 | |
2017 | | | 25 | | | | 434,214 | | | | 3.91 | | | | 10,593,990 | | | | 3.60 | | | | 25.87 | |
2018 | | | 21 | | | | 1,209,820 | | | | 10.90 | | | | 33,822,613 | | | | 11.48 | | | | 32.40 | |
2019 | | | 20 | | | | 808,811 | | | | 7.29 | | | | 14,347,186 | | | | 4.87 | | | | 25.61 | |
2020 | | | 14 | | | | 1,046,733 | | | | 9.43 | | | | 27,813,919 | | | | 9.44 | | | | 32.92 | |
2021 | | | 8 | | | | 374,921 | | | | 3.38 | | | | 6,690,469 | | | | 2.27 | | | | 18.28 | |
Thereafter | | | 31 | | | | 2,494,488 | | | | 22.48 | | | | 100,665,993 | | | | 34.17 | | | | 42.02 | |
| | | | | | | | |
Total | | | 511 | | | | 11,099,581 | | | | 100.00 % | | | $ | 294,598,596 | | | | 100.00 % | | | $ | 30.92 | |
| | | | | | | | |
| (1) | GLA = Gross Leasable Area. |
| (2) | Net base rent expiring is an operating statistic and is not comparable to rental revenue, a GAAP financial measure. The primary differences arise because net base rent is determined using the tenant’s contractual rental agreements at our ownership share of the base rental income from expiring leases as determined within the rent agreement and it does not include adjustments such as the impact of straight-line rent, amortization of above and below market lease values in-place, and contingent rental payments (which are not reasonably estimable). |
| (3) | Square feet of expiring leases and average base rent per square feet are operating statistics that represent 100% of the square footage and base rental income per square foot from expiring leases. |
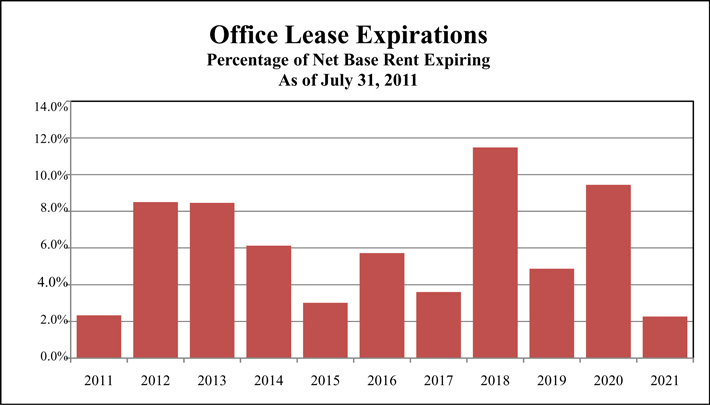
29
Forest City Enterprises, Inc. and Subsidiaries
Supplemental Operating Information
Schedule of Significant Retail Tenants as of July 31, 2011
| | | | | | | | | | | | |
(Based on net base rent 1% or greater of the Company’s ownership share) | |
TENANT | | NUMBER OF LEASES | | | LEASED SQUARE FEET | | | PERCENTAGE OF TOTAL RETAIL SQUARE FEET | |
| | | |
Bass Pro Shops, Inc. | | | 3 | | | | 510,855 | | | | 4.01 % | |
| | | |
Regal Entertainment Group | | | 5 | | | | 381,461 | | | | 2.99 | |
| | | |
AMC Entertainment, Inc. | | | 5 | | | | 377,797 | | | | 2.97 | |
| | | |
TJX Companies | | | 11 | | | | 347,457 | | | | 2.73 | |
| | | |
The Gap | | | 26 | | | | 336,900 | | | | 2.64 | |
| | | |
Dick’s Sporting Goods | | | 6 | | | | 293,171 | | | | 2.30 | |
| | | |
The Limited | | | 37 | | | | 220,357 | | | | 1.73 | |
| | | |
Best Buy | | | 6 | | | | 207,969 | | | | 1.63 | |
| | | |
Abercrombie & Fitch Stores, Inc. | | | 27 | | | | 194,549 | | | | 1.53 | |
| | | |
Footlocker, Inc. | | | 33 | | | | 125,098 | | | | 0.98 | |
| | | |
Forever 21, Inc. | | | 9 | | | | 103,368 | | | | 0.81 | |
| | | |
American Eagle Outfitters, Inc. | | | 16 | | | | 91,343 | | | | 0.72 | |
| | | | |
| | | |
Subtotal | | | 184 | | | | 3,190,325 | | | | 25.04 | |
| | | | |
| | | |
All Others | | | 2,001 | | | | 9,548,560 | | | | 74.96 | |
| | | | |
| | | |
Total | | | 2,185 | | | | 12,738,885 | | | | 100.00 % | |
| | | | |
30
Forest City Enterprises, Inc. and Subsidiaries
Supplemental Operating Information
Schedule of Significant Office Tenants as of July 31, 2011
(Based on net base rent 2% or greater of the Company’s ownership share)
| | | | | | | | | | |
| TENANT | | LEASED
SQUARE
FEET | | | PERCENTAGE OF TOTAL OFFICE SQUARE FEET |
| | | |
City of New York | | | 1,044,167 | | | | 9.41 % | | | |
| | | |
Millennium Pharmaceuticals, Inc. | | | 660,741 | | | | 5.95 | | | |
| | | |
U.S. Government | | | 647,983 | | | | 5.84 | | | |
| | | |
WellPoint, Inc. | | | 392,514 | | | | 3.54 | | | |
| | | |
JP Morgan Chase & Co. | | | 383,341 | | | | 3.45 | | | |
| | | |
Morgan Stanley & Co. | | | 377,304 | | | | 3.40 | | | |
| | | |
Forest City Enterprises, Inc.(1) | | | 356,187 | | | | 3.21 | | | |
| | | |
Bank of New York | | | 323,043 | | | | 2.91 | | | |
| | | |
National Grid | | | 254,034 | | | | 2.29 | | | |
| | | |
Clearbridge Advisors, LLC, a Legg Mason Company | | | 193,249 | | | | 1.74 | | | |
| | | |
Covington & Burling, LLP | | | 160,565 | | | | 1.45 | | | |
| | | |
Seyfarth Shaw, LLP | | | 96,909 | | | | 0.87 | | | |
| | | |
| | | |
Subtotal | | | 4,890,037 | | | | 44.06 | | | |
| | | |
| | | |
All Others | | | 6,209,544 | | | | 55.94 | | | |
| | | |
| | | |
Total | | | 11,099,581 | | | | 100.00 % | | | |
| | | |
(1) All intercompany rental income is eliminated in consolidation.
31
Forest City Enterprises, Inc. and Subsidiaries
Supplemental Operating Information
Openings and Acquisitions
as of July 31, 2011
| | | | | | | | | | | | | | | | | | | | | | | | | | | | | | | | | | |
| Property | | Location | | Dev (D)
Acq (A) | | Date Opened /
Acquired | | FCE Legal
Ownership % (a) | | Pro-Rata
FCE % (a)
(1) | | Cost at Full
Consolidation
(GAAP) (b) | | | Total Cost
at 100%
(2) | | | Cost at FCE
Pro-Rata Share
(Non-GAAP) (c) (1) X (2) | | | Sq. ft./ No. of Units | | | Gross
Leasable
Area | | | Lease
Commitment % | |
| 2011 (2) | | | | | | | | | | | | (in millions) | | | | | | | | | | |
| | | | | | | | | | | | | | | | | | | | | | | | |
| | | | | | | | | | | |
Retail Centers: | | | | | | | | | | | | | | | | | | | | | | | | | | | | | | | | | | |
Westchester’s Ridge Hill (d) | | Yonkers, NY | | D | | Q2-11/12 | | 70.0% | | 100.0% | | $ | 0.0 | | | $ | 0.0 | | | $ | 0.0 | | | | 176,000 | | | | 176,000 | | | | | |
| | | | | | | | | | | | | | | | | | | | | | | | | | |
| | | | | | | | | | | |
Residential: | | | | | | | | | | | | | | | | | | | | | | | | | | | | | | | | | | |
8 Spruce Street (leasable units only) (d) (f) | | Manhattan, NY | | D | | Q1-11/12 | | 35.7% | | 51.0% | | $ | 0.0 | | | $ | 0.0 | | | $ | 0.0 | | | | 682 | | | | | | | | | |
| | | | | | | | | | | | | | | | | | | | | | | | | | |
| | | | | | | | | | | |
| | | | | | | | | | | | | | | | | | | | | | | | | | | | | | | | | | | |
| | | | | | | | | | | |
Prior Two Years Openings (7) | | | | | | | | | | | | | | | | | | | | | | | | | | | | | | | | | | |
Retail Centers: | | | | | | | | | | | | | | | | | | | | | | | | | | | | | | | | | | |
Village at Gulfstream Park (f) | | Hallandale Beach, FL | | D | | Q1-10 | | 50.0% | | 50.0% | | $ | 0.0 | | | $ | 198.9 | | | $ | 99.5 | | | | 511,000 | | | | 511,000 | | | | 70% | |
East River Plaza (f) | | Manhattan, NY | | D | | Q4-09/Q2-10 | | 35.0% | | 50.0% | | | 0.0 | | | | 390.6 | | | | 195.3 | | | | 527,000 | | | | 527,000 | | | | 90% | |
Promenade in Temecula Expansion | | Temecula, CA | | D | | Q1-09 | | 75.0% | | 100.0% | | | 113.4 | | | | 113.4 | | | | 113.4 | | | | 127,000 | | | | 127,000 | | | | 89% | |
| | | | | | | | | | | | | | | | | | | | | | |
| | | | | | | | | | | | $ | 113.4 | | | $ | 702.9 | | | $ | 408.2 | | | | 1,165,000 | | | | 1,165,000 | | | | | |
| | | | | | | | | | | | | | | | | | | | | | | | | | |
| | | | | | | | | | | |
Office: | | | | | | | | | | | | | | | | | | | | | | | | | | | | | | | | | | |
Waterfront Station | | | | | | | | | | | | | | | | | | | | | | | | | | | | | | | | | | |
– East 4th & West 4th Buildings (g) | | Washington, D.C. | | D | | Q1-10 | | 45.0% | | 45.0% | | $ | 245.9 | | | $ | 245.9 | | | $ | 110.7 | | | | 631,000 | | | | | | | | 99% | |
| | | | | | | | | | | | | | | | | | | | | | | | | | |
| | | | | | | | | | | |
Residential : (h) | | | | | | | | | | | | | | | | | | | | | | | | | | | | | | | | | | |
Presidio Landmark | | San Francisco, CA | | D | | Q3-10 | | 100.0% | | 100.0% | | $ | 96.5 | | | $ | 96.5 | | | $ | 96.5 | | | | 161 | | | | | | | | 70% (r) | |
North Church Towers | | Parma Heights, OH | | A | | Q3-09 | | 100.0% | | 100.0% | | | 5.1 | | | | 5.1 | | | | 5.1 | | | | 399 | | | | | | | | 86% | |
DKLB BKLN (f) | | Brooklyn, NY | | D | | Q4-09/Q2-10 | | 40.8% | | 51.0% | | | 0.0 | | | | 161.8 | | | | 82.5 | | | | 365 | | | | | | | | 96% | |
| | | | | | | | | | | | | | | | | | | | | | |
| | | | | | | | | | | | $ | 101.6 | | | $ | 263.4 | | | $ | 184.1 | | | | 925 | | | | | | | | | |
| | | | | | | | | | | | | | | | | | | | | | | | | | |
| | | | | | | | | | | |
Total Prior Two Years Openings (i) | | | | | | | | | | | | $ | 460.9 | | | $ | 1,212.2 | | | $ | 703.0 | | | | | | | | | | | | | |
| | | | | | | | | | | | | | | | | | | | | | | | | | |
| | | | | | | | | | | |
Recap of Total Prior Two Years Openings | | | | | | | | | | | | | | | | | | | | | | | | | | | | | | | | | | |
Total 2010 | | | | | | | | | | | | $ | 342.4 | | | $ | 931.9 | | | $ | 502.0 | | | | | | | | | | | | | |
Total 2009 | | | | | | | | | | | | | 118.5 | | | | 280.3 | | | | 201.0 | | | | | | | | | | | | | |
| | | | | | | | | | | | | | | | | | | | | | | | | | |
Total Prior Two Years Openings (i) | | | | | | | | | | | | $ | 460.9 | | | $ | 1,212.2 | | | $ | 703.0 | | | | | | | | | | | | | |
| | | | | | | | | | | | | | | | | | | | | | | | | | |
See footnotes on page 33-34.
32
Forest City Enterprises, Inc. and Subsidiaries
Supplemental Operating Information
Projects Under Construction (4)
as of July 31, 2011
| | | | | | | | | | | | | | | | | | | | | | | | | | | | | | | | | | | | | | |
| Property | | Location | | Anticipated Opening | | FCE Legal
Ownership % (a) | | | | | Pro-Rata
FCE % (a)
(1) | | | Cost at Full
Consolidation
(GAAP) (b) | | | Total Cost
at 100%
(2) | | | Cost at FCE
Pro-Rata Share
(Non-GAAP) (c)
(1) X (2) | | | Sq. ft./
No. of
Units | | | Gross
Leasable
Area | | | Lease
Commitment % | |
| | | | | | | | | | | | | | | (in millions) | | | | | | | | | | |
| | | | | | | | | | | | | | | | | | | | | | | | | | | | | | |
| | | | | | | | | | | |
Retail Centers: | | | | | | | | | | | | | | | | | | | | | | | | | | | | | | | | | | | | | | |
Westchester’s Ridge Hill (e) | | Yonkers, NY | | Q2-11/12 | | | 70.0% | | | | | | 100.0% | | | $ | 842.4 | | | $ | 842.4 | | | $ | 842.4 | | | | 1,336,000 | | | | 1,336,000 | (l) | | | 52% | |
| | | | | | | | | | | | | | | | | | | | | | | | | | | | | | |
| | | | | | | | | | | |
Residential: | | | | | | | | | | | | | | | | | | | | | | | | | | | | | | | | | | | | | | |
8 Spruce Street (f) (j) | | Manhattan, NY | | Q1-11/12 | | | 35.7% | | | | | | 51.0% | | | $ | 0.0 | | | $ | 875.7 | | | $ | 446.6 | | | | 903 | | | | | | | | 51% (m) | |
Foundry Lofts | | Washington, D.C. | | Q3-11 | | | 100.0% | | | | | | 100.0% | | | | 61.4 | | | | 61.4 | | | | 61.4 | | | | 170 | | | | | | | | | |
| | | | | | | | | | | | | | | | | | | | | | | | | | | | | | |
| | | | | | | | | | | | | | | | $ | 61.4 | | | $ | 937.1 | | | $ | 508.0 | | | | 1,073 | | | | | | | | | |
| | | | | | | | | | | | | | | | | | | | | | | | | | | | | | |
| | | | | | | | | | | |
Arena: | | | | | | | | | | | | | | | | | | | | | | | | | | | | | | | | | | | | | | |
Barclays Center | | Brooklyn, NY | | Q3-12 | | | 33.8% (n) | | | | | | 33.8% (n) | | | $ | 904.3 | | | $ | 904.3 | | | $ | 305.9 | | | | 670,000 | | | | 18,000 seats | (o) | | | 56% (p) | |
| | | | | | | | | | | | | | | | | | | | | | | | | | | | | | |
| | | | | | | | | | | |
Total Under Construction (k) | | | | | | | | | | | | | | | | $ | 1,808.1 | | | $ | 2,683.8 | | | $ | 1,656.3 | | | | | | | | | | | | | |
| | | | | | | | | | | | | | | | | | | | | | | | | | | | | | |
Fee Development: | | | | | | | | | | | | | | | | | | | | | | | | | | | | | Sq. ft. | | | | | | | | | |
| | | | | | | | | | | | | | | | | | | | | | | | | | | | | | | | | | | | | | | |
Las Vegas City Hall | | Las Vegas, NV | | Q1-12 | | | – (q) | | | | | | – (q) | | | $ | 0.0 | | | $ | 146.2 | | | $ | 0.0 | | | | 270,000 | | | | | | | | | |
| | | | | | | | | | | | | | | | | | | | | | | | | | | |
| | | | | | | | | | | | |
Projects Under Construction (2) Subsequent to July 31, 2011 | | | | | | | | | | | | | | | | | | | | | | | | | | | | | | | | | | | | | | |
| | | | | | | | | | | |
Retail Centers: | | | | | | | | | | | | | | | | | | | | | | | | | | | | | | | | | | | | | | |
The Yards – Boilermaker Shop | | Washington, D.C. | | Q3-12 | | | 100.0% | | | | | | 100.0% | | | $ | 19.4 | | | $ | 19.4 | | | $ | 19.4 | | | | 41,000 | | | | 41,000 | | | | 73% (r) | |
| | | | | | | | | | | | | | | | | | | | | | | | | | | | | | |
| | | | | | | | | | | |
Residential: | | | | | | | | | | | | | | | | | | | | | | | | | | | | | | | | | | | | | | |
Novella Apartments | | Denver, CO | | Q3-12 | | | 90.0% | | | | | | 90.0% | | | $ | 10.1 | | | $ | 10.1 | | | $ | 9.1 | | | | 85 | | | | | | | | | |
| | | | | | | | | | | | | | | | | | | | | | | | | | | | | | |
| | | | | | | | | | |
Total Projects Under Construction Subsequent to July 31, 2011 | | | | | | | | | | | | | | $ | 29.5 | | | $ | 29.5 | | | $ | 28.5 | | | | | | | | | | | | | |
| | | | | | | | | | | | | | | | | | | | | | | | | | | | | | |
FOOTNOTES
| | (a) | As is customary within the real estate industry, the Company invests in certain real estate projects through joint ventures. For some of these projects, the Company provides funding at percentages that differ from the Company’s legal ownership. |
| | (b) | Amounts are presented on the full consolidation method of accounting, a GAAP measure. Under full consolidation, costs are reported as consolidated at 100 percent if we are deemed to have control or to be the primary beneficiary of our investments in the variable interest entity (“VIE”). |
| | (c) | Cost at pro-rata share represents Forest City’s share of cost, based on the Company’s pro-rata ownership of each property (a non-GAAP measure). Under the pro-rata consolidation method of accounting the Company determines its pro-rata share by multiplying its pro-rata ownership by the total cost of the applicable property. |
| | (d) | See the Under Construction pipeline for cost details of the total property. |
| | (e) | Phased-in opening includes the total cost and square footage of the center, including Cinema De Lux, REI and WESTMED which opened in the second quarter. |
| | (f) | Reported under the equity method of accounting. This method represents a GAAP measure for investments in which the Company is not deemed to have control or to be the primary beneficiary of our investments in a VIE. |
| | (g) | Property was sold on May 10, 2011 and was 99% leased at time of sale. |
33
Forest City Enterprises, Inc. and Subsidiaries
Supplemental Operating Information
FOOTNOTES (continued)
| | (h) | The lease percentage represents occupancy as of July 31, 2011. |
| | (i) | The difference between the full consolidation cost amount (GAAP) of $460.9 million to the Company’s pro-rata share (a non-GAAP measure) of $703.0 million consists of a reduction to full consolidation for noncontrolling interest of $135.2 million of cost and the addition of its share of cost for unconsolidated investments of $377.3 million. |
| | (j) | Phased in opening. Costs are representative of the total project cost, including 682 units opened as of August 30, 2011. |
| | (k) | The difference between the full consolidation cost amount (GAAP) of $1,808.1 million to the Company’s pro-rata share (a non-GAAP measure) of $1,656.3 million consists of a reduction to full consolidation for noncontrolling interest of $598.4 million of cost and the addition of its share of cost for unconsolidated investments of $446.6 million. |
| | (l) | Includes 156,000 square feet of office space. |
| | (m) | As of August 30, 2011, 457 leases have been signed since appointments with prospective residents began on February 18, 2011, representing 51% of the total 903 units after construction is complete. As of July 31, 2011, $246.5 million at pro-rata consolidation of costs incurred and $158.5 million at pro-rata consolidation of mortgage debt were transferred to completed rental properties on the Company’s balance sheet. |
| | (n) | On May 2, 2011, the Company closed on a purchase agreement with a minority interest partner. As a result, the Company’s legal and pro-rata ownership increased to approximately 34%. |
| | (o) | The Nets, a member of the NBA, has a 37 year license agreement to use the arena. |
| | (p) | Represents the percentage of forecasted contractually obligated arena income that is under contract. Contractually obligated income, which includes revenue from naming rights, sponsorships, suite licenses, Nets minimum rent and food concession agreements, accounts for 72% of total forecasted revenues for the arena. |
| | (q) | This is a fee development project, owned by the City of Las Vegas. Therefore, these costs are not included on the full consolidation or pro-rata balance sheet. |
| | (r) | Updated lease commitments as of September 6, 2011. |
Equity Requirements for Projects Under Construction(a)
as of July 31, 2011
| | | | | | | | | | | | | | | | | | | | | | | | |
| | | 100% | | | Less
Unconsolidated
Investments
at 100% | | | Full
Consolidation
(GAAP)(b) | | | Less
Noncontrolling
Interest | | | Plus
Unconsolidated
Investments
at Pro-Rata | | | Pro-Rata
Consolidation
(Non-GAAP) (c) | |
| | | | |
| | | (dollars in millions) | |
| | | | | | |
Total Cost Under Construction | | $ | 2,683.8 | | | $ | 875.7 | | | $ | 1,808.1 | | | $ | 598.4 | | | $ | 446.6 | | | $ | 1,656.3 | |
Total Loan Draws and Other Sources at Completion(d) | | | 1,668.2 | | | | 539.0 | | | | 1,129.2 | | | | 376.5 | | | | 263.1 | | | | 1,015.8 | |
| | | | |
Net Equity at Completion | | | 1,015.6 | | | | 336.7 | | | | 678.9 | | | | 221.9 | | | | 183.5 | | | | 640.5 | |
| | | | |
| | | | | | |
Net Costs Incurred to Date(e) | | | 1,870.4 | | | | 734.5 | | | | 1,135.9 | | | | 281.7 | | | | 382.8 | | | | 1,237.0 | |
Loan Draws and Other Sources to Date (e) | | | 935.3 | | | | 424.4 | | | | 510.9 | | | | 59.8 | | | | 225.8 | | | | 676.9 | |
| | | | |
Net Equity to Date(e) | | | 935.1 | | | | 310.1 | | | | 625.0 | | | | 221.9 | | | | 157.0 | | | | 560.1 | |
| | | | |
| | | | | | |
% of Total Equity | | | 92% | | | | | | | | 92% | | | | | | | | | | | | 87% | |
| | | | | | |
Remaining Costs | | | 813.4 | | | | 141.2 | | | | 672.2 | | | | 316.7 | | | | 63.8 | | | | 419.3 | |
Remaining Loan Draws and Other Sources | | | 732.9 | | | | 114.6 | | | | 618.3 | | | | 316.7 | | | | 37.3 | | | | 338.9 | |
| | | | |
Remaining Equity | | $ | 80.5 | | | $ | 26.6 | | | $ | 53.9 | | | $ | – | | | $ | 26.5 | | | $ | 80.4 | |
| | | | |
| | | | | | |
% of Total Equity | | | 8% | | | | | | | | 8% | | | | | | | | | | | | 13% | |
| | (a) | This schedule includes only the four properties listed on the previous page. This does not include costs associated with phased-in units, operating property renovations and military housing. |
| | (b) | Amounts are presented on the full consolidation method of accounting, a GAAP measure. Under full consolidation, costs are reported as consolidated at 100 percent if we are deemed to have control or to be the primary beneficiary of our investments in the variable interest entity (“VIE”). |
| | (c) | Cost at pro-rata share represents Forest City’s share of cost, based on the Company’s pro-rata ownership of each property (a non-GAAP measure). Under the pro-rata consolidation method of accounting the Company determines its pro-rata share by multiplying its pro-rata ownership by the total cost of the applicable property. |
| | (d) | “Other Sources” includes estimates of third party subsidies and tax credit proceeds. The timing and the amounts may differ from our estimates. |
| | (e) | Reflects activity through July 31, 2011. |
34
Forest City Enterprises, Inc. and Subsidiaries
Supplemental Operating Information
|
Projects Under Development as of July 31, 2011 Below is a summary of our active large scale development projects, which have yet to commence construction, often referred to as our “shadow pipeline” which are crucial to our long-term growth. While we cannot make any assurances on the timing or delivery of these projects, our track record speaks to our ability to bring large, complex, projects to fruition when there is demand and available construction financing. The projects listed below represent pro-rata costs of $738.1 million ($918.2 million at full consolidation) of Projects Under Development (“PUD”) on our balance sheet and pro-rata mortgage debt of $145.2 million ($184.7 million at full consolidation). 1) Atlantic Yards –Brooklyn, NY Atlantic Yards is adjacent to the state-of-the art arena, the Barclays Center, which is designed by the award-winning firms Ellerbe Becket and SHoP Architects and is currently under construction. In addition, Atlantic Yards will feature more than 6,400 units of housing, including over 2,200 affordable units, approximately 250,000 square feet of retail space, and more than 8 acres of landscaped open space. 2) LiveWork Las Vegas – Las Vegas, NV LiveWork Las Vegas is a mixed-use project on a 13.5-acre parcel in downtown Las Vegas. At full build-out, the project will have a new 260,000-square-foot City Hall for Las Vegas and is also expected to include up to 1 million square feet of office space and approximately 300,000 square feet of retail. The City Hall is owned by the city of Las Vegas and is a fee-development project. 3) The Yards – Washington, D.C. The Yards is a 42-acre mixed-use project, located in the neighborhood of the Washington Nationals baseball park in Southeast D.C. The full development is expected to include up to 2,700 residential units, 1.8 million square feet of office space, and 300,000 square feet of retail and dining space. The Yards features a 5.5-acre publicly funded public park that is a gathering place and recreational focus for the community. The first residential building, Foundry Lofts, which is under construction and expected to open in Q3-11. 4) The Science + Technology Park at Johns Hopkins –Baltimore, MD The 31-acre Science + Technology Park at Johns Hopkins is a new center for collaborative research directly adjacent to the world-renowned Johns Hopkins medical and research complex. Initial plans call for 1.1 million square feet in five buildings, with future phases that could support additional expansion. In 2008, the Company opened the first of those buildings, 855 North Wolfe Street, a 279,000-square-foot office building anchored by the Johns Hopkins School of Medicine’s Institute for Basic Biomedical Sciences. 5) Colorado Science + Technology Park at Fitzsimons – Aurora, CO The 184-acre Colorado Science + Technology Park at Fitzsimons is becoming a hub for the biotechnology industry in the Rocky Mountain region. Anchored by the University of Colorado at Denver Health Science Center, the University of Colorado Hospital and The Denver Children’s Hospital, the park will offer cost-effective lease rates; build-to-suit office and research sites; and flexible lab and office layouts in a cutting-edge research park. The park is also adjacent to Forest City’s 4,700-acre Stapleton mixed-used development. 6) Waterfront Station– Washington, D.C. Located in Southwest Washington, D.C., Waterfront Station is adjacent to the Waterfront/Southeastern University MetroRail station. Waterfront Station is expected to include 660,000 square feet of office space, an estimated 400 residential units and 40,000 square feet of stores and restaurants. 7) 300 Massachusetts Avenue – Cambridge, MA Located in the science and technology hub of Cambridge, MA, the 300 Massachusetts Avenue block represents an expansion of University Park @ MIT. In a 50/50 partnership with MIT, Forest City is presently focused on a project that reflects a development program of approximately 260,000 square feet of lab and office space. Potential redevelopment of the entire block is possible with the acquisition of adjacent parcels in future phases, and would result in an approximately 400,000 square foot project. |
35
Forest City Enterprises, Inc. and Subsidiaries
Supplemental Operating Information
Military Housing
as of July 31, 2011
Below is a summary of our equity method investments for Military Housing Development projects. The Company provides development, construction and management services for these projects and receives agreed upon fees for these services. The following phases still have a percentage of units opened and under construction:
| | | | | | | | | | | | | | | | | | |
| Property | | Location | | Anticipated
Opening | | FCE
Pro-Rata % | | Cost at Full
Consolidation | | | Total Cost
at 100% | | | No. of Units | |
| | | | | | | | | (in millions) | | | | |
| | | | | | | | | | | | | | |
| | | | | | |
Military Housing – Openings (2) | | | | | | | | | | | | | | | | | | |
| | | | | | |
Navy, Hawaii Increment III | | Honolulu, HI | | 2007-Q1-11 | | * | | $ | 0.0 | | | $ | 464.8 | | | | 2,520 | |
| | | | | | |
Marines, Hawaii Increment II | | Honolulu, HI | | 2007-Q2-11 | | * | | | 0.0 | | | | 292.7 | | | | 1,175 | |
| | | | | | | | | | |
Total Openings | | | | | | | | $ | 0.0 | | | $ | 757.5 | | | | 3,695 | |
| | | | | | |
Military Housing – Under Construction (5) | | | | | | | | | | | | | | | | | | |
| | | | | | |
Pacific Northwest Communities | | Seattle, WA | | 2007-2011 | | * | | $ | 0.0 | | | $ | 280.5 | | | | 2,985 | |
| | | | | | |
Navy Midwest | | Chicago, IL | | 2006-2012 | | * | | | 0.0 | | | | 200.3 | | | | 1,401 | |
| | | | | | |
Midwest Millington | | Memphis, TN | | 2008-2012 | | * | | | 0.0 | | | | 33.1 | | | | 318 | |
| | | | | | |
Air Force Academy | | Colorado Springs, CO | | 2007-2013 | | 50.0% | | | 0.0 | | | | 69.5 | | | | 427 | |
| | | | | | |
Hawaii Phase IV | | Kaneohe, HI | | 2007-2014 | | * | | | 0.0 | | | | 475.1 | | | | 1,141 | |
| | | | | | | | | | |
Total Under Construction | | | | | | | | $ | 0.0 | | | $ | 1,058.5 | | | | 6,272 | |
| | | | | | | | | | |
| | | | | | |
Total Military Housing | | | | | | | | $ | 0.0 | | | $ | 1,816.0 | | | | 9,967 | |
| | | | | | | | | | |
| * The Company’s share of residual cash flow ranges from 0-20% during the life cycle of the project. | |
Recent commitment not yet closed
Air Force – Southern Group was awarded on August 30, 2010. We are currently in exclusive negotiations with the Air Force. This project is expected to include 2,185 end state units at four Air Force bases in Sumter, SC, Manchester, TN, Charleston, SC and Biloxi, MS. There are 330 financially excluded units that will not be encumbered by debt and which may be removed from the end state at the sole discretion of the Air Force. The financial closing of the project is scheduled for October 1, 2011 and commencement of construction is expected to immediately follow.
Development fees related to our military housing projects are earned based on a contractual percentage of the actual development costs incurred. We also recognize additional development incentive fees upon successful completion of certain criteria, such as incentives to realize development cost savings, encourage small and local business participation, comply with specified safety standards and other project management incentives as specified in the development agreements. NOI from development and development incentive fees is $788,000 and $1,925,000 for the three and six months ended July 31, 2011, respectively, and $1,705,000 and $3,318,000 for the three and six months ended July 31, 2010, respectively.
Construction management fees are earned based on a contractual percentage of the actual construction costs incurred. We also recognize certain construction incentive fees based upon successful completion of certain criteria as set forth in the construction contracts. NOI from construction and incentive fees is $738,000 and $1,918,000 for the three and six months ended July 31, 2011, respectively, and $1,465,000 and $3,060,000 recognized during the three and six months ended July 31, 2010, respectively.
Property management and asset management fees are earned based on a contractual percentage of the annual net rental income and annual operating income, respectively, that is generated by the military housing privatization projects as defined in the agreements. We also recognize certain property management incentive fees based upon successful completion of certain criteria as set forth in the property management agreements. Property management, management incentive and asset management fees generated NOI of $2,418,000 and $5,647,000 during the three and six months ended July 31, 2011, respectively, and $3,120,000 and $6,242,000 during the three and six months ended July 31, 2010, respectively.
36
Forest City Enterprises, Inc. and Subsidiaries
Supplemental Operating Information
Land Held for Development or Sale
as of July 31, 2011
The Land Development Group acquires and sells raw land and sells fully-entitled developed lots to residential, commercial, and industrial customers. The Land Development Group also owns and develops raw land into master-planned communities, mixed-use projects and other residential developments. Below is a summary of our large Land Development Group projects.
| | | | | | | | | | | | | | |
| Location | | Gross Acres (1) | | | Saleable Acres (2) | | | Option Acres (3) | | | |
| | |
Stapleton – Denver, CO | | | 213 | | | | 141 | | | | 1,358 | | |
Mesa del Sol – Albuquerque, NM | | | 3,011 | | | | 1,647 | | | | 5,731 | | |
Central Station – Chicago, IL | | | 30 | | | | 30 | | | | – | | |
Texas | | | 2,798 | | | | 1,553 | | | | – | | |
North Carolina | | | 1,225 | | | | 1,001 | | | | 788 | | |
Ohio | | | 967 | | | | 652 | | | | 470 | | |
Arizona | | | 663 | | | | 489 | | | | – | | |
Other | | | 884 | | | | 698 | | | | – | | |
| | | | | |
Total | | | 9,791 | | | | 6,211 | | | | 8,347 | | |
| | | | | |
| | (1) | Represent all acres currently owned including those used for roadways, open spaces and parks. |
| | (2) | Saleable acres represent the total of all acres owned and available for sales. The Land Development Group may choose to further develop some of the acres into completed sublots prior to sale. |
| | (3) | Option acres are those acres that the Land Development Group has a formal option to acquire. Typically these options are in the form of purchase agreements with contingencies for the satisfaction of due diligence reviews. |
Stapleton – Denver, CO
Stapleton represents one of the nation’s largest urban redevelopments. At full build out of 4,700 acres or 7.5 square miles, Stapleton is planned for more than 12,000 homes and apartments, a projected 3 million square-feet of retail and 10 million square-feet of office/research and development/industrial space. Centrally located 10 minutes east of Downtown Denver and 20 minutes from Denver International Airport, Stapleton will be home to 30,000 residents and 35,000 workers when complete.
Mesa del Sol – Albuquerque, NM
Mesa del Sol is a 20-square mile, mixed-use community on the south mesa of Albuquerque, N.M., five minutes from the Albuquerque International Airport. Mesa del Sol’s master plan calls for mixed-use development that will include 1,400 acres for industrial/commercial and office development use, 4,400 acres for residential and supporting retail use, 3,200 acres for open space and parks and 800 acres for schools and universities.
Central Station – Chicago, IL
Located adjacent to the city’s Museum Campus, and just minutes from the heart of Chicago’s Loop, the 80-acre Central Station is a residential community with 3,727 residential units completed, of which 3,156 are occupied and 571 units are listed for sale, and another 4,000 units in development. Central Station, a 14 million-square-foot development, is being developed in partnership with The Fogelson Companies.
37
|
| Forest City Enterprises, Inc. and Subsidiaries |
Supplemental Operating Information
Land Held for Development or Sale (continued)
as of July 31, 2011
Other Significant Land Holdings
Legacy Lakes – Aberdeen, NC
Legacy Lakes is a master-planned community located in the Pinehurst area. This community is surrounding the Nicklaus-designed Legacy Golf Course. Legacy Lakes is 406 acres and includes 718 residential lots. Of the 406 total acres, 265 are saleable acres and 17 acres have been sold to date.
Gladden Farms – Marana, AZ
Gladden Farms is a master-planned community that includes residential and commercial uses in a suburban area of northwest Tucson. This community includes parks, trails and a school in a rural setting. Gladden Farms is 1,350 acres and includes approximately 4,142 residential lots and 223 acres of commercial space. As of July 31, 2011, 1,266 lots and 100 commercial acres have been sold. Of the 1,350 total acres, 868 are saleable acres and 408 acres have been sold to date.
Cotton Creek – Mooresville, NC
Cotton Creek is a master-planned community located in a northern suburb of Charlotte, NC. This community will feature a variety of attached and detached home sites, which will be sold to a mix of national and local builders. Cotton Creek is 534 acres. When completed the development is expected to produce approximately 1,300 residential lots.
Three Stones – Prosper, TX
Three Stones is a master-planned community of 2,031 acres located in the growth corridor north of Dallas in the town of Prosper. The community is fully entitled and the plan includes approximately 3,090 single family lots, 600 units of attached housing, over 600 acres of parks and open space and 250 acres for commercial/retail use. A variety of single family lot sizes will be offered, as well as a complete amenity center. The development of Phase 1 is expected to be completed in late 2012.
San Antonio Portfolio– San Antonio, TX
Forest City owns four multi-phase communities and finished lots in three additional locations in the San Antonio area, predominantly on the west side. As of July 31, 2011, almost 1,000 of the total 2,563 lots have been sold. The remaining portfolio is comprised of 449 finished lots and 1,112 undeveloped “paper” lots. Our San Antonio communities serve several different price ranges, and all lots are under option contract to one of seven different builders.
Tangerine Crossing – Tucson, AZ
Tangerine Crossing is a master-planned gated residential community with a major retail component on the exterior in a desirable region of the Tucson metropolitan area. This community includes open space, trails and recreation. Tangerine Crossing is 309 acres and includes 396 residential lots and a 25-acre retail center. As of July 31, 2011, 230 lots and the 25 commercial acres have been sold. Of the 309 total acres, 98 are saleable acres and 69 acres have been sold to date.
Timberlake– Oak Point (Dallas), TX
Timberlake is a planned community of approximately 250 acres located in Denton County, north of Dallas. Forest City entered into this project earlier in 2011 through the formation of a new partnership with Taylor Duncan Interests, Inc. with Forest City providing capital for financing and development. The project is zoned for over 800 single family lots, and development of Phase 1 is expected to begin in 2012.
Woodforest – Houston, TX
Woodforest, which is not included in the acres on the previous page, is an active, 3,000-acre master-planned community, located in southern Montgomery County, north of Houston. Forest City entered into this project last year through the formation of a new partnership with Johnson Development, with Forest City providing capital for financing and development. The project is zoned for 5,700 units and six active home builders are currently involved with model homes in place serving a wide range of prices. Over 200 home sales have occurred to date. The project is being developed adjacent to the 27-hole Woodforest Golf Club that opened in 2001 and has been rated one of the top courses in the state.
38
Forest City Enterprises, Inc. and Subsidiaries
Supplemental Operating Information
Debt for Projects under Construction and Development
We use nonrecourse mortgage debt and nonrecourse notes payable for the financing of our projects under construction and development. We draw on these financings to partially fund the cost incurred with the development of our real estate. As of July 31, 2011, the detail of how much is outstanding compared to the total commitment under the financing is as follows:
| | | | | | | | | | | | | | | | |
| | | Full
Consolidation
(GAAP) | | | Less
Noncontrolling
Interest | | | Plus
Unconsolidated
Investments at
Pro-Rata | | | Pro-Rata
Consolidation
(Non-GAAP) | |
| |
| | | (in thousands) | |
Outstanding | | | | | | | | | | | | | | | | |
Fixed | | $ | 196,088 | | | $ | 65,706 | | | $ | 887 | | | $ | 131,269 | |
Variable | | | | | | | | | | | | | | | | |
Taxable | | | 514,788 | | | | 30,998 | | | | 74,377 | | | | 558,167 | |
Tax-Exempt | | | – | | | | – | | | | 44,039 | | | | 44,039 | |
| | | | |
Total outstanding on projects under construction and development(1) | | $ | 710,876 | | | $ | 96,704 | | | $ | 119,303 | | | $ | 733,475 | |
| | | | |
| | | | |
Commitment | | | | | | | | | | | | | | | | |
Fixed | | $ | 852,197 | | | $ | 402,963 | | | $ | 887 | | | $ | 450,121 | |
Variable | | | | | | | | | | | | | | | | |
Taxable | | | 645,482 | | | | 30,998 | | | | 74,377 | | | | 688,861 | |
Tax-Exempt | | | – | | | | – | | | | 44,039 | | | | 44,039 | |
| | | | |
Total commitment | | $ | 1,497,679 | | | $ | 433,961 | | | $ | 119,303 | | | $ | 1,183,021 | |
| | | | |
| | (1) | Proceeds from outstanding debt of $20,741 and $45,516, at full and pro-rata consolidation, respectively, described above is recorded as restricted cash and escrowed funds in our Consolidated Balance Sheet. For bonds issued in conjunction with development, the full amount of the bonds at the beginning of construction must remain in escrow until costs are incurred. |
Nonrecourse Debt
Our primary capital strategy seeks to isolate the operating and financial risk at the property level to maximize returns and reduce risk on and of our equity capital. As such, substantially all of our operating and development properties are separately encumbered with nonrecourse mortgage debt which in some limited circumstances is supplemented by nonrecourse notes payable (collectively “nonrecourse debt”).
We use taxable and tax-exempt nonrecourse debt for our real estate projects. For real estate projects financed with tax-exempt debt, we generally utilize variable-rate debt. For construction loans, we generally pursue variable-rate financings with maturities ranging from two to five years. For those real estate projects financed with taxable debt, we generally seek long-term, fixed-rate financing for those operating projects whose loans mature or are projected to open and achieve stabilized operations. The availability of nonrecourse mortgage capital is improving, especially in strong markets, but is still not at the levels before the economic downturn. For those assets that cannot be refinanced at attractive terms, we attempt to extend the maturities with existing lenders.
We are actively working to refinance and/or extend the maturities of the nonrecourse debt that are coming due in the next 24 months. During the six months ended July 31, 2011, we completed the following financings:
| | | | | | | | | | | | | | | | |
| Purpose of Financing | | Full
Consolidation | | | Less
Noncontrolling
Interest | | | Plus
Unconsolidated
Investments at
Pro-Rata | | | Pro-Rata
Consolidation | |
| |
| | | (in thousands) | |
| | | | |
Refinancings | | $ | 84,000 | | | $ | 830 | | | $ | 56,113 | | | $ | 139,283 | |
Construction and development projects(1) | | | 294,421 | | | | 66,876 | | | | – | | | | 227,545 | |
Loan extensions/additional fundings | | | 257,856 | | | | 54,381 | | | | 427,928 | | | | 631,403 | |
| | | | |
| | $ | 636,277 | | | $ | 122,087 | | | $ | 484,041 | | | $ | 998,231 | |
| | | | |
| | (1) | Represents the full amount available to be drawn on the loans. |
39
Forest City Enterprises, Inc. and Subsidiaries
Supplemental Financial Information
Scheduled Maturities Table: Nonrecourse Debt(dollars in thousands)
As of July 31, 2011
| | | | | | | | | | | | | | | | | | | | | | | | | | | | | | | | |
| | | Period Ending January 31, 2012 | | | Fiscal Year Ending January 31, 2013 | |
| | | Full
Consolidation | | | Less
Noncontrolling
Interest | | | Plus
Unconsolidated
Investments at
Pro-Rata | | | Pro-Rata
Consolidation | | | Full
Consolidation | | | Less
Noncontrolling
Interest | | | Plus
Unconsolidated
Investments at
Pro-Rata | | | Pro-Rata
Consolidation | |
Fixed: | | | | | | | | | | | | | | | | | | | | | | | | | | | | | | | | |
Fixed-rate debt | | $ | 144,692 | | | $ | 4,072 | | | $ | 101,251 | | | $ | 241,871 | | | $ | 318,236 | | | $ | 18,006 | | | $ | 61,122 | | | $ | 361,352 | |
Weighted average rate | | | 6.36 | % | | | 6.15 | % | | | 7.11 | % | | | 6.68 | % | | | 6.02 | % | | | 6.72 | % | | | 6.39 | % | | | 6.04 | % |
Variable: | | | | | | | | | | | | | | | | | | | | | | | | | | | | | | | | |
Variable-rate debt | | | 327,152 | | | | 10,461 | | | | 21,027 | | | | 337,718 | | | | 737,390 | | | | 13,190 | | | | 113,919 | | | | 838,119 | |
Weighted average rate | | | 3.11 | % | | | 6.80 | % | | | 2.52 | % | | | 2.96 | % | | | 3.72 | % | | | 8.22 | % | | | 3.67 | % | | | 3.64 | % |
Tax-Exempt | | | 238 | | | | 24 | | | | 2,983 | | | | 3,197 | | | | 239 | | | | 24 | | | | – | | | | 215 | |
Weighted average rate | | | 1.53 | % | | | 1.51 | % | | | 1.47 | % | | | 1.47 | % | | | 1.58 | % | | | 1.57 | % | | | – | % | | | 1.58 | % |
Total variable-rate debt | | | 327,390 | | | | 10,485 | | | | 24,010 | | | | 340,915 | | | | 737,629 | | | | 13,214 | | | | 113,919 | | | | 838,334 | |
Total Nonrecourse Debt | | $ | 472,082 | | | $ | 14,557 | | | $ | 125,261 | | | $ | 582,786 | | | $ | 1,055,865 | | | $ | 31,220 | | | $ | 175,041 | | | $ | 1,199,686 | |
Weighted Average Rate | | | 4.11 | % | | | 6.61 | % | | | 6.21 | % | | | 4.50 | % | | | 4.41 | % | | | 7.35 | % | | | 4.62 | % | | | 4.36 | % |
| | | | | | | | | | | | | | | | | | | | | | | | | | | | | | | | |
| | | Fiscal Year Ending January 31, 2014 | | | Fiscal Year Ending January 31, 2015 | |
| | | Full
Consolidation | | | Less
Noncontrolling
Interest | | | Plus
Unconsolidated
Investments at
Pro-Rata | | | Pro-Rata
Consolidation | | | Full
Consolidation | | | Less
Noncontrolling
Interest | | | Plus
Unconsolidated
Investments at
Pro-Rata | | | Pro-Rata
Consolidation | |
Fixed: | | | | | | | | | | | | | | | | | | | | | | | | | | | | | | | | |
Fixed-rate debt | | $ | 691,808 | | | $ | 72,846 | | | $ | 139,490 | | | $ | 758,452 | | | $ | 386,623 | | | $ | 66,298 | | | $ | 191,169 | | | $ | 511,494 | |
Weighted average rate | | | 6.30 | % | | | 9.82 | % | | | 6.35 | % | | | 5.97 | % | | | 5.95 | % | | | 5.78 | % | | | 5.49 | % | | | 5.80 | % |
Variable: | | | | | | | | | | | | | | | | | | | | | | | | | | | | | | | | |
Variable-rate debt | | | 92,673 | | | | 9,060 | | | | 13,302 | | | | 96,915 | | | | 23,563 | | | | – | | | | 30,302 | | | | 53,865 | |
Weighted average rate | | | 6.59 | % | | | 8.64 | % | | | 4.19 | % | | | 6.07 | % | | | 3.68 | % | | | – | % | | | 4.23 | % | | | 3.99 | % |
Tax-Exempt | | | 91,055 | | | | 26 | | | | 53,040 | | | | 144,069 | | | | 272 | | | | 27 | | | | – | | | | 245 | |
Weighted average rate | | | 2.55 | % | | | 1.55 | % | | | 3.05 | % | | | 2.73 | % | | | 1.58 | % | | | 1.59 | % | | | – | % | | | 1.58 | % |
Total variable-rate debt | | | 183,728 | | | | 9,086 | | | | 66,342 | | | | 240,984 | | | | 23,835 | | | | 27 | | | | 30,302 | | | | 54,110 | |
Total Nonrecourse Debt | | $ | 875,536 | | | $ | 81,932 | | | $ | 205,832 | | | $ | 999,436 | | | $ | 410,458 | | | $ | 66,325 | | | $ | 221,471 | | | $ | 565,604 | |
Weighted Average Rate | | | 5.94 | % | | | 9.69 | % | | | 5.36 | % | | | 5.52 | % | | | 5.82 | % | | | 5.78 | % | | | 5.32 | % | | | 5.63 | % |
40
Forest City Enterprises, Inc. and Subsidiaries
Supplemental Financial Information
Scheduled Maturities Table: Nonrecourse Debt(dollars in thousands) (continued)
As of July 31, 2011
| | | | | | | | | | | | | | | | | | | | | | | | | | | | | | | | |
| | | Fiscal Year Ending January 31, 2016 | | | Thereafter | |
| | | Full
Consolidation | | | Less
Noncontrolling
Interest | | | Plus
Unconsolidated
Investments at
Pro-Rata | | | Pro-Rata
Consolidation | | | Full
Consolidation | | | Less
Noncontrolling
Interest | | | Plus
Unconsolidated
Investments at
Pro-Rata | | | Pro-Rata
Consolidation | |
Fixed: | | | | | | | | | | | | | | | | | | | | | | | | | | | | | | | | |
Fixed-rate debt | | $ | 357,164 | | | $ | 29,276 | | | $ | 123,152 | | | $ | 451,040 | | | $ | 1,479,614 | | | $ | 65,714 | | | $ | 826,330 | | | $ | 2,240,230 | |
Weighted average rate | | | 5.58 | % | | | 5.82 | % | | | 5.31 | % | | | 5.49 | % | | | 5.70 | % | | | 5.74 | % | | | 5.78 | % | | | 5.73 | % |
Variable: | | | | | | | | | | | | | | | | | | | | | | | | | | | | | | | | |
Variable-rate debt | | | – | | | | – | | | | 21,682 | | | | 21,682 | | | | 640,340 | | | | 2,717 | | | | 295,299 | | | | 932,922 | |
Weighted average rate | | | – | % | | | – | % | | | 1.62 | % | | | 1.62 | % | | | 7.23 | % | | | 3.25 | % | | | 2.98 | % | | | 5.90 | % |
Tax-Exempt | | | 290 | | | | 29 | | | | – | | | | 261 | | | | 330,338 | | | | 5,303 | | | | 268,938 | | | | 593,973 | |
Weighted average rate | | | 1.58 | % | | | 1.58 | % | | | – | % | | | 1.58 | % | | | 1.01 | % | | | 1.00 | % | | | 1.86 | % | | | 1.40 | % |
Total variable-rate debt | | | 290 | | | | 29 | | | | 21,682 | | | | 21,943 | | | | 970,678 | | | | 8,020 | | | | 564,237 | | | | 1,526,895 | |
Total Nonrecourse Debt | | $ | 357,454 | | | $ | 29,305 | | | $ | 144,834 | | | $ | 472,983 | | | $ | 2,450,292 | | | $ | 73,734 | | | $ | 1,390,567 | | | $ | 3,767,125 | |
Weighted Average Rate | | | 5.58 | % | | | 5.82 | % | | | 4.76 | % | | | 5.31 | % | | | 5.47 | % | | | 5.31 | % | | | 4.42 | % | | | 5.09 | % |
| | | | | | | | | | | | | | | | | | | | | | | | | | | | | | | | |
| | | Total | | | | |
| | | Full
Consolidation | | | Less
Noncontrolling
Interest | | | Plus
Unconsolidated
Investments at
Pro-Rata | | | Pro-Rata
Consolidation | | | | |
Fixed: | | | | | | | | | | | | | | | | | |
Fixed-rate debt | | $ | 3,378,137 | | | $ | 256,212 | | | $ | 1,442,514 | | | $ | 4,564,439 | | |
Weighted average rate | | | 5.90 | % | | | 7.00 | % | | | 5.87 | % | | | 5.83 | % | |
Variable: | | | | | | | | | | | | | | | | | |
Variable-rate debt | | | 1,821,118 | | | | 35,428 | | | | 495,531 | | | | 2,281,221 | | |
Weighted average rate | | | 4.99 | % | | | 7.53 | % | | | 3.17 | % | | | 4.55 | % | |
Tax-Exempt | | | 422,432 | | | | 5,433 | | | | 324,961 | | | | 741,960 | | |
Weighted average rate | | | 1.34 | % | | | 1.02 | % | | | 2.05 | % | | | 1.66 | % | |
Total variable-rate debt | | | 2,243,550 | | | | 40,861 | | | | 820,492 | | | | 3,023,181 | | |
Total Nonrecourse Debt | | $ | 5,621,687 | | | $ | 297,073 | | | $ | 2,263,006 | | | $ | 7,587,620 | | |
Weighted Average Rate | | | 5.26 | % | | | 6.95 | % | | | 4.73 | % | | | 5.04 | % | |
41
Forest City Enterprises, Inc. and Subsidiaries
Supplemental Financial Information
The following schedules present information on investments in unconsolidated entities.
Investments in Unconsolidated Entities
Investments in unconsolidated entities include investments in and advances to affiliates and cash distributions and losses in excess of unconsolidated investments that the Company does not control and/or is not deemed to be the primary beneficiary, and which are accounted for under the equity method of accounting.
The following is a reconciliation of members’ and partners’ equity to the Company’s carrying value:
| | | | | | | | |
| | | July 31, 2011 | | | January 31, 2011 | |
| | | | |
| | | (in thousands) | |
| | |
Members’ and partners’ equity, as below | | $ | 987,583 | | | $ | 587,164 | |
Equity of other members and partners | | | 857,348 | | | | 616,640 | |
| | | | |
| | |
Company’s investment in partnerships | | | 130,235 | | | | (29,476) | |
Basis differences | | | 177,495 | | | | 76,634 | |
Advances to and on behalf of other affiliates | | | 94,942 | | | | 93,859 | |
| | | | |
Total Investments in Unconsolidated Entities | | $ | 402,672 | | | $ | 141,017 | |
| | | | |
| | |
Assets – Investments in and advances to affiliates | | $ | 685,627 | | | $ | 431,509 | |
Liabilities – Cash distributions and losses in excess of investments in unconsolidated investments | | | (282,955) | | | | (290,492) | |
| | | | |
Total Investments in Unconsolidated Entities | | $ | 402,672 | | | $ | 141,017 | |
| | | | |
Summarized financial information for the equity method investments is as follows:
| | | | | | | | | | | | | | | | |
| | | Combined (100%) | | | Pro-Rata Share | |
| | | (GAAP) | | | (Non-GAAP) | |
| | | July 31, 2011 | | | January 31, 2011 | | | July 31, 2011 | | | January 31, 2011 | |
| | | | |
| | | (in thousands) | |
Balance Sheet: | | | | | | | | | | | | | | | | |
Real Estate | | | | | | | | | | | | | | | | |
Completed rental properties | | $ | 6,905,798 | | | $ | 5,514,041 | | | $ | 2,673,450 | | | $ | 1,923,813 | |
Projects under construction and development | | | 425,495 | | | | 174,106 | | | | 220,826 | | | | 79,603 | |
Land held for development or sale | | | 230,431 | | | | 272,930 | | | | 96,725 | | | | 115,607 | |
| | | | |
Total Real Estate | | | 7,561,724 | | | | 5,961,077 | | | | 2,991,001 | | | | 2,119,023 | |
| | | | |
Less accumulated depreciation | | | (1,158,399) | | | | (944,968) | | | | (516,556) | | | | (424,331) | |
| | | | |
| | | | |
Real Estate, net | | | 6,403,325 | | | | 5,016,109 | | | | 2,474,445 | | | | 1,694,692 | |
| | | | |
Cash and equivalents | | | 125,605 | | | | 109,246 | | | | 60,556 | | | | 48,583 | |
Restricted cash – military housing bond funds | | | 345,365 | | | | 384,584 | | | | 5,694 | | | | 5,161 | |
Other restricted cash and escrowed funds | | | 292,490 | | | | 206,778 | | | | 117,324 | | | | 73,729 | |
Other assets | | | 750,381 | | | | 536,246 | | | | 252,348 | | | | 131,486 | |
Operating property assets held for sale(1) | | | – | | | | 67,190 | | | | – | | | | – | |
| | | | |
Total Assets | | $ | 7,917,166 | | | $ | 6,320,153 | | | $ | 2,910,367 | | | $ | 1,953,651 | |
| | | | |
| | | | |
Mortgage debt and notes payable, nonrecourse | | $ | 6,461,858 | | | $ | 5,301,900 | | | $ | 2,263,006 | | | $ | 1,713,367 | |
Other liabilities | | | 467,725 | | | | 369,871 | | | | 191,050 | | | | 124,908 | |
Liabilities of operating property held for sale(1) | | | – | | | | 61,218 | | | | – | | | | – | |
| | | | |
Total Liabilities | | | 6,929,583 | | | | 5,732,989 | | | | 2,454,056 | | | | 1,838,275 | |
| | | | |
Members’ and partners’ equity | | | 987,583 | | | | 587,164 | | | | 456,311 | | | | 115,376 | |
| | | | |
| | | | |
Total Liabilities and Members’ and Partners’ Equity | | $ | 7,917,166 | | | $ | 6,320,153 | | | $ | 2,910,367 | | | $ | 1,953,651 | |
| | | | |
| | (1) | Represents assets and liabilities ofMetropolitan Lofts, an unconsolidated apartment community in Los Angeles, California, which was disposed on February 1, 2011. |
42
Forest City Enterprises, Inc. and Subsidiaries
Supplemental Financial Information
Investments in Unconsolidated Entities(continued)
| | | | | | | | | | | | | | | | |
| | | Combined (100%)
(GAAP) | | | Pro-Rata Share
(Non-GAAP) | |
| Three Months Ended July 31, | | 2011 | | | 2010 | | | 2011 | | | 2010 | |
| | | (in thousands) | |
Operations: | | | | | | | | | | | | | | | | |
Revenues | | $ | 258,831 | | | $ | 218,481 | | | $ | 94,643 | | | $ | 80,162 | |
Equity in earnings (loss) of unconsolidated entities on a pro-rata basis | | | – | | | | – | | | | (3,349 | ) | | | (6,206 | ) |
Operating expenses | | | (140,394 | ) | | | (122,421 | ) | | | (45,037 | ) | | | (39,807 | ) |
Interest expense including early extinguishment of debt | | | (86,064 | ) | | | (67,554 | ) | | | (27,538 | ) | | | (19,162 | ) |
Depreciation and amortization | | | (48,259 | ) | | | (43,485 | ) | | | (16,744 | ) | | | (12,865 | ) |
Interest and other income | | | 4,769 | | | | 5,012 | | | | 268 | | | | (56 | ) |
Noncontrolling interest | | | – | | | | – | | | | 142 | | | | 98 | |
Net earnings (loss) (pre-tax) | | $ | (11,117 | ) | | $ | (9,967 | ) | | $ | 2,385 | | | $ | 2,164 | |
Impairment of investments in unconsolidated entities(1) | | | – | | | | (2,282 | ) | | | – | | | | (2,282 | ) |
Loss on disposition of equity method investments(2) | | | – | | | | (878 | ) | | | – | | | | (878 | ) |
Net earnings (loss) (pre-tax) from unconsolidated entities | | $ | (11,117 | ) | | $ | (13,127 | ) | | $ | 2,385 | | | $ | (996 | ) |
| | | Combined (100%)
(GAAP) | | | Pro-Rata Share
(Non-GAAP) | |
| Six Months Ended July 31, | | 2011 | | | 2010 | | | 2011 | | | 2010 | |
| | | (in thousands) | |
Operations: | | | | | | | | | | | | | | | | |
Revenues | | $ | 515,020 | | | $ | 451,504 | | | $ | 177,357 | | | $ | 167,701 | |
Equity in earnings (loss) of unconsolidated entities on a pro-rata basis | | | – | | | | – | | | | (3,702 | ) | | | (5,933 | ) |
Operating expenses | | | (294,786 | ) | | | (263,319 | ) | | | (82,721 | ) | | | (93,443 | ) |
Interest expense including early extinguishment of debt | | | (160,291 | ) | | | (129,993 | ) | | | (50,645 | ) | | | (39,118 | ) |
Impairment of real estate(1) | | | – | | | | (1,457 | ) | | | – | | | | (743 | ) |
Depreciation and amortization | | | (95,651 | ) | | | (80,577 | ) | | | (31,052 | ) | | | (25,664 | ) |
Interest and other income | | | 7,527 | | | | 7,549 | | | | 385 | | | | 694 | |
Noncontrolling interest | | | – | | | | – | | | | 190 | | | | (6,346 | ) |
Net earnings (loss) (pre-tax) | | $ | (28,181 | ) | | $ | (16,293 | ) | | $ | 9,812 | | | $ | (2,852 | ) |
Impairment of investments in unconsolidated entities(1) | | | – | | | | (14,438 | ) | | | – | | | | (14,438 | ) |
Gain (loss) on disposition of equity method investments(2) | | | 12,567 | | | | (830 | ) | | | 12,567 | | | | (830 | ) |
Net earnings (loss) (pre-tax) from unconsolidated entities | | $ | (15,614 | ) | | $ | (31,561 | ) | | $ | 22,379 | | | $ | (18,120 | ) |
43
Forest City Enterprises, Inc. and Subsidiaries
Supplemental Financial Information
| (1) | The following tables show the detail of impairment of unconsolidated entities: |
| | | | | | | | | | | | | | | | | | |
| | | | | Combined (100%)
(GAAP) | | | Pro-Rata Share
(Non-GAAP) | |
| | | | | Three Months Ended July 31, | |
| | | | | 2011 | | | 2010 | | | 2011 | | | 2010 | |
| | | | | (in thousands) | |
Impairment of investments in unconsolidated entities: | | | | | | | | | | | | | | | | | | |
Mixed-Use Land Development: | | | | | | | | | | | | | | | | | | |
Central Station: Mercy Campus | | Chicago, Illinois | | $ | – | | | $ | 1,817 | | | $ | – | | | $ | 1,817 | |
Other | | | | | – | | | | 465 | | | | – | | | | 465 | |
Total impairment of investments in unconsolidated entities | | | | $ | – | | | $ | 2,282 | | | $ | – | | | $ | 2,282 | |
| | | |
| | | | | Combined (100%) | | | Pro-Rata Share | |
| | | | | (GAAP) | | | (Non-GAAP) | |
| | | | | Six Months Ended July 31, | |
| | | | | 2011 | | | 2010 | | | 2011 | | | 2010 | |
| | | | | (in thousands) | |
Impairment of real estate: | | | | | | | | | | | | | | | | | | |
Old Stone Crossing at Caldwell Creek (Mixed-Use Land Development) | | Charlotte, North Carolina | | $ | – | | | $ | 1,457 | | | $ | – | | | $ | 743 | |
| | | | $ | – | | | $ | 1,457 | | | $ | – | | | $ | 743 | |
Impairment of investments in unconsolidated entities: | | | | | | | | | | | | | | | | | | |
Mixed-Use Land Development: | | | | | | | | | | | | | | | | | | |
Central Station: Mercy Campus | | Chicago, Illinois | | $ | – | | | $ | 1,817 | | | $ | – | | | $ | 1,817 | |
Office Buildings: | | | | | | | | | | | | | | | | | | |
818 Mission Street | | San Francisco, California | | | – | | | | 4,018 | | | | – | | | | 4,018 | |
Bulletin Building | | San Francisco, California | | | – | | | | 3,543 | | | | – | | | | 3,543 | |
Metreon (Specialty Retail Center) | | San Francisco, California | | | – | | | | 4,595 | | | | – | | | | 4,595 | |
Other | | | | | – | | | | 465 | | | | – | | | | 465 | |
Total impairment of investments in unconsolidated entities | | | | $ | – | | | $ | 14,438 | | | $ | – | | | $ | 14,438 | |
Total impairment of unconsolidated entities | | | | $ | – | | | $ | 15,895 | | | $ | – | | | $ | 15,181 | |
|
(2) Upon disposition, investments accounted for on the equity method are not classified as discontinued operations; therefore, gains or losses on the disposition of these properties are reported in continuing operations. The following table shows the detail of gains and losses on disposition of unconsolidated entities: | |
| | | |
| | | | | Combined (100%)
(GAAP) | | | Pro-Rata Share
(Non-GAAP) | |
| | | | | Three Months Ended July 31, | |
| | | | | 2011 | | | 2010 | | | 2011 | | | 2010 | |
| | | | | (in thousands) | |
Gain (loss) on disposition of equity method investments: | | | | | | | | | | | | | | | | | | |
Specialty Retail Centers: | | | | | | | | | | | | | | | | | | |
Coachella Plaza | | Coachella, California | | $ | – | | | $ | 104 | | | $ | – | | | $ | 104 | |
Southgate Mall | | Yuma, Arizona | | | – | | | | 64 | | | | – | | | | 64 | |
Metreon | | San Francisco, California | | | – | | | | (1,046 | ) | | | – | | | | (1,046 | ) |
Total loss on disposition of equity method investments | | | | $ | – | | | $ | (878 | ) | | $ | – | | | $ | (878 | ) |
| | | |
| | | | | Combined (100%)
(GAAP) | | | Pro-Rata Share
(Non-GAAP) | |
| | | | | Six Months Ended July 31, | |
| | | | | 2011 | | | 2010 | | | 2011 | | | 2010 | |
| | | | | (in thousands) | |
Gain (loss) on disposition of equity method investments: | | | | | | | | | | | | | | | | | | |
Apartment Communities: | | | | | | | | | | | | | | | | | | |
Metropolitan Lofts | | Los Angeles, California | | $ | 9,964 | | | $ | – | | | $ | 9,964 | | | $ | – | |
Twin Lake Towers | | Denver, Colorado | | | 2,603 | | | | – | | | | 2,603 | | | | – | |
Specialty Retail Centers: | | | | | | | | | | | | | | | | | | |
Coachella Plaza | | Coachella, California | | | – | | | | 104 | | | | – | | | | 104 | |
Southgate Mall | | Yuma, Arizona | | | – | | | | 64 | | | | – | | | | 64 | |
El Centro Mall | | El Centro, California | | | – | | | | 48 | | | | – | | | | 48 | |
Metreon | | San Francisco, California | | | – | | | | (1,046 | ) | | | – | | | | (1,046 | ) |
Total gain (loss) on disposition of equity method investments | | | | $ | 12,567 | | | $ | (830 | ) | | $ | 12,567 | | | $ | (830 | ) |
44
(THIS PAGE INTENTIONALLY LEFT BLANK)
Forest City Enterprises, Inc. and Subsidiaries
Supplemental Financial Information
Summary of Earnings Before Depreciation, Amortization and Deferred Taxes (EBDT) – Three Months Ended July 31, 2011(in thousands)
| | | | | | | | | | | | | | | | | | | | | | | | | | | | | | | | | | | | | | | | |
| | | Commercial Group 2011 | | | Residential Group 2011 | |
| | | Full
Consolidation
(GAAP) | | | Less
Noncontrolling
Interest | | | Plus
Unconsolidated
Investments at
Pro-Rata | | | Plus
Discontinued
Operations | | | Pro-Rata
Consolidation
(Non-GAAP) | | | Full
Consolidation
(GAAP) | | | Less
Noncontrolling
Interest | | | Plus
Unconsolidated
Investments at
Pro-Rata | | | Plus
Discontinued
Operations | | | Pro-Rata
Consolidation
(Non-GAAP) | |
Revenues from real estate operations | | $ | 187,818 | | | $ | 8,626 | | | $ | 55,995 | | | $ | 1,494 | | | $ | 236,681 | | | $ | 57,525 | | | $ | 3,254 | | | $ | 36,558 | | | $ | – | | | $ | 90,829 | |
Exclude straight-line rent adjustment | | | 1,907 | | | | – | | | | – | | | | (217 | ) | | | 1,690 | | | | (288 | ) | | | – | | | | – | | | | – | | | | (288 | ) |
Adjusted revenues | | | 189,725 | | | | 8,626 | | | | 55,995 | | | | 1,277 | | | | 238,371 | | | | 57,237 | | | | 3,254 | | | | 36,558 | | | | – | | | | 90,541 | |
Add interest and other income | | | 7,714 | | | | 173 | | | | 40 | | | | – | | | | 7,581 | | | | 4,998 | | | | 149 | | | | 224 | | | | – | | | | 5,073 | |
Add equity in earnings (loss) of unconsolidated entities, including impairment | | | 3,845 | | | | 1 | | | | (3,844 | ) | | | – | | | | – | | | | 1,614 | | | | 141 | | | | (1,548 | ) | | | – | | | | (75 | ) |
Exclude gain on disposition of unconsolidated entities | | | – | | | | – | | | | – | | | | – | | | | – | | | | – | | | | – | | | | – | | | | – | | | | – | |
Exclude depreciation and amortization of unconsolidated entities | | | 10,394 | | | | – | | | | (10,394 | ) | | | – | | | | – | | | | 6,274 | | | | – | | | | (6,274 | ) | | | – | | | | – | |
Adjusted total income | | | 211,678 | | | | 8,800 | | | | 41,797 | | | | 1,277 | | | | 245,952 | | | | 70,123 | | | | 3,544 | | | | 28,960 | | | | – | | | | 95,539 | |
Operating expenses | | | 99,421 | | | | 5,186 | | | | 25,259 | | | | 446 | | | | 119,940 | | | | 40,359 | | | | 2,264 | | | | 18,013 | | | | – | | | | 56,108 | |
Non-Real Estate depreciation and amortization and amortization of mortgage procurement costs | | | 194 | | | | – | | | | – | | | | – | | | | 194 | | | | 120 | | | | – | | | | – | | | | – | | | | 120 | |
Exclude straight-line rent adjustment | | | (1,095 | ) | | | – | | | | – | | | | – | | | | (1,095 | ) | | | – | | | | – | | | | – | | | | – | | | | – | |
Exclude preference payment | | | (586 | ) | | | – | | | | – | | | | – | | | | (586 | ) | | | – | | | | – | | | | – | | | | – | | | | – | |
Adjusted operating expenses | | | 97,934 | | | | 5,186 | | | | 25,259 | | | | 446 | | | | 118,453 | | | | 40,479 | | | | 2,264 | | | | 18,013 | | | | – | | | | 56,228 | |
Net operating income | | | 113,744 | | | | 3,614 | | | | 16,538 | | | | 831 | | | | 127,499 | | | | 29,644 | | | | 1,280 | | | | 10,947 | | | | – | | | | 39,311 | |
Interest expense | | | 41,459 | | | | 2,846 | | | | 16,519 | | | | 180 | | | | 55,312 | | | | 9,040 | | | | 582 | | | | 8,611 | | | | – | | | | 17,069 | |
(Gain) loss on early extinguishment of debt | | | (5,329 | ) | | | – | | | | 19 | | | | – | | | | (5,310 | ) | | | – | | | | – | | | | 2,336 | | | | – | | | | 2,336 | |
Noncontrolling interest in earnings before depreciation and amortization | | | 768 | | | | 768 | | | | – | | | | – | | | | – | | | | 698 | | | | 698 | | | | – | | | | – | | | | – | |
Add: Pre-Tax EBDT from discontinued operations | | | 651 | | | | – | | | | – | | | | (651 | ) | | | – | | | | – | | | | – | | | | – | | | | – | | | | – | |
Pre-Tax EBDT | | | 77,497 | | | | – | | | | – | | | | – | | | | 77,497 | | | | 19,906 | | | | – | | | | – | | | | – | | | | 19,906 | |
Income tax expense (benefit) | | | – | | | | – | | | | – | | | | – | | | | – | | | | – | | | | – | | | | – | | | | – | | | | – | |
Earnings before depreciation, amortization and deferred taxes (EBDT) | | $ | 77,497 | | | $ | – | | | $ | – | | | $ | – | | | $ | 77,497 | | | $ | 19,906 | | | $ | – | | | $ | – | | | $ | – | | | $ | 19,906 | |
Reconciliation to net earnings: | | | | | | | | | | | | | | | | | | | | | | | | | | | | | | | | | | | | | | | | |
Earnings before depreciation, amortization and deferred taxes (EBDT) | | $ | 77,497 | | | $ | – | | | $ | – | | | $ | – | | | $ | 77,497 | | | $ | 19,906 | | | $ | – | | | $ | – | | | $ | – | | | $ | 19,906 | |
Depreciation and amortization – Real Estate Groups | | | (49,436 | ) | | | – | | | | – | | | | (238 | ) | | | (49,674 | ) | | | (19,188 | ) | | | – | | | | – | | | | – | | | | (19,188 | ) |
Amortization of mortgage procurement costs – Real Estate Groups | | | (2,360 | ) | | | – | | | | – | | | | (84 | ) | | | (2,444 | ) | | | (886 | ) | | | – | | | | – | | | | – | | | | (886 | ) |
Straight-line rent adjustment | | | (3,002 | ) | | | – | | | | – | | | | 217 | | | | (2,785 | ) | | | 288 | | | | – | | | | – | | | | – | | | | 288 | |
Preference payment | | | (586 | ) | | | – | | | | – | | | | – | | | | (586 | ) | | | – | | | | – | | | | – | | | | – | | | | – | |
Gain on disposition of rental properties and partial interests in rental properties, net of noncontrolling interest | | | – | | | | – | | | | – | | | | 29,899 | | | | 29,899 | | | | – | | | | – | | | | – | | | | – | | | | – | |
Gain on disposition of unconsolidated entities | | | – | | | | – | | | | – | | | | – | | | | – | | | | – | | | | – | | | | – | | | | – | | | | – | |
Impairment of consolidated and unconsolidated real estate | | | – | | | | – | | | | – | | | | – | | | | – | | | | (235 | ) | | | – | | | | – | | | | – | | | | (235 | ) |
Discontinued operations: | | | | | | | | | | | | | | | | | | | | | | | | | | | | | | | | | | | | | | | | |
Depreciation and amortization – Real Estate Groups | | | (238 | ) | | | – | | | | – | | | | 238 | | | | – | | | | – | | | | – | | | | – | | | | – | | | | – | |
Amortization of mortgage procurement costs – Real Estate Groups | | | (84 | ) | | | – | | | | – | | | | 84 | | | | – | | | | – | | | | – | | | | – | | | | – | | | | – | |
Straight-line rent adjustment | | | 217 | | | | – | | | | – | | | | (217 | ) | | | – | | | | – | | | | – | | | | – | | | | – | | | | – | |
Gain on disposition of rental properties | | | 29,899 | | | | – | | | | – | | | | (29,899 | ) | | | – | | | | – | | | | – | | | | – | | | | – | | | | – | |
Net earnings (loss) attributable to Forest City Enterprises, Inc. | | $ | 51,907 | | | $ | – | | | $ | – | | | $ | – | | | $ | 51,907 | | | $ | (115 | ) | | $ | – | | | $ | – | | | $ | – | | | $ | (115 | ) |
45
Forest City Enterprises, Inc. and Subsidiaries
Supplemental Financial Information
Summary of Earnings Before Depreciation, Amortization and Deferred Taxes (EBDT) – Three Months Ended July 31, 2011(in thousands)(continued)
| | | | | | | | | | | | | | | | | | | | | | | | | | | | | | | | | | | | | | | | |
| | | Land Development Group 2011 | | | The Nets 2011 | |
| | | Full
Consolidation
(GAAP) | | | Less
Noncontrolling
Interest | | | Plus
Unconsolidated
Investments at
Pro-Rata | | | Plus
Discontinued
Operations | | | Pro-Rata
Consolidation
(Non-GAAP) | | | Full
Consolidation
(GAAP) | | | Less
Noncontrolling
Interest | | | Plus
Unconsolidated
Investments at
Pro-Rata | | | Plus
Discontinued
Operations | | | Pro-Rata
Consolidation
(Non-GAAP) | |
Revenues from real estate operations | | $ | 7,862 | | | $ | 399 | | | $ | 2,090 | | | $ | – | | | $ | 9,553 | | | $ | – | | | $ | – | | | $ | – | | | $ | – | | | $ | – | |
Exclude straight-line rent adjustment | | | – | | | | – | | | | – | | | | – | | | | – | | | | – | | | | – | | | | – | | | | – | | | | – | |
Adjusted revenues | | | 7,862 | | | | 399 | | | | 2,090 | | | | – | | | | 9,553 | | | | – | | | | – | | | | – | | | | – | | | | – | |
Add interest and other income | | | 2,553 | | | | 212 | | | | 4 | | | | – | | | | 2,345 | | | | – | | | | – | | | | – | | | | – | | | | – | |
Add equity in earnings (loss) of unconsolidated entities, including impairment | | | 308 | | | | – | | | | (200 | ) | | | – | | | | 108 | | | | (3,382 | ) | | | – | | | | – | | | | – | | | | (3,382 | ) |
Exclude gain on disposition of unconsolidated entities | | | – | | | | – | | | | – | | | | – | | | | – | | | | – | | | | – | | | | – | | | | – | | | | – | |
Exclude depreciation and amortization of unconsolidated entities | | | 76 | | | | – | | | | (76 | ) | | | – | | | | – | | | | – | | | | – | | | | – | | | | – | | | | – | |
Adjusted total income | | | 10,799 | | | | 611 | | | | 1,818 | | | | – | | | | 12,006 | | | | (3,382 | ) | | | – | | | | – | | | | – | | | | (3,382 | ) |
Operating expenses | | | 10,193 | | | | 453 | | | | 1,765 | | | | – | | | | 11,505 | | | | – | | | | – | | | | – | | | | – | | | | – | |
Non-Real Estate depreciation and amortization and amortization of mortgage procurement costs | | | 16 | | | | – | | | | – | | | | – | | | | 16 | | | | – | | | | – | | | | – | | | | – | | | | – | |
Exclude straight-line rent adjustment | | | – | | | | – | | | | – | | | | – | | | | – | | | | – | | | | – | | | | – | | | | – | | | | – | |
Exclude preference payment | | | – | | | | – | | | | – | | | | – | | | | – | | | | – | | | | – | | | | – | | | | – | | | | – | |
Adjusted operating expenses | | | 10,209 | | | | 453 | | | | 1,765 | | | | – | | | | 11,521 | | | | – | | | | – | | | | – | | | | – | | | | – | |
Net operating income | | | 590 | | | | 158 | | | | 53 | | | | – | | | | 485 | | | | (3,382 | ) | | | – | | | | – | | | | – | | | | (3,382 | ) |
Interest expense | | | 776 | | | | 130 | | | | 53 | | | | – | | | | 699 | | | | – | | | | – | | | | – | | | | – | | | | – | |
(Gain) loss on early extinguishment of debt | | | – | | | | – | | | | – | | | | – | | | | – | | | | – | | | | – | | | | – | | | | – | | | | – | |
Noncontrolling interest in earnings before depreciation and amortization | | | 28 | | | | 28 | | | | – | | | | – | | | | – | | | | – | | | | – | | | | – | | | | – | | | | – | |
Add: Pre-Tax EBDT from discontinued operations | | | – | | | | – | | | | – | | | | – | | | | – | | | | – | | | | – | | | | – | | | | – | | | | – | |
Pre-Tax EBDT | | | (214 | ) | | | – | | | | – | | | | – | | | | (214 | ) | | | (3,382 | ) | | | – | | | | – | | | | – | | | | (3,382 | ) |
Income tax expense (benefit) | | | – | | | | – | | | | – | | | | – | | | | – | | | | – | | | | – | | | | – | | | | – | | | | – | |
Earnings before depreciation, amortization and deferred taxes (EBDT) | | $ | (214 | ) | | $ | – | | | $ | – | | | $ | – | | | $ | (214 | ) | | $ | (3,382 | ) | | $ | – | | | $ | – | | | $ | – | | | $ | (3,382 | ) |
Reconciliation to net earnings: | | | | | | | | | | | | | | | | | | | | | | | | | | | | | | | | | | | | | | | | |
Earnings before depreciation, amortization and deferred taxes (EBDT) | | $ | (214 | ) | | $ | – | | | $ | – | | | $ | – | | | $ | (214 | ) | | $ | (3,382 | ) | | $ | – | | | $ | – | | | $ | – | | | $ | (3,382 | ) |
Depreciation and amortization – Real Estate Groups | | | (67 | ) | | | – | | | | – | | | | – | | | | (67 | ) | | | – | | | | – | | | | – | | | | – | | | | – | |
Amortization of mortgage procurement costs – Real Estate Groups | | | (85 | ) | | | – | | | | – | | | | – | | | | (85 | ) | | | – | | | | – | | | | – | | | | – | | | | – | |
Straight-line rent adjustment | | | – | | | | – | | | | – | | | | – | | | | – | | | | – | | | | – | | | | – | | | | – | | | | – | |
Preference payment | | | – | | | | – | | | | – | | | | – | | | | – | | | | – | | | | – | | | | – | | | | – | | | | – | |
Gain on disposition of rental properties and partial interests in rental properties, net of noncontrolling interest | | | – | | | | – | | | | – | | | | – | | | | – | | | | – | | | | – | | | | – | | | | – | | | | – | |
Gain on disposition of unconsolidated entities | | | – | | | | – | | | | – | | | | – | | | | – | | | | – | | | | – | | | | – | | | | – | | | | – | |
Impairment of consolidated and unconsolidated real estate | | | – | | | | – | | | | – | | | | – | | | | – | | | | – | | | | – | | | | – | | | | – | | | | – | |
Discontinued operations: | | | | | | | | | | | | | | | | | | | | | | | | | | | | | | | | | | | | | | | | |
Depreciation and amortization – Real Estate Groups | | | – | | | | – | | | | – | | | | – | | | | – | | | | – | | | | – | | | | – | | | | – | | | | – | |
Amortization of mortgage procurement costs – Real Estate Groups | | | – | | | | – | | | | – | | | | – | | | | – | | | | – | | | | – | | | | – | | | | – | | | | – | |
Straight-line rent adjustment | | | – | | | | – | | | | – | | | | – | | | | – | | | | – | | | | – | | | | – | | | | – | | | | – | |
Gain on disposition of rental properties | | | – | | | | – | | | | – | | | | – | | | | – | | | | – | | | | – | | | | – | | | | – | | | | – | |
Net earnings (loss) attributable to Forest City Enterprises, Inc. | | $ | (366 | ) | | $ | – | | | $ | – | | | $ | – | | | $ | (366 | ) | | $ | (3,382 | ) | | $ | – | | | $ | – | | | $ | – | | | $ | (3,382 | ) |
46
Forest City Enterprises, Inc. and Subsidiaries
Supplemental Financial Information
Summary of Earnings Before Depreciation, Amortization and Deferred Taxes (EBDT) – Three Months Ended July 31, 2011(in thousands) (continued)
| | | | | | | | | | | | | | | | | | | | | | | | | | | | | | | | | | | | | | | | |
| | | Corporate Activities 2011 | | | Total 2011 | |
| | | Full Consolidation (GAAP) | | | Less Noncontrolling Interest | | | Plus Unconsolidated Investments at Pro-Rata | | | Plus Discontinued Operations | | | Pro-Rata Consolidation (Non-GAAP) | | | Full Consolidation (GAAP) | | | Less Noncontrolling Interest | | | Plus Unconsolidated Investments at Pro-Rata | | | Plus Discontinued Operations | | | Pro-Rata Consolidation (Non-GAAP) | |
Revenues from real estate operations | | $ | – | | | $ | – | | | $ | – | | | $ | – | | | $ | – | | | $ | 253,205 | | | $ | 12,279 | | | $ | 94,643 | | | $ | 1,494 | | | $ | 337,063 | |
Exclude straight-line rent adjustment | | | – | | | | – | | | | – | | | | – | | | | – | | | | 1,619 | | | | – | | | | – | | | | (217 | ) | | | 1,402 | |
Adjusted revenues | | | – | | | | – | | | | – | | | | – | | | | – | | | | 254,824 | | | | 12,279 | | | | 94,643 | | | | 1,277 | | | | 338,465 | |
Add interest and other income | | | 50 | | | | – | | | | – | | | | – | | | | 50 | | | | 15,315 | | | | 534 | | | | 268 | | | | – | | | | 15,049 | |
Add equity in earnings (loss) of unconsolidated entities, including impairment | | | – | | | | – | | | | – | | | | – | | | | – | | | | 2,385 | | | | 142 | | | | (5,592 | ) | | | – | | | | (3,349 | ) |
Exclude gain on disposition of unconsolidated entities | | | – | | | | – | | | | – | | | | – | | | | – | | | | – | | | | – | | | | – | | | | – | | | | – | |
Exclude depreciation and amortization of unconsolidated entities | | | – | | | | – | | | | – | | | | – | | | | – | | | | 16,744 | | | | – | | | | (16,744 | ) | | | – | | | | – | |
Adjusted total income | | | 50 | | | | – | | | | – | | | | – | | | | 50 | | | | 289,268 | | | | 12,955 | | | | 72,575 | | | | 1,277 | | | | 350,165 | |
Operating expenses | | | 9,798 | | | | – | | | | – | | | | – | | | | 9,798 | | | | 159,771 | | | | 7,903 | | | | 45,037 | | | | 446 | | | | 197,351 | |
Non-Real Estate depreciation and amortization and amortization of mortgage procurement costs | | | 356 | | | | – | | | | – | | | | – | | | | 356 | | | | 686 | | | | – | | | | – | | | | – | | | | 686 | |
Exclude straight-line rent adjustment | | | – | | | | – | | | | – | | | | – | | | | – | | | | (1,095 | ) | | | – | | | | – | | | | – | | | | (1,095 | ) |
Exclude preference payment | | | – | | | | – | | | | – | | | | – | | | | – | | | | (586 | ) | | | – | | | | – | | | | – | | | | (586 | ) |
Adjusted operating expenses | | | 10,154 | | | | – | | | | – | | | | – | | | | 10,154 | | | | 158,776 | | | | 7,903 | | | | 45,037 | | | | 446 | | | | 196,356 | |
Net operating income | | | (10,104 | ) | | | – | | | | – | | | | – | | | | (10,104 | ) | | | 130,492 | | | | 5,052 | | | | 27,538 | | | | 831 | | | | 153,809 | |
Interest expense | | | 12,789 | | | | – | | | | – | | | | – | | | | 12,789 | | | | 64,064 | | | | 3,558 | | | | 25,183 | | | | 180 | | | | 85,869 | |
(Gain) loss on early extinguishment of debt | | | 10,800 | | | | – | | | | – | | | | – | | | | 10,800 | | | | 5,471 | | | | – | | | | 2,355 | | | | – | | | | 7,826 | |
Noncontrolling interest in earnings before depreciation and amortization | | | – | | | | – | | | | – | | | | – | | | | – | | | | 1,494 | | | | 1,494 | | | | – | | | | – | | | | – | |
Add: Pre-Tax EBDT from discontinued operations | | | – | | | | – | | | | – | | | | – | | | | – | | | | 651 | | | | – | | | | – | | | | (651 | ) | | | – | |
Pre-Tax EBDT | | | (33,693 | ) | | | – | | | | – | | | | – | | | | (33,693 | ) | | | 60,114 | | | | – | | | | – | | | | – | | | | 60,114 | |
Income tax expense (benefit) | | | (10,592 | ) | | | – | | | | – | | | | – | | | | (10,592 | ) | | | (10,592 | ) | | | – | | | | – | | | | – | | | | (10,592 | ) |
Earnings before depreciation, amortization and deferred taxes (EBDT) | | $ | (23,101 | ) | | $ | – | | | $ | – | | | $ | – | | | $ | (23,101 | ) | | $ | 70,706 | | | $ | – | | | $ | – | | | $ | – | | | $ | 70,706 | |
Reconciliation to net earnings: | | | | | | | | | | | | | | | | | | | | | | | | | | | | | | | | | | | | | | | | |
Earnings before depreciation, amortization and deferred taxes (EBDT) | | $ | (23,101 | ) | | $ | – | | | $ | – | | | $ | – | | | $ | (23,101 | ) | | $ | 70,706 | | | $ | – | | | $ | – | | | $ | – | | | $ | 70,706 | |
Depreciation and amortization – Real Estate Groups | | | – | | | | – | | | | – | | | | – | | | | – | | | | (68,691 | ) | | | – | | | | – | | | | (238 | ) | | | (68,929 | ) |
Amortization of mortgage procurement costs – Real Estate Groups | | | – | | | | – | | | | – | | | | – | | | | – | | | | (3,331 | ) | | | – | | | | – | | | | (84 | ) | | | (3,415 | ) |
Straight-line rent adjustment | | | – | | | | – | | | | – | | | | – | | | | – | | | | (2,714 | ) | | | – | | | | – | | | | 217 | | | | (2,497 | ) |
Preference payment | | | – | | | | – | | | | – | | | | – | | | | – | | | | (586 | ) | | | – | | | | – | | | | – | | | | (586 | ) |
Gain on disposition of rental properties and partial interests in rental properties, net of noncontrolling interest | | | – | | | | – | | | | – | | | | – | | | | – | | | | – | | | | – | | | | – | | | | 29,899 | | | | 29,899 | |
Gain on disposition of unconsolidated entities | | | – | | | | – | | | | – | | | | – | | | | – | | | | – | | | | – | | | | – | | | | – | | | | – | |
Impairment of consolidated and unconsolidated real estate | | | – | | | | – | | | | – | | | | – | | | | – | | | | (235 | ) | | | – | | | | – | | | | – | | | | (235 | ) |
Discontinued operations: | | | | | | | | | | | | | | | | | | | | | | | | | | | | | | | | | | | | | | | | |
Depreciation and amortization – Real Estate Groups | | | – | | | | – | | | | – | | | | – | | | | – | | | | (238 | ) | | | – | | | | – | | | | 238 | | | | – | |
Amortization of mortgage procurement costs – Real Estate Groups | | | – | | | | – | | | | – | | | | – | | | | – | | | | (84 | ) | | | – | | | | – | | | | 84 | | | | – | |
Straight-line rent adjustment | | | – | | | | – | | | | – | | | | – | | | | – | | | | 217 | | | | – | | | | – | | | | (217 | ) | | | – | |
Gain on disposition of rental properties | | | – | | | | – | | | | – | | | | – | | | | – | | | | 29,899 | | | | – | | | | – | | | | (29,899 | ) | | | – | |
Tax (expense) benefit: | | | | | | | | | | | | | | | | | | | | | | | | | | | | | | | | | | | | | | | | |
Deferred taxes | | | (6,353 | ) | | | – | | | | – | | | | – | | | | (6,353 | ) | | | (6,353 | ) | | | – | | | | – | | | | – | | | | (6,353 | ) |
Gain (loss) on disposition of rental properties and partial interest in rental properties | | | (10,456 | ) | | | – | | | | – | | | | – | | | | (10,456 | ) | | | (10,456 | ) | | | – | | | | – | | | | – | | | | (10,456 | ) |
Net earnings (loss) attributable to Forest City Enterprises, Inc. | | $ | (39,910 | ) | | $ | – | | | $ | – | | | $ | – | | | $ | (39,910 | ) | | $ | 8,134 | | | $ | – | | | $ | – | | | $ | – | | | $ | 8,134 | |
Preferred dividends | | | (3,850 | ) | | | – | | | | – | | | | – | | | | (3,850 | ) | | | (3,850 | ) | | | – | | | | – | | | | – | | | | (3,850 | ) |
Net earnings (loss) attributable to Forest City Enterprises, Inc. common shareholders | | $ | (43,760 | ) | | $ | – | | | $ | – | | | $ | – | | | $ | (43,760 | ) | | $ | 4,284 | | | $ | – | | | $ | – | | | $ | – | | | $ | 4,284 | |
47
Forest City Enterprises, Inc. and Subsidiaries
Supplemental Financial Information
Summary of Earnings Before Depreciation, Amortization and Deferred Taxes (EBDT) – Six Months Ended July 31, 2011(in thousands)
| | | | | | | | | | | | | | | | | | | | | | | | | | | | | | | | | | | | | | | | |
| | | Commercial Group 2011 | | | Residential Group 2011 | |
| | | Full Consolidation (GAAP) | | | Less Noncontrolling Interest | | | Plus Unconsolidated Investments at Pro-Rata | | | Plus Discontinued Operations | | | Pro-Rata Consolidation (Non-GAAP) | | | Full Consolidation (GAAP) | | | Less Noncontrolling Interest | | | Plus Unconsolidated Investments at Pro-Rata | | | Plus Discontinued Operations | | | Pro-Rata Consolidation (Non-GAAP) | |
Revenues from real estate operations | | $ | 434,648 | | | $ | 19,516 | | | $ | 100,499 | | | $ | 6,593 | | | $ | 522,224 | | | $ | 111,029 | | | $ | 4,302 | | | $ | 72,341 | | | $ | – | | | $ | 179,068 | |
Exclude straight-line rent adjustment | | | (1,400 | ) | | | – | | | | – | | | | (571 | ) | | | (1,971 | ) | | | (62 | ) | | | – | | | | – | | | | – | | | | (62 | ) |
Adjusted revenues | | | 433,248 | | | | 19,516 | | | | 100,499 | | | | 6,022 | | | | 520,253 | | | | 110,967 | | | | 4,302 | | | | 72,341 | | | | – | | | | 179,006 | |
Add interest and other income | | | 14,455 | | | | (338 | ) | | | 69 | | | | – | | | | 14,862 | | | | 10,874 | | | | 291 | | | | 372 | | | | – | | | | 10,955 | |
Add equity in earnings (loss) of unconsolidated entities, including impairment | | | 6,767 | | | | – | | | | (6,767 | ) | | | – | | | | – | | | | 18,646 | | | | 190 | | | | (18,253 | ) | | | – | | | | 203 | |
Exclude gain on disposition of unconsolidated entities | | | – | | | | – | | | | – | | | | – | | | | – | | | | (12,567 | ) | | | – | | | | 12,567 | | | | – | | | | – | |
Exclude depreciation and amortization of unconsolidated entities | | | 19,063 | | | | – | | | | (19,063 | ) | | | – | | | | – | | | | 11,830 | | | | – | | | | (11,830 | ) | | | – | | | | – | |
Adjusted total income | | | 473,533 | | | | 19,178 | | | | 74,738 | | | | 6,022 | | | | 535,115 | | | | 139,750 | | | | 4,783 | | | | 55,197 | | | | – | | | | 190,164 | |
Operating expenses | | | 202,300 | | | | 11,481 | | | | 44,348 | | | | 2,944 | | | | 238,111 | | | | 76,536 | | | | 2,803 | | | | 35,144 | | | | – | | | | 108,877 | |
Non-Real Estate depreciation and amortization and amortization of mortgage procurement costs | | | 389 | | | | – | | | | – | | | | – | | | | 389 | | | | 243 | | | | – | | | | – | | | | – | | | | 243 | |
Exclude straight-line rent adjustment | | | (2,369 | ) | | | – | | | | – | | | | – | | | | (2,369 | ) | | | 63 | | | | – | | | | – | | | | – | | | | 63 | |
Exclude preference payment | | | (1,171 | ) | | | – | | | | – | | | | – | | | | (1,171 | ) | | | – | | | | – | | | | – | | | | – | | | | – | |
Adjusted operating expenses | | | 199,149 | | | | 11,481 | | | | 44,348 | | | | 2,944 | | | | 234,960 | | | | 76,842 | | | | 2,803 | | | | 35,144 | | | | – | | | | 109,183 | |
Net operating income | | | 274,384 | | | | 7,697 | | | | 30,390 | | | | 3,078 | | | | 300,155 | | | | 62,908 | | | | 1,980 | | | | 20,053 | | | | – | | | | 80,981 | |
Interest expense | | | 87,417 | | | | 6,103 | | | | 30,371 | | | | 712 | | | | 112,397 | | | | 15,254 | | | | 1,083 | | | | 17,717 | | | | – | | | | 31,888 | |
(Gain) loss on early extinguishment of debt | | | (5,033 | ) | | | 4 | | | | 19 | | | | – | | | | (5,018 | ) | | | – | | | | – | | | | 2,336 | | | | – | | | | 2,336 | |
Noncontrolling interest in earnings before depreciation and amortization | | | 1,590 | | | | 1,590 | | | | – | | | | – | | | | – | | | | 897 | | | | 897 | | | | – | | | | – | | | | – | |
Add: Pre-Tax EBDT from discontinued operations | | | 2,366 | | | | – | | | | – | | | | (2,366 | ) | | | – | | | | – | | | | – | | | | – | | | | – | | | | – | |
Pre-Tax EBDT | | | 192,776 | | | | – | | | | – | | | | – | | | | 192,776 | | | | 46,757 | | | | – | | | | – | | | | – | | | | 46,757 | |
Income tax expense (benefit) | | | – | | | | – | | | | – | | | | – | | | | – | | | | – | | | | – | | | | – | | | | – | | | | – | |
Earnings before depreciation, amortization and deferred taxes (EBDT) | | $ | 192,776 | | | $ | – | | | $ | – | | | $ | – | | | $ | 192,776 | | | $ | 46,757 | | | $ | – | | | $ | – | | | $ | – | | | $ | 46,757 | |
Reconciliation to net earnings: | | | | | | | | | | | | | | | | | | | | | | | | | | | | | | | | | | | | | | | | |
Earnings before depreciation, amortization and deferred taxes (EBDT) | | $ | 192,776 | | | $ | – | | | $ | – | | | $ | – | | | $ | 192,776 | | | $ | 46,757 | | | $ | – | | | $ | – | | | $ | – | | | $ | 46,757 | |
Depreciation and amortization – Real Estate Groups | | | (99,074 | ) | | | – | | | | – | | | | (1,030 | ) | | | (100,104 | ) | | | (37,501 | ) | | | – | | | | – | | | | – | | | | (37,501 | ) |
Amortization of mortgage procurement costs – Real Estate Groups | | | (4,842 | ) | | | – | | | | – | | | | (333 | ) | | | (5,175 | ) | | | (1,726 | ) | | | – | | | | – | | | | – | | | | (1,726 | ) |
Straight-line rent adjustment | | | (969 | ) | | | – | | | | – | | | | 571 | | | | (398 | ) | | | 125 | | | | – | | | | – | | | | – | | | | 125 | |
Preference payment | | | (1,171 | ) | | | – | | | | – | | | | – | | | | (1,171 | ) | | | – | | | | – | | | | – | | | | – | | | | – | |
Gain on disposition of rental properties and partial interests in rental properties, net of noncontrolling interest | | | 9,561 | | | | – | | | | – | | | | 39,937 | | | | 49,498 | | | | – | | | | – | | | | 12,567 | | | | – | | | | 12,567 | |
Gain on disposition of unconsolidated entities | | | – | | | | – | | | | – | | | | – | | | | – | | | | 12,567 | | | | – | | | | (12,567 | ) | | | – | | | | – | |
Impairment of consolidated and unconsolidated real estate | | | (3,435 | ) | | | – | | | | – | | | | – | | | | (3,435 | ) | | | (235 | ) | | | – | | | | – | | | | – | | | | (235 | ) |
Discontinued operations: | | | | | | | | | | | | | | | | | | | | | | | | | | | | | | | | | | | | | | | | |
Depreciation and amortization – Real Estate Groups | | | (1,030 | ) | | | – | | | | – | | | | 1,030 | | | | – | | | | – | | | | – | | | | – | | | | – | | | | – | |
Amortization of mortgage procurement costs – Real Estate Groups | | | (333 | ) | | | – | | | | – | | | | 333 | | | | – | | | | – | | | | – | | | | – | | | | – | | | | – | |
Straight-line rent adjustment | | | 571 | | | | – | | | | – | | | | (571 | ) | | | – | | | | – | | | | – | | | | – | | | | – | | | | – | |
Gain on disposition of rental properties | | | 39,937 | | | | – | | | | – | | | | (39,937 | ) | | | – | | | | – | | | | – | | | | – | | | | – | | | | – | |
Net earnings (loss) attributable to Forest City Enterprises, Inc. | | $ | 131,991 | | | $ | – | | | $ | – | | | $ | – | | | $ | 131,991 | | | $ | 19,987 | | | $ | – | | | $ | – | | | $ | – | | | $ | 19,987 | |
48
Forest City Enterprises, Inc. and Subsidiaries
Supplemental Financial Information
Summary of Earnings Before Depreciation, Amortization and Deferred Taxes (EBDT) – Six Months Ended July 31, 2011(in thousands) (continued)
| | | | | | | | | | | | | | | | | | | | | | | | | | | | | | | | | | | | | | | | |
| | | Land Development Group 2011 | | | The Nets 2011 | |
| | | Full Consolidation (GAAP) | | | Less Noncontrolling Interest | | | Plus Unconsolidated Investments at Pro-Rata | | | Plus Discontinued Operations | | | Pro-Rata Consolidation (Non-GAAP) | | | Full Consolidation (GAAP) | | | Less Noncontrolling Interest | | | Plus Unconsolidated Investments at Pro-Rata | | | Plus Discontinued Operations | | | Pro-Rata Consolidation (Non-GAAP) | |
Revenues from real estate operations | | $ | 15,952 | | | $ | 1,050 | | | $ | 4,517 | | | $ | – | | | $ | 19,419 | | | $ | – | | | $ | – | | | $ | – | | | $ | – | | | $ | – | |
Exclude straight-line rent adjustment | | | – | | | | – | | | | – | | | | – | | | | – | | | | – | | | | – | | | | – | | | | – | | | | – | |
Adjusted revenues | | | 15,952 | | | | 1,050 | | | | 4,517 | | | | – | | | | 19,419 | | | | – | | | | – | | | | – | | | | – | | | | – | |
Add interest and other income | | | 5,394 | | | | 441 | | | | (56 | ) | | | – | | | | 4,897 | | | | – | | | | – | | | | – | | | | – | | | | – | |
Add equity in earnings (loss) of unconsolidated entities, including impairment | | | 652 | | | | – | | | | (871 | ) | | | – | | | | (219 | ) | | | (3,686 | ) | | | – | | | | – | | | | – | | | | (3,686 | ) |
Exclude gain on disposition of unconsolidated entities | | | – | | | | – | | | | – | | | | – | | | | – | | | | – | | | | – | | | | – | | | | – | | | | – | |
Exclude depreciation and amortization of unconsolidated entities | | | 159 | | | | – | | | | (159 | ) | | | – | | | | – | | | | – | | | | – | | | | – | | | | – | | | | – | |
Adjusted total income | | | 22,157 | | | | 1,491 | | | | 3,431 | | | | – | | | | 24,097 | | | | (3,686 | ) | | | – | | | | – | | | | – | | | | (3,686 | ) |
Operating expenses | | | 19,418 | | | | 1,057 | | | | 3,229 | | | | – | | | | 21,590 | | | | – | | | | – | | | | – | | | | – | | | | – | |
Non-Real Estate depreciation and amortization and amortization of mortgage procurement costs | | | 47 | | | | – | | | | – | | | | – | | | | 47 | | | | – | | | | – | | | | – | | | | – | | | | – | |
Exclude straight-line rent adjustment | | | – | | | | – | | | | – | | | | – | | | | – | | | | – | | | | – | | | | – | | | | – | | | | – | |
Exclude preference payment | | | – | | | | – | | | | – | | | | – | | | | – | | | | – | | | | – | | | | – | | | | – | | | | – | |
Adjusted operating expenses | | | 19,465 | | | | 1,057 | | | | 3,229 | | | | – | | | | 21,637 | | | | – | | | | – | | | | – | | | | – | | | | – | |
Net operating income | | | 2,692 | | | | 434 | | | | 202 | | | | – | | | | 2,460 | | | | (3,686 | ) | | | – | | | | – | | | | – | | | | (3,686 | ) |
Interest expense | | | 1,600 | | | | 234 | | | | 202 | | | | – | | | | 1,568 | | | | – | | | | – | | | | – | | | | – | | | | – | |
(Gain) loss on early extinguishment of debt | | | – | | | | – | | | | – | | | | – | | | | – | | | | – | | | | – | | | | – | | | | – | | | | – | |
Noncontrolling interest in earnings before depreciation and amortization | | | 200 | | | | 200 | | | | – | | | | – | | | | – | | | | – | | | | – | | | | – | | | | – | | | | – | |
Add: Pre-Tax EBDT from discontinued operations | | | – | | | | – | | | | – | | | | – | | | | – | | | | – | | | | – | | | | – | | | | – | | | | – | |
Pre-Tax EBDT | | | 892 | | | | – | | | | – | | | | – | | | | 892 | | | | (3,686 | ) | | | – | | | | – | | | | – | | | | (3,686 | ) |
Income tax expense (benefit) | | | – | | | | – | | | | – | | | | – | | | | – | | | | – | | | | – | | | | – | | | | – | | | | – | |
Earnings before depreciation, amortization and deferred taxes (EBDT) | | $ | 892 | | | $ | – | | | $ | – | | | $ | – | | | $ | 892 | | | $ | (3,686 | ) | | $ | – | | | $ | – | | | $ | – | | | $ | (3,686 | ) |
Reconciliation to net earnings: | | | | | | | | | | | | | | | | | | | | | | | | | | | | | | | | | | | | | | | | |
Earnings before depreciation, amortization and deferred taxes (EBDT) | | $ | 892 | | | $ | – | | | $ | – | | | $ | – | | | $ | 892 | | | $ | (3,686 | ) | | $ | – | | | $ | – | | | $ | – | | | $ | (3,686 | ) |
Depreciation and amortization – Real Estate Groups | | | (153 | ) | | | – | | | | – | | | | – | | | | (153 | ) | | | – | | | | – | | | | – | | | | – | | | | – | |
Amortization of mortgage procurement costs – Real Estate Groups | | | (146 | ) | | | – | | | | – | | | | – | | | | (146 | ) | | | – | | | | – | | | | – | | | | – | | | | – | |
Straight-line rent adjustment | | | – | | | | – | | | | – | | | | – | | | | – | | | | – | | | | – | | | | – | | | | – | | | | – | |
Preference payment | | | – | | | | – | | | | – | | | | – | | | | – | | | | – | | | | – | | | | – | | | | – | | | | – | |
Gain on disposition of rental properties and partial interests in rental properties, net of noncontrolling interest | | | – | | | | – | | | | – | | | | – | | | | – | | | | – | | | | – | | | | – | | | | – | | | | – | |
Gain on disposition of unconsolidated entities | | | – | | | | – | | | | – | | | | – | | | | – | | | | – | | | | – | | | | – | | | | – | | | | – | |
Impairment of consolidated and unconsolidated real estate | | | (1,400 | ) | | | – | | | | – | | | | – | | | | (1,400 | ) | | | – | | | | – | | | | – | | | | – | | | | – | |
Discontinued operations: | | | | | | | | | | | | | | | | | | | | | | | | | | | | | | | | | | | | | | | | |
Depreciation and amortization – Real Estate Groups | | | – | | | | – | | | | – | | | | – | | | | – | | | | – | | | | – | | | | – | | | | – | | | | – | |
Amortization of mortgage procurement costs – Real Estate Groups | | | – | | | | – | | | | – | | | | – | | | | – | | | | – | | | | – | | | | – | | | | – | | | | – | |
Straight-line rent adjustment | | | – | | | | – | | | | – | | | | – | | | | – | | | | – | | | | – | | | | – | | | | – | | | | – | |
Gain on disposition of rental properties | | | – | | | | – | | | | – | | | | – | | | | – | | | | – | | | | – | | | | – | | | | – | | | | – | |
Net earnings (loss) attributable to Forest City Enterprises, Inc. | | $ | (807 | ) | | $ | – | | | $ | – | | | $ | – | | | $ | (807 | ) | | $ | (3,686 | ) | | $ | – | | | $ | – | | | $ | – | | | $ | (3,686 | ) |
49
Forest City Enterprises, Inc. and Subsidiaries
Supplemental Financial Information
Summary of Earnings Before Depreciation, Amortization and Deferred Taxes (EBDT) – Six Months Ended July 31, 2011(in thousands)(continued)
| | | | | | | | | | | | | | | | | | | | | | | | | | | | | | | | | | | | | | | | |
| | | Corporate Activities 2011 | | | Total 2011 | |
| | | Full
Consolidation
(GAAP) | | | Less
Noncontrolling
Interest | | | Plus
Unconsolidated
Investments at
Pro-Rata | | | Plus
Discontinued
Operations | | | Pro-Rata
Consolidation
(Non-GAAP) | | | Full
Consolidation
(GAAP) | | | Less
Noncontrolling
Interest | | | Plus
Unconsolidated
Investments at
Pro-Rata | | | Plus
Discontinued
Operations | | | Pro-Rata
Consolidation
(Non-GAAP) | |
Revenues from real estate operations | | $ | – | | | $ | – | | | $ | – | | | $ | – | | | $ | – | | | $ | 561,629 | | | $ | 24,868 | | | $ | 177,357 | | | $ | 6,593 | | | $ | 720,711 | |
Exclude straight-line rent adjustment | | | – | | | | – | | | | – | | | | – | | | | – | | | | (1,462 | ) | | | – | | | | – | | | | (571 | ) | | | (2,033 | ) |
Adjusted revenues | | | – | | | | – | | | | – | | | | – | | | | – | | | | 560,167 | | | | 24,868 | | | | 177,357 | | | | 6,022 | | | | 718,678 | |
Add interest and other income | | | 99 | | | | – | | | | – | | | | – | | | | 99 | | | | 30,822 | | | | 394 | | | | 385 | | | | – | | | | 30,813 | |
Add equity in earnings (loss) of unconsolidated entities, including impairment | | | – | | | | – | | | | – | | | | – | | | | – | | | | 22,379 | | | | 190 | | | | (25,891 | ) | | | – | | | | (3,702 | ) |
Exclude gain on disposition of unconsolidated entities | | | – | | | | – | | | | – | | | | – | | | | – | | | | (12,567 | ) | | | – | | | | 12,567 | | | | – | | | | – | |
Exclude depreciation and amortization of unconsolidated entities | | | – | | | | – | | | | – | | | | – | | | | – | | | | 31,052 | | | | – | | | | (31,052 | ) | | | – | | | | – | |
Adjusted total income | | | 99 | | | | – | | | | – | | | | – | | | | 99 | | | | 631,853 | | | | 25,452 | | | | 133,366 | | | | 6,022 | | | | 745,789 | |
Operating expenses | | | 24,425 | | | | – | | | | – | | | | – | | | | 24,425 | | | | 322,679 | | | | 15,341 | | | | 82,721 | | | | 2,944 | | | | 393,003 | |
Non-Real Estate depreciation and amortization and amortization of mortgage procurement costs | | | 709 | | | | – | | | | – | | | | – | | | | 709 | | | | 1,388 | | | | – | | | | – | | | | – | | | | 1,388 | |
Exclude straight-line rent adjustment | | | – | | | | – | | | | – | | | | – | | | | – | | | | (2,306 | ) | | | – | | | | – | | | | – | | | | (2,306 | ) |
Exclude preference payment | | | – | | | | – | | | | – | | | | – | | | | – | | | | (1,171 | ) | | | – | | | | – | | | | – | | | | (1,171 | ) |
Adjusted operating expenses | | | 25,134 | | | | – | | | | – | | | | – | | | | 25,134 | | | | 320,590 | | | | 15,341 | | | | 82,721 | | | | 2,944 | | | | 390,914 | |
Net operating income | | | (25,035 | ) | | | – | | | | – | | | | – | | | | (25,035 | ) | | | 311,263 | | | | 10,111 | | | | 50,645 | | | | 3,078 | | | | 354,875 | |
Interest expense | | | 26,708 | | | | – | | | | – | | | | – | | | | 26,708 | | | | 130,979 | | | | 7,420 | | | | 48,290 | | | | 712 | | | | 172,561 | |
(Gain) loss on early extinguishment of debt | | | 10,800 | | | | – | | | | – | | | | – | | | | 10,800 | | | | 5,767 | | | | 4 | | | | 2,355 | | | | – | | | | 8,118 | |
Noncontrolling interest in earnings before depreciation and amortization | | | – | | | | – | | | | – | | | | – | | | | – | | | | 2,687 | | | | 2,687 | | | | – | | | | – | | | | – | |
Add: Pre-Tax EBDT from discontinued operations | | | – | | | | – | | | | – | | | | – | | | | – | | | | 2,366 | | | | – | | | | – | | | | (2,366 | ) | | | – | |
Pre-Tax EBDT | | | (62,543 | ) | | | – | | | | – | | | | – | | | | (62,543 | ) | | | 174,196 | | | | – | | | | – | | | | – | | | | 174,196 | |
Income tax expense (benefit) | | | (23,886 | ) | | | – | | | | – | | | | – | | | | (23,886 | ) | | | (23,886 | ) | | | – | | | | – | | | | – | | | | (23,886 | ) |
Earnings before depreciation, amortization and deferred taxes (EBDT) | | $ | (38,657 | ) | | $ | – | | | $ | – | | | $ | – | | | $ | (38,657 | ) | | $ | 198,082 | | | $ | – | | | $ | – | | | $ | – | | | $ | 198,082 | |
Reconciliation to net earnings: | | | | | | | | | | | | | | | | | | | | | | | | | | | | | | | | | | | | | | | | |
Earnings before depreciation, amortization and deferred taxes (EBDT) | | $ | (38,657 | ) | | $ | – | | | $ | – | | | $ | – | | | $ | (38,657 | ) | | $ | 198,082 | | | $ | – | | | $ | – | | | $ | – | | | $ | 198,082 | |
Depreciation and amortization – Real Estate Groups | | | – | | | | – | | | | – | | | | – | | | | – | | | | (136,728 | ) | | | – | | | | – | | | | (1,030 | ) | | | (137,758 | ) |
Amortization of mortgage procurement costs – Real Estate Groups | | | – | | | | – | | | | – | | | | – | | | | – | | | | (6,714 | ) | | | – | | | | – | | | | (333 | ) | | | (7,047 | ) |
Straight-line rent adjustment | | | – | | | | – | | | | – | | | | – | | | | – | | | | (844 | ) | | | – | | | | – | | | | 571 | | | | (273 | ) |
Preference payment | | | – | | | | – | | | | – | | | | – | | | | – | | | | (1,171 | ) | | | – | | | | – | | | | – | | | | (1,171 | ) |
Gain on disposition of rental properties and partial interests in rental properties, net of noncontrolling interest | | | – | | | | – | | | | – | | | | – | | | | – | | | | 9,561 | | | | – | | | | 12,567 | | | | 39,937 | | | | 62,065 | |
Gain on disposition of unconsolidated entities | | | – | | | | – | | | | – | | | | – | | | | – | | | | 12,567 | | | | – | | | | (12,567 | ) | | | – | | | | – | |
Impairment of consolidated and unconsolidated real estate | | | – | | | | – | | | | – | | | | – | | | | – | | | | (5,070 | ) | | | – | | | | – | | | | – | | | | (5,070 | ) |
Discontinued operations: | | | | | | | | | | | | | | | | | | | | | | | | | | | | | | | | | | | | | | | | |
Depreciation and amortization – Real Estate Groups | | | – | | | | – | | | | – | | | | – | | | | – | | | | (1,030 | ) | | | – | | | | – | | | | 1,030 | | | | – | |
Amortization of mortgage procurement costs – Real Estate Groups | | | – | | | | – | | | | – | | | | – | | | | – | | | | (333 | ) | | | – | | | | – | | | | 333 | | | | – | |
Straight-line rent adjustment | | | – | | | | – | | | | – | | | | – | | | | – | | | | 571 | | | | – | | | | – | | | | (571 | ) | | | – | |
Gain on disposition of rental properties | | | – | | | | – | | | | – | | | | – | | | | – | | | | 39,937 | | | | – | | | | – | | | | (39,937 | ) | | | – | |
Tax (expense) benefit: | | | | | | | | | | | | | | | | | | | | | | | | | | | | | | | | | | | | | | | | |
Deferred taxes | | | (11,166 | ) | | | – | | | | – | | | | – | | | | (11,166 | ) | | | (11,166 | ) | | | – | | | | – | | | | – | | | | (11,166 | ) |
Gain (loss) on disposition of rental properties and partial interest in rental properties | | | (41,961 | ) | | | – | | | | – | | | | – | | | | (41,961 | ) | | | (41,961 | ) | | | – | | | | – | | | | – | | | | (41,961 | ) |
Net earnings (loss) attributable to Forest City Enterprises, Inc. | | $ | (91,784 | ) | | $ | – | | | $ | – | | | $ | – | | | $ | (91,784 | ) | | $ | 55,701 | | | $ | – | | | $ | – | | | $ | – | | | $ | 55,701 | |
Preferred dividends | | | (7,700 | ) | | | – | | | | – | | | | – | | | | (7,700 | ) | | | (7,700 | ) | | | – | | | | – | | | | – | | | | (7,700 | ) |
Net earnings (loss) attributable to Forest City Enterprises, Inc. common shareholders | | $ | (99,484 | ) | | $ | – | | | $ | – | | | $ | – | | | $ | (99,484 | ) | | $ | 48,001 | | | $ | – | | | $ | – | | | $ | – | | | $ | 48,001 | |
50
Forest City Enterprises, Inc. and Subsidiaries
Supplemental Financial Information
Summary of Earnings Before Depreciation, Amortization and Deferred Taxes (EBDT) – Three Months Ended July 31, 2010(in thousands)(continued)
| | | | | | | | | | | | | | | | | | | | | | | | | | | | | | | | | | | | | | | | |
| | | Commercial Group 2010 | | | Residential Group 2010 | |
| | | Full
Consolidation
(GAAP) | | | Less
Noncontrolling
Interest | | | Plus
Unconsolidated
Investments at
Pro-Rata | | | Plus
Discontinued
Operations | | | Pro-Rata
Consolidation
(Non-GAAP) | | | Full
Consolidation
(GAAP) | | | Less
Noncontrolling
Interest | | | Plus
Unconsolidated
Investments at
Pro-Rata | | | Plus
Discontinued
Operations | | | Pro-Rata
Consolidation
(Non-GAAP) | |
Revenues from real estate operations | | $ | 234,813 | | | $ | 13,569 | | | $ | 40,333 | | | $ | 11,312 | | | $ | 272,889 | | | $ | 53,790 | | | $ | 884 | | | $ | 36,130 | | | $ | 1,084 | | | $ | 90,120 | |
Exclude straight-line rent adjustment | | | (5,140 | ) | | | – | | | | – | | | | (508 | ) | | | (5,648 | ) | | | (318 | ) | | | – | | | | – | | | | – | | | | (318 | ) |
Adjusted revenues | | | 229,673 | | | | 13,569 | | | | 40,333 | | | | 10,804 | | | | 267,241 | | | | 53,472 | | | | 884 | | | | 36,130 | | | | 1,084 | | | | 89,802 | |
Add interest and other income | | | 8,264 | | | | (210 | ) | | | (485 | ) | | | 1 | | | | 7,990 | | | | 5,668 | | | | 142 | | | | 353 | | | | 2 | | | | 5,881 | |
Add gain on disposition of partial interests in other investment – Nets | | | – | | | | – | | | | – | | | | – | | | | – | | | | – | | | | – | | | | – | | | | – | | | | – | |
Add equity in earnings (loss) of unconsolidated entities, including impairment | | | 1,962 | | | | – | | | | (1,961 | ) | | | – | | | | 1 | | | | 4,624 | | | | 118 | | | | (4,173 | ) | | | – | | | | 333 | |
Exclude gain (loss) on disposition of unconsolidated entities | | | 878 | | | | – | | | | (878 | ) | | | – | | | | – | | | | – | | | | – | | | | – | | | | – | | | | – | |
Exclude impairment of unconsolidated real estate | | | – | | | | – | | | | – | | | | – | | | | – | | | | – | | | | – | | | | – | | | | – | | | | – | |
Exclude depreciation and amortization of unconsolidated entities | | | 6,602 | | | | – | | | | (6,602 | ) | | | – | | | | – | | | | 6,191 | | | | – | | | | (6,191 | ) | | | – | | | | – | |
Adjusted total income | | | 247,379 | | | | 13,359 | | | | 30,407 | | | | 10,805 | | | | 275,232 | | | | 69,955 | | | | 1,144 | | | | 26,119 | | | | 1,086 | | | | 96,016 | |
Operating expenses | | | 119,342 | | | | 8,739 | | | | 20,156 | | | | 6,598 | | | | 137,357 | | | | 33,321 | | | | 215 | | | | 17,326 | | | | 835 | | | | 51,267 | |
Non-Real Estate depreciation and amortization and amortization of mortgage procurement costs | | | 418 | | | | – | | | | – | | | | – | | | | 418 | | | | 289 | | | | – | | | | – | | | | – | | | | 289 | |
Exclude straight-line rent adjustment | | | (1,418 | ) | | | – | | | | – | | | | – | | | | (1,418 | ) | | | 1 | | | | – | | | | – | | | | – | | | | 1 | |
Exclude preference payment | | | (586 | ) | | | – | | | | – | | | | – | | | | (586 | ) | | | – | | | | – | | | | – | | | | – | | | | – | |
Adjusted operating expenses | | | 117,756 | | | | 8,739 | | | | 20,156 | | | | 6,598 | | | | 135,771 | | | | 33,611 | | | | 215 | | | | 17,326 | | | | 835 | | | | 51,557 | |
Net operating income | | | 129,623 | | | | 4,620 | | | | 10,251 | | | | 4,207 | | | | 139,461 | | | | 36,344 | | | | 929 | | | | 8,793 | | | | 251 | | | | 44,459 | |
Interest expense | | | 59,924 | | | | 3,915 | | | | 10,251 | | | | 2,344 | | | | 68,604 | | | | 9,167 | | | | 178 | | | | 8,793 | | | | 11 | | | | 17,793 | |
Gain on early extinguishment of debt | | | – | | | | – | | | | – | | | | – | | | | – | | | | – | | | | – | | | | – | | | | – | | | | – | |
Noncontrolling interest in earnings before depreciation and amortization | | | 705 | | | | 705 | | | | – | | | | – | | | | – | | | | 751 | | | | 751 | | | | – | | | | – | | | | – | |
Add: Pre-Tax EBDT from discontinued operations | | | 1,863 | | | | – | | | | – | | | | (1,863 | ) | | | – | | | | 240 | | | | – | | | | – | | | | (240 | ) | | | – | |
Pre-Tax EBDT | | | 70,857 | | | | – | | | | – | | | | – | | | | 70,857 | | | | 26,666 | | | | – | | | | – | | | | – | | | | 26,666 | |
Income tax expense (benefit) | | | (1,163 | ) | | | – | | | | – | | | | – | | | | (1,163 | ) | | | 1,500 | | | | – | | | | – | | | | – | | | | 1,500 | |
Earnings before depreciation, amortization and deferred taxes (EBDT) | | $ | 72,020 | | | $ | – | | | $ | – | | | $ | – | | | $ | 72,020 | | | $ | 25,166 | | | $ | – | | | $ | – | | | $ | – | | | $ | 25,166 | |
Reconciliation to net earnings: | | | | | | | | | | | | | | | | | | | | | | | | | | | | | | | | | | | | | | | | |
Earnings before depreciation, amortization and deferred taxes (EBDT) | | $ | 72,020 | | | $ | – | | | $ | – | | | $ | – | | | $ | 72,020 | | | $ | 25,166 | | | $ | – | | | $ | – | | | $ | – | | | $ | 25,166 | |
Depreciation and amortization – Real Estate Groups | | | (48,979 | ) | | | – | | | | – | | | | (2,319 | ) | | | (51,298 | ) | | | (18,162 | ) | | | – | | | | – | | | | (254 | ) | | | (18,416 | ) |
Amortization of mortgage procurement costs – Real Estate Groups | | | (2,522 | ) | | | – | | | | – | | | | (421 | ) | | | (2,943 | ) | | | (601 | ) | | | – | | | | – | | | | (5 | ) | | | (606 | ) |
Deferred taxes – Real Estate Groups | | | (10,198 | ) | | | – | | | | – | | | | (227 | ) | | | (10,425 | ) | | | 26 | | | | – | | | | – | | | | (291 | ) | | | (265 | ) |
Straight-line rent adjustment | | | 3,722 | | | | – | | | | – | | | | 508 | | | | 4,230 | | | | 319 | | | | – | | | | – | | | | – | | | | 319 | |
Preference payment | | | (586 | ) | | | – | | | | – | | | | – | | | | (586 | ) | | | – | | | | – | | | | – | | | | – | | | | – | |
Gain (loss) on disposition of rental properties and partial interests in rental properties, net of tax | | | 125,047 | | | | – | | | | (536 | ) | | | – | | | | 124,511 | | | | 121 | | | | – | | | | – | | | | 1,099 | | | | 1,220 | |
Gain (loss) on disposition of unconsolidated entities, net of tax | | | (536 | ) | | | – | | | | 536 | | | | – | | | | – | | | | – | | | | – | | | | – | | | | – | | | | – | |
Impairment of consolidated and unconsolidated real estate, net of tax | | | – | | | | – | | | | – | | | | (27,800 | ) | | | (27,800 | ) | | | – | | | | – | | | | – | | | | – | | | | – | |
Impairment of unconsolidated real estate, net of tax | | | – | | | | – | | | | – | | | | – | | | | – | | | | – | | | | – | | | | – | | | | – | | | | – | |
Discontinued operations, net of tax: | | | | | | | | | | | | | | | | | | | | | | | | | | | | | | | | | | | | | | | | |
Depreciation and amortization – Real Estate Groups | | | (2,319 | ) | | | – | | | | – | | | | 2,319 | | | | – | | | | (254 | ) | | | – | | | | – | | | | 254 | | | | – | |
Amortization of mortgage procurement costs – Real Estate Groups | | | (421 | ) | | | – | | | | – | | | | 421 | | | | – | | | | (5 | ) | | | – | | | | – | | | | 5 | | | | – | |
Deferred taxes – Real Estate Groups | | | (227 | ) | | | – | | | | – | | | | 227 | | | | – | | | | (291 | ) | | | – | | | | – | | | | 291 | | | | – | |
Straight-line rent adjustment | | | 508 | | | | – | | | | – | | | | (508 | ) | | | – | | | | – | | | | – | | | | – | | | | – | | | | – | |
Gain on disposition of rental properties | | | – | | | | – | | | | – | | | | – | | | | – | | | | 1,099 | | | | – | | | | – | | | | (1,099 | ) | | | – | |
Impairment of consolidated and unconsolidated real estate | | | (27,800 | ) | | | – | | | | – | | | | 27,800 | | | | – | | | | – | | | | – | | | | – | | | | – | | | | – | |
Net earnings (loss) attributable to Forest City Enterprises, Inc. | | $ | 107,709 | | | $ | – | | | $ | – | | | $ | – | | | $ | 107,709 | | | $ | 7,418 | | | $ | – | | | $ | – | | | $ | – | | | $ | 7,418 | |
51
Forest City Enterprises, Inc. and Subsidiaries
Supplemental Financial Information
Summary of Earnings Before Depreciation, Amortization and Deferred Taxes (EBDT) – Three Months Ended July 31, 2010(in thousands)(continued)
| | | | | | | | | | | | | | | | | | | | | | | | | | | | | | | | | | | | | | | | |
| | | Land Development Group 2010 | | | The Nets 2010 | |
| | | Full
Consolidation
(GAAP) | | | Less
Noncontrolling
Interest | | | Plus
Unconsolidated
Investments at
Pro-Rata | | | Plus
Discontinued
Operations | | | Pro-Rata
Consolidation
(Non-GAAP) | | | Full
Consolidation
(GAAP) | | | Less
Noncontrolling
Interest | | | Plus
Unconsolidated
Investments at
Pro-Rata | | | Plus
Discontinued
Operations | | | Pro-Rata
Consolidation
(Non-GAAP) | |
Revenues from real estate operations | | $ | 5,618 | | | $ | 401 | | | $ | 3,699 | | | $ | – | | | $ | 8,916 | | | $ | – | | | $ | – | | | $ | – | | | $ | – | | | $ | – | |
Exclude straight-line rent adjustment | | | 7 | | | | – | | | | – | | | | – | | | | 7 | | | | – | | | | – | | | | – | | | | – | | | | – | |
Adjusted revenues | | | 5,625 | | | | 401 | | | | 3,699 | | | | – | | | | 8,923 | | | | – | | | | – | | | | – | | | | – | | | | – | |
Add interest and other income | | | 2,231 | | | | 201 | | | | 76 | | | | – | | | | 2,106 | | | | – | | | | – | | | | – | | | | – | | | | – | |
Add gain on disposition of partial interests in other investment – Nets | | | – | | | | – | | | | – | | | | – | | | | – | | | | 55,112 | | | | 23,675 | | | | – | | | | – | | | | 31,437 | |
Add equity in earnings (loss) of unconsolidated entities, including impairment | | | (421 | ) | | | – | | | | 1,022 | | | | – | | | | 601 | | | | (7,161 | ) | | | (20 | ) | | | – | | | | – | | | | (7,141 | ) |
Exclude gain (loss) on disposition of unconsolidated entities | | | – | | | | – | | | | – | | | | – | | | | – | | | | – | | | | – | | | | – | | | | – | | | | – | |
Exclude impairment of unconsolidated real estate | | | 2,282 | | | | – | | | | (2,282 | ) | | | – | | | | – | | | | – | | | | – | | | | – | | | | – | | | | – | |
Exclude depreciation and amortization of unconsolidated entities | | | 72 | | | | – | | | | (72 | ) | | | – | | | | – | | | | – | | | | – | | | | – | | | | – | | | | – | |
Adjusted total income | | | 9,789 | | | | 602 | | | | 2,443 | | | | – | | | | 11,630 | | | | 47,951 | | | | 23,655 | | | | – | | | | – | | | | 24,296 | |
Operating expenses | | | 7,423 | | | | 414 | | | | 2,325 | | | | – | | | | 9,334 | | | | – | | | | – | | | | – | | | | – | | | | – | |
Non-Real Estate depreciation and amortization and amortization of mortgage procurement costs | | | 39 | | | | – | | | | – | | | | – | | | | 39 | | | | – | | | | – | | | | – | | | | – | | | | – | |
Exclude straight-line rent adjustment | | | – | | | | – | | | | – | | | | – | | | | – | | | | – | | | | – | | | | – | | | | – | | | | – | |
Exclude preference payment | | | – | | | | – | | | | – | | | | – | | | | – | | | | – | | | | – | | | | – | | | | – | | | | – | |
Adjusted operating expenses | | | 7,462 | | | | 414 | | | | 2,325 | | | | – | | | | 9,373 | | | | – | | | | – | | | | – | | | | – | | | | – | |
Net operating income | | | 2,327 | | | | 188 | | | | 118 | | | | – | | | | 2,257 | | | | 47,951 | | | | 23,655 | | | | – | | | | – | | | | 24,296 | |
Interest expense | | | 25 | | | | 71 | | | | 118 | | | | – | | | | 72 | | | | – | | | | – | | | | – | | | | – | | | | – | |
Gain on early extinguishment of debt | | | – | | | | – | | | | – | | | | – | | | | – | | | | – | | | | – | | | | – | | | | – | | | | – | |
Noncontrolling interest in earnings before depreciation and amortization | | | 117 | | | | 117 | | | | – | | | | – | | | | – | | | | 23,655 | | | | 23,655 | | | | – | | | | – | | | | – | |
Add: Pre-Tax EBDT from discontinued operations | | | – | | | | – | | | | – | | | | – | | | | – | | | | – | | | | – | | | | – | | | | – | | | | – | |
Pre-Tax EBDT | | | 2,185 | | | | – | | | | – | | | | – | | | | 2,185 | | | | 24,296 | | | | – | | | | – | | | | – | | | | 24,296 | |
Income tax expense (benefit) | | | (673 | ) | | | – | | | | – | | | | – | | | | (673 | ) | | | 9,551 | | | | – | | | | – | | | | – | | | | 9,551 | |
Earnings before depreciation, amortization and deferred taxes (EBDT) | | $ | 2,858 | | | $ | – | | | $ | – | | | $ | – | | | $ | 2,858 | | | $ | 14,745 | | | $ | – | | | $ | – | | | $ | – | | | $ | 14,745 | |
Reconciliation to net earnings: | | | | | | | | | | | | | | | | | | | | | | | | | | | | | | | | | | | | | | | | |
Earnings before depreciation, amortization and deferred taxes (EBDT) | | $ | 2,858 | | | $ | – | | | $ | – | | | $ | – | | | $ | 2,858 | | | $ | 14,745 | | | $ | – | | | $ | – | | | $ | – | | | $ | 14,745 | |
Depreciation and amortization – Real Estate Groups | | | (75 | ) | | | – | | | | – | | | | – | | | | (75 | ) | | | – | | | | – | | | | – | | | | – | | | | – | |
Amortization of mortgage procurement costs – Real Estate Groups | | | (84 | ) | | | – | | | | – | | | | – | | | | (84 | ) | | | – | | | | – | | | | – | | | | – | | | | – | |
Deferred taxes – Real Estate Groups | | | (1,101 | ) | | | – | | | | – | | | | – | | | | (1,101 | ) | | | – | | | | – | | | | – | | | | – | | | | – | |
Straight-line rent adjustment | | | (7 | ) | | | – | | | | – | | | | – | | | | (7 | ) | | | – | | | | – | | | | – | | | | – | | | | – | |
Preference payment | | | – | | | | – | | | | – | | | | – | | | | – | | | | – | | | | – | | | | – | | | | – | | | | – | |
Gain (loss) on disposition of rental properties and partial interests in rental properties, net of tax | | | – | | | | – | | | | – | | | | – | | | | – | | | | – | | | | – | | | | – | | | | – | | | | – | |
Gain (loss) on disposition of unconsolidated entities, net of tax | | | – | | | | – | | | | – | | | | – | | | | – | | | | – | | | | – | | | | – | | | | – | | | | – | |
Impairment of consolidated and unconsolidated real estate, net of tax | | | (672 | ) | | | – | | | | (1,398 | ) | | | – | | | | (2,070 | ) | | | – | | | | – | | | | – | | | | – | | | | – | |
Impairment of unconsolidated real estate, net of tax | | | (1,398 | ) | | | – | | | | 1,398 | | | | – | | | | – | | | | – | | | | – | | | | – | | | | – | | | | – | |
Discontinued operations, net of tax: | | | | | | | | | | | | | | | | | | | | | | | | | | | | | | | | | | | | | | | | |
Depreciation and amortization – Real Estate Groups | | | – | | | | – | | | | – | | | | – | | | | – | | | | – | | | | – | | | | – | | | | – | | | | – | |
Amortization of mortgage procurement costs – Real Estate Groups | | | – | | | | – | | | | – | | | | – | | | | – | | | | – | | | | – | | | | – | | | | – | | | | – | |
Deferred taxes – Real Estate Groups | | | – | | | | – | | | | – | | | | – | | | | – | | | | – | | | | – | | | | – | | | | – | | | | – | |
Straight-line rent adjustment | | | – | | | | – | | | | – | | | | – | | | | – | | | | – | | | | – | | | | – | | | | – | | | | – | |
Gain on disposition of rental properties | | | – | | | | – | | | | – | | | | – | | | | – | | | | – | | | | – | | | | – | | | | – | | | | – | |
Impairment of consolidated and unconsolidated real estate | | | – | | | | – | | | | – | | | | – | | | | – | | | | – | | | | – | | | | – | | | | – | | | | – | |
Net earnings (loss) attributable to Forest City Enterprises, Inc. | | $ | (479 | ) | | $ | – | | | $ | – | | | $ | – | | | $ | (479 | ) | | $ | 14,745 | | | $ | – | | | $ | – | | | $ | – | | | $ | 14,745 | |
52
Forest City Enterprises, Inc. and Subsidiaries
Supplemental Financial Information
Summary of Earnings Before Depreciation, Amortization and Deferred Taxes (EBDT) – Three Months Ended July 31, 2010(in thousands)(continued)
| | | | | | | | | | | | | | | | | | | | | | | | | | | | | | | | | | | | | | | | |
| | | Corporate Activities 2010 | | | Total 2010 | |
| | | Full
Consolidation
(GAAP) | | | Less
Noncontrolling
Interest | | | Plus
Unconsolidated
Investments at
Pro-Rata | | | Plus
Discontinued
Operations | | | Pro-Rata
Consolidation
(Non-GAAP) | | | Full
Consolidation
(GAAP) | | | Less
Noncontrolling
Interest | | | Plus
Unconsolidated
Investments at
Pro-Rata | | | Plus
Discontinued
Operations | | | Pro-Rata
Consolidation
(Non-GAAP) | |
Revenues from real estate operations | | $ | – | | | $ | – | | | $ | – | | | $ | – | | | $ | – | | | $ | 294,221 | | | $ | 14,854 | | | $ | 80,162 | | | $ | 12,396 | | | $ | 371,925 | |
Exclude straight-line rent adjustment | | | – | | | | – | | | | – | | | | – | | | | – | | | | (5,451 | ) | | | – | | | | – | | | | (508 | ) | | | (5,959 | ) |
Adjusted revenues | | | – | | | | – | | | | – | | | | – | | | | – | | | | 288,770 | | | | 14,854 | | | | 80,162 | | | | 11,888 | | | | 365,966 | |
Add interest and other income | | | 68 | | | | – | | | | – | | | | – | | | | 68 | | | | 16,231 | | | | 133 | | | | (56 | ) | | | 3 | | | | 16,045 | |
Add gain on disposition of partial interests in other investment – Nets | | | – | | | | – | | | | – | | | | – | | | | – | | | | 55,112 | | | | 23,675 | | | | – | | | | – | | | | 31,437 | |
Add equity in earnings (loss) of unconsolidated entities, including impairment | | | – | | | | – | | | | – | | | | – | | | | – | | | | (996 | ) | | | 98 | | | | (5,112 | ) | | | – | | | | (6,206 | ) |
Exclude gain (loss) on disposition of unconsolidated entities | | | – | | | | – | | | | – | | | | – | | | | – | | | | 878 | | | | – | | | | (878 | ) | | | – | | | | – | |
Exclude impairment of unconsolidated real estate | | | – | | | | – | | | | – | | | | – | | | | – | | | | 2,282 | | | | – | | | | (2,282 | ) | | | – | | | | – | |
Exclude depreciation and amortization of unconsolidated entities | | | – | | | | – | | | | – | | | | – | | | | – | | | | 12,865 | | | | – | | | | (12,865 | ) | | | – | | | | – | |
Adjusted total income | | | 68 | | | | – | | | | – | | | | – | | | | 68 | | | | 375,142 | | | | 38,760 | | | | 58,969 | | | | 11,891 | | | | 407,242 | |
Operating expenses | | | 9,430 | | | | – | | | | – | | | | – | | | | 9,430 | | | | 169,516 | | | | 9,368 | | | | 39,807 | | | | 7,433 | | | | 207,388 | |
Non-Real Estate depreciation and amortization and amortization of mortgage procurement costs | | | 439 | | | | – | | | | – | | | | – | | | | 439 | | | | 1,185 | | | | – | | | | – | | | | – | | | | 1,185 | |
Exclude straight-line rent adjustment | | | – | | | | – | | | | – | | | | – | | | | – | | | | (1,417 | ) | | | – | | | | – | | | | – | | | | (1,417 | ) |
Exclude preference payment | | | – | | | | – | | | | – | | | | – | | | | – | | | | (586 | ) | | | – | | | | – | | | | – | | | | (586 | ) |
Adjusted operating expenses | | | 9,869 | | | | – | | | | – | | | | – | | | | 9,869 | | | | 168,698 | | | | 9,368 | | | | 39,807 | | | | 7,433 | | | | 206,570 | |
Net operating income | | | (9,801 | ) | | | – | | | | – | | | | – | | | | (9,801 | ) | | | 206,444 | | | | 29,392 | | | | 19,162 | | | | 4,458 | | | | 200,672 | |
Interest expense | | | 15,679 | | | | – | | | | – | | | | – | | | | 15,679 | | | | 84,795 | | | | 4,164 | | | | 19,162 | | | | 2,355 | | | | 102,148 | |
Gain on early extinguishment of debt | | | (1,896 | ) | | | – | | | | – | | | | – | | | | (1,896 | ) | | | (1,896 | ) | | | – | | | | – | | | | – | | | | (1,896 | ) |
Noncontrolling interest in earnings before depreciation and amortization | | | – | | | | – | | | | – | | | | – | | | | – | | | | 25,228 | | | | 25,228 | | | | – | | | | – | | | | – | |
Add: Pre-Tax EBDT from discontinued operations | | | – | | | | – | | | | – | | | | – | | | | – | | | | 2,103 | | | | – | | | | – | | | | (2,103 | ) | | | – | |
Pre-Tax EBDT | | | (23,584 | ) | | | – | | | | – | | | | – | | | | (23,584 | ) | | | 100,420 | | | | – | | | | – | | | | – | | | | 100,420 | |
Income tax expense (benefit) | | | (14,355 | ) | | | – | | | | – | | | | – | | | | (14,355 | ) | | | (5,140 | ) | | | – | | | | – | | | | – | | | | (5,140 | ) |
Earnings before depreciation, amortization and deferred taxes (EBDT) | | $ | (9,229 | ) | | $ | – | | | $ | – | | | $ | – | | | $ | (9,229 | ) | | $ | 105,560 | | | $ | – | | | $ | – | | | $ | – | | | $ | 105,560 | |
Reconciliation to net earnings: | | | | | | | | | | | | | | | | | | | | | | | | | | | | | | | | | | | | | | | | |
Earnings before depreciation, amortization and deferred taxes (EBDT) | | $ | (9,229 | ) | | $ | – | | | $ | – | | | $ | – | | | $ | (9,229 | ) | | $ | 105,560 | | | $ | – | | | $ | – | | | $ | – | | | $ | 105,560 | |
Depreciation and amortization – Real Estate Groups | | | – | | | | – | | | | – | | | | – | | | | – | | | | (67,216 | ) | | | – | | | | – | | | | (2,573 | ) | | | (69,789 | ) |
Amortization of mortgage procurement costs – Real Estate Groups | | | – | | | | – | | | | – | | | | – | | | | – | | | | (3,207 | ) | | | – | | | | – | | | | (426 | ) | | | (3,633 | ) |
Deferred taxes – Real Estate Groups | | | 2,682 | | | | – | | | | – | | | | – | | | | 2,682 | | | | (8,591 | ) | | | – | | | | – | | | | (518 | ) | | | (9,109 | ) |
Straight-line rent adjustment | | | – | | | | – | | | | – | | | | – | | | | – | | | | 4,034 | | | | – | | | | – | | | | 508 | | | | 4,542 | |
Preference payment | | | – | | | | – | | | | – | | | | – | | | | – | | | | (586 | ) | | | – | | | | – | | | | – | | | | (586 | ) |
Gain (loss) on disposition of rental properties and partial interests in rental properties, net of tax | | | – | | | | – | | | | – | | | | – | | | | – | | | | 125,168 | | | | – | | | | (536 | ) | | | 1,099 | | | | 125,731 | |
Gain (loss) on disposition of unconsolidated entities, net of tax | | | – | | | | – | | | | – | | | | – | | | | – | | | | (536 | ) | | | – | | | | 536 | | | | – | | | | – | |
Impairment of consolidated and unconsolidated real estate, net of tax | | | – | | | | – | | | | – | | | | – | | | | – | | | | (672 | ) | | | – | | | | (1,398 | ) | | | (27,800 | ) | | | (29,870 | ) |
Impairment of unconsolidated real estate, net of tax | | | – | | | | – | | | | – | | | | – | | | | – | | | | (1,398 | ) | | | – | | | | 1,398 | | | | – | | | | – | |
Discontinued operations, net of tax: | | | | | | | | | | | | | | | | | | | | | | | | | | | | | | | | | | | | | | | | |
Depreciation and amortization – Real Estate Groups | | | – | | | | – | | | | – | | | | – | | | | – | | | | (2,573 | ) | | | – | | | | – | | | | 2,573 | | | | – | |
Amortization of mortgage procurement costs – Real Estate Groups | | | – | | | | – | | | | – | | | | – | | | | – | | | | (426 | ) | | | – | | | | – | | | | 426 | | | | – | |
Deferred taxes – Real Estate Groups | | | – | | | | – | | | | – | | | | – | | | | – | | | | (518 | ) | | | – | | | | – | | | | 518 | | | | – | |
Straight-line rent adjustment | | | – | | | | – | | | | – | | | | – | | | | – | | | | 508 | | | | – | | | | – | | | | (508 | ) | | | – | |
Gain on disposition of rental properties | | | – | | | | – | | | | – | | | | – | | | | – | | | | 1,099 | | | | – | | | | – | | | | (1,099 | ) | | | – | |
Impairment of consolidated and unconsolidated real estate | | | – | | | | – | | | | – | | | | – | | | | – | | | | (27,800 | ) | | | – | | | | – | | | | 27,800 | | | | – | |
Net earnings (loss) attributable to Forest City Enterprises, Inc. | | $ | (6,547 | ) | | $ | – | | | $ | – | | | $ | – | | | $ | (6,547 | ) | | $ | 122,846 | | | $ | – | | | $ | – | | | $ | – | | | $ | 122,846 | |
Preferred dividends | | | (4,107 | ) | | | – | | | | – | | | | – | | | | (4,107 | ) | | | (4,107 | ) | | | – | | | | – | | | | – | | | | (4,107 | ) |
Net earnings (loss) attributable to Forest City Enterprises, Inc. common shareholders | | $ | (10,654 | ) | | $ | – | | | $ | – | | | $ | – | | | $ | (10,654 | ) | | $ | 118,739 | | | $ | – | | | $ | – | | | $ | – | | | $ | 118,739 | |
53
Forest City Enterprises, Inc. and Subsidiaries
Supplemental Financial Information
Summary of Earnings Before Depreciation, Amortization and Deferred Taxes (EBDT) – Six Months Ended July 31, 2010(in thousands)
| | | | | | | | | | | | | | | | | | | | | | | | | | | | | | | | | | | | | | | | |
| | | Commercial Group 2010 | | | Residential Group 2010 | |
| | | Full
Consolidation
(GAAP) | | | Less
Noncontrolling
Interest | | | Plus
Unconsolidated
Investments at
Pro-Rata | | | Plus
Discontinued
Operations | | | Pro-Rata
Consolidation
(Non-GAAP) | | | Full
Consolidation
(GAAP) | | | Less
Noncontrolling
Interest | | | Plus
Unconsolidated
Investments at
Pro-Rata | | | Plus
Discontinued
Operations | | | Pro-Rata
Consolidation
(Non-GAAP) | |
Revenues from real estate operations | | $ | 445,345 | | | $ | 24,141 | | | $ | 75,837 | | | $ | 21,474 | | | $ | 518,515 | | | $ | 105,182 | | | $ | 1,778 | | | $ | 71,664 | | | $ | 2,506 | | | $ | 177,574 | |
Exclude straight-line rent adjustment | | | (8,802 | ) | | | – | | | | – | | | | (671 | ) | | | (9,473 | ) | | | (770 | ) | | | – | | | | – | | | | – | | | | (770 | ) |
Adjusted revenues | | | 436,543 | | | | 24,141 | | | | 75,837 | | | | 20,803 | | | | 509,042 | | | | 104,412 | | | | 1,778 | | | | 71,664 | | | | 2,506 | | | | 176,804 | |
Add interest and other income | | | 10,209 | | | | 415 | | | | 109 | | | | 2 | | | | 9,905 | | | | 8,237 | | | | 242 | | | | 530 | | | | 4 | | | | 8,529 | |
Add gain on disposition of partial interests in other investment – Nets | | | – | | | | – | | | | – | | | | – | | | | – | | | | – | | | | – | | | | – | | | | – | | | | – | |
Add equity in earnings (loss) of unconsolidated entities, including impairment | | | (6,739 | ) | | | – | | | | 6,740 | | | | – | | | | 1 | | | | 6,662 | | | | (103 | ) | | | (6,348 | ) | | | – | | | | 417 | |
Exclude gain (loss) on disposition of unconsolidated entities | | | 830 | | | | – | | | | (830 | ) | | | – | | | | – | | | | – | | | | – | | | | – | | | | – | | | | – | |
Exclude impairment of unconsolidated real estate | | | 12,156 | | | | – | | | | (12,156 | ) | | | – | | | | – | | | | – | | | | – | | | | – | | | | – | | | | – | |
Exclude depreciation and amortization of unconsolidated entities | | | 12,525 | | | | – | | | | (12,525 | ) | | | – | | | | – | | | | 12,046 | | | | – | | | | (12,046 | ) | | | – | | | | – | |
Adjusted total income | | | 465,524 | | | | 24,556 | | | | 57,175 | | | | 20,805 | | | | 518,948 | | | | 131,357 | | | | 1,917 | | | | 53,800 | | | | 2,510 | | | | 185,750 | |
Operating expenses | | | 221,185 | | | | 13,969 | | | | 35,666 | | | | 11,543 | | | | 254,425 | | | | 65,152 | | | | 754 | | | | 37,189 | | | | 1,610 | | | | 103,197 | |
Non-Real Estate depreciation and amortization and amortization of mortgage procurement costs | | | 939 | | | | – | | | | – | | | | – | | | | 939 | | | | 850 | | | | – | | | | – | | | | – | | | | 850 | |
Exclude straight-line rent adjustment | | | (2,661 | ) | | | – | | | | – | | | | – | | | | (2,661 | ) | | | 2 | | | | – | | | | – | | | | – | | | | 2 | |
Exclude preference payment | | | (1,171 | ) | | | – | | | | – | | | | – | | | | (1,171 | ) | | | – | | | | – | | | | – | | | | – | | | | – | |
Adjusted operating expenses | | | 218,292 | | | | 13,969 | | | | 35,666 | | | | 11,543 | | | | 251,532 | | | | 66,004 | | | | 754 | | | | 37,189 | | | | 1,610 | | | | 104,049 | |
Net operating income | | | 247,232 | | | | 10,587 | | | | 21,509 | | | | 9,262 | | | | 267,416 | | | | 65,353 | | | | 1,163 | | | | 16,611 | | | | 900 | | | | 81,701 | |
Interest expense | | | 118,078 | | | | 8,604 | | | | 21,509 | | | | 3,927 | | | | 134,910 | | | | 14,023 | | | | 454 | | | | 16,611 | | | | 118 | | | | 30,298 | |
Gain on early extinguishment of debt | | | – | | | | – | | | | – | | | | – | | | | – | | | | – | | | | – | | | | – | | | | – | | | | – | |
Noncontrolling interest in earnings before depreciation and amortization | | | 1,983 | | | | 1,983 | | | | – | | | | – | | | | – | | | | 709 | | | | 709 | | | | – | | | | – | | | | – | |
Add: Pre-Tax EBDT from discontinued operations | | | 5,335 | | | | – | | | | – | | | | (5,335 | ) | | | – | | | | 782 | | | | – | | | | – | | | | (782 | ) | | | – | |
Pre-Tax EBDT | | | 132,506 | | | | – | | | | – | | | | – | | | | 132,506 | | | | 51,403 | | | | – | | | | – | | | | – | | | | 51,403 | |
Income tax expense (benefit) | | | (595 | ) | | | – | | | | – | | | | – | | | | (595 | ) | | | (1,376 | ) | | | – | | | | – | | | | – | | | | (1,376 | ) |
Earnings before depreciation, amortization and deferred taxes (EBDT) | | $ | 133,101 | | | $ | – | | | $ | – | | | $ | – | | | $ | 133,101 | | | $ | 52,779 | | | $ | – | | | $ | – | | | $ | – | | | $ | 52,779 | |
Reconciliation to net earnings: | | | | | | | | | | | | | | | | | | | | | | | | | | | | | | | | | | | | | | | | |
Earnings before depreciation, amortization and deferred taxes (EBDT) | | $ | 133,101 | | | $ | – | | | $ | – | | | $ | – | | | $ | 133,101 | | | $ | 52,779 | | | $ | – | | | $ | – | | | $ | – | | | $ | 52,779 | |
Depreciation and amortization – Real Estate Groups | | | (99,328 | ) | | | – | | | | – | | | | (4,140 | ) | | | (103,468 | ) | | | (35,485 | ) | | | – | | | | – | | | | (636 | ) | | | (36,121 | ) |
Amortization of mortgage procurement costs – Real Estate Groups | | | (4,907 | ) | | | – | | | | – | | | | (468 | ) | | | (5,375 | ) | | | (1,143 | ) | | | – | | | | – | | | | (13 | ) | | | (1,156 | ) |
Deferred taxes – Real Estate Groups | | | (12,969 | ) | | | – | | | | – | | | | (204 | ) | | | (13,173 | ) | | | (6,613 | ) | | | – | | | | – | | | | (400 | ) | | | (7,013 | ) |
Straight-line rent adjustment | | | 6,141 | | | | – | | | | – | | | | 671 | | | | 6,812 | | | | 772 | | | | – | | | | – | | | | – | | | | 772 | |
Preference payment | | | (1,171 | ) | | | – | | | | – | | | | – | | | | (1,171 | ) | | | – | | | | – | | | | – | | | | – | | | | – | |
Gain (loss) on disposition of rental properties and partial interests in rental properties, net of tax | | | 107,615 | | | | – | | | | (507 | ) | | | – | | | | 107,108 | | | | 17,731 | | | | – | | | | – | | | | 1,099 | | | | 18,830 | |
Gain (loss) on disposition of unconsolidated entities, net of tax | | | (507 | ) | | | – | | | | 507 | | | | – | | | | – | | | | – | | | | – | | | | – | | | | – | | | | – | |
Impairment of consolidated and unconsolidated real estate, net of tax | | | – | | | | – | | | | (7,441 | ) | | | (27,800 | ) | | | (35,241 | ) | | | – | | | | – | | | | – | | | | – | | | | – | |
Impairment of unconsolidated real estate, net of tax | | | (7,441 | ) | | | – | | | | 7,441 | | | | – | | | | – | | | | – | | | | – | | | | – | | | | – | | | | – | |
Discontinued operations, net of tax: | | | | | | | | | | | | | | | | | | | | | | | | | | | | | | | | | | | | | | | | |
Depreciation and amortization – Real Estate Groups | | | (4,140 | ) | | | – | | | | – | | | | 4,140 | | | | – | | | | (636 | ) | | | – | | | | – | | | | 636 | | | | – | |
Amortization of mortgage procurement costs – Real Estate Groups | | | (468 | ) | | | – | | | | – | | | | 468 | | | | – | | | | (13 | ) | | | – | | | | – | | | | 13 | | | | – | |
Deferred taxes – Real Estate Groups | | | (204 | ) | | | – | | | | – | | | | 204 | | | | – | | | | (400 | ) | | | – | | | | – | | | | 400 | | | | – | |
Straight-line rent adjustment | | | 671 | | | | – | | | | – | | | | (671 | ) | | | – | | | | – | | | | – | | | | – | | | | – | | | | – | |
Gain on disposition of rental properties | | | – | | | | – | | | | – | | | | – | | | | – | | | | 1,099 | | | | – | | | | – | | | | (1,099 | ) | | | – | |
Impairment of consolidated and unconsolidated real estate | | | (27,800 | ) | | | – | | | | – | | | | 27,800 | | | | – | | | | – | | | | – | | | | – | | | | – | | | | – | |
Net earnings (loss) attributable to Forest City Enterprises, Inc. | | $ | 88,593 | | | $ | – | | | $ | – | | | $ | – | | | $ | 88,593 | | | $ | 28,091 | | | $ | – | | | $ | – | | | $ | – | | | $ | 28,091 | |
54
Forest City Enterprises, Inc. and Subsidiaries
Supplemental Financial Information
Summary of Earnings Before Depreciation, Amortization and Deferred Taxes (EBDT) – Six Months Ended July 31, 2010(in thousands)(continued)
| | | | | | | | | | | | | | | | | | | | | | | | | | | | | | | | | | | | | | | | |
| | | Land Development Group 2010 | | | The Nets 2010 | |
| | | Full
Consolidation
(GAAP) | | | Less
Noncontrolling
Interest | | | Plus
Unconsolidated
Investments at
Pro-Rata | | | Plus
Discontinued
Operations | | | Pro-Rata
Consolidation
(Non-GAAP) | | | Full
Consolidation
(GAAP) | | | Less
Noncontrolling
Interest | | | Plus
Unconsolidated
Investments at
Pro-Rata | | | Plus
Discontinued
Operations | | | Pro-Rata
Consolidation
(Non-GAAP) | |
Revenues from real estate operations | | $ | 12,476 | | | $ | 749 | | | $ | 6,134 | | | $ | – | | | $ | 17,861 | | | $ | – | | | $ | – | | | $ | – | | | $ | – | | | $ | – | |
Exclude straight-line rent adjustment | | | 4 | | | | – | | | | – | | | | – | | | | 4 | | | | – | | | | – | | | | – | | | | – | | | | – | |
Adjusted revenues | | | 12,480 | | | | 749 | | | | 6,134 | | | | – | | | | 17,865 | | | | – | | | | – | | | | – | | | | – | | | | – | |
Add interest and other income | | | 4,425 | | | | 375 | | | | 84 | | | | – | | | | 4,134 | | | | – | | | | – | | | | 14,037 | | | | – | | | | 14,037 | |
Add gain on disposition of partial interests in other investment – Nets | | | – | | | | – | | | | – | | | | – | | | | – | | | | 55,112 | | | | 23,675 | | | | – | | | | – | | | | 31,437 | |
Add equity in earnings (loss) of unconsolidated entities, including impairment | | | (452 | ) | | | – | | | | 1,242 | | | | – | | | | 790 | | | | (17,591 | ) | | | (6,243 | ) | | | 4,207 | | | | – | | | | (7,141 | ) |
Exclude gain (loss) on disposition of unconsolidated entities | | | – | | | | – | | | | – | | | | – | | | | – | | | | – | | | | – | | | | – | | | | – | | | | – | |
Exclude impairment of unconsolidated real estate | | | 3,025 | | | | – | | | | (3,025 | ) | | | – | | | | – | | | | – | | | | – | | | | – | | | | – | | | | – | |
Exclude depreciation and amortization of unconsolidated entities | | | 146 | | | | – | | | | (146 | ) | | | – | | | | – | | | | – | | | | – | | | | – | | | | – | | | | – | |
Adjusted total income | | | 19,624 | | | | 1,124 | | | | 4,289 | | | | – | | | | 22,789 | | | | 37,521 | | | | 17,432 | | | | 18,244 | | | | – | | | | 38,333 | |
Operating expenses | | | 17,871 | | | | 918 | | | | 4,437 | | | | – | | | | 21,390 | | | | – | | | | – | | | | 16,151 | | | | – | | | | 16,151 | |
Non-Real Estate depreciation and amortization and amortization of mortgage procurement costs | | | 79 | | | | – | | | | – | | | | – | | | | 79 | | | | – | | | | – | | | | 947 | | | | – | | | | 947 | |
Exclude straight-line rent adjustment | | | – | | | | – | | | | – | | | | – | | | | – | | | | – | | | | – | | | | – | | | | – | | | | – | |
Exclude preference payment | | | – | | | | – | | | | – | | | | – | | | | – | | | | – | | | | – | | | | – | | | | – | | | | – | |
Adjusted operating expenses | | | 17,950 | | | | 918 | | | | 4,437 | | | | – | | | | 21,469 | | | | – | | | | – | | | | 17,098 | | | | – | | | | 17,098 | |
Net operating income | | | 1,674 | | | | 206 | | | | (148 | ) | | | – | | | | 1,320 | | | | 37,521 | | | | 17,432 | | | | 1,146 | | | | – | | | | 21,235 | |
Interest expense | | | 1,333 | | | | 143 | | | | (148 | ) | | | – | | | | 1,042 | | | | – | | | | – | | | | 1,146 | | | | – | | | | 1,146 | |
Gain on early extinguishment of debt | | | – | | | | – | | | | – | | | | – | | | | – | | | | – | | | | – | | | | – | | | | – | | | | – | |
Noncontrolling interest in earnings before depreciation and amortization | | | 63 | | | | 63 | | | | – | | | | – | | | | – | | | | 17,432 | | | | 17,432 | | | | – | | | | – | | | | – | |
Add: Pre-Tax EBDT from discontinued operations | | | – | | | | – | | | | – | | | | – | | | | – | | | | – | | | | – | | | | – | | | | – | | | | – | |
Pre-Tax EBDT | | | 278 | | | | – | | | | – | | | | – | | | | 278 | | | | 20,089 | | | | – | | | | – | | | | – | | | | 20,089 | |
Income tax expense (benefit) | | | (288 | ) | | | – | | | | – | | | | – | | | | (288 | ) | | | 8,717 | | | | – | | | | – | | | | – | | | | 8,717 | |
Earnings before depreciation, amortization and deferred taxes (EBDT) | | $ | 566 | | | $ | – | | | $ | – | | | $ | – | | | $ | 566 | | | $ | 11,372 | | | $ | – | | | $ | – | | | $ | – | | | $ | 11,372 | |
Reconciliation to net earnings: | | | | | | | | | | | | | | | | | | | | | | | | | | | | | | | | | | | | | | | | |
Earnings before depreciation, amortization and deferred taxes (EBDT) | | $ | 566 | | | $ | – | | | $ | – | | | $ | – | | | $ | 566 | | | $ | 11,372 | | | $ | – | | | $ | – | | | $ | – | | | $ | 11,372 | |
Depreciation and amortization – Real Estate Groups | | | (154 | ) | | | – | | | | – | | | | – | | | | (154 | ) | | | – | | | | – | | | | – | | | | – | | | | – | |
Amortization of mortgage procurement costs – Real Estate Groups | | | (164 | ) | | | – | | | | – | | | | – | | | | (164 | ) | | | – | | | | – | | | | – | | | | – | | | | – | |
Deferred taxes – Real Estate Groups | | | (220 | ) | | | – | | | | – | | | | – | | | | (220 | ) | | | – | | | | – | | | | – | | | | – | | | | – | |
Straight-line rent adjustment | | | (4 | ) | | | – | | | | – | | | | – | | | | (4 | ) | | | – | | | | – | | | | – | | | | – | | | | – | |
Preference payment | | | – | | | | – | | | | – | | | | – | | | | – | | | | – | | | | – | | | | – | | | | – | | | | – | |
Gain (loss) on disposition of rental properties and partial interests in rental properties, net of tax | | | – | | | | – | | | | – | | | | – | | | | – | | | | – | | | | – | | | | – | | | | – | | | | – | |
Gain (loss) on disposition of unconsolidated entities, net of tax | | | – | | | | – | | | | – | | | | – | | | | – | | | | – | | | | – | | | | – | | | | – | | | | – | |
Impairment of consolidated and unconsolidated real estate, net of tax | | | (672 | ) | | | – | | | | (1,853 | ) | | | – | | | | (2,525 | ) | | | – | | | | – | | | | – | | | | – | | | | – | |
Impairment of unconsolidated real estate, net of tax | | | (1,853 | ) | | | – | | | | 1,853 | | | | – | | | | – | | | | – | | | | – | | | | – | | | | – | | | | – | |
Discontinued operations, net of tax: | | | | | | | | | | | | | | | | | | | | | | | | | | | | | | | | | | | | | | | | |
Depreciation and amortization – Real Estate Groups | | | – | | | | – | | | | – | | | | – | | | | – | | | | – | | | | – | | | | – | | | | – | | | | – | |
Amortization of mortgage procurement costs – Real Estate Groups | | | – | | | | – | | | | – | | | | – | | | | – | | | | – | | | | – | | | | – | | | | – | | | | – | |
Deferred taxes – Real Estate Groups | | | – | | | | – | | | | – | | | | – | | | | – | | | | – | | | | – | | | | – | | | | – | | | | – | |
Straight-line rent adjustment | | | – | | | | – | | | | – | | | | – | | | | – | | | | – | | | | – | | | | – | | | | – | | | | – | |
Gain on disposition of rental properties | | | – | | | | – | | | | – | | | | – | | | | – | | | | – | | | | – | | | | – | | | | – | | | | – | |
Impairment of consolidated and unconsolidated real estate | | | – | | | | – | | | | – | | | | – | | | | – | | | | – | | | | – | | | | – | | | | – | | | | – | |
Net earnings (loss) attributable to Forest City Enterprises, Inc. | | $ | (2,501 | ) | | $ | – | | | $ | – | | | $ | – | | | $ | (2,501 | ) | | $ | 11,372 | | | $ | – | | | $ | – | | | $ | – | | | $ | 11,372 | |
55
Forest City Enterprises, Inc. and Subsidiaries
Supplemental Financial Information
Summary of Earnings Before Depreciation, Amortization and Deferred Taxes (EBDT) – Six Months Ended July 31, 2010(in thousands)(continued)
| | | | | | | | | | | | | | | | | | | | | | | | | | | | | | | | | | | | | | | | |
| | | Corporate Activities 2010 | | | Total 2010 | |
| | | Full
Consolidation
(GAAP) | | | Less
Noncontrolling
Interest | | | Plus
Unconsolidated
Investments at
Pro-Rata | | | Plus
Discontinued
Operations | | | Pro-Rata
Consolidation
(Non-GAAP) | | | Full
Consolidation
(GAAP) | | | Less
Noncontrolling
Interest | | | Plus
Unconsolidated
Investments at
Pro-Rata | | | Plus
Discontinued
Operations | | | Pro-Rata
Consolidation
(Non-GAAP) | |
Revenues from real estate operations | | $ | – | | | $ | – | | | $ | – | | | $ | – | | | $ | – | | | $ | 563,003 | | | $ | 26,668 | | | $ | 153,635 | | | $ | 23,980 | | | $ | 713,950 | |
Exclude straight-line rent adjustment | | | – | | | | – | | | | – | | | | – | | | | – | | | | (9,568 | ) | | | – | | | | – | | | | (671 | ) | | | (10,239 | ) |
Adjusted revenues | | | – | | | | – | | | | – | | | | – | | | | – | | | | 553,435 | | | | 26,668 | | | | 153,635 | | | | 23,309 | | | | 703,711 | |
Add interest and other income | | | 174 | | | | – | | | | – | | | | – | | | | 174 | | | | 23,045 | | | | 1,032 | | | | 14,760 | | | | 6 | | | | 36,779 | |
Add gain on disposition of partial interests in other investment – Nets | | | – | | | | – | | | | – | | | | – | | | | – | | | | 55,112 | | | | 23,675 | | | | – | | | | – | | | | 31,437 | |
Add equity in earnings (loss) of unconsolidated entities, including impairment | | | – | | | | – | | | | – | | | | – | | | | – | | | | (18,120 | ) | | | (6,346 | ) | | | 5,841 | | | | – | | | | (5,933 | ) |
Exclude gain (loss) on disposition of unconsolidated entities | | | – | | | | – | | | | – | | | | – | | | | – | | | | 830 | | | | – | | | | (830 | ) | | | – | | | | – | |
Exclude impairment of unconsolidated real estate | | | – | | | | – | | | | – | | | | – | | | | – | | | | 15,181 | | | | – | | | | (15,181 | ) | | | – | | | | – | |
Exclude depreciation and amortization of unconsolidated entities | | | – | | | | – | | | | – | | | | – | | | | – | | | | 24,717 | | | | – | | | | (24,717 | ) | | | – | | | | – | |
Adjusted total income | | | 174 | | | | – | | | | – | | | | – | | | | 174 | | | | 654,200 | | | | 45,029 | | | | 133,508 | | | | 23,315 | | | | 765,994 | |
Operating expenses | | | 20,436 | | | | – | | | | – | | | | – | | | | 20,436 | | | | 324,644 | | | | 15,641 | | | | 93,443 | | | | 13,153 | | | | 415,599 | |
Non-Real Estate depreciation and amortization and amortization of mortgage procurement costs | | | 885 | | | | – | | | | – | | | | – | | | | 885 | | | | 2,753 | | | | – | | | | 947 | | | | – | | | | 3,700 | |
Exclude straight-line rent adjustment | | | – | | | | – | | | | – | | | | – | | | | – | | | | (2,659 | ) | | | – | | | | – | | | | – | | | | (2,659 | ) |
Exclude preference payment | | | – | | | | – | | | | – | | | | – | | | | – | | | | (1,171 | ) | | | – | | | | – | | | | – | | | | (1,171 | ) |
Adjusted operating expenses | | | 21,321 | | | | – | | | | – | | | | – | | | | 21,321 | | | | 323,567 | | | | 15,641 | | | | 94,390 | | | | 13,153 | | | | 415,469 | |
Net operating income | | | (21,147 | ) | | | – | | | | – | | | | – | | | | (21,147 | ) | | | 330,633 | | | | 29,388 | | | | 39,118 | | | | 10,162 | | | | 350,525 | |
Interest expense | | | 32,543 | | | | – | | | | – | | | | – | | | | 32,543 | | | | 165,977 | | | | 9,201 | | | | 39,118 | | | | 4,045 | | | | 199,939 | |
Gain on early extinguishment of debt | | | (8,193 | ) | | | – | | | | – | | | | – | | | | (8,193 | ) | | | (8,193 | ) | | | – | | | | – | | | | – | | | | (8,193 | ) |
Noncontrolling interest in earnings before depreciation and amortization | | | – | | | | – | | | | – | | | | – | | | | – | | | | 20,187 | | | | 20,187 | | | | – | | | | – | | | | – | |
Add: Pre-Tax EBDT from discontinued operations | | | – | | | | – | | | | – | | | | – | | | | – | | | | 6,117 | | | | – | | | | – | | | | (6,117 | ) | | | – | |
Pre-Tax EBDT | | | (45,497 | ) | | | – | | | | – | | | | – | | | | (45,497 | ) | | | 158,779 | | | | – | | | | – | | | | – | | | | 158,779 | |
Income tax expense (benefit) | | | (23,706 | ) | | | – | | | | – | | | | – | | | | (23,706 | ) | | | (17,248 | ) | | | – | | | | – | | | | – | | | | (17,248 | ) |
Earnings before depreciation, amortization and deferred taxes (EBDT) | | $ | (21,791 | ) | | $ | – | | | $ | – | | | $ | – | | | $ | (21,791 | ) | | $ | 176,027 | | | $ | – | | | $ | – | | | $ | – | | | $ | 176,027 | |
Reconciliation to net earnings: | | | | | | | | | | | | | | | | | | | | | | | | | | | | | | | | | | | | | | | | |
Earnings before depreciation, amortization and deferred taxes (EBDT) | | $ | (21,791 | ) | | $ | – | | | $ | – | | | $ | – | | | $ | (21,791 | ) | | $ | 176,027 | | | $ | – | | | $ | – | | | $ | – | | | $ | 176,027 | |
Depreciation and amortization – Real Estate Groups | | | – | | | | – | | | | – | | | | – | | | | – | | | | (134,967 | ) | | | – | | | | – | | | | (4,776 | ) | | | (139,743 | ) |
Amortization of mortgage procurement costs – Real Estate Groups | | | – | | | | – | | | | – | | | | – | | | | – | | | | (6,214 | ) | | | – | | | | – | | | | (481 | ) | | | (6,695 | ) |
Deferred taxes – Real Estate Groups | | | 3,520 | | | | – | | | | – | | | | – | | | | 3,520 | | | | (16,282 | ) | | | – | | | | – | | | | (604 | ) | | | (16,886 | ) |
Straight-line rent adjustment | | | – | | | | – | | | | – | | | | – | | | | – | | | | 6,909 | | | | – | | | | – | | | | 671 | | | | 7,580 | |
Preference payment | | | – | | | | – | | | | – | | | | – | | | | – | | | | (1,171 | ) | | | – | | | | – | | | | – | | | | (1,171 | ) |
Gain (loss) on disposition of rental properties and partial interests in rental properties, net of tax | | | – | | | | – | | | | – | | | | – | | | | – | | | | 125,346 | | | | – | | | | (507 | ) | | | 1,099 | | | | 125,938 | |
Gain (loss) on disposition of unconsolidated entities, net of tax | | | – | | | | – | | | | – | | | | – | | | | – | | | | (507 | ) | | | – | | | | 507 | | | | – | | | | – | |
Impairment of consolidated and unconsolidated real estate, net of tax | | | – | | | | – | | | | – | | | | – | | | | – | | | | (672 | ) | | | – | | | | (9,294 | ) | | | (27,800 | ) | | | (37,766 | ) |
Impairment of unconsolidated real estate, net of tax | | | – | | | | – | | | | – | | | | – | | | | – | | | | (9,294 | ) | | | – | | | | 9,294 | | | | – | | | | – | |
Discontinued operations, net of tax: | | | | | | | | | | | | | | | | | | | | | | | | | | | | | | | | | | | | | | | | |
Depreciation and amortization – Real Estate Groups | | | – | | | | – | | | | – | | | | – | | | | – | | | | (4,776 | ) | | | – | | | | – | | | | 4,776 | | | | – | |
Amortization of mortgage procurement costs – Real Estate Groups | | | – | | | | – | | | | – | | | | – | | | | – | | | | (481 | ) | | | – | | | | – | | | | 481 | | | | – | |
Deferred taxes – Real Estate Groups | | | – | | | | – | | | | – | | | | – | | | | – | | | | (604 | ) | | | – | | | | – | | | | 604 | | | | – | |
Straight-line rent adjustment | | | – | | | | – | | | | – | | | | – | | | | – | | | | 671 | | | | – | | | | – | | | | (671 | ) | | | – | |
Gain on disposition of rental properties | | | – | | | | – | | | | – | | | | – | | | | – | | | | 1,099 | | | | – | | | | – | | | | (1,099 | ) | | | – | |
Impairment of consolidated and unconsolidated real estate | | | – | | | | – | | | | – | | | | – | | | | – | | | | (27,800 | ) | | | – | | | | – | | | | 27,800 | | | | – | |
Net earnings (loss) attributable to Forest City Enterprises, Inc. | | $ | (18,271 | ) | | $ | – | | | $ | – | | | $ | – | | | $ | (18,271 | ) | | $ | 107,284 | | | $ | – | | | $ | – | | | $ | – | | | $ | 107,284 | |
Preferred dividends | | | (4,107 | ) | | | – | | | | – | | | | – | | | | (4,107 | ) | | | (4,107 | ) | | | – | | | | – | | | | – | | | | (4,107 | ) |
Net earnings (loss) attributable to Forest City Enterprises, Inc. common shareholders | | $ | (22,378 | ) | | $ | – | | | $ | – | | | $ | – | | | $ | (22,378 | ) | | $ | 103,177 | | | $ | – | | | $ | – | | | $ | – | | | $ | 103,177 | |
56