Exhibit 99.1
Forest City Enterprises, Inc.
Supplemental Package
Three Months Ended April 30, 2012 and 2011
Forest City Enterprises, Inc. and Subsidiaries
Three Months Ended April 30, 2012 and 2011
Supplemental Package
NYSE: FCEA, FCEB
Index
| | | | |
Corporate Overview | | | 2-4 | |
| |
Selected Financial Information | | | | |
Forest City Enterprises, Inc. | | | | |
Consolidated Balance Sheet Information | | | 5-8 | |
Consolidated Earnings Information | | | 9-10 | |
Net Asset Value Components | | | 11-12 | |
| |
Supplemental Operating Information | | | | |
Occupancy Data | | | 13 | |
Retail Sales Data | | | 14 | |
Leasing Summary | | | 15 | |
Comparable Net Operating Income (NOI) | | | 16 | |
Comparable NOI Detail | | | 17 | |
NOI By Product Type | | | 18 | |
NOI By Core Market | | | 19 | |
Reconciliation of NOI to Net Earnings | | | 20 | |
Results of Operations Discussion | | | 21-23 | |
FFO Bridge | | | 24 | |
EBDT Bridge | | | 25 | |
Funds From Operations | | | 26-28 | |
Schedules of Lease Expirations | | | 29-30 | |
Schedules of Significant Tenants | | | 31-32 | |
Development Pipeline | | | 33-39 | |
| |
Supplemental Financial Information | | | | |
Common Stock Data/Covenants | | | 40 | |
Projects under Construction and Development Debt and Nonrecourse Debt | | | 41 | |
Scheduled Maturities Table | | | 42-43 | |
Summary of EBDT | | | 44-49 | |
This Supplemental Package, together with other statements and information publicly disseminated by us, contains “forward-looking statements” within the meaning of Section 27A of the Securities Act of 1933, as amended, and Section 21E of the Securities Exchange Act of 1934, as amended. Such statements reflect management’s current views with respect to financial results related to future events and are based on assumptions and expectations that may not be realized and are inherently subject to risks and uncertainties, many of which cannot be predicted with accuracy and some of which might not even be anticipated. Future events and actual results, financial or otherwise, may differ from the results discussed in the forward-looking statements. Risk factors discussed in Item 1A of our Form 10-K for the year ended January 31, 2012 and other factors that might cause differences, some of which could be material, include, but are not limited to, the impact of current lending and capital market conditions on our liquidity, ability to finance or refinance projects and repay our debt, the impact of the current economic environment on the ownership, development and management of our real estate portfolio, general real estate investment and development risks, vacancies in our properties, the strategic decision to reposition or divest portions of our land business, further downturns in the housing market, competition, illiquidity of real estate investments, bankruptcy or defaults of tenants, anchor store consolidations or closings, international activities, the impact of terrorist acts, risks associated with an investment in a professional sports team, our substantial debt leverage and the ability to obtain and service debt, the impact of restrictions imposed by our credit facility and senior debt, exposure to hedging agreements, the level and volatility of interest rates, the continued availability of tax-exempt government financing, the impact of credit rating downgrades, effects of uninsured or underinsured losses, effects of a downgrade or failure of our insurance carriers, environmental liabilities, conflicts of interest, risks associated with the sale of tax credits, risks associated with developing and managing properties in partnership with others, the ability to maintain effective internal controls, compliance with governmental regulations, increased legislative and regulatory scrutiny of the financial services industry, volatility in the market price of our publicly traded securities, inflation risks, litigation risks, cybersecurity risks and cyber incidents, as well as other risks listed from time to time in our reports filed with the Securities and Exchange Commission. We have no obligation to revise or update any forward-looking statements, other than imposed by law, as a result of future events or new information. Readers are cautioned not to place undue reliance on such forward-looking statements.
1
Forest City Enterprises, Inc. and Subsidiaries
Supplemental Financial and Operating Information
Corporate Overview
We principally engage in the ownership, development, management and acquisition of commercial and residential real estate and land throughout the United States. We operate through three strategic business units and five reportable segments. TheCommercial Group, our largest strategic business unit, owns, develops, acquires and operates regional malls, specialty/urban retail centers, office and life science buildings, hotels and mixed-use projects. TheResidential Group owns, develops, acquires and operates residential rental properties, including upscale and middle-market apartments and adaptive re-use developments. Additionally, the Residential Group develops for-sale condominium projects and also owns interests in entities that develop and manage military family housing. The Land Development Group acquires and sells both land and developed lots to residential, commercial and industrial customers. It also owns and develops land into master-planned communities and mixed-use projects. On January 31, 2012, our Board of Directors approved a strategic decision by senior management to reposition or divest significant portions of our Land Development Group and is actively reviewing alternatives to do so.Real Estate Groups are the combined Commercial, Residential and Land Development Groups.Corporate Activities and theNets, a member of the National Basketball Association (“NBA”) in which we account for our investment on the equity method of accounting, are other reportable segments of the Company.
We have approximately $10.5 billion of assets in 28 states and the District of Columbia at April 30, 2012. Our core markets include Boston, Chicago, Dallas, Denver, Los Angeles, New York, Philadelphia, the Greater San Francisco metropolitan area and the Greater Washington D.C. metropolitan area. Our core markets account for approximately 78 percent of the cost of our real estate portfolio at April 30, 2012. We have offices in Albuquerque, Boston, Chicago, Dallas, Denver, London (England), Los Angeles, New York City, San Francisco, Washington, D.C. and our corporate headquarters in Cleveland, Ohio.
SUPPLEMENTAL FINANCIAL AND OPERATING INFORMATION
We recommend that this supplemental package be read in conjunction with our Form 10-Q for the three months ended April 30, 2012. This supplemental package contains certain measures prepared in accordance with generally accepted accounting principles (“GAAP”) under the full consolidation accounting method and certain measures prepared under the pro-rata consolidation method, a non-GAAP measure. Along with net earnings, we have historically reported an additional measure, Earnings Before Depreciation, Amortization and Deferred Taxes (“EBDT”), to report operating results. EBDT is a non-GAAP measure and may not be directly comparable to similarly-titled measures reported by other companies. Beginning in the three months ended April 30, 2012, we are also presenting Funds From Operations (“FFO”) for the first time, which is also a non-GAAP measure. The non-GAAP financial measures presented under the pro-rata consolidation method, comparable net operating income (“NOI”), EBDT and FFO, provide supplemental information about our operations. Although these measures are not presented in accordance with GAAP, we believe they are necessary to understand our business and operating results, along with net earnings and other GAAP measures. Our investors can use these non-GAAP measures as supplementary information to evaluate our business. Our non-GAAP measures are not intended to be performance measures that should be regarded as alternatives to, or more meaningful than, our GAAP measures.
Revision of Prior Period Financial Statements
Historically, we have recorded an allowance for projects under development (the “Allowance”) that have not been abandoned at each balance sheet date. During the three months ended January 31, 2012, we determined that the recording of the Allowance was not in accordance with ASC 970-360-40. The impact of this error (the “Allowance Revision”) was an understatement of operating expenses of $2,000,000 ($1,224,000 after tax) for the three months ended April 30, 2011. We assessed the materiality of this error on prior periods’ financial statements in accordance with ASC 250-10 (SEC’s Staff Accounting Bulletin No. 99, Materiality), and concluded that the error was not material to any prior annual or interim periods but would be material if the entire correction was recorded during the year ended January 31, 2012. Accordingly, the financial statements for the three months ended April 30, 2011 presented herein have been revised to correct for the error.
Consolidation Methods
We present certain financial amounts under the pro-rata consolidation method because we believe this information is useful to investors as this method reflects the manner in which we operate our business. In line with industry practice, we have made a large number of investments in which our economic ownership is less than 100% as a means of procuring opportunities and sharing risk. Under the pro-rata consolidation method, we generally present our investments proportionate to our economic share of ownership. Under GAAP, the full consolidation method is used to report partnership assets and liabilities consolidated at 100% if deemed to be under our control or if we are deemed to be the primary beneficiary of the variable interest entity (“VIE”), even if our ownership is not 100%. We provide reconciliations from the full consolidation method to the pro-rata consolidation method throughout our supplemental package. Please refer to our property listing for the detail of our consolidated and unconsolidated properties in our supplemental package for the year ended January 31, 2012.
2
Forest City Enterprises, Inc. and Subsidiaries
Supplemental Financial and Operating Information
EBDT
We believe that EBDT, along with net earnings, provides additional information about our core operations. While property dispositions, acquisitions or other factors can affect net earnings in the short-term, we believe EBDT presents a more consistent view of the overall financial performance of our business from period-to-period. EBDT has been used by the chief operating decision maker and management to assess performance and resource allocations by strategic business unit and on a consolidated basis. EBDT is similar, but not identical, to FFO, a measure of performance used by publicly traded Real Estate Investment Trusts (“REITs”).
FFO
The majority of our peers in the publically traded real estate industry are REITs and report operations using FFO as defined by the National Association of Real Estate Investment Trusts (“NAREIT”). Although we are not a REIT, we feel it is important to publish this measure to allow for easier comparison of our performance to our peers. The major difference between us and our REIT peers is that we are a taxable entity and any taxable income we generate could result in payment of federal or state income taxes. Our REIT peers typically are not subject to federal or state income taxes, but must pay out a portion of their taxable income to shareholders. Due to our effective tax management policies, we have not historically been a significant payer of income taxes. This has allowed us to retain our internally generated cash flows but has also resulted in large expenses for deferred taxes as required by GAAP. The treatment of deferred taxes is the single biggest difference between EBDT and FFO. We intend to continue to report both EBDT and FFO during the fiscal year ending January 31, 2013. Effective February 1, 2013, we will only report FFO and remove deferred taxes and any other industry accepted exclusion to arrive at Adjusted FFO to be more comparable to our industry peers.
Supplemental Operating Information
The operating information contained in this document includes: occupancy data, retail sales data, leasing summaries, comparable NOI, NOI by product type and core market, reconciliation of NOI to net earnings, results of operations discussion, FFO and EBDT bridges, reconciliation of net earnings to FFO and EBDT, retail and office lease expirations, significant retail and office tenants, and our development pipeline. We believe this information will give interested parties a better understanding and more information about our operating performance. The term “comparable,” which is used throughout this document, is generally defined as including properties that were open and operated in both the three months ended April 30, 2012 and 2011.
We believe occupancy rates, retail and office lease expirations, base rent, significant retail and office tenant listings, mall sales per square foot, and leasing spreads represent meaningful operating statistics about us.
Comparable NOI is useful because it measures the performance of the same properties on a period-to-period basis and is used to assess operating performance and resource allocation of the operating properties within our strategic business units. While property dispositions, acquisitions or other factors can impact net earnings in the short term, we believe comparable NOI gives a more consistent view of the overall performance of our operating portfolio from quarter-to-quarter and year-to-year. A reconciliation of NOI to net earnings, the most comparable financial measure calculated in accordance with GAAP, a reconciliation of NOI to net earnings for each strategic business unit and a reconciliation from NOI to comparable NOI are included in this supplemental package.
3
Forest City Enterprises, Inc. and Subsidiaries
Supplemental Financial and Operating Information
Corporate Headquarters
Forest City Enterprises, Inc.
Terminal Tower
50 Public Square, Suite 1100
Cleveland, Ohio 44113
Annual Report on Form 10-K
A copy of the Annual Report on Form 10-K as filed with the Securities and Exchange Commission for the fiscal year ended January 31, 2012 can be found on our website under SEC Filings or may be obtained without charge upon written request to:
Jeffrey B. Linton
Senior Vice President, Corporate Communication
jefflinton@forestcity.net
Website
www.forestcity.net
The information contained on this website is not incorporated herein by reference and does not constitute a part of this supplemental package.
Investor Relations
Robert G. O’Brien
Executive Vice President and Chief Financial Officer
Transfer Agent and Registrar
Wells Fargo
Shareowner Services
P.O. Box 64854
St. Paul, MN 55164-9440
(800) 468-9716
www.shareowneronline.com
Stock Exchange Listing
NYSE: FCEA and FCEB
Dividend Reinvestment and Stock Purchase Plan
We offer our shareholders the opportunity to purchase additional shares of common stock through the Forest City Enterprises, Inc. Dividend Reinvestment and Stock Purchase Plan (the “Plan”) at 97% of current market value. You may obtain a copy of the Plan prospectus and an enrollment card by contacting Wells Fargo Shareowner Services at (800) 468-9716 or by visiting www.shareowneronline.com.
4
Forest City Enterprises, Inc. and Subsidiaries
Selected Financial Information
Consolidated Balance Sheet Information – April 30, 2012 (Unaudited)
| | | | | | | | | | | | | | | | |
| | | | | | | | | Plus | | | | |
| | | Full | | | Less | | | Unconsolidated | | | Pro-Rata | |
| | | Consolidation | | | Noncontrolling | | | Investments at | | | Consolidation | |
| | | (GAAP) | | | Interest | | | Pro-Rata | | | (Non-GAAP) | |
| | | (in thousands) | |
Assets | | | | | | | | | | | | | | | | |
Real Estate | | | | | | | | | | | | | | | | |
Completed rental properties | | | | | | | | | | | | | | | | |
Residential | | $ | 1,597,234 | | | $ | 34,795 | | | $ | 1,311,034 | | | $ | 2,873,473 | |
Commercial | | | | | | | | | | | | | | | | |
Retail centers | | | 2,686,186 | | | | 71,240 | | | | 1,209,501 | | | | 3,824,447 | |
Office and other buildings | | | 2,967,531 | | | | 95,935 | | | | 377,334 | | | | 3,248,930 | |
Corporate and other equipment | | | 10,621 | | | | — | | | | — | | | | 10,621 | |
| | | | | | | | | | | | | | | | |
Total completed rental properties | | | 7,261,572 | | | | 201,970 | | | | 2,897,869 | | | | 9,957,471 | |
| | | | |
Projects under construction | | | | | | | | | | | | | | | | |
Residential | | | 43,591 | | | | 1,326 | | | | 23,195 | | | | 65,460 | |
Commercial | | | | | | | | | | | | | | | | |
Retail centers | | | 559,811 | | | | 224 | | | | 3,940 | | | | 563,527 | |
Office and other buildings | | | 698,639 | | | | 428,699 | | | | 658 | | | | 270,598 | |
| | | | | | | | | | | | | | | | |
Total projects under construction | | | 1,302,041 | | | | 430,249 | | | | 27,793 | | | | 899,585 | |
| | | | |
Projects under development | | | | | | | | | | | | | | | | |
Residential | | | 820,262 | | | | 177,683 | | | | 18,355 | | | | 660,934 | |
Commercial | | | | | | | | | | | | | | | | |
Retail centers | | | 40,638 | | | | 106 | | | | 32 | | | | 40,564 | |
Office and other buildings | | | 260,639 | | | | 25,518 | | | | 2,670 | | | | 237,791 | |
| | | | | | | | | | | | | | | | |
Total projects under development | | | 1,121,539 | | | | 203,307 | | | | 21,057 | | | | 939,289 | |
| | | | | | | | | | | | | | | | |
Total projects under construction and development | | | 2,423,580 | | | | 633,556 | | | | 48,850 | | | | 1,838,874 | |
Land held for development and sale | | | 80,185 | | | | 7,735 | | | | 25,110 | | | | 97,560 | |
| | | | | | | | | | | | | | | | |
Total Real Estate | | | 9,765,337 | | | | 843,261 | | | | 2,971,829 | | | | 11,893,905 | |
Less accumulated depreciation | | | (1,561,063 | ) | | | (49,664 | ) | | | (573,862 | ) | | | (2,085,261 | ) |
| | | | | | | | | | | | | | | | |
Real Estate, net | | | 8,204,274 | | | | 793,597 | | | | 2,397,967 | | | | 9,808,644 | |
| | | | |
Cash and equivalents | | | 287,678 | | | | 10,704 | | | | 59,753 | | | | 336,727 | |
Restricted cash and escrowed funds | | | 385,116 | | | | 60,158 | | | | 104,034 | | | | 428,992 | |
Notes and accounts receivable, net | | | 375,974 | | | | 20,357 | | | | 31,299 | | | | 386,916 | |
Investments in and advances to unconsolidated entities | | | 619,510 | | | | (136,395 | ) | | | (522,218 | ) | | | 233,687 | |
Lease and mortgage procurement costs, net | | | 268,368 | | | | 8,641 | | | | 58,358 | | | | 318,085 | |
Prepaid expenses and other deferred costs, net | | | 227,955 | | | | 34,012 | | | | 21,242 | | | | 215,185 | |
Intangible assets, net | | | 104,247 | | | | 3 | | | | 10,959 | | | | 115,203 | |
Land held for divestiture | | | 58,114 | | | | 14,177 | | | | 44,598 | | | | 88,535 | |
| | | | | | | | | | | | | | | | |
Total Assets | | $ | 10,531,236 | | | $ | 805,254 | | | $ | 2,205,992 | | | $ | 11,931,974 | |
| | | | | | | | | | | | | | | | |
5
Forest City Enterprises, Inc. and Subsidiaries
Selected Financial Information
Consolidated Balance Sheet Information – April 30, 2012 (Unaudited)
| | | | | | | | | | | | | | | | |
| | | | | | | | | Plus | | | | |
| | | Full | | | Less | | | Unconsolidated | | | Pro-Rata | |
| | | Consolidation | | | Noncontrolling | | | Investments at | | | Consolidation | |
| | | (GAAP) | | | Interest | | | Pro-Rata | | | (Non-GAAP) | |
| | | (in thousands) | |
Liabilities and Equity | | | | | | | | | | | | | | | | |
Liabilities | | | | | | | | | | | | | | | | |
Mortgage debt and notes payable, nonrecourse | | | | | | | | | | | | | | | | |
Completed rental properties | | | | | | | | | | | | | | | | |
Residential | | $ | 1,012,242 | | | $ | 25,820 | | | $ | 989,090 | | | $ | 1,975,512 | |
Commercial | | | | | | | | | | | | | | | | |
Retail centers | | | 1,737,819 | | | | 64,980 | | | | 969,023 | | | | 2,641,862 | |
Office and other buildings | | | 2,070,003 | | | | 72,940 | | | | 300,446 | | | | 2,297,509 | |
| | | | | | | | | | | | | | | | |
Total completed rental properties | | | 4,820,064 | | | | 163,740 | | | | 2,258,559 | | | | 6,914,883 | |
Projects under construction | | | | | | | | | | | | | | | | |
Residential | | | 13,711 | | | | 148 | | | | 13,776 | | | | 27,339 | |
Commercial | | | | | | | | | | | | | | | | |
Retail centers | | | 300,229 | | | | — | | | | — | | | | 300,229 | |
Office and other buildings | | | 287,057 | | | | 180,317 | | | | — | | | | 106,740 | |
| | | | | | | | | | | | | | | | |
Total projects under construction | | | 600,997 | | | | 180,465 | | | | 13,776 | | | | 434,308 | |
Projects under development | | | | | | | | | | | | | | | | |
Residential | | | 234,869 | | | | 55,854 | | | | — | | | | 179,015 | |
Commercial | | | | | | | | | | | | | | | | |
Retail centers | | | — | | | | — | | | | — | | | | — | |
Office and other buildings | | | — | | | | — | | | | 2,887 | | | | 2,887 | |
| | | | | | | | | | | | | | | | |
Total projects under development | | | 234,869 | | | | 55,854 | | | | 2,887 | | | | 181,902 | |
| | | | | | | | | | | | | | | | |
Total projects under construction and development | | | 835,866 | | | | 236,319 | | | | 16,663 | | | | 616,210 | |
Land held for development and sale | | | 15,775 | | | | 1,577 | | | | 12,434 | | | | 26,632 | |
| | | | | | | | | | | | | | | | |
Total Mortgage debt and notes payable, nonrecourse | | | 5,671,705 | | | | 401,636 | | | | 2,287,656 | | | | 7,557,725 | |
Bank revolving credit facility | | | — | | | | — | | | | — | | | | — | |
Senior and subordinated debt | | | 1,038,610 | | | | — | | | | — | | | | 1,038,610 | |
| | | | |
Construction payables | | | 207,064 | | | | 65,235 | | | | 13,264 | | | | 155,093 | |
Operating accounts payable and accrued expenses | | | 581,895 | | | | 35,631 | | | | 160,174 | | | | 706,438 | |
Accrued derivative liability | | | 165,500 | | | | — | | | | 17,499 | | | | 182,999 | |
Deferred profit on NY retail joint venture transaction | | | 114,465 | | | | — | | | | — | | | | 114,465 | |
| | | | | | | | | | | | | | | | |
Total Accounts payable, accrued expenses and other liabilities | | | 1,068,924 | | | | 100,866 | | | | 190,937 | | | | 1,158,995 | |
| | | | |
Cash distributions and losses in excess of investments in unconsolidated entities | | | 278,756 | | | | (27,173 | ) | | | (284,792 | ) | | | 21,137 | |
Deferred income taxes | | | 448,520 | | | | — | | | | — | | | | 448,520 | |
Mortgage debt and notes payable, nonrecourse on land held for divestiture | | | 18,171 | | | | 1,721 | | | | 12,191 | | | | 28,641 | |
| | | | | | | | | | | | | | | | |
Total Liabilities | | | 8,524,686 | | | | 477,050 | | | | 2,205,992 | | | | 10,253,628 | |
| | | | |
Redeemable Noncontrolling Interest | | | 230,438 | | | | 230,438 | | | | — | | | | — | |
| | | | |
Equity | | | | | | | | | | | | | | | | |
Shareholders’ Equity | | | | | | | | | | | | | | | | |
Shareholders’ equity before accumulated other comprehensive loss | | | 1,606,664 | | | | — | | | | — | | | | 1,606,664 | |
Accumulated other comprehensive loss | | | (114,339 | ) | | | — | | | | — | | | | (114,339 | ) |
| | | | | | | | | | | | | | | | |
Total Shareholders’ Equity | | | 1,492,325 | | | | — | | | | — | | | | 1,492,325 | |
Noncontrolling interest | | | 283,787 | | | | 97,766 | | | | — | | | | 186,021 | |
| | | | | | | | | | | | | | | | |
Total Equity | | | 1,776,112 | | | | 97,766 | | | | — | | | | 1,678,346 | |
| | | | | | | | | | | | | | | | |
Total Liabilities and Equity | | $ | 10,531,236 | | | $ | 805,254 | | | $ | 2,205,992 | | | $ | 11,931,974 | |
| | | | | | | | | | | | | | | | |
6
Forest City Enterprises, Inc. and Subsidiaries
Selected Financial Information
Consolidated Balance Sheet Information – January 31, 2012 (Unaudited)
| | | | | | | | | | | | | | | | |
| | | | | | | | | Plus | | | | |
| | | Full | | | Less | | | Unconsolidated | | | Pro-Rata | |
| | | Consolidation | | | Noncontrolling | | | Investments at | | | Consolidation | |
| | | (GAAP) | | | Interest | | | Pro-Rata | | | (Non-GAAP) | |
| | | (in thousands) | |
Assets | | | | | | | | | | | | | | | | |
Real Estate | | | | | | | | | | | | | | | | |
Completed rental properties | | | | | | | | | | | | | | | | |
Residential | | $ | 1,584,403 | | | $ | 27,003 | | | $ | 1,229,109 | | | $ | 2,786,509 | |
Commercial | | | | | | | | | | | | | | | | |
Retail centers | | | 2,638,954 | | | | 74,012 | | | | 1,203,459 | | | | 3,768,401 | |
Office and other buildings | | | 2,949,699 | | | | 94,310 | | | | 387,543 | | | | 3,242,932 | |
Corporate and other equipment | | | 10,392 | | | | — | | | | — | | | | 10,392 | |
| | | | | | | | | | | | | | | | |
Total completed rental properties | | | 7,183,448 | | | | 195,325 | | | | 2,820,111 | | | | 9,808,234 | |
| | | | |
Projects under construction | | | | | | | | | | | | | | | | |
Residential | | | 56,496 | | | | 988 | | | | 95,404 | | | | 150,912 | |
Commercial | | | | | | | | | | | | | | | | |
Retail centers | | | 595,011 | | | | 309 | | | | 7,945 | | | | 602,647 | |
Office and other buildings | | | 606,304 | | | | 370,626 | | | | 2,302 | | | | 237,980 | |
| | | | | | | | | | | | | | | | |
Total projects under construction | | | 1,257,811 | | | | 371,923 | | | | 105,651 | | | | 991,539 | |
Projects under development | | | | | | | | | | | | | | | | |
Residential | | | 776,817 | | | | 170,423 | | | | 17,693 | | | | 624,087 | |
Commercial | | | | | | | | | | | | | | | | |
Retail centers | | | 39,495 | | | | 99 | | | | 10,481 | | | | 49,877 | |
Office and other buildings | | | 254,856 | | | | 25,712 | | | | 2,670 | | | | 231,814 | |
| | | | | | | | | | | | | | | | |
Total projects under development | | | 1,071,168 | | | | 196,234 | | | | 30,844 | | | | 905,778 | |
| | | | | | | | | | | | | | | | |
Total projects under construction and development | | | 2,328,979 | | | | 568,157 | | | | 136,495 | | | | 1,897,317 | |
Land held for development and sale | | | 77,298 | | | | 7,451 | | | | 24,851 | | | | 94,698 | |
| | | | | | | | | | | | | | | | |
Total Real Estate | | | 9,589,725 | | | | 770,933 | | | | 2,981,457 | | | | 11,800,249 | |
Less accumulated depreciation | | | (1,526,503 | ) | | | (46,085 | ) | | | (557,613 | ) | | | (2,038,031 | ) |
| | | | | | | | | | | | | | | | |
Real Estate, net | | | 8,063,222 | | | | 724,848 | | | | 2,423,844 | | | | 9,762,218 | |
| | | | |
Cash and equivalents | | | 217,486 | | | | 9,324 | | | | 60,689 | | | | 268,851 | |
Restricted cash and escrowed funds | | | 542,566 | | | | 98,001 | | | | 109,282 | | | | 553,847 | |
Notes and accounts receivable, net | | | 406,244 | | | | 19,542 | | | | 36,684 | | | | 423,386 | |
Investments in and advances to unconsolidated entities | | | 609,079 | | | | (160,470 | ) | | | (542,772 | ) | | | 226,777 | |
Lease and mortgage procurement costs, net | | | 273,995 | | | | 8,760 | | | | 58,512 | | | | 323,747 | |
Prepaid expenses and other deferred costs, net | | | 227,354 | | | | 34,626 | | | | 20,708 | | | | 213,436 | |
Intangible assets, net | | | 107,192 | | | | 3 | | | | 11,076 | | | | 118,265 | |
Land held for divestiture | | | 57,145 | | | | 14,141 | | | | 45,257 | | | | 88,261 | |
| | | | | | | | | | | | | | | | |
Total Assets | | $ | 10,504,283 | | | $ | 748,775 | | | $ | 2,223,280 | | | $ | 11,978,788 | |
| | | | | | | | | | | | | | | | |
7
Forest City Enterprises, Inc. and Subsidiaries
Selected Financial Information
Consolidated Balance Sheet Information – January 31, 2012 (Unaudited)
| | | | | | | | | | | | | | | | |
| | | | | | | | | Plus | | | | |
| | | Full | | | Less | | | Unconsolidated | | | Pro-Rata | |
| | | Consolidation | | | Noncontrolling | | | Investments at | | | Consolidation | |
| | | (GAAP) | | | Interest | | | Pro-Rata | | | (Non-GAAP) | |
| | | (in thousands) | |
Liabilities and Equity | | | | | | | | | | | | | | | | |
Liabilities | | | | | | | | | | | | | | | | |
Mortgage debt and notes payable, nonrecourse | | | | | | | | | | | | | | | | |
Completed rental properties | | | | | | | | | | | | | | | | |
Residential | | $ | 1,008,576 | | | $ | 18,844 | | | $ | 949,015 | | | $ | 1,938,747 | |
Commercial | | | | | | | | | | | | | | | | |
Retail centers | | | 1,735,148 | | | | 67,371 | | | | 971,035 | | | | 2,638,812 | |
Office and other buildings | | | 2,064,588 | | | | 73,056 | | | | 301,910 | | | | 2,293,442 | |
| | | | | | | | | | | | | | | | |
Total completed rental properties | | | 4,808,312 | | | | 159,271 | | | | 2,221,960 | | | | 6,871,001 | |
| | | | |
Projects under construction | | | | | | | | | | | | | | | | |
Residential | | | 6,596 | | | | — | | | | 56,737 | | | | 63,333 | |
Commercial | | | | | | | | | | | | | | | | |
Retail centers | | | 330,533 | | | | — | | | | — | | | | 330,533 | |
Office and other buildings | | | 207,028 | | | | 127,685 | | | | — | | | | 79,343 | |
| | | | | | | | | | | | | | | | |
Total projects under construction | | | 544,157 | | | | 127,685 | | | | 56,737 | | | | 473,209 | |
Projects under development | | | | | | | | | | | | | | | | |
Residential | | | 272,195 | | | | 66,027 | | | | — | | | | 206,168 | |
Commercial | | | | | | | | | | | | | | | | |
Retail centers | | | — | | | | — | | | | — | | | | — | |
Office and other buildings | | | — | | | | — | | | | 2,887 | | | | 2,887 | |
| | | | | | | | | | | | | | | | |
Total projects under development | | | 272,195 | | | | 66,027 | | | | 2,887 | | | | 209,055 | |
| | | | | | | | | | | | | | | | |
Total projects under construction and development | | | 816,352 | | | | 193,712 | | | | 59,624 | | | | 682,264 | |
Land held for development and sale | | | 15,775 | | | | 1,578 | | | | 12,655 | | | | 26,852 | |
| | | | | | | | | | | | | | | | |
Total Mortgage debt and notes payable, nonrecourse | | | 5,640,439 | | | | 354,561 | | | | 2,294,239 | | | | 7,580,117 | |
Bank revolving credit facility | | | — | | | | — | | | | — | | | | — | |
Senior and subordinated debt | | | 1,038,529 | | | | — | | | | — | | | | 1,038,529 | |
| | | | |
Construction payables | | | 202,395 | | | | 61,564 | | | | 18,564 | | | | 159,395 | |
Operating accounts payable and accrued expenses | | | 621,582 | | | | 27,798 | | | | 161,323 | | | | 755,107 | |
Accrued derivative liability | | | 174,020 | | | | — | | | | 19,033 | | | | 193,053 | |
Deferred profit on NY retail joint venture transaction | | | 114,465 | | | | — | | | | — | | | | 114,465 | |
| | | | | | | | | | | | | | | | |
Total Accounts payable, accrued expenses and other liabilities | | | 1,112,462 | | | | 89,362 | | | | 198,920 | | | | 1,222,020 | |
| | | | |
Cash distributions and losses in excess of investments in unconsolidated entities | | | 279,708 | | | | (24,803 | ) | | | (282,105 | ) | | | 22,406 | |
Deferred income taxes | | | 433,040 | | | | — | | | | — | | | | 433,040 | |
Mortgage debt and notes payable, nonrecourse on land held for divestiture | | | 19,084 | | | | 1,721 | | | | 12,226 | | | | 29,589 | |
| | | | | | | | | | | | | | | | |
Total Liabilities | | | 8,523,262 | | | | 420,841 | | | | 2,223,280 | | | | 10,325,701 | |
| | | | |
Redeemable Noncontrolling Interest | | | 229,149 | | | | 229,149 | | | | — | | | | — | |
| | | | |
Equity | | | | | | | | | | | | | | | | |
Shareholders’ Equity | | | | | | | | | | | | | | | | |
Shareholders’ equity before accumulated other comprehensive loss | | | 1,587,526 | | | | — | | | | — | | | | 1,587,526 | |
Accumulated other comprehensive loss | | | (120,460 | ) | | | — | | | | — | | | | (120,460 | ) |
| | | | | | | | | | | | | | | | |
Total Shareholders’ Equity | | | 1,467,066 | | | | — | | | | — | | | | 1,467,066 | |
Noncontrolling interest | | | 284,806 | | | | 98,785 | | | | — | | | | 186,021 | |
| | | | | | | | | | | | | | | | |
Total Equity | | | 1,751,872 | | | | 98,785 | | | | — | | | | 1,653,087 | |
| | | | | | | | | | | | | | | | |
Total Liabilities and Equity | | $ | 10,504,283 | | | $ | 748,775 | | | $ | 2,223,280 | | | $ | 11,978,788 | |
| | | | | | | | | | | | | | | | |
8
Forest City Enterprises, Inc. and Subsidiaries
Selected Financial Information
Consolidated Earnings Information – Three Months Ended April 30, 2012 (Unaudited)
| | | | | | | | | | | | | | | | | | | | |
| | | | | | | | | Plus | | | | | | | |
| | | Full | | | Less | | | Unconsolidated | | | Plus | | | Pro-Rata | |
| | | Consolidation | | | Noncontrolling | | | Investments at | | | Discontinued | | | Consolidation | |
| | | (GAAP) | | | Interest | | | Pro-Rata | | | Operations | | | (Non-GAAP) | |
| | | (in thousands) | |
Revenues from real estate operations | | $ | 296,652 | | | $ | 12,561 | | | $ | 101,564 | | | $ | 292 | | | $ | 385,947 | |
| | | | | |
Expenses | | | | | | | | | | | | | | | | | | | | |
Operating expenses | | | 166,851 | | | | 9,057 | | | | 45,184 | | | | 141 | | | | 203,119 | |
Depreciation and amortization | | | 52,833 | | | | 957 | | | | 19,161 | | | | — | | | | 71,037 | |
Impairment of real estate | | | 1,381 | | | | — | | | | — | | | | — | | | | 1,381 | |
| | | | | | | | | | | | | | | | | | | | |
| | | 221,065 | | | | 10,014 | | | | 64,345 | | | | 141 | | | | 275,537 | |
| | | | | | | | | | | | | | | | | | | | |
Interest expense | | | (58,516 | ) | | | (2,724 | ) | | | (26,332 | ) | | | (97 | ) | | | (82,221 | ) |
Amortization of mortgage procurement costs | | | (2,869 | ) | | | (83 | ) | | | (837 | ) | | | — | | | | (3,623 | ) |
Loss on early extinguishment of debt | | | (719 | ) | | | (188 | ) | | | — | | | | — | | | | (531 | ) |
| | | | | |
Interest and other income | | | 10,679 | | | | 466 | | | | 210 | | | | — | | | | 10,423 | |
Net gain on disposition of full or partial interests in rental properties | | | — | | | | — | | | | — | | | | 7,914 | | | | 7,914 | |
| | | | | | | | | | | | | | | | | | | | |
Earnings before income taxes | | | 24,162 | | | | 18 | | | | 10,260 | | | | 7,968 | | | | 42,372 | |
| | | | | | | | | | | | | | | | | | | | |
Income tax expense | | | | | | | | | | | | | | | | | | | | |
Current | | | 1,129 | | | | — | | | | — | | | | 511 | | | | 1,640 | |
Deferred | | | 8,444 | | | | — | | | | — | | | | 3,019 | | | | 11,463 | |
| | | | | | | | | | | | | | | | | | | | |
| | | 9,573 | | | | — | | | | — | | | | 3,530 | | | | 13,103 | |
| | | | | | | | | | | | | | | | | | | | |
Equity in earnings (loss) of unconsolidated entities | | | 3,773 | | | | 30 | | | | (10,260 | ) | | | — | | | | (6,517 | ) |
| | | | | | | | | | | | | | | | | | | | |
Earnings from continuing operations | | | 18,362 | | | | 48 | | | | — | | | | 4,438 | | | | 22,752 | |
| | | | | |
Discontinued operations, net of tax: | | | | | | | | | | | | | | | | | | | | |
Operating earnings from rental properties | | | 41 | | | | 8 | | | | — | | | | (33 | ) | | | — | |
Gain on disposition of rental properties | | | 5,370 | | | | 965 | | | | — | | | | (4,405 | ) | | | — | |
| | | | | | | | | | | | | | | | | | | | |
| | | 5,411 | | | | 973 | | | | — | | | | (4,438 | ) | | | — | |
| | | | | | | | | | | | | | | | | | | | |
Net earnings | | | 23,773 | | | | 1,021 | | | | — | | | | — | | | | 22,752 | |
| | | | | |
Noncontrolling Interests | | | | | | | | | | | | | | | | | | | | |
Earnings from continuing operations attributable to noncontrolling interests | | | (48 | ) | | | (48 | ) | | | — | | | | — | | | | — | |
Earnings from discontinued operations attributable to noncontrolling interests | | | (973 | ) | | | (973 | ) | | | — | | | | — | | | | — | |
| | | | | | | | | | | | | | | | | | | | |
| | | (1,021 | ) | | | (1,021 | ) | | | — | | | | — | | | | — | |
| | | | | | | | | | | | | | | | | | | | |
Net earnings attributable to Forest City Enterprises, Inc. | | $ | 22,752 | | | $ | — | | | $ | — | | | $ | — | | | $ | 22,752 | |
| | | | | | | | | | | | | | | | | | | | |
Preferred dividends | | | (3,850 | ) | | | — | | | | — | | | | — | | | | (3,850 | ) |
| | | | | | | | | | | | | | | | | | | | |
Net earnings attributable to Forest City Enterprises, Inc. common shareholders | | $ | 18,902 | | | $ | — | | | $ | — | | | $ | — | | | $ | 18,902 | |
| | | | | | | | | | | | | | | | | | | | |
9
Forest City Enterprises, Inc. and Subsidiaries
Selected Financial Information
Consolidated Earnings Information – Three Months Ended April 30, 2011 (Unaudited)
| | | | | | | | | | | | | | | | | | | | |
| | | | | | | | | Plus | | | | | | | |
| | | Full | | | Less | | | Unconsolidated | | | Plus | | | Pro-Rata | |
| | | Consolidation | | | Noncontrolling | | | Investments at | | | Discontinued | | | Consolidation | |
| | | (GAAP) | | | Interest | | | Pro-Rata | | | Operations | | | (Non-GAAP) | |
| | | (in thousands) | |
Revenues from real estate operations | | $ | 304,180 | | | $ | 12,498 | | | $ | 82,714 | | | $ | 9,252 | | | $ | 383,648 | |
| | | | | |
Expenses | | | | | | | | | | | | | | | | | | | | |
Operating expenses | | | 160,689 | | | | 7,400 | | | | 37,684 | | | | 6,679 | | | | 197,652 | |
Depreciation and amortization | | | 55,853 | | | | 1,638 | | | | 13,690 | | | | 1,626 | | | | 69,531 | |
Impairment of real estate | | | 4,835 | | | | — | | | | — | | | | — | | | | 4,835 | |
| | | | | | | | | | | | | | | | | | | | |
| | | 221,377 | | | | 9,038 | | | | 51,374 | | | | 8,305 | | | | 272,018 | |
| | | | | | | | | | | | | | | | | | | | |
Interest expense | | | (66,181 | ) | | | (3,832 | ) | | | (23,107 | ) | | | (1,236 | ) | | | (86,692 | ) |
Amortization of mortgage procurement costs | | | (2,882 | ) | | | (130 | ) | | | (618 | ) | | | (262 | ) | | | (3,632 | ) |
Loss on extinguishment of debt | | | (296 | ) | | | (4 | ) | | | — | | | | — | | | | (292 | ) |
| | | | | |
Interest and other income | | | 15,507 | | | | (140 | ) | | | 117 | | | | — | | | | 15,764 | |
Net gain on disposition of full or partial interests in rental properties | | | 9,561 | | | | — | | | | 12,567 | | | | 10,038 | | | | 32,166 | |
| | | | | | | | | | | | | | | | | | | | |
Earnings (loss) before income taxes | | | 38,512 | | | | (646 | ) | | | 20,299 | | | | 9,487 | | | | 68,944 | |
| | | | | | | | | | | | | | | | | | | | |
Income tax expense | | | | | | | | | | | | | | | | | | | | |
Current | | | 17,633 | | | | — | | | | — | | | | 578 | | | | 18,211 | |
Deferred | | | 116 | | | | — | | | | — | | | | 3,921 | | | | 4,037 | |
| | | | | | | | | | | | | | | | | | | | |
| | | 17,749 | | | | — | | | | — | | | | 4,499 | | | | 22,248 | |
| | | | | | | | | | | | | | | | | | | | |
Equity in earnings (loss) of unconsolidated entities | | | 19,994 | | | | 48 | | | | (20,299 | ) | | | — | | | | (353 | ) |
| | | | | | | | | | | | | | | | | | | | |
Earnings (loss) from continuing operations | | | 40,757 | | | | (598 | ) | | | — | | | | 4,988 | | | | 46,343 | |
| | | | | |
Discontinued operations, net of tax: | | | | | | | | | | | | | | | | | | | | |
Operating earnings from rental properties | | | 997 | | | | 1,335 | | | | — | | | | 338 | | | | — | |
Gain on disposition of rental properties | | | 5,719 | | | | 393 | | | | — | | | | (5,326 | ) | | | — | |
| | | | | | | | | | | | | | | | | | | | |
| | | 6,716 | | | | 1,728 | | | | — | | | | (4,988 | ) | | | — | |
| | | | | | | | | | | | | | | | | | | | |
Net earnings | | | 47,473 | | | | 1,130 | | | | — | | | | — | | | | 46,343 | |
| | | | | |
Noncontrolling Interests | | | | | | | | | | | | | | | | | | | | |
Loss from continuing operations attributable to noncontrolling interests | | | 598 | | | | 598 | | | | — | | | | — | | | | — | |
Earnings from discontinued operations attributable to noncontrolling interests | | | (1,728 | ) | | | (1,728 | ) | | | — | | | | — | | | | — | |
| | | | | | | | | | | | | | | | | | | | |
| | | (1,130 | ) | | | (1,130 | ) | | | — | | | | — | | | | — | |
| | | | | | | | | | | | | | | | | | | | |
Net earnings attributable to Forest City Enterprises, Inc. | | $ | 46,343 | | | $ | — | | | $ | — | | | $ | — | | | $ | 46,343 | |
| | | | | | | | | | | | | | | | | | | | |
Preferred dividends | | | (3,850 | ) | | | — | | | | — | | | | — | | | | (3,850 | ) |
| | | | | | | | | | | | | | | | | | | | |
Net earnings attributable to Forest City Enterprises, Inc. common shareholders | | $ | 42,493 | | | $ | — | | | $ | — | | | $ | — | | | $ | 42,493 | |
| | | | | | | | | | | | | | | | | | | | |
10
Forest City Enterprises, Inc. and Subsidiaries
Selected Financial Information
Net Asset Value Components – April 30, 2012
The “Net Asset Value Components” table below represents components of our business relevant to calculate Net Asset Value (“NAV”), a non-GAAP measure. There is no directly comparable GAAP financial measure to NAV. We consider NAV to be a useful supplemental measure which assists both management and investors to estimate the fair value of our Company. The calculation of the net asset value involves significant estimates and can be calculated using various methods. Each individual investor must determine the specific methodology, assumptions and estimates to use to arrive at an estimated NAV of the Company.
The components of NAV do not consider the potential changes in rental and fee income streams, or development platform. The components include non-GAAP financial measures, such as NOI and information related to our rental properties business prepared using the pro-rata consolidation method. Although these measures are not presented in accordance with GAAP, investors can use these non-GAAP measures as supplementary information to evaluate our business. The non-GAAP measures presented are not intended to be performance measures that should be regarded as alternatives to, or more meaningful than, our GAAP measures.
| | | | | | | | | | | | | | | | | | | | |
| Net Asset Value Components - April 30, 2012 | |
| Completed Rental Properties (“CRP”) | |
| (Dollars in millions at pro-rata) | | Q1 2012 NOI(1) | | | Annualized
NOI(2) | | | Net Stabilized
Adjustments (3) | | | Annualized
Stabilized NOI | | | Nonrecourse Debt(4) | |
| | | | | | A | | | B | | | =A + B | | | | |
Commercial Real Estate | | | | | | | | | | | | | | | | | | | | |
Retail | | $ | 59.0 | | | $ | 236.0 | | | $ | 4.9 | | | $ | 240.9 | | | $ | (2,641.9 | ) |
Office | | | 62.8 | | | | 251.2 | | | | 0.5 | | | | 251.7 | | | | (2,297.5 | ) |
Other | | | (6.3 | ) | | | (25.2 | ) | | | 9.7 | | | | (15.5 | ) | | | | |
Total Commercial Real Estate | | $ | 115.5 | | | $ | 462.0 | | | $ | 15.1 | | | $ | 477.1 | | | $ | (4,939.4 | ) |
Residential Real Estate | | | | | | | | | | | | | | | | | | | | |
Apartments | | $ | 38.1 | | | $ | 152.4 | | | $ | (2.8 | ) | | $ | 149.6 | | | $ | (1,975.5 | ) |
Subsidized Senior Housing(5) | | | 4.4 | | | | 17.6 | | | | — | | | | 17.6 | | | | | |
Military Housing | | | 7.3 | | | | 29.2 | | | | (14.2 | ) | | | 15.0 | | | | | |
Other | | | (3.3 | ) | | | (13.2 | ) | | | — | | | | (13.2 | ) | | | | |
Total Residential Real Estate | | $ | 46.5 | | | $ | 186.0 | | | $ | (17.0 | ) | | $ | 169.0 | | | $ | (1,975.5 | ) |
Total Rental Properties | | $ | 162.0 | | | $ | 648.0 | | | $ | (1.9 | ) | | $ | 646.1 | | | $ | (6,914.9 | ) |
Development Pipeline Debt Adj. NET(6) | | | | | | | | | | | | | | | | | | | 454.8 | |
Adjusted Total Rental Properties | | $ | 162.0 | | | $ | 648.0 | | | $ | (1.9 | ) | | $ | 646.1 | | | $ | (6,460.1 | ) |
| Development Pipeline | |
| | | | | | | | | | | | Book Value | | | Nonrecourse
Debt | |
Westchester's Ridge Hill(Adjusted for amounts included in CRP)(6) | | | | | | | | | | | | | | $ | 346.2 | | | $ | (193.7 | ) |
8 Spruce Street(Adjusted for amounts included in CRP)(6) | | | | | | | | | | | | | | | 427.4 | | | | (261.1 | ) |
| | | | | | | | | | | | | | | | | |
Total development pipeline adjustments | | | | | | | | | | | | | | | 773.6 | | | | (454.8 | ) |
Projects under construction(4) | | | | | | | | | | | | | | | 899.6 | | | | (434.3 | ) |
| | | | | | | | | | | | | | | | | |
Adjusted projects under construction | | | | | | | | | | | | | | $ | 1,673.2 | | | $ | (889.1 | ) |
| | | | | | | | | | | | | | | | | |
Projects under development(4) | | | | | | | | | | | | | | $ | 939.3 | | | $ | (181.9 | ) |
Land held for development and sale(4) | | | | | | | | | | | | | | $ | 97.6 | | | $ | (26.6 | ) |
| Other Tangible Assets | |
| | | | | | |
| | | | | | | | | | | | Book Value (4) | | | Nonrecourse
Debt(4) | |
Cash and equivalents | | | | | | | | | | | | | | $ | 336.7 | | | | | |
Restricted cash and escrowed funds | | | | | | | | | | | | | | $ | 429.0 | | | | | |
Notes and accounts receivable, net(7) | | | | | | | | | | | | | | $ | 386.9 | | | | | |
Net investments and advances to unconsolidated entities | | | | | | | | | | | | | | $ | 212.6 | | | | | |
Prepaid expenses and other deferred costs, net | | | | | | | | | | | | | | $ | 215.2 | | | | | |
Land held for divestiture | | | | | | | | | | | | | | $ | 88.5 | | | $ | (28.6 | ) |
| Recourse Debt and Other Liabilities | |
| | | | | | |
| | | | | | | | | | | | Book Value (4) | | | | |
Bank revolving credit facility | | | | | | | | | | | | | | $ | — | | | | | |
Senior and subordinated debt | | | | | | | | | | | | | | $ | (1,038.6 | ) | | | | |
Less: convertible debt | | | | | | | | | | | | | | $ | 599.2 | | | | | |
Construction payables | | | | | | | | | | | | | | $ | (155.1 | ) | | | | |
Operating accounts payable and accrued expenses(8) | | | | | | | | | | | | | | $ | (706.4 | ) | | | | |
| Weighted Average Shares Outstanding—Diluted | |
Number of shares for the three months ended April 30, 2012(In millions) | | | | | | | | 221.8 | | | | | |
11
Forest City Enterprises, Inc. and Subsidiaries
Selected Financial Information
Net Asset Value Components – April 30, 2012(continued)
| (1) | Pro-rata Q1 2012 NOI is reconciled to NOI at full consolidation by Product Group for the three months ended April 30, 2012 in the Supplemental Operating Information section of this supplemental package. NOI generated from the casino land sale of $36.5 million has been excluded from total NOI used in the Net Asset Value Component schedule. |
| (2) | Pro-rata annualized NOI is calculated by taking the Q1 2012 NOI times a multiple of four. |
| (3) | The net stabilized adjustments column represents net adjustments required to arrive at a fully stabilized NOI for those properties currently in initial lease up periods, net of the removal of partial period NOI for recently sold properties. For those properties currently in initial lease up periods we have included stabilization adjustments as follows: |
| | a) | Except forWestchester’s Ridge Hill and8 Spruce Street, NOI for the properties in lease up are reflected at 5% of the pro-rata cost disclosed in our Development Pipeline disclosure (Current Year and Prior Two Year Openings). This assumption does not reflect Forest City’s anticipated NOI, but rather is used in order to establish a hypothetical basis for valuation of lease up properties. See note 6, which describes the treatment ofWestchester’s Ridge Hill and8 Spruce Street. |
| | b) | At the conclusion of the initial development period at each of our military housing communities, we estimate the ongoing property management fees, net of operating expenses, to be $15.0 million. |
The net stabilized adjustments are not comparable to any GAAP measure and therefore do not have a reconciliation to the nearest comparable GAAP measure.
| (4) | Amounts are derived from the respective pro-rata balance sheet line item as of April 30, 2012 and are reconciled to their GAAP equivalents in the Selected Financial Information section of this supplemental package. |
| (5) | Represents limited-distribution subsidized senior housing properties. |
| (6) | Westchester’s Ridge Hill and8 Spruce Street have their assets shown in the Development Pipeline section of the model.Westchester’s Ridge Hill, as of April 30, 2012, had $346.2 million of costs incurred at pro-rata consolidation and $193.7 million of mortgage debt at pro-rata consolidation which were transferred to CRP.8 Spruce Street, as of April 30, 2012, had $427.4 million of costs incurred at pro-rata consolidation and $261.1 million of mortgage debt at pro-rata consolidation which were transferred to CRP. In order to account for the phased openings ofWestchester’s Ridge Hill and8 Spruce Street as NAV components we have made the following adjustments: |
| | a) | All costs and associated debt forWestchester’s Ridge Hill and 8 Spruce Streetfor purposes exclusive to this disclosure are accounted for as a component of “Adjusted Projects Under Construction” in the Development Pipeline section of this schedule. Accordingly, all NOI, through the net stabilized adjustments column, and debt have been removed from the CRP section of the NAV schedule. |
| (7) | Includes $157.7 million of straight-line rent receivable (net of $15.9 million of allowance for doubtful accounts). |
| (8) | Includes $41.7 million of straight-line rent payable. |
12
Forest City Enterprises, Inc. and Subsidiaries
Supplemental Operating Information
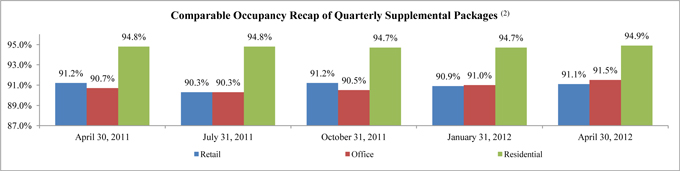
Occupancy Data - April 30, 2012 and 2011
Retail and office occupancy is based on square feet leased at the end of the fiscal quarter. Average Occupancy Year-to-Date for retail and office is calculated by dividing the sum of leased square feet at the beginning and end of the period by two. Residential occupancy represents total units occupied divided by total units available. Average Occupancy for residential is calculated by dividing gross potential rent less vacancy by gross potential rent.
We analyze our occupancy percentages by each of our major product lines as follows:
| | | | | | | | | | |
| | | Occupancy
As of
April 30, 2012 | | Average
Occupancy
Year-to-Date
April 30, 2012 | | | | Occupancy
As of
April 30, 2011 | | Average
Occupancy
Year-to-Date
April 30, 2011 |
Retail | | | | | | | | | | |
Comparable | | 91.1% | | 91.0% | | | | 91.1% | | 91.1% |
Total | | 89.0% | | 89.0% | | | | 91.1% | | 91.1% |
Office | | | | | | | | | | |
Comparable | | 91.5% | | 91.2% | | | | 91.0% | | 90.2% |
Total | | 89.5% | | 89.3% | | | | 89.6% | | 88.7% |
Residential(1) | | | | | | | | | | |
Comparable | | 94.2% | | 94.9% | | | | 93.6% | | 94.6% |
Total | | 93.5% | | 94.0% | | | | 92.6% | | 91.5% |
The graph below provides comparable occupancy as reported in previous quarters. These amounts may differ from above because the properties that qualify as comparable change from period to period.
| (1) | Excludes military and limited-distribution subsidized senior housing units. |
| (2) | Represents Comparable Occupancy for Retail and Office as of the applicable date and Comparable Average Occupancy Year-to-Date for Residential. |
13
Forest City Enterprises, Inc. and Subsidiaries
Supplemental Operating Information
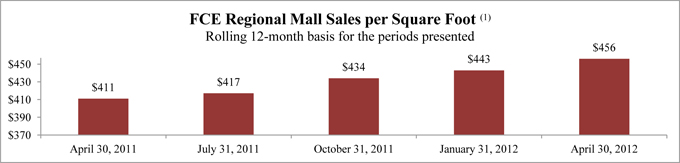
Retail Sales Data
The following graphs provide current and historical retail sales for small shop inline tenants at our regional malls. We believe this data allows investors to better understand the productivity of our tenants.
The graph below represents regional mall sales for tenants that are open and operating for the duration of each rolling 12-month period presented. Those tenants that have begun and/or ceased operations in the periods shown are not included.
The graph below represents regional mall sales for all tenants that are open and operating for the duration of each comparable period presented. Those tenants that have begun and/or ceased operations in the periods shown are not included.
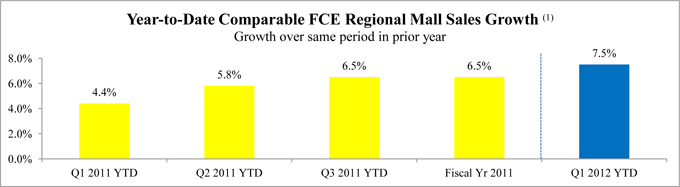
| (1) | All sales data is derived from schedules provided by our tenants and is not subject to the same internal control and verification procedures that are applied to the other data supplied in the Company’s supplemental package. In addition, the data is presented on a one-month lag to be consistent with the calendar year end of our tenants. |
14
Forest City Enterprises, Inc. and Subsidiaries
Supplemental Operating Information
Leasing Summary
Retail Centers
The following tables represent those new leases and gross leasable area (“GLA”) signed on the same space in which there was a former tenant and existing tenant renewals.
Regional Malls—Quarterly
| | | | | | | | | | | | | | | | | | | | |
Quarter | | Number
of
Leases
Signed | | | GLA
Signed | | | Contractual
Rent Per
Square Foot (1)(2) | | | Prior Rent Per
Square Foot (1)(2) | | | Cash Basis %
Change over
Prior Rent | |
2nd Quarter 2011 | | | 30 | | | | 66,897 | | | $ | 79.63 | | | $ | 72.72 | | | | 10 | % |
3rd Quarter 2011 | | | 48 | | | | 162,170 | | | $ | 49.53 | | | $ | 45.43 | | | | 9 | % |
4th Quarter 2011 | | | 59 | | | | 149,030 | | | $ | 60.95 | | | $ | 55.35 | | | | 10 | % |
1st Quarter 2012 | | | 38 | | | | 88,993 | | | $ | 58.67 | | | $ | 53.37 | | | | 10 | % |
| | | | | | | | | | | | | | | | | | | | |
Total—12 months | | | 175 | | | | 467,090 | | | $ | 59.24 | | | $ | 54.02 | | | | 10 | % |
| | | | | | | | | | | | | | | | | | | | |
Specialty Retail Centers—Quarterly(3)
| | | | | | | | | | | | | | | | | | | | |
| | | Number | | | | | | Contractual | | | | | | Cash Basis % | |
| | | of Leases | | | GLA | | | Rent Per | | | Prior Rent Per | | | Change over | |
Quarter | | Signed | | | Signed | | | Square Foot (1)(2) | | | Square Foot (1)(2) | | | Prior Rent | |
2nd Quarter 2011 | | | 3 | | | | 13,779 | | | $ | 20.79 | | | $ | 20.58 | | | | 1 | % |
3rd Quarter 2011 | | | 10 | | | | 34,385 | | | $ | 62.29 | | | $ | 56.11 | | | | 11 | % |
4th Quarter 2011 | | | 9 | | | | 83,671 | | | $ | 31.12 | | | $ | 27.86 | | | | 12 | % |
1st Quarter 2012 | | | 7 | | | | 29,117 | | | $ | 41.95 | | | $ | 41.56 | | | | 1 | % |
| | | | | | | | | | | | | | | | | | | | |
Total—12 months | | | 29 | | | | 160,952 | | | $ | 38.85 | | | $ | 35.75 | | | | 9 | % |
| | | | | | | | | | | | | | | | | | | | |
Office Buildings
The following table represents all new leases compared to terms of all expired leases in our office portfolio over the past 12 months.
Quarterly
| | | | | | | | | | | | | | | | | | | | | | | | | | | | |
| | | Number | | | Number | | | | | | | | | Contractual | | | Expiring | | | Cash Basis % | |
| | | of Leases | | | of Leases | | | GLA | | | GLA | | | Rent Per | | | Rent Per | | | Change over | |
Quarter | | Signed | | | Expired | | | Signed | | | Expired | | | Square Foot (2) | | | Square Foot (2) | | | Prior Rent | |
2nd Quarter 2011 | | | 19 | | | | 19 | | | | 127,285 | | | | 110,492 | | | $ | 19.22 | | | $ | 18.37 | | | | 5 | % |
3rd Quarter 2011 | | | 33 | | | | 27 | | | | 178,838 | | | | 178,598 | | | $ | 26.20 | | | $ | 29.22 | | | | (10 | %) |
4th Quarter 2011 | | | 46 | | | | 33 | | | | 703,488 | | | | 683,121 | | | $ | 30.13 | | | $ | 27.86 | | | | 8 | % |
1st Quarter 2012 | | | 38 | | | | 28 | | | | 340,382 | | | | 239,112 | | | $ | 27.40 | | | $ | 28.01 | | | | (2 | %) |
| | | | | | | | | | | | | | | | | | | | | | | | | | | | |
Total—12 months | | | 136 | | | | 107 | | | | 1,349,993 | | | | 1,211,323 | | | $ | 27.90 | | | $ | 27.23 | | | | 2 | % |
| | | | | | | | | | | | | | | | | | | | | | | | | | | | |
| (1) | Retail contractual rent per square foot includes base rent and fixed additional charges for marketing/promotional charges and common area maintenance. |
| (2) | For all new leases, contractual rent per square foot is the new base rate as of rental commencement. For all expiring leases, contractual rent per square foot is the base rate at the time of expiration, plus any applicable escalations. |
| (3) | Prior periods have been recast to exclude leases atQuebec Square, a specialty retail center located in Denver, Colorado, which was sold Q1-12. |
Apartment Communities
| | | | | | | | | | | | | | | | | | | | | | | | | | | | |
| | | | | | Monthly Average Residential Rental Rates (2) | | | Average Residential Occupancy | |
| | | Leasable | | | Three Months Ended | | | | | | Year-to-Date | | | | |
| | | Units at | | | April 30, | | | | | | April 30, | | | | |
Comparable Apartment Communities(1) | | Pro-Rata % | | | 2012 | | | 2011 | | | % Change | | | 2012 | | | 2011 | | | % Change | |
Core Markets | | | 8,221 | | | $ | 1,529 | | | $ | 1,448 | | | | 5.6 | % | | | 95.7 | % | | | 94.7 | % | | | 1.0 | % |
Non-Core Markets | | | 9,081 | | | $ | 862 | | | $ | 829 | | | | 4.0 | % | | | 93.5 | % | | | 94.4 | % | | | (0.9 | %) |
| | | | | | | | | | | | | | | | | | | | | | | | | | | | |
Total Comparable Apartments | | | 17,302 | | | $ | 1,179 | | | $ | 1,123 | | | | 5.0 | % | | | 94.9 | % | | | 94.6 | % | | | 0.3 | % |
| | | | | | | | | | | | | | | | | | | | | | | | | | | | |
| (1) | Includes apartment communities completely opened and operated in both periods presented. Excludes all military and limited-distribution subsidized senior housing units. These apartment communities include units leased at affordable apartment rates which provide a discount from average market rental rates. As of April 30, 2012, 21.9% of our core market leasable units and 1.7% of our non-core market leasable units were affordable housing. |
| (2) | Represents gross potential rent less concessions. |
15
(THIS PAGE INTENTIONALLY LEFT BLANK)
Forest City Enterprises, Inc. and Subsidiaries
Supplemental Operating Information
Comparable NOI is defined as NOI from properties opened and operated in the three months ended April 30, 2012 and 2011. The schedules below present Pro-Rata Comparable NOI for the three months ended April 30, 2012.
Comparable Net Operating Income (% change over same period prior year)
| | | | |
| | | Three Months Ended | |
| | | April 30, 2012 | |
Retail | | | 3.0 | % |
Office | | | 3.2 | % |
Residential | | | 11.0 | % |
Total | | | 4.8 | % |
The tables below provide the percentage change of Comparable NOI as reported in previous quarters. GAAP reconciliations for previous quarters can be found in prior supplemental packages.
| | | | | | | | | | | | | | | | | | | | |
| Quarterly Historical Trends | | | | | |
| |
| | | Three Months Ended | |
| | | April 30,
2012 | | | January 31,
2012 | | | October 31,
2011 | | | July 31,
2011 | | | April 30,
2011 | |
Retail | | | 3.0 | % | | | 4.7 | % | | | (1.5 | %) | | | 1.6 | % | | | 2.6 | % |
Office | | | 3.2 | % | | | 0.5 | % | | | (7.6 | %) | | | 3.1 | % | | | (2.5 | %) |
Residential | | | 11.0 | % | | | 11.9 | % | | | 12.0 | % | | | 3.1 | % | | | 4.8 | % |
Total (1) | | | 4.8 | % | | | 4.6 | % | | | (1.4 | %) | | | 2.6 | % | | | 0.9 | % |
| | | | | | | | | | | | |
| Annual Historical Trends | | | | | |
| |
| | | Years Ended | |
| | | January 31,
2012 | | | January 31,
2011 | | | January 31,
2010 | |
Retail | | | 2.6 | % | | | 2.2 | % | | | (3.9 | %) |
Office | | | (2.6 | %) | | | 2.1 | % | | | 5.4 | % |
Residential | | | 7.3 | % | | | 4.3 | % | | | (3.9 | %) |
Total (1) | | | 1.4 | % | | | 2.5 | % | | | (0.7 | %) |
| (1) | Prior periods have been recast to exclude hotels. The Company believes this change will improve disclosure by allowing investors to see the overall total comparable NOI results of strictly our core product types. |
16
Forest City Enterprises, Inc. and Subsidiaries
Supplemental Operating Information
| | | | | | | | | | | | | | | | | | | | | | | | | | | | | | | | | | | | | | | | |
| | | Net Operating Income(dollars in thousands) | |
| | | Three Months Ended April 30, 2012 | | | Three Months Ended April 30, 2011 | | | % Change | |
| | | Full | | | Less | | | Plus | | | Pro-Rata | | | Full | | | Less | | | Plus | | | Pro-Rata | | | Full | | | Pro-Rata | |
| | | Consolidation | | | Noncontrolling | | | Discontinued | | | Consolidation | | | Consolidation | | | Noncontrolling | | | Discontinued | | | Consolidation | | | Consolidation | | | Consolidation | |
| | | (GAAP) | | | Interest | | | Operations | | | (Non-GAAP) | | | (GAAP) | | | Interest | | | Operations | | | (Non-GAAP) | | | (GAAP) | | | (Non-GAAP) | |
Commercial Group | | | | | | | | | | | | | | | | | | | | | | | | | | | | | | | | | | | | | | | | |
Retail | | | | | | | | | | | | | | | | | | | | | | | | | | | | | | | | | | | | | | | | |
Comparable | | $ | 58,865 | | | $ | 1,773 | | | $ | — | | | $ | 57,092 | | | $ | 57,337 | | | $ | 1,920 | | | $ | — | | | $ | 55,417 | | | | 2.7 | % | | | 3.0 | % |
| | | | | | | | | | | | | | | | | | | | | | | | | | | | | | | | | | | | | | | | |
Total | | | 60,917 | | | | 2,076 | | | | 148 | | | | 58,989 | | | | 66,791 | | | | 2,840 | | | | 549 | | | | 64,500 | | | | | | | | | |
| | | | | | | | | | |
Office Buildings | | | | | | | | | | | | | | | | | | | | | | | | | | | | | | | | | | | | | | | | |
Comparable | | | 60,865 | | | | 2,251 | | | | — | | | | 58,614 | | | | 58,873 | | | | 2,057 | | | | — | | | | 56,816 | | | | 3.4 | % | | | 3.2 | % |
| | | | | | | | | | | | | | | | | | | | | | | | | | | | | | | | | | | | | | | | |
Total | | | 65,185 | | | | 2,408 | | | | — | | | | 62,777 | | | | 61,998 | | | | 2,026 | | | | 2,134 | | | | 62,106 | | | | | | | | | |
| | | | | | | | | | |
Hotels | | | 1,096 | | | | — | | | | — | | | | 1,096 | | | | 956 | | | | — | | | | (446 | ) | | | 510 | | | | | | | | | |
| | | | | | | | | | |
Land Sales(1) | | | 36,484 | | | | — | | | | — | | | | 36,484 | | | | 42,585 | | | | (782 | ) | | | — | | | | 43,367 | | | | | | | | | |
| | | | | | | | | | |
Other(2) | | | (9,371 | ) | | | (2,011 | ) | | | — | | | | (7,360 | ) | | | 719 | | | | (54 | ) | | | — | | | | 773 | | | | | | | | | |
| | | | | | | | | | | | | | | | | | | | | | | | | | | | | | | | | | | | | | | | |
Total Commercial Group | | | | | | | | | | | | | | | | | | | | | | | | | | | | | | | | | | | | | | | | |
Comparable | | | 119,730 | | | | 4,024 | | | | — | | | | 115,706 | | | | 116,210 | | | | 3,977 | | | | — | | | | 112,233 | | | | 3.0 | % | | | 3.1 | % |
| | | | | | | | | | | | | | | | | | | | | | | | | | | | | | | | | | | | | | | | |
Total | | | 154,311 | | | | 2,473 | | | | 148 | | | | 151,986 | | | | 173,049 | | | | 4,030 | | | | 2,237 | | | | 171,256 | | | | | | | | | |
| | | | | | | | | | |
Residential Group | | | | | | | | | | | | | | | | | | | | | | | | | | | | | | | | | | | | | | | | |
Apartments | | | | | | | | | | | | | | | | | | | | | | | | | | | | | | | | | | | | | | | | |
Comparable | | | 35,690 | | | | 634 | | | | — | | | | 35,056 | | | | 32,085 | | | | 496 | | | | — | | | | 31,589 | | | | 11.2 | % | | | 11.0 | % |
| | | | | | | | | | | | | | | | | | | | | | | | | | | | | | | | | | | | | | | | |
Total | | | 38,963 | | | | 807 | | | | — | | | | 38,156 | | | | 31,585 | | | | 444 | | | | — | | | | 31,141 | | | | | | | | | |
| | | | | | | | | | |
Subsidized Senior Housing | | | 4,400 | | | | 39 | | | | — | | | | 4,361 | | | | 3,961 | | | | 97 | | | | — | | | | 3,864 | | | | | | | | | |
| | | | | | | | | | |
Military Housing | | | 7,542 | | | | 195 | | | | — | | | | 7,347 | | | | 5,968 | | | | — | | | | — | | | | 5,968 | | | | | | | | | |
| | | | | | | | | | |
Land Sales | | | — | | | | — | | | | — | | | | — | | | | 158 | | | | 16 | | | | — | | | | 142 | | | | | | | | | |
| | | | | | | | | | |
Other(2) | | | (3,187 | ) | | | 143 | | | | — | | | | (3,330 | ) | | | 98 | | | | 143 | | | | — | | | | (45 | ) | | | | | | | | |
| | | | | | | | | | | | | | | | | | | | | | | | | | | | | | | | | | | | | | | | |
Total Residential Group | | | | | | | | | | | | | | | | | | | | | | | | | | | | | | | | | | | | | | | | |
Comparable | | | 35,690 | | | | 634 | | | | — | | | | 35,056 | | | | 32,085 | | | | 496 | | | | — | | | | 31,589 | | | | 11.2 | % | | | 11.0 | % |
| | | | | | | | | | | | | | | | | | | | | | | | | | | | | | | | | | | | | | | | |
Total | | | 47,718 | | | | 1,184 | | | | — | | | | 46,534 | | | | 41,770 | | | | 700 | | | | — | | | | 41,070 | | | | | | | | | |
| | | | | | | | | | |
Total Rental Properties | | | | | | | | | | | | | | | | | | | | | | | | | | | | | | | | | | | | | | | | |
Comparable | | | 155,420 | | | | 4,658 | | | | — | | | | 150,762 | | | | 148,295 | | | | 4,473 | | | | — | | | | 143,822 | | | | 4.8 | % | | | 4.8 | % |
| | | | | | | | | | | | | | | | | | | | | | | | | | | | | | | | | | | | | | | | |
Total | | | 202,029 | | | | 3,657 | | | | 148 | | | | 198,520 | | | | 214,819 | | | | 4,730 | | | | 2,237 | | | | 212,326 | | | | | | | | | |
| | | | | | | | | | |
Land Development Group | | | 3,075 | | | | 343 | | | | — | | | | 2,732 | | | | 2,251 | | | | 276 | | | | — | | | | 1,975 | | | | | | | | | |
| | | | | | | | | | |
The Nets | | | (6,958 | ) | | | — | | | | — | | | | (6,958 | ) | | | (304 | ) | | | — | | | | — | | | | (304 | ) | | | | | | | | |
| | | | | | | | | | |
Corporate Activities | | | (13,015 | ) | | | — | | | | — | | | | (13,015 | ) | | | (14,931 | ) | | | — | | | | — | | | | (14,931 | ) | | | | | | | | |
| | | | | | | | | | | | | | | | | | | | | | | | | | | | | | | | | | | | | | | | |
Grand Total | | $ | 185,131 | | | $ | 4,000 | | | $ | 148 | | | $ | 181,279 | | | $ | 201,835 | | | $ | 5,006 | | | $ | 2,237 | | | $ | 199,066 | | | | | | | | | |
| | | | | | | | | | | | | | | | | | | | | | | | | | | | | | | | | | | | | | | | |
| (1) | Includes $36,484 and $42,622 of NOI generated from the casino land sale at full and pro-rata consolidation for the three months ended April 30, 2012 and 2011, respectively. |
| (2) | Includes write-offs of abandoned development projects, non-capitalizable development costs, non-capitalizable marketing/promotional costs associated withBarclays Center and unallocated management and service company overhead, net of tax credit income. |
17
Forest City Enterprises, Inc. and Subsidiaries
Supplemental Operating Information
Net Operating Income by Product Type
Pro-Rata Consolidation (dollars in thousands)
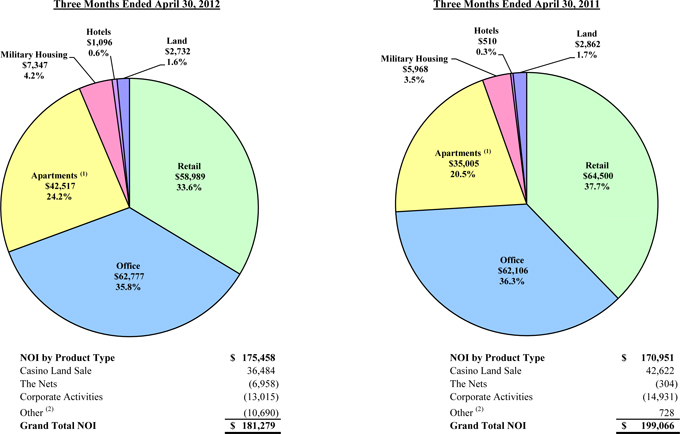
| (1) | Includes limited-distribution subsidized senior housing. |
| (2) | Includes write-offs of abandoned development projects, non-capitalizable development costs, non-capitalizable marketing/promotional costs associated withBarclays Center and unallocated management and service company overhead, net of tax credit income. |
18
Forest City Enterprises, Inc. and Subsidiaries
Supplemental Operating Information
Net Operating Income by Core Market
Pro-Rata Consolidation (dollars in thousands)
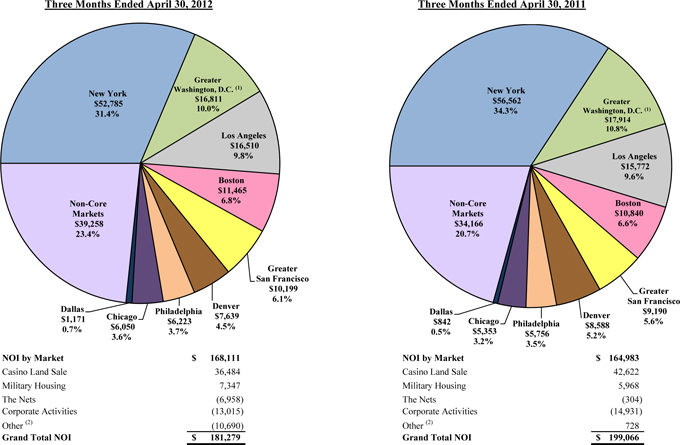
| (1) | Includes Richmond, Virginia. |
| (2) | Includes write-offs of abandoned development projects, non-capitalizable development costs, non-capitalizable marketing/promotional costs associated withBarclays Center and unallocated management and service company overhead, net of tax credit income. |
19
Forest City Enterprises, Inc. and Subsidiaries
Supplemental Operating Information
Reconciliation of Net Operating Income (non-GAAP) to Net Earnings (GAAP)(in thousands)
| | | | | | | | | | | | | | | | | | | | | | | | | | | | | | | | | | | | | | | | |
| | | Three Months Ended April 30, 2012 | | | Three Months Ended April 30, 2011 | |
| | | | | | | | | Plus | | | | | | | | | | | | | | | Plus | | | | | | | |
| | | Full | | | Less | | | Unconsolidated | | | Plus | | | Pro-Rata | | | Full | | | Less | | | Unconsolidated | | | Plus | | | Pro-Rata | |
| | | Consolidation | | | Noncontrolling | | | Investments at | | | Discontinued | | | Consolidation | | | Consolidation | | | Noncontrolling | | | Investments at | | | Discontinued | | | Consolidation | |
| | | (GAAP) | | | Interest | | | Pro-Rata | | | Operations | | | (Non-GAAP) | | | (GAAP) | | | Interest | | | Pro-Rata | | | Operations | | | (Non-GAAP) | |
Revenues from real estate operations | | $ | 296,652 | | | $ | 12,561 | | | $ | 101,564 | | | $ | 292 | | | $ | 385,947 | | | $ | 304,180 | | | $ | 12,498 | | | $ | 82,714 | | | $ | 9,252 | | | $ | 383,648 | |
Exclude straight-line rent adjustment (1) | | | (5,624 | ) | | | — | | | | — | | | | (3 | ) | | | (5,627 | ) | | | (3,099 | ) | | | — | | | | — | | | | (336 | ) | | | (3,435 | ) |
| | | | | | | | | | | | | | | | | | | | | | | | | | | | | | | | | | | | | | | | |
Adjusted revenues | | | 291,028 | | | | 12,561 | | | | 101,564 | | | | 289 | | | | 380,320 | | | | 301,081 | | | | 12,498 | | | | 82,714 | | | | 8,916 | | | | 380,213 | |
Add interest and other income | | | 10,679 | | | | 466 | | | | 210 | | | | — | | | | 10,423 | | | | 15,507 | | | | (140 | ) | | | 117 | | | | — | | | | 15,764 | |
Add equity in earnings (loss) of unconsolidated entities | | | 3,773 | | | | 30 | | | | (10,260 | ) | | | — | | | | (6,517 | ) | | | 19,994 | | | | 48 | | | | (20,299 | ) | | | — | | | | (353 | ) |
Exclude gain on disposition of unconsolidated entities | | | — | | | | — | | | | — | | | | — | | | | — | | | | (12,567 | ) | | | — | | | | 12,567 | | | | — | | | | — | |
Exclude depreciation and amortization of unconsolidated entities | | | 19,998 | | | | — | | | | (19,998 | ) | | | — | | | | — | | | | 14,308 | | | | — | | | | (14,308 | ) | | | — | | | | — | |
Exclude interest expense of unconsolidated entities | | | 26,332 | | | | — | | | | (26,332 | ) | | | — | | | | — | | | | 23,107 | | | | — | | | | (23,107 | ) | | | — | | | | — | |
| | | | | | | | | | | | | | | | | | | | | | | | | | | | | | | | | | | | | | | | |
Adjusted total income | | | 351,810 | | | | 13,057 | | | | 45,184 | | | | 289 | | | | 384,226 | | | | 361,430 | | | | 12,406 | | | | 37,684 | | | | 8,916 | | | | 395,624 | |
Operating expenses | | | 166,851 | | | | 9,057 | | | | 45,184 | | | | 141 | | | | 203,119 | | | | 160,689 | | | | 7,400 | | | | 37,684 | | | | 6,679 | | | | 197,652 | |
Add back non-Real Estate depreciation and amortization (b) | | | 620 | | | | — | | | | — | | | | — | | | | 620 | | | | 702 | | | | — | | | | — | | | | — | | | | 702 | |
Exclude straight-line rent adjustment (2) | | | (792 | ) | | | — | | | | — | | | | — | | | | (792 | ) | | | (1,211 | ) | | | — | | | | — | | | | — | | | | (1,211 | ) |
Exclude preference payment | | | — | | | | — | | | | — | | | | — | | | | — | | | | (585 | ) | | | — | | | | — | | | | — | | | | (585 | ) |
| | | | | | | | | | | | | | | | | | | | | | | | | | | | | | | | | | | | | | | | |
Adjusted operating expenses | | | 166,679 | | | | 9,057 | | | | 45,184 | | | | 141 | | | | 202,947 | | | | 159,595 | | | | 7,400 | | | | 37,684 | | | | 6,679 | | | | 196,558 | |
Net operating income | | | 185,131 | | | | 4,000 | | | | — | | | | 148 | | | | 181,279 | | | | 201,835 | | | | 5,006 | | | | — | | | | 2,237 | | | | 199,066 | |
Interest expense | | | (58,516 | ) | | | (2,724 | ) | | | (26,332 | ) | | | (97 | ) | | | (82,221 | ) | | | (66,181 | ) | | | (3,832 | ) | | | (23,107 | ) | | | (1,236 | ) | | | (86,692 | ) |
Loss on early extinguishment of debt | | | (719 | ) | | | (188 | ) | | | — | | | | — | | | | (531 | ) | | | (296 | ) | | | (4 | ) | | | — | | | | — | | | | (292 | ) |
Equity in (earnings) loss of unconsolidated entities | | | (3,773 | ) | | | (30 | ) | | | 10,260 | | | | — | | | | 6,517 | | | | (19,994 | ) | | | (48 | ) | | | 20,299 | | | | — | | | | 353 | |
Gain on disposition of unconsolidated entities | | | — | | | | — | | | | — | | | | — | | | | — | | | | 12,567 | | | | — | | | | — | | | | — | | | | 12,567 | |
Depreciation and amortization of unconsolidated entities | | | (19,998 | ) | | | — | | | | 19,998 | | | | — | | | | — | | | | (14,308 | ) | | | — | | | | 14,308 | | | | — | | | | — | |
Interest expense of unconsolidated entities | | | (26,332 | ) | | | — | | | | 26,332 | | | | — | | | | — | | | | (23,107 | ) | | | — | | | | 23,107 | | | | — | | | | — | |
Net gain on disposition of rental properties and partial interests in rental properties | | | — | | | | — | | | | — | | | | 7,914 | | | | 7,914 | | | | 9,561 | | | | — | | | | — | | | | 10,038 | | | | 19,599 | |
Impairment of consolidated real estate | | | (1,381 | ) | | | — | | | | — | | | | — | | | | (1,381 | ) | | | (4,835 | ) | | | — | | | | — | | | | — | | | | (4,835 | ) |
Depreciation and amortization—Real Estate Groups (a) | | | (52,213 | ) | | | (957 | ) | | | (19,161 | ) | | | — | | | | (70,417 | ) | | | (55,151 | ) | | | (1,638 | ) | | | (13,690 | ) | | | (1,626 | ) | | | (68,829 | ) |
Amortization of mortgage procurement costs—Real Estate Groups (c) | | | (2,869 | ) | | | (83 | ) | | | (837 | ) | | | — | | | | (3,623 | ) | | | (2,882 | ) | | | (130 | ) | | | (618 | ) | | | (262 | ) | | | (3,632 | ) |
Straight-line rent adjustment (1) + (2) | | | 4,832 | | | | — | | | | — | | | | 3 | | | | 4,835 | | | | 1,888 | | | | — | | | | — | | | | 336 | | | | 2,224 | |
Preference payment | | | — | | | | — | | | | — | | | | — | | | | — | | | | (585 | ) | | | — | | | | — | | | | — | | | | (585 | ) |
| | | | | | | | | | | | | | | | | | | | | | | | | | | | | | | | | | | | | | | | |
Earnings (loss) before income taxes | | | 24,162 | | | | 18 | | | | 10,260 | | | | 7,968 | | | | 42,372 | | | | 38,512 | | | | (646 | ) | | | 20,299 | | | | 9,487 | | | | 68,944 | |
Income tax expense | | | (9,573 | ) | | | — | | | | — | | | | (3,530 | ) | | | (13,103 | ) | | | (17,749 | ) | | | — | | | | — | | | | (4,499 | ) | | | (22,248 | ) |
Equity in earnings (loss) of unconsolidated entities | | | 3,773 | | | | 30 | | | | (10,260 | ) | | | — | | | | (6,517 | ) | | | 19,994 | | | | 48 | | | | (20,299 | ) | | | — | | | | (353 | ) |
| | | | | | | | | | | | | | | | | | | | | | | | | | | | | | | | | | | | | | | | |
Earnings (loss) from continuing operations | | | 18,362 | | | | 48 | | | | — | | | | 4,438 | | | | 22,752 | | | | 40,757 | | | | (598 | ) | | | — | | | | 4,988 | | | | 46,343 | |
Discontinued operations, net of tax | | | 5,411 | | | | 973 | | | | — | | | | (4,438 | ) | | | — | | | | 6,716 | | | | 1,728 | | | | — | | | | (4,988 | ) | | | — | |
| | | | | | | | | | | | | | | | | | | | | | | | | | | | | | | | | | | | | | | | |
Net earnings | | | 23,773 | | | | 1,021 | | | | — | | | | — | | | | 22,752 | | | | 47,473 | | | | 1,130 | | | | — | | | | — | | | | 46,343 | |
Noncontrolling interests | | | | | | | | | | | | | | | | | | | | | | | | | | | | | | | | | | | | | | | | |
(Earnings) loss from continuing operations attributable to noncontrolling interests | | | (48 | ) | | | (48 | ) | | | — | | | | — | | | | — | | | | 598 | | | | 598 | | | | — | | | | — | | | | — | |
Earnings from discontinued operations attributable to noncontrolling interests | | | (973 | ) | | | (973 | ) | | | — | | | | — | | | | — | | | | (1,728 | ) | | | (1,728 | ) | | | — | | | | — | | | | — | |
| | | | | | | | | | | | | | | | | | | | | | | | | | | | | | | | | | | | | | | | |
Noncontrolling interests | | | (1,021 | ) | | | (1,021 | ) | | | — | | | | — | | | | — | | | | (1,130 | ) | | | (1,130 | ) | | | — | | | | — | | | | — | |
| | | | | | | | | | | | | | | | | | | | | | | | | | | | | | | | | | | | | | | | |
Net earnings attributable to Forest City Enterprises, Inc. | | $ | 22,752 | | | $ | — | | | $ | — | | | $ | — | | | $ | 22,752 | | | $ | 46,343 | | | $ | — | | | $ | — | | | $ | — | | | $ | 46,343 | |
| | | | | | | | | | | | | | | | | | | | | | | | | | | | | | | | | | | | | | | | |
Preferred dividends | | | (3,850 | ) | | | — | | | | — | | | | — | | | | (3,850 | ) | | | (3,850 | ) | | | — | | | | — | | | | — | | | | (3,850 | ) |
| | | | | | | | | | | | | | | | | | | | | | | | | | | | | | | | | | | | | | | | |
Net earnings attributable to Forest City Enterprises, Inc. common shareholders | | $ | 18,902 | | | $ | — | | | $ | — | | | $ | — | | | $ | 18,902 | | | $ | 42,493 | | | $ | — | | | $ | — | | | $ | — | | | $ | 42,493 | |
| | | | | | | | | | | | | | | | | | | | | | | | | | | | | | | | | | | | | | | | |
(a) Depreciation and amortization—Real Estate Groups | | $ | 52,213 | | | $ | 957 | | | $ | 19,161 | | | $ | — | | | $ | 70,417 | | | $ | 55,151 | | | $ | 1,638 | | | $ | 13,690 | | | $ | 1,626 | | | $ | 68,829 | |
(b) Depreciation and amortization—Non-Real Estate | | | 620 | | | | — | | | | — | | | | — | | | | 620 | | | | 702 | | | | — | | | | — | | | | — | | | | 702 | |
| | | | | | | | | | | | | | | | | | | | | | | | | | | | | | | | | | | | | | | | |
Total depreciation and amortization | | $ | 52,833 | | | $ | 957 | | | $ | 19,161 | | | $ | — | | | $ | 71,037 | | | $ | 55,853 | | | $ | 1,638 | | | $ | 13,690 | | | $ | 1,626 | | | $ | 69,531 | |
| | | | | | | | | | | | | | | | | | | | | | | | | | | | | | | | | | | | | | | | |
(c) Amortization of mortgage procurement costs—Real Estate Groups | | $ | 2,869 | | | $ | 83 | | | $ | 837 | | | $ | — | | | $ | 3,623 | | | $ | 2,882 | | | $ | 130 | | | $ | 618 | | | $ | 262 | | | $ | 3,632 | |
(d) Amortization of mortgage procurement costs—Non-Real Estate | | | — | | | | — | | | | — | | | | — | | | | — | | | | — | | | | — | | | | — | | | | — | | | | — | |
| | | | | | | | | | | | | | | | | | | | | | | | | | | | | | | | | | | | | | | | |
Total amortization of mortgage procurement costs | | $ | 2,869 | | | $ | 83 | | | $ | 837 | | | $ | — | | | $ | 3,623 | | | $ | 2,882 | | | $ | 130 | | | $ | 618 | | | $ | 262 | | | $ | 3,632 | |
| | | | | | | | | | | | | | | | | | | | | | | | | | | | | | | | | | | | | | | | |
20
Results of Operations
Net Earnings Attributable to Forest City Enterprises, Inc.—Net earnings attributable to Forest City Enterprises, Inc. for the three months ended April 30, 2012 was $22,752,000 versus $46,343,000 for the three months ended April 30, 2011. Although we have substantial recurring revenue sources from our properties, we also enter into significant transactions, which create substantial variances in net earnings (loss) between periods. This variance to the prior year period is primarily attributable to the following decreases, which are net of noncontrolling interest:
| | • | | $42,622,000 related to the 2011 sale of an approximate 6 acre land parcel and air rights for development of a casino in downtown Cleveland, Ohio; |
| | • | | $12,567,000 related to the 2011 gains on disposition of our unconsolidated investments inMetropolitan Lofts andTwin Lake Towers, apartment communities in Los Angeles, California and Denver, Colorado, respectively; |
| | • | | $9,561,000 due to the 2011 gain on disposition of partial interests in 15 retail properties in the New York City metropolitan area, related to the formation of new joint venture agreements with an outside partner; |
| | • | | $6,654,000 related to a 2012 increase in allocated losses from our equity investment in The Nets; |
| | • | | $5,157,000 related to a decrease in income recognized on the sale of state and federal Historic Preservation Tax Credits and New Market Tax Credits in 2012 compared to 2011; and |
| | • | | $2,124,000 related to the 2011 gain on disposition ofCharleston Marriott, a hotel in Charleston, West Virginia, offset by the 2012 gain on disposition ofQuebec Square, a specialty retail center in Denver, Colorado. |
These decreases were partially offset by the following increases, net of noncontrolling interest:
| | • | | $36,484,000 related to the 2012 sale of an approximate 10 acre land parcel and air rights for development of a casino in downtown Cleveland, Ohio; |
| | • | | $3,678,000 related to the change in fair market value of certain derivatives between the comparable periods, which was marked to market through interest expense as a result of the derivatives not qualifying for hedge accounting; |
| | • | | $3,454,000 related to the 2012 decrease in impairment charges of consolidated entities; and |
| | • | | $9,145,000 due to decreased income tax expense attributable to both continuing and discontinued operations primarily related to the fluctuations in earnings before income taxes and pre-tax earnings, including gains in discontinued operations. These fluctuations are primarily related to the various transactions discussed herein. |
Net Operating Income (NOI) from Real Estate Groups – NOI, a non-GAAP measure, is defined as revenues (excluding straight-line rent adjustments) less operating expenses (including depreciation and amortization and amortization of mortgage procurement costs for non-real estate groups) plus interest income plus equity in earnings (loss) of unconsolidated entities (excluding gain on disposition and impairment of unconsolidated entities) plus interest expense, gain (loss) on early extinguishment of debt, depreciation and amortization of unconsolidated entities. We believe NOI provides us, as well as our investors, additional information about our core business operations and, along with earnings, is necessary to understand our business and operating results.
Full Consolidation – Under the full consolidation method (GAAP), NOI from the combination of the Commercial Group and the Residential Group (“Rental Properties”) for the three months ended April 30, 2012 was $202,029,000 compared to $214,819,000 for the three months ended April 30, 2011, a 6.0% decrease.
Pro-Rata Consolidation – Management also analyzes property NOI using the pro-rata consolidation method because it provides operating data at our ownership share, and we publicly disclose and discuss our performance using this method of consolidation to complement our GAAP disclosures. Under the pro-rata consolidation method, NOI from Rental Properties for the three months ended April 30, 2012 was $198,520,000 compared to $212,326,000 for the three months ended April 30, 2011, a 6.5% decrease. The fluctuation in total NOI from Rental Properties has similar components to the change in FFO and EBDT for the period as described in the following discussion of FFO and EBDT.
Comparable NOI increased 4.8% for the three months ended April 30, 2012 compared to the prior year period. Retail, office and our residential portfolio comparable NOI increased 3.0%, 3.2% and 11.0%, respectively.
21
Capital Expenditures for our Operating Portfolio—Our diversified real estate portfolio requires certain capital expenditures, including tenant improvements, to maintain and improve its operating performance. During the three months ended April 30, 2012 we invested $22,716,000 at pro-rata consolidation ($18,902,000 at full consolidation) in capital expenditures for our operating portfolio as compared to $18,499,000 at pro-rata consolidation ($14,257,000 at full consolidation) during the three months ended April 30, 2011.
FFO—The majority of our peers in the publically traded real estate industry are REITs and report operations using FFO as defined by NAREIT. Although we are not a REIT, we feel it is important to publish this measure to allow for easier comparison of our performance to our peers.
FFO is defined by NAREIT as net earnings excluding the following items: i) gain (loss) on disposition of rental properties, divisions and other investments (net of tax); ii) non-cash charges for real estate depreciation and amortization; iii) impairment of depreciable real estate (net of tax); iv) extraordinary items (net of tax); and v) cumulative or retrospective effect of change in accounting principle (net of tax).
FFO for the three months ended April 30, 2012 of $89,152,000 decreased by $8,424,000 or 8.6% compared to $97,576,000 for the three months ended April 30, 2011. The fluctuations in FFO by Segment are as follows:
| | • | | Our Commercial and Residential Segments combined provided a pre-tax FFO decrease of $5,955,000. This is primarily related to decreased income recognized from state and federal Historic Preservation and New Market tax credits of $6,333,000, decreased FFO on the casino land sale in 2012 compared to 2011 of $6,138,000 and reduced FFO from properties sold of $5,643,000. These decreases in the portfolio were partially offset by increased NOI on our mature portfolio of $6,940,000, decreased interest expense on our mature portfolio of $3,603,000, increased FFO from the change in fair market value of derivatives between the comparable periods which were marked to market through interest expense of $3,580,000 and increased FFO for the adjustments to recognize rental revenues and rental expenses using the straight-line method of $2,611,000; |
| | • | | Our Land Segment provided a pre-tax FFO increase of $1,419,000, primarily due to the 2011 impairment of Land Group projects of $1,400,000; |
| | • | | The Nets provided a pre-tax FFO decrease of $6,654,000 due to the increase in our allocated losses; |
| | • | | Corporate pre-tax FFO increased $2,240,000 primarily due to decreased professional fees associated with strategic planning and process improvement initiatives and other general corporate expenses; and |
| | • | | FFO was favorably impacted by a smaller tax expense of $526,000 compared to prior year. |
EBDT—We use an additional measure, along with net earnings, to report our operating results. This non-GAAP measure, referred to as EBDT, is not a measure of operating results or cash flows from operations as defined by GAAP and may not be directly comparable to similarly-titled measures reported by other companies.
We believe that EBDT provides additional information about our core operations and, along with net earnings, is necessary to understand our operating results. EBDT is used by the chief operating decision maker and management in assessing operating performance and to consider capital requirements and allocation of resources by segment and on a consolidated basis. We believe EBDT is important to investors because it provides another method for the investor to measure our long-term operating performance as net earnings can vary from year to year due to property dispositions, acquisitions and other factors that have a short-term impact.
EBDT is defined as net earnings excluding the following items: i) gain (loss) on disposition of rental properties, divisions and other investments (net of tax); ii) the adjustment to recognize rental revenues and rental expense using the straight-line method; iii) non-cash charges for real estate depreciation, amortization, and amortization of mortgage procurement costs; iv) deferred income taxes; v) preferred payment which is classified as noncontrolling interest expense on our Consolidated Statement of Operations; vi) impairment of real estate (net of tax); vii) extraordinary items (net of tax); viii) cumulative or retrospective effect of change in accounting principle (net of tax), and ix) revisions of prior period financial statements.
22
We reconcile EBDT to net earnings (loss), the most comparable financial measure calculated in accordance with GAAP. The adjustment to recognize rental revenues and rental expenses on the straight-line method is excluded because it is management’s opinion that rental revenues and expenses should be recognized when due from the tenants or due to the landlord. We exclude depreciation and amortization expense related to real estate operations from EBDT because we believe the values of our properties, in general, have appreciated over time in excess of their original cost. Deferred income taxes, which are the result of timing differences of certain income and expense items which are to be realized in a future year for federal income tax purposes, are excluded until the year in which they are reflected in our current tax provision. The impairment of real estate is excluded from EBDT because it varies from year to year based on factors unrelated to our overall financial performance and is related to the ultimate gain on dispositions of operating properties.
EBDT for the three months ended April 30, 2012 of $102,432,000 decreased by $24,944,000 or 19.6% compared to $127,376,000 for the three months ended April 30, 2011. The fluctuations in EBDT by Segment are as follows:
| | • | | Our Commercial and Residential Segments combined provided a pre-tax EBDT decrease of $11,125,000. This is primarily related to decreased income recognized from state and federal Historic Preservation and New Market tax credits of $6,333,000, decreased EBDT on the casino land sale in 2012 compared to 2011 of $6,138,000 and reduced EBDT from properties sold of $5,643,000. These decreases in the portfolio were partially offset by increased NOI on our mature portfolio of $6,940,000, decreased interest expense on our mature portfolio of $3,603,000 and increased EBDT from the change in fair market value of derivatives between the comparable periods which were marked to market through interest expense of $3,580,000; |
| | • | | Our Land Segment remained flat; |
| | • | | The Nets provided a pre-tax EBDT decrease of $6,654,000 due to the increase in our allocated losses; |
| | • | | Corporate pre-tax EBDT increased $2,240,000 primarily due to decreased professional fees associated with strategic planning and process improvement initiatives and other general corporate expenses; and |
| | • | | EBDT was unfavorably impacted by a smaller current tax benefit of $9,389,000 compared to prior year. |
23
Forest City Enterprises, Inc. and Subsidiaries
Supplemental Operating Information
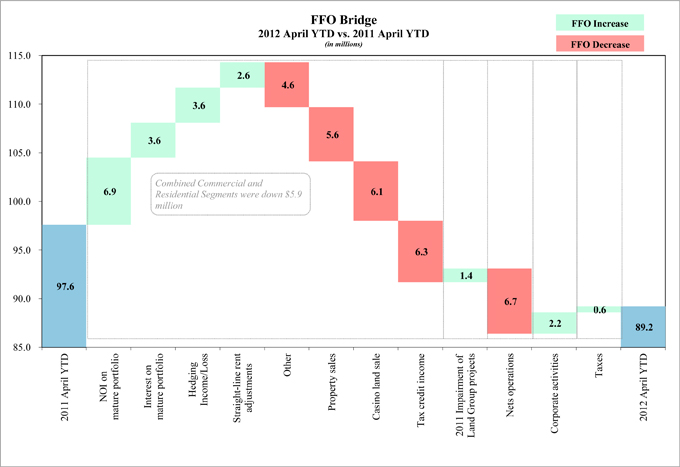
24
Forest City Enterprises, Inc. and Subsidiaries
Supplemental Operating Information
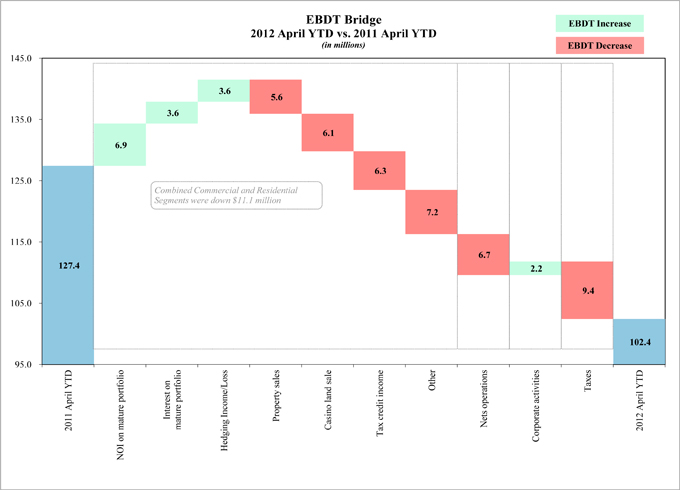
25
Forest City Enterprises, Inc. and Subsidiaries
Supplemental Operating Information
Funds From Operations (FFO)
The table below will illustrate the differences between FFO and our historical reporting of EBDT. The table will also reconcile these non-GAAP measures to net earnings, the most comparable GAAP measure.
| | | | | | | | | | | | | | | | | | |
| | | Three Months Ended April 30, 2012 | | | | | Three Months Ended April 30, 2011 | |
| | | FFO | | | EBDT | | | | | FFO | | | EBDT | |
| | | (in thousands) | | | | | (in thousands) | |
Net earnings attributable to Forest City Enterprises, Inc. | | $ | 22,752 | | | $ | 22,752 | | | | | $ | 46,343 | | | $ | 46,343 | |
Depreciation and Amortization—Real Estate Groups | | | 70,417 | | | | 70,417 | | | | | | 68,829 | | | | 68,829 | |
Impairment of depreciable rental properties | | | 1,381 | | | | 1,381 | | | | | | 3,435 | | | | 3,435 | |
Gain on disposition of rental properties and partial interests in rental properties | | | (7,914 | ) | | | (7,914 | ) | | | | | (32,166 | ) | | | (32,166 | ) |
| | | | | |
Income tax expense (benefit) on non-operating earnings (loss)—current and deferred(1) | | | | | | | | | | | | | | | | | | |
Gain on disposition of rental properties and partial interests in rental properties | | | 3,052 | | | | 3,052 | | | | | | 12,467 | | | | 12,467 | |
Impairment of depreciable rental properties | | | (536 | ) | | | (536 | ) | | | | | (1,332 | ) | | | (1,332 | ) |
| | | | | |
Straight-line rent adjustments | | | | | | | (4,835 | ) | | | | | | | | | (2,224 | ) |
Impairment of Land Group projects | | | | | | | — | | | | | | | | | | 1,400 | |
Deferred taxes on impairment of Land Group projects(1) | | | | | | | — | | | | | | | | | | (543 | ) |
Deferred income tax expense on operating earnings(1) | | | | | | | 14,492 | | | | | | | | | | 24,950 | |
Amortization of mortgage procurement costs—Real Estate Groups | | | | | | | 3,623 | | | | | | | | | | 3,632 | |
Preference payment | | | | | | | — | | | | | | | | | | 585 | |
Allowance for projects under development revision | | | | | | | — | | | | | | | | | | 2,000 | |
FFO/EBDT | | $ | 89,152 | | | $ | 102,432 | | | | | $ | 97,576 | | | $ | 127,376 | |
| | | | | | | | | | | | | | | | | | |
| | | | | | | | | | | | | | | | | | | | |
| EBDT/FFO Per Share Data - Quarterly Historical Trends | | | |
| | | Three Months Ended | |
| | | April 30, | | | January 31, | | | October 31, | | | July 31, | | | April 30, | |
| | | 2012 | | | 2012(2) | | | 2011 | | | 2011 | | | 2011 | |
| Numerator(in thousands): | | | | | | | | | | | | | | | |
EBDT | | $ | 102,432 | | | $ | 58,825 | | | $ | 77,477 | | | $ | 70,706 | | | $ | 127,376 | |
If-Converted Method (adjustments for interest, net of tax): | | | | | | | | | | | | | | | | | | | | |
3.625% Puttable Senior Notes due 2014 | | | 1,110 | | | | 1,110 | | | | 1,110 | | | | 1,110 | | | | 1,110 | |
5.00% Convertible Senior Notes due 2016 | | | 382 | | | | 382 | | | | 382 | | | | 413 | | | | 688 | |
4.25% Convertible Senior Notes due 2018 | | | 2,277 | | | | 2,277 | | | | 2,277 | | | | 329 | | | | — | |
| | | | | |
Total If-Converted Method interest adjustments | | | 3,769 | | | | 3,769 | | | | 3,769 | | | | 1,852 | | | | 1,798 | |
| | | | | |
EBDT for per share data | | $ | 106,201 | | | $ | 62,594 | | | $ | 81,246 | | | $ | 72,558 | | | $ | 129,174 | |
| | | | | |
FFO | | $ | 89,152 | | | $ | (40,714 | ) | | $ | 61,198 | | | $ | 60,129 | | | $ | 97,576 | |
If-Converted Method (adjustments for interest, net of tax) (see above): | | | 3,769 | | | | — | | | | 3,769 | | | | 1,852 | | | | 1,798 | |
| | | | | |
FFO for per share data | | $ | 92,921 | | | $ | (40,714 | ) | | $ | 64,967 | | | $ | 61,981 | | | $ | 99,374 | |
| | | | | |
Denominator | | | | | | | | | | | | | | | | | | | | |
Weighted average shares outstanding—Basic | | | 169,206,594 | | | | 169,157,392 | | | | 169,150,429 | | | | 168,788,754 | | | | 165,498,904 | |
Effect of stock options and restricted stock | | | 937,272 | | | | 646,943 | | | | 566,701 | | | | 1,019,210 | | | | 1,054,102 | |
Effect of convertible preferred stock | | | 14,550,257 | | | | 14,550,257 | | | | 14,550,257 | | | | 14,550,257 | | | | 14,550,257 | |
Effect of convertible debt | | | 33,499,503 | | | | 33,499,503 | | | | 33,499,503 | | | | 19,912,982 | | | | 20,225,204 | |
Effect of convertible Class A Common Units | | | 3,646,755 | | | | 3,646,755 | | | | 3,646,755 | | | | 3,646,755 | | | | 3,646,755 | |
| | | | | |
Weighted average shares outstanding - Diluted | | | 221,840,381 | | | | 221,500,850 | | | | 221,413,645 | | | | 207,917,958 | | | | 204,975,222 | |
| | | | | |
EBDT Per Share | | $ | 0.48 | | | $ | 0.28 | | | $ | 0.37 | | | $ | 0.35 | | | $ | 0.63 | |
| | | | | |
FFO Per Share | | $ | 0.42 | | | $ | (0.24 | ) | | $ | 0.29 | | | $ | 0.30 | | | $ | 0.48 | |
| | | | | |
| | | | | | | | | | | | | | | | | | | | | |
26
Forest City Enterprises, Inc. and Subsidiaries
Supplemental Operating Information
FFO(continued)
| (1) | The following table provides detail of Income Tax Expense (Benefit): |
| | | | | | | | |
| | | Three Months Ended April 30, | |
| | | 2012 | | | 2011 | |
Current taxes | | | | | | | | |
Operating earnings | | $ | (3,736 | ) | | $ | (12,671 | ) |
Gain on disposition of rental properties and partial interests in rental properties | | | 4,865 | | | | 30,304 | |
| | | | | | | | |
Subtotal | | | 1,129 | | | | 17,633 | |
| | | | | | | | |
Discontinued operations | | | | | | | | |
Operating earnings | | | (169 | ) | | | (623 | ) |
Gain on disposition of rental properties and partial interests in rental properties | | | 680 | | | | 1,201 | |
| | | | | | | | |
Subtotal | | | 511 | | | | 578 | |
| | | | | | | | |
Total Current taxes | | | 1,640 | | | | 18,211 | |
| | | | | | | | |
Deferred taxes | | | | | | | | |
Operating earnings | | | 14,302 | | | | 24,540 | |
Gain on disposition of rental properties and partial interests in rental properties | | | (5,322 | ) | | | (22,549 | ) |
Impairment of depreciable rental properties | | | (536 | ) | | | (1,332 | ) |
Impairment of Land Group projects | | | — | | | | (543 | ) |
| | | | | | | | |
Subtotal | | | 8,444 | | | | 116 | |
| | | | | | | | |
Discontinued operations | | | | | | | | |
Operating earnings | | | 190 | | | | 410 | |
Gain on disposition of rental properties and partial interests in rental properties | | | 2,829 | | | | 3,511 | |
| | | | | | | | |
Subtotal | | | 3,019 | | | | 3,921 | |
| | | | | | | | |
Total Deferred taxes | | | 11,463 | | | | 4,037 | |
| | | | | | | | |
Grand Total | | $ | 13,103 | | | $ | 22,248 | |
| | | | | | | | |
| (2) | For the three months ended January 31, 2012, the effect of 52,343,458 shares of dilutive securities were not included in the computation of diluted FFO per share because their effect is anti-dilutive due to the negative FFO for the quarter. As a result, an adjustment to FFO is not required for interest expense of $3,769,000 related to these securities. |
27
Forest City Enterprises, Inc. and Subsidiaries
Supplemental Operating Information
FFO (continued)
The table below is a quarterly historical trend analysis of FFO and EBDT for the year ended January 31, 2012:
| | | | | | | | | | | | | | | | | | | | | | | | | | | | | | | | | | | | | | | | | | | | | | | | | | | | | | |
| | | Three Months Ended
April 30, 2011 | | | | Three Months Ended
July 31, 2011 | | | | Three Months Ended
October 31, 2011 | | | | Three Months Ended
January 31, 2012 | | | |
| | | FFO | | | | | EBDT | | | | | | | FFO | | | | | EBDT | | | | | | | FFO | | | | | EBDT | | | | | | | FFO | | | | | EBDT | | | |
| | | (in thousands) | | | | | | | (in thousands) | | | | (in thousands) | | | | | | | (in thousands) | | | |
Net earnings (loss) attributable to Forest City Enterprises, Inc. | | $ | 46,343 | | | | | $ | 46,343 | | | | | | | $ | 9,358 | | | | | $ | 9,358 | | | | | | | $ | (36,801 | ) | | | | $ | (36,801 | ) | | | | | | $ | (105,386 | ) | | | | $ | (105,386 | ) | | |
Depreciation and Amortization—Real Estate Groups | | | 68,829 | | | | | | 68,829 | | | | | | | | 68,929 | | | | | | 68,929 | | | | | | | | 71,304 | | | | | | 71,304 | | | | | | | | 72,642 | | | | | | 72,642 | | | |
Impairment of depreciable rental properties | | | 3,435 | | | | | | 3,435 | | | | | | | | 235 | | | | | | 235 | | | | | | | | 49,446 | | | | | | 49,446 | | | | | | | | 1,095 | | | | | | 1,095 | | | |
Gain on disposition of rental properties and partial interests in rental properties | | | (32,166 | ) | | | | | (32,166 | ) | | | | | | | (29,899 | ) | | | | | (29,899 | ) | | | | | | | (5,849 | ) | | | | | (5,849 | ) | | | | | | | (14,114 | ) | | | | | (14,114 | ) | | |
| | | | | | | | | | | | | | | | | | | |
Income tax expense (benefit) on non-operating earnings (loss) - current and deferred: | | | | | | | | | | | | | | | | | | | | | | | | | | | | | | | | | | | | | | | | | | | | | | | | | | | | | | |
Gain on disposition of rental properties and partial interests in rental properties | | | 12,467 | | | | | | 12,467 | | | | | | | | 11,597 | | | | | | 11,597 | | | | | | | | 2,275 | | | | | | 2,275 | | | | | | | | 5,473 | | | | | | 5,473 | | | |
Impairment of depreciable rental properties | | | (1,332 | ) | | | | | (1,332 | ) | | | | | | | (91 | ) | | | | | (91 | ) | | | | | | | (19,177 | ) | | | | | (19,177 | ) | | | | | | | (424 | ) | | | | | (424 | ) | | |
| | | | | | | | | | | | | | | | | | | |
Straight-line rent adjustments | | | | | | | | | (2,224 | ) | | | | | | | | | | | | | 2,497 | | | | | | | | | | | | | | (3,268 | ) | | | | | | | | | | | | | (4,213 | ) | | |
Impairment of Land Group projects | | | | | | | | | 1,400 | | | | | | | | | | | | | | — | | | | | | | | | | | | | | 2,550 | | | | | | | | | | | | | | 153,363 | | | |
Deferred taxes on impairment of Land Group projects | | | | | | | | | (543 | ) | | | | | | | | | | | | | — | | | | | | | | | | | | | | (989 | ) | | | | | | | | | | | | | (59,479 | ) | | |
Deferred income tax expense on operating earnings | | | | | | | | | 24,950 | | | | | | | | | | | | | | 6,079 | | | | | | | | | | | | | | 15,349 | | | | | | | | | | | | | | 5,321 | | | |
Amortization of mortgage procurement costs—Real Estate Groups | | | | | | | | | 3,632 | | | | | | | | | | | | | | 3,415 | | | | | | | | | | | | | | 4,052 | | | | | | | | | | | | | | 3,571 | | | |
Preference payment | | | | | | | | | 585 | | | | | | | | | | | | | | 586 | | | | | | | | | | | | | | 585 | | | | | | | | | | | | | | (24 | ) | | |
Allowance for projects under development revision | | | | | | | | | 2,000 | | | | | | | | | | | | | | (2,000 | ) | | | | | | | | | | | | | (2,000 | ) | | | | | | | | | | | | | 1,000 | | | |
FFO/EBDT | | $ | 97,576 | | | | | $ | 127,376 | | | | | | | $ | 60,129 | | | | | $ | 70,706 | | | | | | | $ | 61,198 | | | | | $ | 77,477 | | | | | | | $ | (40,714 | ) | | | | $ | 58,825 | | | |
28
(THIS PAGE INTENTIONALLY LEFT BLANK)
Forest City Enterprises, Inc. and Subsidiaries
Supplemental Operating Information
Schedule of Retail Lease Expirations as of April 30, 2012
| | | | | | | | | | | | | | | | | | | | | | | | |
| | | | | | | | | | | | | | | | | | AVERAGE | |
| | | | | | | | | | | | | | | | | | BASE | |
| | | NUMBER OF | | | SQUARE FEET | | | PERCENTAGE | | | NET | | | PERCENTAGE | | | RENT PER | |
| EXPIRATION | | EXPIRING | | | OF EXPIRING | | | OF TOTAL | | | BASE RENT | | | OF TOTAL | | | SQUARE FEET | |
YEAR | | LEASES | | | LEASES(3) | | | LEASED GLA (1) | | | EXPIRING(2) | | | BASE RENT | | | EXPIRING(3) | |
2012 | | | 212 | | | | 634,085 | | | | 5.08 | % | | $ | 12,995,333 | | | | 5.17 | % | | $ | 26.27 | |
2013 | | | 350 | | | | 1,223,594 | | | | 9.80 | | | | 26,708,040 | | | | 10.63 | | | | 27.30 | |
2014 | | | 295 | | | | 1,077,675 | | | | 8.63 | | | | 21,067,186 | | | | 8.38 | | | | 27.67 | |
2015 | | | 218 | | | | 866,319 | | | | 6.93 | | | | 19,331,135 | | | | 7.69 | | | | 29.84 | |
2016 | | | 265 | | | | 1,404,114 | | | | 11.24 | | | | 31,550,161 | | | | 12.55 | | | | 36.38 | |
2017 | | | 171 | | | | 1,219,049 | | | | 9.76 | | | | 24,184,163 | | | | 9.62 | | | | 26.93 | |
2018 | | | 159 | | | | 745,680 | | | | 5.97 | | | | 19,033,415 | | | | 7.57 | | | | 28.90 | |
2019 | | | 118 | | | | 1,024,355 | | | | 8.20 | | | | 19,833,619 | | | | 7.89 | | | | 25.06 | |
2020 | | | 102 | | | | 810,027 | | | | 6.48 | | | | 16,613,119 | | | | 6.61 | | | | 30.55 | |
2021 | | | 138 | | | | 1,221,501 | | | | 9.78 | | | | 26,076,567 | | | | 10.38 | | | | 31.11 | |
2022 | | | 23 | | | | 391,767 | | | | 3.14 | | | | 4,641,654 | | | | 1.85 | | | | 18.10 | |
Thereafter | | | 66 | | | | 1,872,180 | | | | 14.99 | | | | 29,317,826 | | | | 11.66 | | | | 21.52 | |
| | | | | | | | | | | | | | | | | | | | | | | | |
Total | | | 2,117 | | | | 12,490,346 | | | | 100.00 | % | | $ | 251,352,218 | | | | 100.00 | % | | $ | 27.78 | |
| | | | | | | | | | | | | | | | | | | | | | | | |
| (1) | GLA = Gross Leasable Area. |
| (2) | Net base rent expiring is an operating statistic and is not comparable to rental revenue, a GAAP financial measure. The primary differences arise because net base rent is determined using the tenant’s contractual rental agreements at our ownership share of the base rental income from expiring leases as determined within the rent agreement and it does not include adjustments such as the impact of straight-line rent, amortization of intangible assets related to in-place leases, above and below market leases, and contingent rental payments (which are not reasonably estimable). |
| (3) | Square feet of expiring leases and average base rent per square feet are operating statistics that represent 100% of the square footage and base rental income per square foot from expiring leases. |
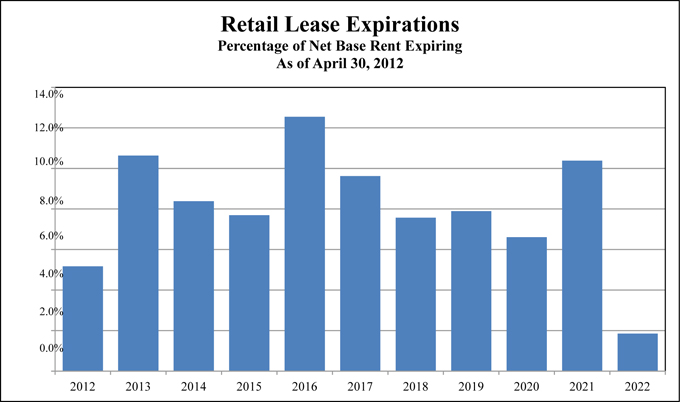
29
Forest City Enterprises, Inc. and Subsidiaries
Supplemental Operating Information
Schedule of Office Lease Expirations as of April 30, 2012
| | | | | | | | | | | | | | | | | | | | | | | | |
| | | | | | | | | | | | | | | | | | AVERAGE | |
| | | | | | | | | | | | | | | | | | BASE | |
| | | NUMBER OF | | | SQUARE FEET | | | PERCENTAGE | | | NET | | | PERCENTAGE | | | RENT PER | |
| EXPIRATION | | EXPIRING | | | OF EXPIRING | | | OF TOTAL | | | BASE RENT | | | OF TOTAL | | | SQUARE FEET | |
YEAR | | LEASES | | | LEASES(3) | | | LEASED GLA (1) | | | EXPIRING(2) | | | BASE RENT | | | EXPIRING(3) | |
2012 | | | 82 | | | | 629,105 | | | | 5.54 | % | | $ | 18,223,579 | | | | 6.02 | % | | $ | 35.37 | |
2013 | | | 99 | | | | 1,203,425 | | | | 10.61 | | | | 25,976,786 | | | | 8.58 | | | | 22.77 | |
2014 | | | 80 | | | | 862,748 | | | | 7.60 | | | | 17,803,428 | | | | 5.88 | | | | 33.02 | |
2015 | | | 53 | | | | 507,152 | | | | 4.47 | | | | 9,539,205 | | | | 3.15 | | | | 21.98 | |
2016 | | | 65 | | | | 1,003,898 | | | | 8.85 | | | | 23,101,556 | | | | 7.63 | | | | 29.77 | |
2017 | | | 33 | | | | 479,231 | | | | 4.22 | | | | 11,421,651 | | | | 3.78 | | | | 25.61 | |
2018 | | | 28 | | | | 1,256,726 | | | | 11.08 | | | | 34,721,382 | | | | 11.47 | | | | 32.07 | |
2019 | | | 25 | | | | 896,768 | | | | 7.90 | | | | 16,036,802 | | | | 5.30 | | | | 25.13 | |
2020 | | | 15 | | | | 1,048,425 | | | | 9.24 | | | | 27,922,087 | | | | 9.23 | | | | 33.07 | |
2021 | | | 14 | | | | 810,711 | | | | 7.15 | | | | 12,976,306 | | | | 4.29 | | | | 23.03 | |
2022 | | | 7 | | | | 150,372 | | | | 1.33 | | | | 7,144,146 | | | | 2.36 | | | | 48.07 | |
Thereafter | | | 29 | | | | 2,497,631 | | | | 22.01 | | | | 97,764,456 | | | | 32.31 | | | | 40.98 | |
| | | | | | | | | | | | | | | | | | | | | | | | |
Total | | | 530 | | | | 11,346,192 | | | | 100.00 | % | | $ | 302,631,384 | | | | 100.00 | % | | $ | 31.48 | |
| | | | | | | | | | | | | | | | | | | | | | | | |
| (1) | GLA = Gross Leasable Area. |
| (2) | Net base rent expiring is an operating statistic and is not comparable to rental revenue, a GAAP financial measure. The primary differences arise because net base rent is determined using the tenant’s contractual rental agreements at our ownership share of the base rental income from expiring leases as determined within the rent agreement and it does not include adjustments such as the impact of straight-line rent, amortization of intangible assets related to in-place leases, above and below market leases, and contingent rental payments (which are not reasonably estimable). |
| (3) | Square feet of expiring leases and average base rent per square feet are operating statistics that represent 100% of the square footage and base rental income per square foot from expiring leases. |
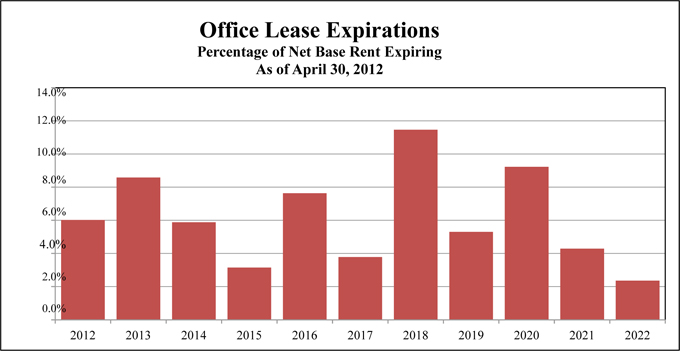
30
Forest City Enterprises, Inc. and Subsidiaries
Supplemental Operating Information
Schedule of Significant Retail Tenants as of April 30, 2012
(Based on net base rent 1% or greater of the Company’s ownership share)
| | | | | | | | | | | | |
| | | NUMBER | | | LEASED | | | PERCENTAGE OF | |
| | | OF | | | SQUARE | | | TOTAL RETAIL | |
TENANT | | LEASES | | | FEET | | | SQUARE FEET | |
Bass Pro Shops, Inc. | | | 3 | | | | 510,855 | | | | 4.09 | % |
Regal Entertainment Group | | | 5 | | | | 381,461 | | | | 3.05 | |
AMC Entertainment, Inc. | | | 5 | | | | 377,797 | | | | 3.03 | |
TJX Companies | | | 11 | | | | 347,457 | | | | 2.78 | |
The Gap | | | 27 | | | | 344,944 | | | | 2.76 | |
Dick’s Sporting Goods | | | 6 | | | | 326,866 | | | | 2.62 | |
Best Buy(1) | | | 7 | | | | 208,977 | | | | 1.67 | |
The Limited | | | 32 | | | | 196,846 | | | | 1.58 | |
Abercrombie & Fitch Stores, Inc. | | | 26 | | | | 188,604 | | | | 1.51 | |
H&M Hennes & Mauritz AB | | | 8 | | | | 141,520 | | | | 1.13 | |
Footlocker, Inc. | | | 35 | | | | 136,789 | | | | 1.10 | |
Forever 21, Inc. | | | 8 | | | | 112,661 | | | | 0.90 | |
American Eagle Outfitters, Inc. | | | 15 | | | | 85,972 | | | | 0.69 | |
| | | | | | | | | | | | |
Subtotal | | | 188 | | | | 3,360,749 | | | | 26.91 | |
| | | | | | | | | | | | |
All Others | | | 1,929 | | | | 9,129,597 | | | | 73.09 | |
| | | | | | | | | | | | |
Total | | | 2,117 | | | | 12,490,346 | | | | 100.00 | % |
| | | | | | | | | | | | |
| (1) | Includes a lease for 54,927 square feet at East River Plaza, with an expiration date of January 31, 2031. In April 2012, Best Buy Co., Inc. publicly announced their intention to vacate this space. |
31
Forest City Enterprises, Inc. and Subsidiaries
Supplemental Operating Information
Schedule of Significant Office Tenants as of April 30, 2012
(Based on net base rent 2% or greater of the Company's ownership share)
| | | | | | | | |
| | | LEASED | | | PERCENTAGE OF | |
| | | SQUARE | | | TOTAL OFFICE | |
TENANT | | FEET | | | SQUARE FEET | |
City of New York | | | 1,046,101 | | | | 9.22 | % |
Millennium Pharmaceuticals, Inc. | | | 698,066 | | | | 6.15 | |
U.S. Government | | | 533,112 | | | | 4.70 | |
WellPoint, Inc. | | | 392,514 | | | | 3.46 | |
JP Morgan Chase & Co. | | | 383,341 | | | | 3.38 | |
Morgan Stanley & Co. | | | 377,304 | | | | 3.33 | |
Bank of New York | | | 323,043 | | | | 2.85 | |
National Grid | | | 254,034 | | | | 2.24 | |
Clearbridge Advisors, LLC, a Legg Mason Company | | | 193,249 | | | | 1.70 | |
Covington & Burling, LLP | | | 160,565 | | | | 1.41 | |
Seyfarth Shaw, LLP | | | 96,909 | | | | 0.85 | |
| | | | | | | | |
Subtotal | | | 4,458,238 | | | | 39.29 | |
| | | | | | | | |
All Others | | | 6,887,954 | | | | 60.71 | |
| | | | | | | | |
Total | | | 11,346,192 | | | | 100.00 | % |
| | | | | | | | |
32
(THIS PAGE INTENTIONALLY LEFT BLANK)
Forest City Enterprises, Inc. and Subsidiaries
Supplemental Operating Information
Openings
as of April 30, 2012
| | | | | | | | | | | | | | | | | | | | | | | | | | | | | | | | | | | | | | | | | | |
| | | | | | | | | | | | | | | | | | | | | | | | Cost at FCE | | | | | | | | | |
| | | | | | | | | | | | | | | Pro-Rata | | | Cost at Full | | | Total Cost | | | Pro-Rata Share | | | Sq. ft./ | | | Gross | | | |
| | | | | | | | | Date | | | FCE Legal | | | FCE % (a) | | | Consolidation | | | at 100% | | | (Non-GAAP) (c) | | | No. of | | | Leasable | | | Lease |
Property | | Location | | | Dev (D) | | | Opened | | | Ownership % (a) | | | (1) | | | (GAAP) (b) | | | (2) | | | (1) X (2) | | | Units | | | Area | | | Commitment % |
| 2012 | | | | | | | | | | | | | | | | | (in millions) | | | | | | | | | |
Residential:(f) | | | | | | | | | | | | | | | | | | | | | | | | | | | | | | | | | | | | | | | | | | |
The Aster Town Center (d) | | | Denver, CO | | | | D | | | | Q1-12/Q2-12 | | | | 90.0 | % | | | 90.0 | % | | $ | 10.9 | | | $ | 10.9 | | | $ | 9.8 | | | | 85 | | | | | | | 42% |
| | | | | | | | | | | | | | | | | | | | | | | | | | | | | | | | | | | | | | | | | | |
Fee Development Project | | | | | | | | | | | | | | | | | | | | | | | | | | | | | | | | | | | | | | | | | | |
Las Vegas City Hall | | | Las Vegas, NV | | | | D | | | | Q1-12 | | | | — | (e) | | | — | (e) | | $ | 0.0 | | | $ | 146.2 | | | $ | 0.0 | | | | 270,000 | | | | | | | |
| | | | | | | | | | | | | | | | | | | | | | | | | | | | | | | | | | | | | | | | | | |
Prior Two Years Openings as of April 30, 2012 | | | | | | | | | | | | | | | | | | | | | | | | | | | | | | | | | | | | | | | | | | |
Retail Centers:(f) | | | | | | | | | | | | | | | | | | | | | | | | | | | | | | | | | | | | | | | | | | |
Westchester’s Ridge Hill (i) | | | Yonkers, NY | | | | D | | | | Q2-11/12 | | | | 70.0 | % | | | 100.0 | % | | $ | 868.2 | | | $ | 868.2 | | | $ | 868.2 | | | | 1,336,000 | | | | 1,336,000 | (h) | | 60%/68% |
Village at Gulfstream Park (g) (k) | | | Hallandale Beach, FL | | | | D | | | | Q1-10 | | | | 50.0 | % | | | 50.0 | % | | | 0.0 | | | | 140.2 | | | | 70.1 | | | | 511,000 | | | | 511,000 | | | 78% |
East River Plaza (g) | | | Manhattan, NY | | | | D | | | | Q4-09/Q2-10 | | | | 35.0 | % | | | 50.0 | % | | | 0.0 | | | | 390.6 | | | | 195.3 | | | | 527,000 | | | | 527,000 | | | 94% |
| | | | | | | | | | | | | | | | | | | | | | | | | | | | | | | | | | | | | | | | | | |
| | | | | | | | | | | | | | | | | | | | | | $ | 868.2 | | | $ | 1,399.0 | | | $ | 1,133.6 | | | | 2,374,000 | | | | 2,374,000 | | | |
| | | | | | | | | | | | | | | | | | | | | | | | | | | | | | | | | | | | | | | | | | |
Office: | | | | | | | | | | | | | | | | | | | | | | | | | | | | | | | | | | | | | | | | | | |
Waterfront Station | | | | | | | | | | | | | | | | | | | | | | | | | | | | | | | | | | | | | | | | | | |
- East 4th & West 4th Bldgs (Sold Q2-11) (l) | | | Washington, D.C. | | | | D | | | | Q1-10 | | | | 45.0 | % | | | 45.0 | % | | $ | 245.9 | | | $ | 245.9 | | | $ | 110.7 | | | | 631,000 | | | | | | | 99% |
| | | | | | | | | | | | | | | | | | | | | | | | | | | | | | | | | | | | | | | | | | |
Residential: (f) | | | | | | | | | | | | | | | | | | | | | | | | | | | | | | | | | | | | | | | | | | |
8 Spruce Street (g) (j) | | | Manhattan, NY | | | | D | | | | Q1-11/12 | | | | 35.7 | % | | | 51.0 | % | | $ | 0.0 | | | $ | 875.7 | | | $ | 446.6 | | | | 899 | | | | | | | 79% |
Foundry Lofts | | | Washington, D.C. | | | | D | | | | Q4-11 | | | | 100.0 | % | | | 100.0 | % | | | 57.5 | | | | 57.5 | | | | 57.5 | | | | 170 | | | | | | | 97% |
Presidio Landmark | | | San Francisco, CA | | | | D | | | | Q3-10 | | | | 100.0 | % | | | 100.0 | % | | | 96.6 | | | | 96.6 | | | | 96.6 | | | | 161 | | | | | | | 98% |
| | | | | | | | | | | | | | | | | | | | | | | | | | | | | | | | | | | | | | | | | | |
| | | | | | | | | | | | | | | | | | | | | | $ | 154.1 | | | $ | 1,029.8 | | | $ | 600.7 | | | | 1,230 | | | | | | | |
| | | | | | | | | | | | | | | | | | | | | | | | | | | | | | | | | | | | | | | | | | |
Total Prior Two Years Openings (m) | | | | | | | | | | | | | | | | | | | | | | $ | 1,268.2 | | | $ | 2,674.7 | | | $ | 1,845.0 | | | | | | | | | | | |
| | | | | | | | | | | | | | | | | | | | | | | | | | | | | | | | | | | | | | | | | | |
Recap of Total Prior Two Years Openings | | | | | | | | | | | | | | | | | | | | | | | | | | | | | | | | | | | | | | | | | | |
Total 2011 | | | | | | | | | | | | | | | | | | | | | | $ | 925.7 | | | $ | 1,801.4 | | | $ | 1,372.3 | | | | | | | | | | | |
Total 2010 | | | | | | | | | | | | | | | | | | | | | | | 342.5 | | | | 873.3 | | | | 472.7 | | | | | | | | | | | |
| | | | | | | | | | | | | | | | | | | | | | | | | | | | | | | | | | | | | | | | | | |
Total Prior Two Years Openings (m) | | | | | | | | | | | | | | | | | | | | | | $ | 1,268.2 | | | $ | 2,674.7 | | | $ | 1,845.0 | | | | | | | | | | | |
| | | | | | | | | | | | | | | | | | | | | | | | | | | | | | | | | | | | | | | | | | |
See footnotes on the following pages.
33
Forest City Enterprises, Inc. and Subsidiaries
Supplemental Operating Information
Projects Under Construction
as of April 30, 2012
| | | | | | | | | | | | | | | | | | | | | | | | | | | | | | | | | | | | | | |
Property | | Location | | Anticipated
Opening | | | FCE Legal
Ownership % (a) | | | Pro-Rata
FCE % (a)
(1) | | | Cost at Full
Consolidation
(GAAP) (b) | | | Total Cost
at 100%
(2) | | | Cost at FCE
Pro-Rata Share
(Non-GAAP) (c)
(1) X (2) | | | Sq. ft./
No. of Units | | | Gross
Leasable
Area | | | Lease
Commitment % | |
| | | | | | | | | | | | | | (in millions) | | | | | | | | | | |
Retail Centers: (f) | | | | | | | | | | | | | | | | | | | | | | | | | | | | | | | | | | | | | | |
The Yards—Boilermaker Shops | | Washington, D.C. | | | Q3-12 | | | | 100.0 | % | | | 100.0 | % | | $ | 19.6 | | | $ | 19.6 | | | $ | 19.6 | | | | 40,000 | | | | 40,000 | | | | 74 | % |
| | | | | | | | | | | | | | | | | | | | | | | | | | | | | | | | | | | | | | |
Office: | | | | | | | | | | | | | | | | | | | | | | | | | | | | | | | | | | | | | | |
Johns Hopkins Parking Garage | | Baltimore, MD | | | Q3-12 | | | | 85.0 | % | | | 100.0 | % | | $ | 29.9 | | | $ | 29.9 | | | $ | 29.9 | | | | 492,000 | | | | | | | | | |
| | | | | | | | | | | | | | | | | | | | | | | | | | | | | | | | | | | | | | |
Residential: | | | | | | | | | | | | | | | | | | | | | | | | | | | | | | | | | | | | | | |
Botanica Eastbridge | | Denver, CO | | | Q2-12 | | | | 90.0 | % | | | 90.0 | % | | $ | 15.4 | | | $ | 15.4 | | | $ | 13.9 | | | | 118 | | | | | | | | | |
Continental Building | | Dallas, TX | | | Q1-13 | | | | 100.0 | % | | | 100.0 | % | | | 54.6 | | | | 54.6 | | | | 54.6 | | | | 203 | | | | | | | | | |
| | | | | | | | | | | | | | | | | | | | | | | | | | | | | | | | | | | | | | |
| | | | | | | | | | | | | | | | $ | 70.0 | | | $ | 70.0 | | | $ | 68.5 | | | | 321 | | | | | | | | | |
| | | | | | | | | | | | | | | | | | | | | | | | | | | | | | | | | | | | | | |
Arena: | | | | | | | | | | | | | | | | | | | | | | | | | | | | | | | | | | | | | | |
Barclays Center | | Brooklyn, NY | | | Q3-12 | | | | 34.0 | % | | | 34.0 | % | | $ | 934.3 | | | $ | 934.3 | | | $ | 317.7 | | | | 670,000 | | | | 18,000 seats | (n) | | | 70 | % (o) |
| | | | | | | | | | | | | | | | | | | | | | | | | | | | | | | | | | | | | | |
Total Under Construction (p) | | | | | | | | | | | | | | | | $ | 1,053.8 | | | $ | 1,053.8 | | | $ | 435.7 | | | | | | | | | | | | | |
| | | | | | | | | | | | | | | | | | | | | | | | | | | | | | | | | | | | | | |
Fee Development Projects | | | | | | | | | | | | | | | | | | | | | | | | | | | | | | | | | | | | | | |
Dept. of Health & Mental Hygiene (DHMH) | | Baltimore, MD | | | Q2-14 | | | | — | (e) | | | — | (e) | | $ | 0.0 | | | $ | 135.0 | | | $ | 0.0 | | | | 234,000 | | | | | | | | | |
| | | | | | | | | | | | | | | | | | | | | | | | | | | | | | | | | | | | | | |
FOOTNOTES
| (a) | As is customary within the real estate industry, the Company invests in certain real estate projects through joint ventures. For some of these projects, the Company provides funding at percentages that differ from the Company's legal ownership. |
| (b) | Amounts are presented on the full consolidation method of accounting, a GAAP measure. Under full consolidation, costs are reported as consolidated at 100 percent if we are deemed to have control or to be the primary beneficiary of our investments in the variable interest entity ("VIE"). |
| (c) | Cost at pro-rata share represents Forest City's share of cost, based on the Company's pro-rata ownership of each property (a non-GAAP measure). Under the pro-rata consolidation method of accounting the Company determines its pro-rata share by multiplying its pro-rata ownership by the total cost of the applicable property. |
| (d) | The difference between the full consolidation cost amount (GAAP) of $10.9 million to the Company's pro-rata share (a non-GAAP measure) of $9.8 million consists of a reduction to full consolidation for non-controlling interest of $1.1 million. |
| (e) | These are fee development projects. Therefore, these costs are not included on the full consolidation or pro-rata balance sheet. |
| (f) | Updated lease commitments as of May 21, 2012. |
| (g) | Reported under the equity method of accounting. This method represents a GAAP measure for investments in which the Company is not deemed to have control or to be the primary beneficiary of our investments in a VIE. |
| (h) | Includes 156,000 square feet of office space. |
| (i) | Phased-in opening. Costs are representative of the total project cost, including 597,000 square feet opened as of May 21, 2012. As of April 30, 2012, $346.2 million of costs incurred at pro-rata consolidation and $193.7 million of mortgage debt at pro-rata consolidation were transferred to completed rental properties. As of April 30, 2012, projects under construction include $525.8 million of costs incurred at pro-rata consolidation and $294.1 million of mortgage debt at pro-rata consolidation. Approximately 800,000 square feet of leases have been signed, representing 60% of the total 1,336,000 square feet after construction is complete. The leased percentage excluding Parcel L is 68%. Parcel L is a self contained pad site at the southern end of the center. Parcel L has been assumed to be leased in the future predominantly to a single retail tenant in its own phase. Given Parcel L’s location on the end of the site, the lease commitment percentage has been presented both with and without the anticipated square footage for Parcel L in the denominator of Gross Leasable Area. |
34
Forest City Enterprises, Inc. and Subsidiaries
Supplemental Operating Information
FOOTNOTES (continued)
| (j) | Phased-in opening. Costs are representative of the total project cost, including 871 units opened as of May 21, 2012. As of April 30, 2012, $427.4 million of costs incurred at pro-rata consolidation and $261.1 million of mortgage debt at pro-rata consolidation were transferred to completed rental properties. As of April 30, 2012, projects under construction include $22.5 million of costs incurred at pro-rata consolidation and $13.8 million of mortgage debt at pro-rata consolidation. As of May 21, 2012, 707 leases have been signed, representing 79% of the total 899 units after construction is complete. |
| (k) | Costs were reduced by the impairment charge of $35.0 million recorded during the three months ended January 31, 2011 and the additional impairment charge of $34.6 million recorded during the three months ended October 31, 2011. |
| (l) | Property was sold on May 10, 2011 and was 99% leased at time of sale. |
| (m) | The difference between the full consolidation cost amount (GAAP) of $1,268.2 million to the Company's pro-rata share (a non-GAAP measure) of $1,845.0 million consists of a reduction to full consolidation for noncontrolling interest of $135.2 million of cost and the addition of its share of cost for unconsolidated investments of $712.0 million. |
| (n) | The Nets, a member of the NBA, has a 37 year license agreement to use the arena. |
| (o) | Represents the percentage of forecasted contractually obligated arena income that is under contract. Contractually obligated income, which include revenue from naming rights, sponsorships, suite licenses, Nets minimum rent and food concession agreements, accounts for 72% of total forecasted revenues for the arena. |
| (p) | The difference between the full consolidation cost amount (GAAP) of $1,053.8 million to the Company's pro-rata share (a non-GAAP measure) of $435.7 million consists of a reduction to full consolidation for noncontrolling interest of $618.1 million of cost. |
Equity Requirements for Projects Under Construction(a)
as of April 30, 2012
| | | | | | | | | | | | | | | | | | | | | | | | |
| | | 100% | | | Less
Unconsolidated
Investments
at 100% | | | Full
Consolidation
(GAAP)(b) | | | Less
Noncontrolling
Interest | | | Plus
Unconsolidated
Investments
at Pro-Rata | | | Pro-Rata
Consolidation
(Non-GAAP) (c) | |
| | | (dollars in millions) | |
Total Cost Under Construction | | $ | 1,053.8 | | | $ | — | | | $ | 1,053.8 | | | $ | 618.1 | | | $ | — | | | $ | 435.7 | |
Total Loan Draws and Other Sources at Completion(d) | | | 638.5 | | | | — | | | | 638.5 | | | | 389.8 | | | | — | | | | 248.7 | |
| | | | | | | | | | | | | | | | | | | | | | | | |
Net Equity at Completion | | | 415.3 | | | | — | | | | 415.3 | | | | 228.3 | | | | — | | | | 187.0 | |
| | | | | | | | | | | | | | | | | | | | | | | | |
Net Costs Incurred to Date | | | 762.3 | | | | — | | | | 762.3 | | | | 450.7 | | | | — | | | | 311.6 | |
Loan Draws and Other Sources to Date | | | 380.9 | | | | — | | | | 380.9 | | | | 228.4 | | | | — | | | | 152.5 | |
| | | | | | | | | | | | | | | | | | | | | | | | |
Net Equity to Date | | | 381.4 | | | | — | | | | 381.4 | | | | 222.3 | | | | — | | | | 159.1 | |
| | | | | | | | | | | | | | | | | | | | | | | | |
% of Total Equity | | | 92 | % | | | | | | | 92 | % | | | | | | | | | | | 85 | % |
| | | | | | |
Remaining Costs | | | 291.5 | | | | — | | | | 291.5 | | | | 167.4 | | | | — | | | | 124.1 | |
Remaining Loan Draws and Other Sources | | | 257.6 | | | | — | | | | 257.6 | | | | 161.4 | | | | — | | | | 96.2 | |
| | | | | | | | | | | | | | | | | | | | | | | | |
Remaining Equity | | $ | 33.9 | | | $ | — | | | $ | 33.9 | | | $ | 6.0 | | | $ | — | | | $ | 27.9 | |
| | | | | | | | | | | | | | | | | | | | | | | | |
% of Total Equity | | | 8 | % | | | | | | | 8 | % | | | | | | | | | | | 15 | % |
| (a) | This schedule includes only the five projects under construction listed on the previous page. This does not include costs associated with phased-in units, operating property renovations and military housing. |
| (b) | Amounts are presented on the full consolidation method of accounting, a GAAP measure. Under full consolidation, costs are reported as consolidated at 100 percent if we are deemed to have control or to be the primary beneficiary of our investments in the variable interest entity (“VIE”). |
| (c) | Cost at pro-rata share represents Forest City's share of cost, based on the Company’s pro-rata ownership of each property (a non-GAAP measure). Under the pro-rata consolidation method of accounting the Company determines its pro-rata share by multiplying its pro-rata ownership by the total cost of the applicable property. |
| (d) | “Other Sources” includes estimates of third party subsidies and tax credit proceeds. The timing and the amounts may differ from our estimates. |
35
Forest City Enterprises, Inc. and Subsidiaries
Supplemental Operating Information
Projects Under Development
as of April 30, 2012
Below is a summary of our active large scale development projects, which have yet to commence construction, often referred to as our “shadow pipeline” which are crucial to our long-term growth. While we cannot make any assurances on the timing or delivery of these projects, our track record speaks to our ability to bring large, complex projects to fruition when there is demand and available construction financing. The projects listed below represent pro-rata costs of $801.8 million ($1,005.0 million at full consolidation) of Projects Under Development (“PUD”) on our balance sheet and pro-rata mortgage debt of $166.2 million ($222.0 million at full consolidation).
1)Atlantic Yards—Brooklyn, NY
Atlantic Yards is adjacent to the state-of-the-art arena, Barclays Center, which was designed by the award-winning firms Ellerbe Becket and SHoP Architects and is currently under construction. Atlantic Yards is expected to feature more than 6,400 units of housing, including over 2,200 affordable units, approximately 250,000 square feet of retail space, and more than 8 acres of landscaped open space.
2)LiveWork Las Vegas—Las Vegas, NV
LiveWork Las Vegas is a mixed-use project on a 13.5 acre parcel in downtown Las Vegas. At full build-out, the project will have the new 260,000 square-foot City Hall and is also expected to include up to 1 million square feet of office space and approximately 300,000 square feet of retail. The City Hall is owned by the city of Las Vegas, which held its dedication ceremony on March 5, 2012.
3)The Yards—Washington, D.C.
The Yards is a 42 acre mixed-use project, located in the neighborhood of the Washington Nationals baseball park in the Capitol Riverfront District. The full project is expected to include up to 2,700 residential units, 1.8 million square feet of office space, and 300,000 square feet of retail and dining space. The Yards features a 5.5 acre publicly funded public park that is a gathering place and recreational focus for the community. The first residential building, Foundry Lofts, opened in November 2011 and includes a Potbelly Sandwich restaurant which opened Q1-12. Kruba Thai & Sushi restaurant is expected to open Q2-12.
4)Colorado Science + Technology Park at Fitzsimons—Aurora, CO
The 184 acre Colorado Science + Technology Park at Fitzsimons is becoming a hub for the biotechnology industry in the Rocky Mountain region. Anchored by the University of Colorado at Denver Health Science Center, the University of Colorado Hospital and The Denver Children’s Hospital, the park will offer cost-effective lease rates, build-to-suit office and research sites, and flexible lab and office layouts in a cutting-edge research park. The park is also adjacent to Forest City’s 4,700 acre Stapleton mixed-used development.
5)The Science + Technology Park at Johns Hopkins—Baltimore, MD
The 31 acre Science + Technology Park at Johns Hopkins is a new center for collaborative research directly adjacent to the world-renowned Johns Hopkins medical and research complex. Initial plans call for 1.1 million square feet in five buildings, with future phases that could support additional expansion. In 2008, the Company opened the first of those buildings, 855 North Wolfe Street, a 279,000 square-foot office building anchored by the Johns Hopkins School of Medicine’s Institute for Basic Biomedical Sciences. Construction of a 492,000 square-foot parking garage at 901 N. Washington Street is currently underway and will provide approximately 1,450 parking spaces for Johns Hopkins and the active buildings at the Science + Technology Park when it is completed in Q3-12. Construction of a second commercial building totaling 234,000 square-feet commenced in January 2012. The new building is being developed on a fee basis and will be fully leased to the Department of Health & Mental Hygiene (DHMH) when it is expected to open in Q2-14.
6)Waterfront Station—Washington, D.C.
Located in Southwest Washington, D.C., Waterfront Station is adjacent to the Waterfront/Southeastern University MetroRail station. Waterfront Station is expected to include 660,000 square feet of office space, an estimated 400 residential units and 40,000 square feet of stores and restaurants.
7)300 Massachusetts Avenue—Cambridge, MA
Located in the science and technology hub of Cambridge, MA, the 300 Massachusetts Avenue block represents an expansion of University Park @ MIT. In a 50/50 partnership with MIT, Forest City is presently focused on a project that reflects a development program of approximately 260,000 square feet of lab and office space. Potential redevelopment of the entire block is possible with the acquisition of adjacent parcels in future phases, and would result in an approximately 400,000 square foot project.
36
Forest City Enterprises, Inc. and Subsidiaries
Supplemental Operating Information
Military Housing
as of April 30, 2012
Below is a summary of our Military Housing development projects. The Company provides development, construction and management services for these projects and receives agreed upon fees for these services. The following phases still have a percentage of units opened and under construction:
| | | | | | | | | | | | | | | | | | | | | | |
Property | | Location | | Anticipated
Opening | | | FCE
Pro-Rata % | | | Cost at Full
Consolidation | | | Total Cost
at 100% | | | No. of Units | |
| | | | | | | | | | | (in millions) | | | | |
Military Housing—Under Construction | | | | | | | | | | | | | | | | | | | | | | |
Hawaii Phase IV | | Kaneohe, HI | | | 2007-2014 | | | | * | | | $ | 0.0 | | | $ | 476.6 | | | | 1,141 | |
Air Force—Southern Group: | | | | | | | | | | | | | | | | | | | | | | |
Keesler Air Force Base | | Biloxi, MS | | | 2011-2012 | | | | 0.0 | % | | | 0.0 | | | | 5.0 | | | | 1,188 | |
Joint Base Charleston | | Charleston, SC | | | 2011-2013 | | | | 0.0 | % | | | 0.0 | | | | 72.0 | | | | 345 | |
Arnold Air Force Base | | Tullahoma, TN | | | 2011-2013 | | | | 0.0 | % | | | 0.0 | | | | 10.1 | | | | 22 | |
Shaw Air Force Base | | Sumter, SC | | | 2011-2015 | | | | 0.0 | % | | | 0.0 | | | | 156.5 | | | | 630 | |
| | | | | | | | | | | | | | | | | | | | | | |
Subtotal Air Force—Southern Group | | | | | | | | | | | | $ | 0.0 | | | $ | 243.6 | | | | 2,185 | |
| | | | | | |
Total Under Construction | | | | | | | | | | | | $ | 0.0 | | | $ | 720.2 | | | | 3,326 | |
| | | | | | | | | | | | | | | | | | | | | | |
| * | The Company's share of residual cash flow ranges from 0-20% during the life cycle of the project. |
Summary of Military Housing Net Operating Income (14,104 end-state units)
Development fees related to our military housing projects are earned based on a contractual percentage of the actual development costs incurred. We also recognize additional development incentive fees upon successful completion of certain criteria, such as incentives to realize development cost savings, encourage small and local business participation, comply with specified safety standards and other project management incentives as specified in the development agreements. NOI from development and development incentive fees was $2,362,000 for the three months ended April 30, 2012 and $1,137,000 for the three months ended April 30, 2011.
Construction management fees are earned based on a contractual percentage of the actual construction costs incurred. We also recognize certain construction incentive fees based upon successful completion of certain criteria as set forth in the construction contracts. NOI from construction and incentive fees was $433,000 for the three months ended April 30, 2012 and $1,180,000 for the three months ended April 30, 2011.
Property management and asset management fees are earned based on a contractual percentage of the annual net rental income and annual operating income, respectively, that is generated by the military housing privatization projects as defined in the agreements. We also recognize certain property management incentive fees based upon successful completion of certain criteria as set forth in the property management agreements. Property management, management incentive and asset management fees generated NOI of $3,547,000 for the three months ended April 30, 2012 and $3,229,000 for the three months ended April 30, 2011.
37
Forest City Enterprises, Inc. and Subsidiaries
Supplemental Operating Information
Land Held for Development and Sale
as of April 30, 2012
The Land Development Group acquires and sells raw land and fully-entitled developed lots to residential, commercial, and industrial customers. The Land Development Group also owns and develops raw land into master-planned communities, mixed-use projects and other residential developments. Below is a summary of our Land Development Group projects.
| | | | | | | | | | | | |
Location | | Gross
Acres (1) | | | Saleable
Acres (2) | | | Option
Acres (3) | |
Stapleton—Denver, CO | | | 334 | | | | 195 | | | | 1,173 | |
Central Station—Chicago, IL | | | 30 | | | | 30 | | | | — | |
| | | | | | | | | | | | |
Total | | | 364 | | | | 225 | | | | 1,173 | |
| | | | | | | | | | | | |
| (1) | Represent all acres currently owned including those used for roadways, open spaces and parks. |
| (2) | Saleable acres represent the total of all acres owned and available for sales. The Land Development Group may choose to further develop some of the acres into completed sublots prior to sale. |
| (3) | Option acres are those acres that the Land Development Group has a formal option to acquire. Typically these options are in the form of purchase agreements with contingencies for the satisfaction of due diligence reviews. |
Stapleton—Denver, CO
Stapleton represents one of the nation’s largest urban redevelopments. At full build-out of 4,700 acres or 7.5 square miles, Stapleton is planned for more than 12,000 homes and apartments, a projected 3 million square-feet of retail and 10 million square-feet of office/research and development/industrial space. Centrally located 10 minutes east of Downtown Denver and 20 minutes from Denver International Airport, Stapleton is expected to be home to 30,000 residents and 35,000 workers when complete.
Central Station—Chicago, IL
Located adjacent to the city’s Museum Campus, and just minutes from the heart of Chicago's Loop, the 80 acre Central Station is a residential community with over 3,000 residential units completed and another 4,000 units in development. Central Station, a 14 million-square-foot development, is being developed in partnership with The Fogelson Companies.
38
Forest City Enterprises, Inc. and Subsidiaries
Supplemental Operating Information
Land Held for Divestiture
as of April 30, 2012
On January 31, 2012, our Board of Directors approved a strategic decision by our senior management to reposition or divest significant portions of our Land Development Group and is actively reviewing alternatives to do so. Below is a summary of land projects that are considered held for divestiture at April 30, 2012.
| | | | | | | | | | | | |
Location | | Gross
Acres | | | Saleable
Acres | | | Option
Acres | |
Mesa del Sol - Albuquerque, NM | | | 3,009 | | | | 1,645 | | | | 5,731 | |
Texas | | | 2,709 | | | | 1,469 | | | | — | |
North Carolina | | | 1,217 | | | | 992 | | | | — | |
Ohio | | | 949 | | | | 638 | | | | 200 | |
Arizona | | | 656 | | | | 482 | | | | — | |
Other | | | 878 | | | | 691 | | | | — | |
| | | | | | | | | | | | |
Total | | | 9,418 | | | | 5,917 | | | | 5,931 | |
| | | | | | | | | | | | |
Mesa del Sol –Albuquerque, NM
Mesa del Sol is a 20 square mile, mixed-use community on the south mesa of Albuquerque, N.M., five minutes from the Albuquerque International Airport. Mesa del Sol’s master plan calls for mixed-use development that will include 1,400 acres for industrial/commercial and office development use, 4,400 acres for residential and supporting retail use, 3,200 acres for open space and parks and 800 acres for schools and universities.
Three Stones – Prosper, TX
Three Stones is a master-planned community of 2,031 acres located in the growth corridor north of Dallas in the town of Prosper. The community is fully entitled and the plan includes approximately 3,090 single family lots, 600 units of attached housing, over 600 acres of parks and open space and 250 acres for commercial/retail use. A variety of single family lot sizes will be offered, as well as a complete amenity center. The development of Phase I is expected to be completed in late 2013.
Legacy Lakes –Aberdeen, NC
Legacy Lakes is a master-planned community located in the Pinehurst area. This community is surrounding the Nicklaus-designed Legacy Golf Course. Legacy Lakes is 406 acres and includes 718 residential lots. Of the 406 total acres, 265 are saleable acres and 21 acres have been sold to date.
San Antonio Portfolio– San Antonio, TX
Forest City owns four multi-phase communities and finished lots in one additional location in the San Antonio area, predominantly on the west side. As of April 30, 2012, over 1,300 of the total 2,563 lots have been sold. The remaining portfolio is comprised of 356 finished lots and 870 undeveloped “paper” lots. Our San Antonio communities serve several different price ranges, and all lots are under option contract to one of five different builders.
Timberlake– Oak Point (Dallas), TX
Timberlake is a planned community of approximately 250 acres located in Denton County, north of Dallas. Forest City entered into this project in 2011 through the formation of a new partnership with Taylor Duncan Interests, Inc. with Forest City providing capital for financing and development. The project is zoned for over 800 single family lots, and development of Phase I is expected to begin in 2012.
Tangerine Crossing – Tucson, AZ
Tangerine Crossing is a master-planned gated residential community with a major retail component on the exterior in a desirable region of the Tucson metropolitan area. This community includes open space, trails and recreation. Tangerine Crossing is 309 acres and includes 396 residential lots and a 25 acre retail center. As of April 30, 2012, 254 lots and the 25 commercial acres have been sold. Of the 309 total acres, 98 are saleable acres and 74 acres have been sold to date.
39
Forest City Enterprises, Inc. and Subsidiaries
Supplemental Financial Information
Common Stock Data (NYSE: FCE A and FCE B)
The following summarizes information related to the Company’s Class A and Class B Common Stock based on information reported by the New York Stock Exchange:
| | | | | | | | | | | | | | | | | | | | |
| | | Quarter Ended | |
| | | April 30,
2012 | | | January 31,
2012 | | | October 31,
2011 | | | July 31,
2011 | | | April 30,
2011 | |
Class A Common Stock | | | | | | | | | | | | | | | | | | | | |
Closing Price, end of quarter | | $ | 15.95 | | | $ | 13.13 | | | $ | 13.68 | | | $ | 18.01 | | | $ | 19.21 | |
High Closing Price | | $ | 16.16 | | | $ | 14.00 | | | $ | 17.82 | | | $ | 19.24 | | | $ | 19.26 | |
Low Closing Price | | $ | 13.19 | | | $ | 10.88 | | | $ | 9.76 | | | $ | 17.78 | | | $ | 17.30 | |
Average Closing Price | | $ | 14.97 | | | $ | 12.32 | | | $ | 12.72 | | | $ | 18.55 | | | $ | 18.48 | |
Total Volume | | | 42,370,907 | | | | 56,114,430 | | | | 101,588,513 | | | | 60,938,097 | | | | 49,003,190 | |
Average Volume | | | 683,402 | | | | 905,071 | | | | 1,562,900 | | | | 967,271 | | | | 790,374 | |
Common shares outstanding, end of quarter | | | 148,501,425 | | | | 148,227,849 | | | | 148,192,446 | | | | 148,162,038 | | | | 144,653,100 | |
| | | | | |
Class B Common Stock | | | | | | | | | | | | | | | | | | | | |
Closing Price, end of quarter | | $ | 15.87 | | | $ | 13.17 | | | $ | 13.57 | | | $ | 17.90 | | | $ | 18.99 | |
High Closing Price | | $ | 16.12 | | | $ | 13.92 | | | $ | 17.77 | | | $ | 19.17 | | | $ | 19.26 | |
Low Closing Price | | $ | 13.17 | | | $ | 10.85 | | | $ | 9.78 | | | $ | 17.66 | | | $ | 17.27 | |
Average Closing Price | | $ | 14.95 | | | $ | 12.29 | | | $ | 12.71 | | | $ | 18.54 | | | $ | 18.46 | |
Total Volume | | | 41,208 | | | | 75,255 | | | | 46,562 | | | | 58,335 | | | | 38,821 | |
Average Volume | | | 665 | | | | 1,214 | | | | 716 | | | | 926 | | | | 626 | |
Common shares outstanding, end of quarter | | | 20,911,371 | | | | 20,934,335 | | | | 20,964,181 | | | | 20,987,364 | | | | 21,006,188 | |
Common Equity Market Capitalization | | $ | 2,700,461,187 | | | $ | 2,221,936,849 | | | $ | 2,311,756,597 | | | $ | 3,044,072,120 | | | $ | 3,177,693,561 | |
| | | | | |
Quarterly dividends declared per common share Class A and Class B | | $ | — | | | $ | — | | | $ | — | | | $ | — | | | $ | — | |
| | | | | | | | | | | | | | | | | | | | |
Financial Covenants
The Company’s bank revolving credit facility and indenture dated May 19, 2003 (“2003 Indenture”) contain certain restrictive financial covenants. A summary of the key financial covenants as defined in each agreement, all of which the Company is compliant with at April 30, 2012, follows:
| | | | | | | | | | | | | | | | | | | | |
| | | Requirement
Per Agreement | | | As of
April 30, 2012 | | | As of
January 31, 2012 | | | As of
October 31, 2011 | | | As of
July 31, 2011 | |
| | | (dollars in thousands) | |
Credit Facility Financial Covenants | | | | | | | | | | | | | | | | | | | | |
Debt Service Coverage Ratio | | | 1.35x | | | | 1.89x | | | | 1.93x | | | | 1.92x | | | | 1.95x | |
Cash Flow Coverage Ratio | | | 2.50x | | | | 3.57x | | | | 3.86x | | | | 3.94x | | | | 4.37x | |
Total Development Ratio | | | <17 | % | | | 10.96 | % | | | 10.64 | % | | | 11.59 | % | | | 10.99 | % |
Minimum Consolidated Shareholders’ Equity, as defined | | $ | 2,320,175 | | | $ | 3,577,586 | | | $ | 3,505,097 | | | $ | 3,584,782 | | | $ | 3,586,466 | |
| | | | | |
2003 Indenture Financial Covenants(1) | | | | | | | | | | | | | | | | | | | | |
Ratio of Consolidated EBITDA to Interest | | | >1.30x | | | | 1.76x | | | | 1.82x | | | | 1.84x | | | | 1.95x | |
Minimum Net Worth, as defined(2) | | $ | 1,002,072 | | | $ | 4,142,140 | | | $ | 4,061,179 | | | $ | 4,105,717 | | | $ | 4,100,853 | |
| (1) | Violation of these financial covenants alone would not automatically cause the notes issued under the 2003 Indenture to become due and payable, but would prevent the Company from incurring or permitting a subsidiary from incurring additional debt, as defined in the 2003 Indenture, unless otherwise permitted by the 2003 Indenture. |
| (2) | Represents the minimum net worth, as defined requirement at April 30, 2012. This requirement fluctuates each quarter based on actual financial results of each applicable period. |
40
Forest City Enterprises, Inc. and Subsidiaries
Supplemental Financial Information
Debt for Projects under Construction and Development
We use nonrecourse mortgage debt and nonrecourse notes payable for the financing of our projects under construction and development. We draw on these financings to partially fund the cost incurred with the development of our real estate. As of April 30, 2012, the amounts outstanding compared to the total commitment under the financings are as follows:
| | | | | | | | | | | | | | | | |
| | | Full
Consolidation
(GAAP) | | | Less
Noncontrolling
Interest | | | Plus
Unconsolidated
Investments at
Pro-Rata | | | Pro-Rata
Consolidation
(Non-GAAP) | |
| | | (in thousands) | |
Outstanding | | | | | | | | | | | | | | | | |
Fixed | | $ | 536,584 | | | $ | 236,171 | | | $ | 887 | | | $ | 301,300 | |
Variable | | | | | | | | | | | | | | | | |
Taxable | | | 299,282 | | | | 148 | | | | 10,565 | | | | 309,699 | |
Tax-Exempt | | | — | | | | — | | | | 5,211 | | | | 5,211 | |
| | | | | | | | | | | | | | | | |
Total outstanding on projects under construction and development(1) | | $ | 835,866 | | | $ | 236,319 | | | $ | 16,663 | | | $ | 616,210 | |
| | | | | | | | | | | | | | | | |
Commitment | | | | | | | | | | | | | | | | |
Fixed | | $ | 839,432 | | | $ | 401,463 | | | $ | 887 | | | $ | 438,856 | |
Variable | | | | | | | | | | | | | | | | |
Taxable | | | 395,116 | | | | 1,139 | | | | 10,565 | | | | 404,542 | |
Tax-Exempt | | | — | | | | — | | | | 5,211 | | | | 5,211 | |
| | | | | | | | | | | | | | | | |
Total commitment | | $ | 1,234,548 | | | $ | 402,602 | | | $ | 16,663 | | | $ | 848,609 | |
| | | | | | | | | | | | | | | | |
| (1) | Proceeds from outstanding debt of $2,715 and $5,581, at full and pro-rata consolidation, respectively, described above are recorded as restricted cash and escrowed funds in our Consolidated Balance Sheet. For bonds issued in conjunction with development, the full amount of the bonds is issued at the beginning of construction and must remain in escrow until costs are incurred. |
Nonrecourse Debt
Our primary capital strategy seeks to isolate the operating and financial risk at the property level to maximize returns and reduce risk on and of our equity capital. As such, substantially all of our operating and development properties are separately encumbered with nonrecourse mortgage debt which in some limited circumstances is supplemented by nonrecourse notes payable (collectively “nonrecourse debt”).
We use taxable and tax-exempt nonrecourse debt for our real estate projects. For real estate projects financed with tax-exempt debt, we generally utilize variable-rate debt. For construction loans, we generally pursue variable-rate financings with maturities ranging from two to five years. For those real estate projects financed with taxable debt, we generally seek long-term, fixed-rate financing for those operating projects whose loans mature or are projected to open and achieve stabilized operations. The availability of nonrecourse mortgage capital is improving, especially in strong markets, but is still not at the levels before the economic downturn. For those assets that cannot be refinanced at attractive terms, we attempt to extend the maturities with existing lenders.
We are actively working to refinance and/or extend the maturities of the nonrecourse debt that are coming due in the next 24 months. During the three months ended April 30, 2012, we completed the following financings:
| | | | | | | | | | | | | | | | |
Purpose of Financing | | Full
Consolidation | | | Less
Noncontrolling
Interest | | | Plus
Unconsolidated
Investments at
Pro-Rata | | | Pro-Rata
Consolidation | |
| | | (in thousands) | |
Refinancings | | $ | 73,000 | | | $ | — | | | $ | 10,829 | | | $ | 83,829 | |
Construction and development projects(1) | | | 18,380 | | | | — | | | | — | | | | 18,380 | |
Loan extensions/additional fundings | | | 57,830 | | | | 862 | | | | 24,700 | | | | 81,668 | |
| | | | | | | | | | | | | | | | |
| | $ | 149,210 | | | $ | 862 | | | $ | 35,529 | | | $ | 183,877 | |
| | | | | | | | | | | | | | | | |
| (1) | Represents the full amount available to be drawn on the loans. |
41
Forest City Enterprises, Inc. and Subsidiaries
Supplemental Financial Information
Scheduled Maturities Table: Nonrecourse Debt(dollars in thousands)
As of April 30, 2012
| | | | | | | | | | | | | | | | | | | | | | | | | | | | | | | | | | | | |
| | | Period Ending January 31, 2013 | | Fiscal Year Ending January 31, 2014 |
| | | | | | | | | Plus | | | | | | | | | | | | | | Plus | | | | | | |
| | | | | | Less | | | Unconsolidated | | | | | | | | | | | Less | | | Unconsolidated | | | | | | |
| | | Full | | | Noncontrolling | | | Investments at | | | Pro-Rata | | | | | Full | | | Noncontrolling | | | Investments at | | | Pro-Rata | | | |
| | | Consolidation | | | Interest | | | Pro-Rata | | | Consolidation | | | | | Consolidation | | | Interest | | | Pro-Rata | | | Consolidation | | | |
Fixed: | | | | | | | | | | | | | | | | | | | | | | | | | | | | | | | | | | | | |
Fixed-rate debt | | $ | 280,987 | | | $ | 17,074 | | | $ | 64,118 | | | $ | 328,031 | | | | | $ | 605,454 | | | $ | 78,317 | | | $ | 142,330 | | | $ | 669,467 | | | |
Weighted average rate | | | 5.96 | % | | | 7.09 | % | | | 6.23 | % | | | 5.95 | % | | | | | 6.49 | % | | | 9.90 | % | | | 6.32 | % | | | 6.05 | % | | |
Variable: | | | | | | | | | | | | | | | | | | | | | | | | | | | | | | | | | | | | |
Variable-rate debt | | | 925,943 | | | | — | | | | 99,319 | | | | 1,025,262 | | | | | | 66,392 | | | | 1,869 | | | | 50,866 | | | | 115,389 | | | |
Weighted average rate | | | 3.17 | % | | | — | % | | | 3.92 | % | | | 3.25 | % | | | | | 5.39 | % | | | 5.76 | % | | | 3.14 | % | | | 4.39 | % | | |
| | | | | | | | | | |
Tax-Exempt | | | 239 | | | | 24 | | | | 2,480 | | | | 2,695 | | | | | | 91,055 | | | | 26 | | | | 53,040 | | | | 144,069 | | | |
Weighted average rate | | | 1.75 | % | | | 1.74 | % | | | 1.62 | % | | | 1.63 | % | | | | | 2.75 | % | | | 1.72 | % | | | 2.96 | % | | | 2.83 | % | | |
Total variable-rate debt | | | 926,182 | | | | 24 | | | | 101,799 | | | | 1,027,957 | | | | | | 157,447 | | | | 1,895 | | | | 103,906 | | | | 259,458 | | | |
Total Nonrecourse Debt | | $ | 1,207,169 | | | $ | 17,098 | | | $ | 165,917 | | | $ | 1,355,988 | | | | | $ | 762,901 | | | $ | 80,212 | | | $ | 246,236 | | | $ | 928,925 | | | |
Weighted Average Rate | | | 3.82 | % | | | 7.09 | % | | | 4.77 | % | | | 3.90 | % | | | | | 5.95 | % | | | 9.80 | % | | | 4.94 | % | | | 5.35 | % | | |
| | | | | | | | | | | | | | | | | | | | | | | | | | | | | | | | | | | | |
| | | Fiscal Year Ending January 31, 2015 | | Fiscal Year Ending January 31, 2016 |
| | | | | | | | | Plus | | | | | | | | | | | | | | Plus | | | | | | |
| | | | | | Less | | | Unconsolidated | | | | | | | | | | | Less | | | Unconsolidated | | | | | | |
| | | Full | | | Noncontrolling | | | Investments at | | | Pro-Rata | | | | | Full | | | Noncontrolling | | | Investments at | | | Pro-Rata | | | |
| | | Consolidation | | | Interest | | | Pro-Rata | | | Consolidation | | | | | Consolidation | | | Interest | | | Pro-Rata | | | Consolidation | | | |
Fixed: | | | | | | | | | | | | | | | | | | | | | | | | | | | | | | | | | | | | |
Fixed-rate debt | | $ | 291,188 | | | $ | 34,041 | | | $ | 242,658 | | | $ | 499,805 | | | | | $ | 346,108 | | | $ | 29,186 | | | $ | 122,682 | | | $ | 439,604 | | | |
Weighted average rate | | | 6.06 | % | | | 5.93 | % | | | 5.51 | % | | | 5.81 | % | | | | | 5.59 | % | | | 5.83 | % | | | 5.30 | % | | | 5.49 | % | | |
Variable: | | | | | | | | | | | | | | | | | | | | | | | | | | | | | | | | | | | | |
Variable-rate debt | | | 28,479 | | | | 314 | | | | 30,460 | | | | 58,625 | | | | | | — | | | | — | | | | 31,715 | | | | 31,715 | | | |
Weighted average rate | | | 3.82 | % | | | 2.74 | % | | | 4.26 | % | | | 4.06 | % | | | | | — | % | | | — | % | | | 2.22 | % | | | 2.22 | % | | |
| | | | | | | | | | |
Tax-Exempt | | | 272 | | | | 27 | | | | — | | | | 245 | | | | | | 290 | | | | 29 | | | | — | | | | 261 | | | |
Weighted average rate | | | 1.75 | % | | | 1.76 | % | | | — | % | | | 1.75 | % | | | | | 1.75 | % | | | 1.75 | % | | | — | % | | | 1.75 | % | | |
Total variable-rate debt | | | 28,751 | | | | 341 | | | | 30,460 | | | | 58,870 | | | | | | 290 | | | | 29 | | | | 31,715 | | | | 31,976 | | | |
Total Nonrecourse Debt | | $ | 319,939 | | | $ | 34,382 | | | $ | 273,118 | | | $ | 558,675 | | | | | $ | 346,398 | | | $ | 29,215 | | | $ | 154,397 | | | $ | 471,580 | | | |
Weighted Average Rate | | | 5.86 | % | | | 5.90 | % | | | 5.37 | % | | | 5.62 | % | | | | | 5.59 | % | | | 5.83 | % | | | 4.67 | % | | | 5.27 | % | | |
42
Forest City Enterprises, Inc. and Subsidiaries
Supplemental Financial Information
Scheduled Maturities Table: Nonrecourse Debt(dollars in thousands)(continued)
As of April 30, 2012
| | | | | | | | | | | | | | | | | | | | | | | | | | | | | | | | | | | | |
| | | Fiscal Year Ending January 31, 2017 | | Thereafter | | | |
| | | Full
Consolidation | | | Less
Noncontrolling
Interest | | | Plus
Unconsolidated
Investments at
Pro-Rata | | | Pro-Rata
Consolidation | | | | | Full
Consolidation | | | Less
Noncontrolling
Interest | | | Plus
Unconsolidated
Investments
at Pro-Rata | | | Pro-Rata
Consolidation | | | |
Fixed: | | | | | | | | | | | | | | | | | | | | | | | | | | | | | | | | | | | | |
Fixed-rate debt | | $ | 420,327 | | | $ | 6,544 | | | $ | 89,802 | | | $ | 503,585 | | | | | $ | 1,639,829 | | | $ | 222,812 | | | $ | 806,617 | | | $ | 2,223,634 | | | |
Weighted average rate | | | 5.77 | % | | | 6.01 | % | | | 6.48 | % | | | 5.89 | % | | | | | 5.18 | % | | | 6.20 | % | | | 5.59 | % | | | 5.23 | % | | |
| | | | | | | | | | |
Variable: | | | | | | | | | | | | | | | | | | | | | | | | | | | | | | | | | | | | |
Variable-rate debt | | | — | | | | — | | | | 182,378 | | | | 182,378 | | | | | | 648,324 | | | | 3,335 | | | | 112,217 | | | | 757,206 | | | |
Weighted average rate | | | — | % | | | — | % | | | 2.38 | % | | | 2.38 | % | | | | | 6.50 | % | | | 3.25 | % | | | 3.97 | % | | | 6.14 | % | | |
| | | | | | | | | | |
Tax-Exempt . | | | 309 | | | | 31 | | | | 103,989 | | | | 104,267 | | | | | | 344,680 | | | | 9,728 | | | | 165,176 | | | | 500,128 | | | |
Weighted average rate | | | 1.75 | % | | | 1.74 | % | | | 2.47 | | | | 2.47 | % | | | | | 1.35 | % | | | 0.94 | % | | | 1.59 | % | | | 1.44 | % | | |
Total variable-rate debt | | | 309 | | | | 31 | | | | 286,367 | | | | 286,645 | | | | | | 993,004 | | | | 13,063 | | | | 277,393 | | | | 1,257,334 | | | |
Total Nonrecourse Debt | | $ | 420,636 | | | $ | 6,575 | | | $ | 376,169 | | | $ | 790,230 | | | | | $ | 2,632,833 | | | $ | 235,875 | | | $ | 1,084,010 | | | $ | 3,480,968 | | | |
Weighted Average Rate | | | 5.77 | % | | | 5.99 | % | | | 3.38 | % | | | 4.63 | % | | | | | 5.01 | % | | | 5.95 | % | | | 4.81 | % | | | 4.88 | % | | |
| | | | | | | | | | | | | | | | | | |
| | | Total |
| | | Full Consolidation | | | Less Noncontrolling Interest | | | Plus Unconsolidated Investments at Pro-Rata | | | Pro-Rata Consolidation | | | |
Fixed: | | | | | | | | | | | | | | | | | | |
Fixed-rate debt | | $ | 3,583,893 | | | $ | 387,974 | | | $ | 1,468,207 | | | $ | 4,664,126 | | | |
Weighted average rate | | | 5.64 | % | | | 6.93 | % | | | 5.71 | % | | | 5.56 | % | | |
| | | | | |
Variable: | | | | | | | | | | | | | | | | | | |
Variable-rate debt | | | 1,669,138 | | | | 5,518 | | | | 506,955 | | | | 2,170,575 | | | |
Weighted average rate | | | 4.57 | % | | | 4.07 | % | | | 3.21 | % | | | 4.25 | % | | |
| | | | | |
Tax-Exempt | | | 436,845 | | | | 9,865 | | | | 324,685 | | | | 751,665 | | | |
Weighted average rate | | | 1.64 | % | | | 0.95 | % | | | 2.09 | % | | | 1.85 | % | | |
Total variable-rate debt | | | 2,105,983 | | | | 15,383 | | | | 831,640 | | | | 2,922,240 | | | |
Total Nonrecourse Debt | | $ | 5,689,876 | | | $ | 403,357 | | | $ | 2,299,847 | | | $ | 7,586,366 | | | |
Weighted Average Rate | | | 5.02 | % | | | 6.75 | % | | | 4.65 | % | | | 4.82 | % | | |
43
Forest City Enterprises, Inc. and Subsidiaries
Supplemental Financial Information
Summary of Earnings Before Depreciation, Amortization and Deferred Taxes (EBDT) — Three Months Ended April 30, 2012 and 2011(in thousands)
| | | | | | | | | | | | | | | | | | | | | | | | | | | | | | | | | | | | | | | | |
| | | Commercial Group 2012 | | | Commercial Group 2011 | |
| | | | | | | | | Plus | | | | | | | | | | | | | | | Plus | | | | | | | |
| | | Full | | | Less | | | Unconsolidated | | | Plus | | | Pro-Rata | | | Full | | | Less | | | Unconsolidated | | | Plus | | | Pro-Rata | |
| | | Consolidation | | | Noncontrolling | | | Investments at | | | Discontinued | | | Consolidation | | | Consolidation | | | Noncontrolling | | | Investments at | | | Discontinued | | | Consolidation | |
| | | (GAAP) | | | Interest | | | Pro-Rata | | | Operations | | | (Non-GAAP) | | | (GAAP) | | | Interest | | | Pro-Rata | | | Operations | | | (Non-GAAP) | |
Revenues from real estate operations | | $ | 219,191 | | | $ | 7,070 | | | $ | 57,944 | | | $ | 292 | | | $ | 270,357 | | | $ | 242,586 | | | $ | 10,799 | | | $ | 44,504 | | | $ | 9,252 | | | $ | 285,543 | |
Exclude straight-line rent adjustment | | | (5,706 | ) | | | — | | | | — | | | | (3 | ) | | | (5,709 | ) | | | (3,325 | ) | | | — | | | | — | | | | (336 | ) | | | (3,661 | ) |
| | | | | | | | | | | | | | | | | | | | | | | | | | | | | | | | | | | | | | | | |
Adjusted revenues | | | 213,485 | | | | 7,070 | | | | 57,944 | | | | 289 | | | | 264,648 | | | | 239,261 | | | | 10,799 | | | | 44,504 | | | | 8,916 | | | | 281,882 | |
Add interest and other income | | | 3,799 | | | | 103 | | | | 33 | | | | — | | | | 3,729 | | | | 6,741 | | | | (511 | ) | | | 29 | | | | — | | | | 7,281 | |
Add equity in earnings (loss) of unconsolidated entities | | | 6,398 | | | | — | | | | (6,398 | ) | | | — | | | | — | | | | 2,922 | | | | (1 | ) | | | (2,923 | ) | | | — | | | | — | |
Exclude gain on disposition of unconsolidated entities | | | — | | | | — | | | | — | | | | — | | | | — | | | | — | | | | — | | | | — | | | | — | | | | — | |
Exclude depreciation and amortization of unconsolidated entities | | | 10,985 | | | | — | | | | (10,985 | ) | | | — | | | | — | | | | 8,669 | | | | — | | | | (8,669 | ) | | | — | | | | — | |
Exclude interest expense of unconsolidated entities | | | 16,533 | | | | — | | | | (16,533 | ) | | | — | | | | — | | | | 13,852 | | | | — | | | | (13,852 | ) | | | — | | | | — | |
| | | | | | | | | | | | | | | | | | | | | | | | | | | | | | | | | | | | | | | | |
Adjusted total income | | | 251,200 | | | | 7,173 | | | | 24,061 | | | | 289 | | | | 268,377 | | | | 271,445 | | | | 10,287 | | | | 19,089 | | | | 8,916 | | | | 289,163 | |
Operating expenses | | | 97,504 | | | | 4,700 | | | | 24,061 | | | | 141 | | | | 117,006 | | | | 100,060 | | | | 6,257 | | | | 19,089 | | | | 6,679 | | | | 119,571 | |
Non-Real Estate depreciation and amortization and amortization of mortgage procurement costs | | | 177 | | | | — | | | | — | | | | — | | | | 177 | | | | 195 | | | | — | | | | — | | | | — | | | | 195 | |
Exclude straight-line rent adjustment | | | (792 | ) | | | — | | | | — | | | | — | | | | (792 | ) | | | (1,274 | ) | | | — | | | | — | | | | — | | | | (1,274 | ) |
Exclude preference payment | | | — | | | | — | | | | — | | | | — | | | | — | | | | (585 | ) | | | — | | | | — | | | | — | | | | (585 | ) |
| | | | | | | | | | | | | | | | | | | | | | | | | | | | | | | | | | | | | | | | |
Adjusted operating expenses | | | 96,889 | | | | 4,700 | | | | 24,061 | | | | 141 | | | | 116,391 | | | | 98,396 | | | | 6,257 | | | | 19,089 | | | | 6,679 | | | | 117,907 | |
Net operating income | | | 154,311 | | | | 2,473 | | | | — | | | | 148 | | | | 151,986 | | | | 173,049 | | | | 4,030 | | | | — | | | | 2,237 | | | | 171,256 | |
Interest expense | | | (38,822 | ) | | | (2,223 | ) | | | (16,533 | ) | | | (97 | ) | | | (53,229 | ) | | | (45,224 | ) | | | (3,227 | ) | | | (13,852 | ) | | | (1,236 | ) | | | (57,085 | ) |
Interest expense of unconsolidated entities | | | (16,533 | ) | | | — | | | | 16,533 | | | | — | | | | — | | | | (13,852 | ) | | | — | | | | 13,852 | | | | — | | | | — | |
Loss on early extinguishment of debt | | | (719 | ) | | | (188 | ) | | | — | | | | — | | | | (531 | ) | | | (296 | ) | | | (4 | ) | | | — | | | | — | | | | (292 | ) |
Noncontrolling interest in earnings before depreciation and amortization | | | (62 | ) | | | (62 | ) | | | — | | | | — | | | | — | | | | (799 | ) | | | (799 | ) | | | — | | | | — | | | | — | |
Allowance for projects under development revision | | | — | | | | — | | | | — | | | | — | | | | — | | | | 1,400 | | | | — | | | | — | | | | — | | | | 1,400 | |
Pre-tax EBDT from discontinued operations | | | 51 | | | | — | | | | — | | | | (51 | ) | | | — | | | | 1,001 | | | | — | | | | — | | | | (1,001 | ) | | | — | |
| | | | | | | | | | | | | | | | | | | | | | | | | | | | | | | | | | | | | | | | |
Pre-Tax EBDT | | | 98,226 | | | | — | | | | — | | | | — | | | | 98,226 | | | | 115,279 | | | | — | | | | — | | | | — | | | | 115,279 | |
Income tax expense (benefit) | | | — | | | | — | | | | — | | | | — | | | | — | | | | — | | | | — | | | | — | | | | — | | | | — | |
| | | | | | | | | | | | | | | | | | | | | | | | | | | | | | | | | | | | | | | | |
Earnings before depreciation, amortization and deferred taxes (EBDT) | | $ | 98,226 | | | $ | — | | | $ | — | | | $ | — | | | $ | 98,226 | | | $ | 115,279 | | | $ | — | | | $ | — | | | $ | — | | | $ | 115,279 | |
| | | | | | | | | | | | | | | | | | | | | | | | | | | | | | | | | | | | | | | | |
Reconciliation to net earnings (loss): | | | | | | | | | | | | | | | | | | | | | | | | | | | | | | | | | | | | | | | | |
Earnings before depreciation, amortization and deferred taxes (EBDT) | | $ | 98,226 | | | $ | — | | | $ | — | | | $ | — | | | $ | 98,226 | | | $ | 115,279 | | | $ | — | | | $ | — | | | $ | — | | | $ | 115,279 | |
Depreciation and amortization - Real Estate Groups | | | (49,178 | ) | | | — | | | | — | | | | — | | | | (49,178 | ) | | | (48,804 | ) | | | — | | | | — | | | | (1,626 | ) | | | (50,430 | ) |
Amortization of mortgage procurement costs - Real Estate Groups | | | (2,839 | ) | | | — | | | | — | | | | — | | | | (2,839 | ) | | | (2,469 | ) | | | — | | | | — | | | | (262 | ) | | | (2,731 | ) |
Straight-line rent adjustment | | | 4,914 | | | | — | | | | — | | | | 3 | | | | 4,917 | | | | 2,051 | | | | — | | | | — | | | | 336 | | | | 2,387 | |
Preference payment | | | — | | | | — | | | | — | | | | — | | | | — | | | | (585 | ) | | | — | | | | — | | | | — | | | | (585 | ) |
Gain on disposition of rental properties and partial interests in rental properties, net of noncontrolling interest | | | — | | | | — | | | | — | | | | 7,914 | | | | 7,914 | | | | 9,561 | | | | — | | | | — | | | | 10,038 | | | | 19,599 | |
Gain on disposition of unconsolidated entities | | | — | | | | — | | | | — | | | | — | | | | — | | | | — | | | | — | | | | — | | | | — | | | | — | |
Impairment of consolidated real estate | | | (1,381 | ) | | | — | | | | — | | | | — | | | | (1,381 | ) | | | (3,435 | ) | | | — | | | | — | | | | — | | | | (3,435 | ) |
Allowance for projects under development revision | | | — | | | | — | | | | — | | | | — | | | | — | | | | (1,400 | ) | | | — | | | | — | | | | — | | | | (1,400 | ) |
Discontinued operations: | | | | | | | | | | | | | | | | | | | | | | | | | | | | | | | | | | | | | | | | |
Depreciation and amortization - Real Estate Groups | | | — | | | | — | | | | — | | | | — | | | | — | | | | (1,626 | ) | | | — | | | | — | | | | 1,626 | | | | — | |
Amortization of mortgage procurement costs - Real Estate Groups | | | — | | | | — | | | | — | | | | — | | | | — | | | | (262 | ) | | | — | | | | — | | | | 262 | | | | — | |
Straight-line rent adjustment | | | 3 | | | | — | | | | — | | | | (3 | ) | | | — | | | | 336 | | | | — | | | | — | | | | (336 | ) | | | — | |
Gain on disposition of rental properties | | | 7,914 | | | | — | | | | — | | | | (7,914 | ) | | | — | | | | 10,038 | | | | — | | | | — | | | | (10,038 | ) | | | — | |
| | | | | | | | | | | | | | | | | | | | | | | | | | | | | | | | | | | | | | | | |
Net earnings (loss) attributable to Forest City Enterprises, Inc. | | $ | 57,659 | | | $ | — | | | $ | — | | | $ | — | | | $ | 57,659 | | | $ | 78,684 | | | $ | — | | | $ | — | | | $ | — | | | $ | 78,684 | |
| | | | | | | | | | | | | | | | | | | | | | | | | | | | | | | | | | | | | | | | |
44
Forest City Enterprises, Inc. and Subsidiaries
Supplemental Financial Information
Summary of Earnings Before Depreciation, Amortization and Deferred Taxes (EBDT) — Three Months Ended April 30, 2012 and 2011(in thousands) (continued)
| | | | | | | | | | | | | | | | | | | | | | | | | | | | | | | | | | | | | | | | |
| | | Residential Group 2012 | | | Residential Group 2011 | |
| | | | | | | | | Plus | | | | | | | | | | | | | | | Plus | | | | | | | |
| | | Full | | | Less | | | Unconsolidated | | | Plus | | | Pro-Rata | | | Full | | | Less | | | Unconsolidated | | | Plus | | | Pro-Rata | |
| | | Consolidation | | | Noncontrolling | | | Investments at | | | Discontinued | | | Consolidation | | | Consolidation | | | Noncontrolling | | | Investments at | | | Discontinued | | | Consolidation | |
| | | (GAAP) | | | Interest | | | Pro-Rata | | | Operations | | | (Non-GAAP) | | | (GAAP) | | | Interest | | | Pro-Rata | | | Operations | | | (Non-GAAP) | |
Revenues from real estate operations | | $ | 65,305 | | | $ | 4,589 | | | $ | 41,669 | | | $ | — | | | $ | 102,385 | | | $ | 53,504 | | | $ | 1,048 | | | $ | 35,783 | | | $ | — | | | $ | 88,239 | |
Exclude straight-line rent adjustment | | | 82 | | | | — | | | | — | | | | — | | | | 82 | | | | 226 | | | | — | | | | — | | | | — | | | | 226 | |
| | | | | | | | | | | | | | | | | | | | | | | | | | | | | | | | | | | | | | | | |
Adjusted revenues | | | 65,387 | | | | 4,589 | | | | 41,669 | | | | — | | | | 102,467 | | | | 53,730 | | | | 1,048 | | | | 35,783 | | | | — | | | | 88,465 | |
Add interest and other income | | | 4,475 | | | | 141 | | | | 176 | | | | — | | | | 4,510 | | | | 5,876 | | | | 142 | | | | 148 | | | | — | | | | 5,882 | |
Add equity in earnings (loss) of unconsolidated entities | | | 4,170 | | | | 30 | | | | (3,949 | ) | | | — | | | | 191 | | | | 17,032 | | | | 49 | | | | (16,705 | ) | | | — | | | | 278 | |
Exclude gain on disposition of unconsolidated entities | | | — | | | | — | | | | — | | | | — | | | | — | | | | (12,567 | ) | | | — | | | | 12,567 | | | | — | | | | — | |
Exclude depreciation and amortization of unconsolidated entities | | | 8,990 | | | | — | | | | (8,990 | ) | | | — | | | | — | | | | 5,556 | | | | — | | | | (5,556 | ) | | | — | | | | — | |
Exclude interest expense of unconsolidated entities | | | 9,735 | | | | — | | | | (9,735 | ) | | | — | | | | — | | | | 9,106 | | | | — | | | | (9,106 | ) | | | — | | | | — | |
| | | | | | | | | | | | | | | | | | | | | | | | | | | | | | | | | | | | | | | | |
Adjusted total income | | | 92,757 | | | | 4,760 | | | | 19,171 | | | | — | | | | 107,168 | | | | 78,733 | | | | 1,239 | | | | 17,131 | | | | — | | | | 94,625 | |
Operating expenses | | | 44,939 | | | | 3,576 | | | | 19,171 | | | | — | | | | 60,534 | | | | 36,777 | | | | 539 | | | | 17,131 | | | | — | | | | 53,369 | |
Non-Real Estate depreciation and amortization and amortization of mortgage procurement costs | | | 100 | | | | — | | | | — | | | | — | | | | 100 | | | | 123 | | | | — | | | | — | | | | — | | | | 123 | |
Exclude straight-line rent adjustment | | | — | | | | — | | | | — | | | | — | | | | — | | | | 63 | | | | — | | | | — | | | | — | | | | 63 | |
Exclude preference payment | | | — | | | | — | | | | — | | | | — | | | | — | | | | — | | | | — | | | | — | | | | — | | | | — | |
| | | | | | | | | | | | | | | | | | | | | | | | | | | | | | | | | | | | | | | | |
Adjusted operating expenses | | | 45,039 | | | | 3,576 | | | | 19,171 | | | | — | | | | 60,634 | | | | 36,963 | | | | 539 | | | | 17,131 | | | | — | | | | 53,555 | |
Net operating income | | | 47,718 | | | | 1,184 | | | | — | | | | — | | | | 46,534 | | | | 41,770 | | | | 700 | | | | — | | | | — | | | | 41,070 | |
Interest expense | | | (4,348 | ) | | | (328 | ) | | | (9,735 | ) | | | — | | | | (13,755 | ) | | | (6,214 | ) | | | (501 | ) | | | (9,106 | ) | | | — | | | | (14,819 | ) |
Interest expense of unconsolidated entities | | | (9,735 | ) | | | — | | | | 9,735 | | | | — | | | | — | | | | (9,106 | ) | | | — | | | | 9,106 | | | | — | | | | — | |
Loss on early extinguishment of debt | | | — | | | | — | | | | — | | | | — | | | | — | | | | — | | | | — | | | | — | | | | — | | | | — | |
Noncontrolling interest in earnings before depreciation and amortization | | | (856 | ) | | | (856 | ) | | | — | | | | — | | | | — | | | | (199 | ) | | | (199 | ) | | | — | | | | — | | | | — | |
Allowance for projects under development revision | | | — | | | | — | | | | — | | | | — | | | | — | | | | 600 | | | | — | | | | — | | | | — | | | | 600 | |
Pre-tax EBDT from discontinued operations | | | — | | | | — | | | | — | | | | — | | | | — | | | | — | | | | — | | | | — | | | | — | | | | — | |
| | | | | | | | | | | | | | | | | | | | | | | | | | | | | | | | | | | | | | | | |
Pre-Tax EBDT | | | 32,779 | | | | — | | | | — | | | | — | | | | 32,779 | | | | 26,851 | | | | — | | | | — | | | | — | | | | 26,851 | |
Income tax expense (benefit) | | | — | | | | — | | | | — | | | | — | | | | — | | | | — | | | | — | | | | — | | | | — | | | | — | |
| | | | | | | | | | | | | | | | | | | | | | | | | | | | | | | | | | | | | | | | |
Earnings before depreciation, amortization and deferred taxes (EBDT) | | $ | 32,779 | | | $ | — | | | $ | — | | | $ | — | | | $ | 32,779 | | | $ | 26,851 | | | $ | — | | | $ | — | | | $ | — | | | $ | 26,851 | |
| | | | | | | | | | | | | | | | | | | | | | | | | | | | | | | | | | | | | | | | |
Reconciliation to net earnings (loss): | | | | | | | | | | | | | | | | | | | | | | | | | | | | | | | | | | | | | | | | |
Earnings before depreciation, amortization and deferred taxes (EBDT) | | $ | 32,779 | | | $ | — | | | $ | — | | | $ | — | | | $ | 32,779 | | | $ | 26,851 | | | $ | — | | | $ | — | | | $ | — | | | $ | 26,851 | |
Depreciation and amortization - Real Estate Groups | | | (21,131 | ) | | | — | | | | — | | | | — | | | | (21,131 | ) | | | (18,313 | ) | | | — | | | | — | | | | — | | | | (18,313 | ) |
Amortization of mortgage procurement costs - Real Estate Groups | | | (758 | ) | | | — | | | | — | | | | — | | | | (758 | ) | | | (840 | ) | | | — | | | | — | | | | — | | | | (840 | ) |
Straight-line rent adjustment | | | (82 | ) | | | — | | | | — | | | | — | | | | (82 | ) | | | (163 | ) | | | — | | | | — | | | | — | | | | (163 | ) |
Preference payment | | | — | | | | — | | | | — | | | | — | | | | — | | | | — | | | | — | | | | — | | | | — | | | | — | |
Gain on disposition of rental properties and partial interests in rental properties, net of noncontrolling interest | | | — | | | | — | | | | — | | | | — | | | | — | | | | — | | | | — | | | | 12,567 | | | | — | | | | 12,567 | |
Gain on disposition of unconsolidated entities | | | — | | | | — | | | | — | | | | — | | | | — | | | | 12,567 | | | | — | | | | (12,567 | ) | | | — | | | | — | |
Impairment of consolidated real estate | | | — | | | | — | | | | — | | | | — | | | | — | | | | — | | | | — | | | | — | | | | — | | | | — | |
Allowance for projects under development revision | | | — | | | | — | | | | — | | | | — | | | | — | | | | (600 | ) | | | — | | | | — | | | | — | | | | (600 | ) |
Discontinued operations: | | | | | | | | | | | | | | | | | | | | | | | | | | | | | | | | | | | | | | | | |
Depreciation and amortization - Real Estate Groups | | | — | | | | — | | | | — | | | | — | | | | — | | | | — | | | | — | | | | — | | | | — | | | | — | |
Amortization of mortgage procurement costs - Real Estate Groups | | | — | | | | — | | | | — | | | | — | | | | — | | | | — | | | | — | | | | — | | | | — | | | | — | |
Straight-line rent adjustment | | | — | | | | — | | | | — | | | | — | | | | — | | | | — | | | | — | | | | — | | | | — | | | | — | |
Gain on disposition of rental properties | | | — | | | | — | | | | — | | | | — | | | | — | | | | — | | | | — | | | | — | | | | — | | | | — | |
| | | | | | | | | | | | | | | | | | �� | | | | | | | | | | | | | | | | | | | | | | |
Net earnings (loss) attributable to Forest City Enterprises, Inc. | | $ | 10,808 | | | $ | — | | | $ | — | | | $ | — | | | $ | 10,808 | | | $ | 19,502 | | | $ | — | | | $ | — | | | $ | — | | | $ | 19,502 | |
| | | | | | | | | | | | | | | | | | | | | | | | | | | | | | | | | | | | | | | | |
45
Forest City Enterprises, Inc. and Subsidiaries
Supplemental Financial Information
Summary of Earnings Before Depreciation, Amortization and Deferred Taxes (EBDT) — Three Months Ended April 30, 2012 and 2011(in thousands)(continued)
| | | | | | | | | | | | | | | | | | | | | | | | | | | | | | | | | | | | | | | | |
| | | Land Development Group 2012 | | | Land Development Group 2011 | |
| | | | | | | | | Plus | | | | | | | | | | | | | | | Plus | | | | | | | |
| | | Full | | | Less | | | Unconsolidated | | | Plus | | | Pro-Rata | | | Full | | | Less | | | Unconsolidated | | | Plus | | | Pro-Rata | |
| | | Consolidation | | | Noncontrolling | | | Investments at | | | Discontinued | | | Consolidation | | | Consolidation | | | Noncontrolling | | | Investments at | | | Discontinued | | | Consolidation | |
| | | (GAAP) | | | Interest | | | Pro-Rata | | | Operations | | | (Non-GAAP) | | | (GAAP) | | | Interest | | | Pro-Rata | | | Operations | | | (Non-GAAP) | |
Revenues from real estate operations | | $ | 12,156 | | | $ | 902 | | | $ | 1,951 | | | $ | — | | | $ | 13,205 | | | $ | 8,090 | | | $ | 651 | | | $ | 2,427 | | | $ | — | | | $ | 9,866 | |
Exclude straight-line rent adjustment | | | — | | | | — | | | | — | | | | — | | | | — | | | | — | | | | — | | | | — | | | | — | | | | — | |
| | | | | | | | | | | | | | | | | | | | | | | | | | | | | | | | | | | | | | | | |
Adjusted revenues | | | 12,156 | | | | 902 | | | | 1,951 | | | | — | | | | 13,205 | | | | 8,090 | | | | 651 | | | | 2,427 | | | | — | | | | 9,866 | |
Add interest and other income | | | 2,360 | | | | 222 | | | | 1 | | | | — | | | | 2,139 | | | | 2,841 | | | | 229 | | | | (60 | ) | | | — | | | | 2,552 | |
Add equity in earnings (loss) of unconsolidated entities | | | 163 | | | | — | | | | 87 | | | | — | | | | 250 | | | | 344 | | | | — | | | | (671 | ) | | | — | | | | (327 | ) |
Exclude gain on disposition of unconsolidated entities | | | — | | | | — | | | | — | | | | — | | | | — | | | | — | | | | — | | | | — | | | | — | | | | — | |
Exclude depreciation and amortization of unconsolidated entities | | | 23 | | | | — | | | | (23 | ) | | | — | | | | — | | | | 83 | | | | — | | | | (83 | ) | | | — | | | | — | |
Exclude interest expense of unconsolidated entities | | | 64 | | | | — | | | | (64 | ) | | | — | | | | — | | | | 149 | | | | — | | | | (149 | ) | | | — | | | | — | |
| | | | | | | | | | | | | | | | | | | | | | | | | | | | | | | | | | | | | | | | |
Adjusted total income | | | 14,766 | | | | 1,124 | | | | 1,952 | | | | — | | | | 15,594 | | | | 11,507 | | | | 880 | | | | 1,464 | | | | — | | | | 12,091 | |
Operating expenses | | | 11,677 | | | | 781 | | | | 1,952 | | | | — | | | | 12,848 | | | | 9,225 | | | | 604 | | | | 1,464 | | | | — | | | | 10,085 | |
Non-Real Estate depreciation and amortization and amortization of mortgage procurement costs | | | 14 | | | | — | | | | — | | | | — | | | | 14 | | | | 31 | | | | — | | | | — | | | | — | | | | 31 | |
Exclude straight-line rent adjustment | | | — | | | | — | | | | — | | | | — | | | | — | | | | — | | | | — | | | | — | | | | — | | | | — | |
Exclude preference payment | | | — | | | | — | | | | — | | | | — | | | | — | | | | — | | | | — | | | | — | | | | — | | | | — | |
| | | | | | | | | | | | | | | | | | | | | | | | | | | | | | | | | | | | | | | | |
Adjusted operating expenses | | | 11,691 | | | | 781 | | | | 1,952 | | | | — | | | | 12,862 | | | | 9,256 | | | | 604 | | | | 1,464 | | | | — | | | | 10,116 | |
Net operating income | | | 3,075 | | | | 343 | | | | — | | | | — | | | | 2,732 | | | | 2,251 | | | | 276 | | | | — | | | | — | | | | 1,975 | |
Interest expense | | | (1,751 | ) | | | (173 | ) | | | (64 | ) | | | — | | | | (1,642 | ) | | | (824 | ) | | | (104 | ) | | | (149 | ) | | | — | | | | (869 | ) |
Interest expense of unconsolidated entities | | | (64 | ) | | | — | | | | 64 | | | | — | | | | — | | | | (149 | ) | | | — | | | | 149 | | | | — | | | | — | |
Loss on early extinguishment of debt | | | — | | | | — | | | | — | | | | — | | | | — | | | | — | | | | — | | | | — | | | | — | | | | — | |
Noncontrolling interest in earnings before depreciation and amortization | | | (170 | ) | | | (170 | ) | | | — | | | | — | | | | — | | | | (172 | ) | | | (172 | ) | | | — | | | | — | | | | — | |
Allowance for projects under development revision | | | — | | | | — | | | | — | | | | — | | | | — | | | | — | | | | — | | | | — | | | | — | | | | — | |
Pre-tax EBDT from discontinued operations | | | — | | | | — | | | | — | | | | — | | | | — | | | | — | | | | — | | | | — | | | | — | | | | — | |
| | | | | | | | | | | | | | | | | | | | | | | | | | | | | | | | | | | | | | | | |
Pre-Tax EBDT | | | 1,090 | | | | — | | | | — | | | | — | | | | 1,090 | | | | 1,106 | | | | — | | | | — | | | | — | | | | 1,106 | |
Income tax expense (benefit) | | | — | | | | — | | | | — | | | | — | | | | — | | | | — | | | | — | | | | — | | | | — | | | | — | |
| | | | | | | | | | | | | | | | | | | | | | | | | | | | | | | | | | | | | | | | |
Earnings before depreciation, amortization and deferred taxes (EBDT) | | $ | 1,090 | | | $ | — | | | $ | — | | | $ | — | | | $ | 1,090 | | | $ | 1,106 | | | $ | — | | | $ | — | | | $ | — | | | $ | 1,106 | |
| | | | | | | | | | | | | | | | | | | | | | | | | | | | | | | | | | | | | | | | |
Reconciliation to net earnings (loss): | | | | | | | | | | | | | | | | | | | | | | | | | | | | | | | | | | | | | | | | |
Earnings before depreciation, amortization and deferred taxes (EBDT) | | $ | 1,090 | | | $ | — | | | $ | — | | | $ | — | | | $ | 1,090 | | | $ | 1,106 | | | $ | — | | | $ | — | | | $ | — | | | $ | 1,106 | |
Depreciation and amortization - Real Estate Groups | | | (108 | ) | | | — | | | | — | | | | — | | | | (108 | ) | | | (86 | ) | | | — | | | | — | | | | — | | | | (86 | ) |
Amortization of mortgage procurement costs - Real Estate Groups | | | (26 | ) | | | — | | | | — | | | | — | | | | (26 | ) | | | (61 | ) | | | — | | | | — | | | | — | | | | (61 | ) |
Straight-line rent adjustment | | | — | | | | — | | | | — | | | | — | | | | — | | | | — | | | | — | | | | — | | | | — | | | | — | |
Preference payment | | | — | | | | — | | | | — | | | | — | | | | — | | | | — | | | | — | | | | — | | | | — | | | | — | |
Gain on disposition of rental properties and partial interests in rental properties, net of noncontrolling interest | | | — | | | | — | | | | — | | | | — | | | | — | | | | — | | | | — | | | | — | | | | — | | | | — | |
Gain on disposition of unconsolidated entities | | | — | | | | — | | | | — | | | | — | | | | — | | | | — | | | | — | | | | — | | | | — | | | | — | |
Impairment of consolidated real estate | | | — | | | | — | | | | — | | | | — | | | | — | | | | (1,400 | ) | | | — | | | | — | | | | — | | | | (1,400 | ) |
Allowance for projects under development revision | | | — | | | | — | | | | — | | | | — | | | | — | | | | — | | | | — | | | | — | | | | — | | | | — | |
Discontinued operations: | | | | | | | | | | | | | | | | | | | | | | | | | | | | | | | | | | | | | | | | |
Depreciation and amortization - Real Estate Groups | | | — | | | | — | | | | — | | | | — | | | | — | | | | — | | | | — | | | | — | | | | — | | | | — | |
Amortization of mortgage procurement costs - Real Estate Groups | | | — | | | | — | | | | — | | | | — | | | | — | | | | — | | | | — | | | | — | | | | — | | | | — | |
Straight-line rent adjustment | | | — | | | | — | | | | — | | | | — | | | | — | | | | — | | | | — | | | | — | | | | — | | | | — | |
Gain on disposition of rental properties | | | — | | | | — | | | | — | | | | — | | | | — | | | | — | | | | — | | | | — | | | | — | | | | — | |
| | | | | | | | | | | | | | | | | | | | | | | | | | | | | | | | | | | | | | | | |
Net earnings (loss) attributable to Forest City Enterprises, Inc. | | $ | 956 | | | $ | — | | | $ | — | | | $ | — | | | $ | 956 | | | $ | (441 | ) | | $ | — | | | $ | — | | | $ | — | | | $ | (441 | ) |
| | | | | | | | | | | | | | | | | | | | | | | | | | | | | | | | | | | | | | | | |
46
Forest City Enterprises, Inc. and Subsidiaries
Supplemental Financial Information
Summary of Earnings Before Depreciation, Amortization and Deferred Taxes (EBDT) — Three Months Ended April 30, 2012 and 2011(in thousands) (continued)
| | | | | | | | | | | | | | | | | | | | | | | | | | | | | | | | | | | | | | | | |
| | | The Nets 2012 | | | The Nets 2011 | |
| | | | | | | | | Plus | | | | | | | | | | | | | | | Plus | | | | | | | |
| | | Full | | | Less | | | Unconsolidated | | | Plus | | | Pro-Rata | | | Full | | | Less | | | Unconsolidated | | | Plus | | | Pro-Rata | |
| | | Consolidation | | | Noncontrolling | | | Investments at | | | Discontinued | | | Consolidation | | | Consolidation | | | Noncontrolling | | | Investments at | | | Discontinued | | | Consolidation | |
| | | (GAAP) | | | Interest | | | Pro-Rata | | | Operations | | | (Non-GAAP) | | | (GAAP) | | | Interest | | | Pro-Rata | | | Operations | | | (Non-GAAP) | |
Revenues from real estate operations | | $ | — | | | $ | — | | | $ | — | | | $ | — | | | $ | — | | | $ | — | | | $ | — | | | $ | — | | | $ | — | | | $ | — | |
Exclude straight-line rent adjustment | | | — | | | | — | | | | — | | | | — | | | | — | | | | — | | | | — | | | | — | | | | — | | | | — | |
| | | | | | | | | | | | | | | | | | | | | | | | | | | | | | | | | | | | | | | | |
Adjusted revenues | | | — | | | | — | | | | — | | | | — | | | | — | | | | — | | | | — | | | | — | | | | — | | | | — | |
Add interest and other income | | | — | | | | — | | | | — | | | | — | | | | — | | | | — | | | | — | | | | — | | | | — | | | | — | |
Add equity in earnings (loss) of unconsolidated entities | | | (6,958 | ) | | | — | | | | — | | | | — | | | | (6,958 | ) | | | (304 | ) | | | — | | | | — | | | | — | | | | (304 | ) |
Exclude gain on disposition of unconsolidated entities | | | — | | | | — | | | | — | | | | — | | | | — | | | | — | | | | — | | | | — | | | | — | | | | — | |
Exclude depreciation and amortization of unconsolidated entities | | | — | | | | — | | | | — | | | | — | | | | — | | | | — | | | | — | | | | — | | | | — | | | | — | |
Exclude interest expense of unconsolidated entities | | | — | | | | — | | | | — | | | | — | | | | — | | | | — | | | | — | | | | — | | | | — | | | | — | |
| | | | | | | | | | | | | | | | | | | | | | | | | | | | | | | | | | | | | | | | |
Adjusted total income | | | (6,958 | ) | | | — | | | | — | | | | — | | | | (6,958 | ) | | | (304 | ) | | | — | | | | — | | | | — | | | | (304 | ) |
Operating expenses | | | — | | | | — | | | | — | | | | — | | | | — | | | | — | | | | — | | | | — | | | | — | | | | — | |
Non-Real Estate depreciation and amortization and amortization of mortgage procurement costs | | | — | | | | — | | | | — | | | | — | | | | — | | | | — | | | | — | | | | — | | | | — | | | | — | |
Exclude straight-line rent adjustment | | | — | | | | — | | | | — | | | | — | | | | — | | | | — | | | | — | | | | — | | | | — | | | | — | |
Exclude preference payment | | | — | | | | — | | | | — | | | | — | | | | — | | | | — | | | | — | | | | — | | | | — | | | | — | |
| | | | | | | | | | | | | | | | | | | | | | | | | | | | | | | | | | | | | | | | |
Adjusted operating expenses | | | — | | | | — | | | | — | | | | — | | | | — | | | | — | | | | — | | | | — | | | | — | | | | — | |
Net operating income | | | (6,958 | ) | | | — | | | | — | | | | — | | | | (6,958 | ) | | | (304 | ) | | | — | | | | — | | | | — | | | | (304 | ) |
Interest expense | | | — | | | | — | | | | — | | | | — | | | | — | | | | — | | | | — | | | | — | | | | — | | | | — | |
Interest expense of unconsolidated entities | | | — | | | | — | | | | — | | | | — | | | | — | | | | — | | | | — | | | | — | | | | — | | | | — | |
Loss on early extinguishment of debt | | | — | | | | — | | | | — | | | | — | | | | — | | | | — | | | | — | | | | — | | | | — | | | | — | |
Noncontrolling interest in earnings before depreciation and amortization | | | — | | | | — | | | | — | | | | — | | | | — | | | | — | | | | — | | | | — | | | | — | | | | — | |
Allowance for projects under development revision | | | — | | | | — | | | | — | | | | — | | | | — | | | | — | | | | — | | | | — | | | | — | | | | — | |
Pre-tax EBDT from discontinued operations | | | — | | | | — | | | | — | | | | — | | | | — | | | | — | | | | — | | | | — | | | | — | | | | — | |
| | | | | | | | | | | | | | | | | | | | | | | | | | | | | | | | | | | | | | | | |
Pre-Tax EBDT | | | (6,958 | ) | | | — | | | | — | | | | — | | | | (6,958 | ) | | | (304 | ) | | | — | | | | — | | | | — | | | | (304 | ) |
Income tax expense (benefit) | | | — | | | | — | | | | — | | | | — | | | | — | | | | — | | | | — | | | | — | | | | — | | | | — | |
| | | | | | | | | | | | | | | | | | | | | | | | | | | | | | | | | | | | | | | | |
Earnings before depreciation, amortization and deferred taxes (EBDT) | | $ | (6,958 | ) | | $ | — | | | $ | — | | | $ | — | | | $ | (6,958 | ) | | $ | (304 | ) | | $ | — | | | $ | — | | | $ | — | | | $ | (304 | ) |
| | | | | | | | | | | | | | | | | | | | | | | | | | | | | | | | | | | | | | | | |
Reconciliation to net earnings (loss): | | | | | | | | | | | | | | | | | | | | | | | | | | | | | | | | | | | | | | | | |
Earnings before depreciation, amortization and deferred taxes (EBDT) | | $ | (6,958 | ) | | $ | — | | | $ | — | | | $ | — | | | $ | (6,958 | ) | | $ | (304 | ) | | $ | — | | | $ | — | | | $ | — | | | $ | (304 | ) |
Depreciation and amortization - Real Estate Groups | | | — | | | | — | | | | — | | | | — | | | | — | | | | — | | | | — | | | | — | | | | — | | | | — | |
Amortization of mortgage procurement costs - Real Estate Groups | | | — | | | | — | | | | — | | | | — | | | | — | | | | — | | | | — | | | | — | | | | — | | | | — | |
Straight-line rent adjustment | | | — | | | | — | | | | — | | | | — | | | | — | | | | — | | | | — | | | | — | | | | — | | | | — | |
Preference payment | | | — | | | | — | | | | — | | | | — | | | | — | | | | — | | | | — | | | | — | | | | — | | | | — | |
Gain on disposition of rental properties and partial interests in rental properties, net of noncontrolling interest | | | — | | | | — | | | | — | | | | — | | | | — | | | | — | | | | — | | | | — | | | | — | | | | — | |
Gain on disposition of unconsolidated entities | | | — | | | | — | | | | — | | | | — | | | | — | | | | — | | | | — | | | | — | | | | — | | | | — | |
Impairment of consolidated real estate | | | — | | | | — | | | | — | | | | — | | | | — | | | | — | | | | — | | | | — | | | | — | | | | — | |
Allowance for projects under development revision | | | — | | | | — | | | | — | | | | — | | | | — | | | | — | | | | — | | | | — | | | | — | | | | — | |
Discontinued operations: | | | | | | | | | | | | | | | | | | | | | | | | | | | | | | | | | | | | | | | | |
Depreciation and amortization - Real Estate Groups | | | — | | | | — | | | | — | | | | — | | | | — | | | | — | | | | — | | | | — | | | | — | | | | — | |
Amortization of mortgage procurement costs - Real Estate Groups | | | — | | | | — | | | | — | | | | — | | | | — | | | | — | | | | — | | | | — | | | | — | | | | — | |
Straight-line rent adjustment | | | — | | | | — | | | | — | | | | — | | | | — | | | | — | | | | — | | | | — | | | | — | | | | — | |
Gain on disposition of rental properties | | | — | | | | — | | | | — | | | | — | | | | — | | | | — | | | | — | | | | — | | | | — | | | | — | |
| | | | | | | | | | | | | | | | | | | | | | | | | | | | | | | | | | | | | | | | |
Net earnings (loss) attributable to Forest City Enterprises, Inc. | | $ | (6,958 | ) | | $ | — | | | $ | — | | | $ | — | | | $ | (6,958 | ) | | $ | (304 | ) | | $ | — | | | $ | — | | | $ | — | | | $ | (304 | ) |
| | | | | | | | | | | | | | | | | | | | | | | | | | | | | | | | | | | | | | | | |
47
Forest City Enterprises, Inc. and Subsidiaries
Supplemental Financial Information
Summary of Earnings Before Depreciation, Amortization and Deferred Taxes (EBDT) — Three Months Ended April 30, 2012 and 2011(in thousands)(continued)
| | | | | | | | | | | | | | | | | | | | | | | | | | | | | | | | | | | | | | | | |
| | | Corporate Activities 2012 | | | Corporate Activities 2011 | |
| | | | | | | | | Plus | | | | | | | | | | | | | | | Plus | | | | | | | |
| | | Full | | | Less | | | Unconsolidated | | | Plus | | | Pro-Rata | | | Full | | | Less | | | Unconsolidated | | | Plus | | | Pro-Rata | |
| | | Consolidation | | | Noncontrolling | | | Investments at | | | Discontinued | | | Consolidation | | | Consolidation | | | Noncontrolling | | | Investments at | | | Discontinued | | | Consolidation | |
| | | (GAAP) | | | Interest | | | Pro-Rata | | | Operations | | | (Non-GAAP) | | | (GAAP) | | | Interest | | | Pro-Rata | | | Operations | | | (Non-GAAP) | |
Revenues from real estate operations | | $ | — | | | $ | — | | | $ | — | | | $ | — | | | $ | — | | | $ | — | | | $ | — | | | $ | — | | | $ | — | | | $ | — | |
Exclude straight-line rent adjustment | | | — | | | | — | | | | — | | | | — | | | | — | | | | — | | | | — | | | | — | | | | — | | | | — | |
| | | | | | | | | | | | | | | | | | | | | | | | | | | | | | | | | | | | | | | | |
Adjusted revenues | | | — | | | | — | | | | — | | | | — | | | | — | | | | — | | | | — | | | | — | | | | — | | | | — | |
Add interest and other income | | | 45 | | | | — | | | | — | | | | — | | | | 45 | | | | 49 | | | | — | | | | — | | | | — | | | | 49 | |
Add equity in earnings (loss) of unconsolidated entities | | | — | | | | — | | | | — | | | | — | | | | — | | | | — | | | | — | | | | — | | | | — | | | | — | |
Exclude gain on disposition of unconsolidated entities | | | — | | | | — | | | | — | | | | — | | | | — | | | | — | | | | — | | | | — | | | | — | | | | — | |
Exclude depreciation and amortization of unconsolidated entities | | | — | | | | — | | | | — | | | | — | | | | — | | | | — | | | | — | | | | — | | | | — | | | | — | |
Exclude interest expense of unconsolidated entities | | | — | | | | — | | | | — | | | | — | | | | — | | | | — | | | | — | | | | — | | | | — | | | | — | |
| | | | | | | | | | | | | | | | | | | | | | | | | | | | | | | | | | | | | | | | |
Adjusted total income | | | 45 | | | | — | | | | — | | | | — | | | | 45 | | | | 49 | | | | — | | | | — | | | | — | | | | 49 | |
Operating expenses | | | 12,731 | | | | — | | | | — | | | | — | | | | 12,731 | | | | 14,627 | | | | — | | | | — | | | | — | | | | 14,627 | |
Non-Real Estate depreciation and amortization and amortization of mortgage procurement costs | | | 329 | | | | — | | | | — | | | | — | | | | 329 | | | | 353 | | | | — | | | | — | | | | — | | | | 353 | |
Exclude straight-line rent adjustment | | | — | | | | — | | | | — | | | | — | | | | — | | | | — | | | | — | | | | — | | | | — | | | | — | |
Exclude preference payment | | | — | | | | — | | | | — | | | | — | | | | — | | | | — | | | | — | | | | — | | | | — | | | | — | |
| | | | | | | | | | | | | | | | | | | | | | | | | | | | | | | | | | | | | | | | |
Adjusted operating expenses | | | 13,060 | | | | — | | | | — | | | | — | | | | 13,060 | | | | 14,980 | | | | — | | | | — | | | | — | | | | 14,980 | |
Net operating income | | | (13,015 | ) | | | — | | | | — | | | | — | | | | (13,015 | ) | | | (14,931 | ) | | | — | | | | — | | | | — | | | | (14,931 | ) |
Interest expense | | | (13,595 | ) | | | — | | | | — | | | | — | | | | (13,595 | ) | | | (13,919 | ) | | | — | | | | — | | | | — | | | | (13,919 | ) |
Interest expense of unconsolidated entities | | | — | | | | — | | | | — | | | | — | | | | — | | | | — | | | | — | | | | — | | | | — | | | | — | |
Loss on early extinguishment of debt | | | — | | | | — | | | | — | | | | — | | | | — | | | | — | | | | — | | | | — | | | | — | | | | — | |
Noncontrolling interest in earnings before depreciation and amortization | | | — | | | | — | | | | — | | | | — | | | | — | | | | — | | | | — | | | | — | | | | — | | | | — | |
Allowance for projects under development revision | | | — | | | | — | | | | — | | | | — | | | | — | | | | — | | | | — | | | | — | | | | — | | | | — | |
Pre-tax EBDT from discontinued operations | | | — | | | | — | | | | — | | | | — | | | | — | | | | — | | | | — | | | | — | | | | — | | | | — | |
| | | | | | | | | | | | | | | | | | | | | | | | | | | | | | | | | | | | | | | | |
Pre-Tax EBDT | | | (26,610 | ) | | | — | | | | — | | | | — | | | | (26,610 | ) | | | (28,850 | ) | | | — | | | | — | | | | — | | | | (28,850 | ) |
Income tax expense (benefit) | | | (3,905 | ) | | | — | | | | — | | | | — | | | | (3,905 | ) | | | (13,294 | ) | | | — | | | | — | | | | — | | | | (13,294 | ) |
| | | | | | | | | | | | | | | | | | | | | | | | | | | | | | | | | | | | | | | | |
Earnings before depreciation, amortization and deferred taxes (EBDT) | | $ | (22,705 | ) | | $ | — | | | $ | — | | | $ | — | | | $ | (22,705 | ) | | $ | (15,556 | ) | | $ | — | | | $ | — | | | $ | — | | | $ | (15,556 | ) |
| | | | | | | | | | | | | | | | | | | | | | | | | | | | | | | | | | | | | | | | |
Reconciliation to net earnings (loss): | | | | | | | | | | | | | | | | | | | | | | | | | | | | | | | | | | | | | | | | |
Earnings before depreciation, amortization and deferred taxes (EBDT) | | $ | (22,705 | ) | | $ | — | | | $ | — | | | $ | — | | | $ | (22,705 | ) | | $ | (15,556 | ) | | $ | — | | | $ | — | | | $ | — | | | $ | (15,556 | ) |
Depreciation and amortization - Real Estate Groups | | | — | | | | — | | | | — | | | | — | | | | — | | | | — | | | | — | | | | — | | | | — | | | | — | |
Amortization of mortgage procurement costs - Real Estate Groups | | | — | | | | — | | | | — | | | | — | | | | — | | | | — | | | | — | | | | — | | | | — | | | | — | |
Straight-line rent adjustment | | | — | | | | — | | | | — | | | | — | | | | — | | | | — | | | | — | | | | — | | | | — | | | | — | |
Preference payment | | | — | | | | — | | | | — | | | | — | | | | — | | | | — | | | | — | | | | — | | | | — | | | | — | |
Gain on disposition of rental properties and partial interests in rental properties, net of noncontrolling interest | | | — | | | | — | | | | — | | | | — | | | | — | | | | — | | | | — | | | | — | | | | — | | | | — | |
Gain on disposition of unconsolidated entities | | | — | | | | — | | | | — | | | | — | | | | — | | | | — | | | | — | | | | — | | | | — | | | | — | |
Impairment of consolidated real estate | | | — | | | | — | | | | — | | | | — | | | | — | | | | — | | | | — | | | | — | | | | — | | | | — | |
Allowance for projects under development revision | | | — | | | | — | | | | — | | | | — | | | | — | | | | — | | | | — | | | | — | | | | — | | | | — | |
Discontinued operations: | | | | | | | | | | | | | | | | | | | | | | | | | | | | | | | | | | | | | | | | |
Depreciation and amortization - Real Estate Groups | | | — | | | | — | | | | — | | | | — | | | | — | | | | — | | | | — | | | | — | | | | — | | | | — | |
Amortization of mortgage procurement costs - Real Estate Groups | | | — | | | | — | | | | — | | | | — | | | | — | | | | — | | | | — | | | | — | | | | — | | | | — | |
Straight-line rent adjustment | | | — | | | | — | | | | — | | | | — | | | | — | | | | — | | | | — | | | | — | | | | — | | | | — | |
Gain on disposition of rental properties | | | — | | | | — | | | | — | | | | — | | | | — | | | | — | | | | — | | | | — | | | | — | | | | — | |
Tax expense: | | | | | | | | | | | | | | | | | | | | | | | | | | | | | | | | | | | | | | | | |
Deferred taxes | | | (11,463 | ) | | | — | | | | — | | | | — | | | | (11,463 | ) | | | (4,037 | ) | | | — | | | | — | | | | — | | | | (4,037 | ) |
Gain on disposition of rental properties and partial interest in rental properties | | | (5,545 | ) | | | — | | | | — | | | | — | | | | (5,545 | ) | | | (31,505 | ) | | | — | | | | — | | | | — | | | | (31,505 | ) |
| | | | | | | | | | | | | | | | | | | | | | | | | | | | | | | | | | | | | | | | |
Net earnings (loss) attributable to Forest City Enterprises, Inc. | | $ | (39,713 | ) | | $ | — | | | $ | — | | | $ | — | | | $ | (39,713 | ) | | $ | (51,098 | ) | | $ | — | | | $ | — | | | $ | — | | | $ | (51,098 | ) |
| | | | | | | | | | | | | | | | | | | | | | | | | | | | | | | | | | | | | | | | |
Preferred dividends | | | (3,850 | ) | | | — | | | | — | | | | — | | | | (3,850 | ) | | | (3,850 | ) | | | — | | | | — | | | | — | | | | (3,850 | ) |
| | | | | | | | | | | | | | | | | | | | | | | | | | | | | | | | | | | | | | | | |
Net earnings (loss) attributable to Forest City Enterprises, Inc. common shareholders | | $ | (43,563 | ) | | $ | — | | | $ | — | | | $ | — | | | $ | (43,563 | ) | | $ | (54,948 | ) | | $ | — | | | $ | — | | | $ | — | | | $ | (54,948 | ) |
| | | | | | | | | | | | | | | | | | | | | | | | | | | | | | | | | | | | | | | | |
48
Forest City Enterprises, Inc. and Subsidiaries
Supplemental Financial Information
Summary of Earnings Before Depreciation, Amortization and Deferred Taxes (EBDT) — Three Months Ended April 30, 2012 and 2011(in thousands)(continued)
| | | | | | | | | | | | | | | | | | | | | | | | | | | | | | | | | | | | | | | | |
| | | Total 2012 | | | Total 2011 | |
| | | | | | | | | Plus | | | | | | | | | | | | | | | Plus | | | | | | | |
| | | Full | | | Less | | | Unconsolidated | | | Plus | | | Pro-Rata | | | Full | | | Less | | | Unconsolidated | | | Plus | | | Pro-Rata | |
| | | Consolidation | | | Noncontrolling | | | Investments at | | | Discontinued | | | Consolidation | | | Consolidation | | | Noncontrolling | | | Investments at | | | Discontinued | | | Consolidation | |
| | | (GAAP) | | | Interest | | | Pro-Rata | | | Operations | | | (Non-GAAP) | | | (GAAP) | | | Interest | | | Pro-Rata | | | Operations | | | (Non-GAAP) | |
Revenues from real estate operations | | $ | 296,652 | | | $ | 12,561 | | | $ | 101,564 | | | $ | 292 | | | $ | 385,947 | | | $ | 304,180 | | | $ | 12,498 | | | $ | 82,714 | | | $ | 9,252 | | | $ | 383,648 | |
Exclude straight-line rent adjustment | | | (5,624 | ) | | | — | | | | — | | | | (3 | ) | | | (5,627 | ) | | | (3,099 | ) | | | — | | | | — | | | | (336 | ) | | | (3,435 | ) |
| | | | | | | | | | | | | | | | | | | | | | | | | | | | | | | | | | | | | | | | |
Adjusted revenues | | | 291,028 | | | | 12,561 | | | | 101,564 | | | | 289 | | | | 380,320 | | | | 301,081 | | | | 12,498 | | | | 82,714 | | | | 8,916 | | | | 380,213 | |
Add interest and other income | | | 10,679 | | | | 466 | | | | 210 | | | | — | | | | 10,423 | | | | 15,507 | | | | (140 | ) | | | 117 | | | | — | | | | 15,764 | |
Add equity in earnings (loss) of unconsolidated entities | | | 3,773 | | | | 30 | | | | (10,260 | ) | | | — | | | | (6,517 | ) | | | 19,994 | | | | 48 | | | | (20,299 | ) | | | — | | | | (353 | ) |
Exclude gain on disposition of unconsolidated entities | | | — | | | | — | | | | — | | | | — | | | | — | | | | (12,567 | ) | | | — | | | | 12,567 | | | | — | | | | — | |
Exclude depreciation and amortization of unconsolidated entities | | | 19,998 | | | | — | | | | (19,998 | ) | | | — | | | | — | | | | 14,308 | | | | — | | | | (14,308 | ) | | | — | | | | — | |
Exclude interest expense of unconsolidated entities | | | 26,332 | | | | — | | | | (26,332 | ) | | | — | | | | — | | | | 23,107 | | | | — | | | | (23,107 | ) | | | — | | | | — | |
| | | | | | | | | | | | | | | | | | | | | | | | | | | | | | | | | | | | | | | | |
Adjusted total income | | | 351,810 | | | | 13,057 | | | | 45,184 | | | | 289 | | | | 384,226 | | | | 361,430 | | | | 12,406 | | | | 37,684 | | | | 8,916 | | | | 395,624 | |
Operating expenses | | | 166,851 | | | | 9,057 | | | | 45,184 | | | | 141 | | | | 203,119 | | | | 160,689 | | | | 7,400 | | | | 37,684 | | | | 6,679 | | | | 197,652 | |
Non-Real Estate depreciation and amortization and amortization of mortgage procurement costs | | | 620 | | | | — | | | | — | | | | — | | | | 620 | | | | 702 | | | | — | | | | — | | | | — | | | | 702 | |
Exclude straight-line rent adjustment | | | (792 | ) | | | — | | | | — | | | | — | | | | (792 | ) | | | (1,211 | ) | | | — | | | | — | | | | — | | | | (1,211 | ) |
Exclude preference payment | | | — | | | | — | | | | — | | | | — | | | | — | | | | (585 | ) | | | — | | | | — | | | | — | | | | (585 | ) |
| | | | | | | | | | | | | | | | | | | | | | | | | | | | | | | | | | | | | | | | |
Adjusted operating expenses | | | 166,679 | | | | 9,057 | | | | 45,184 | | | | 141 | | | | 202,947 | | | | 159,595 | | | | 7,400 | | | | 37,684 | | | | 6,679 | | | | 196,558 | |
Net operating income | | | 185,131 | | | | 4,000 | | | | — | | | | 148 | | | | 181,279 | | | | 201,835 | | | | 5,006 | | | | — | | | | 2,237 | | | | 199,066 | |
Interest expense | | | (58,516 | ) | | | (2,724 | ) | | | (26,332 | ) | | | (97 | ) | | | (82,221 | ) | | | (66,181 | ) | | | (3,832 | ) | | | (23,107 | ) | | | (1,236 | ) | | | (86,692 | ) |
Interest expense of unconsolidated entities | | | (26,332 | ) | | | — | | | | 26,332 | | | | — | | | | — | | | | (23,107 | ) | | | — | | | | 23,107 | | | | — | | | | — | |
Loss on early extinguishment of debt | | | (719 | ) | | | (188 | ) | | | — | | | | — | | | | (531 | ) | | | (296 | ) | | | (4 | ) | | | — | | | | — | | | | (292 | ) |
Noncontrolling interest in earnings before depreciation and amortization | | | (1,088 | ) | | | (1,088 | ) | | | — | | | | — | | | | — | | | | (1,170 | ) | | | (1,170 | ) | | | — | | | | — | | | | — | |
Allowance for projects under development revision | | | — | | | | — | | | | — | | | | — | | | | — | | | | 2,000 | | | | — | | | | — | | | | — | | | | 2,000 | |
Pre-tax EBDT from discontinued operations | | | 51 | | | | — | | | | — | | | | (51 | ) | | | — | | | | 1,001 | | | | — | | | | — | | | | (1,001 | ) | | | — | |
| | | | | | | | | | | | | | | | | | | | | | | | | | | | | | | | | | | | | | | | |
Pre-Tax EBDT | | | 98,527 | | | | — | | | | — | | | | — | | | | 98,527 | | | | 114,082 | | | | — | | | | — | | | | — | | | | 114,082 | |
Income tax expense (benefit) | | | (3,905 | ) | | | — | | | | — | | | | — | | | | (3,905 | ) | | | (13,294 | ) | | | — | | | | — | | | | — | | | | (13,294 | ) |
| | | | | | | | | | | | | | | | | | | | | | | | | | | | | | | | | | | | | | | | |
Earnings before depreciation, amortization and deferred taxes (EBDT) | | $ | 102,432 | | | $ | — | | | $ | — | | | $ | — | | | $ | 102,432 | | | $ | 127,376 | | | $ | — | | | $ | — | | | $ | — | | | $ | 127,376 | |
| | | | | | | | | | | | | | | | | | | | | | | | | | | | | | | | | | | | | | | | |
Reconciliation to net earnings (loss): | | | | | | | | | | | | | | | | | | | | | | | | | | | | | | | | | | | | | | | | |
Earnings before depreciation, amortization and deferred taxes (EBDT) | | $ | 102,432 | | | $ | — | | | $ | — | | | $ | — | | | $ | 102,432 | | | $ | 127,376 | | | $ | — | | | $ | — | | | $ | — | | | $ | 127,376 | |
Depreciation and amortization - Real Estate Groups | | | (70,417 | ) | | | — | | | | — | | | | — | | | | (70,417 | ) | | | (67,203 | ) | | | — | | | | — | | | | (1,626 | ) | | | (68,829 | ) |
Amortization of mortgage procurement costs - Real Estate Groups | | | (3,623 | ) | | | — | | | | — | | | | — | | | | (3,623 | ) | | | (3,370 | ) | | | — | | | | — | | | | (262 | ) | | | (3,632 | ) |
Straight-line rent adjustment | | | 4,832 | | | | — | | | | — | | | | 3 | | | | 4,835 | | | | 1,888 | | | | — | | | | — | | | | 336 | | | | 2,224 | |
Preference payment | | | — | | | | — | | | | — | | | | — | | | | — | | | | (585 | ) | | | — | | | | — | | | | — | | | | (585 | ) |
Gain on disposition of rental properties and partial interests in rental properties, net of noncontrolling interest | | | — | | | | — | | | | — | | | | 7,914 | | | | 7,914 | | | | 9,561 | | | | — | | | | 12,567 | | | | 10,038 | | | | 32,166 | |
Gain on disposition of unconsolidated entities | | | — | | | | — | | | | — | | | | — | | | | — | | | | 12,567 | | | | — | | | | (12,567 | ) | | | — | | | | — | |
Impairment of consolidated real estate | | | (1,381 | ) | | | — | | | | — | | | | — | | | | (1,381 | ) | | | (4,835 | ) | | | — | | | | — | | | | — | | | | (4,835 | ) |
Allowance for projects under development revision | | | — | | | | — | | | | — | | | | — | | | | — | | | | (2,000 | ) | | | — | | | | — | | | | — | | | | (2,000 | ) |
Discontinued operations: | | | | | | | | | | | | | | | | | | | | | | | | | | | | | | | | | | | | | | | | |
Depreciation and amortization - Real Estate Groups | | | — | | | | — | | | | — | | | | — | | | | — | | | | (1,626 | ) | | | — | | | | — | | | | 1,626 | | | | — | |
Amortization of mortgage procurement costs - Real Estate Groups | | | — | | | | — | | | | — | | | | — | | | | — | | | | (262 | ) | | | — | | | | — | | | | 262 | | | | — | |
Straight-line rent adjustment | | | 3 | | | | — | | | | — | | | | (3 | ) | | | — | | | | 336 | | | | — | | | | — | | | | (336 | ) | | | — | |
Gain on disposition of rental properties | | | 7,914 | | | | — | | | | — | | | | (7,914 | ) | | | — | | | | 10,038 | | | | — | | | | — | | | | (10,038 | ) | | | — | |
Tax expense: | | | | | | | | | | | | | | | | | | | | | | | | | | | | | | | | | | | | | | | | |
Deferred taxes | | | (11,463 | ) | | | — | | | | — | | | | — | | | | (11,463 | ) | | | (4,037 | ) | | | — | | | | — | | | | — | | | | (4,037 | ) |
Gain on disposition of rental properties and partial interest in rental properties | | | (5,545 | ) | | | — | | | | — | | | | — | | | | (5,545 | ) | | | (31,505 | ) | | | — | | | | — | | | | — | | | | (31,505 | ) |
| | | | | | | | | | | | | | | | | | | | | | | | | | | | | | | | | | | | | | | | |
Net earnings (loss) attributable to Forest City Enterprises, Inc. | | $ | 22,752 | | | $ | — | | | $ | — | | | $ | — | | | $ | 22,752 | | | $ | 46,343 | | | $ | — | | | $ | — | | | $ | — | | | $ | 46,343 | |
| | | | | | | | | | | | | | | | | | | | | | | | | | | | | | | | | | | | | | | | |
Preferred dividends | | | (3,850 | ) | | | — | | | | — | | | | — | | | | (3,850 | ) | | | (3,850 | ) | | | — | | | | — | | | | — | | | | (3,850 | ) |
| | | | | | | | | | | | | | | | | | | | | | | | | | | | | | | | | | | | | | | | |
Net earnings (loss) attributable to Forest City Enterprises, Inc. common shareholders | | $ | 18,902 | | | $ | — | | | $ | — | | | $ | — | | | $ | 18,902 | | | $ | 42,493 | | | $ | — | | | $ | — | | | $ | — | | | $ | 42,493 | |
| | | | | | | | | | | | | | | | | | | | | | | | | | | | | | | | | | | | | | | | |
49