UNITED STATES
SECURITIES AND EXCHANGE COMMISSION
Washington, D.C. 20549
FORM N-CSR
CERTIFIED SHAREHOLDER REPORT OF REGISTERED MANAGEMENT
INVESTMENT COMPANIES
Investment Company Act file number | 811- 1018 |
| |
| Dreyfus Funds, Inc. | |
| (Exact name of Registrant as specified in charter) | |
| | |
| c/o The Dreyfus Corporation 200 Park Avenue New York, New York 10166 | |
| (Address of principal executive offices) (Zip code) | |
| | |
| Michael A. Rosenberg, Esq. 200 Park Avenue New York, New York 10166 | |
| (Name and address of agent for service) | |
|
Registrant's telephone number, including area code: | (212) 922-6000 |
| |
Date of fiscal year end: | 12/31 | |
Date of reporting period: | 6/30/2010 | |
| | | | | | |
FORM N-CSR
Item 1. Reports to Stockholders.
|
| Dreyfus |
| Equity Growth Fund |
SEMIANNUAL REPORT June 30, 2010

Save time. Save paper. View your next shareholder report online as soon as it’s available. Log into www.dreyfus.com and sign up for Dreyfus eCommunications. It’s simple and only takes a few minutes.
The views expressed in this report reflect those of the portfolio manager only through the end of the period covered and do not necessarily represent the views of Dreyfus, Founders or any other person in our organization. Any such views are subject to change at any time based upon market or other conditions and we disclaim any responsibility to update such views. These views may not be relied on as investment advice and, because investment decisions for a Dreyfus fund are based on numerous factors, may not be relied on as an indication of trading intent on behalf of any Dreyfus fund.

| | Contents |
| | THE FUND |
| 2 | A Letter from the Chairman and CEO |
| 3 | Discussion of Fund Performance |
| 6 | Understanding Your Fund’s Expenses |
| 6 | Comparing Your Fund’s Expenses With Those of Other Funds |
| 7 | Statement of Investments |
| 11 | Statement of Assets and Liabilities |
| 12 | Statement of Operations |
| 13 | Statement of Changes in Net Assets |
| 15 | Financial Highlights |
| 20 | Notes to Financial Statements |
| 32 | Information About the Review and Approval of the Fund’s Investment Advisory Agreement |
| | FOR MORE INFORMATION |
| | Back Cover |
Dreyfus
Equity Growth Fund
The Fund

A LETTER FROM THE CHAIRMAN AND CEO
Dear Shareholder:
We are pleased to present this semiannual report for Dreyfus Equity Growth Fund, covering the six-month period from January 1, 2010, through June 30, 2010.
After posting solid gains over the first quarter of 2010, stocks encountered renewed volatility in the second quarter, which caused most equity indices to erase their previous gains and end the reporting period lower than where they began. The second-quarter correction occurred despite positive GDP reports, as manufacturing activity improved and unemployment began to moderate in a recovery that has so far proved sustainable but milder than historical averages. Indeed, many of the headlines that have affected investors emanated from overseas markets, including the sovereign debt crisis in Europe and inflation fears in China.
Despite recent headlines about the current state of the U.S. economy, we still believe that it is unlikely that we’ll encounter a “double-dip” recession. Instead, we expect current financial strains to ease and the domestic economy to expand at a moderate pace over the second half of the year. However, we currently see a number of downside risks across the global markets that could result in volatility over the short term, which is why we still believe that a long-term investment focus with an emphasis on high-quality stocks may be suitable for many investors. As always, your financial advisor can help you assess both the risks and opportunities provided by the global financial markets in this investment climate.
For information about how the fund performed during the reporting period, as well as general market perspectives, we provide a Discussion of Fund Performance on the pages that follow.
Thank you for your continued confidence and support.
Jonathan R. Baum
Chairman and Chief Executive Officer
The Dreyfus Corporation
July 15, 2010
2

DISCUSSION OF FUND PERFORMANCE
For the period of January 1, 2010, through June 30, 2010, as provided by Elizabeth Slover, Portfolio Manager
Fund and Market Performance Overview
For the six-month period ended June 30, 2010, Dreyfus Equity Growth Fund’s Class A shares produced a total return of –6.64%, Class B shares returned –7.30%, Class C shares returned –6.92%, Class F shares returned –6.38% and Class I shares returned –6.51%.1 In comparison, the Russell 1000 Growth Index produced a total return of –7.65% over the same period.2
Stocks encountered heightened volatility late in the reporting period when investors grew concerned regarding a number of threats to global economic growth. The fund produced higher returns than its benchmark, mainly due to successful stock selections in the consumer staples, technology and industrials sectors.
The Fund’s Investment Approach
To pursue the fund’s goal of long-term growth of capital and income, we invest primarily in the common stocks of large, well-established companies with records of profitability, dividend payments and a reputation for high-quality management, products and services.The fund normally invests at least 80% of its net assets in stocks that are included in a widely recognized index of stock market performance, such as the Dow Jones Industrial Average, the Standard & Poor’s 500 Index, or the NASDAQ Composite Index. Using a “bottom-up” approach, we focus on individual stock selection instead of broad economic or industry trends. We look mainly for companies whose fundamental strengths suggest the potential to provide superior earnings growth over time. The fund may also invest in non-dividend-paying companies, and it may invest up to 30% of its total assets in foreign securities.
Global Economic Concerns Derailed Market Rally
The year 2010 began in the midst of an economic recovery as improved manufacturing activity, an apparent bottoming of residential
DISCUSSION OF FUND PERFORMANCE (continued)
housing prices and modest employment gains helped boost confidence among investors. Later in the reporting period, however, several developments threatened the economic rebound. Europe was roiled by a sovereign debt crisis when Greece found itself unable to finance a heavy debt burden, requiring intervention by the International Monetary Fund and European Union. Robust economic growth in China, one of the primary engines of the global economic recovery, seemed to spark inflationary pressures in local real estate markets, and investors worried that remedial measures might dampen Asian growth. In the United States, mixed data regarding unemployment, retail sales and housing markets suggested that economic headwinds might constrain already mild growth.
These factors derailed a market rally that had driven U.S. stock prices higher through April. As investor sentiment deteriorated in May and June, stocks generally gave back all of the reporting period’s previous gains, ending the first six months of 2010 with moderate losses. Growth-oriented stocks generally fell more sharply than their value-oriented counterparts.
Constructive Posture Bolstered Relative Performance
In the early stages of the economic recovery, we found opportunities across a variety of market sectors to invest in growing companies at attractive prices. As a result, during the first half of 2010, a number of strong performers enabled the fund to participate in the early rally, and cushion the effects of the subsequent market correction.
In the consumer staples sector, Coca Cola Enterprises benefited from solid execution of its business plan, and Dr. Pepper Snapple Group gained value after it was added to the Russell 1000 Growth Index. Whole Foods Market climbed after simultaneously cutting costs and growing its business. Estee Lauder revamped its product line and expanded into the emerging markets.
Among technology stocks, server virtualization specialist VMware benefited from the increasing popularity of “cloud computing,” software developer Sybase was acquired by a former rival and Salesforce.com rose amid robust demand for productivity-enhancing corporate services. Audio systems specialist Dolby Laboratories encountered increasing
4
adoption of high-definition entertainment technologies, and electronics innovator Apple gained value due to the successful launch of the iPad mobile device. In the industrials sector, machinery producer Cummins benefited from government stimulus programs in its agriculture- and construction-related businesses.
Disappointments during the reporting period were concentrated in the consumer discretionary sector, where specialty retailer Staples and apparel seller Abercrombie & Fitch missed earning targets.
Positioned for a Mild Recovery
Although we are concerned regarding recent economic and market setbacks, we believe a return to recession is unlikely. Indeed, as of the reporting period’s end, we have continued to find growth opportunities in the information technology sector, where demand for business productivity enhancements has remained strong.We reduced the fund’s overweighted exposure to the health care sector after the passage of health care reform legislation, which we expect to benefit some companies and hurt others.We also established a more mildly overweighted position in the consumer staples sector. In our view, these strategies position the fund for a continued, albeit subpar, economic recovery in the United States and around the world.
July 15, 2010
Please note, the position in any security highlighted with italicized typeface was sold during the reporting period.
Equity funds are subject generally to market, market sector, market liquidity, issuer and investment style risks, among other factors, to varying degrees, all of which are more fully described in the fund’s prospectus.
| |
| 1 | Total return includes reinvestment of dividends and any capital gains paid, and does not take into |
| | consideration the maximum initial sales charge in the case of Class A shares, or the applicable |
| | contingent deferred sales charges imposed on redemptions in the case of Class B and Class C |
| | shares. Had these charges been reflected, returns would have been lower. Past performance is no |
| | guarantee of future results. Share price and investment return fluctuate such that upon redemption, |
| | fund shares may be worth more or less than their original cost. |
| 2 | SOURCE: LIPPER INC. — The Russell 1000 Growth Index is a widely accepted, |
| | unmanaged large-cap index that measures the performance of those Russell 1000 Index |
| | companies with higher price-to-book ratios and higher forecasted growth values.The total return |
| | figure cited for this index assumes change in security prices and reinvestment of dividends, but does |
| | not reflect the costs of managing a mutual fund. Investors cannot invest directly in any index. |
UNDERSTANDING YOUR FUND’S EXPENSES (Unaudited)
As a mutual fund investor, you pay ongoing expenses, such as management fees and other expenses. Using the information below, you can estimate how these expenses affect your investment and compare them with the expenses of other funds.You also may pay one-time transaction expenses, including sales charges (loads) and redemption fees, which are not shown in this section and would have resulted in higher total expenses. For more information, see your fund’s prospectus or talk to your financial adviser.
Review your fund’s expenses
The table below shows the expenses you would have paid on a $1,000 investment in Dreyfus Equity Growth Fund from January 1, 2010 to June 30, 2010. It also shows how much a $1,000 investment would be worth at the close of the period, assuming actual returns and expenses.
Expenses and Value of a $1,000 Investment
assuming actual returns for the six months ended June 30, 2010
| | | | | |
| | Class A | Class B | Class C | Class F | Class I |
| Expenses paid per $1,000† | $ 6.33 | $ 15.24 | $ 10.20 | $ 5.28 | $ 5.28 |
| Ending value (after expenses) | $933.60 | $927.00 | $930.80 | $936.20 | $934.90 |
COMPARING YOUR FUND’S EXPENSES
WITH THOSE OF OTHER FUNDS (Unaudited)
Using the SEC’s method to compare expenses
The Securities and Exchange Commission (SEC) has established guidelines to help investors assess fund expenses. Per these guidelines, the table below shows your fund’s expenses based on a $1,000 investment, assuming a hypothetical 5% annualized return. You can use this information to compare the ongoing expenses (but not transaction expenses or total cost) of investing in the fund with those of other funds.All mutual fund shareholder reports will provide this information to help you make this comparison. Please note that you cannot use this information to estimate your actual ending account balance and expenses paid during the period.
Expenses and Value of a $1,000 Investment
assuming a hypothetical 5% annualized return for the six months ended June 30, 2010
| | | | | |
| | Class A | Class B | Class C | Class F | Class I |
| Expenses paid per $1,000† | $ 6.61 | $ 15.89 | $ 10.64 | $ 5.51 | $ 5.51 |
| Ending value (after expenses) | $1,018.25 | $1,008.98 | $1,014.23 | $1,019.34 | $1,019.34 |
|
| † Expenses are equal to the fund’s annualized expense ratio of 1.32% for Class A, 3.19% for Class B, 2.13% for |
| Class C, 1.10% for Class F and 1.10% for Class I, multiplied by the average account value over the period, |
| multiplied by 181/365 (to reflect the one-half year period). |
6
STATEMENT OF INVESTMENTS
June 30, 2010 (Unaudited)
| | |
| Common Stocks—96.7% | Shares | Value ($) |
| Consumer Discretionary—13.0% | | |
| Abercrombie & Fitch, Cl. A | 44,300 | 1,359,567 |
| Amazon.com | 37,680 a | 4,116,917 |
| Autoliv | 56,810 | 2,718,358 |
| Carnival | 67,964 | 2,055,231 |
| Dick’s Sporting Goods | 67,970 a | 1,691,773 |
| DIRECTV, Cl. A | 85,490 a | 2,899,821 |
| Home Depot | 84,048 | 2,359,227 |
| Macy’s | 77,210 | 1,382,059 |
| NetFlix | 29,110 a,b | 3,162,802 |
| News, Cl. A | 181,160 | 2,166,674 |
| Nordstrom | 59,430 | 1,913,052 |
| Omnicom Group | 67,670 | 2,321,081 |
| Staples | 160,520 | 3,057,906 |
| Target | 100,670 | 4,949,944 |
| Tiffany & Co. | 41,560 | 1,575,540 |
| | | 37,729,952 |
| Consumer Staples—11.3% | | |
| Clorox | 48,320 | 3,003,571 |
| Costco Wholesale | 54,840 | 3,006,877 |
| Dr. Pepper Snapple Group | 67,340 | 2,517,843 |
| Energizer Holdings | 54,970 a | 2,763,892 |
| Estee Lauder, Cl. A | 31,630 | 1,762,740 |
| Kraft Foods, Cl. A | 94,570 | 2,647,960 |
| PepsiCo | 113,790 | 6,935,501 |
| Philip Morris International | 167,740 | 7,689,202 |
| Whole Foods Market | 68,060 a,b | 2,451,521 |
| | | 32,779,107 |
| Energy—7.2% | | |
| Cameron International | 66,090 a | 2,149,247 |
| ConocoPhillips | 88,280 | 4,333,665 |
| EOG Resources | 24,980 | 2,457,283 |
| Newfield Exploration | 32,190 a | 1,572,803 |
| Occidental Petroleum | 38,860 | 2,998,049 |
| Pioneer Natural Resources | 23,770 | 1,413,127 |
| Schlumberger | 105,560 | 5,841,690 |
| | | 20,765,864 |
STATEMENT OF INVESTMENTS (Unaudited) (continued)
| | |
| Common Stocks (continued) | Shares | Value ($) |
| Exchange Traded Funds—1.2% | | |
| iShares Russell 1000 Growth Index Fund | 79,650 | 3,650,360 |
| Financial—4.1% | | |
| American Express | 90,170 | 3,579,749 |
| Genworth Financial, Cl. A | 137,050 a | 1,791,244 |
| Prudential Financial | 39,090 | 2,097,569 |
| State Street | 43,110 | 1,457,980 |
| T. Rowe Price Group | 64,790 | 2,876,028 |
| | | 11,802,570 |
| Health Care—13.4% | | |
| Alexion Pharmaceuticals | 32,850 a | 1,681,591 |
| Allergan | 52,570 | 3,062,728 |
| AmerisourceBergen | 114,710 | 3,642,042 |
| Amgen | 34,940 a | 1,837,844 |
| Amylin Pharmaceuticals | 91,120 a | 1,713,056 |
| Celgene | 43,420 a | 2,206,604 |
| Cerner | 38,350 a | 2,910,381 |
| Covidien | 57,887 | 2,325,900 |
| Dendreon | 1,800 a | 100,211 |
| Edwards Lifesciences | 50,240 a | 2,814,445 |
| Express Scripts | 86,520 a | 4,068,170 |
| Hospira | 33,970 a | 1,951,577 |
| Human Genome Sciences | 64,320 a | 1,457,491 |
| Illumina | 48,470 a | 2,109,899 |
| Merck & Co. | 42,440 | 1,484,127 |
| Pfizer | 136,284 | 1,943,410 |
| Warner Chilcott, Cl. A | 84,790 a | 1,937,451 |
| Zimmer Holdings | 28,620 a | 1,546,911 |
| | | 38,793,838 |
| Industrial—11.0% | | |
| Caterpillar | 101,470 | 6,095,303 |
| Cummins | 50,670 | 3,300,137 |
| Dover | 69,871 | 2,919,909 |
| General Electric | 245,200 | 3,535,784 |
| Ingersoll-Rand | 83,390 | 2,876,121 |
| Norfolk Southern | 57,190 | 3,033,930 |
| Rockwell Collins | 45,600 | 2,422,728 |
8
| | |
| Common Stocks (continued) | Shares | Value ($) |
| Industrial (continued) | | |
| Tyco International | 82,380 | 2,902,247 |
| United Technologies | 73,550 | 4,774,131 |
| | | 31,860,290 |
| Information Technology—31.9% | | |
| Agilent Technologies | 69,440 a | 1,974,179 |
| Amphenol, Cl. A | 72,800 | 2,859,584 |
| Apple | 66,904 a | 16,828,363 |
| BMC Software | 94,060 a | 3,257,298 |
| Cisco Systems | 397,210 a | 8,464,545 |
| Dolby Laboratories, Cl. A | 55,720 a | 3,493,087 |
| Equinix | 16,460 a | 1,336,881 |
| Google, Cl. A | 18,896 a | 8,407,775 |
| Informatica | 102,830 a | 2,455,580 |
| International Business Machines | 78,740 | 9,722,815 |
| Microsoft | 385,310 | 8,865,983 |
| NetApp | 47,200 a | 1,761,032 |
| Oracle | 351,610 | 7,545,551 |
| Research In Motion | 51,920 a | 2,557,579 |
| Salesforce.com | 38,530 a | 3,306,645 |
| Teradata | 121,130 a | 3,692,042 |
| Trimble Navigation | 98,560 a | 2,759,680 |
| VMware, Cl. A | 51,800 a | 3,242,162 |
| | | 92,530,781 |
| Materials—3.6% | | |
| Air Products & Chemicals | 64,050 | 4,151,080 |
| Celanese, Ser. A | 83,390 | 2,077,245 |
| Freeport-McMoRan Copper & Gold | 70,190 | 4,150,335 |
| | | 10,378,660 |
| Total Common Stocks | | |
| (cost $269,201,183) | | 280,291,422 |
| |
| Other Investment—4.0% | | |
| Registered Investment Company; | | |
| Dreyfus Institutional Preferred | | |
| Plus Money Market Fund | | |
| (cost $11,517,000) | 11,517,000 c | 11,517,000 |
STATEMENT OF INVESTMENTS (Unaudited) (continued)
| | |
| Investment of Cash Collateral | | |
| for Securities Loaned—1.1% | Shares | Value ($) |
| Registered Investment Company; | | |
| Dreyfus Institutional Cash Advantage Fund | | |
| (cost $3,233,564) | 3,233,564 c | 3,233,564 |
| Total Investments (cost $283,951,747) | 101.8% | 295,041,986 |
| Liabilities, Less Cash and Receivables | (1.8%) | (5,240,046) |
| Net Assets | 100.0% | 289,801,940 |
|
| a Non-income producing security. |
| b Security, or portion thereof, on loan. At June 30, 2010, the total market value of the fund’s securities on loan is |
| $2,931,384 and the total market value of the collateral held by the fund is $3,233,564. |
| c Investment in affiliated money market mutual fund. |
| | | |
| Portfolio Summary (Unaudited)† | | |
| |
| | Value (%) | | Value (%) |
| Information Technology | 31.9 | Money Market Investments | 5.1 |
| Health Care | 13.4 | Financial | 4.1 |
| Consumer Discretionary | 13.0 | Materials | 3.6 |
| Consumer Staples | 11.3 | Exchange Traded Funds | 1.2 |
| Industrial | 11.0 | | |
| Energy | 7.2 | | 101.8 |
| |
| † Based on net assets. | | | |
| See notes to financial statements. | | | |
10
|
| STATEMENT OF ASSETS AND LIABILITIES |
| June 30, 2010 (Unaudited) |
| | | | | |
| | | | | Cost | Value |
| Assets ($): | | | | | |
| Investments in securities—See Statement of Investments (including | | |
| securities on loan, valued at $2,931,384)—Note 1(b): | | | |
| Unaffiliated issuers | | | 269,201,183 | 280,291,422 |
| Affiliated issuers | | | | 14,750,564 | 14,750,564 |
| Receivable for investment securities sold | | | | 15,320,432 |
| Dividends and interest receivable | | | | 308,832 |
| Receivable for shares of Common Stock subscribed | | | 44,509 |
| Prepaid expenses | | | | | 43,358 |
| | | | | | 310,759,117 |
| Liabilities ($): | | | | | |
| Due to The Dreyfus Corporation and affiliates—Note 3(c) | | | 326,704 |
| Cash overdraft due to Custodian | | | | 15,442 |
| Payable for investment securities purchased | | | | 16,828,626 |
| Liability for securities on loan—Note 1(b) | | | | 3,233,564 |
| Payable for shares of Common Stock redeemed | | | 204,904 |
| Accrued expenses | | | | | 347,937 |
| | | | | | 20,957,177 |
| Net Assets ($) | | | | | 289,801,940 |
| Composition of Net Assets ($): | | | | |
| Paid-in capital | | | | | 424,849,833 |
| Accumulated Investment (loss)—net | | | | (126,184) |
| Accumulated net realized gain (loss) on investments | | (146,011,948) |
| Accumulated net unrealized appreciation | | | | |
| (depreciation) on investments | | | | 11,090,239 |
| Net Assets ($) | | | | | 289,801,940 |
| |
| |
| Net Asset Value Per Share | | | | |
| | Class A | Class B | Class C | Class F | Class I |
| Net Assets ($) | 156,594,901 | 174,721 | 2,721,840 | 127,820,440 | 2,490,038 |
| Shares Outstanding | 34,769,978 | 41,724 | 652,024 | 27,710,317 | 544,707 |
| Net Asset Value | | | | | |
| Per Share ($) | 4.50 | 4.19 | 4.17 | 4.61 | 4.57 |
| |
| See notes to financial statements. | | | | | |
|
| STATEMENT OF OPERATIONS |
| Six Months Ended June 30, 2010 (Unaudited) |
| |
| Investment Income ($): | |
| Income: | |
| Cash dividends: | |
| Unaffiliated issuers | 1,837,379 |
| Affiliated issuers | 2,890 |
| Income from securities lending—Note 1(b) | 1,521 |
| Total Income | 1,841,790 |
| Expenses: | |
| Investment advisory fee—Note 3(a) | 1,020,203 |
| Shareholder servicing costs—Note 3(c) | 497,980 |
| Prospectus and shareholders’ reports | 136,446 |
| Accounting fees—Note 3(c) | 95,881 |
| Professional fees | 55,023 |
| Directors’ fees and expenses—Note 3(d) | 45,370 |
| Registration fees | 36,097 |
| Distribution fees—Note 3(b) | 34,172 |
| Custodian fees—Note 3(c) | 4,813 |
| Loan commitment fees—Note 2 | 1,688 |
| Interest expense—Note 2 | 153 |
| Miscellaneous | 38,296 |
| Total Expenses | 1,966,122 |
| Less—reduction in fees due to earnings credits—Note 1(b) | (1,258) |
| Net Expenses | 1,964,864 |
| Investment (Loss)—Net | (123,074) |
| Realized and Unrealized Gain (Loss) on Investments—Note 4 ($): | |
| Net realized gain (loss) on investments | 25,252,634 |
| Net unrealized appreciation (depreciation) on investments | (44,942,499) |
| Net Realized and Unrealized Gain (Loss) on Investments | (19,689,865) |
| Net (Decrease) in Net Assets Resulting from Operations | (19,812,939) |
| |
| See notes to financial statements. | |
12
STATEMENT OF CHANGES IN NET ASSETS
| | |
| | Six Months Ended | |
| | June 30, 2010 | Year Ended |
| | (Unaudited) | December 31, 2009a |
| Operations ($): | | |
| Investment income (loss)—net | (123,074) | 771,255 |
| Net realized gain (loss) on investments | 25,252,634 | (49,298,470) |
| Net unrealized appreciation | | |
| (depreciation) on investments | (44,942,499) | 137,374,652 |
| Net Increase (Decrease) in Net Assets | | |
| Resulting from Operations | (19,812,939) | 88,847,437 |
| Dividends to Shareholders from ($): | | |
| Investment income—net: | | |
| Class A Shares | — | (110,755) |
| Class F Shares | (180,045) | (680,875) |
| Class I Shares | (6,839) | (12,613) |
| Total Dividends | (186,884) | (804,243) |
| Capital Stock Transactions ($): | | |
| Net proceeds from shares sold: | | |
| Class A Shares | 2,448,662 | 7,601,144 |
| Class B Shares | — | 1,834 |
| Class C Shares | 121,474 | 315,444 |
| Class F Shares | 469,789 | 1,779,617 |
| Class I Shares | 886,114 | 640,328 |
| Class T Shares | — | 2,500 |
| Dividends reinvested: | | |
| Class A Shares | — | 105,531 |
| Class F Shares | 158,713 | 601,276 |
| Class I Shares | 6,449 | 11,530 |
| Cost of shares redeemed: | | |
| Class A Shares | (12,538,801) | (34,966,953) |
| Class B Shares | (133,085) | (281,302) |
| Class C Shares | (294,125) | (966,649) |
| Class F Shares | (6,751,754) | (19,895,195) |
| Class I Shares | (296,005) | (352,939) |
| Class T Shares | — | (45,740) |
| Increase (Decrease) in Net Assets | | |
| from Capital Stock Transactions | (15,922,569) | (45,449,574) |
| Total Increase (Decrease) in Net Assets | (35,922,392) | 42,593,620 |
| Net Assets ($): | | |
| Beginning of Period | 325,724,332 | 283,130,712 |
| End of Period | 289,801,940 | 325,724,332 |
| Undistributed investment income (loss)—net | (126,184) | 183,774 |
STATEMENT OF CHANGES IN NET ASSETS (continued)
| | |
| | Six Months Ended | |
| | June 30, 2010 | Year Ended |
| | (Unaudited) | December 31, 2009a |
| Capital Share Transactions: | | |
| Class Ab,c | | |
| Shares sold | 505,367 | 1,987,119 |
| Shares issued for dividends reinvested | — | 21,759 |
| Shares redeemed | (2,565,499) | (8,533,785) |
| Net Increase (Decrease) in Shares Outstanding | (2,060,132) | (6,524,907) |
| Class Bb | | |
| Shares sold | — | 451 |
| Shares redeemed | (29,183) | (79,207) |
| Net Increase (Decrease) in Shares Outstanding | (29,183) | (78,756) |
| Class C | | |
| Shares sold | 26,529 | 95,045 |
| Shares redeemed | (64,261) | (249,847) |
| Net Increase (Decrease) in Shares Outstanding | (37,732) | (154,802) |
| Class F | | |
| Shares sold | 93,881 | 443,473 |
| Shares issued for dividends reinvested | 30,940 | 138,897 |
| Shares redeemed | (1,348,666) | (4,659,408) |
| Net Increase (Decrease) in Shares Outstanding | (1,223,845) | (4,077,038) |
| Class I | | |
| Shares sold | 174,499 | 149,599 |
| Shares issued for dividends reinvested | 1,269 | 2,701 |
| Shares redeemed | (60,083) | (94,856) |
| Net Increase (Decrease) in Shares Outstanding | 115,685 | 57,444 |
| Class Tc | | |
| Shares sold | — | 799 |
| Shares redeemed | — | (14,253) |
| Net Increase (Decrease) in Shares Outstanding | — | (13,454) |
|
| a Effective as of the close of business on February 4, 2009, the fund no longer offers Class T shares. |
| b During the period ended June 30, 2010, 14,844 Class B shares representing $67,833 were automatically converted |
| to 13,906 Class A shares and during the period ended December 31, 2009, 25,581 Class B shares representing |
| $95,932 were automatically converted to 24,116 Class A shares. |
| c On the close of business on February 4, 2009, 13,911 Class T shares representing $44,654 were converted to |
| 12,943 Class A shares. |
See notes to financial statements.
14
FINANCIAL HIGHLIGHTS
The following tables describe the performance for each share class for the fiscal periods indicated.All information (except portfolio turnover rate) reflects financial results for a single fund share.Total return shows how much your investment in the fund would have increased (or decreased) during each period, assuming you had reinvested all dividends and distributions.These figures have been derived from the fund’s financial statements.
| | | | | | |
| Six Months Ended | | | | | |
| June 30, 2010 | | Year Ended December 31, | |
| Class A Shares | (Unaudited) | 2009† | 2008 | 2007 | 2006 | 2005 |
| Per Share Data ($): | | | | | | |
| Net asset value, | | | | | | |
| beginning of period | 4.82 | 3.60 | 6.15 | 5.72 | 5.07 | 4.86 |
| Investment Operations: | | | | | | |
| Investment income (loss)—neta | (.00)b | .01 | .01 | .01 | .00b | (.00)b |
| Net realized and unrealized | | | | | | |
| gain (loss) on investments | (.32) | 1.21 | (2.55) | .44 | .66 | .22 |
| Total from Investment Operations | (.32) | 1.22 | (2.54) | .45 | .66 | .22 |
| Distributions: | | | | | | |
| Dividends from | | | | | | |
| investment income—net | — | (.00)b | (.01) | (.02) | (.01) | (.01) |
| Net asset value, end of period | 4.50 | 4.82 | 3.60 | 6.15 | 5.72 | 5.07 |
| Total Return (%)c | (6.64)d | 33.97 | (41.39) | 7.81 | 13.02 | 4.46 |
| Ratios/Supplemental Data (%): | | | | | | |
| Ratio of total expenses | | | | | | |
| to average net assets | 1.32e | 1.32 | 1.25 | 1.19 | 1.34 | 1.35 |
| Ratio of net expenses | | | | | | |
| to average net assets | 1.32e,f | 1.31 | 1.23 | 1.19f | 1.34f | 1.33 |
| Ratio of net investment income | | | | | | |
| (loss) to average net assets | (.17)e | .16 | .12 | .14 | .00g | (.09) |
| Portfolio Turnover Rate | 55.85d | 162.04 | 112 | 68 | 110 | 126 |
| Net Assets, end of period | | | | | | |
| ($ x 1,000) | 156,595 | 177,424 | 156,236 | 317,753 | 4,399 | 1,266 |
|
| † Effective September 1, 2009,The Dreyfus Corporation replaced Founders Asset Management LLC as the fund’s |
| investment adviser. |
| a Based on average shares outstanding at each month end. |
| b Amount represents less than $.01 per share. |
| c Exclusive of sales charge. |
| d Not annualized. |
| e Annualized. |
| f Expense waivers and/or reimbursements amounted to less than .01%. |
| g Amount represents less than .01%. |
See notes to financial statements.
FINANCIAL HIGHLIGHTS (continued)
| | | | | | |
| Six Months Ended | | | | | |
| June 30, 2010 | | Year Ended December 31, | |
| Class B Shares | (Unaudited) | 2009† | 2008 | 2007 | 2006 | 2005 |
| Per Share Data ($): | | | | | | |
| Net asset value, | | | | | | |
| beginning of period | 4.52 | 3.42 | 5.88 | 5.51 | 4.91 | 4.74 |
| Investment Operations: | | | | | | |
| Investment (loss)—neta | (.05) | (.04) | (.04) | (.04) | (.05) | (.04) |
| Net realized and unrealized | | | | | | |
| gain (loss) on investments | (.28) | 1.14 | (2.42) | .41 | .65 | .21 |
| Total from Investment Operations | (.33) | 1.10 | (2.46) | .37 | .60 | .17 |
| Net asset value, end of period | 4.19 | 4.52 | 3.42 | 5.88 | 5.51 | 4.91 |
| Total Return (%)b | (7.30)c | 32.16 | (41.84) | 6.72 | 12.22 | 3.59 |
| Ratios/Supplemental Data (%): | | | | | | |
| Ratio of total expenses | | | | | | |
| to average net assets | 3.20d | 2.50 | 2.12 | 2.24 | 2.21 | 2.19 |
| Ratio of net expenses | | | | | | |
| to average net assets | 3.19d | 2.48 | 2.10 | 2.24e | 2.21e | 2.18 |
| Ratio of net investment (loss) | | | | | | |
| to average net assets | (2.06)d | (.97) | (.78) | (.76) | (.93) | (.97) |
| Portfolio Turnover Rate | 55.85c | 162.04 | 112 | 68 | 110 | 126 |
| Net Assets, end of period | | | | | | |
| ($ x 1,000) | 175 | 321 | 512 | 1,855 | 1,046 | 1,453 |
|
| † Effective September 1, 2009,The Dreyfus Corporation replaced Founders Asset Management LLC as the fund’s |
| investment adviser. |
| a Based on average shares outstanding at each month end. |
| b Exclusive of sales charge. |
| c Not annualized. |
| d Annualized. |
| e Expense waivers and/or reimbursements amounted to less than .01%. |
See notes to financial statements.
16
| | | | | | |
| Six Months Ended | | | | | |
| June 30, 2010 | | Year Ended December 31, | |
| Class C Shares | (Unaudited) | 2009† | 2008 | 2007 | 2006 | 2005 |
| Per Share Data ($): | | | | | | |
| Net asset value, | | | | | | |
| beginning of period | 4.48 | 3.38 | 5.80 | 5.41 | 4.82 | 4.66 |
| Investment Operations: | | | | | | |
| Investment (loss)—neta | (.02) | (.02) | (.03) | (.03) | (.03) | (.03) |
| Net realized and unrealized | | | | | | |
| gain (loss) on investments | (.29) | 1.12 | (2.39) | .42 | .62 | .20 |
| Total from Investment Operations | (.31) | 1.10 | (2.42) | .39 | .59 | .17 |
| Distributions: | | | | | | |
| Dividends from | | | | | | |
| investment income—net | — | — | — | — | — | (.01) |
| Net asset value, end of period | 4.17 | 4.48 | 3.38 | 5.80 | 5.41 | 4.82 |
| Total Return (%)b | (6.92)c | 32.54 | (41.72) | 7.21 | 12.24 | 3.68 |
| Ratios/Supplemental Data (%): | | | | | | |
| Ratio of total expenses | | | | | | |
| to average net assets | 2.13d | 2.12 | 1.99 | 1.97 | 2.01 | 1.98 |
| Ratio of net expenses | | | | | | |
| to average net assets | 2.13d,e | 2.10 | 1.97 | 1.97e | 2.01e | 1.96 |
| Ratio of net investment (loss) | | | | | | |
| to average net assets | (.98)d | (.63) | (.64) | (.45) | (.69) | (.72) |
| Portfolio Turnover Rate | 55.85c | 162.04 | 112 | 68 | 110 | 126 |
| Net Assets, end of period | | | | | | |
| ($ x 1,000) | 2,722 | 3,092 | 2,853 | 8,628 | 3,759 | 2,012 |
|
| † Effective September 1, 2009,The Dreyfus Corporation replaced Founders Asset Management LLC as the fund’s |
| investment adviser. |
| a Based on average shares outstanding at each month end. |
| b Exclusive of sales charge. |
| c Not annualized. |
| d Annualized. |
| e Expense waivers and/or reimbursements amounted to less than .01%. |
See notes to financial statements.
FINANCIAL HIGHLIGHTS (continued)
| | | | | | |
| Six Months Ended | | | | | |
| June 30, 2010 | | Year Ended December 31, | |
| Class F Shares | (Unaudited) | 2009† | 2008 | 2007 | 2006 | 2005 |
| Per Share Data ($): | | | | | | |
| Net asset value, | | | | | | |
| beginning of period | 4.93 | 3.70 | 6.32 | 5.86 | 5.18 | 4.96 |
| Investment Operations: | | | | | | |
| Investment income—neta | .00b | .02 | .02 | .03 | .01 | .00b |
| Net realized and unrealized | | | | | | |
| gain (loss) on investments | (.31) | 1.23 | (2.62) | .45 | .68 | .23 |
| Total from Investment Operations | (.31) | 1.25 | (2.60) | .48 | .69 | .23 |
| Distributions: | | | | | | |
| Dividends from | | | | | | |
| investment income—net | (.01) | (.02) | (.02) | (.02) | (.01) | (.01) |
| Net asset value, end of period | 4.61 | 4.93 | 3.70 | 6.32 | 5.86 | 5.18 |
| Total Return (%) | (6.38)c | 33.94 | (41.13) | 8.14 | 13.25 | 4.64 |
| Ratios/Supplemental Data (%): | | | | | | |
| Ratio of total expenses | | | | | | |
| to average net assets | 1.10d | 1.08 | .96 | 1.04 | 1.10 | 1.13 |
| Ratio of net expenses | | | | | | |
| to average net assets | 1.10d,e | 1.06 | .94 | 1.04e | 1.10e | 1.12 |
| Ratio of net investment income | | | | | | |
| to average net assets | .05d | .41 | .41 | .54 | .20 | .11 |
| Portfolio Turnover Rate | 55.85c | 162.04 | 112 | 68 | 110 | 126 |
| Net Assets, end of period | | | | | | |
| ($ x 1,000) | 127,820 142,787 | 122,119 | 231,030 | 220,502 | 215,556 |
|
| † Effective September 1, 2009,The Dreyfus Corporation replaced Founders Asset Management LLC as the fund’s |
| investment adviser. |
| a Based on average shares outstanding at each month end. |
| b Amount represents less than $.01 per share. |
| c Not annualized. |
| d Annualized. |
| e Expense waivers and/or reimbursements amounted to less than .01%. |
See notes to financial statements.
18
| | | | | | |
| Six Months Ended | | | | | |
| June 30, 2010 | | Year Ended December 31, | |
| Class I Shares | (Unaudited) | 2009† | 2008 | 2007a | 2006 | 2005 |
| Per Share Data ($): | | | | | | |
| Net asset value, | | | | | | |
| beginning of period | 4.90 | 3.67 | 6.28 | 5.82 | 5.13 | 4.91 |
| Investment Operations: | | | | | | |
| Investment income—netb | .00c | .02 | .03 | .03 | .01 | .01 |
| Net realized and unrealized | | | | | | |
| gain (loss) on investments | (.32) | 1.24 | (2.62) | .45 | .69 | .22 |
| Total from Investment Operations | (.32) | 1.26 | (2.59) | .48 | .70 | .23 |
| Distributions: | | | | | | |
| Dividends from | | | | | | |
| investment income—net | (.01) | (.03) | (.02) | (.02) | (.01) | (.01) |
| Net asset value, end of period | 4.57 | 4.90 | 3.67 | 6.28 | 5.82 | 5.13 |
| Total Return (%) | (6.51)d | 34.54 | (41.08) | 8.09 | 13.55 | 4.78 |
| Ratios/Supplemental Data (%): | | | | | | |
| Ratio of total expenses | | | | | | |
| to average net assets | 1.10e | .96 | .89 | 1.09 | 1.04 | 1.10 |
| Ratio of net expenses | | | | | | |
| to average net assets | 1.10e,f | .94 | .81 | .96 | 1.04f | 1.09 |
| Ratio of net investment income | | | | | | |
| to average net assets | .05e | .53 | .54 | .48 | .21 | .15 |
| Portfolio Turnover Rate | 55.85d | 162.04 | 112 | 68 | 110 | 126 |
| Net Assets, end of period | | | | | | |
| ($ x 1,000) | 2,490 | 2,101 | 1,365 | 3,434 | 97 | 270 |
|
| † Effective September 1, 2009,The Dreyfus Corporation replaced Founders Asset Management LLC as the fund’s |
| investment adviser. |
| a Effective June 1, 2007, Class R shares were redesignated as Class I shares. |
| b Based on average shares outstanding at each month end. |
| c Amount represents less than $.01 per share. |
| d Not annualized. |
| e Annualized. |
| f Expense waivers and/or reimbursements amounted to less than .01%. |
See notes to financial statements.
NOTES TO FINANCIAL STATEMENTS (Unaudited)
NOTE 1—Significant Accounting Policies:
Dreyfus Equity Growth Fund (the “fund”) is a separate diversified series of Dreyfus Funds, Inc. (the “Company”), which is registered under the Investment Company Act of 1940, as amended (the “Act”), as an open-end management investment company and operates as a series company currently offering two series, including the fund.The fund’s investment objective seeks long-term growth of capital. The Dreyfus Corporation (the “Manager” or “Dreyfus”), a wholly-owned subsidiary of The Bank of New York Mellon Corporation (“BNY Mellon”), serves as the fund’s investment adviser.
MBSC Securities Corporation (the “Distributor”), a wholly-owned subsidiary of the Manager, is the distributor of the fund’s shares.The fund is authorized to issue 2.15 billion shares of $.001 par value Common Stock. The fund currently offers five classes of shares: Class A (1 billion shares authorized), Class B (50 million shares authorized), Class C (250 million shares authorized), Class F (700 million shares authorized) and Class I (150 million shares authorized).Class A shares are subject to a sales charge imposed at the time of purchase. Class B shares are subject to a contingent deferred sales charge (“CDSC”) imposed on Class B share redemptions made within six years of purchase and automatically convert to Class A shares after six years. The fund does not offer Class B shares, except in connection with dividend reinvestment and permitted exchanges of Class B shares. Class C shares are subject to a CDSC imposed on Class C shares redeemed within one year of purchase. Class F and Class I shares are sold at net asset value per share. Class F shares are sold only to Class F grandfathered investors, and Class I shares are sold only to institutional investors. Other differences between the classes include the services offered to and the expenses borne by each class, the allocation of certain transfer agency costs and certain voting rights. Income,expenses (other than expenses attributable to a specific class),and realized and unrealized gains or losses on investments are allocated to each class of shares based on its relative net assets.
The Company accounts separately for the assets, liabilities and operations of each series. Expenses directly attributable to each series are
20
charged to that series’ operations; expenses which are applicable to all series are allocated among them on a pro rata basis.
The Financial Accounting Standards Board (“FASB”) Accounting Standards Codification (“ASC”) is the exclusive reference of authoritative U.S. generally accepted accounting principles (“GAAP”) recognized by the FASB to be applied by nongovernmental entities.Rules and interpretive releases of the Securities and Exchange Commission (“SEC”) under authority of federal laws are also sources of authoritative GAAP for SEC registrants. The fund’s financial statements are prepared in accordance with GAAP, which may require the use of management estimates and assumptions.Actual results could differ from those estimates.
The Company enters into contracts that contain a variety of indemnifications. The fund’s maximum exposure under these arrangements is unknown.The fund does not anticipate recognizing any loss related to these arrangements.
(a) Portfolio valuation: Investments in securities are valued at the last sales price on the securities exchange or national securities market on which such securities are primarily traded. Securities listed on the National Market System for which market quotations are available are valued at the official closing price or, if there is no official closing price that day, at the last sales price. Securities not listed on an exchange or the national securities market, or securities for which there were no transactions, are valued at the average of the most recent bid and asked prices, except for open short positions, where the asked price is used for valuation purposes. Bid price is used when no asked price is available. Registered investment companies that are not traded on an exchange are valued at their net asset value.When market quotations or officia l closing prices are not readily available, or are determined not to reflect accurately fair value, such as when the value of a security has been significantly affected by events after the close of the exchange or market on which the security is principally traded (for example, a foreign exchange or market), but before the fund calculates its net asset value, the fund may value these investments at fair value as determined
NOTES TO FINANCIAL STATEMENTS (Unaudited) (continued)
in accordance with the procedures approved by the Board of Directors. Fair valuing of securities may be determined with the assistance of a pricing service using calculations based on indices of domestic securities and other appropriate indicators, such as prices of relevant American Depository Receipts and futures contracts. For other securities that are fair valued by the Board of Directors, certain factors may be considered such as: fundamental analytical data, the nature and duration of restrictions on disposition, an evaluation of the forces that influence the market in which the securities are purchased and sold, and public trading in similar securities of the issuer or comparable issuers.
The fair value of a financial instrument is the amount that would be received to sell an asset or paid to transfer a liability in an orderly transaction between market participants at the measurement date (i.e. the exit price). GAAP establishes a fair value hierarchy that prioritizes the inputs of valuation techniques used to measure fair value.This hierarchy gives the highest priority to unadjusted quoted prices in active markets for identical assets or liabilities (Level 1 measurements) and the lowest priority to unobservable inputs (Level 3 measurements).
Additionally, GAAP provides guidance on determining whether the volume and activity in a market has decreased significantly and whether such a decrease in activity results in transactions that are not orderly. GAAP requires enhanced disclosures around valuation inputs and techniques used during annual and interim periods.
Various inputs are used in determining the value of the fund’s investments relating to fair value measurements.These inputs are summarized in the three broad levels listed below:
Level 1—unadjusted quoted prices in active markets for
identical investments.
Level 2—other significant observable inputs (including quoted
prices for similar investments, interest rates, prepayment speeds,
credit risk, etc.).
Level 3—significant unobservable inputs (including the fund’s own
assumptions in determining the fair value of investments).
22
The inputs or methodology used for valuing securities are not necessarily an indication of the risk associated with investing in those securities.
The following is a summary of the inputs used as of June 30, 2010 in valuing the fund’s investments:
| | | | |
| | | Level 2—Other | Level 3— | |
| | Level 1— | Significant | Significant | |
| | Unadjusted | Observable | Unobservable | |
| | Quoted Prices | Inputs | Inputs | Total |
| Assets ($) | | | | |
| Investments in Securities: | | | |
| Equity Securities— | | | | |
| Domestic† | 271,365,125 | — | — | 271,365,125 |
| Equity Securities— | | | | |
| Foreign† | 5,275,937 | — | — | 5,275,937 |
| Mutual Funds/ | | | | |
| Exchange | | | | |
| Traded Funds | 18,400,924 | — | — | 18,400,924 |
| |
| † See Statement of Investments for industry classification. | | |
In January 2010, FASB issued Accounting Standards Update (“ASU”) No. 2010-06 “Improving Disclosures about Fair Value Measurements”. The portions of ASU No. 2010-06 which require reporting entities to prepare new disclosures surrounding amounts and reasons for significant transfers in and out of Level 1 and Level 2 fair value measurements as well as inputs and valuation techniques used to measure fair value for both recurring and nonrecurring fair value measurements that fall in either Level 2 or Level 3 have been adopted by the fund.The remaining portion of ASU No. 2010-06 requires reporting entities to make new disclosures about information on purchases, sales, issuances and settlements on a gross basis in the reconciliation of activity in Level 3 fair value measurements.These new and revised disclosures are required to be implemented for fiscal years beginning after December 15, 2010. Management is current ly evaluating the impact that the adoption of this remaining portion of ASU No. 2010-06 may have on the fund’s financial statement disclosures.
NOTES TO FINANCIAL STATEMENTS (Unaudited) (continued)
(b) Securities transactions and investment income: Securities transactions are recorded on a trade date basis. Realized gains and losses from securities transactions are recorded on the identified cost basis. Dividend income is recognized on the ex-dividend date and interest income, including, where applicable, accretion of discount and amortization of premium on investments, is recognized on the accrual basis.
The fund has arrangements with the custodian and cash management bank whereby the fund may receive earnings credits when positive cash balances are maintained, which are used to offset custody and cash management fees. For financial reporting purposes, the fund includes net earnings credits as an expense offset in the Statement of Operations.
Pursuant to a securities lending agreement with The Bank of New York Mellon, a subsidiary of BNY Mellon and an affiliate of Dreyfus, the fund may lend securities to qualified institutions. It is the fund’s policy that, at origination, all loans are secured by collateral of at least 102% of the value of U.S. securities loaned and 105% of the value of foreign securities loaned. Collateral equivalent to at least 100% of the market value of securities on loan is maintained at all times. Collateral is either in the form of cash, which can be invested in certain money market mutual funds managed by the Manager, U.S. Government and Agency securities or letters of credit.The fund is entitled to receive all income on securities loaned, in addition to income earned as a result of the lending transaction. Although each security loaned is fully collateralized, the fund bears the risk of delay in recovery of, or loss of rights in, the securities loaned should a borrower fail to return the securities in a timely manner. During the period ended June 30, 2010, The Bank of New York Mellon earned $652 from lending portfolio securities, pursuant to the securities lending agreement.
(c) Affiliated issuers: Investments in other investment companies advised by Dreyfus are defined as “affiliated” in the Act.
24
The fund may invest in shares of certain affiliated investment companies also advised or managed by Dreyfus. Investments in affiliated investment companies for the period ended June 30, 2010 were as follows:
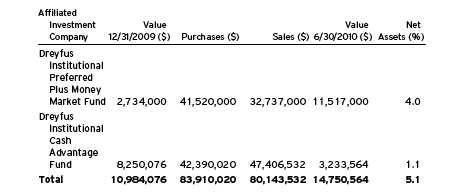
(d) Dividends to shareholders: Dividends are recorded on the ex-dividend date. Dividends from investment income-net and dividends from net realized capital gains, if any, are normally declared and paid annually, but the fund may make distributions on a more frequent basis to comply with the distribution requirements of the Internal Revenue Code of 1986, as amended (the “Code”).To the extent that net realized capital gains can be offset by capital loss carryovers, it is the policy of the fund not to distribute such gains. Income and capital gain distributions are determined in accordance with income tax regulations, which may differ from GAAP.
(e) Federal income taxes: It is the policy of the fund to continue to qualify as a regulated investment company, if such qualification is in the best interests of its shareholders, by complying with the applicable provisions of the Code, and to make distributions of taxable income sufficient to relieve it from substantially all federal income and excise taxes.
NOTES TO FINANCIAL STATEMENTS (Unaudited) (continued)
As of and during the period ended June 30, 2010, the fund did not have any liabilities for any uncertain tax positions.The fund recognizes interest and penalties, if any, related to uncertain tax positions as income tax expense in the Statement of Operations. During the period, the fund did not incur any interest or penalties.
Each of the tax years in the three-year period ended December 31, 2009 remains subject to examination by the Internal Revenue Service and state taxing authorities.
The fund has an unused capital loss carryover of $165,692,151 available for federal income tax purposes to be applied against future net securities profits, if any, realized subsequent to December 31, 2009. If not applied, $50,083,636 of the carryover expires in fiscal 2010, $37,347,074 expires in fiscal 2016 and $78,261,441 expires in fiscal 2017.
The tax character of distributions paid to shareholders during the fiscal year ended December 31, 2009 was as follows: ordinary income $804,243. The tax character of current year distributions will be determined at the end of the current fiscal year.
NOTE 2—Bank Lines of Credit:
The fund participates with other Dreyfus-managed funds in a $225 million unsecured credit facility led by Citibank, N.A. and a $300 million unsecured credit facility provided by The Bank of New York Mellon (each, a “Facility”), each to be utilized primarily for temporary or emergency purposes, including the financing of redemptions. In connection therewith, the fund has agreed to pay its pro rata portion of commitment fees for each Facility. Interest is charged to the fund based on rates determined pursuant to the terms of the respective Facility at the time of borrowing.
The average amount of borrowings outstanding under the Facilities during the period ended June 30, 2010, was approximately $22,100 with a related weighted average annualized interest rate of 1.40%.
26
NOTE 3—Investment Advisory Fee and Other Transactions With Affiliates:
(a) Pursuant to an investment advisory agreement with the Manager, the investment advisory fee is based on the value of the fund’s average daily net assets and is computed at the following annual rates: .65% of the first $250 million, .60% of the next $250 million, .55% of the next $250 million; and .50% in excess of $750 million.The fee is payable monthly.
During the period ended June 30, 2010, the Distributor retained $292 from commissions earned on sales of the fund’s Class A shares and $801 and $260 from CDSCs on redemptions of the fund’s Class B and Class C shares, respectively.
(b) Under a Distribution Plan (the “Class B and C Plan”) adopted pursuant to Rule 12b-1 under the Act, Class B and Class C shares pay the Distributor for distributing their shares at an annual rate of .75% of the value of the average daily net assets of Class B and Class C shares. During the period ended June 30, 2010, Class B and Class C shares were charged $851 and $11,269, respectively, pursuant to the Class B and C Plan.
The fund also adopted a Distribution Plan pursuant to Rule 12b-1 under the Act applicable to its Class F shares (the “Class F Plan”). Under the Class F Plan, the fund is authorized to reimburse the Distributor for expenses paid for distributing or servicing its Class F shares at an annual rate of up to .25% of the value of the average daily net assets of the fund’s Class F shares. The Distributor has agreed not to seek reimbursement of any expenses under the Class F Plan other than reimbursements for payments made to brokers and other intermediaries whose customers hold Class F shares (“Third Party Payments”). This commitment applies to any such expenses (other than Third Party Payments). This commitment will continue indefinitely and will not terminate without the prior approval of the
NOTES TO FINANCIAL STATEMENTS (Unaudited) (continued)
fund’s Board of Directors. During the period ended June 30, 2010, Class F shares were charged $22,052 pursuant to the Class F Plan.
(c) Under the Shareholder Services Plan, Class A, Class B and Class C shares pay the Distributor at an annual rate of .25% of the value of their average daily net assets for the provision of certain services.The services provided may include personal services relating to shareholder accounts, such as answering shareholder inquiries regarding Class A, Class B and Class C shares and providing reports and other information, and services related to the maintenance of shareholder accounts. The Distributor may make payments to Service Agents (a securities dealer, financial institution or other industry professional) in respect of these services.The Distributor determines the amounts to be paid to Service Agents. During the period ended June 30, 2010, Class A, Class B and Class C shares were charged $215,683, $284 and $3,756, respectively, pursuant to the Sha reholder Services Plan.
The Company has a shareholder services agreement with the Distributor, whereby the fund agrees to compensate the Distributor for providing certain shareholder servicing functions to holders of Class F shares. On an annual basis, the fund pays the Distributor a monthly fee of $24.00 per Class F shareholder account considered to be an open account at any time during a given month. During the period ended June 30, 2010, Class F shares were charged $88,769 pursuant to the shareholder services agreement.
The fund compensates Dreyfus Transfer, Inc., a wholly-owned subsidiary of the Manager, under a transfer agency agreement for providing personnel and facilities to perform transfer agency services for the fund. During the period ended June 30, 2010, the fund was charged $77,173 pursuant to the transfer agency agreement, which is included in Shareholder servicing costs in the Statement of Operations.
The fund compensates The Bank of New York Mellon under cash management agreements for performing cash management services related to fund subscriptions and redemptions. During the period ended June 30, 2010, the fund was charged $18,841 pursuant to the
28
cash management agreements, which is included in Shareholder servicing costs in the Statement of Operations.These fees were partially offset by earnings credits of $1,258.
The fund also compensates The Bank of New York Mellon under a custody agreement for providing custodial services for the fund. During the period ended June 30, 2010, the fund was charged $4,813 pursuant to the custody agreement.
The fund has agreed to compensate the Manager for providing accounting services, administration, compliance monitoring, regulatory and shareholder reporting, as well as related facilities, equipment and clerical help.The fee is based on the fund’s average daily net assets and computed at the following annual rates: .06% of the first $500 million, .04% of the next $500 million and .02% in excess of $1 billion, plus reasonable out-of-pocket expenses.The Manager has contractually agreed in writing to waive any fees received for these services to the extent they exceed its costs in providing the services and a reasonable allocation of the costs incurred by the Manager and its affiliates related to the support and oversight of these services.
During the period ended June 30, 2010, the fund was charged $2,742 for services performed by the Chief Compliance Officer.
The components of “Due to The Dreyfus Corporation and affiliates” in the Statement of Assets and Liabilities consist of: investment advisory fees $162,168, Rule 12b-1 distribution plan fees $5,258, shareholder services plan fees $86,799, custodian fees $1,823, chief compliance officer fees $4,113, accounting fees $13,303 and transfer agency per account fees $53,240.
(d) Effective January 1, 2010, each Director who is not an “interested person” of the Company (as defined in the Act) received $60,000 per annum, plus $7,000 per joint Board meeting of the Company, The Dreyfus/Laurel Funds, Inc., The Dreyfus/Laurel Funds Trust, The Dreyfus/Laurel Tax-Free Municipal Funds and Dreyfus Investment Funds (collectively, the “Board Group Open-end Funds”) attended,
NOTES TO FINANCIAL STATEMENTS (Unaudited) (continued)
$2,500 for separate in-person committee meetings attended which are not held in conjunction with a regularly scheduled Board meeting and $2,000 for Board meetings and separate committee meetings attended that are conducted by telephone.The Board Group Open-end Funds also reimburse each Director who is not an “interested person” of the Company (as defined in the Act) for travel and out-of-pocket expenses. With respect to Board meetings, the Chairman of the Board receives an additional 25% of such compensation (with the exception of reimbursable amounts). Effective January 1, 2010, the Chair of each of the Board’s committees, unless the Chair also serves as Chair of the Board, receives $1,350 per applicable committee meeting. In the event that there is an in-person joint committee meeting or a joint telephone meeting of the Board Group Open-end Funds and Dreyfus HighYield Strategies Fund, the $2,500 or $2,000 fee, as applicable, is allocated between the Board Group Open-end Funds and Dreyfus High Yield Strategies Fund.These fees and expenses are charged and allocated to each series based on net assets.
NOTE 4—Securities Transactions:
The aggregate amount of purchases and sales of investment securities, excluding short-term securities, during the period ended June 30, 2010, amounted to $175,053,072 and $198,664,464, respectively.
The provisions of ASC Topic 815 “Derivatives and Hedging” require qualitative disclosures about objectives and strategies for using derivatives, quantitative disclosures about fair value amounts of gains and
30
losses on derivative instruments and disclosures about credit-risk-related contingent features in derivative agreements.The fund held no derivatives during the period ended June 30, 2010. These disclosures did not impact the notes to the financial statements.
At June 30, 2010, accumulated net unrealized appreciation on investments was $11,090,239, consisting of $28,076,637 gross unrealized appreciation and $16,986,398 gross unrealized depreciation.
At June 30, 2010, the cost of investments for federal income tax purposes was substantially the same as the cost for financial reporting purposes (see the Statement of Investments).
|
| INFORMATION ABOUT THE REVIEW AND |
| APPROVAL OF THE FUND’S INVESTMENT |
| ADVISORY AGREEMENT (Unaudited) |
At a meeting of the fund’s Board of Directors held on February 9, 2010, the Board considered the re-approval of the fund’s Investment Advisory Agreement (“Management Agreement”), pursuant to which the Manager provides the fund with investment advisory and certain administrative services.The Board members, none of whom are “interested persons” (as defined in the Investment Company Act of 1940, as amended) of the fund, were assisted in their review by independent legal counsel and met with counsel in executive session separate from representatives of the Manager.
Representatives of the Manager reminded the Board members that the Manager became the investment adviser of the fund, effective September 1, 2009, but that there were no changes to the portfolio management of the fund as a result of the appointment of the Manager as the fund’s investment adviser.
Analysis of Nature, Extent and Quality of Services Provided to the Fund. The Board members considered information previously provided to them in a presentation from representatives of the Manager regarding services provided to other funds in the Dreyfus fund complex, and representatives of the Manager confirmed that this information is applicable to the fund and that there had been no material changes in this information.The Board also discussed the nature, extent and quality of the services provided to the fund pursuant to its Management Agreement.The Manager’s representatives reviewed the fund’s distribution of accounts and the relationships the Manager has with various intermediaries and the different needs of each. The Manager’s representatives noted the distribution channels for the fund, as well as the diversity of distribution among the fu nds in the Dreyfus fund complex, and the Manager’s corresponding need for broad, deep, and diverse resources to be able to provide ongoing shareholder services to each distribution channel, including those of the fund.The Manager provided the number of shareholder accounts in the fund, as well as the fund’s asset size.
32
The Board members also considered the Manager’s research and portfolio management capabilities and that the Manager also provides oversight of day-to-day fund operations, including assistance in meeting legal and regulatory requirements.The Board members also considered the Manager’s extensive compliance infrastructure. The Board also considered the Manager’s brokerage policies and practices, the standards applied in seeking best execution and the Manager’s policies and practices regarding soft dollars.
Comparative Analysis of the Fund’s Performance and Management Fee and Expense Ratio. The Board members reviewed the fund’s performance and comparisons to a group of retail front-end load, large-cap growth funds (the “Performance Group”) and to a larger universe of funds, consisting of all retail and institutional large-cap growth funds (the “Performance Universe”) selected and provided by Lipper, Inc., an independent provider of investment company data.The Board was provided with a description of the methodology Lipper used to select the Performance Group and Performance Universe, as well as the Expense Group and Expense Universe (discussed below).The Board members discussed the results of the comparisons and noted that the fund’s total return performance was below the Performance Group and Performance Universe medians for the various periods ended December 31, 2009, except for the one-year period ended December 31, 2009 when the fund’s total return performance was above the Performance Group median. As part of an overall presentation to the Board members, representatives of the Manager discussed the market environment in 2009, noting that high beta stocks had outperformed during 2009 and high quality stocks had been out of favor during 2009. A representative of the Manager reminded the Board that Elizabeth Slover became the fund’s primary portfolio manager in January 2009, and noted that the fund’s total return performance for the one-year period ended
|
| INFORMATION ABOUT THE REVIEW AND APPROVAL OF THE FUND’S |
| INVESTMENT ADVISORY AGREEMENT (Unaudited) (continued) |
December 31, 2009 was above the Performance Group median. The Manager also provided a comparison of the fund’s calendar year total returns to the returns of the fund’s benchmark index.
The Board members also discussed the fund’s contractual and actual management fees and expense ratio and reviewed the range of management fees and expense ratios of a comparable group of funds (the “Expense Group”) and a broader group of funds (the “Expense Universe”), each selected and provided by Lipper. The Lipper data presenting the fund’s “actual management fees” included fees paid by the fund, as calculated by Lipper, for administrative services provided by the Manager, the fund’s administrator. Such reporting was necessary, according to Lipper, to allow the Board to compare the fund’s advisory fees to those peers that include administrative fees within a combined management (investment advisory and administrative) fee. The Board members noted that the fund’s contractual management fee was below the Expense Group median, the fund’s actual management fee at the Ex pense Group median and above the Expense Universe median, and the fund’s expense ratio was above the Expense Group and Expense Universe medians.
Representatives of the Manager reviewed with the Board members the fees paid to the Manager or its affiliates by mutual funds managed by the Manager or its affiliates with similar investment objectives, policies and strategies, and included in the same Lipper category as the fund (the “Similar Funds”), and by other accounts managed by the Manager or its affiliates with similar investment objectives, policies and strategies as the fund (the “Similar Accounts”). The Manager’s representatives explained the nature of the Similar Accounts and the differences, from the Manager’s perspective, in providing services to such Similar Accounts as compared to managing and providing services to the fund. The Board analyzed differences in fees paid to the Manager and discussed the relationship of the fees paid in light of the services provided. The Board members considered the relevance of the fee information
34
provided for the Similar Funds and the Similar Accounts to evaluate the appropriateness and reasonableness of the fund’s management fee.
Analysis of Profitability and Economies of Scale. A representative of the Manager reminded the Board members that The Bank of New York Mellon Corporation, the parent company of the Manager, paid all of the expenses associated with the Manager becoming the fund’s investment adviser and the proxy campaign with respect to the Board members becoming the Company’s Board members. Because the Manager only became the fund’s investment adviser effective September 1, 2009, the Manager’s representatives were only able to provide the dollar amount of expenses allocated and profit received by the Manager for an abbreviated period of time. A representative of the Manager reviewed the method used to determine such expenses and profit.The Board previously had been provided with information prepared by an independent consulting firm regarding the Manager� 6;s approach to allocating costs to, and determining the profitability of, individual funds and the entire Dreyfus mutual fund complex.The Board also was informed that the methodology had also been reviewed by an independent registered public accounting firm which, like the consultant, found the methodology to be reasonable. The consulting firm also analyzed where any economies of scale might emerge in connection with the management of the fund.The Board members evaluated the profitability analysis in light of the relevant circumstances for the fund.The Board members also considered potential benefits to the Manager from acting as investment adviser and noted the Manager’s soft dollar arrangements with respect to trading the fund’s portfolio.
It was noted that the Board members should consider the Manager’s profitability with respect to the fund as part of their evaluation of whether the fees under the Management Agreement bear a reasonable relationship to the mix of services provided by the Manager, including the nature, extent and quality of such services and that a
|
| INFORMATION ABOUT THE REVIEW AND APPROVAL OF THE FUND’S |
| INVESTMENT ADVISORY AGREEMENT (Unaudited) (continued) |
discussion of economies of scale is predicated on increasing assets and that, if a fund’s assets had been decreasing, the possibility that the Manager may have realized any economies of scale would be less. It also was noted that the profitability percentage for managing the fund was within the range determined by appropriate court cases to be reasonable given the services rendered and generally superior service levels provided by the Manager.
At the conclusion of these discussions, the Board agreed that it had been furnished with sufficient information to make an informed business decision with respect to continuation of the fund’s Management Agreement. Based on the discussions and considerations as described above, the Board made the following conclusions and determinations.
The Board concluded that the nature, extent and quality of the services provided by the Manager are adequate and appropriate.
Although the Board was concerned about the fund’s relative long- term performance, it was generally satisfied with the fund’s relative one-year performance and noted the fund’s primary portfolio manager change in January 2009.
The Board concluded that the fee paid by the fund to the Manager was reasonable in light of the services provided, comparative per- formance, expense and management fee information, costs of the services provided and profits realized and benefits derived or to be derived by the Manager from its relationship with the fund.
The Board determined that because the Manager had become the investment adviser of the fund effective September 1, 2009, economies of scale were not a factor at this time, but, to the extent that material economies of scale are not shared with the fund in the future, the Board would seek to do so in connection with future renewals.
The Board members considered these conclusions and determinations, along with information received on a routine and regular basis throughout the year, and, without any one factor being dispositive, the Board determined that re-approval of the fund’s Management Agreement was in the best interests of the fund and its shareholders.
36
For More Information
| |
| Telephone Call your financial representative or: |
| Class F shareholders: | 1-800-645-6561 |
| All other share classes: | 1-800-554-4611 |
Mail The Dreyfus Family of Funds, 144 Glenn Curtiss Boulevard, Uniondale, NY 11556-0144
The fund files its complete schedule of portfolio holdings with the Securities and Exchange Commission (“SEC”) for the first and third quarters of each fiscal year on Form N-Q. The fund’s Forms N-Q are available on the SEC’s website at http://www.sec.gov and may be reviewed and copied at the SEC’s Public Reference Room in Washington, DC. Information on the operation of the Public Reference Room may be obtained by calling 1-800-SEC-0330.
A description of the policies and procedures that the fund uses to determine how to vote proxies relating to portfolio securities, and information regarding how the fund voted these proxies for the most recent 12-month period ended June 30 is available at http://www.dreyfus.com and on the SEC’s website at http://www.sec.gov.
The description of the policies and procedures is also available without charge, upon request, by calling 1-800-645-6561.

|
| Dreyfus |
| Mid-Cap Growth Fund |
SEMIANNUAL REPORT June 30, 2010

Save time. Save paper. View your next shareholder report online as soon as it’s available. Log into www.dreyfus.com and sign up for Dreyfus eCommunications. It’s simple and only takes a few minutes.
The views expressed in this report reflect those of the portfolio manager only through the end of the period covered and do not necessarily represent the views of Dreyfus, Founders or any other person in our organization. Any such views are subject to change at any time based upon market or other conditions and we disclaim any responsibility to update such views. These views may not be relied on as investment advice and, because investment decisions for a Dreyfus fund are based on numerous factors, may not be relied on as an indication of trading intent on behalf of any Dreyfus fund.
|
| Not FDIC-Insured • Not Bank-Guaranteed • May Lose Value |
| | Contents |
| | THE FUND |
| 2 | A Letter from the Chairman and CEO |
| 3 | Discussion of Fund Performance |
| 6 | Understanding Your Fund’s Expenses |
| 6 | Comparing Your Fund’s Expenses With Those of Other Funds |
| 7 | Statement of Investments |
| 10 | Statement of Assets and Liabilities |
| 11 | Statement of Operations |
| 12 | Statement of Changes in Net Assets |
| 14 | Financial Highlights |
| 19 | Notes to Financial Statements |
| 31 | Information About the Review and Approval of the Fund’s Investment Advisory Agreement |
| | FOR MORE INFORMATION |
| | Back Cover |
Dreyfus
Mid-Cap Growth Fund
The Fund

A LETTER FROM THE CHAIRMAN AND CEO
Dear Shareholder:
We are pleased to present this semiannual report for Dreyfus Mid-Cap Growth Fund, covering the six-month period from January 1, 2010, through June 30, 2010.
After posting solid gains over the first quarter of 2010, stocks encountered renewed volatility in the second quarter, which caused most equity indices to erase their previous gains and end the reporting period lower than where they began. The second-quarter correction occurred despite positive GDP reports, as manufacturing activity improved and unemployment began to moderate in a recovery that has so far proved sustainable but milder than historical averages. Indeed, many of the headlines that have affected investors emanated from overseas markets, including the sovereign debt crisis in Europe and inflation fears in China.
Despite recent headlines about the current state of the U.S. economy, we still believe that it is unlikely that we’ll encounter a “double-dip” recession. Instead, we expect current financial strains to ease and the domestic economy to expand at a moderate pace over the second half of the year. However, we currently see a number of downside risks across the global markets that could result in volatility over the short term, which is why we still believe that a long-term investment focus with an emphasis on high-quality stocks may be suitable for many investors. As always, your financial advisor can help you assess both the risks and opportunities provided by the global financial markets in this investment climate.
For information about how the fund performed during the reporting period, as well as general market perspectives, we provide a Discussion of Fund Performance on the pages that follow.
Thank you for your continued confidence and support.

Jonathan R. Baum
Chairman and Chief Executive Officer
The Dreyfus Corporation
July 15, 2010
2

DISCUSSION OF FUND PERFORMANCE
For the period of January 1, 2010, through June 30, 2010, as provided by B. RandallWatts, Jr., CFA, and Robert C. Zeuthen, CFA, Primary Portfolio Managers
Fund and Market Performance Overview
For the six-month period ended June 30, 2010, Dreyfus Mid-Cap Growth Fund’s Class A shares produced a total return of 4.25%, Class B shares returned 4.07%, Class C shares returned 3.83%, Class F shares returned 4.37% and Class I shares returned 4.39%.1 In comparison, the fund’s benchmark, the Russell Midcap Growth Index (the “Index”), produced a total return of –3.31% for the same period.2 Stocks encountered heightened volatility late in the reporting period when investors grew concerned regarding a number of threats to global economic growth. Unlike its benchmark, the fund produced positive absolute returns over the first half of 2010, mainl y due to successful stock selections in the technology, consumer discretionary and consumer staples sectors.
As a side note, as of March 2010, the fund’s primary portfolio managers are B. Randall Watts, Jr., CFA, and Robert C. Zeuthen, CFA.
The Fund’s Investment Approach
The fund seeks capital appreciation.The fund will normally invest at least 80% of its assets in equity securities of companies within the market capitalization range of companies comprising the Russell Midcap Growth Index. The fund also may invest in larger or smaller companies if they represent better prospects for capital appreciation.We look for companies whose fundamental strengths suggest the potential for superior earnings growth over time.We go beyond Wall Street analysis and perform intensive qualitative and quantitative in-house research to determine whether companies meet our investment criteria.
Global Economic Concerns Derailed Market Rally
The year 2010 began in the midst of an economic recovery as improved manufacturing activity, an apparent bottoming of residential housing prices and modest employment gains helped boost confidence among investors. Later in the reporting period, however, several developments threatened the economic rebound. Europe was roiled by a sovereign debt
DISCUSSION OF FUND PERFORMANCE (continued)
crisis when Greece found itself unable to finance a heavy debt burden. Robust economic growth in China, one of the primary engines of the global economic recovery, seemed to spark inflationary pressures, and investors worried that remedial measures might dampen Asian growth. In the United States, mixed data regarding unemployment, retail sales and housing markets suggested that economic headwinds might constrain already mild growth.
These factors derailed a market rally that had driven U.S. stock prices higher through April. As investor sentiment deteriorated in May and June, stocks generally gave back all of the reporting period’s previous gains, ending the first six months of 2010 with moderate losses. Midcap stocks generally fared better over the reporting period than their large-cap counterparts.
Security Selections Bolstered Relative Performance
In the early stages of the economic recovery, we found opportunities across a variety of market sectors to invest in growing midcap companies at attractive prices.As a result, during the first half of 2010, a number of strong performers enabled the fund to participate in the early rally, and cushion the effects of the subsequent market correction.
Among technology stocks, Internet software and services company Baidu benefited from Google’s exit from the Chinese search engine market. Broadband enabler Akamai Technologies responded to rising demand for the bandwidth required for streaming video, including viewers tuning in to the World Cup. Audio systems specialist Dolby Laboratories encountered increasing adoption of high-definition entertainment technologies.
In the consumer discretionary sector, DVD rental company NetFlix achieved growth with on-demand services provided through third-party platforms, complementing its traditional by-mail delivery service. The fund benefited from fortunate timing in the sale of discount travel services provider Priceline.com, which declined sharply soon after its elimination from the portfolio.
In the consumer staples sector, beverages producer Dr. Pepper Snapple Group gained value after it expanded distribution and boosted its dividend. Additionally, Mead Johnson Nutrition experienced strong growth in the emerging markets.
Disappointments during the reporting period were concentrated in the energy sector, where softer commodity prices, the catastrophic oil spill
4
in the Gulf of Mexico and an oversupply of natural gas dampened results from Consol Energy, Southwestern Energy and Plains Exploration
& Production Company. In the industrials sector, oil-rig equipment provider Flowserve was also hurt by the consequences of the oil spill.
Positioned for a Mild Recovery
Although we are concerned regarding recent economic and market setbacks, we believe a return to recession is unlikely. Indeed, as of the reporting period’s end, we have continued to find growth opportunities in the technology sector, where demand for business productivity enhancements has remained strong.A mildly overweighted position in the health care sector reflects a focus on fundamentals after the passage of health care reform legislation, which we expect to benefit some companies and hurt others.We have found fewer opportunities in the consumer discretionary sector, where economic headwinds could curb consumer spending. In our view, these strategies position the fund for a continued, albeit subpar, economic recovery in the United States and around the world.
July 15, 2010
Please note, the position in any security highlighted with italicized typeface was sold during the reporting period.
Equity funds are subject generally to market, market sector, market liquidity, issuer and investment style risks, among other factors, to varying degrees, all of which are more fully described in the fund’s prospectus.
Midsize companies carry additional risks because their earnings and revenues tend to be less predictable and their share prices more volatile than those of larger, more established companies. The shares of midsize companies tend to trade less frequently than those of larger, more established companies.
| |
| 1 | Total return includes reinvestment of dividends and any capital gains paid, and does not take into |
| | consideration the maximum initial sales charges in the case of Class A shares, or the applicable |
| | contingent deferred sales charges imposed on redemptions in the case of Class B and Class C |
| | shares. Had these charges been reflected, returns would have been lower. Past performance is no |
| | guarantee of future results. Share price and investment return fluctuate such that upon redemption, |
| | fund shares may be worth more or less than their original cost. Return figures provided reflect the |
| | absorption of certain fund expenses by The Dreyfus Corporation pursuant to an agreement |
| | through October 31, 2010, at which time it may be extended, terminated or modified. Had these |
| | expenses not been absorbed, the fund’s returns would have been lower. |
| 2 | SOURCE: LIPPER INC. — The Russell Midcap Growth Index measures the performance of |
| | the 800 smallest companies in the Russell 1000 Index with higher price-to-book ratios and |
| | higher forecasted growth values.The total return figure cited for this index assumes change in |
| | security prices and reinvestment of dividends, but does not reflect the costs of managing a mutual |
| | fund.The Russell 1000 Index measures the performance of the largest 1,000 publicly traded |
| | U.S. companies. Investors cannot invest directly in any index. |
UNDERSTANDING YOUR FUND’S EXPENSES (Unaudited)
As a mutual fund investor, you pay ongoing expenses, such as management fees and other expenses. Using the information below, you can estimate how these expenses affect your investment and compare them with the expenses of other funds.You also may pay one-time transaction expenses, including sales charges (loads) and redemption fees, which are not shown in this section and would have resulted in higher total expenses. For more information, see your fund’s prospectus or talk to your financial adviser.
Review your fund’s expenses
The table below shows the expenses you would have paid on a $1,000 investment in Dreyfus Mid-Cap Growth Fund from January 1, 2010 to June 30, 2010. It also shows how much a $1,000 investment would be worth at the close of the period, assuming actual returns and expenses.
Expenses and Value of a $1,000 Investment
assuming actual returns for the six months ended June 30, 2010
| | | | | |
| | Class A | Class B | Class C | Class F | Class I |
| Expenses paid per $1,000† | $ 7.09 | $ 10.52 | $ 10.82 | $ 6.64 | $ 5.83 |
| Ending value (after expenses) | $1,042.50 | $1,040.70 | $1,038.30 | $1,043.70 | $1,043.90 |
COMPARING YOUR FUND’S EXPENSES
WITH THOSE OF OTHER FUNDS (Unaudited)
Using the SEC’s method to compare expenses
The Securities and Exchange Commission (SEC) has established guidelines to help investors assess fund expenses. Per these guidelines, the table below shows your fund’s expenses based on a $1,000 investment, assuming a hypothetical 5% annualized return. You can use this information to compare the ongoing expenses (but not transaction expenses or total cost) of investing in the fund with those of other funds.All mutual fund shareholder reports will provide this information to help you make this comparison. Please note that you cannot use this information to estimate your actual ending account balance and expenses paid during the period.
Expenses and Value of a $1,000 Investment
assuming a hypothetical 5% annualized return for the six months ended June 30, 2010
| | | | | |
| | Class A | Class B | Class C | Class F | Class I |
| Expenses paid per $1,000† | $ 7.00 | $ 10.39 | $ 10.69 | $ 6.56 | $ 5.76 |
| Ending value (after expenses) | $1,017.85 | $1,014.48 | $1,014.18 | $1,018.30 | $1,019.09 |
|
| † Expenses are equal to the fund’s annualized expense ratio of 1.40% for Class A, 2.08% for Class B, 2.14% for |
| Class C, 1.31% for Class F and 1.15% for Class I, multiplied by the average account value over the period, |
| multiplied by 181/365 (to reflect the one-half year period). |
6
|
| STATEMENT OF INVESTMENTS |
| June 30, 2010 (Unaudited) |
| | |
| Common Stocks—97.2% | Shares | Value ($) |
| Consumer Discretionary—13.9% | | |
| Aeropostale | 88,340 a | 2,530,058 |
| Bed Bath & Beyond | 44,130 a | 1,636,340 |
| Chipotle Mexican Grill | 16,190 a | 2,214,954 |
| Estee Lauder, Cl. A | 31,960 | 1,781,131 |
| International Game Technology | 121,670 | 1,910,219 |
| Marriott International, Cl. A | 78,340 | 2,345,500 |
| Williams-Sonoma | 74,530 | 1,849,835 |
| WMS Industries | 40,380 a | 1,584,915 |
| | | 15,852,952 |
| Consumer Staples—8.4% | | |
| Clorox | 36,960 | 2,297,434 |
| Dr. Pepper Snapple Group | 55,200 | 2,063,928 |
| Hansen Natural | 73,200 a | 2,862,852 |
| Mead Johnson Nutrition | 46,350 | 2,323,062 |
| | | 9,547,276 |
| Energy—4.2% | | |
| Consol Energy | 60,000 | 2,025,600 |
| Continental Resources | 62,630 a | 2,794,551 |
| | | 4,820,151 |
| Exchange Traded Funds—2.6% | | |
| IShares Russell 2000 Index Fund | 68,260 | 2,982,962 |
| Financial—6.8% | | |
| IntercontinentalExchange | 19,490 a | 2,202,955 |
| KeyCorp | 291,020 | 2,237,944 |
| New York Community Bancorp | 113,460 | 1,732,534 |
| Och-Ziff Capital Management Group, Cl. A | 131,880 | 1,660,369 |
| | | 7,833,802 |
| Health Care—14.9% | | |
| Alexion Pharmaceuticals | 34,920 a | 1,787,555 |
| Allscripts-Misys Healthcare Solutions | 97,440 a,b | 1,568,784 |
| AmerisourceBergen | 85,790 | 2,723,832 |
| IDEXX Laboratories | 37,930 a,b | 2,309,937 |
| Illumina | 46,900 a,b | 2,041,557 |
| Patterson | 60,460 | 1,724,924 |
| Sirona Dental Systems | 19,890 a | 692,968 |
| Universal Health Services, Cl. B | 47,060 | 1,795,339 |
STATEMENT OF INVESTMENTS (Unaudited) (continued)
| | |
| Common Stocks (continued) | Shares | Value ($) |
| Health Care (continued) | | |
| Varian Medical Systems | 45,800 a | 2,394,424 |
| | | 17,039,320 |
| Industrials—15.5% | | |
| Aecom Technology | 75,284 a | 1,736,049 |
| AMETEK | 45,730 | 1,836,059 |
| Flowserve | 26,670 | 2,261,616 |
| IDEX | 57,910 | 1,654,489 |
| Jacobs Engineering Group | 44,590 a | 1,624,860 |
| Landstar System | 43,070 | 1,679,299 |
| Pall | 48,400 | 1,663,508 |
| Roper Industries | 52,970 | 2,964,201 |
| Stericycle | 35,090 a | 2,301,202 |
| | | 17,721,283 |
| Information Technology—25.3% | | |
| Akamai Technologies | 55,470 a,b | 2,250,418 |
| Analog Devices | 62,630 | 1,744,872 |
| Baidu, ADR | 30,500 a | 2,076,440 |
| BMC Software | 47,600 a | 1,648,388 |
| Broadcom, Cl. A | 94,200 | 3,105,774 |
| Cognizant Technology Solutions, Cl. A | 40,000 a | 2,002,400 |
| Dolby Laboratories, Cl. A | 34,830 a | 2,183,493 |
| FactSet Research Systems | 38,000 | 2,545,620 |
| Harris | 51,590 | 2,148,723 |
| Marvell Technology Group | 117,070 a | 1,845,023 |
| Salesforce.com | 21,670 a | 1,859,719 |
| Shanda Interactive Entertainment, ADR | 52,000 a,b | 2,062,840 |
| Teradata | 54,680 a | 1,666,646 |
| VeriSign | 65,070 a | 1,727,608 |
| | | 28,867,964 |
| Materials—1.8% | | |
| Titanium Metals | 119,550 a | 2,102,884 |
| Telecommunication Services—3.8% | | |
| American Tower, Cl. A | 45,770 a | 2,036,765 |
| Sprint Nextel | 539,300 a | 2,286,632 |
| | | 4,323,397 |
| Total Common Stocks | | |
| (cost $104,945,562) | | 111,091,991 |
8
| | |
| Other Investment—3.3% | Shares | Value ($) |
| Registered Investment Company; | | |
| Dreyfus Institutional Preferred | | |
| Plus Money Market Fund | | |
| (cost $3,776,000) | 3,776,000 c | 3,776,000 |
| |
| Investment of Cash Collateral | | |
| for Securities Loaned—6.6% | | |
| Registered Investment Company; | | |
| Dreyfus Institutional Cash Advantage Fund | | |
| (cost $7,518,332) | 7,518,332 c | 7,518,332 |
| |
| Total Investments (cost $116,239,894) | 107.1% | 122,386,323 |
| Liabilities, Less Cash and Receivables | (7.1%) | (8,172,047) |
| Net Assets | 100.0% | 114,214,276 |
|
| ADR—American Depository Receipts |
| a Non-income producing security. |
| b Security, or portion thereof, on loan.At June 30, 2010, the total market value of the fund’s securities on loan is |
| $6,476,139 and the total market value of the collateral held by the fund is $7,518,332. |
| c Investment in affiliated money market mutual fund. |
| | | |
| Portfolio Summary (Unaudited)† | | |
| |
| | Value (%) | | Value (%) |
| Information Technology | 25.3 | Financial | 6.8 |
| Industrials | 15.5 | Energy | 4.2 |
| Health Care | 14.9 | Telecommunication Services | 3.8 |
| Consumer Discretionary | 13.9 | Exchange Traded Funds | 2.6 |
| Money Market Investments | 9.9 | Materials | 1.8 |
| Consumer Staples | 8.4 | | 107.1 |
| |
| † Based on net assets. | | | |
| See notes to financial statements. | | | |
|
| STATEMENT OF ASSETS AND LIABILITIES |
| June 30, 2010 (Unaudited) |
| | | | | |
| | | | | Cost | Value |
| Assets ($): | | | | | |
| Investments in securities—See Statement of Investments (including | | |
| securities on loan, valued at $6,476,139)—Note 1(b): | | | |
| Unaffiliated issuers | | | 104,945,562 | 111,091,991 |
| Affiliated issuers | | | | 11,294,332 | 11,294,332 |
| Receivable for investment securities sold | | | | 5,637,357 |
| Dividends and interest receivable | | | | 65,439 |
| Receivable for shares of Common Stock subscribed | | | 47,316 |
| Prepaid expenses | | | | | 37,467 |
| | | | | | 128,173,902 |
| Liabilities ($): | | | | | |
| Due to The Dreyfus Corporation and affiliates—Note 3(c) | | | 161,396 |
| Cash overdraft due to Custodian | | | | 680,897 |
| Liability for securities on loan—Note 1(b) | | | | 7,518,332 |
| Payable for investment securities purchased | | | | 5,390,728 |
| Payable for shares of Common Stock redeemed | | | 111,460 |
| Accrued expenses | | | | | 96,813 |
| | | | | | 13,959,626 |
| Net Assets ($) | | | | | 114,214,276 |
| Composition of Net Assets ($): | | | | |
| Paid-in capital | | | | | 190,204,517 |
| Accumulated Investment (loss)—net | | | | (441,263) |
| Accumulated net realized gain (loss) on investments | | | (81,695,407) |
| Accumulated net unrealized appreciation | | | | |
| (depreciation) on investments | | | | 6,146,429 |
| Net Assets ($) | | | | | 114,214,276 |
| |
| |
| Net Asset Value Per Share | | | | |
| | Class A | Class B | Class C | Class F | Class I |
| Net Assets ($) | 20,669,618 | 430,080 | 10,434,024 | 78,173,670 | 4,506,884 |
| Shares Outstanding | 4,953,893 | 112,131 | 2,747,480 | 18,184,649 | 1,054,004 |
| Net Asset Value | | | | | |
| Per Share ($) | 4.17 | 3.84 | 3.80 | 4.30 | 4.28 |
| |
| See notes to financial statements. | | | | | |
10
|
| STATEMENT OF OPERATIONS |
| Six Months Ended June 30, 2010 (Unaudited) |
| |
| Investment Income ($): | |
| Income: | |
| Cash dividends: | |
| Unaffiliated issuers | 360,697 |
| Affiliated issuers | 2,438 |
| Income from securities lending—Note 1(b) | 30,790 |
| Total Income | 393,925 |
| Expenses: | |
| Investment advisory fee—Note 3(a) | 485,008 |
| Shareholder servicing costs—Note 3(c) | 179,462 |
| Prospectus and shareholders’ reports | 76,681 |
| Distribution fees—Note 3(b) | 73,078 |
| Accounting fees—Note 3(c) | 35,831 |
| Registration fees | 23,219 |
| Directors’ fees and expenses—Note 3(d) | 5,039 |
| Professional fees | 3,871 |
| Custodian fees—Note 3(c) | 1,447 |
| Total Expenses | 883,636 |
| Less—reduction in investment advisory fee | |
| due to undertaking—Note 3(a) | (48,017) |
| Less—reduction in fees due to earnings credits—Note 1(b) | (431) |
| Net Expenses | 835,188 |
| Investment (Loss)—Net | (441,263) |
| Realized and Unrealized Gain (Loss) on Investments—Note 4 ($): | |
| Net realized gain (loss) on investments | 16,284,623 |
| Net unrealized appreciation (depreciation) on investments | (10,760,130) |
| Net Realized and Unrealized Gain (Loss) on Investments | 5,524,493 |
| Net Increase in Net Assets Resulting from Operations | 5,083,230 |
| |
| See notes to financial statements. | |
STATEMENT OF CHANGES IN NET ASSETS
| | |
| | Six Months Ended | |
| | June 30, 2010 | Year Ended |
| | (Unaudited) | December 31, 2009a |
| Operations ($): | | |
| Investment (loss)—net | (441,263) | (817,177) |
| Net realized gain (loss) on investments | 16,284,623 | (43,666,398) |
| Net unrealized appreciation | | |
| (depreciation) on investments | (10,760,130) | 71,449,490 |
| Net Increase (Decrease) in Net Assets | | |
| Resulting from Operations | 5,083,230 | 26,965,915 |
| Capital Stock Transactions ($): | | |
| Net proceeds from shares sold: | | |
| Class A Shares | 3,932,183 | 6,489,918 |
| Class B Shares | 88,577 | 2,998 |
| Class C Shares | 450,832 | 527,471 |
| Class F Shares | 4,590,977 | 1,696,620 |
| Class I Shares | 1,452,686 | 1,376,339 |
| Class T Shares | — | 18,200 |
| Cost of shares redeemed: | | |
| Class A Shares | (7,799,104) | (18,663,153) |
| Class B Shares | (237,764) | (293,334) |
| Class C Shares | (2,185,748) | (5,469,772) |
| Class F Shares | (7,956,772) | (16,013,985) |
| Class I Shares | (1,205,662) | (2,025,820) |
| Class T Shares | — | (972,785) |
| Increase (Decrease) in Net Assets | | |
| from Capital Stock Transactions | (8,869,795) | (33,327,303) |
| Total Increase (Decrease) in Net Assets | (3,786,565) | (6,361,388) |
| Net Assets ($): | | |
| Beginning of Period | 118,000,841 | 124,362,229 |
| End of Period | 114,214,276 | 118,000,841 |
| Accumulated investment (loss)—net | (441,263) | — |
12
| | |
| | Six Months Ended | |
| | June 30, 2010 | Year Ended |
| | (Unaudited) | December 31, 2009a |
| Capital Share Transactions: | | |
| Class Ab,c | | |
| Shares sold | 888,122 | 1,961,128 |
| Shares redeemed | (1,793,686) | (5,403,462) |
| Net Increase (Decrease) in Shares Outstanding | (905,564) | (3,442,334) |
| Class Bb | | |
| Shares sold | 21,044 | 1,177 |
| Shares redeemed | (60,334) | (96,448) |
| Net Increase (Decrease) in Shares Outstanding | (39,290) | (95,271) |
| Class C | | |
| Shares sold | 112,142 | 169,408 |
| Shares redeemed | (559,014) | (1,773,198) |
| Net Increase (Decrease) in Shares Outstanding | (446,872) | (1,603,790) |
| Class F | | |
| Shares sold | 991,854 | 489,863 |
| Shares redeemed | (1,786,402) | (4,609,615) |
| Net Increase (Decrease) in Shares Outstanding | (794,548) | (4,119,752) |
| Class I | | |
| Shares sold | 324,089 | 375,603 |
| Shares redeemed | (270,446) | (563,472) |
| Net Increase (Decrease) in Shares Outstanding | 53,643 | (187,869) |
| Class Tc | | |
| Shares sold | — | 6,416 |
| Shares redeemed | — | (346,191) |
| Net Increase (Decrease) in Shares Outstanding | — | (339,755) |
|
| a Effective as of the close of business on February 4, 2009, the fund no longer offers Class T shares. |
| b During the period ended June 30, 2010, 7,287 Class B shares representing $28,879, were automatically converted |
| to 6,703 Class A shares and during the period ended December 31, 2009, 8,986 Class B shares representing |
| $27,399 were automatically converted to 8,348 Class A shares. |
| c On the close of business on February 4, 2009, 335,018 Class T shares representing $941,401 were converted to |
| 311,722 Class A shares. |
See notes to financial statements.
FINANCIAL HIGHLIGHTS
The following tables describe the performance for each share class for the fiscal periods indicated. All information (except portfolio turnover rate) reflects financial results for a single fund share.Total return shows how much your investment in the fund would have increased (or decreased) during each period, assuming you had reinvested all dividends and distributions.These figures have been derived from the fund’s financial statements.
| | | | | | |
| Six Months Ended | | | | | |
| June 30, 2010 | | Year Ended December 31, | |
| Class A Shares | (Unaudited) | 2009† | 2008 | 2007 | 2006 | 2005 |
| Per Share Data ($): | | | | | | |
| Net asset value, | | | | | | |
| beginning of period | 4.00 | 3.17 | 6.28 | 5.80 | 4.68 | 4.15 |
| Investment Operations: | | | | | | |
| Investment (loss)—net | (.02)a | (.03)a | (.05)a | (.02)a | (.04)a | (.05) |
| Net realized and unrealized | | | | | | |
| gain (loss) on investments | .19 | .86 | (3.06) | .76 | 1.16 | .58 |
| Total from Investment Operations | .17 | .83 | (3.11) | .74 | 1.12 | .53 |
| Distributions: | | | | | | |
| Dividends from net realized | | | | | | |
| gain on investments | — | — | — | (.26) | — | — |
| Net asset value, end of period | 4.17 | 4.00 | 3.17 | 6.28 | 5.80 | 4.68 |
| Total Return (%)b | 4.25c | 26.18 | (49.52) | 12.77 | 23.93 | 12.77 |
| Ratios/Supplemental Data (%): | | | | | | |
| Ratio of total expenses | | | | | | |
| to average net assets | 1.60d | 1.77 | 1.45 | 1.43 | 1.40 | 1.58 |
| Ratio of net expenses | | | | | | |
| to average net assets | 1.40d | 1.75 | 1.44 | 1.43e | 1.39 | 1.55 |
| Ratio of net investment (loss) | | | | | | |
| to average net assets | (.74)d | (.86) | (.89) | (.32) | (.68) | (.92) |
| Portfolio Turnover Rate | 94.47c | 59.66 | 119 | 165 | 104 | 211 |
| Net Assets, end of period | | | | | | |
| ($ x 1,000) | 20,670 | 23,448 | 29,525 | 97,331 | 21,146 | 1,656 |
|
| † Effective September 1, 2009,The Dreyfus Corporation replaced Founders Asset Management LLC as the fund’s |
| investment adviser. |
| a Based on average shares outstanding at each month end. |
| b Exclusive of sales charge. |
| c Not annualized. |
| d Annualized. |
| e Expense waivers and/or reimbursements amounted to less than .01%. |
See notes to financial statements.
14
| | | | | | |
| Six Months Ended | | | | | |
| June 30, 2010 | | Year Ended December 31, | |
| Class B Shares | (Unaudited) | 2009† | 2008 | 2007 | 2006 | 2005 |
| Per Share Data ($): | | | | | | |
| Net asset value, | | | | | | |
| beginning of period | 3.69 | 2.96 | 5.89 | 5.50 | 4.48 | 4.01 |
| Investment Operations: | | | | | | |
| Investment (loss)—net | (.03)a | (.06)a | (.08)a | (.06)a | (.08)a | (.09) |
| Net realized and unrealized | | | | | | |
| gain (loss) on investments | .18 | .79 | (2.85) | .71 | 1.10 | .56 |
| Total from Investment Operations | .15 | .73 | (2.93) | .65 | 1.02 | .47 |
| Distributions: | | | | | | |
| Dividends from net realized | | | | | | |
| gain on investments | — | — | — | (.26) | — | — |
| Net asset value, end of period | 3.84 | 3.69 | 2.96 | 5.89 | 5.50 | 4.48 |
| Total Return (%)b | 4.07c | 24.66 | (49.75) | 11.84 | 22.77 | 11.72 |
| Ratios/Supplemental Data (%): | | | | | | |
| Ratio of total expenses | | | | | | |
| to average net assets | 2.51d | 2.68 | 2.21 | 2.26 | 2.29 | 2.43 |
| Ratio of net expenses | | | | | | |
| to average net assets | 2.08d | 2.66 | 2.20 | 2.26e | 2.29 | 2.41 |
| Ratio of net investment (loss) | | | | | | |
| to average net assets | (1.43)d | (1.77) | (1.66) | (1.02) | (1.60) | (1.78) |
| Portfolio Turnover Rate | 94.47c | 59.66 | 119 | 165 | 104 | 211 |
| Net Assets, end of period | | | | | | |
| ($ x 1,000) | 430 | 559 | 729 | 2,200 | 1,929 | 1,886 |
|
| † Effective September 1, 2009,The Dreyfus Corporation replaced Founders Asset Management LLC as the fund’s |
| investment adviser. |
| a Based on average shares outstanding at each month end. |
| b Exclusive of sales charge. |
| c Not annualized. |
| d Annualized. |
| e Expense waivers and/or reimbursements amounted to less than .01%. |
See notes to financial statements.
FINANCIAL HIGHLIGHTS (continued)
| | | | | | |
| Six Months Ended | | | | | |
| June 30, 2010 | | Year Ended December 31, | |
| Class C Shares | (Unaudited) | 2009† | 2008 | 2007 | 2006 | 2005 |
| Per Share Data ($): | | | | | | |
| Net asset value, | | | | | | |
| beginning of period | 3.66 | 2.92 | 5.83 | 5.44 | 4.42 | 3.96 |
| Investment Operations: | | | | | | |
| Investment (loss)—net | (.03)a | (.05)a | (.08)a | (.06)a | (.06)a | (.02) |
| Net realized and unrealized | | | | | | |
| gain (loss) on investments | .17 | .79 | (2.83) | .71 | 1.08 | .48 |
| Total from Investment Operations | .14 | .74 | (2.91) | .65 | 1.02 | .46 |
| Distributions: | | | | | | |
| Dividends from net realized | | | | | | |
| gain on investments | — | — | — | (.26) | — | — |
| Net asset value, end of period | 3.80 | 3.66 | 2.92 | 5.83 | 5.44 | 4.42 |
| Total Return (%)b | 3.83c | 25.34 | (49.91) | 11.96 | 23.08 | 11.62 |
| Ratios/Supplemental Data (%): | | | | | | |
| Ratio of total expenses | | | | | | |
| to average net assets | 2.37d | 2.61 | 2.20 | 2.13 | 2.19 | 2.35 |
| Ratio of net expenses | | | | | | |
| to average net assets | 2.14d | 2.60 | 2.19 | 2.13e | 2.18 | 2.32 |
| Ratio of net investment (loss) | | | | | | |
| to average net assets | (1.48)d | (1.70) | (1.65) | (1.04) | (1.27) | (1.69) |
| Portfolio Turnover Rate | 94.47c | 59.66 | 119 | 165 | 104 | 211 |
| Net Assets, end of period | | | | | | |
| ($ x 1,000) | 10,434 | 11,678 | 14,033 | 43,825 | 9,641 | 550 |
|
| † Effective September 1, 2009,The Dreyfus Corporation replaced Founders Asset Management LLC as the fund’s |
| investment adviser. |
| a Based on average shares outstanding at each month end. |
| b Exclusive of sales charge. |
| c Not annualized. |
| d Annualized. |
| e Expense waivers and/or reimbursements amounted to less than .01%. |
See notes to financial statements.
16
| | | | | | |
| Six Months Ended | | | | | |
| June 30, 2010 | | Year Ended December 31, | |
| Class F Shares | (Unaudited) | 2009† | 2008 | 2007 | 2006 | 2005 |
| Per Share Data ($): | | | | | | |
| Net asset value, | | | | | | |
| beginning of period | 4.12 | 3.26 | 6.43 | 5.92 | 4.78 | 4.24 |
| Investment Operations: | | | | | | |
| Investment (loss)—net | (.01)a | (.02)a | (.04)a | (.00)a,b | (.03)a | (.12) |
| Net realized and unrealized | | | | | | |
| gain (loss) on investments | .19 | .88 | (3.13) | .77 | 1.17 | .66 |
| Total from Investment Operations | .18 | .86 | (3.17) | .77 | 1.14 | .54 |
| Distributions: | | | | | | |
| Dividends from net realized | | | | | | |
| gain on investments | — | — | — | (.26) | — | — |
| Net asset value, end of period | 4.30 | 4.12 | 3.26 | 6.43 | 5.92 | 4.78 |
| Total Return (%) | 4.37c | 26.38 | (49.30) | 13.03 | 23.85 | 12.74 |
| Ratios/Supplemental Data (%): | | | | | | |
| Ratio of total expenses | | | | | | |
| to average net assets | 1.32d | 1.38 | 1.23 | 1.30 | 1.33 | 1.41 |
| Ratio of net expenses | | | | | | |
| to average net assets | 1.31d | 1.36 | 1.22 | 1.30e | 1.33 | 1.39 |
| Ratio of net investment (loss) | | | | | | |
| to average net assets | (.64)d | (.47) | (.68) | (.03) | (.62) | (.77) |
| Portfolio Turnover Rate | 94.47c | 59.66 | 119 | 165 | 104 | 211 |
| Net Assets, end of period | | | | | | |
| ($ x 1,000) | 78,174 | 78,218 | 75,224 | 182,336 147,410 | 110,170 |
|
| † Effective September 1, 2009,The Dreyfus Corporation replaced Founders Asset Management LLC as the fund’s |
| investment adviser. |
| a Based on average shares outstanding at each month end. |
| b Amount represents less than $.01 per share. |
| c Not annualized. |
| d Annualized. |
| e Expense waivers and/or reimbursements amounted to less than .01%. |
See notes to financial statements.
FINANCIAL HIGHLIGHTS (continued)
| | | | | | |
| Six Months Ended | | | | | |
| June 30, 2010 | | Year Ended December 31, | |
| Class I Shares | (Unaudited) | 2009† | 2008 | 2007a | 2006 | 2005 |
| Per Share Data ($): | | | | | | |
| Net asset value, | | | | | | |
| beginning of period | 4.10 | 3.24 | 6.39 | 5.88 | 4.73 | 4.19 |
| Investment Operations: | | | | | | |
| Investment income (loss)—net | (.01)b | (.02)b | (.03)b | .00b,c | (.02)b | (.02) |
| Net realized and unrealized | | | | | | |
| gain (loss) on investments | .19 | .88 | (3.12) | .77 | 1.17 | .56 |
| Total from Investment Operations | .18 | .86 | (3.15) | .77 | 1.15 | .54 |
| Distributions: | | | | | | |
| Dividends from net realized | | | | | | |
| gain on investments | — | — | — | (.26) | — | — |
| Net asset value, end of period | 4.28 | 4.10 | 3.24 | 6.39 | 5.88 | 4.73 |
| Total Return (%) | 4.39d | 26.54 | (49.30) | 13.11 | 24.31 | 12.89 |
| Ratios/Supplemental Data (%): | | | | | | |
| Ratio of total expenses | | | | | | |
| to average net assets | 1.41e | 1.49 | 1.20 | 1.12 | 1.14 | 1.38 |
| Ratio of net expenses | | | | | | |
| to average net assets | 1.15e | 1.47 | 1.19 | 1.11 | 1.12 | 1.34 |
| Ratio of net investment income | | | | | | |
| (loss) to average net assets | (.48)e | (.58) | (.65) | .06 | (.28) | (.70) |
| Portfolio Turnover Rate | 94.47d | 59.66 | 119 | 165 | 104 | 211 |
| Net Assets, end of period | | | | | | |
| ($ x 1,000) | 4,507 | 4,098 | 3,849 | 10,266 | 4,279 | 297 |
|
| † Effective September 1, 2009,The Dreyfus Corporation replaced Founders Asset Management LLC as the fund’s |
| investment adviser. |
| a Effective June 1, 2007, Class R shares were redesignated as Class I shares. |
| b Based on average shares outstanding at each month end. |
| c Amount represents less than $.01 per share. |
| d Not annualized. |
| e Annualized. |
See notes to financial statements.
18
NOTES TO FINANCIAL STATEMENTS (Unaudited)
NOTE 1—Significant Accounting Policies:
Dreyfus Mid-Cap Growth Fund (the “fund”) is a separate diversified series of Dreyfus Funds, Inc. (the “Company”), which is registered under the Investment Company Act of 1940, as amended (the “Act”), as an open-end management investment company and operates as a series company currently offering two series, including the fund.The fund’s investment objective seeks capital appreciation through investments in mid-cap growth companies. The Dreyfus Corporation (the “Manager” or “Dreyfus”), a wholly-owned subsidiary of The Bank of New York Mellon Corporation (‘BNY Mellon”), serves as the fund’s investment adviser.
MBSC Securities Corporation (the “Distributor”), a wholly-owned subsidiary of the Manager, is the distributor of the fund’s shares. The fund is authorized to issue 1.05 billion shares of $.001 par value Common Stock.The fund currently offers five classes of shares: Class A (300 million shares authorized), Class B (50 million shares authorized), Class C (100 million shares authorized), Class F (500 million shares authorized) and Class I (100 million shares authorized). Class A shares are subject to a sales charge imposed at the time of purchase. Class B shares are subject to a contingent deferred sales charge (“CDSC”) imposed on Class B share redemptions made within six years of purchase and automatically convert to Class A shares after six years. The fund does not offer Class B shares, except in connection with dividend reinvestment and permitted exchanges of Class B shares. Class C shares are subject t o a CDSC imposed on Class C shares redeemed within one year of purchase. Class F and Class I shares are sold at net asset value per share. Class F shares are sold only to Class F grandfathered investors, and Class I shares are sold only to institutional investors. Other differences between the classes include the services offered to and the expenses borne by each class, the allocation of certain transfer agency costs and certain voting rights. Income, expenses (other than expenses attributable to a specific class), and realized and unrealized gains or losses on investments are allocated to each class of shares based on its relative net assets.
NOTES TO FINANCIAL STATEMENTS (Unaudited) (continued)
The Company accounts separately for the assets, liabilities and operations of each series. Expenses directly attributable to each series are charged to that series’ operations; expenses which are applicable to all series are allocated among them on a pro rata basis.
The Financial Accounting Standards Board (“FASB”) Accounting Standards Codification (“ASC”) is the exclusive reference of authoritative U.S. generally accepted accounting principles (“GAAP”) recognized by the FASB to be applied by nongovernmental entities.Rules and interpretive releases of the Securities and Exchange Commission (“SEC”) under authority of federal laws are also sources of authoritative GAAP for SEC registrants. The fund’s financial statements are prepared in accordance with GAAP, which may require the use of management estimates and assumptions.Actual results could differ from those estimates.
The Company enters into contracts that contain a variety of indemnifications. The fund’s maximum exposure under these arrangements is unknown.The fund does not anticipate recognizing any loss related to these arrangements.
(a) Portfolio valuation: Investments in securities are valued at the last sales price on the securities exchange or national securities market on which such securities are primarily traded. Securities listed on the National Market System for which market quotations are available are valued at the official closing price or, if there is no official closing price that day, at the last sales price. Securities not listed on an exchange or the national securities market, or securities for which there were no transactions, are valued at the average of the most recent bid and asked prices, except for open short positions, where the asked price is used for valuation purposes. Bid price is used when no asked price is available. Registered investment companies that are not traded on an exchange are valued at their net asset value.When market quotations
20
or official closing prices are not readily available, or are determined not to reflect accurately fair value, such as when the value of a security has been significantly affected by events after the close of the exchange or market on which the security is principally traded (for example, a foreign exchange or market), but before the fund calculates its net asset value, the fund may value these investments at fair value as determined in accordance with the procedures approved by the Board of Directors. Fair valuing of securities may be determined with the assistance of a pricing service using calculations based on indices of domestic securities and other appropriate indicators, such as prices of relevant ADRs and futures contracts. For other securities that are fair valued by the Board of Directors, certain factors may be considered such as: fundamental analytical data, the nature and duration of restrictions on disposition, an evaluation of the forces that influence the market in which the securities are purchased and sold, and public trading in similar securities of the issuer or comparable issuers.
The fair value of a financial instrument is the amount that would be received to sell an asset or paid to transfer a liability in an orderly transaction between market participants at the measurement date (i.e. the exit price). GAAP establishes a fair value hierarchy that prioritizes the inputs of valuation techniques used to measure fair value.This hierarchy gives the highest priority to unadjusted quoted prices in active markets for identical assets or liabilities (Level 1 measurements) and the lowest priority to unobservable inputs (Level 3 measurements).
Additionally, GAAP provides guidance on determining whether the volume and activity in a market has decreased significantly and whether such a decrease in activity results in transactions that are not orderly. GAAP requires enhanced disclosures around valuation inputs and techniques used during annual and interim periods.
NOTES TO FINANCIAL STATEMENTS (Unaudited) (continued)
Various inputs are used in determining the value of the fund’s investments relating to fair value measurements.These inputs are summarized in the three broad levels listed below:
Level 1—unadjusted quoted prices in active markets for
identical investments.
Level 2—other significant observable inputs (including quoted
prices for similar investments, interest rates, prepayment speeds,
credit risk, etc.).
Level 3—significant unobservable inputs (including the fund’s own
assumptions in determining the fair value of investments).
The inputs or methodology used for valuing securities are not necessarily an indication of the risk associated with investing in those securities.
The following is a summary of the inputs used as of June 30, 2010 in valuing the fund’s investments:
| | | | |
| | | Level 2—Other | Level 3— | |
| | Level 1— | Significant | Significant | |
| | Unadjusted | Observable | Unobservable | |
| | Quoted Prices | Inputs | Inputs | Total |
| Assets ($) | | | | |
| Investments in Securities: | | | |
| Equity Securities— | | | | |
| Domestic† | 103,969,749 | — | — | 103,969,749 |
| Equity Securities— | | | | |
| Foreign† | 4,139,280 | — | — | 4,139,280 |
| Mutual Funds/ | | | | |
| Exchange Traded | | | | |
| Funds | 14,277,294 | — | — | 14,277,294 |
| |
| † | See Statement of Investments for industry classification. |
In January 2010, FASB issued Accounting Standards Update (“ASU”) No. 2010-06 “Improving Disclosures about FairValue Measurements”. The portions of ASU No. 2010-06 which require reporting entities to prepare new disclosures surrounding amounts and reasons for significant transfers in and out of Level 1 and Level 2 fair value measurements as well as inputs and valuation techniques used to measure fair value for both recurring and nonrecurring fair value measurements that fall in
22
either Level 2 or Level 3 have been adopted by the fund.The remaining portion of ASU No. 2010-06 requires reporting entities to make new disclosures about information on purchases, sales, issuances and settlements on a gross basis in the reconciliation of activity in Level 3 fair value measurements.These new and revised disclosures are required to be implemented for fiscal years beginning after December 15, 2010. Management is currently evaluating the impact that the adoption of this remaining portion of ASU No. 2010-06 may have on the fund’s financial statement disclosures.
(b) Securities transactions and investment income: Securities transactions are recorded on a trade date basis. Realized gains and losses from securities transactions are recorded on the identified cost basis. Dividend income is recognized on the ex-dividend date and interest income, including, where applicable, accretion of discount and amortization of premium on investments, is recognized on the accrual basis.
The fund has arrangements with the custodian and cash management bank whereby the fund may receive earnings credits when positive cash balances are maintained, which are used to offset custody and cash management fees. For financial reporting purposes, the fund includes net earnings credits as an expense offset in the Statement of Operations.
Pursuant to a securities lending agreement with The Bank of New York Mellon, a subsidiary of BNY Mellon and an affiliate of Dreyfus, the fund may lend securities to qualified institutions. It is the fund’s policy that, at origination, all loans are secured by collateral of at least 102% of the value of U.S. securities loaned and 105% of the value of foreign securities loaned. Collateral equivalent to at least 100% of the market value of securities on loan is maintained at all times. Collateral is either in the form of cash, which can be invested in certain money market mutual funds managed by the Manager, U.S. Government and Agency securities or letters of credit.The fund is entitled to receive all income on securities loaned, in addition to income earned as a result of the lending transaction. Although each security loaned is fully col-
NOTES TO FINANCIAL STATEMENTS (Unaudited) (continued)
lateralized, the fund bears the risk of delay in recovery of, or loss of rights in, the securities loaned should a borrower fail to return the securities in a timely manner. During the period ended June 30, 2010, The Bank of New York Mellon earned $13,196 from lending portfolio securities, pursuant to the securities lending agreement.
(c) Affiliated issuers: Investments in other investment companies advised by Dreyfus are defined as “affiliated” in the Act.
The fund may invest in shares of certain affiliated investment companies also advised or managed by Dreyfus. Investments in affiliated investment companies for the period ended June 30, 2010 were as follows:

(d) Dividends to shareholders: Dividends are recorded on the ex-dividend date. Dividends from investment income-net and dividends from net realized capital gains, if any, are normally declared and paid annually, but the fund may make distributions on a more frequent basis to comply with the distribution requirements of the Internal Revenue Code of 1986, as amended (the “Code”).To the extent that net realized capital gains can be offset by capital loss carryovers, it is the policy of the fund not to distribute such gains. Income and capital gain distributions are determined in accordance with income tax regulations, which may differ from GAAP.
(e) Federal income taxes: It is the policy of the fund to continue to qualify as a regulated investment company, if such qualification is in the best interests of its shareholders, by complying with the applicable pro-
24
visions of the Code, and to make distributions of taxable income sufficient to relieve it from substantially all federal income and excise taxes.
As of and during the period ended June 30, 2010, the fund did not have any liabilities for any uncertain tax positions.The fund recognizes interest and penalties, if any, related to uncertain tax positions as income tax expense in the Statement of Operations. During the period, the fund did not incur any interest or penalties.
Each of the tax years in the three-year period ended December 31, 2009 remains subject to examination by the Internal Revenue Service and state taxing authorities.
The fund has an unused capital loss carryover of $97,963,747 available for federal income tax purposes to be applied against future net securities profits, if any, realized subsequent to December 31, 2009. If not applied, $29,443,355 of the carryover expires in fiscal 2016 and $68,520,392 expires in fiscal 2017.
NOTE 2—Bank Lines of Credit:
The fund participates with other Dreyfus-managed funds in a $225 million unsecured credit facility led by Citibank, N.A. and a $300 million unsecured credit facility provided by The Bank of New York Mellon (each, a “Facility”), each to be utilized primarily for temporary or emergency purposes, including the financing of redemptions. In connection therewith, the fund has agreed to pay its pro rata portion of commitment fees for each Facility. Interest is charged to the fund based on rates determined pursuant to the terms of the respective Facility at the time of borrowing. During the period ended June 30, 2010, the fund did not borrow under the Facilities.
NOTE 3—Investment Advisory Fee and Other Transactions With Affiliates:
(a) Pursuant to an investment advisory agreement with the Manager, the investment advisory fee is based on the fund’s average daily net assets and is computed at the following annual rates: 1% of the first $30
NOTES TO FINANCIAL STATEMENTS (Unaudited) (continued)
million, .75% of the next $270 million, .70% of the next $200 million and .65% in excess of $500 million.The fee is payable monthly.
The Manager has agreed to waive receipt of its fees and/or assume the expenses of the fund, until October 31, 2010, so that the annual direct expenses of the fund (excluding Rule 12b-1 fees, shareholder services fees, taxes, interest, brokerage commissions, acquired fund fees and extraordinary expenses) do not exceed 1.15% of the fund’s average daily net assets.The reduction in investment advisory fee, pursuant to the undertaking, amounted to $48,017 during the period ended June 30, 2010.
During the period ended June 30, 2010, the Distributor retained $3,205 from commissions earned on sales of the fund’s Class A shares and $896 and $591 from CDSCs on redemptions of the fund’s Class B and Class C shares, respectively.
(b) Under a Distribution Plan (the “Class B and C Plan”) adopted pursuant to Rule 12b-1 under the Act, Class B and Class C shares pay the Distributor for distributing their shares at an annual rate of .75% of the value of the average daily net assets of Class B and Class C shares.During the period ended June 30,2010,Class B and Class C shares were charged $1,983 and $42,655, respectively, pursuant to the Class B and C Plan.
The fund also adopted a Distribution Plan pursuant to Rule 12b-1 under the Act applicable to its Class F shares (the “Class F Plan”). Under the Class F Plan, the fund is authorized to reimburse the Distributor for expenses paid for distributing or servicing its Class F shares at an annual rate of up to .25% of the value of the average daily net assets of the fund’s Class F shares.The Distributor has agreed not to seek reimbursement of any expenses under the Class F Plan other than reimbursements for payments made to brokers and other intermediaries whose customers hold Class F shares (“Third Party Payments”).This commitment applies to any such expenses (other than Third Party Payments).This commitment will continue indefinitely and will not terminate without the prior approval of the fund’s Board of Directors. During the period ended June 30, 2010, Class F shares were charged $28,440 pursuant to th e Class F Plan.
26
(c) Under the Shareholder Services Plan, Class A, Class B and Class C shares pay the Distributor at an annual rate of .25% of the value of their average daily net assets for the provision of certain services.The services provided may include personal services relating to shareholder accounts, such as answering shareholder inquiries regarding Class A, Class B and Class C shares and providing reports and other information, and services related to the maintenance of shareholder accounts. The Distributor may make payments to Service Agents (a securities dealer, financial institution or other industry professional) in respect of these services.The Distributor determines the amounts to be paid to Service Agents. During the period ended June 30, 2010, Class A, Class B and Class C shares were charged $28,503, $661 and $14,218, respectively, pursuant to the Sha reholder Services Plan.
The Company has a shareholder services agreement with the Distributor, whereby the fund agrees to compensate the Distributor for providing certain shareholder servicing functions to holders of Class F shares. On an annual basis, the fund pays the Distributor a monthly fee of $24.00 per Class F shareholder account considered to be an open account at any time during a given month. During the period ended June 30, 2010, Class F shares were charged $49,775 pursuant to the shareholder services agreement.
The fund compensates Dreyfus Transfer, Inc., a wholly-owned subsidiary of the Manager, under a transfer agency agreement for providing personnel and facilities to perform transfer agency services for the fund. During the period ended June 30, 2010, the fund was charged $30,685 pursuant to the transfer agency agreement, which is included in Shareholder servicing costs in the Statement of Operations.
The fund compensates The Bank of New York Mellon under cash management agreements for performing cash management services related to fund subscriptions and redemptions. During the period ended June 30, 2010, the fund was charged $6,527 pursuant to the cash
NOTES TO FINANCIAL STATEMENTS (Unaudited) (continued)
management agreements, which is included in Shareholder servicing costs in the Statement of Operations. These fees were partially offset by earnings credits of $431.
The fund also compensates The Bank of New York Mellon under a custody agreement for providing custodial services for the fund. During the period ended June 30, 2010, the fund was charged $1,447 pursuant to the custody agreement.
The fund has agreed to compensate the Manager for providing accounting services, administration, compliance monitoring, regulatory and shareholder reporting, as well as related facilities, equipment and clerical help.The fee is based on the fund’s average daily net assets and computed at the following annual rates: .06% of the first $500 million, .04% of the next $500 million and .02% in excess of $1 billion, plus reasonable out-of-pocket expenses.The Manager has contractually agreed in writing to waive any fees received for these services to the extent they exceed its costs in providing the services and a reasonable allocation of the costs incurred by the Manager and its affiliates related to the support and oversight of these services.
During the period ended June 30, 2010, the fund was charged $2,742 for services performed by the Chief Compliance Officer.
The components of “Due to The Dreyfus Corporation and affiliates” in the Statement of Assets and Liabilities consist of: investment advisory fees $101,577, Rule 12b-1 distribution plan fees $11,782, shareholder services plan fees $23,986, custodian fees $962, chief compliance officer fees $4,113, accounting fees $4,856 and transfer agency per account fees $14,120.
(d) Effective January 1, 2010, each Director who is not an “interested person” of the Company (as defined in the Act) received $60,000 per annum, plus $7,000 per joint Board meeting of the Company, The Dreyfus/Laurel Funds, Inc., The Dreyfus/Laurel Funds Trust, The
28
Dreyfus/Laurel Tax-Free Municipal Funds and Dreyfus Investment Funds (collectively, the “Board Group Open-end Funds”) attended, $2,500 for separate in-person committee meetings attended which are not held in conjunction with a regularly scheduled Board meeting and $2,000 for Board meetings and separate committee meetings attended that are conducted by telephone.The Board Group Open-end Funds also reimburse each Director who is not an “interested person” of the Company (as defined in the Act) for travel and out-of-pocket expenses. With respect to Board meetings, the Chairman of the Board receives an additional 25% of such compensation (with the exception of reimbursable amounts). Effective January 1, 2010, the Chair of each of the Board’s committees, unless the Chair also serves as Chair of the Board, receives $1,350 per applicable committee meeting. In the event that there is an in-person joint committe e meeting or a joint telephone meeting of the Board Group Open-end Funds and Dreyfus HighYield Strategies Fund, the $2,500 or $2,000 fee, as applicable, is allocated between the Board Group Open-end Funds and Dreyfus High Yield Strategies Fund.These fees and expenses are charged and allocated to each series based on net assets.
NOTE 4—Securities Transactions:
The aggregate amount of purchases and sales of investment securities, excluding short-term securities, during the period ended June 30, 2010, amounted to $109,600,836 and $121,465,125, respectively.
The provisions of ASC Topic 815 “Derivatives and Hedging” require qualitative disclosures about objectives and strategies for using derivatives, quantitative disclosures about fair value amounts of gains and losses on derivative instruments and disclosures about credit-risk-related contingent features in derivative agreements.The fund held no derivatives during the period ended June 30, 2010. These disclosures did not impact the notes to the financial statements.
NOTES TO FINANCIAL STATEMENTS (Unaudited) (continued)
At June 30, 2010, accumulated net unrealized appreciation on investments was $6,146,429, consisting of $12,432,935 gross unrealized appreciation and $6,286,506 gross unrealized depreciation.
At June 30, 2010, the cost of investments for federal income tax purposes was substantially the same as the cost for financial reporting purposes (see the Statement of Investments).
30
|
| INFORMATION ABOUT THE REVIEW AND |
| APPROVAL OF THE FUND’S INVESTMENT |
| ADVISORY AGREEMENT (Unaudited) |
At a meeting of the fund’s Board of Directors held on February 9, 2010, the Board considered the re-approval of the fund’s Investment Advisory Agreement (“Management Agreement”), pursuant to which the Manager provides the fund with investment advisory and certain administrative services.The Board members, none of whom are “interested persons” (as defined in the Investment Company Act of 1940, as amended) of the fund, were assisted in their review by independent legal counsel and met with counsel in executive session separate from representatives of the Manager.
Representatives of the Manager reminded the Board members that the Manager became the investment adviser of the fund, effective September 1, 2009, but that there were no changes to the portfolio management of the fund as a result of the appointment of the Manager as the fund’s investment adviser.
Analysis of Nature, Extent and Quality of Services Provided to the Fund. The Board members considered information previously provided to them in a presentation from representatives of the Manager regarding services provided to other funds in the Dreyfus fund complex, and representatives of the Manager confirmed that this information is applicable to the fund and that there had been no material changes in this information.The Board also discussed the nature, extent and quality of the services provided to the fund pursuant to its Management Agreement.The Manager’s representatives reviewed the fund’s distribution of accounts and the relationships the Manager has with various intermediaries and the different needs of each. The Manager’s representatives noted the distribution channels for the fund, as well as the diversity of distribution among the fu nds in the Dreyfus fund complex, and the Manager’s corresponding need for broad, deep, and diverse resources to be able to provide ongoing shareholder services to each distribution channel, including those of the fund. The Manager provided the number of shareholder accounts in the fund, as well as the fund’s asset size.
|
| INFORMATION ABOUT THE REVIEW AND APPROVAL OF THE FUND’S |
| INVESTMENT ADVISORY AGREEMENT (Unaudited) (continued) |
The Board members also considered the Manager’s research and portfolio management capabilities and that the Manager also provides oversight of day-to-day fund operations, including assistance in meeting legal and regulatory requirements. The Board members also considered the Manager’s extensive compliance infrastructure.The Board also considered the Manager’s brokerage policies and practices, the standards applied in seeking best execution and the Manager’s policies and practices regarding soft dollars.
Comparative Analysis of the Fund’s Performance and Management Fee and Expense Ratio. The Board members reviewed the fund’s performance and comparisons to a group of retail front-end load, mid-cap growth funds (the “Performance Group”) and to a larger universe of funds, consisting of all retail and institutional mid-cap growth funds (the “Performance Universe”) selected and provided by Lipper, Inc., an independent provider of investment company data. The Board was provided with a description of the methodology Lipper used to select the Performance Group and Performance Universe, as well as the Expense Group and Expense Universe (discussed below). The Board members discussed the results of the comparisons and noted that the fund’s total return performance was below the Performance Group and Performance Universe medians for each of the reporting periods. As part of an overall presentation to the Board members, representatives of the Manager discussed the market environment in 2009, noting that high beta stocks had outperformed during 2009 and high quality stocks had been out of favor during 2009.The Manager also provided a comparison of the fund’s calendar year total returns to the returns of the fund’s benchmark index.
The Board members were concerned about the fund’s performance and requested that the Manager take steps to improve the fund’s performance or take other action. Representatives of the Manager discussed recent efforts to improve the fund’s total return performance, including the portfolio management change in January 2009, when Fred Kuehndorf became the primary portfolio manager of the fund. Although the Board members noted that it would be expected to take some time for the new
32
management to favorably affect performance, they believed that the fund’s relative performance had not shown satisfactory improvement as of December 31, 2009. A representative of the Manager stated that the Manager was considering various options to improve fund performance and agreed to advise the Board at, or prior to, the next Board meeting of steps being taken to improve fund performance.
The Board members also discussed the fund’s contractual and actual management fees and expense ratio and reviewed the range of management fees and expense ratios of a comparable group of funds (the “Expense Group”) and a broader group of funds (the “Expense Universe”), each selected and provided by Lipper. The Lipper data presenting the fund’s “actual management fees” included fees paid by the fund, as calculated by Lipper, for administrative services provided by the Manager, the fund’s administrator. Such reporting was necessary, according to Lipper, to allow the Board to compare the fund’s advisory fees to those peers that include administrative fees within a combined management (investment advisory and administrative) fee. The Board members noted that the fund’s contractual management fee was below the Expense Group median, the fund’s actual management fee and the f und’s expense ratio were above the respective Expense Group and Expense Universe medians. Representatives of the Manager and the Board members agreed that the Manager would waive receipt of its fees and/or assume the expenses of the fund, until August 31, 2010, so that the annual direct expenses of the fund (excluding Rule 12b-1 fees, shareholder services fees, taxes, interest, brokerage commissions, acquired fund fees and extraordinary expenses) do not exceed 1.15% of the fund’s average daily net assets.
Representatives of the Manager reviewed with the Board members the fees paid to the Manager or its affiliates by mutual funds managed by the Manager or its affiliates with similar investment objectives, policies and strategies, and included in the same Lipper category as the fund (the “Similar Funds”), and by other accounts managed by the Manager or its affiliates with similar investment objectives, policies and strategies as the
|
| INFORMATION ABOUT THE REVIEW AND APPROVAL OF THE FUND’S |
| INVESTMENT ADVISORY AGREEMENT (Unaudited) (continued) |
fund (the “Similar Accounts”).The Manager’s representatives explained the nature of the Similar Accounts and the differences, from the Manager’s perspective, in providing services to such Similar Accounts as compared to managing and providing services to the fund.The Board analyzed differences in fees paid to the Manager and discussed the relationship of the fees paid in light of the services provided. The Board members considered the relevance of the fee information provided for the Similar Funds and the Similar Accounts to evaluate the appropriateness and reasonableness of the fund’s management fee.
Analysis of Profitability and Economies of Scale. A representative of the Manager reminded the Board members that The Bank of New York Mellon Corporation, the parent company of the Manager, paid all of the expenses associated with the Manager becoming the fund’s investment adviser and the proxy campaign with respect to the Board members becoming the Company’s Board members. Because the Manager only became the fund’s investment adviser effective September 1, 2009, the Manager’s representatives were only able to provide the dollar amount of expenses allocated and profit received by the Manager for an abbreviated period of time. A representative of the Manager reviewed the method used to determine such expenses and profit.The Board previously had been provided with information prepared by an independent consulting firm regarding the Manager� 6;s approach to allocating costs to, and determining the profitability of, individual funds and the entire Dreyfus mutual fund complex. The Board also was informed that the methodology had also been reviewed by an independent registered public accounting firm which, like the consultant, found the methodology to be reasonable. The consulting firm also analyzed where any economies of scale might emerge in connection with the management of the fund.The Board members evaluated the profitability analysis in light of the relevant circumstances for the fund.The Board members also considered potential benefits to the Manager from acting as investment adviser and noted the Manager’s soft dollar arrangements with respect to trading the fund’s portfolio.
34
It was noted that the Board members should consider the Manager’s profitability with respect to the fund as part of their evaluation of whether the fees under the Management Agreement bear a reasonable relationship to the mix of services provided by the Manager, including the nature, extent and quality of such services and that a discussion of economies of scale is predicated on increasing assets and that, if a fund’s assets had been decreasing, the possibility that the Manager may have realized any economies of scale would be less. It also was noted that the profitability percentage for managing the fund was within the range determined by appropriate court cases to be reasonable given the services rendered and generally superior service levels provided by the Manager.
At the conclusion of these discussions, the Board agreed that it had been furnished with sufficient information to make an informed business decision with respect to continuation of the fund’s Management Agreement. Based on the discussions and considerations as described above, the Board made the following conclusions and determinations.
The Board concluded that the nature, extent and quality of the services provided by the Manager are adequate and appropriate.
The Board was concerned with the fund’s performance and requested that the Manager provide the Board with an update at, or prior to, the next Board meeting on the fund’s performance and the steps the Manager will be taking in connection with the fund’s management and performance.
The Board concluded, taking into account the implementation of the fee waiver, that the fee paid by the fund to the Manager was rea- sonable in light of the services provided, comparative performance, expense and management fee information, costs of the services pro- vided and profits realized and benefits derived or to be derived by the Manager from its relationship with the fund.
|
| INFORMATION ABOUT THE REVIEW AND APPROVAL OF THE FUND’S |
| INVESTMENT ADVISORY AGREEMENT (Unaudited) (continued) |
The Board determined that because the Manager had become the investment adviser of the fund effective September 1, 2009, economies of scale were not a factor at this time, but, to the extent that material economies of scale are not shared with the fund in the future, the Board would seek to do so in connection with future renewals.
The Board members considered these conclusions and determinations, along with information received on a routine and regular basis throughout the year, and, without any one factor being dispositive, the Board determined that re-approval of the fund’s Management Agreement was in the best interests of the fund and its shareholders.
36
For More Information
| |
| Telephone Call your financial representative or: |
| Class F shareholders: | 1-800-645-6561 |
| All other share classes: | 1-800-554-4611 |
Mail The Dreyfus Family of Funds, 144 Glenn Curtiss Boulevard, Uniondale, NY 11556-0144
The fund files its complete schedule of portfolio holdings with the Securities and Exchange Commission (“SEC”) for the first and third quarters of each fiscal year on Form N-Q. The fund’s Forms N-Q are available on the SEC’s website at http://www.sec.gov and may be reviewed and copied at the SEC’s Public Reference Room in Washington, DC. Information on the operation of the Public Reference Room may be obtained by calling 1-800-SEC-0330.
A description of the policies and procedures that the fund uses to determine how to vote proxies relating to portfolio securities, and information regarding how the fund voted these proxies for the most recent 12-month period ended June 30 is available at http://www.dreyfus.com and on the SEC’s website at http://www.sec.gov.
The description of the policies and procedures is also available without charge, upon request, by calling 1-800-645-6561.

Item 2. Code of Ethics.
Not applicable.
Item 3. Audit Committee Financial Expert.
Not applicable.
Item 4. Principal Accountant Fees and Services.
Not applicable.
Item 5. Audit Committee of Listed Registrants.
Not applicable.
Item 6. Investments.
(a) Not applicable.
Item 7. Disclosure of Proxy Voting Policies and Procedures for Closed-End Management Investment Companies.
Not applicable.
Item 8. Portfolio Managers of Closed-End Management Investment Companies.
Not applicable.
Item 9. Purchases of Equity Securities by Closed-End Management Investment Companies and Affiliated Purchasers.
Not applicable. [CLOSED END FUNDS ONLY]
Item 10. Submission of Matters to a Vote of Security Holders.
There have been no material changes to the procedures applicable to Item 10.
Item 11. Controls and Procedures.
(a) The Registrant's principal executive and principal financial officers have concluded, based on their evaluation of the Registrant's disclosure controls and procedures as of a date within 90 days of the filing date of this report, that the Registrant's disclosure controls and procedures are reasonably designed to ensure that information required to be disclosed by the Registrant on Form N-CSR is recorded, processed, summarized and reported within the required time periods and that information required to be disclosed by the Registrant in the reports that it files or submits on Form N-CSR is accumulated and communicated to the Registrant's management, including its principal executive and principal financial officers, as appropriate to allow timely decisions regarding required disclosure.
(b) There were no changes to the Registrant's internal control over financial reporting that occurred during the second fiscal quarter of the period covered by this report that have materially affected, or are reasonably likely to materially affect, the Registrant's internal control over financial reporting.
Item 12. Exhibits.
(a)(1) Not applicable.
(a)(2) Certifications of principal executive and principal financial officers as required by Rule 30a-2(a) under the Investment Company Act of 1940.
(a)(3) Not applicable.
(b) Certification of principal executive and principal financial officers as required by Rule 30a-2(b) under the Investment Company Act of 1940.
SIGNATURES
Pursuant to the requirements of the Securities Exchange Act of 1934 and the Investment Company Act of 1940, the Registrant has duly caused this Report to be signed on its behalf by the undersigned, thereunto duly authorized.
Dreyfus Funds, Inc.
By: /s/ Bradley J. Skapyak |
Bradley J. Skapyak, President |
Date: | August 23, 2010 |
|
Pursuant to the requirements of the Securities Exchange Act of 1934 and the Investment Company Act of 1940, this Report has been signed below by the following persons on behalf of the Registrant and in the capacities and on the dates indicated. |
|
By: /s/ Bradley J. Skapyak |
Bradley J. Skapyak, President |
Date: | August 23, 2010 |
|
By: /s/ James Windels |
James Windels, Treasurer |
Date: | August 23, 2010 |
|
EXHIBIT INDEX
(a)(2) Certifications of principal executive and principal financial officers as required by Rule 30a-2(a) under the Investment Company Act of 1940. (EX-99.CERT)
(b) Certification of principal executive and principal financial officers as required by Rule 30a-2(b) under the Investment Company Act of 1940. (EX-99.906CERT)