UNITED STATES
SECURITIES AND EXCHANGE COMMISSION
Washington, DC 20549
FORM N-CSR
CERTIFIED SHAREHOLDER REPORT OF REGISTERED MANAGEMENT INVESTMENT COMPANIES
Investment Company Act file number 811-00537
Franklin Custodian Funds
(Exact name of registrant as specified in charter)
_One Franklin Parkway, San Mateo, CA 94403-1906
(Address of principal executive offices) (Zip code)
Craig S. Tyle, One Franklin Parkway, San Mateo, CA 94403-1906
(Name and address of agent for service)
Registrant's telephone number, including area code:650 312-2000
Date of fiscal year end: 9/30
Date of reporting period: 9/30/16
Item 1. Reports to Stockholders.
| |
| Contents | |
| |
| Annual Report | |
| Economic and Market Overview | 3 |
| Franklin DynaTech Fund | 4 |
| Franklin Growth Fund | 12 |
| Franklin Income Fund | 20 |
| Franklin U.S. Government Securities Fund | 28 |
| Franklin Utilities Fund | 34 |
| Financial Highlights and Statements of Investments | 40 |
| Financial Statements | 95 |
| Notes to Financial Statements | 104 |
| Report of Independent Registered | |
| Public Accounting Firm | 127 |
| Tax Information | 128 |
| Board Members and Officers | 129 |
| Shareholder Information | 133 |
Visit franklintempleton.com for fund updates, to access your account, or to find helpful financial planning tools.
2 Annual Report
franklintempleton.com
Annual Report
Economic and Market Overview
The U.S. economy grew modestly during the first three quarters of the 12 months ended September 30, 2016, despite a general decline in private inventory, nonresidential fixed investments and exports. However, personal consumption expenditures remained strong throughout the period, contributing to faster growth in 2016’s third quarter as nonresidential fixed investments and exports grew. Manufacturing conditions generally contracted during the first half of the period, but generally expanded in the second half. Manufacturing data rebounded in September to enter into expansionary territory after contracting in August. The services sector, although volatile, continued to grow throughout the period. Growth in services contributed to new jobs, and the unemployment rate decreased slightly from 5.1% in September 2015 to 5.0% at period-end.1 Home sales and prices rose amid relatively low mortgage rates. Monthly retail sales grew for most of the review period, and rose to the highest level in April in more than a year, due to a broad-based increase across most retail categories. After declining in August, retail sales rose in September, driven largely by sales in auto and auto components dealers, gasoline stations and grocery stores. Inflation, as measured by the Consumer Price Index (CPI), rose slightly in September due to an increase in shelter and gasoline costs. The CPI reported its strongest monthly reading over the past three years in April as energy prices rose.
After maintaining a near-zero interest rate for seven years to support the U.S. economy’s recovery, the U.S. Federal Reserve (Fed) raised its target range for the federal funds rate to 0.25%–0.50% at its December 2015 meeting and maintained the rate through the period-end. In July, the Fed Chair signaled the possibility of a near-term increase in interest rates citing strengthening labor market conditions and the Fed’s optimism about future economic growth. However, following lower-than-expected job growth in August, the Fed kept interest rates unchanged at its September meeting and lowered its forecast for 2016 U.S. economic growth.
U.S. stock markets rose during the period, as investors remained confident after the European Central Bank expanded its quantitative easing measures and cut its benchmark interest rate to zero, the People’s Bank of China introduced further easing measures, and the Bank of Japan adopted a negative interest rate policy. However, the U.K.’s historic referendum to leave the European Union (also known as the “Brexit”) and global growth concerns weighed on market sentiment. Toward period-end, the rally in crude oil prices and the Fed’s decision to keep interest rates unchanged further boosted investor confidence. The broad U.S. stock market ended the 12-month period higher, as measured by the Standard & Poor’s® 500 Index.
The foregoing information reflects our analysis and opinions as of September 30, 2016. The information is not a complete analysis of every aspect of any market, country, industry, security or fund. Statements of fact are from sources considered reliable.
1. Source: Bureau of Labor Statistics.
franklintempleton.com
Annual Report
3
Franklin DynaTech Fund
This annual report for Franklin DynaTech Fund covers the fiscal year ended September 30, 2016.
Your Fund’s Goal and Main Investments
The Fund seeks capital appreciation by investing primarily in equity securities of companies that emphasize innovation and new technologies, have superior management and that benefit from new industry conditions in the dynamically changing global economy.
Performance Overview
The Fund’s Class A shares delivered a +15.73% cumulative total return for the 12 months under review. In comparison, the Russell 1000® Growth Index, which measures performance of the largest companies in the Russell 3000® Index with higher price-to-book ratios and higher forecasted growth values, generated a total return of +13.76%.1 Also for comparison, the broad U.S. stock market as measured by the Standard & Poor’s 500 Index (S&P 500®), produced a +15.43% return, and domestic and international-based stocks as measured by the NASDAQ Composite Index® had a +16.42% total return.1 You can find more of the Fund’s performance data in the Performance Summary beginning on page 8.
Performance data represent past performance, which does not guarantee future results. Investment return and principal value will fluctuate, and you may have a gain or loss when you sell your shares. Current performance may differ from figures shown. For most recent month-end performance, go to franklintempleton.com or call (800) 342-5236.
Investment Strategy
We use fundamental, bottom-up research to seek companies meeting our criteria of growth potential, quality and valuation. In seeking sustainable growth characteristics, we look for companies we believe can produce sustainable earnings and cash flow growth, evaluating the long-term market opportunity and competitive structure of an industry to target leaders and emerging leaders. We define quality companies as those with strong and improving competitive positions in attractive markets. We also believe important attributes of quality are experienced and talented management teams as well as financial strength reflected in the capital structure, gross and operating margins, free cash flow generation and returns on capital employed. Our valuation analysis includes a range of potential outcomes based on an assessment of multiple scenarios. In assessing value, we consider whether security prices fully reflect the balance of the sustainable growth opportunities relative to business and financial risks.
Manager’s Discussion
During the period under review, most investment sectors contributed to absolute performance. The Fund’s information technology (IT) holdings contributed notably to results.2 Social media company Facebook helped Fund returns. The company continued to outperform expectations, and grew its advertising revenues for three consecutive quarters based on continued strong customer engagement, strong performance of its immersive advertising formats, and the initial ramp-up of the monetization of its Instagram division. Chinese Internet portal Tencent Holdings was another key contributor. The company’s accelerated revenue growth was driven by the popularity of WeChat, a leading social/messaging platform in China. Tencent also built out its ecosystem around its social media platforms, which included games, subscriptions, advertising and online-to-offline services. Alphabet, Google’s parent company, enjoyed strong revenue growth during the period based on the addition of a new mobile advertising offer and the success of advertising programs from the company’s YouTube division. Additionally, the introduction of Ruth Porat as the company’s chief executive officer in 2015 improved Alphabet’s transparency, financial discipline and shareholder friendliness. Furthermore, the company’s core business exercised discipline, driving margin expansion during the period. Alphabet also cut back or adjusted its strategy in several of its research and development projects.
The Fund’s consumer discretionary sector holdings also aided performance.3 Internet retailer Amazon.com enjoyed strong performance, driven by record-breaking sales during its Prime
1. Source: Morningstar.
The indexes are unmanaged and include reinvestment of any income or distributions. They do not reflect any fees, expenses or sales charges. One cannot invest directly in an
index, and an index is not representative of the Fund’s portfolio.
Russell Investment Group is the source and owner of the trademarks, service marks and copyrights related to the Russell Indexes. Russell® is a trademark of Russell
Investment Group.
2. The IT sector comprises communications equipment; Internet software and services; IT services; semiconductors and semiconductor equipment; software; and technology
hardware, storage and peripherals in the SOI.
3. The consumer discretionary sector comprises Internet and direct marketing retail and textiles, apparel and luxury goods in the SOI.
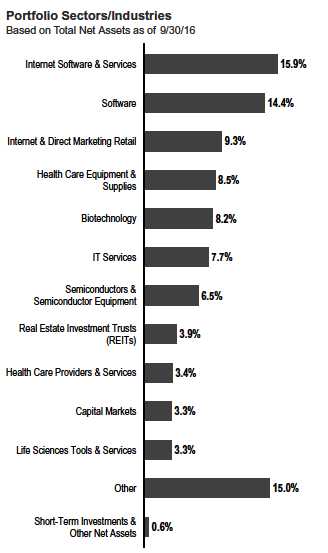
The dollar value, number of shares or principal amount, and names of all portfolio holdings are listed in the Fund’s Statement of Investments (SOI).
The SOI begins on page 45.
4 Annual Report
franklintempleton.com
FRANKLIN DYNATECH FUND
Day promotion. Liberty Broadband is primarily an investment vehicle in Charter Communications. Charter reported solid results during the period with continued improvement in legacy Charter subscriber and profitability growth.
The Fund’s health care sector holdings also aided performance.4 Medical device manufacturer Edwards Lifesciences performed well during the period. Sales and profits from its trans-catheter heart valve replacement systems exceeded investor expectations. Also, the company released positive clinical trial data that showed the use of trans-catheter heart valves resulted in lower rates of mortality and stroke relative to traditional surgical heart valve replacements. IDEXX Laboratories performed well after its successful transition to a direct sales model boosted sales and profits. Medical insurance provider UnitedHealth Group continued to execute well on all fronts. In its managed care division, the company delivered better medical cost management and above-industry average growth in Medicare Advantage policies. Also, UnitedHealth successfully integrated the acquisition of pharmacy-benefit manager Catamaran, which led to a pickup in market share. The company’s health technology division exceeded investor expectations with strong internal and external growth in all business lines.
In contrast, some individual positions detracted from Fund results. Business-oriented social network LinkedIn’s revenue failed to meet expectations during the company’s fourth quarter of 2015.5 LinkedIn’s stock price was also impacted by negative results from its Tableau Software division and fears of a recession.
Pharmaceutical company Allergan’s5 shares declined after the U.S. Treasury passed new tax rules that forced the company to terminate its planned merger with Pfizer. Allergan’s number of acquisitions and divestitures made investors cautious about its outlook as an independent company.
Biopharmaceutical company Gilead Sciences’s results declined along with the rest of the health care sector. The company was pressured by weakening sales of its hepatitis C drug Harvoni. Gilead was also hampered by a lack of transformative mergers and acquisition activity during the period.
Palo Alto Networks, a cyber-security technology company, struggled during the past year as heavy investments made in the prior two years slowed and investment shifted to subscriptions.
Medical waste manager Stericycle suffered from increased competition that reduced revenues and profitability of the company’s industrial and manufacturing waste business.5
Regeneron Pharmaceuticals was impacted by a number of factors. The biotechnology company suffered from a decline in its first quarter along with the rest of the health care sector, and Regeneron’s comparatively high debt level exacerbated results. Also, the management team surprised investors by forecasting a
4. The health care sector comprises biotechnology, health care equipment and supplies, health care providers and services, health care technology, life sciences tools and
services, and pharmaceuticals in the SOI.
5. Not held at period-end.
See www.franklintempletondatasources.com for additional data provider information.
franklintempleton.com
Annual Report
5
| | |
| FRANKLIN DYNATECH FUND | | |
| |
| |
| |
| |
| Top 10 Holdings | | |
| 9/30/16 | | |
| Company | % of Total | |
| Sector/Industry | Net Assets | |
| Amazon.com Inc. | 6.3 | % |
| Internet & Direct Marketing Retail | | |
| Alphabet Inc. | 5.6 | % |
| Internet Software & Services | | |
| Facebook Inc. | 4.6 | % |
| Internet Software & Services | | |
| Mastercard Inc. | 3.3 | % |
| IT Services | | |
| Visa Inc. | 2.7 | % |
| IT Services | | |
| Edwards Lifesciences Corp. | 2.4 | % |
| Health Care Equipment & Supplies | | |
| Equinix Inc. | 2.4 | % |
| Real Estate Investment Trusts (REITs) | | |
| Tencent Holdings Ltd. | 2.3 | % |
| Internet Software & Services | | |
| Celgene Corp. | 2.2 | % |
| Biotechnology | | |
| Salesforce.com Inc. | 1.9 | % |
| Software | | |
large ramp-up in expenses that could occur in the company’s fourth quarter of 2016. Regeneron also had disappointing results from its Praluent and Eylea products.
Biopharmaceutical research company Incyte’s product development pipeline suffered from setbacks. The company ran a trial to determine if its Epacadostat therapy could work with Merck’s Keytruda drug to treat melanomas. Results did not demonstrate clear-cut efficacy. Additionally, Incyte discontinued development of its Jakafi medication as a solid tumor therapy after receiving disappointing results from a pancreatic cancer trial.
Sportswear maker Under Armour underperformed primarily because growth decelerated.5 Sales during the period were impacted by one-time factors including sports retailer bankruptcies and unfavorable weather causing excess inventory.
As managers of Franklin DynaTech Fund, at period-end we remained encouraged by the relative abundance of companies that we believe have strong long-term growth prospects trading at what we perceive to be attractive valuations. We believe it is these innovative, thought-leading companies that may promote economic advancement over the longer term.
Thank you for your continued participation in Franklin DynaTech Fund. We look forward to serving your future investment needs.

6 Annual Report
franklintempleton.com
FRANKLIN DYNATECH FUND
The foregoing information reflects our analysis, opinions and portfolio
holdings as of September 30, 2016, the end of the reporting period.
The way we implement our main investment strategies and the
resulting portfolio holdings may change depending on factors such as
market and economic conditions. These opinions may not be relied
upon as investment advice or an offer for a particular security. The
information is not a complete analysis of every aspect of any market,
country, industry, security or the Fund. Statements of fact are from
sources considered reliable, but the investment manager makes no
representation or warranty as to their completeness or accuracy.
Although historical performance is no guarantee of future results,
these insights may help you understand our investment management
philosophy.
franklintempleton.com
Annual Report
7
FRANKLIN DYNATECH FUND
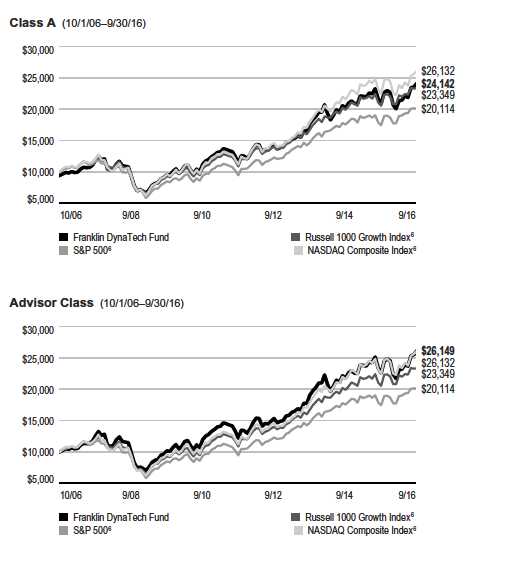
Performance Summary as of September 30, 2016
The performance table and graphs do not reflect any taxes that a shareholder would pay on Fund dividends, capital gain distributions, if any, or any realized gains on the sale of Fund shares. Total return reflects reinvestment of the Fund’s dividends and capital gain distributions, if any, and any unrealized gains or losses.
Performance as of 9/30/161
Cumulative total return excludes sales charges. Average annual total return includes maximum sales charges. Sales charges will vary depending on the size of the investment and the class of share purchased. The maximum is 5.75% and the minimum is 0%. Class A: 5.75% maximum initial sales charge; Advisor Class: no sales charges. For other share classes, visit franklintempleton.com.
| | | | | | |
| | Cumulative | | Average Annual | | Total Annual | |
| Share Class | Total Return2 | | Total Return3 | | Operating Expenses4 | |
| A | | | | | 0.89 | % |
| 1-Year | +15.73 | % | +9.07 | % | | |
| 5-Year | +112.24 | % | +14.87 | % | | |
| 10-Year | +156.11 | % | +9.21 | % | | |
| Advisor5 | | | | | 0.64 | % |
| 1-Year | +16.02 | % | +16.02 | % | | |
| 5-Year | +114.95 | % | +16.54 | % | | |
| 10-Year | +161.49 | % | +10.09 | % | | |
Performance data represent past performance, which does not guarantee future results. Investment return and principal value will fluctuate, and you may have a gain or loss when you sell your shares. Current performance may differ from figures shown. For most recent month-end performance, go to franklintempleton.com or call (800) 342-5236.
See page 10 for Performance Summary footnotes.
8 Annual Report
franklintempleton.com
FRANKLIN DYNATECH FUND
PERFORMANCE SUMMARY
Total Return Index Comparison for a Hypothetical $10,000 Investment1
Total return represents the change in value of an investment over the periods shown. It includes any applicable maximum sales charge, Fund expenses, account fees and reinvested distributions. The unmanaged indexes include reinvestment of any income or distributions. They differ from the Fund in composition and do not pay management fees or expenses. One cannot invest directly in an index.
See page 10 for Performance Summary footnotes.
franklintempleton.com
Annual Report
9
FRANKLIN DYNATECH FUND
PERFORMANCE SUMMARY
Each class of shares is available to certain eligible investors and has different annual fees and expenses, as described in the prospectus.
All investments involve risks, including possible loss of principal. The Fund’s investments in fast-growing industries, including the technology and health care
sectors (which have historically been volatile) could result in increased price fluctuation, especially over the short term, due to the rapid pace of product change
and development and changes in government regulation of companies emphasizing scientific or technological advancement or regulatory approval for new
drugs and medical instruments. The Fund may also invest in small- and mid-capitalization capitalization companies, which can be particularly sensitive to
changing economic conditions, and their prospects for growth are less certain than those of larger, more established companies. The Fund is actively managed
but there is no guarantee that the manager’s investment decisions will produce the desired results. The Fund’s prospectus also includes a description of the
main investment risks.
1. The Fund has a fee waiver associated with any investment it makes in a Franklin Templeton money fund and/or other Franklin Templeton fund, contractually guaranteed
through its current fiscal year-end. Fund investment results reflect the fee waiver; without this waiver, the results would have been lower.
2. Cumulative total return represents the change in value of an investment over the periods indicated.
3. Average annual total return represents the average annual change in value of an investment over the periods indicated. Return for less than one year, ifany,hasnotbeen
annualized.
4. Figures are as stated in the Fund’s current prospectus and may differ from the expense ratios disclosed in the Financial Highlights in this report. In periods of market volatility,
assets may decline significantly, causing total annual Fund operating expenses to become higher than the figures shown.
5. Effective 5/15/08, the Fund began offering Advisor Class shares, which do not have sales charges or a Rule 12b-1 plan. Performance quotations for this class reflect the
following methods of calculation: (a) For periods prior to 5/15/08, a restated figure is used based upon the Fund’s Class A performance, excluding the effect of Class A’s
maximum initial sales charge, but reflecting the effect of the Class A Rule 12b-1 fees; and (b) for periods after 5/15/08, actual Advisor Class performance is used reflecting all
charges and fees applicable to that class. Since 5/15/08 (commencement of sales), the cumulative and average annual total returns of Advisor Class shares were +110.17%
and +9.27%
6. Source: Morningstar. The Russell 1000 Growth Index is market capitalization weighted and measures performance of those Russell 1000 Index companies with higher
price-to-book ratios and higher forecasted growth values. The S&P 500 is a market capitalization-weighted index of 500 stocks designed to measure total U.S. equity market
performance. The NASDAQ Composite Index is a broad-based, market capitalization-weighted index designed to measure all NASDAQ domestic and international-based
common type stocks listed on The NASDAQ Stock Market.
See www.franklintempletondatasources.com for additional data provider information.
10 Annual Report
franklintempleton.com
FRANKLIN DYNATECH FUND
Your Fund’s Expenses
As a Fund shareholder, you can incur two types of costs: (1) transaction costs, including sales charges (loads) on Fund purchases and redemptions; and (2) ongoing Fund costs, including management fees, distribution and service (12b-1) fees, and other Fund expenses. All mutual funds have ongoing costs, sometimes referred to as operating expenses. The table below shows ongoing costs of investing in the Fund and can help you understand these costs and compare them with those of other mutual funds. The table assumes a $1,000 investment held for the six months indicated.
Actual Fund Expenses
The table below provides information about actual account values and actual expenses in the columns under the heading “Actual.” In these columns the Fund’s actual return, which includes the effect of Fund expenses, is used to calculate the “Ending Account Value” for each class of shares. You can estimate the expenses you paid during the period by following these steps (of course, your account value and expenses will differ from those in this illustration): Divide your account value by $1,000 (if your account had an $8,600 value, then $8,600 ÷ $1,000 = 8.6). Then multiply the result by the number in the row for your class of shares under the headings “Actual” and “Expenses Paid During Period” (if Actual Expenses Paid During Period were $7.50, then 8.6 x $7.50 = $64.50). In this illustration, the actual expenses paid this period are $64.50.
Hypothetical Example for Comparison with Other Funds
Under the heading “Hypothetical” in the table, information is provided about hypothetical account values and hypothetical expenses based on the Fund’s actual expense ratio and an assumed rate of return of 5% per year before expenses, which is not the Fund’s actual return. This information may not be used to estimate the actual ending account balance or expenses you paid for the period, but it can help you compare ongoing costs of investing in the Fund with those of other funds. To do so, compare this 5% hypothetical example for the class of shares you hold with the 5% hypothetical examples that appear in the shareholder reports of other funds.
Please note that expenses shown in the table are meant to highlight ongoing costs and do not reflect any transactional costs. Therefore, information under the heading “Hypothetical” is useful in comparing ongoing costs only, and will not help you compare total costs of owning different funds. In addition, if transactional costs were included, your total costs would have been higher.
| | | | | | | | | | | | |
| | | | | | | Actual | | Hypothetical | | |
| | | | | (actual return after expenses) | | (5% annual return before expenses) | | |
| | | | | | | Expenses | | | | Expenses | Net | |
| | | Beginning | | Ending | | Paid During | | Ending | | Paid During | Annualized | |
| Share | | Account | | Account | | Period | | Account | | Period | Expense | |
| Class | | Value 4/1/16 | | Value 9/30/16 | | 4/1/16–9/30/161,2 | | Value 9/30/16 | | 4/1/16–9/30/161,2 | Ratio2 | |
| A | $ | 1,000 | $ | 1,132.80 | $ | 4.96 | $ | 1,020.35 | $ | 4.70 | 0.93 | % |
| C | $ | 1,000 | $ | 1,128.80 | $ | 8.94 | $ | 1,016.60 | $ | 8.47 | 1.68 | % |
| R | $ | 1,000 | $ | 1,131.20 | $ | 6.29 | $ | 1,019.10 | $ | 5.96 | 1.18 | % |
| R6 | $ | 1,000 | $ | 1,135.30 | $ | 2.62 | $ | 1,022.55 | $ | 2.48 | 0.49 | % |
| Advisor | $ | 1,000 | $ | 1,134.20 | $ | 3.63 | $ | 1,021.60 | $ | 3.44 | 0.68 | % |
1. Expenses are equal to the annualized expense ratio for the six-month period as indicated above–in the far right column–multiplied by the simple average account value
over the period indicated, and then multiplied by 183/366 to reflect the one-half year period.
2. Reflects expenses after fee waivers and expense reimbursements. Does not include acquired fund fees and expenses.
franklintempleton.com
Annual Report
11
Franklin Growth Fund
This annual report for Franklin Growth Fund covers the fiscal year ended September 30, 2016.
As previously communicated, shareholders approved the reorganization of Franklin Large Cap Equity Fund into Franklin Growth Fund. The transactions were completed on March 11, 2016, and shares of Franklin Large Cap Equity Fund share classes A, C, R and Advisor were exchanged for shares in Franklin Growth Fund share classes A, C, R, and Advisor, respectively.
Your Fund’s Goal and Main Investments
The Fund seeks capital appreciation by investing substantially in equity securities of companies that are leaders in their industries.
Performance Overview
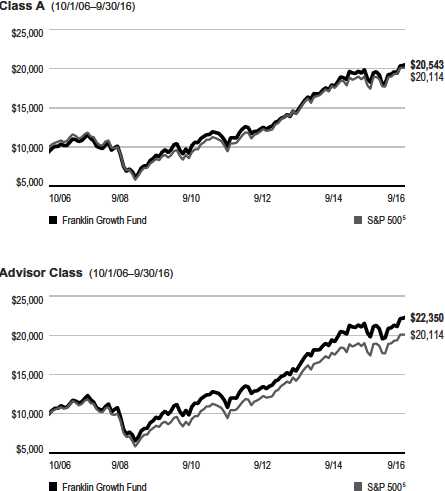
The Fund’s Class A shares delivered a +12.57% cumulative total return for the 12 months under review. In comparison, the Standard & Poor’s 500 Index (S&P 500), which is a broad measure of U.S. stock performance, had a +15.43% total return.1 You can find more of the Fund’s performance data in the Performance Summary beginning on page 16.
Performance data represent past performance, which does not guarantee future results. Investment return will fluctuate. Current performance may differ from figures shown. Please visit franklintempleton.com or call (800) 342-5236 for most recent month-end performance.
Investment Strategy
We use fundamental, bottom-up research to seek companies meeting our criteria of growth potential, quality and valuation. In seeking sustainable growth characteristics, we look for companies we believe can produce sustainable earnings and cash flow growth, evaluating the long-term market opportunity and competitive structure of an industry to target leaders and emerging leaders. We define quality companies as those with strong and improving competitive positions in attractive markets. We also believe important attributes of quality are experienced and talented management teams as well as financial strength reflected in the capital structure, gross and operating margins, free cash flow generation and returns on capital employed. Our valuation analysis includes a range of
potential outcomes based on an assessment of multiple scenarios. In assessing value, we consider whether security prices fully reflect the balance of the sustainable growth opportunities relative to business and financial risks.
1. Source: Morningstar.
The index is unmanaged and includes reinvestment of any income or distributions. It does not reflect any fees, expenses or sales charges. One cannot invest directly in an
index, and an index is not representative of the Fund’s portfolio.
The dollar value, number of shares or principal amount, and names of all portfolio holdings are listed in the Fund’s Statement of Investments (SOI).
The SOI begins on page 54.
12 Annual Report
franklintempleton.com
FRANKLIN GROWTH FUND
Manager’s Discussion
Franklin Growth Fund owned shares of 162 companies at period-end. We continue to invest in a broad array of companies of all sizes and in varied industries.
During the period under review, most investment sectors contributed to absolute performance including information technology (IT), health care and financials.2 In IT, Microsoft, a software and IT services company, benefited over the past year from investors gaining greater confidence in their ability to be relevant in the cloud-computing era with their key productivity and server software franchises. Specifically, its productivity suite moved rapidly to Office 365, while its server franchise found new growth opportunities with the company’s Azure platform. In addition, the company executed well on various cost containment and capital return initiatives with stepped-up share repurchases and a solid dividend. Computer Sciences (CSC), a provider of IT infrastructure services, was boosted by the announcement of a merger with HP Enterprise’s IT Services business in May. With the merger, CSC anticipated achieving significant annual cost synergies, which could drive significant earnings for shareholders. Global positioning system developer Trimble had strong revenue growth during the period from its mobile solutions division.
In health care, shares of precision instrument manufacturer Mettler-Toledo International benefited from strong earnings growth based on strong execution of its operating platforms and a more aggressive share buyback program. Also, the company’s new business-management software enabled improved margins and capital management. Robotic surgical system maker Intuitive Surgical performed well during the period due to sales and profits exceeding investor expectations. The company’s procedure growth rate accelerated, driven by a recovery in prostatectomy procedures and growth in hernia procedures. Medical devices, pharmaceutical and consumer packaged goods manufacturer Johnson & Johnson’s sales and profits exceeded investor expectations as the company’s pharmaceuticals division delivered continued strong growth across multiple products.
In financials, investment management firm BlackRock benefited from the U.S. Department of Labor’s (DOL) new Fiduciary Rule, which investors believed could accelerate the growth of exchange-traded funds versus actively managed
| | |
| Top 10 Holdings | | |
| 9/30/16 | | |
| Company | % of Total | |
| Sector/Industry | Net Assets | |
| Apple Inc. | 3.8 | % |
| Technology Hardware & Equipment | | |
| Amazon.com Inc. | 2.4 | % |
| Retailing | | |
| Alphabet Inc. | 2.1 | % |
| Software & Services | | |
| Northrop Grumman Corp. | 1.9 | % |
| Capital Goods | | |
| Alaska Air Group Inc. | 1.7 | % |
| Transportation | | |
| Union Pacific Corp. | 1.6 | % |
| Transportation | | |
| Microsoft Corp. | 1.6 | % |
| Software & Services | | |
| Mettler-Toledo International Inc. | 1.5 | % |
| Pharmaceuticals, Biotechnology & Life Sciences | | |
| Amgen Inc. | 1.4 | % |
| Pharmaceuticals, Biotechnology & Life Sciences | | |
| The Walt Disney Co. | 1.3 | % |
| Media | | |
investments. The company also delivered continued strong organic asset growth. Insurer Aflac performed well during the period based on better-than-expected improvement in U.S. and Japanese new policy sales. The company also had continued favorable claim experience and margins relative to previous guidance from the management team. Aflac was also aided by the strengthening of the Japanese yen against the U.S. dollar during the period. Investment, retirement and financial services provider Charles Schwab performed well. The federal funds rate rose, which improved net interest margin and reduced money market fee waivers. Investors also believed the company could benefit from the DOL’s Fiduciary Rule.
All sectors the Fund invested in produced positive performance on an absolute basis during the period. However, some individual positions detracted from Fund results. Our positions in airlines, including Alaska Air Group and Allegiant Travel, were challenged by a decline in fares resulting from too much capacity being added. The capacity was added because fuel prices were down and operations were profitable. This environment led to record industry profits, but the companies’ stock prices were punished because investors viewed the added
2. The IT sector comprises technology hardware equipment, software and services, and semiconductors and semiconductor equipment in the SOI. The health caresector
comprises health care equipment and services and pharmaceuticals, biotechnology and life sciences in the SOI. The financials sector comprises banks, diversified financials
and insurance in the SOI.
See www.franklintempletondatasources.com for additional data provider information.
franklintempleton.com
Annual Report
13
FRANKLIN GROWTH FUND
capacity as undisciplined oversupply that could not be pulled back if demand weakened.
Earlier in the period, diversified medical services provider Envision Healthcare Holdings had operational issues. The company experienced an unexpected slowdown in volume and the management team was not able to adjust operating costs on a timely basis, which led to a margin shortfall. Envision also had losses from a handful of unprofitable contracts. The management team implemented plans to fix these issues and saw initial signs of success. Near the end of the company’s performance year, Envision entered into a merger with competitor Amsurg to create a much strong and larger physician service company to capture future growth opportunity. We sold our position by period-end.
Apparel and footwear company VF Corporation had poor performance driven by bad weather last winter that impacted its North Face and Timberland brands. Retailers cut back on inventory levels, which directly hurt the company’s 2016 sales. Factors that led to near-term weakness for VF’s stock included increased competition for the company’s Vans division and lower retail reorders.
Pharmaceutical company Allergan’s shares declined after the U.S. Treasury passed new tax rules that forced the company to terminate its planned merger with Pfizer. Allergan’s dramatic number of acquisitions and divestitures made investors cautious about its outlook as an independent company.
Medical waste manager Stericycle suffered from increased competition that reduced revenues and profitability of the company’s industrial and manufacturing waste business.
Sensata Technologies Holding, a producer of control systems for industrial manufacturers, had poor performance during the period because of investor fears about cyclical companies with high yield debt and peaking automobile production. Sensata also had to reset its earnings lower twice based on slowing industrial demand in emerging markets.
Sportswear maker NIKE underperformed primarily because growth decelerated. Sales during the period were impacted by one-time factors including sports retailer bankruptcies and unfavorable weather causing excess inventory.
The stock price of entertainment conglomerate Walt Disney has underperformed since the launch of “Star Wars: The Force Awakens” last December. Investors were concerned about potentially flat earnings in the company’s fiscal year 2017 based on lower subscriber levels for its ESPN division that could impact negotiations for NBA broadcasting rights and the lack of a new “Star Wars” movie.
Thank you for your participation in Franklin Growth Fund. We look forward to serving your future investment needs.

CFA® is a trademark owned by CFA Institute.
14 Annual Report
franklintempleton.com
FRANKLIN GROWTH FUND
The foregoing information reflects our analysis, opinions and portfolio
holdings as of September 30, 2016, the end of the reporting period.
The way we implement our main investment strategies and the
resulting portfolio holdings may change depending on factors such as
market and economic conditions. These opinions may not be relied
upon as investment advice or an offer for a particular security. The
information is not a complete analysis of every aspect of any market,
country, industry, security or the Fund. Statements of fact are from
sources considered reliable, but the investment manager makes no
representation or warranty as to their completeness or accuracy.
Although historical performance is no guarantee of future results,
these insights may help you understand our investment management
philosophy.
franklintempleton.com
Annual Report
15
FRANKLIN GROWTH FUND
Performance Summary as of September 30, 2016
The performance table and graphs do not reflect any taxes that a shareholder would pay on Fund dividends, capital gain distributions, if any, or any realized gains on the sale of Fund shares. Total return reflects reinvestment of the Fund’s dividends and capital gain distributions, if any, and any unrealized gains or losses.
Performance as of 9/30/161
Cumulative total return excludes sales charges. Average annual total return includes maximum sales charges. Sales charges will vary depending on the size of the investment and the class of share purchased. The maximum is 5.75% and the minimum is 0%. Class A: 5.75% maximum initial sales charge; Advisor Class: no sales charges. For other share classes, visit franklintempleton.com.
| | | | | | |
| | Cumulative | | Average Annual | | Total Annual | |
| Share Class | Total Return2 | | Total Return3 | | Operating Expenses4 | |
| A | | | | | 0.88 | % |
| 1-Year | +12.57 | % | +6.10 | % | | |
| 5-Year | +104.84 | % | +14.06 | % | | |
| 10-Year | +117.98 | % | +7.46 | % | | |
| Advisor | | | | | 0.63 | % |
| 1-Year | +12.85 | % | +12.85 | % | | |
| 5-Year | +107.37 | % | +15.70 | % | | |
| 10-Year | +123.50 | % | +8.37 | % | | |
Performance data represent past performance, which does not guarantee future results. Investment return and principal value will fluctuate, and you may have a gain or loss when you sell your shares. Current performance may differ from figures shown. For most recent month-end performance, go to franklintempleton.com or call (800) 342-5236.
See page 18 for Performance Summary footnotes.
16 Annual Report
franklintempleton.com
FRANKLIN GROWTH FUND
PERFORMANCE SUMMARY
Total Return Index Comparison for a Hypothetical $10,000 Investment1
Total return represents the change in value of an investment over the periods shown. It includes any applicable maximum sales charge, Fund expenses, account fees and reinvested distributions. The unmanaged indexes include reinvestment of any income or distributions. They differ from the Fund in composition and do not pay management fees or expenses. One cannot invest directly in an index.
See page 18 for Performance Summary footnotes.
franklintempleton.com
Annual Report
17
FRANKLIN GROWTH FUND
PERFORMANCE SUMMARY
Each class of shares is available to certain eligible investors and has different annual fees and expenses, as described in the prospectus.
All investments involve risks, including possible loss of principal. Historically, the Fund has focused on larger companies. The Fund may also invest in small,
relatively new and/or unseasoned companies, which involves additional risks, as the price of these securities can be volatile, particularly over the short term. The
Fund may focus on particular sectors of the market from time to time, which can carry greater risks of adverse developments in such sectors. In addition, the
Fund may invest up to 40% of its net assets in stocks of foreign companies, which involve special risks, including currency fluctuations and economic as well as
political uncertainty. The Fund is actively managed but there is no guarantee that the manager’s investment decisions will produce the desired results. The Fund’s
prospectus also includes a description of the main investment risks.
1. The Fund has a fee waiver associated with any investment it makes in a Franklin Templeton money fund and/or other Franklin Templeton fund, contractually guaranteed
through its current fiscal year-end. Fund investment results reflect the fee waiver; without this waiver, the results would have been lower.
2. Cumulative total return represents the change in value of an investment over the periods indicated.
3. Average annual total return represents the average annual change in value of an investment over the periods indicated. Return for less than one year, ifany,hasnotbeen
annualized.
4. Figures are as stated in the Fund’s current prospectus and may differ from the expense ratios disclosed in the Financial Highlights in this report. In periods of market volatility,
assets may decline significantly, causing total annual Fund operating expenses to become higher than the figures shown.
5. Source: Morningstar. The S&P 500 is a market capitalization-weighted index of 500 stocks designed to measure total U.S. equity market performance.
See www.franklintempletondatasources.com for additional data provider information.
18 Annual Report
franklintempleton.com
FRANKLIN GROWTH FUND
Your Fund’s Expenses
As a Fund shareholder, you can incur two types of costs: (1) transaction costs, including sales charges (loads) on Fund purchases and redemptions; and (2) ongoing Fund costs, including management fees, distribution and service (12b-1) fees, and other Fund expenses. All mutual funds have ongoing costs, sometimes referred to as operating expenses. The table below shows ongoing costs of investing in the Fund and can help you understand these costs and compare them with those of other mutual funds. The table assumes a $1,000 investment held for the six months indicated.
Actual Fund Expenses
The table below provides information about actual account values and actual expenses in the columns under the heading “Actual.” In these columns the Fund’s actual return, which includes the effect of Fund expenses, is used to calculate the “Ending Account Value” for each class of shares. You can estimate the expenses you paid during the period by following these steps (of course, your account value and expenses will differ from those in this illustration): Divide your account value by $1,000 (if your account had an $8,600 value, then $8,600 ÷ $1,000 = 8.6). Then multiply the result by the number in the row for your class of shares under the headings “Actual” and “Expenses Paid During Period” (if Actual Expenses Paid During Period were $7.50, then 8.6 x $7.50 = $64.50). In this illustration, the actual expenses paid this period are $64.50.
Hypothetical Example for Comparison with Other Funds
Under the heading “Hypothetical” in the table, information is provided about hypothetical account values and hypothetical expenses based on the Fund’s actual expense ratio and an assumed rate of return of 5% per year before expenses, which is not the Fund’s actual return. This information may not be used to estimate the actual ending account balance or expenses you paid for the period, but it can help you compare ongoing costs of investing in the Fund with those of other funds. To do so, compare this 5% hypothetical example for the class of shares you hold with the 5% hypothetical examples that appear in the shareholder reports of other funds.
Please note that expenses shown in the table are meant to highlight ongoing costs and do not reflect any transactional costs. Therefore, information under the heading “Hypothetical” is useful in comparing ongoing costs only, and will not help you compare total costs of owning different funds. In addition, if transactional costs were included, your total costs would have been higher.
| | | | | | | | | | | | |
| | | | | | | Actual | | Hypothetical | | |
| | | | | (actual return after expenses) | | (5% annual return before expenses) | | |
| | | | | | | Expenses | | | | Expenses | Net | |
| | | Beginning | | Ending | | Paid During | | Ending | | Paid During | Annualized | |
| Share | | Account | | Account | | Period | | Account | | Period | Expense | |
| Class | | Value 4/1/16 | | Value 9/30/16 | | 4/1/16–9/30/161,2 | | Value 9/30/16 | | 4/1/16–9/30/161,2 | Ratio2 | |
| A | $ | 1,000 | $ | 1,068.30 | $ | 4.45 | $ | 1,020.70 | $ | 4.34 | 0.86 | % |
| C | $ | 1,000 | $ | 1,064.20 | $ | 8.31 | $ | 1,016.95 | $ | 8.12 | 1.61 | % |
| R | $ | 1,000 | $ | 1,066.90 | $ | 5.74 | $ | 1,019.45 | $ | 5.60 | 1.11 | % |
| R6 | $ | 1,000 | $ | 1,070.50 | $ | 2.28 | $ | 1,022.80 | $ | 2.23 | 0.44 | % |
| Advisor | $ | 1,000 | $ | 1,069.50 | $ | 3.16 | $ | 1,021.95 | $ | 3.08 | 0.61 | % |
1. Expenses are equal to the annualized expense ratio for the six-month period as indicated above–in the far right column–multiplied by the simple average account value
over the period indicated, and then multiplied by 183/366 to reflect the one-half year period.
2. Reflects expenses after fee waivers and expense reimbursements. Does not include acquired fund fees and expenses.
franklintempleton.com
Annual Report
19
Franklin Income Fund
This annual report for Franklin Income Fund covers the fiscal year ended September 30, 2016.
Your Fund’s Goal and Main Investments
The Fund seeks to maximize income while maintaining prospects for capital appreciation by investing, under normal market conditions, in a diversified portfolio of debt and equity securities.
Performance Overview
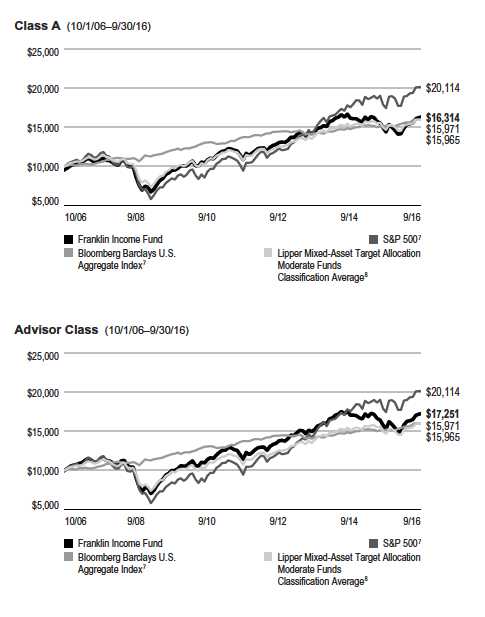
The Fund’s Class A shares delivered a cumulative total return of +13.31% for the 12 months under review. In comparison, the Fund’s equity benchmark, the Standard & Poor’s 500 Index (S&P 500), which is a broad measure of U.S. stock performance, returned +15.43%.1 The Fund’s fixed income benchmark, the Bloomberg Barclays U.S. Aggregate Bond Index, which tracks the U.S. investment-grade, taxable bond market, posted a +5.19% total return.1 The Fund’s peers, as measured by the Lipper Mixed-Asset Target Allocation Moderate Funds Classification Average, which consists of funds chosen by Lipper that, by practice, maintain a mix of 40% to 60% equity securities, with the remainder in bonds and cash, returned +13.31%.2 You can find the Fund’s long-term performance data in the Performance Summary beginning on page 24.
Performance data represent past performance, which does not guarantee future results. Investment return will fluctuate. Current performance may differ from figures shown. Please visit franklintempleton.com or call (800) 342-5236 for most recent month-end performance.
Investment Strategy
By generally performing independent analysis of debt, convertible and equity securities, we search for undervalued or out-of-favor securities we believe offer opportunities for income today and significant growth tomorrow. We consider such factors as a company’s experience and managerial strength; its cash flow potential and profitability; its competitive positioning and advantages; its responsiveness to changes in interest rates and business conditions; debt maturity schedules and borrowing requirements; a company’s changing
| | | | | |
| Dividend Distributions | | | |
| 10/1/15–9/30/16 | | | | |
| | | Dividend per Share (cents) | |
| | | | | | Advisor |
| Month | Class A | Class C | Class R | Class R6 | Class |
| October | 1.00 | 0.90 | 0.93 | 1.04 | 1.02 |
| November | 1.00 | 0.90 | 0.93 | 1.04 | 1.02 |
| December | 1.00 | 0.91 | 0.93 | 1.05 | 1.03 |
| January | 1.00 | 0.91 | 0.93 | 1.05 | 1.03 |
| February | 1.00 | 0.91 | 0.93 | 1.05 | 1.03 |
| March | 1.00 | 0.92 | 0.95 | 1.04 | 1.03 |
| April | 1.00 | 0.92 | 0.95 | 1.04 | 1.03 |
| May | 1.00 | 0.92 | 0.95 | 1.04 | 1.03 |
| June | 1.00 | 0.90 | 0.94 | 1.03 | 1.02 |
| July | 1.00 | 0.90 | 0.94 | 1.03 | 1.02 |
| August | 1.00 | 0.90 | 0.94 | 1.03 | 1.02 |
| September | 1.00 | 0.90 | 0.93 | 1.03 | 1.02 |
| Total | 12.00 | 10.89 | 11.25 | 12.47 | 12.30 |
*The distribution amount is the sum of the dividend payments to shareholders for
the period shown and includes only estimated tax-basis net investment income. All
Fund distributions will vary depending upon current market conditions, and past
distributions are not indicative of future trends.
financial condition and market recognition of the change; and a security’s relative value based on such factors as anticipated cash flow, interest or dividend coverage, asset coverage and earnings.
Manager’s Discussion
During the period under review, we continued to strategically shift the Fund’s asset mix in seeking to manage risks. Thus, our equity holdings declined, while our fixed income holdings increased. The Fund’s equity weighting fell from 65.5% to 57.8% of total net assets. Our fixed income weighting rose from 32.5% to 40.5%. The Fund’s cash position fell from 2.0% to 1.7% of total net assets.
Consistent with the Fund’s long-term strategy, performance was supported by healthy diversification across asset classes and positive overall contributions from the Fund’s equity and fixed income positions.
Among equities, the largest contributors were energy sector positions including Chevron, Royal Dutch Shell and BP.
1. Source: Morningstar.
2. Source: Lipper, a Thomson Reuters Company. For the 12-month period ended 9/30/16, this category consisted of 567 funds. Lipper calculations do not include sales charges
or expense subsidization by a fund’s manager. The Fund’s performance relative to the average may have differed if these and other factors had been considered.
The indexes are unmanaged and include reinvestment of any income or distributions. They do not reflect any fees, expenses or sales charges. One cannot invest directly in an
index, and an index is not representative of the Fund’s portfolio.
The dollar value, number of shares or principal amount, and names of all portfolio holdings are listed in the Fund’s Statement of Investments (SOI).
The SOI begins on page 64.
20 Annual Report
franklintempleton.com
FRANKLIN INCOME FUND
| | |
| Portfolio Sectors/Industries | | |
| 9/30/16 | | |
| | % of Total | |
| | Net Assets | |
| Equity* | 57.8 | % |
| Energy | 9.7 | % |
| Financials** | 8.0 | % |
| Information Technology | 7.5 | % |
| Health Care | 6.5 | % |
| Industrials | 5.6 | % |
| Utilities | 5.2 | % |
| Consumer Discretionary | 5.0 | % |
| Materials | 4.5 | % |
| Consumer Staples | 3.7 | % |
| Other | 2.1 | % |
| Fixed Income*** | 40.5 | % |
| Consumer Discretionary | 6.8 | % |
| Health Care | 6.7 | % |
| Energy | 6.7 | % |
| Financials | 4.8 | % |
| Telecommunication Services | 3.8 | % |
| Industrials | 2.9 | % |
| Information Technology | 2.8 | % |
| Utilities | 2.6 | % |
| Materials | 2.5 | % |
| Other | 0.9 | % |
| Short-Term Investments & Other Net Assets | 1.7 | % |
*Includes convertible bonds.
**Includes options purchased.
***Includes senior floating rate interests.
The equity information technology (IT), industrials and utilities sectors were also significant contributors to Fund performance. During the period, the IT sector surged ahead of all other equity sectors and helped lift the broader market to its fourth consecutive quarterly gain. After barely budging through the first half of 2016, technology-related companies have surged higher since June, dominating the equity-sector leaderboard and topping the S&P 500 Index average by the widest margin since the bull market began more than seven years ago. Aided by reports of rising corporate profits among technology firms—in particular those focused on mobile and cloud platforms—IT led all other sectors in terms of upside earnings surprises. Large-capitalization companies held by the Fund enjoyed strong returns, aided by their dividend component. Part of the allure for investors was valuations, as IT-related companies appeared to be attractively priced, while still offering growth potential. Key IT contributors included Microsoft, Intel and an equity-linked security in Texas Instruments. Microsoft, a software and IT services company, benefited over the past year from investors gaining greater confidence in their ability to be relevant in the cloud-computing era with their key productivity and server software franchises. Specifically, its productivity suite moved rapidly to Office 365, while its server franchise found new growth opportunities with the company’s Azure platform. In addition, the company executed well on various cost containment and capital return initiatives with stepped-up share repurchases and a solid dividend.
In the equity industrials sector, standout contributors included defense contractor Raytheon3 and conglomerates General Electric and United Technologies.
| | |
| Top Five Equity Holdings | | |
| 9/30/16 | | |
| Company | % of Total | |
| Sector/Industry | Net Assets | |
| Royal Dutch Shell PLC | 2.2 | % |
| Energy | | |
| General Electric Co. | 1.6 | % |
| Industrials | | |
| Wells Fargo & Co. | 1.4 | % |
| Financials | | |
| Microsoft Corp. | 1.3 | % |
| Information Technology | | |
| The Coca-Cola Co. | 1.3 | % |
| Consumer Staples | | |
The equity utilities sector continued to provide a solid income stream for the Fund, even as investors sold off their positions and rotated into higher growth, cyclical equity sectors. Many of our positions, including Duke Energy, hit multi-year price peaks in the second quarter, and they generally sold off over the summer amid high valuations and the market’s switch in preference to growth-oriented, cyclical stocks.
Individual equity positions that significantly contributed to Fund performance included chemical manufacturer The Dow Chemical Company, conglomerate E. I. du Pont de Nemours and Company3 and telecommunications provider Verizon Communications.
3. Sold by period-end.
franklintempleton.com
Annual Report
21
| | |
| FRANKLIN INCOME FUND | | |
| |
| |
| |
| Top Five Fixed Income Holdings | | |
| and Senior Floating Rate Interests* | | |
| 9/30/16 | | |
| Company | % of Total | |
| Sector/Industry | Net Assets | |
| JPMorgan Chase & Co. | 1.8 | % |
| Financials | | |
| CHS/Community Health Systems Inc. | 1.7 | % |
| Health Care | | |
| iHeartCommunications Inc. | 1.4 | % |
| Consumer Discretionary | | |
| Chesapeake Energy Corp. | 1.4 | % |
| Energy | | |
| Tenet Healthcare Corp. | 1.4 | % |
| Health Care | | |
| *Does not include convertible bonds. | | |
In contrast, the equity consumer discretionary sector hurt Fund performance. Major detractors included retail chain Target and automobile companies Fiat Chrysler Automobiles3 and Ford Motor.
Individual equity positions that significantly detracted from Fund performance included insurance firm AXA,4 contract logistics and freight management solutions provider Ceva Holdings, and a convertible bond in global oil exploration company Cobalt International Energy.
Many fixed income sectors produced positive performance. In particular, the communications and technology sectors were strong contributors to Fund results.5
Among our fixed income communications positions, telecommunications company Sprint Capital, global satellite services provider EchoStar4 and cable telecommunications company Charter Communications delivered strong performance.
Similar to the equity market, technology high yield bonds also appreciated over the quarter, leading to gains for all of our related positions. Standout fixed-income technology holdings included payment technology solutions developer First Data, data storage company Western Digital and enterprise software maker BMC Software Finance.
Individual fixed income positions that significantly contributed to Fund performance included iron ore producer Fortescue Metals Group, petroleum and natural gas exploration and production company Chesapeake Energy, financial services firm JPMorgan Chase & Co. and liquefied natural gas producer Sabine Pass Liquefaction LNG.
In contrast, the fixed income energy sector hurt Fund performance. Our positions in California Resources,3 Energy XXI Gulf Coast and Sandridge Energy3 were major detractors. These companies, like many other exploration and production companies, were hampered by falling oil prices.
Individual fixed income positions that significantly detracted from Fund performance included health care company Concordia International4 and satellite communications company Intelsat Jackson Holdings.
Thank you for your continued participation in Franklin Income Fund. We look forward to serving your future investment needs.

4. New position during the period.
5. Communications holdings are in consumer discretionary and telecommunication services in the fixed income section of the SOI. Technology holdings are in information
technology and real estate in the fixed income section of the SOI.
See www.franklintempletondatasources.com for additional data provider information.
22 Annual Report
franklintempleton.com
FRANKLIN INCOME FUND
The foregoing information reflects our analysis, opinions and portfolio
holdings as of September 30, 2016, the end of the reporting period.
The way we implement our main investment strategies and the
resulting portfolio holdings may change depending on factors such as
market and economic conditions. These opinions may not be relied
upon as investment advice or an offer for a particular security. The
information is not a complete analysis of every aspect of any market,
country, industry, security or the Fund. Statements of fact are from
sources considered reliable, but the investment manager makes no
representation or warranty as to their completeness or accuracy.
Although historical performance is no guarantee of future results,
these insights may help you understand our investment management
philosophy.
franklintempleton.com
Annual Report
23
FRANKLIN INCOME FUND
Performance Summary as of September 30, 2016
The performance tables and graphs do not reflect any taxes that a shareholder would pay on Fund dividends, capital gain distributions, if any, or any realized gains on the sale of Fund shares. Total return reflects reinvestment of the Fund’s dividends and capital gain distributions, if any, and any unrealized gains or losses. Your dividend income will vary depending on dividends or interest paid by securities in the Fund’s portfolio, adjusted for operating expenses of each class. Capital gain distributions are net profits realized from the sale of portfolio securities.
Performance as of 9/30/161
Cumulative total return excludes sales charges. Average annual total return includes maximum sales charges. Sales charges will vary depending on the size of the investment and the class of share purchased. The maximum is 4.25% and the minimum is 0%. Class A: 4.25% maximum initial sales charge; Advisor Class: no sales charges. For other share classes, visit franklintempleton.com.
| | | | | | |
| | Cumulative | | Average Annual | | Total Annual | |
| Share Class | Total Return2 | | Total Return3 | | Operating Expenses4 | |
| A | | | | | 0.61 | % |
| 1-Year | +13.31 | % | +8.66 | % | | |
| 5-Year | +50.49 | % | +7.56 | % | | |
| 10-Year | +70.12 | % | +5.02 | % | | |
| Advisor | | | | | 0.46 | % |
| 1-Year | +13.06 | % | +13.06 | % | | |
| 5-Year | +51.36 | % | +8.64 | % | | |
| 10-Year | +72.51 | % | +5.60 | % | | |
| |
| |
| | | | 30-Day Standardized Yield6 | |
| | Distribution | | | | | |
| Share Class | Rate5 | | (with waiver) (without waiver) | |
| A | 5.11 | % | 3.90 | % | 3.90 | % |
| Advisor | 5.49 | % | 4.23 | % | 4.23 | % |
Performance data represent past performance, which does not guarantee future results. Investment return and principal value will fluctuate, and you may have a gain or loss when you sell your shares. Current performance may differ from figures shown. For most recent month-end performance, go to franklintempleton.com or call (800) 342-5236.
See page 26 for Performance Summary footnotes.
24 Annual Report
franklintempleton.com
FRANKLIN INCOME FUND
PERFORMANCE SUMMARY
Total Return Index Comparison for a Hypothetical $10,000 Investment1
Total return represents the change in value of an investment over the periods shown. It includes any applicable maximum sales charge, Fund expenses, account fees and reinvested distributions. The unmanaged indexes include reinvestment of any income or distributions. They differ from the Fund in composition and do not pay management fees or expenses. One cannot invest directly in an index.
See page 26 for Performance Summary footnotes.
franklintempleton.com
Annual Report
25
| | | | | |
| FRANKLIN INCOME FUND | | | | | |
| PERFORMANCE SUMMARY | | | | | |
| |
| |
| |
| Net Asset Value | | | | | |
| Share Class (Symbol) | | 9/30/16 | | 9/30/15 | Change |
| A (FKINX) | $ | 2.25 | $ | 2.10 | +$0.15 |
| C (FCISX) | $ | 2.27 | $ | 2.13 | +$0.14 |
| R (FISRX) | $ | 2.21 | $ | 2.07 | +$0.14 |
| R6 (FNCFX) | $ | 2.23 | $ | 2.09 | +$0.14 |
| Advisor (FRIAX) | $ | 2.23 | $ | 2.09 | +$0.14 |
| |
| |
| Distributions9 (10/1/15–9/30/16) | | | | | |
| | | Dividend | | | |
| Share Class | | Income | | | |
| A | $ | 0.1200 | | | |
| C | $ | 0.1089 | | | |
| R | $ | 0.1125 | | | |
| R6 | $ | 0.1247 | | | |
| Advisor | $ | 0.1230 | | | |
Each class of shares is available to certain eligible investors and has different annual fees and expenses, as described in the prospectus.
All investments involve risks, including possible loss of principal. The Fund’s share price and yield will be affected by interest rate movements. Bond prices
generally move in the opposite direction of interest rates. Thus, as prices of bonds in the Fund adjust to a rise in interest rates, the Fund’s share price may
decline. Changes in the financial strength of a bond issuer or in a bond’s credit rating may affect its value. The Fund’s portfolio includes a substantial portion of
higher yielding, lower rated corporate bonds because of the relatively higher yields they offer. Floating-rate loans are lower rated, higher yielding instruments,
which are subject to increased risk of default and can potentially result in loss of principal. These securities carry a greater degree of credit risk relative to
investment-grade securities. Stock prices fluctuate, sometimes rapidly and dramatically, due to factors affecting individual companies, particular industries or
sectors, or general market conditions. The Fund is actively managed but there is no guarantee that the manager’s investment decisions will produce the desired
results. The Fund’s prospectus also includes a description of the main investment risks.
1. The Fund has a fee waiver associated with any investment it makes in a Franklin Templeton money fund and/or other Franklin Templeton fund, contractually guaranteed
through its current fiscal year-end. Fund investment results reflect the fee waiver; without this waiver, the results would have been lower.
2. Cumulative total return represents the change in value of an investment over the periods indicated.
3. Average annual total return represents the average annual change in value of an investment over the periods indicated. Return for less than one year, ifany,hasnotbeen
annualized.
4. Figures are as stated in the Fund’s current prospectus and may differ from the expense ratios disclosed in the Financial Highlights in this report. In periods of market volatility,
assets may decline significantly, causing total annual Fund operating expenses to become higher than the figures shown.
5. Distribution rate is based on an annualization of the respective class’s September dividend and the maximum offering price (NAV for Advisor Class) per share on 9/30/16.
6. The Fund’s 30-day standardized yield is calculated over a trailing 30-day period using the yield to maturity on bonds and/or the dividends accrued on stocks. It may not equal
the Fund’s actual income distribution rate, which reflects the Fund’s past dividends paid to shareholders.
7. Source: Morningstar. The S&P 500 is a market capitalization-weighted index of 500 stocks designed to measure total U.S. equity market performance. The Bloomberg
Barclays U.S. Aggregate Bond Index is a market capitalization-weighted index representing the U.S. investment-grade, fixed-rate, taxable bond market with index components
for government and corporate, mortgage pass-through and asset-backed securities. All issues included are SEC registered, taxable, dollar denominated and nonconvertible,
must have at least one year to final maturity and must be rated investment grade (Baa3/BBB-/BBB- or higher) using the middle rating of Moody’s, S&P and Fitch, respectively.
8. Source: Lipper, a Thomas Reuters Company. The Lipper Mixed-Asset Target Allocation Moderate Funds Classification Average is calculated by averaging the total returns of
all funds within the Lipper Mixed-Asset Target Allocation Moderate Funds classification in the Lipper Open-End underlying funds universe. Lipper Mixed-Asset Target Allocation
Moderate Funds are defined as funds that, by portfolio practice, maintain a mix of between 40%—60% equity securities, with the remainder invested in bonds, cash and cash
equivalents. For the 12-month period ended 9/30/16, there were 567 funds in this category. Lipper calculations do not include sales charges or expense subsidization by a
fund’s manager. The Fund’s performance relative to the average may have differed if these and other factors had been considered.
9. The distribution amount is the sum of the dividend payments to shareholders for the period shown and includes only estimated tax-basis net investment income.
See www.franklintempletondatasources.com for additional data provider information.
26 Annual Report
franklintempleton.com
FRANKLIN INCOME FUND
Your Fund’s Expenses
As a Fund shareholder, you can incur two types of costs: (1) transaction costs, including sales charges (loads) on Fund purchases and redemptions; and (2) ongoing Fund costs, including management fees, distribution and service (12b-1) fees, and other Fund expenses. All mutual funds have ongoing costs, sometimes referred to as operating expenses. The table below shows ongoing costs of investing in the Fund and can help you understand these costs and compare them with those of other mutual funds. The table assumes a $1,000 investment held for the six months indicated.
Actual Fund Expenses
The table below provides information about actual account values and actual expenses in the columns under the heading “Actual.” In these columns the Fund’s actual return, which includes the effect of Fund expenses, is used to calculate the “Ending Account Value” for each class of shares. You can estimate the expenses you paid during the period by following these steps (of course, your account value and expenses will differ from those in this illustration): Divide your account value by $1,000 (if your account had an $8,600 value, then $8,600 ÷ $1,000 = 8.6). Then multiply the result by the number in the row for your class of shares under the headings “Actual” and “Expenses Paid During Period” (if Actual Expenses Paid During Period were $7.50, then 8.6 x $7.50 = $64.50). In this illustration, the actual expenses paid this period are $64.50.
Hypothetical Example for Comparison with Other Funds
Under the heading “Hypothetical” in the table, information is provided about hypothetical account values and hypothetical expenses based on the Fund’s actual expense ratio and an assumed rate of return of 5% per year before expenses, which is not the Fund’s actual return. This information may not be used to estimate the actual ending account balance or expenses you paid for the period, but it can help you compare ongoing costs of investing in the Fund with those of other funds. To do so, compare this 5% hypothetical example for the class of shares you hold with the 5% hypothetical examples that appear in the shareholder reports of other funds.
Please note that expenses shown in the table are meant to highlight ongoing costs and do not reflect any transactional costs. Therefore, information under the heading “Hypothetical” is useful in comparing ongoing costs only, and will not help you compare total costs of owning different funds. In addition, if transactional costs were included, your total costs would have been higher.
| | | | | | | | | | | | |
| | | | | | | Actual | | Hypothetical | | |
| | | | | (actual return after expenses) | | (5% annual return before expenses) | | |
| | | | | | | Expenses | | | | Expenses | Net | |
| | | Beginning | | Ending | | Paid During | | Ending | | Paid During | Annualized | |
| Share | | Account | | Account | | Period | | Account | | Period | Expense | |
| Class | | Value 4/1/16 | | Value 9/30/16 | | 4/1/16–9/30/161,2 | | Value 9/30/16 | | 4/1/16–9/30/161,2 | Ratio2 | |
| A | $ | 1,000 | $ | 1,096.10 | $ | 3.25 | $ | 1,021.90 | $ | 3.13 | 0.62 | % |
| C | $ | 1,000 | $ | 1,087.20 | $ | 5.84 | $ | 1,019.40 | $ | 5.65 | 1.12 | % |
| R | $ | 1,000 | $ | 1,090.90 | $ | 5.07 | $ | 1,020.15 | $ | 4.90 | 0.97 | % |
| R6 | $ | 1,000 | $ | 1,092.80 | $ | 2.04 | $ | 1,023.05 | $ | 1.97 | 0.39 | % |
| Advisor | $ | 1,000 | $ | 1,092.50 | $ | 2.46 | $ | 1,022.65 | $ | 2.38 | 0.47 | % |
1. Expenses are equal to the annualized expense ratio for the six-month period as indicated above–in the far right column–multiplied by the simple average account value
over the period indicated, and then multiplied by 183/366 to reflect the one-half year period.
2. Reflects expenses after fee waivers and expense reimbursements. Does not include acquired fund fees and expenses.
franklintempleton.com
Annual Report
27
Franklin U.S. Government Securities Fund
We are pleased to bring you Franklin U.S. Government Securities Fund’s annual report for the fiscal year ended September 30, 2016.
Your Fund’s Goal and Main Investments
The Fund seeks income by investing at least 80% of its net assets in U.S. government securities. The Fund presently invests substantially all of its assets in Government National Mortgage Association obligations (Ginnie Maes).
Since 1983, the Fund has invested substantially in Ginnie Mae securities, which carry a guarantee backed by the full faith and credit of the U.S. government as to the timely payment of interest and principal.1 Issued by the Government National Mortgage Association (GNMA), Ginnie Maes have been among the highest yielding U.S. government obligations available.
| | |
| Portfolio Sectors/Industries | | |
| Based on Total Net Assets as of 9/30/16 | | |
| |
| GNMA | 98.4 | % |
| Short-Term Investments & Other Net Assets | 1.6 | % |
Performance Overview
The Fund’s Class A shares generated a +2.35% cumulative total return for the 12 months under review. In comparison, the Fund’s peers, as measured by the Lipper GNMA Funds Classification Average, which consists of funds chosen by Lipper that invest primarily in GNMAs, posted a +2.46% total return.2 The Bloomberg Barclays U.S. Government Index: Intermediate Component, the intermediate component of the Barclays U.S. Government Index, returned +2.44% for the same period.3 You can find more of the Fund’s performance data in the Performance Summary beginning on page 30.
Performance data represent past performance, which does not guarantee future results. Investment return and principal value will fluctuate, and you may have a gain or loss when you sell your shares. Current performance may differ from figures shown. For most recent month-end performance, go to franklintempleton.com or call (800) 342-5236.
Investment Strategy
We currently invest the Fund’s assets predominantly in GNMA obligations. We analyze securities using proprietary models to help us identify attractive investment opportunities. The Fund’s short-term investments may include short-term government securities and cash or cash equivalents.
| | | | | |
| Dividend Distributions | | | |
| 10/1/15–9/30/16 | | | | |
| | | Dividend per Share (cents) | |
| | | | | | Advisor |
| Month | Class A | Class C | Class R | Class R6 | Class |
| October | 1.75 | 1.48 | 1.56 | 1.90 | 1.83 |
| November | 1.70 | 1.44 | 1.52 | 1.85 | 1.78 |
| December | 1.74 | 1.47 | 1.55 | 1.89 | 1.82 |
| January | 1.67 | 1.40 | 1.49 | 1.82 | 1.75 |
| February | 1.64 | 1.39 | 1.46 | 1.78 | 1.71 |
| March | 1.67 | 1.40 | 1.47 | 1.82 | 1.75 |
| April | 1.65 | 1.39 | 1.47 | 1.79 | 1.73 |
| May | 1.67 | 1.43 | 1.50 | 1.81 | 1.74 |
| June | 1.62 | 1.36 | 1.44 | 1.76 | 1.70 |
| July | 1.57 | 1.30 | 1.38 | 1.73 | 1.65 |
| August | 1.59 | 1.32 | 1.40 | 1.74 | 1.67 |
| September | 1.53 | 1.27 | 1.34 | 1.68 | 1.61 |
| Total | 19.80 | 16.65 | 17.58 | 21.57 | 20.74 |
Manager’s Discussion
U.S. economic indicators were generally encouraging during the reporting period. Steady growth in the services sector created new jobs and slightly boosted employment levels. Retail sales grew for most of the period. Low energy prices pulled inflation lower. In this environment, home sales and prices grew.
Ginnie Mae (GNMA) mortgage-backed securities (MBS) produced positive excess returns and outpaced Treasuries.
In our view, agency MBS remained close to fully valued. The Fed’s continued participation in agency MBS has, in our view, kept mortgage valuations high compared to historical metrics.
1. Securities owned by the Fund, but not shares of the Fund, are guaranteed by the U.S. government, its agencies or instrumentalities as to timely payment of principal and
interest. The Fund’s yield and share price are not guaranteed and will vary with market conditions.
2. Source: Lipper, a Thomson Reuters Company. For the 12-month period ended 9/30/16, there were 61 funds in this category. Lipper calculations do not include sales charges
or expense subsidization by a fund’s manager. The Fund’s performance relative to the average may have differed if these or other factors had been considered.
3. Source: Morningstar.
The indexes are unmanaged and include reinvestment of any income or distributions. They do not reflect any fees, expenses or sales charges. One cannot invest directly in an
index, and an index is not representative of the Fund’s portfolio.
See www.franklintempletondatasources.com for additional data provider information.
The dollar value, number of shares or principal amount, and names of all portfolio holdings are listed in the Fund’s Statement of Investments (SOI).
The SOI begins on page 85.
28 Annual Report
franklintempleton.com
FRANKLIN U.S. GOVERNMENT SECURITIES FUND
Once the Fed moves closer to ceasing or tapering reinvestment in MBS, questions may persist about the demand source for agency MBS. We felt demand from banks, mortgage real estate investment trusts, overseas investors and domestic money managers would need to rise to compensate for the Fed’s reduced presence in the MBS sector. We believed prepayment levels could moderate with mortgage rates staying in the same range and underwriting standards remaining tight.
Within the agency mortgage pass-through sector, GNMA MBS outpaced their Freddie Mac MBS and Fannie Mae MBS counterparts. On a total return basis, GNMA 3.0% coupons were the best performers, while 5.0% coupons generally lagged.
The Fund maintains a conservative, disciplined investment strategy and invests entirely in GNMA mortgage pass-throughs, which remain the only MBS that are backed by the full faith and credit of the U.S. government—the same guarantee applicable to U.S. Treasuries.1 Our collateral-intensive research approach can allow us to uncover dislocations across the GNMA markets and associated misvaluation of prepayment risk. We continue to focus on specified pools where we believe our experience and continual investment in new technologies help us uncover these discrepancies.
During the period, we were more weighted toward GNMA IIs (pools of mortgages from multiple issuers) than GNMA Is (pools of mortgages from single issuers). Over the period, we added to GNMA II 3.0% and 3.5% coupons, while reducing exposure to 4.5%, 5.0%, 5.5% and 6.0% coupons. Our heaviest allocation was in 3.5%, 4.0% and 4.5% coupons at period-end. The Fund’s positions in higher coupon—4.0% through 6.5%—GNMA securities generally benefited performance, while our allocation to 3.0% and 3.5% coupon GNMAs detracted from performance.
Thank you for your continued participation in Franklin U.S. Government Securities Fund. We welcome your comments and questions and look forward to serving your investment needs in the years ahead.

The foregoing information reflects our analysis, opinions and portfolio holdings as of September 30, 2016, the end of the reporting period. The way we implement our main investment strategies and the resulting portfolio holdings may change depending on factors such as market and economic conditions. These opinions may not be relied upon as investment advice or an offer for a particular security. The information is not a complete analysis of every aspect of any market, country, industry, security or the Fund. Statements of fact are from sources considered reliable, but the investment manager makes no representation or warranty as to their completeness or accuracy. Although historical performance is no guarantee of future results, these insights may help you understand our investment management philosophy.
franklintempleton.com
Annual Report
29
FRANKLIN U.S. GOVERNMENT SECURITIES FUND
Performance Summary as of September 30, 2016
The performance table and graphs do not reflect any taxes that a shareholder would pay on Fund dividends, capital gain distributions, if any, or any realized gains on the sale of Fund shares. Total return reflects reinvestment of the Fund’s dividends and capital gain distributions, if any, and any unrealized gains or losses.
Performance as of 9/30/161
Cumulative total return excludes sales charges. Average annual total returns include maximum sales charges. Sales charges will vary depending on the size of the investment and the class of share purchased. The maximum is 4.25% and the minimum is 0%. Class A: 4.25% maximum initial sales charge; Advisor Class: no sales charges. For other share classes, visit franklintempleton.com.
| | | | | | |
| | Cumulative | | Average Annual | | Total Annual | |
| Share Class | Total Return2 | | Total Return3 | | Operating Expenses4 | |
| A | | | | | 0.76 | % |
| 1-Year | +2.35 | % | -1.94 | % | | |
| 5-Year | +8.89 | % | +0.83 | % | | |
| 10-Year | +47.05 | % | +3.47 | % | | |
| Advisor | | | | | 0.61 | % |
| 1-Year | +2.49 | % | +2.49 | % | | |
| 5-Year | +9.68 | % | +1.86 | % | | |
| 10-Year | +49.00 | % | +4.07 | % | | |
| | | | | | |
| | Distribution | | 30-Day Standardized Yield6 | |
| Share Class | Rate5 | | (with waiver) | | (without waiver) | |
| |
| A | 2.77 | % | 1.87 | % | 1.86 | % |
| |
| Advisor | 3.03 | % | 2.09 | % | 2.09 | % |
Performance data represent past performance, which does not guarantee future results. Investment return and principal value will fluctuate, and you may have a gain or loss when you sell your shares. Current performance may differ from figures shown. For most recent month-end performance, go to franklintempleton.com or call (800) 342-5236.
See page 32 for Performance Summary footnotes.
30 Annual Report
franklintempleton.com
FRANKLIN U.S. GOVERNMENT SECURITIES FUND
PERFORMANCE SUMMARY
Total Return Index Comparison for a Hypothetical $10,000 Investment1
Total return represents the change in value of an investment over the periods shown. It includes any applicable maximum sales charge, Fund expenses, account fees and reinvested distributions. The unmanaged indexes include reinvestment of any income or distributions. They differ from the Fund in composition and do not pay management fees or expenses. One cannot invest directly in an index.
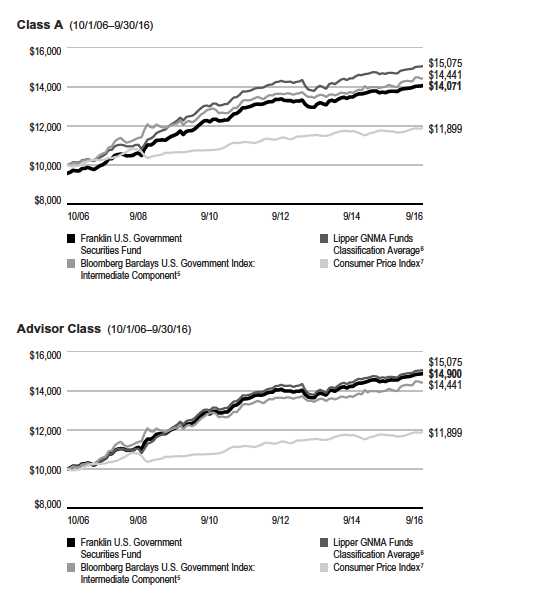
See page 32 for Performance Summary footnotes.
franklintempleton.com
Annual Report
31
FRANKLIN U.S. GOVERNMENT SECURITIES FUND
PERFORMANCE SUMMARY
Each class of shares is available to certain eligible investors and has different annual fees and expenses, as described in the prospectus.
All investments involve risks, including possible loss of principal. The Fund’s share price and yield will be affected by interest rate movements and mortgage
prepayments. Bond prices generally move in the opposite direction of interest rates. Thus, as prices of bonds in the Fund adjust to a rise in interest rates, the
Fund’s share price may decline. Changes in the financial strength of a bond issuer or in a bond’s credit rating may affect its value. The Fund is actively managed
but there is no guarantee that the manager’s investment decisions will produce the desired results. The Fund’s prospectus also includes a description of the
main investment risks.
1. The Fund has a fee waiver associated with any investment it makes in a Franklin Templeton money fund and/or other Franklin Templeton fund, contractually guaranteed
through its current fiscal year-end. Fund investment results reflect the fee waiver; without this waiver, the results would have been lower.
2. Cumulative total return represents the change in value of an investment over the periods indicated.
3. Average annual total return represents the average annual change in value of an investment over the periods indicated. Return for less than one year, ifany,hasnotbeen
annualized.
4. Figures are as stated in the Fund’s current prospectus and may differ from the expense ratios disclosed in the Financial Highlights in this report. In periods of market volatility,
assets may decline significantly, causing total annual Fund operating expenses to become higher than the figures shown.
5. Source: Morningstar. The Bloomberg Barclays U.S. Government Index: Intermediate Component is the intermediate component of the Bloomberg Barclays U.S. Government
Index, which includes public obligations of the U.S. Treasury with at least one year to final maturity and publicly issued debt of U.S. government agencies, quasi-federal
corporations, and corporate or foreign debt guaranteed by the U.S. government.
6. Source: Lipper, a Thomson Reuters Company. The Lipper GNMA Funds Classification Average is calculated by averaging the total return for all funds within the Lipper
GNMA Funds classification in the Lipper Open-End underlying funds universe for the period indicated. Lipper GNMA Funds are defined as funds that invest primarily in
Government National Mortgage Association securities. For the 12-month period ended 9/30/16, there were 61 funds in this category. Lipper calculations do not include sales
charges or expense subsidization by a fund’s manager. The Fund’s performance relative to the average may have differed if these or other factors had been considered.
7. Source: Bureau of Labor Statistics, bls.gov/cpi. The Consumer Price Index (CPI) is a commonly used measure of the inflation rate.
See www.franklintempletondatasources.com for additional data provider information.
32 Annual Report
franklintempleton.com
FRANKLIN U.S. GOVERNMENT SECURITIES FUND
Your Fund’s Expenses
As a Fund shareholder, you can incur two types of costs: (1) transaction costs, including sales charges (loads) on Fund purchases and redemptions; and (2) ongoing Fund costs, including management fees, distribution and service (12b-1) fees, and other Fund expenses. All mutual funds have ongoing costs, sometimes referred to as operating expenses. The table below shows ongoing costs of investing in the Fund and can help you understand these costs and compare them with those of other mutual funds. The table assumes a $1,000 investment held for the six months indicated.
Actual Fund Expenses
The table below provides information about actual account values and actual expenses in the columns under the heading “Actual.” In these columns the Fund’s actual return, which includes the effect of Fund expenses, is used to calculate the “Ending Account Value” for each class of shares. You can estimate the expenses you paid during the period by following these steps (of course, your account value and expenses will differ from those in this illustration): Divide your account value by $1,000 (if your account had an $8,600 value, then $8,600 ÷ $1,000 = 8.6). Then multiply the result by the number in the row for your class of shares under the headings “Actual” and “Expenses Paid During Period” (if Actual Expenses Paid During Period were $7.50, then 8.6 x $7.50 = $64.50). In this illustration, the actual expenses paid this period are $64.50.
Hypothetical Example for Comparison with Other Funds
Under the heading “Hypothetical” in the table, information is provided about hypothetical account values and hypothetical expenses based on the Fund’s actual expense ratio and an assumed rate of return of 5% per year before expenses, which is not the Fund’s actual return. This information may not be used to estimate the actual ending account balance or expenses you paid for the period, but it can help you compare ongoing costs of investing in the Fund with those of other funds. To do so, compare this 5% hypothetical example for the class of shares you hold with the 5% hypothetical examples that appear in the shareholder reports of other funds.
Please note that expenses shown in the table are meant to highlight ongoing costs and do not reflect any transactional costs. Therefore, information under the heading “Hypothetical” is useful in comparing ongoing costs only, and will not help you compare total costs of owning different funds. In addition, if transactional costs were included, your total costs would have been higher.
| | | | | | | | | | | | |
| | | | | | | Actual | | Hypothetical | | |
| | | | | (actual return after expenses) | | (5% annual return before expenses) | | |
| | | | | | | Expenses | | | | Expenses | Net | |
| | | Beginning | | Ending | | Paid During | | Ending | | Paid During | Annualized | |
| Share | | Account | | Account | | Period | | Account | | Period | Expense | |
| Class | | Value 4/1/16 | | Value 9/30/16 | | 4/1/16–9/30/161,2 | | Value 9/30/16 | | 4/1/16–9/30/161,2 | Ratio2 | |
| A | $ | 1,000 | $ | 1,012.10 | $ | 3.82 | $ | 1,021.20 | $ | 3.84 | 0.76 | % |
| C | $ | 1,000 | $ | 1,008.10 | $ | 6.33 | $ | 1,018.70 | $ | 6.36 | 1.26 | % |
| R | $ | 1,000 | $ | 1,008.70 | $ | 5.57 | $ | 1,019.45 | $ | 5.60 | 1.11 | % |
| R6 | $ | 1,000 | $ | 1,013.40 | $ | 2.42 | $ | 1,022.60 | $ | 2.43 | 0.48 | % |
| Advisor | $ | 1,000 | $ | 1,012.80 | $ | 3.07 | $ | 1,021.95 | $ | 3.08 | 0.61 | % |
1. Expenses are equal to the annualized expense ratio for the six-month period as indicated above–in the far right column–multiplied by the simple average account value
over the period indicated, and then multiplied by 183/366 to reflect the one-half year period.
2. Reflects expenses after fee waivers and expense reimbursements. Does not include acquired fund fees and expenses.
franklintempleton.com
Annual Report
33
Franklin Utilities Fund
This annual report for Franklin Utilities Fund covers the fiscal year ended September 30, 2016.
Your Fund’s Goal and Main Investments
The Fund seeks both capital appreciation and current income by investing at least 80% of its net assets in public utility company securities.
Performance Overview
The Fund’s Class A shares delivered a +18.23% cumulative total return for the 12 months under review. In comparison, the Standard & Poor’s 500 (S&P 500) Index, which is a broad measure of U.S. stock performance, generated a +15.43% total return, and the S&P 500 Utilities Index, which measures the performance of all utilities stocks in the S&P 500 Index, produced a +17.37% total return.1 You can find the Fund’s long-term performance data in the Performance Summary beginning on page 36.
Performance data represent past performance, which does not guarantee future results. Investment return will fluctuate. Current performance may differ from figures shown. Please visit franklintempleton.com or call (800) 342-5236 for most recent month-end performance.
Investment Strategy
We search for the best return opportunities available in the global utilities arena with a specific focus on the U.S. electricity and gas sector. Generally, we look for companies producing a high percentage of earnings from regulated utility franchise operations.
Manager’s Discussion
The Fund’s utilities holdings contributed notably to absolute performance during the reporting period.2 Clean energy company NextEra Energy benefited from federal tax legislation passed in December 2015, which extended production tax credit opportunities on developers of renewable energy plants. The company also benefited from favorable regulatory treatment in Florida. Electric utility provider Westar Energy announced it would be acquired by Great Plains Energy at a significant premium share price. Electric power generator, distributor and structured finance provider Edison International
performed well after investor concerns about a negative regulatory outcome regarding the retirement of the San Onofre Nuclear Station retirement abated.
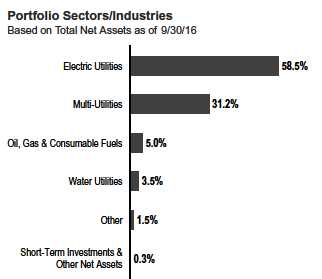
All sectors the Fund invested in produced positive performance on an absolute basis during the period. However, some individual positions detracted from Fund results. In particular, our positions in pipeline holding company Plains GP Holdings, natural gas and refined petroleum products producer Kinder Morgan and natural gas, petroleum and electricity power producer The Williams Companies suffered from a decline in commodity prices that stressed markets and reduced the companies’ access to new capital to fund growth projects. These conditions forced the companies to reduce their dividends to ensure access to capital.
1. Source: Morningstar.
The indexes are unmanaged and include reinvested dividends. They do not reflect any fees, expenses or sales charges. One cannot invest directly in an index, and an index is
not representative of the Fund’s portfolio.
2. The utilities sector comprises electric utilities, gas utilities, multi-utilities and water utilities in the SOI.
The dollar value, number of shares or principal amount, and names of all portfolio holdings are listed in the Fund’s Statement of Investments (SOI).
The SOI begins on page 93.
34 Annual Report
franklintempleton.com
FRANKLIN UTILITIES FUND
| | |
| Top 10 Holdings | | |
| 9/30/16 | | |
| Company | % of Total | |
| Sector/Industry | Net Assets | |
| NextEra Energy Inc. | 5.6 | % |
| Electric Utilities | | |
| Edison International | 5.0 | % |
| Electric Utilities | | |
| Dominion Resources Inc. | 4.9 | % |
| Multi-Utilities | | |
| Sempra Energy | 4.7 | % |
| Multi-Utilities | | |
| PG&E Corp. | 4.5 | % |
| Electric Utilities | | |
| Duke Energy Corp. | 4.4 | % |
| Electric Utilities | | |
| American Electric Power Co. Inc. | 4.1 | % |
| Electric Utilities | | |
| The Southern Co. | 3.7 | % |
| Electric Utilities | | |
| Exelon Corp. | 3.5 | % |
| Electric Utilities | | |
| CMS Energy Corp. | 3.2 | % |
| Multi-Utilities | | |
Thank you for your continued participation in Franklin Utilities Fund. We look forward to serving your future investment needs.

The foregoing information reflects our analysis, opinions and portfolio holdings as of September 30, 2016, the end of the reporting period. The way we implement our main investment strategies and the resulting portfolio holdings may change depending on factors such as market and economic conditions. These opinions may not be relied upon as investment advice or an offer for a particular security. The information is not a complete analysis of every aspect of any market, country, industry, security or the Fund. Statements of fact are from sources considered reliable, but the investment manager makes no representation or warranty as to their completeness or accuracy. Although historical performance is no guarantee of future results, these insights may help you understand our investment management philosophy.
franklintempleton.com
Annual Report
35
FRANKLIN UTILITIES FUND
Performance Summary as of September 30, 2016
The performance tables and graphs do not reflect any taxes that a shareholder would pay on Fund dividends, capital gain distributions, if any, or any realized gains on the sale of Fund shares. Total return reflects reinvestment of the Fund’s dividends and capital gain distributions, if any, and any unrealized gains or losses. Your dividend income will vary depending on dividends or interest paid by securities in the Fund’s portfolio, adjusted for operating expenses of each class. Capital gain distributions are net profits realized from the sale of portfolio securities.
Performance as of 9/30/161
Cumulative total return excludes sales charges. Average annual total return includes maximum sales charges. Sales charges will vary depending on the size of the investment and the class of share purchased. The maximum is 4.25% and the minimum is 0%. Class A: 4.25% maximum initial sales charge; Advisor Class: no sales charges. For other share classes, visit franklintempleton.com.
| | | | | | |
| | Cumulative | | Average Annual | | Total Annual | |
| Share Class | Total Return2 | | Total Return3 | | Operating Expenses4 | |
| A | | | | | 0.73 | % |
| 1-Year | +18.23 | % | +13.23 | % | | |
| 5-Year | +78.84 | % | +11.36 | % | | |
| 10-Year | +128.51 | % | +8.15 | % | | |
| Advisor | | | | | 0.58 | % |
| 1-Year | +18.34 | % | +18.34 | % | | |
| 5-Year | +80.13 | % | +12.49 | % | | |
| 10-Year | +131.83 | % | +8.77 | % | | |
| |
| |
| | | | 30-Day Standardized Yield6 | |
| | Distribution | | | | | |
| Share Class | Rate5 | | (with waiver) (without waiver) | |
| A | 2.47 | % | 2.60 | % | 2.60 | % |
| Advisor | 2.72 | % | 2.86 | % | 2.86 | % |
Performance data represent past performance, which does not guarantee future results. Investment return and principal value will fluctuate, and you may have a gain or loss when you sell your shares. Current performance may differ from figures shown. For most recent month-end performance, go to franklintempleton.com or call (800) 342-5236.
See page 38 for Performance Summary footnotes.
36 Annual Report
franklintempleton.com
FRANKLIN UTILITIES FUND
PERFORMANCE SUMMARY
Total Return Index Comparison for a Hypothetical $10,000 Investment1
Total return represents the change in value of an investment over the periods shown. It includes any applicable maximum sales charge, Fund expenses, account fees and reinvested distributions. The unmanaged indexes include reinvestment of any income or distributions. They differ from the Fund in composition and do not pay management fees or expenses. One cannot invest directly in an index.
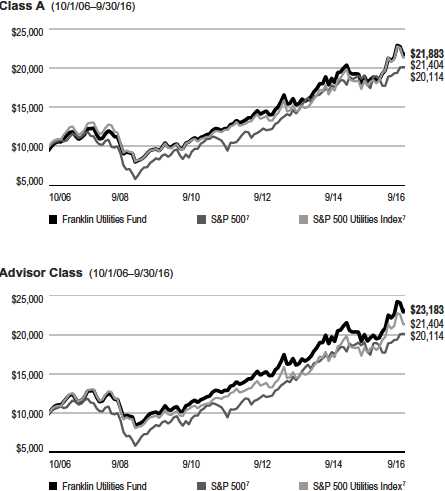
See page 38 for Performance Summary footnotes.
franklintempleton.com
Annual Report
37
| | | | | | | | |
| FRANKLIN UTILITIES FUND | | | | | | | | |
| PERFORMANCE SUMMARY | | | | | | | | |
| |
| |
| |
| Net Asset Value | | | | | | | | |
| Share Class (Symbol) | | 9/30/16 | | 9/30/15 | | Change | | |
| A (FKUTX) | $ | 17.85 | $ | 16.08 | +$ | 1.77 | | |
| C (FRUSX) | $ | 17.76 | $ | 16.01 | +$ | 1.75 | | |
| R (FRURX) | $ | 17.78 | $ | 16.02 | +$ | 1.76 | | |
| R6 (FUFRX) | $ | 17.97 | $ | 16.18 | +$ | 1.79 | | |
| Advisor (FRUAX) | $ | 17.97 | $ | 16.19 | +$ | 1.78 | | |
| |
| |
| Distributions8 (10/1/15–9/30/16) | | | | | | | | |
| | | Dividend | | Short-Term | | Long-Term | | |
| Share Class | | Income | | Capital Gain | | Capital Gain | | Total |
| A | $ | 0.5000 | $ | 0.0339 | $ | 0.4872 | $ | 1.0211 |
| C | $ | 0.4157 | $ | 0.0339 | $ | 0.4872 | $ | 0.9368 |
| R | $ | 0.4403 | $ | 0.0339 | $ | 0.4872 | $ | 0.9614 |
| R6 | $ | 0.5443 | $ | 0.0339 | $ | 0.4872 | $ | 1.0654 |
| Advisor | $ | 0.5253 | $ | 0.0339 | $ | 0.4872 | $ | 1.0464 |
Each class of shares is available to certain eligible investors and has different annual fees and expenses, as described in the prospectus.
All investments involve risks, including possible loss of principal. In addition to other factors, securities issued by utility companies have been historically
sensitive to interest rate changes. When interest rates fall, utility securities prices, and thus a utilities fund’s share price, tend to rise; when interest rates rise, their
prices generally fall. The Fund is actively managed but there is no guarantee that the manager’s investment decisions will produce the desired results. The Fund’s
prospectus also includes a description of the main investment risks.
1. The Fund has a fee waiver associated with any investment it makes in a Franklin Templeton money fund and/or other Franklin Templeton fund, contractually guaranteed
through its current fiscal year-end. Fund investment results reflect the fee waiver; without this waiver, the results would have been lower.
2. Cumulative total return represents the change in value of an investment over the periods indicated.
3. Average annual total return represents the average annual change in value of an investment over the periods indicated. Return for less than one year, ifany,hasnotbeen
annualized.
4. Figures are as stated in the Fund’s current prospectus and may differ from the expense ratios disclosed in the Financial Highlights in this report. In periods of market volatility,
assets may decline significantly, causing total annual Fund operating expenses to become higher than the figures shown.
5. Distribution rate is based on an annualization of the respective class’s current quarterly dividend and the maximum offering price (NAV for Advisor Class) per share on
9/30/16.
6. The Fund’s 30-day standardized yield is calculated over a trailing 30-day period using the yield to maturity on bonds and/or the dividends accrued on stocks. It may not equal
the Fund’s actual income distribution rate, which reflects the Fund’s past dividends paid to shareholders.
7. Source: Morningstar. The S&P 500 Index is a market capitalization-weighted index of 500 stocks designed to measure total U.S. equity market performance. The S&P 500
Utilities Index is market capitalization weighted and consists of all utility stocks in the S&P 500 Index.
8. The distribution amount is the sum of the dividend payments to shareholders for the period shown and includes only estimated tax-basis net investment income and capital
gain.
See www.franklintempletondatasources.com for additional data provider information.
38 Annual Report
franklintempleton.com
FRANKLIN UTILITIES FUND
Your Fund’s Expenses
As a Fund shareholder, you can incur two types of costs: (1) transaction costs, including sales charges (loads) on Fund purchases and redemptions; and (2) ongoing Fund costs, including management fees, distribution and service (12b-1) fees, and other Fund expenses. All mutual funds have ongoing costs, sometimes referred to as operating expenses. The table below shows ongoing costs of investing in the Fund and can help you understand these costs and compare them with those of other mutual funds. The table assumes a $1,000 investment held for the six months indicated.
Actual Fund Expenses
The table below provides information about actual account values and actual expenses in the columns under the heading “Actual.” In these columns the Fund’s actual return, which includes the effect of Fund expenses, is used to calculate the “Ending Account Value” for each class of shares. You can estimate the expenses you paid during the period by following these steps (of course, your account value and expenses will differ from those in this illustration): Divide your account value by $1,000 (if your account had an $8,600 value, then $8,600 ÷ $1,000 = 8.6). Then multiply the result by the number in the row for your class of shares under the headings “Actual” and “Expenses Paid During Period” (if Actual Expenses Paid During Period were $7.50, then 8.6 x $7.50 = $64.50). In this illustration, the actual expenses paid this period are $64.50.
Hypothetical Example for Comparison with Other Funds
Under the heading “Hypothetical” in the table, information is provided about hypothetical account values and hypothetical expenses based on the Fund’s actual expense ratio and an assumed rate of return of 5% per year before expenses, which is not the Fund’s actual return. This information may not be used to estimate the actual ending account balance or expenses you paid for the period, but it can help you compare ongoing costs of investing in the Fund with those of other funds. To do so, compare this 5% hypothetical example for the class of shares you hold with the 5% hypothetical examples that appear in the shareholder reports of other funds.
Please note that expenses shown in the table are meant to highlight ongoing costs and do not reflect any transactional costs. Therefore, information under the heading “Hypothetical” is useful in comparing ongoing costs only, and will not help you compare total costs of owning different funds. In addition, if transactional costs were included, your total costs would have been higher.
| | | | | | | | | | | | |
| | | | | | | Actual | | Hypothetical | | |
| | | | | (actual return after expenses) | | (5% annual return before expenses) | | |
| | | | | | | Expenses | | | | Expenses | Net | |
| | | Beginning | | Ending | | Paid During | | Ending | | Paid During | Annualized | |
| Share | | Account | | Account | | Period | | Account | | Period | Expense | |
| Class | | Value 4/1/16 | | Value 9/30/16 | | 4/1/16–9/30/161,2 | | Value 9/30/16 | | 4/1/16–9/30/161,2 | Ratio2 | |
| A | $ | 1,000 | $ | 1,029.30 | $ | 3.65 | $ | 1,021.40 | $ | 3.64 | 0.72 | % |
| C | $ | 1,000 | $ | 1,026.90 | $ | 6.18 | $ | 1,018.90 | $ | 6.16 | 1.22 | % |
| R | $ | 1,000 | $ | 1,027.60 | $ | 5.42 | $ | 1,019.65 | $ | 5.40 | 1.07 | % |
| R6 | $ | 1,000 | $ | 1,030.30 | $ | 2.39 | $ | 1,022.65 | $ | 2.38 | 0.47 | % |
| Advisor | $ | 1,000 | $ | 1,029.80 | $ | 2.89 | $ | 1,022.15 | $ | 2.88 | 0.57 | % |
1. Expenses are equal to the annualized expense ratio for the six-month period as indicated above–in the far right column–multiplied by the simple average account value
over the period indicated, and then multiplied by 183/366 to reflect the one-half year period.
2. Reflects expenses after fee waivers and expense reimbursements. Does not include acquired fund fees and expenses.
franklintempleton.com
Annual Report
39
| | | | | | | | | | | | | | | |
| FRANKLIN CUSTODIAN FUNDS | | | | | | | | | | | | | | | |
| |
| |
| |
| Financial Highlights | | | | | | | | | | | | | | | |
| Franklin DynaTech Fund | | | | | | | | | | | | | | | |
| | | | | | Year Ended September 30, | | | | |
| | | 2016 | | | 2015 | | | 2014 | | | 2013 | | | 2012 | |
| Class A | | | | | | | | | | | | | | | |
| Per share operating performance | | | | | | | | | | | | | | | |
| (for a share outstanding throughout the year) | | | | | | | | | | | | | | | |
| Net asset value, beginning of year | $ | 46.04 | | $ | 46.08 | | $ | 42.13 | | $ | 34.00 | | $ | 27.66 | |
| Income from investment operationsa: | | | | | | | | | | | | | | | |
| Net investment income (loss)b | | (0.14 | ) | | (0.21 | ) | | (0.18 | ) | | (0.12 | ) | | (0.11 | ) |
| Net realized and unrealized gains (losses) | | 7.35 | | | 1.78 | | | 5.94 | | | 8.25 | | | 7.10 | |
| Total from investment operations | | 7.21 | | | 1.57 | | | 5.76 | | | 8.13 | | | 6.99 | |
| Less distributions from net realized gains | | (1.20 | ) | | (1.61 | ) | | (1.81 | ) | | — | | | (0.65 | ) |
| Net asset value, end of year. | $ | 52.05 | | $ | 46.04 | | $ | 46.08 | | $ | 42.13 | | $ | 34.00 | |
| |
| Total returnc | | 15.73 | % | | 3.40 | % | | 13.98 | % | | 23.91 | % | | 25.59 | % |
| |
| Ratios to average net assets | | | | | | | | | | | | | | | |
| Expenses before waiver and payments by affiliates | | 0.91 | % | | 0.89 | % | | 0.89 | % | | 0.94 | % | | 0.96 | % |
| Expenses net of waiver and payments by affiliates | | 0.90 | % | | 0.89 | %d | | 0.89 | %d,e | | 0.94 | % | | 0.96 | % |
| Net investment income (loss) | | (0.30 | )% | | (0.44 | )% | | (0.41 | )% | | (0.34 | )% | | (0.35 | )% |
| |
| Supplemental data | | | | | | | | | | | | | | | |
| Net assets, end of year (000’s) | $ | 2,123,082 | | $ | 1,857,570 | | $ | 1,504,338 | | $ | 1,072,814 | | $ | 898,665 | |
| Portfolio turnover rate | | 22.42 | % | | 31.02 | % | | 26.43 | % | | 35.40 | % | | 16.65 | % |
aThe amount shown for a share outstanding throughout the period may not correlate with the Statement of Operations for the period due to the timing of sales and
repurchases of the Fund’s shares in relation to income earned and/or fluctuating fair value of the investments of the Fund.
bBased on average daily shares outstanding.
cTotal return does not reflect sales commissions or contingent deferred sales charges, if applicable.
dBenefit of waiver and payments by affiliates rounds to less than 0.01%.
eBenefit of expense reduction rounds to less than 0.01%.
40 Annual Report | The accompanying notes are an integral part of these financial statements.
franklintempleton.com
| | | | | | | | | | | | | | | |
| | | | | | | | | FRANKLIN CUSTODIAN FUNDS | |
| | | | | | | | | FINANCIAL HIGHLIGHTS | |
| |
| |
| Franklin DynaTech Fund (continued) | | | | | | | | | | | | | | | |
| | | | | | Year Ended September 30, | | | | |
| | | 2016 | | | 2015 | | | 2014 | | | 2013 | | | 2012 | |
| Class C | | | | | | | | | | | | | | | |
| Per share operating performance | | | | | | | | | | | | | | | |
| (for a share outstanding throughout the year) | | | | | | | | | | | | | | | |
| Net asset value, beginning of year | $ | 40.00 | | $ | 40.53 | | $ | 37.53 | | $ | 30.52 | | $ | 25.07 | |
| Income from investment operationsa: | | | | | | | | | | | | | | | |
| Net investment income (loss)b | | (0.43 | ) | | (0.50 | ) | | (0.46 | ) | | (0.35 | ) | | (0.32 | ) |
| Net realized and unrealized gains (losses) | | 6.34 | | | 1.58 | | | 5.27 | | | 7.36 | | | 6.42 | |
| Total from investment operations | | 5.91 | | | 1.08 | | | 4.81 | | | 7.01 | | | 6.10 | |
| Less distributions from net realized gains | | (1.20 | ) | | (1.61 | ) | | (1.81 | ) | | — | | | (0.65 | ) |
| Net asset value, end of year. | $ | 44.71 | | $ | 40.00 | | $ | 40.53 | | $ | 37.53 | | $ | 30.52 | |
| |
| Total returnc | | 14.86 | % | | 2.63 | % | | 13.13 | % | | 22.97 | % | | 24.67 | % |
| |
| Ratios to average net assets | | | | | | | | | | | | | | | |
| Expenses before waiver and payments by affiliates | | 1.66 | % | | 1.64 | % | | 1.64 | % | | 1.69 | % | | 1.71 | % |
| Expenses net of waiver and payments by affiliates | | 1.65 | % | | 1.64 | %d | | 1.64 | %d,e | | 1.69 | % | | 1.71 | % |
| Net investment income (loss) | | (1.05 | )% | | (1.19 | )% | | (1.16 | )% | | (1.09 | )% | | (1.10 | )% |
| |
| Supplemental data | | | | | | | | | | | | | | | |
| Net assets, end of year (000’s) | $ | 318,896 | | $ | 270,961 | | $ | 212,961 | | $ | 176,556 | | $ | 142,903 | |
| Portfolio turnover rate | | 22.42 | % | | 31.02 | % | | 26.43 | % | | 35.40 | % | | 16.65 | % |
aThe amount shown for a share outstanding throughout the period may not correlate with the Statement of Operations for the period due to the timing of sales and
repurchases of the Fund’s shares in relation to income earned and/or fluctuating fair value of the investments of the Fund.
bBased on average daily shares outstanding.
cTotal return does not reflect sales commissions or contingent deferred sales charges, if applicable.
dBenefit of waiver and payments by affiliates rounds to less than 0.01%.
eBenefit of expense reduction rounds to less than 0.01%.
franklintempleton.com
The accompanying notes are an integral part of these financial statements. | Annual Report 41
| | | | | | | | | | | | | | | |
| FRANKLIN CUSTODIAN FUNDS | | | | | | | | | | | | | | | |
| FINANCIAL HIGHLIGHTS | | | | | | | | | | | | | | | |
| |
| |
| Franklin DynaTech Fund (continued) | | | | | | | | | | | | | | | |
| | | | | | Year Ended September 30, | | | | |
| | | 2016 | | | 2015 | | | 2014 | | | 2013 | | | 2012 | |
| Class R | | | | | | | | | | | | | | | |
| Per share operating performance | | | | | | | | | | | | | | | |
| (for a share outstanding throughout the year) | | | | | | | | | | | | | | | |
| Net asset value, beginning of year | $ | 45.16 | | $ | 45.35 | | $ | 41.58 | | $ | 33.65 | | $ | 27.44 | |
| Income from investment operationsa: | | | | | | | | | | | | | | | |
| Net investment income (loss)b | | (0.26 | ) | | (0.32 | ) | | (0.29 | ) | | (0.21 | ) | | (0.19 | ) |
| Net realized and unrealized gains (losses) | | 7.20 | | | 1.74 | | | 5.87 | | | 8.14 | | | 7.05 | |
| Total from investment operations | | 6.94 | | | 1.42 | | | 5.58 | | | 7.93 | | | 6.86 | |
| Less distributions from net realized gains | | (1.20 | ) | | (1.61 | ) | | (1.81 | ) | | — | | | (0.65 | ) |
| Net asset value, end of year. | $ | 50.90 | | $ | 45.16 | | $ | 45.35 | | $ | 41.58 | | $ | 33.65 | |
| |
| Total return | | 15.43 | % | | 3.11 | % | | 13.72 | % | | 23.57 | % | | 25.32 | % |
| |
| Ratios to average net assets | | | | | | | | | | | | | | | |
| Expenses before waiver and payments by affiliates | | 1.16 | % | | 1.14 | % | | 1.14 | % | | 1.19 | % | | 1.21 | % |
| Expenses net of waiver and payments by affiliates | | 1.15 | % | | 1.14 | %c | | 1.14 | %c,d | | 1.19 | % | | 1.21 | % |
| Net investment income (loss) | | (0.55 | )% | | (0.69 | )% | | (0.66 | )% | | (0.59 | )% | | (0.60 | )% |
| |
| Supplemental data | | | | | | | | | | | | | | | |
| Net assets, end of year (000’s) | $ | 38,862 | | $ | 43,001 | | $ | 45,230 | | $ | 41,825 | | $ | 33,338 | |
| Portfolio turnover rate | | 22.42 | % | | 31.02 | % | | 26.43 | % | | 35.40 | % | | 16.65 | % |
aThe amount shown for a share outstanding throughout the period may not correlate with the Statement of Operations for the period due to the timing of sales and
repurchases of the Fund’s shares in relation to income earned and/or fluctuating fair value of the investments of the Fund.
bBased on average daily shares outstanding.
cBenefit of waiver and payments by affiliates rounds to less than 0.01%.
dBenefit of expense reduction rounds to less than 0.01%.
42 Annual Report | The accompanying notes are an integral part of these financial statements.
franklintempleton.com
| | | | | | | | | | | | |
| | | | | | FRANKLIN CUSTODIAN FUNDS | |
| | | | | | FINANCIAL HIGHLIGHTS | |
| |
| |
| Franklin DynaTech Fund (continued) | | | | | | | | | | | | |
| | | Year Ended September 30, | | | | |
| | | 2016 | | | 2015 | | | 2014 | | | 2013 | a |
| Class R6 | | | | | | | | | | | | |
| Per share operating performance | | | | | | | | | | | | |
| (for a share outstanding throughout the year) | | | | | | | | | | | | |
| Net asset value, beginning of year | $ | 47.15 | | $ | 46.97 | | $ | 42.74 | | $ | 36.56 | |
| Income from investment operationsb: | | | | | | | | | | | | |
| Net investment income (loss)c | | 0.06 | | | (0.01 | ) | | (0.01 | ) | | 0.01 | |
| Net realized and unrealized gains (losses) | | 7.55 | | | 1.80 | | | 6.05 | | | 6.17 | |
| Total from investment operations | | 7.61 | | | 1.79 | | | 6.04 | | | 6.18 | |
| Less distributions from net realized gains | | (1.20 | ) | | (1.61 | ) | | (1.81 | ) | | — | |
| Net asset value, end of year | $ | 53.56 | | $ | 47.15 | | $ | 46.97 | | $ | 42.74 | |
| |
| Total returnd | | 16.21 | % | | 3.81 | % | | 14.45 | % | | 16.90 | % |
| |
| Ratios to average net assetse | | | | | | | | | | | | |
| Expenses before waiver and payments by affiliates | | 0.49 | % | | 0.48 | % | | 0.49 | % | | 0.52 | % |
| Expenses net of waiver and payments by affiliates | | 0.48 | % | | 0.48 | %f | | 0.49 | %f,g | | 0.52 | % |
| Net investment income (loss) | | 0.12 | % | | (0.03 | )% | | (0.01 | )% | | 0.08 | % |
| |
| Supplemental data | | | | | | | | | | | | |
| Net assets, end of year (000’s) | $ | 359,505 | | $ | 362,627 | | $ | 342,466 | | $ | 317,315 | |
| Portfolio turnover rate | | 22.42 | % | | 31.02 | % | | 26.43 | % | | 35.40 | % |
aFor the period May 1, 2013 (effective date) to September 30, 2013.
bThe amount shown for a share outstanding throughout the period may not correlate with the Statement of Operations for the period due to the timing of sales and
repurchases of the Fund’s shares in relation to income earned and/or fluctuating fair value of the investments of the Fund.
cBased on average daily shares outstanding.
dTotal return is not annualized for periods less than one year.
eRatios are annualized for periods less than one year.
fBenefit of waiver and payments by affiliates rounds to less than 0.01%.
gBenefit of expense reduction rounds to less than 0.01%.
franklintempleton.com
The accompanying notes are an integral part of these financial statements. | Annual Report 43
| | | | | | | | | | | | | | | |
| FRANKLIN CUSTODIAN FUNDS | | | | | | | | | | | | | | | |
| FINANCIAL HIGHLIGHTS | | | | | | | | | | | | | | | |
| |
| |
| Franklin DynaTech Fund (continued) | | | | | | | | | | | | | | | |
| | | | | | Year Ended September 30, | | | | |
| | | 2016 | | | 2015 | | | 2014 | | | 2013 | | | 2012 | |
| Advisor Class | | | | | | | | | | | | | | | |
| Per share operating performance | | | | | | | | | | | | | | | |
| (for a share outstanding throughout the year) | | | | | | | | | | | | | | | |
| Net asset value, beginning of year | $ | 46.96 | | $ | 46.87 | | $ | 42.71 | | $ | 34.39 | | $ | 27.89 | |
| Income from investment operationsa: | | | | | | | | | | | | | | | |
| Net investment income (loss)b | | (0.03 | ) | | (0.09 | ) | | (0.07 | ) | | (0.03 | ) | | (0.03 | ) |
| Net realized and unrealized gains (losses) | | 7.52 | | | 1.79 | | | 6.04 | | | 8.35 | | | 7.18 | |
| Total from investment operations | | 7.49 | | | 1.70 | | | 5.97 | | | 8.32 | | | 7.15 | |
| Less distributions from net realized gains | | (1.20 | ) | | (1.61 | ) | | (1.81 | ) | | — | | | (0.65 | ) |
| Net asset value, end of year. | $ | 53.25 | | $ | 46.96 | | $ | 46.87 | | $ | 42.71 | | $ | 34.39 | |
| |
| Total return | | 16.02 | % | | 3.62 | % | | 14.29 | % | | 24.19 | % | | 25.96 | % |
| |
| Ratios to average net assets | | | | | | | | | | | | | | | |
| Expenses before waiver and payments by affiliates | | 0.66 | % | | 0.64 | % | | 0.64 | % | | 0.69 | % | | 0.71 | % |
| Expenses net of waiver and payments by affiliates | | 0.65 | % | | 0.64 | %c | | 0.64 | %c,d | | 0.69 | % | | 0.71 | % |
| Net investment income (loss) | | (0.05 | )% | | (0.19 | )% | | (0.16 | )% | | (0.09 | )% | | (0.10 | )% |
| |
| Supplemental data | | | | | | | | | | | | | | | |
| Net assets, end of year (000’s) | $ | 203,443 | | $ | 176,090 | | $ | 159,180 | | $ | 122,287 | | $ | 260,012 | |
| Portfolio turnover rate | | 22.42 | % | | 31.02 | % | | 26.43 | % | | 35.40 | % | | 16.65 | % |
aThe amount shown for a share outstanding throughout the period may not correlate with the Statement of Operations for the period due to the timing of sales and
repurchases of the Fund’s shares in relation to income earned and/or fluctuating fair value of the investments of the Fund.
bBased on average daily shares outstanding.
cBenefit of waiver and payments by affiliates rounds to less than 0.01%.
dBenefit of expense reduction rounds to less than 0.01%.
44 Annual Report | The accompanying notes are an integral part of these financial statements.
franklintempleton.com
FRANKLIN CUSTODIAN FUNDS
| | | | |
| Statement of Investments, September 30, 2016 | | | | |
| Franklin DynaTech Fund | | | | |
| | Country | Shares | | Value |
| |
| Common Stocks 99.4% | | | | |
| Aerospace & Defense 1.1% | | | | |
| The Boeing Co | United States | 30,000 | $ | 3,952,200 |
| Raytheon Co | United States | 210,000 | | 28,587,300 |
| | | | | 32,539,500 |
| Air Freight & Logistics 0.7% | | | | |
| FedEx Corp | United States | 120,000 | | 20,961,600 |
| Biotechnology 8.2% | | | | |
| Amgen Inc | United States | 200,000 | | 33,362,000 |
| a Biogen Inc | United States | 100,000 | | 31,303,000 |
| a Celgene Corp | United States | 650,000 | | 67,944,500 |
| Gilead Sciences Inc | United States | 400,000 | | 31,648,000 |
| a Incyte Corp | United States | 300,000 | | 28,287,000 |
| a Kite Pharma Inc | United States | 100,000 | | 5,586,000 |
| a Regeneron Pharmaceuticals Inc | United States | 100,000 | | 40,202,000 |
| a Tesaro Inc | United States | 100,000 | | 10,024,000 |
| | | | | 248,356,500 |
| Capital Markets 3.3% | | | | |
| Intercontinental Exchange Inc | United States | 150,000 | | 40,404,000 |
| MarketAxess Holdings Inc | United States | 100,000 | | 16,559,000 |
| Moody’s Corp | United States | 300,000 | | 32,484,000 |
| MSCI Inc | United States | 140,000 | | 11,751,600 |
| | | | | 101,198,600 |
| Communications Equipment 1.3% | | | | |
| a Palo Alto Networks Inc | United States | 250,000 | | 39,832,500 |
| Diversified Telecommunication Services 1.3% | | | | |
| a SBA Communications Corp | United States | 350,000 | | 39,256,000 |
| Electrical Equipment 1.1% | | | | |
| Acuity Brands Inc | United States | 125,000 | | 33,075,000 |
| Electronic Equipment, Instruments & Components 0.9% | | | | |
| Amphenol Corp., A | United States | 400,000 | | 25,968,000 |
| a Universal Display Corp | United States | 50,000 | | 2,775,500 |
| | | | | 28,743,500 |
| Energy Equipment & Services 1.7% | | | | |
| Core Laboratories NV | United States | 125,000 | | 14,041,250 |
| Schlumberger Ltd | United States | 500,000 | | 39,320,000 |
| | | | | 53,361,250 |
| Health Care Equipment & Supplies 8.5% | | | | |
| Abbott Laboratories | United States | 500,000 | | 21,145,000 |
| CR Bard Inc | United States | 150,000 | | 33,642,000 |
| a DexCom Inc | United States | 400,000 | | 35,064,000 |
| a Edwards Lifesciences Corp | United States | 600,000 | | 72,336,000 |
| a IDEXX Laboratories Inc | United States | 400,000 | | 45,092,000 |
| a Intuitive Surgical Inc | United States | 7,000 | | 5,073,810 |
| Ion Beam Applications | Belgium | 80,000 | | 4,063,661 |
| a Nevro Corp | United States | 130,000 | | 13,570,700 |
| Stryker Corp | United States | 250,000 | | 29,102,500 |
| | | | | 259,089,671 |
franklintempleton.com
Annual Report
45
FRANKLIN CUSTODIAN FUNDS
STATEMENT OF INVESTMENTS
| | | | |
| Franklin DynaTech Fund (continued) | | | | |
| | Country | Shares | | Value |
| |
| Common Stocks (continued) | | | | |
| Health Care Providers & Services 3.4% | | | | |
| a Henry Schein Inc | United States | 200,000 | $ | 32,596,000 |
| McKesson Corp | United States | 100,000 | | 16,675,000 |
| UnitedHealth Group Inc | United States | 350,000 | | 49,000,000 |
| a VCA Inc | United States | 60,000 | | 4,198,800 |
| | | | | 102,469,800 |
| Health Care Technology 1.5% | | | | |
| a athenahealth Inc | United States | 125,000 | | 15,765,000 |
| a Cerner Corp | United States | 100,000 | | 6,175,000 |
| a Veeva Systems Inc | United States | 600,000 | | 24,768,000 |
| | | | | 46,708,000 |
| Internet & Direct Marketing Retail 9.3% | | | | |
| a Amazon.com Inc | United States | 230,000 | | 192,581,300 |
| a Liberty Ventures, A | United States | 550,000 | | 21,928,500 |
| a Netflix Inc | United States | 200,000 | | 19,710,000 |
| a The Priceline Group Inc | United States | 30,000 | | 44,144,700 |
| Start Today Co. Ltd | Japan | 300,000 | | 5,120,111 |
| | | | | 283,484,611 |
| Internet Software & Services 15.9% | | | | |
| a 2U Inc | United States | 250,000 | | 9,572,500 |
| a Alarm.com Holdings Inc | United States | 20,000 | | 577,200 |
| a Alibaba Group Holding Ltd., ADR | China | 100,000 | | 10,579,000 |
| a Alphabet Inc., A | United States | 150,000 | | 120,609,000 |
| a Alphabet Inc., C | United States | 62,170 | | 48,324,119 |
| a Apptio Inc., A | United States | 96,800 | | 2,100,560 |
| a Baidu Inc., ADR | China | 100,000 | | 18,207,000 |
| a CommerceHub Inc., A | United States | 100,000 | | 1,580,000 |
| a CommerceHub Inc., C. | United States | 110,000 | | 1,750,100 |
| a CoStar Group Inc | United States | 10,000 | | 2,165,300 |
| a Facebook Inc., A | United States | 1,100,000 | | 141,097,000 |
| MercadoLibre Inc | Argentina | 100,000 | | 18,497,000 |
| NetEase Inc., ADR | China | 130,000 | | 31,301,400 |
| a Nutanix Inc., A | United States | 63,300 | | 2,342,100 |
| Tencent Holdings Ltd | China | 2,500,000 | | 68,653,426 |
| a Twilio Inc., A | United States | 100,000 | | 6,436,000 |
| | | | | 483,791,705 |
| IT Services 7.7% | | | | |
| a EPAM Systems Inc | United States | 150,000 | | 10,396,500 |
| a Fiserv Inc | United States | 300,000 | | 29,841,000 |
| Jack Henry & Associates Inc | United States | 50,000 | | 4,277,500 |
| Mastercard Inc., A | United States | 1,000,000 | | 101,770,000 |
| a PayPal Holdings Inc | United States | 150,000 | | 6,145,500 |
| Visa Inc., A | United States | 1,000,000 | | 82,700,000 |
| | | | | 235,130,500 |
| Life Sciences Tools & Services 3.3% | | | | |
| a Illumina Inc | United States | 200,000 | | 36,332,000 |
| a Patheon NV | United States | 100,000 | | 2,963,000 |
| Thermo Fisher Scientific Inc | United States | 200,000 | | 31,812,000 |
| a VWR Corp | United States | 500,000 | | 14,180,000 |
46 Annual Report
franklintempleton.com
FRANKLIN CUSTODIAN FUNDS
STATEMENT OF INVESTMENTS
| | | | |
| Franklin DynaTech Fund (continued) | | | | |
| | Country | Shares | | Value |
| |
| Common Stocks (continued) | | | | |
| Life Sciences Tools & Services (continued) | | | | |
| a Waters Corp | United States | 100,000 | $ | 15,849,000 |
| | | | | 101,136,000 |
| Media 1.6% | | | | |
| a Liberty Broadband Corp., A | United States | 300,000 | | 21,048,000 |
| a Liberty Broadband Corp., C | United States | 130,907 | | 9,357,233 |
| Naspers Ltd., N | South Africa | 100,000 | | 17,320,936 |
| | | | | 47,726,169 |
| Oil, Gas & Consumable Fuels 0.0%† | | | | |
| Pioneer Natural Resources Co | United States | 5,000 | | 928,250 |
| Pharmaceuticals 0.9% | | | | |
| Merck KGaA | Germany | 250,000 | | 26,945,916 |
| Professional Services 0.4% | | | | |
| Equifax Inc | United States | 100,000 | | 13,458,000 |
| Real Estate Investment Trusts (REITs) 3.9% | | | | |
| American Tower Corp | United States | 400,000 | | 45,332,000 |
| Equinix Inc | United States | 200,000 | | 72,050,000 |
| | | | | 117,382,000 |
| Semiconductors & Semiconductor Equipment 6.5% | | | | |
| ASML Holding NV, N.Y. shs | Netherlands | 200,000 | | 21,916,000 |
| Broadcom Ltd | Singapore | 270,000 | | 46,580,400 |
| a Inphi Corp | United States | 20,000 | | 870,200 |
| Intel Corp | United States | 800,000 | | 30,200,000 |
| Lam Research Corp | United States | 300,000 | | 28,413,000 |
| a MACOM Technology Solutions Holdings Inc | United States | 200,000 | | 8,468,000 |
| Monolithic Power Systems | United States | 110,000 | | 8,855,000 |
| NVIDIA Corp | United States | 160,000 | | 10,963,200 |
| a NXP Semiconductors NV | Netherlands | 350,000 | | 35,703,500 |
| Xilinx Inc | United States | 100,000 | | 5,434,000 |
| | | | | 197,403,300 |
| Software 14.4% | | | | |
| a Adobe Systems Inc | United States | 500,000 | | 54,270,000 |
| a ANSYS Inc | United States | 200,000 | | 18,522,000 |
| a Aspen Technology Inc | United States | 400,000 | | 18,716,000 |
| a Atlassian Corp. PLC | Australia | 300,000 | | 8,991,000 |
| a Electronic Arts Inc | United States | 450,000 | | 38,430,000 |
| a Ellie Mae Inc | United States | 200,000 | | 21,060,000 |
| a Gridsum Holdings Inc., ADR | China | 149,700 | | 2,522,445 |
| a Hubspot Inc | United States | 125,000 | | 7,202,500 |
| Intuit Inc | United States | 300,000 | | 33,003,000 |
| a Line Corp., ADR | Japan | 75,000 | | 3,630,000 |
| Microsoft Corp | United States | 650,000 | | 37,440,000 |
| a Mobileye NV | Israel | 70,000 | | 2,979,900 |
| a Salesforce.com Inc | United States | 800,000 | | 57,064,000 |
| a ServiceNow Inc | United States | 500,000 | | 39,575,000 |
| a Splunk Inc | United States | 110,000 | | 6,454,800 |
| a Tyler Technologies Inc | United States | 100,000 | | 17,123,000 |
| a Ultimate Software Group Inc | United States | 200,000 | | 40,878,000 |
| a Workday Inc., A | United States | 250,000 | | 22,922,500 |
franklintempleton.com
Annual Report
47
FRANKLIN CUSTODIAN FUNDS
STATEMENT OF INVESTMENTS
| | | | | |
| Franklin DynaTech Fund (continued) | | | | | |
| | Country | Shares | | Value | |
| Common Stocks (continued) | | | | | |
| Software (continued) | | | | | |
| a Zendesk Inc | United States | 300,000 | $ | 9,213,000 | |
| | | | | 439,997,145 | |
| Technology Hardware, Storage & Peripherals 1.5% | | | | | |
| Apple Inc | United States | 400,000 | | 45,220,000 | |
| Textiles, Apparel & Luxury Goods 0.7% | | | | | |
| NIKE Inc., B | United States | 400,000 | | 21,060,000 | |
| Wireless Telecommunication Services 0.3% | | | | | |
| a T-Mobile U.S. Inc | United States | 170,000 | | 7,942,400 | |
| Total Common Stocks (Cost $1,724,897,924) | | | | 3,027,197,917 | |
| |
| Short Term Investments (Cost $17,719,400) 0.6% | | | | | |
| Money Market Funds 0.6% | | | | | |
| a,b Institutional Fiduciary Trust Money Market Portfolio | United States | 17,719,400 | | 17,719,400 | |
| Total Investments (Cost $1,742,617,324) 100.0% | | | | 3,044,917,317 | |
| Other Assets, less Liabilities (0.0)%† | | | | (1,128,704 | ) |
| Net Assets 100.0% | | | $ | 3,043,788,613 | |
See Abbreviations on page 126.
†Rounds to less than 0.1% of net assets.
aNon-income producing.
bSee Note 3(f) regarding investments in affiliated management investment companies.
48 Annual Report | The accompanying notes are an integral part of these financial statements.
franklintempleton.com
| | | | | | | | | | | | | | | |
| | | | | | | | | FRANKLIN CUSTODIAN FUNDS | |
| |
| |
| |
| Financial Highlights | | | | | | | | | | | | | | | |
| Franklin Growth Fund | | | | | | | | | | | | | | | |
| | | | | | Year Ended September 30, | | | | |
| | | 2016 | | | 2015 | | | 2014 | | | 2013 | | | 2012 | |
| Class A | | | | | | | | | | | | | | | |
| Per share operating performance | | | | | | | | | | | | | | | |
| (for a share outstanding throughout the year) | | | | | | | | | | | | | | | |
| Net asset value, beginning of year | $ | 72.40 | | $ | 70.51 | | $ | 59.49 | | $ | 50.13 | | $ | 40.45 | |
| Income from investment operationsa: | | | | | | | | | | | | | | | |
| Net investment incomeb | | 0.47 | c | | 0.29 | | | 0.26 | | | 0.26 | | | 0.20 | |
| Net realized and unrealized gains (losses) | | 8.51 | | | 1.79 | | | 11.06 | | | 9.24 | | | 9.76 | |
| Total from investment operations | | 8.98 | | | 2.08 | | | 11.32 | | | 9.50 | | | 9.96 | |
| Less distributions from: | | | | | | | | | | | | | | | |
| Net investment income | | (0.47 | ) | | (0.19 | ) | | (0.30 | ) | | (0.14 | ) | | (0.16 | ) |
| Net realized gains | | (2.37 | ) | | — | | | — | | | — | | | (0.12 | ) |
| Total distributions | | (2.84 | ) | | (0.19 | ) | | (0.30 | ) | | (0.14 | ) | | (0.28 | ) |
| Net asset value, end of year. | $ | 78.54 | | $ | 72.40 | | $ | 70.51 | | $ | 59.49 | | $ | 50.13 | |
| |
| Total returnd | | 12.57 | % | | 2.94 | % | | 19.08 | % | | 19.01 | % | | 24.74 | % |
| |
| Ratios to average net assets | | | | | | | | | | | | | | | |
| Expenses before waiver and payments by affiliates | | 0.88 | % | | 0.88 | % | | 0.90 | % | | 0.91 | % | | 0.94 | % |
| Expenses net of waiver and payments by affiliates | | 0.86 | %e | | 0.88 | %e,f | | 0.90 | %e,f | | 0.91 | %e | | 0.94 | % |
| Net investment income | | 0.63 | %c | | 0.38 | % | | 0.40 | % | | 0.49 | % | | 0.43 | % |
| |
| Supplemental data | | | | | | | | | | | | | | | |
| Net assets, end of year (000’s) | $ | 7,628,523 | | $ | 7,185,665 | | $ | 6,611,073 | | $ | 5,305,031 | | $ | 4,135,962 | |
| Portfolio turnover rate | | 7.53 | % | | 5.05 | % | | 1.50 | % | | 0.83 | % | | 3.50 | % |
aThe amount shown for a share outstanding throughout the period may not correlate with the Statement of Operations for the period due to the timing of sales and
repurchases of the Fund’s shares in relation to income earned and/or fluctuating fair value of the investments of the Fund.
bBased on average daily shares outstanding.
cNet investment income per share includes approximately $0.10 per share related to income received in the form of special dividends in connection with certain Fund
holdings. Excluding this amount, the ratio of net investment income to average net assets would have been 0.50%.
dTotal return does not reflect sales commissions or contingent deferred sales charges, if applicable.
eBenefit of expense reduction rounds to less than 0.01%.
fBenefit of waiver and payments by affiliates rounds to less than 0.01%.
franklintempleton.com
The accompanying notes are an integral part of these financial statements. | Annual Report 49
| | | | | | | | | | | | | | | |
| FRANKLIN CUSTODIAN FUNDS | | | | | | | | | | | | | | | |
| FINANCIAL HIGHLIGHTS | | | | | | | | | | | | | | | |
| |
| |
| Franklin Growth Fund (continued) | | | | | | | | | | | | | | | |
| | | | | | Year Ended September 30, | | | | |
| | | 2016 | | | 2015 | | | 2014 | | | 2013 | | | 2012 | |
| Class C | | | | | | | | | | | | | | | |
| Per share operating performance | | | | | | | | | | | | | | | |
| (for a share outstanding throughout the year) | | | | | | | | | | | | | | | |
| Net asset value, beginning of year | $ | 67.17 | | $ | 65.75 | | $ | 55.64 | | $ | 47.10 | | $ | 38.16 | |
| Income from investment operationsa: | | | | | | | | | | | | | | | |
| Net investment income (loss)b | | (0.08 | )c | | (0.26 | ) | | (0.22 | ) | | (0.13 | ) | | (0.14 | ) |
| Net realized and unrealized gains (losses) | | 7.88 | | | 1.68 | | | 10.33 | | | 8.67 | | | 9.20 | |
| Total from investment operations | | 7.80 | | | 1.42 | | | 10.11 | | | 8.54 | | | 9.06 | |
| Less distributions from net realized gains | | (2.37 | ) | | — | | | — | | | — | | | (0.12 | ) |
| Net asset value, end of year. | $ | 72.60 | | $ | 67.17 | | $ | 65.75 | | $ | 55.64 | | $ | 47.10 | |
| |
| Total returnd | | 11.74 | % | | 2.16 | % | | 18.17 | % | | 18.13 | % | | 23.79 | % |
| |
| Ratios to average net assets | | | | | | | | | | | | | | | |
| Expenses before waiver and payments by affiliates | | 1.63 | % | | 1.63 | % | | 1.65 | % | | 1.66 | % | | 1.69 | % |
| Expenses net of waiver and payments by affiliates | | 1.61 | %e | | 1.63 | %e,f | | 1.65 | %e,f | | 1.66 | %e | | 1.69 | % |
| Net investment income (loss) | | (0.12 | )%c | | (0.37 | )% | | (0.35 | )% | | (0.26 | )% | | (0.32 | )% |
| |
| Supplemental data | | | | | | | | | | | | | | | |
| Net assets, end of year (000’s) | $ | 846,965 | | $ | 777,570 | | $ | 662,548 | | $ | 546,505 | | $ | 466,205 | |
| Portfolio turnover rate | | 7.53 | % | | 5.05 | % | | 1.50 | % | | 0.83 | % | | 3.50 | % |
aThe amount shown for a share outstanding throughout the period may not correlate with the Statement of Operations for the period due to the timing of sales and
repurchases of the Fund’s shares in relation to income earned and/or fluctuating fair value of the investments of the Fund.
bBased on average daily shares outstanding.
cNet investment income per share includes approximately $0.10 per share related to income received in the form of special dividends in connection with certain Fund
holdings. Excluding this amount, the ratio of net investment income to average net assets would have been (0.25)%.
dTotal return does not reflect sales commissions or contingent deferred sales charges, if applicable.
eBenefit of expense reduction rounds to less than 0.01%.
fBenefit of waiver and payments by affiliates rounds to less than 0.01%.
50 Annual Report | The accompanying notes are an integral part of these financial statements.
franklintempleton.com
| | | | | | | | | | | | | | | |
| | | | | | | | | FRANKLIN CUSTODIAN FUNDS | |
| | | | | | | | | FINANCIAL HIGHLIGHTS | |
| |
| |
| Franklin Growth Fund (continued) | | | | | | | | | | | | | | | |
| | | | | | Year Ended September 30, | | | | |
| | | 2016 | | | 2015 | | | 2014 | | | 2013 | | | 2012 | |
| Class R | | | | | | | | | | | | | | | |
| Per share operating performance | | | | | | | | | | | | | | | |
| (for a share outstanding throughout the year) | | | | | | | | | | | | | | | |
| Net asset value, beginning of year | $ | 71.93 | | $ | 70.05 | | $ | 59.07 | | $ | 49.82 | | $ | 40.23 | |
| Income from investment operationsa: | | | | | | | | | | | | | | | |
| Net investment incomeb | | 0.29 | c | | 0.10 | | | 0.10 | | | 0.13 | | | 0.08 | |
| Net realized and unrealized gains (losses) | | 8.45 | | | 1.78 | | | 10.98 | | | 9.18 | | | 9.71 | |
| Total from investment operations | | 8.74 | | | 1.88 | | | 11.08 | | | 9.31 | | | 9.79 | |
| Less distributions from: | | | | | | | | | | | | | | | |
| Net investment income | | (0.16 | ) | | — | | | (0.10 | ) | | (0.06 | ) | | (0.08 | ) |
| Net realized gains | | (2.37 | ) | | — | | | — | | | — | | | (0.12 | ) |
| Total distributions | | (2.53 | ) | | — | | | (0.10 | ) | | (0.06 | ) | | (0.20 | ) |
| Net asset value, end of year. | $ | 78.14 | | $ | 71.93 | | $ | 70.05 | | $ | 59.07 | | $ | 49.82 | |
| |
| Total return | | 12.29 | % | | 2.68 | % | | 18.77 | % | | 18.71 | % | | 24.42 | % |
| |
| Ratios to average net assets | | | | | | | | | | | | | | | |
| Expenses before waiver and payments by affiliates | | 1.13 | % | | 1.13 | % | | 1.15 | % | | 1.16 | % | | 1.19 | % |
| Expenses net of waiver and payments by affiliates | | 1.11 | %d | | 1.13 | %d,e | | 1.15 | %d,e | | 1.16 | %d | | 1.19 | % |
| Net investment income | | 0.38 | %c | | 0.13 | % | | 0.15 | % | | 0.24 | % | | 0.18 | % |
| |
| Supplemental data | | | | | | | | | | | | | | | |
| Net assets, end of year (000’s) | $ | 477,221 | | $ | 501,813 | | $ | 565,634 | | $ | 552,391 | | $ | 466,954 | |
| Portfolio turnover rate | | 7.53 | % | | 5.05 | % | | 1.50 | % | | 0.83 | % | | 3.50 | % |
aThe amount shown for a share outstanding throughout the period may not correlate with the Statement of Operations for the period due to the timing of sales and
repurchases of the Fund’s shares in relation to income earned and/or fluctuating fair value of the investments of the Fund.
bBased on average daily shares outstanding.
cNet investment income per share includes approximately $0.10 per share related to income received in the form of special dividends in connection with certain Fund
holdings. Excluding this amount, the ratio of net investment income to average net assets would have been 0.25%.
dBenefit of expense reduction rounds to less than 0.01%.
eBenefit of waiver and payments by affiliates rounds to less than 0.01%.
franklintempleton.com
The accompanying notes are an integral part of these financial statements. | Annual Report 51
| | | | | | | | | | | | |
| FRANKLIN CUSTODIAN FUNDS | | | | | | | | | | | | |
| FINANCIAL HIGHLIGHTS | | | | | | | | | | | | |
| |
| |
| Franklin Growth Fund (continued) | | | | | | | | | | | | |
| | | Year Ended September 30, | | | | |
| | | 2016 | | | 2015 | | | 2014 | | | 2013 | a |
| Class R6 | | | | | | | | | | | | |
| Per share operating performance | | | | | | | | | | | | |
| (for a share outstanding throughout the year) | | | | | | | | | | | | |
| Net asset value, beginning of year | $ | 72.69 | | $ | 70.76 | | $ | 59.71 | | $ | 54.58 | |
| Income from investment operationsb: | | | | | | | | | | | | |
| Net investment incomec | | 0.78 | d | | 0.61 | | | 0.55 | | | 0.24 | |
| Net realized and unrealized gains (losses) | | 8.56 | | | 1.79 | | | 11.08 | | | 4.89 | |
| Total from investment operations | | 9.34 | | | 2.40 | | | 11.63 | | | 5.13 | |
| Less distributions from: | | | | | | | | | | | | |
| Net investment income. | | (0.87 | ) | | (0.47 | ) | | (0.58 | ) | | — | |
| Net realized gains | | (2.37 | ) | | — | | | — | | | — | |
| Total distributions | | (3.24 | ) | | (0.47 | ) | | (0.58 | ) | | — | |
| Net asset value, end of year | $ | 78.79 | | $ | 72.69 | | $ | 70.76 | | $ | 59.71 | |
| |
| Total returne | | 13.05 | % | | 3.37 | % | | 19.59 | % | | 9.40 | % |
| |
| Ratios to average net assetsf | | | | | | | | | | | | |
| Expenses before waiver and payments by affiliates | | 0.46 | % | | 0.46 | % | | 0.47 | % | | 0.48 | % |
| Expenses net of waiver and payments by affiliatesg | | 0.44 | % | | 0.46 | %h | | 0.47 | %h | | 0.48 | % |
| Net investment income | | 1.05 | %d | | 0.80 | % | | 0.83 | % | | 0.92 | % |
| |
| Supplemental data | | | | | | | | | | | | |
| Net assets, end of year (000’s) | $ | 1,247,825 | | $ | 1,163,362 | | $ | 1,107,887 | | $ | 871,260 | |
| Portfolio turnover rate | | 7.53 | % | | 5.05 | % | | 1.50 | % | | 0.83 | % |
aFor the period May 1, 2013 (effective date) to September 30, 2013.
bThe amount shown for a share outstanding throughout the period may not correlate with the Statement of Operations for the period due to the timing of sales and
repurchases of the Fund’s shares in relation to income earned and/or fluctuating fair value of the investments of the Fund.
cBased on average daily shares outstanding.
dNet investment income per shares includes approximately $0.10 per share related to income received in the form of special dividend in connection with certain Fund
holdings. Excluding this amount, the ratio of net investment income to average net assets would have been 0.92%.
eTotal return is not annualized for periods less than one year.
fRatios are annualized for periods less than one year.
gBenefit of expense reduction rounds to less than 0.01%.
hBenefit of waiver and payments by affiliates rounds to less than 0.01%.
52 Annual Report | The accompanying notes are an integral part of these financial statements.
franklintempleton.com
| | | | | | | | | | | | | | | |
| | | | | | | | | FRANKLIN CUSTODIAN FUNDS | |
| | | | | | | | | FINANCIAL HIGHLIGHTS | |
| |
| |
| Franklin Growth Fund (continued) | | | | | | | | | | | | | | | |
| | | | | | Year Ended September 30, | | | | |
| | | 2016 | | | 2015 | | | 2014 | | | 2013 | | | 2012 | |
| Advisor Class | | | | | | | | | | | | | | | |
| Per share operating performance | | | | | | | | | | | | | | | |
| (for a share outstanding throughout the year) | | | | | | | | | | | | | | | |
| Net asset value, beginning of year | $ | 72.67 | | $ | 70.75 | | $ | 59.66 | | $ | 50.24 | | $ | 40.53 | |
| Income from investment operationsa: | | | | | | | | | | | | | | | |
| Net investment incomeb | | 0.65 | c | | 0.48 | | | 0.43 | | | 0.39 | | | 0.32 | |
| Net realized and unrealized gains (losses) | | 8.56 | | | 1.79 | | | 11.08 | | | 9.26 | | | 9.78 | |
| Total from investment operations | | 9.21 | | | 2.27 | | | 11.51 | | | 9.65 | | | 10.10 | |
| Less distributions from: | | | | | | | | | | | | | | | |
| Net investment income | | (0.71 | ) | | (0.35 | ) | | (0.42 | ) | | (0.23 | ) | | (0.27 | ) |
| Net realized gains | | (2.37 | ) | | — | | | — | | | — | | | (0.12 | ) |
| Total distributions | | (3.08 | ) | | (0.35 | ) | | (0.42 | ) | | (0.23 | ) | | (0.39 | ) |
| Net asset value, end of year. | $ | 78.80 | | $ | 72.67 | | $ | 70.75 | | $ | 59.66 | | $ | 50.24 | |
| |
| Total return | | 12.85 | % | | 3.20 | % | | 19.37 | % | | 19.29 | % | | 25.04 | % |
| |
| Ratios to average net assets | | | | | | | | | | | | | | | |
| Expenses before waiver and payments by affiliates | | 0.63 | % | | 0.63 | % | | 0.65 | % | | 0.66 | % | | 0.69 | % |
| Expenses net of waiver and payments by affiliates | | 0.61 | %d | | 0.63 | %d,e | | 0.65 | %d,e | | 0.66 | %d | | 0.69 | % |
| Net investment income | | 0.88 | %c | | 0.63 | % | | 0.65 | % | | 0.74 | % | | 0.68 | % |
| |
| Supplemental data | | | | | | | | | | | | | | | |
| Net assets, end of year (000’s) | $ | 1,998,483 | | $ | 1,514,492 | | $ | 1,414,980 | | $ | 1,080,811 | | $ | 1,399,191 | |
| Portfolio turnover rate | | 7.53 | % | | 5.05 | % | | 1.50 | % | | 0.83 | % | | 3.50 | % |
aThe amount shown for a share outstanding throughout the period may not correlate with the Statement of Operations for the period due to the timing of sales and
repurchases of the Fund’s shares in relation to income earned and/or fluctuating fair value of the investments of the Fund.
bBased on average daily shares outstanding.
cNet investment income per share includes approximately $0.10 per share related to income received in the form of special dividends in connection with certain Fund
holdings. Excluding this amount, the ratio of net investment income to average net assets would have been 0.75%.
dBenefit of expense reduction rounds to less than 0.01%.
eBenefit of waiver and payments by affiliates rounds to less than 0.01%.
franklintempleton.com
The accompanying notes are an integral part of these financial statements. | Annual Report 53
| | | | |
| FRANKLIN CUSTODIAN FUNDS | | | | |
| |
| |
| |
| |
| Statement of Investments, September 30, 2016 | | | | |
| Franklin Growth Fund | | | | |
| | Country | Shares | | Value |
| |
| Common Stocks 93.2% | | | | |
| Automobiles & Components 1.5% | | | | |
| BorgWarner Inc | United States | 1,650,000 | $ | 58,047,000 |
| Ford Motor Co | United States | 1,200,000 | | 14,484,000 |
| Harley-Davidson Inc | United States | 913,096 | | 48,019,719 |
| Johnson Controls International PLC | United States | 1,337,120 | | 62,216,193 |
| | | | | 182,766,912 |
| Banks 0.3% | | | | |
| a Signature Bank | United States | 23,000 | | 2,724,350 |
| U.S. Bancorp | United States | 100,000 | | 4,289,000 |
| Wells Fargo & Co | United States | 750,000 | | 33,210,000 |
| | | | | 40,223,350 |
| Capital Goods 16.2% | | | | |
| 3M Co | United States | 855,000 | | 150,676,650 |
| Allegion PLC. | United States | 700,000 | | 48,237,000 |
| AMETEK Inc | United States | 700,000 | | 33,446,000 |
| The Boeing Co | United States | 1,100,000 | | 144,914,000 |
| Caterpillar Inc | United States | 550,000 | | 48,823,500 |
| Deere & Co | United States | 500,000 | | 42,675,000 |
| Emerson Electric Co | United States | 1,100,000 | | 59,961,000 |
| Fortive Corp | United States | 525,000 | | 26,722,500 |
| General Dynamics Corp | United States | 1,000,000 | | 155,160,000 |
| General Electric Co | United States | 1,800,000 | | 53,316,000 |
| Huntington Ingalls Industries Inc | United States | 425,000 | | 65,203,500 |
| Illinois Tool Works Inc | United States | 1,000,000 | | 119,840,000 |
| Ingersoll-Rand PLC | United States | 1,100,000 | | 74,734,000 |
| Lockheed Martin Corp | United States | 500,000 | | 119,860,000 |
| Northrop Grumman Corp | United States | 1,100,000 | | 235,345,000 |
| Raytheon Co | United States | 600,000 | | 81,678,000 |
| Rockwell Collins Inc | United States | 350,000 | | 29,519,000 |
| a Sensata Technologies Holding NV | United States | 3,200,000 | | 124,096,000 |
| Stanley Black & Decker Inc | United States | 650,000 | | 79,937,000 |
| Textron Inc | United States | 1,600,000 | | 63,600,000 |
| United Technologies Corp | United States | 930,000 | | 94,488,000 |
| W.W. Grainger Inc | United States | 550,000 | | 123,662,000 |
| | | | | 1,975,894,150 |
| Commercial & Professional Services 3.3% | | | | |
| Dun & Bradstreet Corp | United States | 675,000 | | 92,218,500 |
| Equifax Inc | United States | 550,000 | | 74,019,000 |
| a IHS Markit Ltd | United States | 3,556,600 | | 133,550,330 |
| a Stericycle Inc | United States | 500,000 | | 40,070,000 |
| a Verisk Analytics Inc | United States | 850,000 | | 69,088,000 |
| | | | | 408,945,830 |
| Consumer Durables & Apparel 1.8% | | | | |
| NIKE Inc., B | United States | 1,880,000 | | 98,982,000 |
| VF Corp | United States | 2,048,000 | | 114,790,400 |
| | | | | 213,772,400 |
| Consumer Services 0.9% | | | | |
| Carnival Corp | United States | 1,200,000 | | 58,584,000 |
| Graham Holdings Co., B | United States | 80,000 | | 38,509,600 |
| Marriott International Inc., A | United States | 200,000 | | 13,466,000 |
54 Annual Report
franklintempleton.com
FRANKLIN CUSTODIAN FUNDS
STATEMENT OF INVESTMENTS
| | | | |
| Franklin Growth Fund (continued) | | | | |
| | Country | Shares | | Value |
| |
| Common Stocks (continued) | | | | |
| Consumer Services (continued) | | | | |
| Starbucks Corp | United States | 78,000 | $ | 4,222,920 |
| | | | | 114,782,520 |
| Diversified Financials 2.4% | | | | |
| American Express Co | United States | 600,000 | | 38,424,000 |
| a Berkshire Hathaway Inc., A | United States | 184 | | 39,784,480 |
| BlackRock Inc | United States | 225,000 | | 81,553,500 |
| The Charles Schwab Corp | United States | 2,200,000 | | 69,454,000 |
| T. Rowe Price Group Inc | United States | 900,000 | | 59,850,000 |
| | | | | 289,065,980 |
| Energy 2.4% | | | | |
| Anadarko Petroleum Corp | United States | 1,250,000 | | 79,200,000 |
| Cabot Oil & Gas Corp., A | United States | 1,700,000 | | 43,860,000 |
| a FMC Technologies Inc | United States | 1,500,000 | | 44,505,000 |
| Halliburton Co | United States | 850,000 | | 38,148,000 |
| Occidental Petroleum Corp | United States | 300,000 | | 21,876,000 |
| Royal Dutch Shell PLC, A, ADR | United Kingdom | 345,000 | | 17,274,150 |
| Schlumberger Ltd | United States | 573,700 | | 45,115,768 |
| | | | | 289,978,918 |
| Food & Staples Retailing 0.5% | | | | |
| Costco Wholesale Corp | United States | 28,000 | | 4,270,280 |
| CVS Health Corp | United States | 656,000 | | 58,377,440 |
| | | | | 62,647,720 |
| Food, Beverage & Tobacco 3.5% | | | | |
| Brown-Forman Corp., B | United States | 1,300,000 | | 61,672,000 |
| Mead Johnson Nutrition Co., A | United States | 1,225,000 | | 96,787,250 |
| Mondelez International Inc., A | United States | 1,500,000 | | 65,850,000 |
| a Monster Beverage Corp | United States | 900,000 | | 132,129,000 |
| PepsiCo Inc | United States | 650,000 | | 70,700,500 |
| | | | | 427,138,750 |
| Health Care Equipment & Services 7.6% | | | | |
| Abbott Laboratories | United States | 1,350,000 | | 57,091,500 |
| Aetna Inc | United States | 600,000 | | 69,270,000 |
| Baxter International Inc | United States | 400,000 | | 19,040,000 |
| Becton, Dickinson and Co | United States | 77,700 | | 13,965,021 |
| Cardinal Health Inc | United States | 300,000 | | 23,310,000 |
| a Cerner Corp | United States | 68,000 | | 4,199,000 |
| Danaher Corp | United States | 1,050,000 | | 82,309,500 |
| a Edwards Lifesciences Corp | United States | 400,000 | | 48,224,000 |
| a Express Scripts Holding Co | United States | 361,648 | | 25,507,033 |
| a Haemonetics Corp | United States | 1,000,000 | | 36,210,000 |
| a Henry Schein Inc | United States | 350,000 | | 57,043,000 |
| Hill-Rom Holdings Inc | United States | 300,000 | | 18,594,000 |
| a Intuitive Surgical Inc | United States | 150,000 | | 108,724,500 |
| a Laboratory Corp. of America Holdings | United States | 500,000 | | 68,740,000 |
| McKesson Corp | United States | 31,000 | | 5,169,250 |
| Medtronic PLC | United States | 406,300 | | 35,104,320 |
| Quest Diagnostics Inc | United States | 900,000 | | 76,167,000 |
| Stryker Corp | United States | 400,000 | | 46,564,000 |
| Teleflex Inc | United States | 500,000 | | 84,025,000 |
| a Varian Medical Systems Inc | United States | 300,000 | | 29,859,000 |
franklintempleton.com
Annual Report
55
FRANKLIN CUSTODIAN FUNDS
STATEMENT OF INVESTMENTS
| | | | |
| Franklin Growth Fund (continued) | | | | |
| | Country | Shares | | Value |
| |
| Common Stocks (continued) | | | | |
| Health Care Equipment & Services (continued) | | | | |
| Zimmer Biomet Holdings Inc | United States | 100,000 | $ | 13,002,000 |
| | | | | 922,118,124 |
| Household & Personal Products 0.2% | | | | |
| The Procter & Gamble Co | United States | 335,000 | | 30,066,250 |
| Insurance 0.4% | | | | |
| Aflac Inc | United States | 600,000 | | 43,122,000 |
| Materials 4.2% | | | | |
| Air Products and Chemicals Inc | United States | 500,000 | | 75,170,000 |
| a Axalta Coating Systems Ltd | United States | 3,400,000 | | 96,118,000 |
| Celanese Corp., A | United States | 1,250,000 | | 83,200,000 |
| The Dow Chemical Co | United States | 90,000 | | 4,664,700 |
| Ecolab Inc | United States | 920,000 | | 111,982,400 |
| Martin Marietta Materials Inc | United States | 400,000 | | 71,644,000 |
| Praxair Inc | United States | 575,000 | | 69,477,250 |
| | | | | 512,256,350 |
| Media 1.7% | | | | |
| Cable One Inc | United States | 80,000 | | 46,720,000 |
| Comcast Corp., A | United States | 55,000 | | 3,648,700 |
| The Walt Disney Co | United States | 1,724,290 | | 160,117,569 |
| | | | | 210,486,269 |
| Pharmaceuticals, Biotechnology & Life Sciences 13.6% | | | | |
| AbbVie Inc | United States | 460,000 | | 29,012,200 |
| Agilent Technologies Inc | United States | 1,300,000 | | 61,217,000 |
| a Allergan PLC | United States | 400,000 | | 92,124,000 |
| Amgen Inc | United States | 1,000,000 | | 166,810,000 |
| a Biogen Inc | United States | 500,000 | | 156,515,000 |
| a Bluebird Bio Inc | United States | 400,000 | | 27,112,000 |
| a Catalent Inc | United States | 3,400,000 | | 87,856,000 |
| a Celgene Corp | United States | 1,300,000 | | 135,889,000 |
| Eli Lilly & Co | United States | 1,450,000 | | 116,377,000 |
| Gilead Sciences Inc | United States | 650,000 | | 51,428,000 |
| a Illumina Inc | United States | 525,000 | | 95,371,500 |
| Johnson & Johnson | United States | 1,200,100 | | 141,767,813 |
| Merck & Co. Inc | United States | 1,000,000 | | 62,410,000 |
| a Mettler-Toledo International Inc | United States | 425,000 | | 178,427,750 |
| Pfizer Inc | United States | 2,761,000 | | 93,515,070 |
| a Regeneron Pharmaceuticals Inc | United States | 5,000 | | 2,010,100 |
| Roche Holding AG, ADR | Switzerland | 1,700,000 | | 52,649,000 |
| Shire PLC, ADR | United States | 59,280 | | 11,492,021 |
| a Waters Corp | United States | 625,000 | | 99,056,250 |
| | | | | 1,661,039,704 |
| Real Estate 0.8% | | | | |
| American Tower Corp | United States | 875,000 | | 99,163,750 |
| Retailing 2.7% | | | | |
| a Amazon.com Inc | United States | 350,000 | | 293,058,500 |
| Expedia Inc | United States | 200,000 | | 23,344,000 |
| Lowe’s Cos. Inc | United States | 60,000 | | 4,332,600 |
| The TJX Cos. Inc | United States | 40,000 | | 2,991,200 |
| | | | | 323,726,300 |
56 Annual Report
franklintempleton.com
FRANKLIN CUSTODIAN FUNDS
STATEMENT OF INVESTMENTS
| | | | |
| Franklin Growth Fund (continued) | | | | |
| | Country | Shares | | Value |
| |
| Common Stocks (continued) | | | | |
| Semiconductors & Semiconductor Equipment 2.2% | | | | |
| ASML Holding NV, N.Y. shs | Netherlands | 650,000 | $ | 71,227,000 |
| Broadcom Ltd | Singapore | 20,000 | | 3,450,400 |
| Intel Corp | United States | 1,100,000 | | 41,525,000 |
| Lam Research Corp | United States | 30,000 | | 2,841,300 |
| Microchip Technology Inc | United States | 45,000 | | 2,796,300 |
| QUALCOMM Inc | United States | 660,000 | | 45,210,000 |
| Texas Instruments Inc | United States | 1,400,000 | | 98,252,000 |
| | | | | 265,302,000 |
| Software & Services 13.9% | | | | |
| a Alibaba Group Holding Ltd., ADR | China | 480,400 | | 50,821,516 |
| a Alphabet Inc., A | United States | 165,000 | | 132,669,900 |
| a Alphabet Inc., C | United States | 158,432 | | 123,147,609 |
| a Autodesk Inc | United States | 800,000 | | 57,864,000 |
| Automatic Data Processing Inc | United States | 700,000 | | 61,740,000 |
| CDK Global LLC | United States | 233,333 | | 13,383,981 |
| a Check Point Software Technologies Ltd | Israel | 525,000 | | 40,745,250 |
| Computer Sciences Corp | United States | 1,400,000 | | 73,094,000 |
| CSRA Inc | United States | 2,300,000 | | 61,870,000 |
| a Dell Technologies Inc., V | United States | 300,942 | | 14,385,028 |
| a Facebook Inc., A | United States | 600,000 | | 76,962,000 |
| a Fortinet Inc | United States | 1,500,000 | | 55,395,000 |
| IAC/InterActiveCorp | United States | 300,000 | | 18,741,000 |
| International Business Machines Corp | United States | 600,000 | | 95,310,000 |
| Intuit Inc | United States | 1,000,000 | | 110,010,000 |
| Mastercard Inc., A | United States | 1,400,000 | | 142,478,000 |
| Microsoft Corp | United States | 3,400,000 | | 195,840,000 |
| Oracle Corp | United States | 2,670,000 | | 104,877,600 |
| a Salesforce.com Inc | United States | 61,000 | | 4,351,130 |
| a ServiceNow Inc | United States | 1,000,000 | | 79,150,000 |
| Visa Inc., A. | United States | 1,400,000 | | 115,780,000 |
| a Yahoo! Inc | United States | 1,700,000 | | 73,270,000 |
| | | | | 1,701,886,014 |
| Technology Hardware & Equipment 6.6% | | | | |
| Apple Inc | United States | 4,086,000 | | 461,922,300 |
| Cisco Systems Inc | United States | 2,945,000 | | 93,415,400 |
| a Keysight Technologies Inc | United States | 650,000 | | 20,598,500 |
| a Palo Alto Networks Inc | United States | 300,000 | | 47,799,000 |
| TE Connectivity Ltd | United States | 1,650,000 | | 106,227,000 |
| a Trimble Inc | United States | 2,700,000 | | 77,112,000 |
| | | | | 807,074,200 |
| Transportation 5.8% | | | | |
| Alaska Air Group Inc | United States | 3,200,000 | | 210,752,000 |
| Allegiant Travel Co | United States | 200,000 | | 26,414,000 |
| C.H. Robinson Worldwide Inc | United States | 267,300 | | 18,833,958 |
| Canadian National Railway Co | Canada | 1,000,000 | | 65,400,000 |
| Canadian Pacific Railway Ltd | Canada | 500,000 | | 76,350,000 |
| Expeditors International of Washington Inc | United States | 600,000 | | 30,912,000 |
| J.B. Hunt Transport Services Inc | United States | 200,000 | | 16,228,000 |
| Kansas City Southern | United States | 450,000 | | 41,994,000 |
| Ryanair Holdings PLC, ADR | Ireland | 233,220 | | 17,498,497 |
franklintempleton.com
Annual Report
57
FRANKLIN CUSTODIAN FUNDS
STATEMENT OF INVESTMENTS
| | | | | |
| Franklin Growth Fund (continued) | | | | | |
| | Country | Shares | | Value | |
| Common Stocks (continued) | | | | | |
| Transportation (continued) | | | | | |
| Union Pacific Corp | United States | 2,030,000 | $ | 197,985,900 | |
| | | | | 702,368,355 | |
| Utilities 0.7% | | | | | |
| American Water Works Co. Inc | United States | 700,000 | | 52,388,000 | |
| NextEra Energy Inc | United States | 250,000 | | 30,580,000 | |
| | | | | 82,968,000 | |
| Total Common Stocks (Cost $5,135,275,908) | | | | 11,366,793,846 | |
| |
| Short Term Investments (Cost $856,457,573) 7.0% | | | | | |
| Money Market Funds 7.0% | | | | | |
| a,b Institutional Fiduciary Trust Money Market Portfolio | United States | 856,457,573 | | 856,457,573 | |
| Total Investments (Cost $5,991,733,481) 100.2%. | | | | 12,223,251,419 | |
| Other Assets, less Liabilities (0.2)% | | | | (24,233,578 | ) |
| Net Assets 100.0% | | | $ | 12,199,017,841 | |
See Abbreviations on page 126.
aNon-income producing.
bSee Note 3(f) regarding investments in affiliated management investment companies.
58 Annual Report | The accompanying notes are an integral part of these financial statements.
franklintempleton.com
| | | | | | | | | | | | | | | |
| | | | | | | | | FRANKLIN CUSTODIAN FUNDS | |
| |
| |
| Financial Highlights | | | | | | | | | | | | | | | |
| Franklin Income Fund | | | | | | | | | | | | | | | |
| | | | | | Year Ended September 30, | | | | |
| | | 2016 | | | 2015 | | | 2014 | | | 2013 | | | 2012 | |
| Class A | | | | | | | | | | | | | | | |
| Per share operating performance | | | | | | | | | | | | | | | |
| (for a share outstanding throughout the year) | | | | | | | | | | | | | | | |
| Net asset value, beginning of year | $ | 2.10 | | $ | 2.48 | | $ | 2.33 | | $ | 2.23 | | $ | 1.98 | |
| Income from investment operationsa: | | | | | | | | | | | | | | | |
| Net investment incomeb | | 0.10 | | | 0.10 | | | 0.11 | | | 0.11 | | | 0.13 | |
| Net realized and unrealized gains (losses) | | 0.17 | | | (0.36 | ) | | 0.16 | | | 0.12 | | | 0.26 | |
| Total from investment operations | | 0.27 | | | (0.26 | ) | | 0.27 | | | 0.23 | | | 0.39 | |
| Less distributions from net investment income | | (0.12 | ) | | (0.12 | ) | | (0.12 | ) | | (0.13 | ) | | (0.14 | ) |
| Net asset value, end of year. | $ | 2.25 | | $ | 2.10 | | $ | 2.48 | | $ | 2.33 | | $ | 2.23 | |
| |
| Total returnc | | 13.31 | % | | (10.93 | )% | | 11.86 | % | | 10.72 | % | | 20.38 | % |
| |
| Ratios to average net assets | | | | | | | | | | | | | | | |
| Expensesd | | 0.61 | %e | | 0.61 | %e | | 0.61 | %e | | 0.62 | % | | 0.64 | % |
| Net investment income | | 4.57 | % | | 4.43 | % | | 4.28 | % | | 4.98 | % | | 5.90 | % |
| |
| Supplemental data | | | | | | | | | | | | | | | |
| Net assets, end of year (000’s) | $ | 45,515,127 | | $ | 44,886,127 | | $ | 53,823,921 | | $ | 48,320,611 | | $ | 41,280,437 | |
| Portfolio turnover rate | | 61.26 | % | | 44.81 | % | | 36.03 | % | | 37.60 | % | | 33.44 | % |
aThe amount shown for a share outstanding throughout the period may not correlate with the Statement of Operations for the period due to the timing of sales and
repurchases of the Fund’s shares in relation to income earned and/or fluctuating fair value of the investments of the Fund.
bBased on average daily shares outstanding.
cTotal return does not reflect sales commissions or contingent deferred sales charges, if applicable.
dBenefit of expense reduction rounds to less than 0.01%.
eBenefit of waiver and payments by affiliates rounds to less than 0.01%.
franklintempleton.com
The accompanying notes are an integral part of these financial statements. | Annual Report 59
| | | | | | | | | | | | | | | |
| FRANKLIN CUSTODIAN FUNDS | | | | | | | | | | | | | | | |
| FINANCIAL HIGHLIGHTS | | | | | | | | | | | | | | | |
| |
| |
| Franklin Income Fund (continued) | | | | | | | | | | | | | | | |
| | | | | | Year Ended September 30, | | | | |
| | | 2016 | | | 2015 | | | 2014 | | | 2013 | | | 2012 | |
| Class C | | | | | | | | | | | | | | | |
| Per share operating performance | | | | | | | | | | | | | | | |
| (for a share outstanding throughout the year) | | | | | | | | | | | | | | | |
| Net asset value, beginning of year | $ | 2.13 | | $ | 2.50 | | $ | 2.35 | | $ | 2.25 | | $ | 2.00 | |
| Income from investment operationsa: | | | | | | | | | | | | | | | |
| Net investment incomeb | | 0.09 | | | 0.09 | | | 0.09 | | | 0.10 | | | 0.12 | |
| Net realized and unrealized gains (losses) | | 0.16 | | | (0.35 | ) | | 0.17 | | | 0.12 | | | 0.26 | |
| Total from investment operations | | 0.25 | | | (0.26 | ) | | 0.26 | | | 0.22 | | | 0.38 | |
| Less distributions from net investment income | | (0.11 | ) | | (0.11 | ) | | (0.11 | ) | | (0.12 | ) | | (0.13 | ) |
| Net asset value, end of year. | $ | 2.27 | | $ | 2.13 | | $ | 2.50 | | $ | 2.35 | | $ | 2.25 | |
| |
| Total returnc | | 12.07 | % | | (10.89 | )% | | 11.19 | % | | 10.07 | % | | 19.58 | % |
| |
| Ratios to average net assets | | | | | | | | | | | | | | | |
| Expensesd | | 1.11 | %e | | 1.11 | %e | | 1.11 | %e | | 1.12 | % | | 1.14 | % |
| Net investment income | | 4.07 | % | | 3.93 | % | | 3.78 | % | | 4.48 | % | | 5.40 | % |
| |
| Supplemental data | | | | | | | | | | | | | | | |
| Net assets, end of year (000’s) | $ | 23,841,466 | | $ | 24,091,638 | | $ | 28,802,209 | | $ | 24,016,797 | | $ | 20,220,114 | |
| Portfolio turnover rate | | 61.26 | % | | 44.81 | % | | 36.03 | % | | 37.60 | % | | 33.44 | % |
aThe amount shown for a share outstanding throughout the period may not correlate with the Statement of Operations for the period due to the timing of sales and
repurchases of the Fund’s shares in relation to income earned and/or fluctuating fair value of the investments of the Fund.
bBased on average daily shares outstanding.
cTotal return does not reflect sales commissions or contingent deferred sales charges, if applicable.
dBenefit of expense reduction rounds to less than 0.01%.
eBenefit of waiver and payments by affiliates rounds to less than 0.01%.
60 Annual Report | The accompanying notes are an integral part of these financial statements.
franklintempleton.com
| | | | | | | | | | | | | | | |
| | | | | | | | | FRANKLIN CUSTODIAN FUNDS | |
| | | | | | | | | FINANCIAL HIGHLIGHTS | |
| |
| |
| Franklin Income Fund (continued) | | | | | | | | | | | | | | | |
| | | | | | Year Ended September 30, | | | | |
| | | 2016 | | | 2015 | | | 2014 | | | 2013 | | | 2012 | |
| Class R | | | | | | | | | | | | | | | |
| Per share operating performance | | | | | | | | | | | | | | | |
| (for a share outstanding throughout the year) | | | | | | | | | | | | | | | |
| Net asset value, beginning of year | $ | 2.07 | | $ | 2.44 | | $ | 2.29 | | $ | 2.20 | | $ | 1.96 | |
| Income from investment operationsa: | | | | | | | | | | | | | | | |
| Net investment incomeb | | 0.09 | | | 0.10 | | | 0.10 | | | 0.11 | | | 0.12 | |
| Net realized and unrealized gains (losses) | | 0.16 | | | (0.36 | ) | | 0.16 | | | 0.10 | | | 0.25 | |
| Total from investment operations | | 0.25 | | | (0.26 | ) | | 0.26 | | | 0.21 | | | 0.37 | |
| Less distributions from net investment income | | (0.11 | ) | | (0.11 | ) | | (0.11 | ) | | (0.12 | ) | | (0.13 | ) |
| Net asset value, end of year. | $ | 2.21 | | $ | 2.07 | | $ | 2.44 | | $ | 2.29 | | $ | 2.20 | |
| |
| Total return | | 12.62 | % | | (10.99 | )% | | 11.66 | % | | 10.03 | % | | 19.66 | % |
| |
| Ratios to average net assets | | | | | | | | | | | | | | | |
| Expensesc | | 0.96 | %d | | 0.96 | %d | | 0.96 | %d | | 0.97 | % | | 0.99 | % |
| Net investment income | | 4.22 | % | | 4.08 | % | | 3.93 | % | | 4.63 | % | | 5.55 | % |
| |
| Supplemental data | | | | | | | | | | | | | | | |
| Net assets, end of year (000’s) | $ | 396,107 | | $ | 416,653 | | $ | 514,892 | | $ | 446,463 | | $ | 426,525 | |
| Portfolio turnover rate | | 61.26 | % | | 44.81 | % | | 36.03 | % | | 37.60 | % | | 33.44 | % |
aThe amount shown for a share outstanding throughout the period may not correlate with the Statement of Operations for the period due to the timing of sales and
repurchases of the Fund’s shares in relation to income earned and/or fluctuating fair value of the investments of the Fund.
bBased on average daily shares outstanding.
cBenefit of expense reduction rounds to less than 0.01%.
dBenefit of waiver and payments by affiliates rounds to less than 0.01%.
franklintempleton.com
The accompanying notes are an integral part of these financial statements. | Annual Report 61
| | | | | | | | | | | | |
| FRANKLIN CUSTODIAN FUNDS | | | | | | | | | | | | |
| FINANCIAL HIGHLIGHTS | | | | | | | | | | | | |
| |
| |
| Franklin Income Fund (continued) | | | | | | | | | | | | |
| | | Year Ended September 30, | | | | |
| | | 2016 | | | 2015 | | | 2014 | | | 2013 | a |
| Class R6 | | | | | | | | | | | | |
| Per share operating performance | | | | | | | | | | | | |
| (for a share outstanding throughout the year) | | | | | | | | | | | | |
| Net asset value, beginning of year | $ | 2.09 | | $ | 2.46 | | $ | 2.31 | | $ | 2.33 | |
| Income from investment operationsb: | | | | | | | | | | | | |
| Net investment incomec | | 0.10 | | | 0.11 | | | 0.11 | | | 0.04 | |
| Net realized and unrealized gains (losses) | | 0.16 | | | (0.35 | ) | | 0.17 | | | (0.02 | ) |
| Total from investment operations | | 0.26 | | | (0.24 | ) | | 0.28 | | | 0.02 | |
| Less distributions from net investment income | | (0.12 | ) | | (0.13 | ) | | (0.13 | ) | | (0.04 | ) |
| Net asset value, end of year | $ | 2.23 | | $ | 2.09 | | $ | 2.46 | | $ | 2.31 | |
| |
| Total returnd | | 13.15 | % | | (10.39 | )% | | 12.19 | % | | 1.06 | % |
| |
| Ratios to average net assetse | | | | | | | | | | | | |
| Expensesf | | 0.38 | %g | | 0.38 | %g | | 0.38 | %g | | 0.39 | % |
| Net investment income | | 4.80 | % | | 4.66 | % | | 4.50 | % | | 5.21 | % |
| |
| Supplemental data | | | | | | | | | | | | |
| Net assets, end of year (000’s) | $ | 1,737,577 | | $ | 1,744,718 | | $ | 2,108,076 | | $ | 1,921,084 | |
| Portfolio turnover rate | | 61.26 | % | | 44.81 | % | | 36.03 | % | | 37.60 | % |
aFor the period May 1, 2013 (effective date) to September 30, 2013.
bThe amount shown for a share outstanding throughout the period may not correlate with the Statement of Operations for the period due to the timing of sales and
repurchases of the Fund’s shares in relation to income earned and/or fluctuating fair value of the investments of the Fund.
cBased on average daily shares outstanding.
dTotal return is not annualized for periods less than one year.
eRatios are annualized for periods less than one year.
fBenefit of expense reduction rounds to less than 0.01%.
gBenefit of waiver and payments by affiliates rounds to less than 0.01%.
62 Annual Report | The accompanying notes are an integral part of these financial statements.
franklintempleton.com
| | | | | | | | | | | | | | | |
| | | | | | | | | FRANKLIN CUSTODIAN FUNDS | |
| | | | | | | | | FINANCIAL HIGHLIGHTS | |
| |
| |
| Franklin Income Fund (continued) | | | | | | | | | | | | | | | |
| | | | | | Year Ended September 30, | | | | |
| | | 2016 | | | 2015 | | | 2014 | | | 2013 | | | 2012 | |
| Advisor Class | | | | | | | | | | | | | | | |
| Per share operating performance | | | | | | | | | | | | | | | |
| (for a share outstanding throughout the year) | | | | | | | | | | | | | | | |
| Net asset value, beginning of year | $ | 2.09 | | $ | 2.46 | | $ | 2.31 | | $ | 2.22 | | $ | 1.97 | |
| Income from investment operationsa: | | | | | | | | | | | | | | | |
| Net investment incomeb | | 0.10 | | | 0.11 | | | 0.11 | | | 0.12 | | | 0.13 | |
| Net realized and unrealized gains (losses) | | 0.16 | | | (0.36 | ) | | 0.17 | | | 0.11 | | | 0.26 | |
| Total from investment operations | | 0.26 | | | (0.25 | ) | | 0.28 | | | 0.23 | | | 0.39 | |
| Less distributions from net investment income | | (0.12 | ) | | (0.12 | ) | | (0.13 | ) | | (0.14 | ) | | (0.14 | ) |
| Net asset value, end of year. | $ | 2.23 | | $ | 2.09 | | $ | 2.46 | | $ | 2.31 | | $ | 2.22 | |
| |
| Total return | | 13.06 | % | | (10.46 | )% | | 12.12 | % | | 10.49 | % | | 20.69 | % |
| |
| Ratios to average net assets | | | | | | | | | | | | | | | |
| Expensesc | | 0.46 | %d | | 0.46 | %d | | 0.46 | %d | | 0.47 | % | | 0.49 | % |
| Net investment income | | 4.72 | % | | 4.58 | % | | 4.43 | % | | 5.13 | % | | 6.05 | % |
| |
| Supplemental data | | | | | | | | | | | | | | | |
| Net assets, end of year (000’s) | $ | 8,143,479 | | $ | 7,754,475 | | $ | 9,096,269 | | $ | 5,903,701 | | $ | 6,444,763 | |
| Portfolio turnover rate | | 61.26 | % | | 44.81 | % | | 36.03 | % | | 37.60 | % | | 33.44 | % |
aThe amount shown for a share outstanding throughout the period may not correlate with the Statement of Operations for the period due to the timing of sales and
repurchases of the Fund’s shares in relation to income earned and/or fluctuating fair value of the investments of the Fund.
bBased on average daily shares outstanding.
cBenefit of expense reduction rounds to less than 0.01%.
dBenefit of waiver and payments by affiliates rounds to less than 0.01%.
franklintempleton.com
The accompanying notes are an integral part of these financial statements. | Annual Report 63
| | | | |
| FRANKLIN CUSTODIAN FUNDS | | | | |
| |
| |
| |
| |
| Statement of Investments, September 30, 2016 | | | | |
| Franklin Income Fund | | | | |
| | Country | Shares | | Value |
| |
| Common Stocks 41.0% | | | | |
| Consumer Discretionary 3.4% | | | | |
| Daimler AG | Germany | 8,000,000 | $ | 563,788,016 |
| Ford Motor Co | United States | 47,841,459 | | 577,446,410 |
| General Motors Co | United States | 20,000,000 | | 635,400,000 |
| Target Corp | United States | 14,000,000 | | 961,520,000 |
| | | | | 2,738,154,426 |
| Consumer Staples 3.7% | | | | |
| Anheuser-Busch InBev SA/NV, ADR | Belgium | 4,500,000 | | 591,345,000 |
| The Coca-Cola Co | United States | 25,000,000 | | 1,058,000,000 |
| PepsiCo Inc | United States | 4,000,000 | | 435,080,000 |
| Philip Morris International Inc | United States | 5,000,000 | | 486,100,000 |
| Reynolds American Inc | United States | 5,000,000 | | 235,750,000 |
| Woolworths Ltd | Australia | 7,500,000 | | 133,607,615 |
| | | �� | | 2,939,882,615 |
| Energy 6.9% | | | | |
| Anadarko Petroleum Corp | United States | 5,000,000 | | 316,800,000 |
| a Bill Barrett Corp | United States | 510,000 | | 2,835,600 |
| BP PLC, ADR | United Kingdom | 28,500,000 | | 1,002,060,000 |
| Chevron Corp | United States | 8,600,000 | | 885,112,000 |
| a,b,c Halcon Resources Corp | United States | 28,306,773 | | 233,127,308 |
| Occidental Petroleum Corp | United States | 5,000,000 | | 364,600,000 |
| a,b PetroQuest Energy Inc | United States | 1,283,318 | | 4,440,280 |
| a,b,c Rex Energy Corp | United States | 2,520,000 | | 1,459,302 |
| a,b Rex Energy Corp | United States | 6,194,262 | | 3,616,829 |
| Royal Dutch Shell PLC, A, ADR | United Kingdom | 35,000,000 | | 1,752,450,000 |
| Total SA, B, ADR | France | 17,500,000 | | 834,750,000 |
| a,b W&T Offshore Inc | United States | 28,041,726 | | 49,353,438 |
| | | | | 5,450,604,757 |
| Financials 4.4% | | | | |
| AXA SA | France | 22,000,000 | | 468,265,010 |
| Bank of America Corp | United States | 6,370,001 | | 99,690,515 |
| Commonwealth Bank of Australia | Australia | 2,286,957 | | 126,756,468 |
| HSBC Holdings PLC | United Kingdom | 75,000,000 | | 562,821,894 |
| JPMorgan Chase & Co | United States | 9,720,000 | | 647,254,800 |
| MetLife Inc | United States | 9,000,000 | | 399,870,000 |
| U.S. Bancorp. | United States | 10,500,000 | | 450,345,000 |
| Wells Fargo & Co | United States | 17,500,000 | | 774,900,000 |
| | | | | 3,529,903,687 |
| Health Care 4.5% | | | | |
| AstraZeneca PLC | United Kingdom | 14,000,000 | | 908,451,140 |
| Eli Lilly & Co | United States | 8,000,000 | | 642,080,000 |
| Medtronic PLC | United States | 2,000,000 | | 172,800,000 |
| Pfizer Inc | United States | 23,000,000 | | 779,010,000 |
| Roche Holding AG | Switzerland | 1,500,000 | | 372,162,454 |
| Sanofi, ADR | France | 18,000,000 | | 687,420,000 |
| | | | | 3,561,923,594 |
| Industrials 4.7% | | | | |
| a,b,d CEVA Holdings LLC | United States | 91,371 | | 31,979,871 |
| Deere & Co | United States | 8,500,000 | | 725,475,000 |
| General Electric Co | United States | 42,500,000 | | 1,258,850,000 |
| Republic Services Inc | United States | 8,000,000 | | 403,600,000 |
64 Annual Report
franklintempleton.com
FRANKLIN CUSTODIAN FUNDS
STATEMENT OF INVESTMENTS
| | | | |
| Franklin Income Fund (continued) | | | | |
| | Country | Shares | | Value |
| |
| Common Stocks (continued) | | | | |
| Industrials (continued) | | | | |
| Union Pacific Corp | United States | 8,000,000 | $ | 780,240,000 |
| United Technologies Corp | United States | 5,000,000 | | 508,000,000 |
| | | | | 3,708,144,871 |
| Information Technology 3.2% | | | | |
| Analog Devices Inc | United States | 6,000,000 | | 386,700,000 |
| Apple Inc | United States | 5,000,000 | | 565,250,000 |
| e Cisco Systems Inc | United States | 2,000,000 | | 63,440,000 |
| a First Data Corp., A | United States | 5,000,000 | | 65,800,000 |
| e Microsoft Corp | United States | 18,500,000 | | 1,065,600,000 |
| QUALCOMM Inc | United States | 2,100,000 | | 143,850,000 |
| Western Digital Corp | United States | 5,000,000 | | 292,350,000 |
| | | | | 2,582,990,000 |
| Materials 3.7% | | | | |
| BASF SE | Germany | 12,000,000 | | 1,026,389,073 |
| The Dow Chemical Co | United States | 18,000,000 | | 932,940,000 |
| The Mosaic Co | United States | 15,000,000 | | 366,900,000 |
| Rio Tinto PLC, ADR | United Kingdom | 18,000,000 | | 601,200,000 |
| | | | | 2,927,429,073 |
| Real Estate 0.7% | | | | |
| Host Hotels & Resorts Inc | United States | 30,000,000 | | 467,100,000 |
| Outfront Media Inc | United States | 5,000,000 | | 118,250,000 |
| | | | | 585,350,000 |
| Telecommunication Services 1.2% | | | | |
| BCE Inc | Canada | 5,500,000 | | 253,910,625 |
| BT Group PLC. | United Kingdom | 25,000,000 | | 126,125,141 |
| Telstra Corp. Ltd | Australia | 40,000,000 | | 158,621,961 |
| TELUS Corp | Canada | 2,500,000 | | 82,460,284 |
| Verizon Communications Inc | United States | 7,000,000 | | 363,860,000 |
| | | | | 984,978,011 |
| Utilities 4.6% | | | | |
| Dominion Resources Inc | United States | 12,500,000 | | 928,375,000 |
| Duke Energy Corp | United States | 5,000,000 | | 400,200,000 |
| Great Plains Energy Inc | United States | 4,667,500 | | 127,376,075 |
| PG&E Corp | United States | 10,000,000 | | 611,700,000 |
| PPL Corp | United States | 5,500,000 | | 190,135,000 |
| Public Service Enterprise Group Inc | United States | 4,000,000 | | 167,480,000 |
| Sempra Energy | United States | 4,500,000 | | 482,355,000 |
| The Southern Co | United States | 7,000,000 | | 359,100,000 |
| SSE PLC | United Kingdom | 5,000,000 | | 101,665,196 |
| Xcel Energy Inc | United States | 7,000,000 | | 287,980,000 |
| | | | | 3,656,366,271 |
| Total Common Stocks (Cost $30,900,162,043) | | | | 32,665,727,305 |
| |
| f Equity-Linked Securities 13.0% | | | | |
| Consumer Discretionary 1.6% | | | | |
| g The Goldman Sachs Group Inc. into Ford Motor Co., 9.00%, 144A | United States | 17,915,000 | | 220,202,222 |
| g JPMorgan Chase & Co. into Target Corp., 6.50%, 144A | United States | 1,892,000 | | 131,461,647 |
| g JPMorgan Chase & Co. into Target Corp., 6.50%, 144A | United States | 2,014,000 | | 139,354,903 |
| g Merrill Lynch International & Co. CV into Ford Motor Co., 8.50%, 144A | United States | 18,740,000 | | 231,476,480 |
franklintempleton.com
Annual Report
65
FRANKLIN CUSTODIAN FUNDS
STATEMENT OF INVESTMENTS
| | | | |
| Franklin Income Fund (continued) | | | | |
| | Country | Shares | | Value |
| |
| f Equity-Linked Securities (continued) | | | | |
| Consumer Discretionary (continued) | | | | |
| g Morgan Stanley into Nordstrom Inc., 8.00%, 144A | United States | 3,000,000 | $ | 153,327,300 |
| g UBS AG into General Motors Co., 8.00%, 144A. | United States | 5,706,000 | | 183,017,668 |
| g UBS AG into Target Corp., 6.00%, 144A | United States | 2,868,000 | | 196,578,743 |
| | | | | 1,255,418,963 |
| Energy 2.3% | | | | |
| g Credit Suisse New York into Chevron Corp., 7.00%, 144A | United States | 2,065,000 | | 211,347,587 |
| g Credit Suisse New York into Halliburton Co., 8.00%, 144A | United States | 4,484,000 | | 198,847,016 |
| g Credit Suisse New York into Schlumberger Ltd., 7.50%, 144A. | United States | 2,665,000 | | 207,513,157 |
| g JPMorgan Chase & Co. into Anadarko Petroleum Corp., 8.50%, 144A | United States | 2,584,000 | | 162,653,756 |
| g JPMorgan Chase & Co. into Halliburton Co., 8.00%, 144A | United States | 4,952,000 | | 212,268,470 |
| g JPMorgan Chase & Co. into Halliburton Co., 8.50%, 144A | United States | 3,054,000 | | 130,580,489 |
| g Morgan Stanley into Anadarko Petroleum Corp., 9.50%, 144A. | United States | 4,275,000 | | 242,374,117 |
| g Royal Bank of Canada into Anadarko Petroleum Corp., 7.50%, 144A. | United States | 3,382,000 | | 197,006,235 |
| g UBS AG into Exxon Mobil Corp., 6.50%, 144A | United States | 3,058,000 | | 262,463,859 |
| | | | | 1,825,054,686 |
| Financials 2.0% | | | | |
| g Barclays Bank PLC into Bank of America Corp., 7.00%, 144A. | United States | 10,600,000 | | 159,702,780 |
| g Barclays Bank PLC into Morgan Stanley, 8.00%, 144A | United States | 7,327,000 | | 216,642,538 |
| g BNP Paribas Arbitrage Issuance BV into JPMorgan Chase & Co., 6.50%, | | | | |
| 144A | United States | 3,124,000 | | 203,434,880 |
| g Citigroup Global Markets Holdings Inc. into Metlife Inc., 8.00%, 144A | United States | 3,502,000 | | 153,579,860 |
| g Deutsche Bank AG/London into MetLife Inc., 8.00%, 144A | United States | 3,296,000 | | 145,730,333 |
| g Merrill Lynch International & Co. CV into Morgan Stanley, 7.50%, 144A | United States | 6,600,000 | | 202,912,380 |
| g UBS AG into Bank of America Corp., 6.50%, 144A | United States | 9,586,000 | | 150,802,159 |
| g Wells Fargo Bank NA into The Charles Schwab Corp., 7.50%, 144A | United States | 5,773,000 | | 171,041,866 |
| g Wells Fargo Bank NA into MetLife Inc., 8.50%, 144A | United States | 3,659,000 | | 156,692,284 |
| | | | | 1,560,539,080 |
| Health Care 1.2% | | | | |
| g Barclays Bank PLC into Gilead Sciences Inc., 8.50%, 144A | United States | 3,333,000 | | 265,848,746 |
| g Barclays Bank PLC into Medtronic PLC, 6.00%, 144A | United States | 1,310,000 | | 108,564,547 |
| g JPMorgan Chase & Co. into Medtronic PLC, 6.00%, 144A | United States | 1,308,000 | | 109,067,580 |
| g JPMorgan Chase & Co. into Merck & Co. Inc., 6.25%, 144A | United States | 2,540,000 | | 152,508,204 |
| g Royal Bank of Canada into Medtronic PLC, 6.50%, 144A | United States | 2,064,000 | | 168,389,789 |
| g UBS AG into Eli Lilly & Co., 7.50%, 144A | United States | 2,400,000 | | 192,940,800 |
| | | | | 997,319,666 |
| Industrials 0.9% | | | | |
| g Bank of America Merrill Lynch into Illinois Tool Works Inc., 6.00%, 144A | United States | 1,057,000 | | 111,628,713 |
| g Barclays Bank PLC into The Boeing Co., 7.50%, 144A | United States | 1,180,000 | | 153,656,060 |
| g Goldman Sachs International into Deere & Co., 8.10%, 144A | United States | 1,220,000 | | 103,229,324 |
| g Merrill Lynch International & Co. CV into Deere & Co., 7.00%, 144A | United States | 1,890,000 | | 159,980,940 |
| g Merrill Lynch International & Co. CV into Deere & Co., 7.50%, 144A | United States | 2,440,000 | | 204,878,504 |
| | | | | 733,373,541 |
| Information Technology 4.3% | | | | |
| g Barclays Bank PLC into Cisco Systems Inc., 7.00%, 144A | United States | 8,250,000 | | 258,822,300 |
| g Barclays Bank PLC into Microsoft Corp., 7.00%, 144A | United States | 6,060,000 | | 331,547,448 |
| g Citigroup Inc. into Apple Inc., 7.50%, 144A | United States | 2,395,400 | | 265,654,651 |
| g Credit Suisse New York into Cisco Systems Inc., 7.50%, 144A | United States | 7,580,000 | | 221,676,342 |
| g Credit Suisse New York into Texas Instruments Inc., 7.00%, 144A | United States | 2,575,000 | | 165,375,255 |
| g The Goldman Sachs Group Inc. into Apple Inc., 7.50%, 144A | United States | 1,561,000 | | 177,857,998 |
| g The Goldman Sachs Group Inc. into Oracle Corp., 6.00%, 144A | United States | 6,946,000 | | 267,709,954 |
66 Annual Report
franklintempleton.com
FRANKLIN CUSTODIAN FUNDS
STATEMENT OF INVESTMENTS
| | | | |
| Franklin Income Fund (continued) | | | | |
| | Country | Shares | | Value |
| |
| f Equity-Linked Securities (continued) | | | | |
| Information Technology (continued) | | | | |
| g Goldman Sachs International into QUALCOMM Inc., 8.50%, 144A | United States | 1,647,000 | $ | 92,696,619 |
| g Merrill Lynch International & Co. CV into Oracle Corp., 6.00%, 144A | United States | 4,950,000 | | 196,397,685 |
| g Morgan Stanley into QUALCOMM Inc., 8.00%, 144A | United States | 3,949,000 | | 229,404,518 |
| g Royal Bank of Canada into Cisco Systems Inc., 7.50%, 144A | United States | 9,356,000 | | 270,715,860 |
| g Royal Bank of Canada into Microsoft Corp., 7.00%, 144A. | United States | 5,080,000 | | 273,195,796 |
| g UBS AG into Intel Corp., 7.00%, 144A | United States | 5,750,000 | | 213,616,525 |
| g Wells Fargo Bank NA into Intel Corp., 7.00%, 144A | United States | 5,804,000 | | 211,337,570 |
| g Wells Fargo Bank NA into Texas Instruments Inc., 6.50%, 144A | United States | 3,535,000 | | 223,689,497 |
| | | | | 3,399,698,018 |
| Materials 0.7% | | | | |
| g Citigroup Inc. into The Dow Chemical Co., 8.00%, 144A. | United States | 4,283,000 | | 218,624,450 |
| g Deutsche Bank AG/London into Agrium Inc., 8.00%, 144A | Canada | 1,050,000 | | 95,565,750 |
| g Merrill Lynch International & Co. CV into The Dow Chemical Co., 7.50%, | | | | |
| 144A | United States | 4,826,000 | | 251,491,547 |
| | | | | 565,681,747 |
| Total Equity-Linked Securities (Cost $9,946,537,966) | | | | 10,337,085,701 |
| |
| Convertible Preferred Stocks 3.0% | | | | |
| Financials 1.4% | | | | |
| Bank of America Corp., 7.25%, cvt. pfd., L | United States | 570,218 | | 696,144,943 |
| a FNMA, 5.375%, cvt. pfd | United States | 4,250 | | 48,875,000 |
| Wells Fargo & Co., 7.50%, cvt. pfd., A | United States | 260,097 | | 340,362,934 |
| | | | | 1,085,382,877 |
| Health Care 0.7% | | | | |
| Allergan PLC, 5.50%, cvt. pfd | United States | 200,000 | | 164,326,000 |
| Teva Pharmaceutical Industries Ltd., 7.00%, cvt. pfd | Israel | 525,000 | | 426,987,330 |
| | | | | 591,313,330 |
| Industrials 0.0%† | | | | |
| a,b,d CEVA Holdings LLC, cvt. pfd., A-1 | United States | 2,897 | | 1,448,625 |
| a,b,d CEVA Holdings LLC, cvt. pfd., A-2 | United States | 110,565 | | 38,697,778 |
| | | | | 40,146,403 |
| Materials 0.1% | | | | |
| Alcoa Inc., 5.375%, cvt. pfd | United States | 2,647,775 | | 86,555,765 |
| Real Estate 0.1% | | | | |
| FelCor Lodging Trust Inc., 7.80%, cvt. pfd., A | United States | 2,426,120 | | 60,677,261 |
| Telecommunication Services 0.1% | | | | |
| T-Mobile US Inc., 5.50%, cvt. pfd | United States | 777,800 | | 60,722,846 |
| Utilities 0.6% | | | | |
| Dominion Resources Inc., 6.375%, cvt. pfd., A | United States | 2,500,000 | | 124,400,000 |
| Exelon Corp., 6.50%, cvt. pfd | United States | 2,250,000 | | 105,165,000 |
| a Great Plains Energy Inc., 7.00%, cvt. pfd | United States | 1,080,000 | | 55,609,200 |
| NextEra Energy Inc., 6.371%, cvt. pfd | United States | 3,650,000 | | 215,496,000 |
| | | | | 500,670,200 |
| Total Convertible Preferred Stocks | | | | |
| (Cost $2,511,784,704) | | | | 2,425,468,682 |
franklintempleton.com
Annual Report
67
FRANKLIN CUSTODIAN FUNDS
STATEMENT OF INVESTMENTS
| | | | |
| Franklin Income Fund (continued) | | | | |
| | Country | Shares | | Value |
| |
| Preferred Stocks 0.1% | | | | |
| Financials 0.1% | | | | |
| a FHLMC, 8.375%, pfd., Z | United States | 8,132,009 | $ | 28,299,391 |
| a FNMA, 8.25%, pfd., S | United States | 6,000,000 | | 21,060,000 |
| Morgan Stanley, 6.375%, pfd., I | United States | 1,977,655 | | 55,117,245 |
| Total Preferred Stocks (Cost $391,641,600) | | | | 104,476,636 |
| |
| |
| | | Principal | | |
| | | Amount* | | |
| |
| Convertible Bonds 0.6% | | | | |
| Energy 0.5% | | | | |
| g Chesapeake Energy Corp., senior note, 144A, cvt., 5.50%, 9/15/26 | United States | 50,000,000 | | 50,000,000 |
| Cobalt International Energy Inc., | | | | |
| cvt., senior bond, 3.125%, 5/15/24 | United States | 61,204,000 | | 23,869,560 |
| cvt., senior note, 2.625%, 12/01/19 | United States | 70,000,000 | | 35,962,500 |
| h Stone Energy Corp., cvt., senior note, 1.75%, 3/01/17 | United States | 150,000,000 | | 88,968,750 |
| Weatherford International Ltd., cvt., senior note, 5.875%, 7/01/21 | United States | 220,000,000 | | 247,362,500 |
| | | | | 446,163,310 |
| Health Care 0.1% | | | | |
| Impax Laboratories Inc., cvt., senior note, 2.00%, 6/15/22 | United States | 55,000,000 | | 48,537,500 |
| Total Convertible Bonds (Cost $586,600,085) | | | | 494,700,810 |
| |
| Corporate Bonds 36.6% | | | | |
| Consumer Discretionary 5.3% | | | | |
| g,i 24 Hour Holdings III LLC, senior note, 144A, 8.00%, 6/01/22. | United States | 103,000,000 | | 84,202,500 |
| g Altice Financing SA, | | | | |
| secured bond, 144A, 7.50%, 5/15/26 | Luxembourg | 50,000,000 | | 52,187,500 |
| secured note, 144A, 6.625%, 2/15/23 | Luxembourg | 45,000,000 | | 46,350,000 |
| g Altice Luxembourg SA, | | | | |
| senior bond, 144A, 7.625%, 2/15/25 | Luxembourg | 20,000,000 | | 20,600,000 |
| senior secured note, 144A, 7.75%, 5/15/22 | Luxembourg | 25,000,000 | | 26,781,250 |
| AMC Networks Inc., 4.75%, 12/15/22 | United States | 26,500,000 | | 26,930,625 |
| CCO Holdings LLC/CCO Holdings Capital Corp., | | | | |
| senior bond, 5.125%, 2/15/23 | United States | 170,000,000 | | 177,650,000 |
| senior bond, 5.75%, 9/01/23 | United States | 67,000,000 | | 71,103,750 |
| senior bond, 5.75%, 1/15/24 | United States | 168,000,000 | | 178,920,000 |
| g senior bond, 144A, 5.75%, 2/15/26 | United States | 40,900,000 | | 43,456,250 |
| g senior bond, 144A, 5.50%, 5/01/26 | United States | 100,000,000 | | 105,000,000 |
| g senior note, 144A, 5.125%, 5/01/23 | United States | 30,000,000 | | 31,387,500 |
| g Charter Communications Operating LLC/Capital, senior secured note, first | | | | |
| lien, 144A, 4.908%, 7/23/25 | United States | 30,000,000 | | 33,177,840 |
| Cinemark USA Inc., | | | | |
| senior bond, 4.875%, 6/01/23 | United States | 23,000,000 | | 23,230,000 |
| senior note, 5.125%, 12/15/22 | United States | 50,000,000 | | 51,500,000 |
| g CSC Holdings LLC, | | | | |
| senior bond, 144A, 10.875%, 10/15/25 | United States | 26,000,000 | | 30,485,000 |
| senior bond, 144A, 5.50%, 4/15/27 | United States | 48,300,000 | | 49,507,500 |
| senior note, 144A, 10.125%, 1/15/23 | United States | 75,000,000 | | 86,925,000 |
| DISH DBS Corp., | | | | |
| senior bond, 5.00%, 3/15/23 | United States | 300,000,000 | | 292,500,000 |
| g senior bond, 144A, 7.75%, 7/01/26 | United States | 75,000,000 | | 79,875,000 |
| senior note, 5.125%, 5/01/20 | United States | 60,000,000 | | 62,400,000 |
| senior note, 6.75%, 6/01/21 | United States | 95,000,000 | | 102,600,000 |
68 Annual Report
franklintempleton.com
FRANKLIN CUSTODIAN FUNDS
STATEMENT OF INVESTMENTS
| | | | |
| Franklin Income Fund (continued) | | | | |
| | | Principal | | |
| | Country | Amount* | | Value |
| |
| Corporate Bonds (continued) | | | | |
| Consumer Discretionary (continued) | | | | |
| DISH DBS Corp., (continued) | | | | |
| senior note, 5.875%, 7/15/22 | United States | 332,500,000 | $ | 343,306,250 |
| senior note, 5.875%, 11/15/24 | United States | 153,200,000 | | 151,859,500 |
| Dollar General Corp., senior bond, 3.25%, 4/15/23 | United States | 40,350,000 | | 41,729,809 |
| Fiat Chrysler Automobiles NV, senior note, 5.25%, 4/15/23 | United Kingdom | 67,600,000 | | 69,533,698 |
| iHeartCommunications Inc., | | | | |
| senior secured bond, first lien, 9.00%, 3/01/21 | United States | 319,775,000 | | 239,431,531 |
| senior secured note, first lien, 9.00%, 12/15/19 | United States | 265,800,000 | | 211,311,000 |
| g International Game Technology PLC, | | | | |
| senior secured bond, 144A, 6.50%, 2/15/25. | United States | 84,000,000 | | 90,930,000 |
| senior secured note, 144A, 6.25%, 2/15/22 | United States | 46,600,000 | | 49,862,000 |
| KB Home, | | | | |
| senior bond, 7.50%, 9/15/22 | United States | 50,000,000 | | 54,500,000 |
| senior note, 7.00%, 12/15/21 | United States | 70,000,000 | | 75,600,000 |
| MGM Resorts International, senior note, 7.75%, 3/15/22 | United States | 80,000,000 | | 93,000,000 |
| Outfront Media Capital LLC/Corp., senior bond, 5.875%, 3/15/25. | United States | 30,000,000 | | 31,612,500 |
| g PetSmart Inc., senior note, 144A, 7.125%, 3/15/23 | United States | 49,600,000 | | 52,204,000 |
| Quebecor Media Inc., senior bond, 5.75%, 1/15/23 | Canada | 70,300,000 | | 73,375,625 |
| Regal Entertainment Group, senior note, 5.75%, 3/15/22 | United States | 40,000,000 | | 41,300,000 |
| g Shea Homes LP/Shea Homes Funding Corp., | | | | |
| senior bond, 144A, 6.125%, 4/01/25 | United States | 90,000,000 | | 90,000,000 |
| senior note, 144A, 5.875%, 4/01/23 | United States | 80,000,000 | | 80,400,000 |
| g Sirius XM Radio Inc., | | | | |
| senior bond, 144A, 6.00%, 7/15/24 | United States | 115,000,000 | | 122,906,250 |
| senior note, 144A, 4.625%, 5/15/23 | United States | 88,400,000 | | 88,731,500 |
| g Univision Communications Inc., | | | | |
| senior secured note, first lien, 144A, 5.125%, 5/15/23 | United States | 135,500,000 | | 137,871,250 |
| senior secured note, first lien, 144A, 5.125%, 2/15/25 | United States | 74,020,000 | | 74,760,200 |
| g Virgin Media Secured Finance PLC, senior secured bond, first lien, 144A, | | | | |
| 5.50%, 1/15/25 | United Kingdom | 80,000,000 | | 82,100,000 |
| g Wynn Las Vegas LLC/Wynn Las Vegas Capital Corp., | | | | |
| senior bond, 144A, 4.25%, 5/30/23 | United States | 74,000,000 | | 71,317,500 |
| senior bond, 144A, 5.50%, 3/01/25 | United States | 100,000,000 | | 101,125,000 |
| g Wynn Macau Ltd., senior note, 144A, 5.25%, 10/15/21. | Macau | 47,000,000 | | 47,705,000 |
| g Ziggo Secured Finance BV, secured bond, 144A, 5.50%, 1/15/27 | Netherlands | 35,000,000 | | 34,987,050 |
| | | | | 4,228,229,378 |
| Consumer Staples 0.5% | | | | |
| Cott Beverages Inc., senior note, 5.375%, 7/01/22 | United States | 49,377,000 | | 51,043,474 |
| g ESAL GmbH, senior note, 144A, 6.25%, 2/05/23 | Brazil | 50,000,000 | | 48,834,750 |
| g JBS USA LLC/Finance Inc., | | | | |
| senior bond, 144A, 5.875%, 7/15/24 | United States | 101,180,000 | | 101,180,000 |
| senior note, 144A, 7.25%, 6/01/21 | United States | 108,500,000 | | 112,026,250 |
| senior note, 144A, 5.75%, 6/15/25 | United States | 55,000,000 | | 54,312,500 |
| g Post Holdings Inc., senior note, 144A, 7.75%, 3/15/24 | United States | 50,000,000 | | 56,250,000 |
| | | | | 423,646,974 |
| Energy 6.3% | | | | |
| Antero Resources Corp., senior note, 5.375%, 11/01/21 | United States | 50,000,000 | | 50,875,000 |
| Bill Barrett Corp., | | | | |
| senior note, 7.625%, 10/01/19 | United States | 162,476,000 | | 140,541,740 |
| senior note, 7.00%, 10/15/22 | United States | 182,500,000 | | 141,893,750 |
franklintempleton.com
Annual Report
69
FRANKLIN CUSTODIAN FUNDS
STATEMENT OF INVESTMENTS
| | | | | |
| Franklin Income Fund (continued) | | | | | |
| | | Principal | | | |
| | Country | Amount* | | | Value |
| |
| Corporate Bonds (continued) | | | | | |
| Energy (continued) | | | | | |
| Calumet Specialty Products Partners LP/Calumet Finance Corp., | | | | | |
| senior note, 6.50%, 4/15/21 | United States | 80,000,000 | | $ | 65,800,000 |
| g senior note, 144A, 11.50%, 1/15/21 | United States | 52,200,000 | | | 60,030,000 |
| g Cheniere Corpus Christi Holdings LLC, senior secured note, 144A, 7.00%, | | | | | |
| 6/30/24 | United States | 39,000,000 | | | 42,315,000 |
| Chesapeake Energy Corp., | | | | | |
| g secured note, second lien, 144A, 8.00%, 12/15/22 | United States | 665,000,000 | | | 674,975,000 |
| senior bond, 6.125%, 2/15/21 | United States | 47,000,000 | | | 43,005,000 |
| senior note, 7.25%, 12/15/18 | United States | 179,000,000 | | | 182,580,000 |
| senior note, 6.625%, 8/15/20 | United States | 41,500,000 | | | 39,113,750 |
| senior note, 6.875%, 11/15/20 | United States | 36,000,000 | | | 33,840,000 |
| j senior note, FRN, 3.93%, 4/15/19 | United States | 80,000,000 | | | 75,200,000 |
| g Denbury Resources Inc., senior secured note, 144A, 9.00%, 5/15/21. | United States | 129,067,000 | | | 135,843,017 |
| Energy Transfer Equity LP, | | | | | |
| senior secured bond, first lien, 5.875%, 1/15/24 | United States | 36,500,000 | | | 38,051,250 |
| senior secured bond, first lien, 5.50%, 6/01/27 | United States | 150,000,000 | | | 150,000,000 |
| g,h,k Energy XXI Gulf Coast Inc., senior secured note, second lien, 144A, | | | | | |
| 11.00%, 3/15/20 | United States | 377,300,000 | | | 152,806,500 |
| g,h EnQuest PLC, senior note, 144A, 7.00%, 4/15/22 | United Kingdom | 18,500,000 | | | 9,712,500 |
| Ferrellgas LP/Ferrellgas Finance Corp., | | | | | |
| senior note, 6.50%, 5/01/21 | United States | 78,795,000 | | | 72,491,400 |
| senior note, 6.75%, 1/15/22 | United States | 70,000,000 | | | 62,650,000 |
| senior note, 6.75%, 6/15/23 | United States | 52,900,000 | | | 46,816,500 |
| d,k Goodrich Petroleum Corp., second lien, 144A, 8.00%, 3/15/18 | United States | 70,000 | l | | 18,179,719 |
| b,g Halcon Resources Corp., secured note, second lien, 144A, 8.625%, | | | | | |
| 2/01/20 | United States | 190,000,000 | | | 191,425,000 |
| Kinder Morgan Inc., | | | | | |
| senior note, MTN, 7.75%, 1/15/32 | United States | 118,000,000 | | | 143,215,892 |
| g senior secured bond, first lien, 144A, 5.625%, 11/15/23 | United States | 120,000,000 | | | 132,757,440 |
| g,h,k Linn Energy LLC/Finance Corp., senior secured note, second lien, 144A, | | | | | |
| 12.00%, 12/15/20. | United States | 300,000,000 | | | 147,000,000 |
| g McDermott International Inc., second lien, 144A, 8.00%, 5/01/21 | United States | 145,270,000 | | | 138,188,087 |
| g NGPL PipeCo LLC, secured note, 144A, 7.119%, 12/15/17 | United States | 53,000,000 | | | 55,650,000 |
| b,g,m PetroQuest Energy Inc., second lien, secured note, 144A, PIK, 10.00%, | | | | | |
| 2/15/21 | United States | 58,725,000 | | | 38,719,780 |
| b Rex Energy Corp., second lien, 1.00% to 10/01/17, 8.00% thereafter, | | | | | |
| 10/01/20 | United States | 110,000,000 | | | 61,600,000 |
| g Rockies Express Pipeline LLC, | | | | | |
| senior bond, 144A, 5.625%, 4/15/20 | United States | 80,000,000 | | | 84,800,000 |
| senior note, 144A, 6.00%, 1/15/19 | United States | 29,400,000 | | | 31,017,000 |
| Sabine Pass Liquefaction LLC, | | | | | |
| first lien, 6.25%, 3/15/22 | United States | 75,000,000 | | | 82,500,000 |
| first lien, 5.625%, 4/15/23 | United States | 149,450,000 | | | 160,285,125 |
| g senior secured bond, 144A, 5.875%, 6/30/26 | United States | 70,000,000 | | | 76,343,750 |
| g senior secured bond, 144A, 5.00%, 3/15/27. | United States | 61,000,000 | | | 62,677,500 |
| senior secured note, first lien, 5.75%, 5/15/24 | United States | 75,000,000 | | | 81,093,750 |
| Sanchez Energy Corp., | | | | | |
| senior note, 7.75%, 6/15/21 | United States | 219,790,000 | | | 194,514,150 |
| senior note, 6.125%, 1/15/23 | United States | 110,000,000 | | | 88,825,000 |
70 Annual Report
franklintempleton.com
FRANKLIN CUSTODIAN FUNDS
STATEMENT OF INVESTMENTS
| | | | |
| Franklin Income Fund (continued) | | | | |
| | | Principal | | |
| | Country | Amount* | | Value |
| |
| Corporate Bonds (continued) | | | | |
| Energy (continued) | | | | |
| h Stone Energy Corp., senior bond, 7.50%, 11/15/22 | United States | 247,000,000 | $ | 142,025,000 |
| g Transocean Inc., senior note, 144A, 9.00%, 7/15/23 | United States | 65,000,000 | | 63,537,500 |
| b,g,m W&T Offshore Inc., | | | | |
| second lien, 144A, PIK, 9.00%, 5/15/20. | United States | 74,140,000 | | 42,339,709 |
| senior secured note, third lien, 144A, PIK, 8.50%, 6/15/21 | United States | 65,903,000 | | 25,211,581 |
| Weatherford International Ltd., | | | | |
| senior note, 5.125%, 9/15/20 | United States | 85,000,000 | | 78,625,000 |
| i senior note, 7.75%, 6/15/21 | United States | 239,600,000 | | 238,102,500 |
| i senior note, 4.50%, 4/15/22 | United States | 130,000,000 | | 110,500,000 |
| i senior note, 8.25%, 6/15/23 | United States | 212,100,000 | | 210,509,250 |
| The Williams Cos. Inc., senior bond, 3.70%, 1/15/23 | United States | 60,700,000 | | 59,182,500 |
| | | | | 4,977,365,640 |
| Financials 4.5% | | | | |
| n Bank of America Corp., | | | | |
| junior sub. bond, AA, 6.10% to 3/17/25, FRN thereafter, Perpetual | United States | 80,000,000 | | 83,400,000 |
| junior sub. bond, M, 8.125% to 5/15/18, FRN thereafter, Perpetual | United States | 100,000,000 | | 102,687,500 |
| junior sub. bond, U, 5.20% to 6/01/23, FRN thereafter, Perpetual | United States | 80,000,000 | | 78,000,000 |
| junior sub. bond, X, 6.25% to 9/05/24, FRN thereafter, Perpetual | United States | 85,000,000 | | 88,621,000 |
| n Barclays PLC, sub. bond, 8.25% to 12/15/18, FRN thereafter, Perpetual | United Kingdom | 75,000,000 | | 75,457,125 |
| CIT Group Inc., senior bond, 5.00%, 8/01/23. | United States | 60,000,000 | | 63,675,000 |
| n Citigroup Inc., | | | | |
| junior sub. bond, 5.35% to 5/15/23, FRN thereafter, Perpetual | United States | 179,195,000 | | 177,627,044 |
| junior sub. bond, 5.90% to 2/15/23, FRN thereafter, Perpetual | United States | 33,000,000 | | 34,237,500 |
| junior sub. bond, 5.95% to 1/30/23, FRN thereafter, Perpetual | United States | 230,000,000 | | 238,551,400 |
| junior sub. bond, M, 6.30% to 5/15/24, FRN thereafter, Perpetual | United States | 250,000,000 | | 256,562,500 |
| junior sub. bond, O, 5.875% to 3/27/20, FRN thereafter, Perpetual | United States | 160,000,000 | | 161,800,000 |
| junior sub. bond, P, 5.95% to 5/15/25, FRN thereafter, Perpetual. | United States | 25,000,000 | | 25,533,750 |
| junior sub. bond, Q, 5.95% to 8/15/20, FRN thereafter, Perpetual | United States | 120,000,000 | | 122,405,400 |
| sub. bond, T, 6.25% to 8/15/26, FRN thereafter, Perpetual | United States | 50,000,000 | | 53,921,850 |
| n Fifth Third Bancorp, junior sub. bond, 5.10% to 6/30/23, FRN thereafter, | | | | |
| Perpetual | United States | 54,000,000 | | 52,110,000 |
| n The Goldman Sachs Group Inc., junior sub. note, 5.70% to 5/10/19, FRN | | | | |
| thereafter, Perpetual | United States | 30,000,000 | | 30,450,000 |
| n HSBC Holdings PLC, junior sub. bond, 6.375% to 9/17/24, FRN thereafter, | | | | |
| Perpetual | United Kingdom | 40,000,000 | | 39,530,000 |
| n JPMorgan Chase & Co., | | | | |
| junior sub. bond, 6.125% to 4/30/24, FRN thereafter, Perpetual | United States | 60,000,000 | | 63,543,600 |
| junior sub. bond, 6.75% to 2/01/24, FRN thereafter, Perpetual | United States | 100,000,000 | | 111,625,000 |
| junior sub. bond, I, 7.90% to 4/30/19, FRN thereafter, Perpetual | United States | 750,000,000 | | 771,562,500 |
| junior sub. bond, Q, 5.15% to 5/01/23, FRN thereafter, Perpetual | United States | 100,000,000 | | 100,750,000 |
| junior sub. bond, R, 6.00% to 8/01/23, FRN thereafter, Perpetual | United States | 105,000,000 | | 109,856,250 |
| junior sub. bond, V, 5.00% to 7/30/19, FRN thereafter, Perpetual | United States | 200,000,000 | | 197,750,000 |
| junior sub. bond, X, 6.10% to 10/01/24, FRN thereafter, Perpetual | United States | 80,000,000 | | 84,600,000 |
| n Morgan Stanley, junior sub. bond, 5.55% to 7/15/20, FRN thereafter, | | | | |
| Perpetual | United States | 58,000,000 | | 59,305,000 |
| Navient Corp., senior note, 6.125%, 3/25/24 | United States | 55,000,000 | | 51,493,750 |
| g OneMain Financial Holdings Inc., | | | | |
| senior note, 144A, 6.75%, 12/15/19 | United States | 75,000,000 | | 79,293,750 |
| senior note, 144A, 7.25%, 12/15/21 | United States | 55,700,000 | | 58,902,750 |
franklintempleton.com
Annual Report
71
FRANKLIN CUSTODIAN FUNDS
STATEMENT OF INVESTMENTS
| | | | |
| Franklin Income Fund (continued) | | | | |
| | | Principal | | |
| | Country | Amount* | | Value |
| |
| Corporate Bonds (continued) | | | | |
| Financials (continued) | | | | |
| n PNC Financial Services Group Inc., junior sub. note, 4.85% to 6/01/23, | | | | |
| FRN thereafter, Perpetual | United States | 54,000,000 | $ | 53,994,600 |
| n Wells Fargo & Co., junior sub. bond, S, 5.90% to 6/15/24, FRN thereafter, | | | | |
| Perpetual | United States | 129,500,000 | | 134,356,250 |
| | | | | 3,561,603,519 |
| Health Care 6.2% | | | | |
| g AMAG Pharmaceuticals Inc., senior note, 144A, 7.875%, 9/01/23 | United States | 48,100,000 | | 46,176,000 |
| CHS/Community Health Systems Inc., | | | | |
| senior note, 8.00%, 11/15/19 | United States | 750,000,000 | | 738,750,000 |
| senior note, 7.125%, 7/15/20 | United States | 331,037,000 | | 309,354,076 |
| senior note, 6.875%, 2/01/22 | United States | 365,000,000 | | 315,725,000 |
| g Concordia International Corp., | | | | |
| senior note, 144A, 9.50%, 10/21/22 | Canada | 125,000,000 | | 87,187,500 |
| senior note, 144A, 7.00%, 4/15/23 | Canada | 50,000,000 | | 32,250,000 |
| DaVita Inc., senior bond, 5.125%, 7/15/24 | United States | 81,000,000 | | 82,771,875 |
| g Endo Finance LLC, senior note, 144A, 5.75%, 1/15/22 | United States | 108,000,000 | | 100,710,000 |
| g Endo Finance LLC/Endo Ltd./Endo Finco Inc., | | | | |
| senior bond, 144A, 6.00%, 2/01/25 | United States | 98,700,000 | | 87,719,625 |
| senior note, 144A, 6.00%, 7/15/23 | United States | 123,025,000 | | 112,567,875 |
| HCA Inc., | | | | |
| senior bond, 5.875%, 5/01/23 | United States | 120,000,000 | | 128,100,000 |
| senior note, 7.50%, 2/15/22 | United States | 150,000,000 | | 172,500,000 |
| senior secured bond, first lien, 5.25%, 4/15/25 | United States | 20,000,000 | | 21,375,000 |
| senior secured note, first lien, 5.00%, 3/15/24 | United States | 134,800,000 | | 143,225,000 |
| Horizon Pharma Inc., senior note, 6.625%, 5/01/23 | United States | 60,012,000 | | 56,411,280 |
| g Jaguar Holding Co. II/Pharmaceutical Product Development LLC, senior | | | | |
| note, 144A, 6.375%, 8/01/23 | United States | 81,765,000 | | 85,240,013 |
| Kindred Healthcare Inc., | | | | |
| senior note, 8.00%, 1/15/20 | United States | 33,845,000 | | 34,606,513 |
| senior note, 8.75%, 1/15/23 | United States | 50,000,000 | | 50,187,500 |
| Mallinckrodt International Finance SA, senior bond, 4.75%, 4/15/23 | United States | 37,500,000 | | 33,937,500 |
| g Mallinckrodt International Finance SA/Mallinckrodt CB LLC, | | | | |
| senior note, 144A, 4.875%, 4/15/20 | United States | 96,600,000 | | 99,015,000 |
| senior note, 144A, 5.75%, 8/01/22 | United States | 190,000,000 | | 188,337,500 |
| senior note, 144A, 5.625%, 10/15/23 | United States | 115,050,000 | | 110,735,625 |
| senior note, 144A, 5.50%, 4/15/25 | United States | 100,000,000 | | 95,500,000 |
| Tenet Healthcare Corp., | | | | |
| 4.375%, 10/01/21 | United States | 140,000,000 | | 140,000,000 |
| senior note, 5.00%, 3/01/19 | United States | 72,000,000 | | 71,100,000 |
| senior note, 8.00%, 8/01/20 | United States | 128,703,000 | | 130,311,787 |
| senior note, 8.125%, 4/01/22 | United States | 465,000,000 | | 467,325,000 |
| senior note, 6.75%, 6/15/23 | United States | 324,700,000 | | 302,782,750 |
| g Valeant Pharmaceuticals International, senior note, 144A, 6.375%, | | | | |
| 10/15/20 | United States | 145,000,000 | | 136,662,500 |
| g Valeant Pharmaceuticals International Inc., | | | | |
| senior bond, 144A, 6.125%, 4/15/25 | United States | 82,400,000 | | 71,173,000 |
| senior note, 144A, 6.75%, 8/15/18 | United States | 163,000,000 | | 164,630,000 |
| senior note, 144A, 5.375%, 3/15/20 | United States | 210,000,000 | | 195,300,000 |
| senior note, 144A, 5.875%, 5/15/23 | United States | 83,500,000 | | 72,597,405 |
| g Vizient Inc., senior note, 144A, 10.375%, 3/01/24 | United States | 45,000,000 | | 51,750,000 |
| | | | | 4,936,015,324 |
72 Annual Report
franklintempleton.com
FRANKLIN CUSTODIAN FUNDS
STATEMENT OF INVESTMENTS
| | | | |
| Franklin Income Fund (continued) | | | | |
| | | Principal | | |
| | Country | Amount* | | Value |
| |
| Corporate Bonds (continued) | | | | |
| Industrials 2.4% | | | | |
| The ADT Corp., senior note, 3.50%, 7/15/22 | United States | 68,000,000 | $ | 65,790,000 |
| g Ahern Rentals Inc., secured note, second lien, 144A, 7.375%, 5/15/23. | United States | 50,000,000 | | 32,625,000 |
| g Bombardier Inc., | | | | |
| 144A, 5.50%, 9/15/18 | Canada | 27,000,000 | | 27,540,000 |
| senior bond, 144A, 6.125%, 1/15/23 | Canada | 81,300,000 | | 72,560,250 |
| senior bond, 144A, 7.50%, 3/15/25 | Canada | 50,100,000 | | 46,342,500 |
| senior note, 144A, 6.00%, 10/15/22 | Canada | 35,000,000 | | 31,587,500 |
| g CEVA Group PLC, senior note, first lien, 144A, 4.00%, 5/01/18 | United Kingdom | 164,778,982 | | 146,653,294 |
| g Cloud Crane LLC, secured note, second lien, 144A, 10.125%, 8/01/24. | United States | 29,500,000 | | 30,680,000 |
| g,o Cortes NP Acquisition Corp., senior note, 144A, 9.25%, 10/15/24 | United States | 77,700,000 | | 77,700,000 |
| n General Electric Co., junior sub. bond, 5.00% to 1/21/21, FRN thereafter, | | | | |
| Perpetual | United States | 90,153,000 | | 95,981,392 |
| Hertz Corp., | | | | |
| senior note, 6.75%, 4/15/19 | United States | 155,000,000 | | 158,602,200 |
| senior note, 6.25%, 10/15/22 | United States | 20,000,000 | | 20,700,000 |
| Navistar International Corp., senior bond, 8.25%, 11/01/21 | United States | 90,000,000 | | 89,550,000 |
| g Prime Security Services Borrower LLC/Prime Finance Inc., secured note, | | | | |
| second lien, 144A, 9.25%, 5/15/23 | United States | 60,000,000 | | 65,550,000 |
| g Stena International SA, senior secured bond, first lien, 144A, 5.75%, | | | | |
| 3/01/24 | Sweden | 46,670,000 | | 39,056,956 |
| TransDigm Inc., | | | | |
| senior sub. bond, 6.50%, 7/15/24 | United States | 100,000,000 | | 105,750,000 |
| g senior sub. bond, 144A, 6.375%, 6/15/26 | United States | 30,800,000 | | 32,109,000 |
| senior sub. note, 6.00%, 7/15/22 | United States | 94,800,000 | | 100,488,000 |
| United Rentals North America Inc., | | | | |
| senior bond, 6.125%, 6/15/23 | United States | 120,000,000 | | 126,600,000 |
| senior bond, 5.75%, 11/15/24 | United States | 121,700,000 | | 126,872,250 |
| senior bond, 5.875%, 9/15/26 | United States | 20,700,000 | | 21,424,500 |
| g XPO Logistics Inc., senior note, 144A, 6.50%, 6/15/22 | United States | 340,000,000 | | 356,575,000 |
| | | | | 1,870,737,842 |
| Information Technology 2.5% | | | | |
| g Belden Inc., senior sub. note, 144A, 5.50%, 9/01/22. | United States | 40,000,000 | | 41,900,000 |
| g BMC Software Finance Inc., senior note, 144A, 8.125%, 7/15/21. | United States | 130,805,000 | | 119,359,562 |
| g,m Boxer Parent Co. Inc., senior note, 144A, PIK, 9.00%, 10/15/19 | United States | 55,000,000 | | 50,050,000 |
| g CommScope Inc., | | | | |
| senior bond, 144A, 5.50%, 6/15/24 | United States | 100,000,000 | | 105,875,000 |
| senior note, 144A, 5.00%, 6/15/21 | United States | 50,000,000 | | 51,937,500 |
| g CommScope Technologies Finance LLC, senior bond, 144A, 6.00%, | | | | |
| 6/15/25 | United States | 84,200,000 | | 90,199,250 |
| g Diamond 1 Finance Corp./Diamond 2 Finance Corp., | | | | |
| senior note, 144A, 5.875%, 6/15/21 | United States | 27,000,000 | | 28,699,056 |
| senior note, 144A, 7.125%, 6/15/24 | United States | 27,100,000 | | 29,823,035 |
| senior secured bond, first lien, 144A, 5.45%, 6/15/23 | United States | 69,750,000 | | 74,807,015 |
| senior secured bond, first lien, 144A, 6.02%, 6/15/26 | United States | 53,750,000 | | 59,067,058 |
| senior secured note, first lien, 144A, 4.42%, 6/15/21 | United States | 41,400,000 | | 43,315,992 |
| g First Data Corp., | | | | |
| second lien, 144A, 5.75%, 1/15/24 | United States | 70,000,000 | | 72,187,500 |
| secured note, first lien, 144A, 5.00%, 1/15/24 | United States | 50,000,000 | | 50,937,500 |
| senior note, 144A, 7.00%, 12/01/23 | United States | 315,000,000 | | 333,900,000 |
| senior secured note, first lien, 144A, 5.375%, 8/15/23 | United States | 75,000,000 | | 77,437,500 |
| Infor (U.S.) Inc., senior note, 6.50%, 5/15/22 | United States | 52,500,000 | | 53,418,750 |
franklintempleton.com
Annual Report
73
FRANKLIN CUSTODIAN FUNDS
STATEMENT OF INVESTMENTS
| | | | |
| Franklin Income Fund (continued) | | | | |
| | | Principal | | |
| | Country | Amount* | | Value |
| |
| Corporate Bonds (continued) | | | | |
| Information Technology (continued) | | | | |
| g,m Infor Software Parent LLC/Inc., senior note, 144A, PIK, 7.125%, 5/01/21 | United States | 24,650,000 | $ | 24,033,750 |
| g Inmarsat Finance PLC, senior note, 144A, 4.875%, 5/15/22 | United Kingdom | 39,000,000 | | 37,245,000 |
| g Micron Technology Inc., senior secured note, 144A, 7.50%, 9/15/23 | United States | 35,000,000 | | 38,963,400 |
| g Microsemi Corp., senior note, 144A, 9.125%, 4/15/23 | United States | 60,600,000 | | 69,387,000 |
| NCR Corp., | | | | |
| senior note, 5.00%, 7/15/22 | United States | 60,000,000 | | 61,650,000 |
| senior note, 6.375%, 12/15/23 | United States | 45,000,000 | | 47,812,500 |
| Qorvo Inc., senior note, 6.75%, 12/01/23 | United States | 50,000,000 | | 54,125,000 |
| g Western Digital Corp., | | | | |
| senior note, 144A, 10.50%, 4/01/24 | United States | 250,000,000 | | 290,937,500 |
| senior secured note, 144A, 7.375%, 4/01/23 | United States | 100,000,000 | | 110,000,000 |
| | | | | 2,017,068,868 |
| Materials 2.3% | | | | |
| g Ardagh Packaging Finance PLC/Ardagh MP Holdings USA Inc., | | | | |
| senior note, 144A, 6.25%, 1/31/19 | Luxembourg | 37,300,000 | | 38,279,125 |
| senior note, 144A, 6.00%, 6/30/21 | Luxembourg | 45,000,000 | | 46,687,500 |
| senior note, 144A, 4.625%, 5/15/23 | Luxembourg | 44,900,000 | | 45,405,125 |
| senior note, 144A, 7.25%, 5/15/24 | Luxembourg | 76,500,000 | | 82,046,250 |
| Ball Corp., senior bond, 4.00%, 11/15/23 | United States | 100,000,000 | | 101,125,000 |
| g BWAY Holding Co., senior note, 144A, 9.125%, 8/15/21 | United States | 55,000,000 | | 57,750,000 |
| g Cemex Finance LLC, senior secured note, first lien, 144A, 6.00%, 4/01/24 . | Mexico | 88,400,000 | | 90,430,990 |
| g Cemex SAB de CV, | | | | |
| first lien, 144A, 5.70%, 1/11/25. | Mexico | 80,000,000 | | 80,918,000 |
| secured note, 144A, 7.25%, 1/15/21 | Mexico | 111,000,000 | | 119,039,730 |
| senior secured bond, 144A, 7.75%, 4/16/26. | Mexico | 75,100,000 | | 83,237,836 |
| The Chemours Co., senior note, 6.625%, 5/15/23 | United States | 74,900,000 | | 73,589,250 |
| Crown Americas LLC/Crown Americas Capital Corp. IV, senior bond, | | | | |
| 4.50%, 1/15/23 | United States | 115,000,000 | | 120,318,750 |
| g First Quantum Minerals Ltd., | | | | |
| senior note, 144A, 6.75%, 2/15/20 | Canada | 50,000,000 | | 46,500,000 |
| senior note, 144A, 7.00%, 2/15/21 | Canada | 10,000,000 | | 9,075,000 |
| g FMG Resources (August 2006) Pty. Ltd., senior secured note, 144A, | | | | |
| 9.75%, 3/01/22 | Australia | 500,000,000 | | 580,155,000 |
| HudBay Minerals Inc., senior note, 9.50%, 10/01/20 | Canada | 24,100,000 | | 24,286,775 |
| g Owens-Brockway Glass Container Inc., senior note, 144A, 5.875%, | | | | |
| 8/15/23 | United States | 27,500,000 | | 29,579,687 |
| g Platform Specialty Products Corp., senior note, 144A, 6.50%, 2/01/22 | United States | 45,000,000 | | 43,987,500 |
| Reynolds Group Issuer Inc./Reynolds Group Issuer LLC/Reynolds Group | | | | |
| Issuer Luxembourg SA, | | | | |
| g first lien, 144A, 5.125%, 7/15/23 | United States | 31,800,000 | | 32,873,250 |
| senior note, 9.875%, 8/15/19 | United States | 27,311,000 | | 28,164,469 |
| g senior note, 144A, 7.00%, 7/15/24 | United States | 14,800,000 | | 15,900,750 |
| senior secured note, first lien, 6.875%, 2/15/21 | United States | 25,600,000 | | 26,560,051 |
| g,j senior secured note, first lien, 144A, FRN, 4.127%, 7/15/21. | United States | 30,400,000 | | 30,932,000 |
| g Sealed Air Corp., senior bond, 144A, 5.25%, 4/01/23 | United States | 48,000,000 | | 51,360,000 |
| | | | | 1,858,202,038 |
| Real Estate 0.4% | | | | |
| g,o Crescent Communities LLC, secured note, 144A, 8.875%, 10/15/21 | United States | 35,000,000 | | 35,612,500 |
| Equinix Inc., senior bond, 5.875%, 1/15/26 | United States | 26,500,000 | | 28,553,750 |
| Iron Mountain Inc., senior sub. bond, 5.75%, 8/15/24 | United States | 100,000,000 | | 103,250,000 |
74 Annual Report
franklintempleton.com
FRANKLIN CUSTODIAN FUNDS
STATEMENT OF INVESTMENTS
| | | | |
| Franklin Income Fund (continued) | | | | |
| | | Principal | | |
| | Country | Amount* | | Value |
| |
| Corporate Bonds (continued) | | | | |
| Real Estate (continued) | | | | |
| iStar Inc., senior note, 5.00%, 7/01/19 | United States | 115,000,000 | $ | 115,129,950 |
| | | | | 282,546,200 |
| Telecommunication Services 3.8% | | | | |
| CenturyLink Inc., | | | | |
| senior note, 5.80%, 3/15/22 | United States | 73,000,000 | | 75,098,750 |
| senior note, 7.50%, 4/01/24 | United States | 41,600,000 | | 44,512,000 |
| Consolidated Communications Inc., senior note, 6.50%, 10/01/22 | United States | 100,000,000 | | 97,500,000 |
| g Digicel Ltd., senior note, 144A, 6.75%, 3/01/23 | Bermuda | 73,300,000 | | 64,964,690 |
| Frontier Communications Corp., | | | | |
| senior bond, 8.75%, 4/15/22 | United States | 43,900,000 | | 44,997,500 |
| senior note, 9.25%, 7/01/21 | United States | 63,600,000 | | 68,767,500 |
| senior note, 10.50%, 9/15/22 | United States | 20,000,000 | | 21,275,000 |
| senior note, 7.125%, 1/15/23 | United States | 115,850,000 | | 108,609,375 |
| senior note, 11.00%, 9/15/25 | United States | 50,000,000 | | 52,312,500 |
| Intelsat Jackson Holdings SA, senior bond, 5.50%, 8/01/23 | Luxembourg | 165,000,000 | | 115,087,500 |
| g SFR Group SA, secured bond, 144A, 7.375%, 5/01/26. | France | 50,000,000 | | 51,002,000 |
| Sprint Capital Corp., | | | | |
| senior bond, 6.875%, 11/15/28. | United States | 126,000,000 | | 119,227,500 |
| senior note, 6.90%, 5/01/19 | United States | 220,000,000 | | 228,800,000 |
| Sprint Communications Inc., | | | | |
| 11.50%, 11/15/21 | United States | 200,000,000 | | 231,000,000 |
| senior note, 8.375%, 8/15/17 | United States | 135,000,000 | | 140,568,750 |
| senior note, 7.00%, 8/15/20 | United States | 102,500,000 | | 103,525,000 |
| senior note, 6.00%, 11/15/22 | United States | 185,000,000 | | 174,131,250 |
| g senior note, 144A, 9.00%, 11/15/18 | United States | 70,000,000 | | 77,437,500 |
| Sprint Corp., | | | | |
| senior bond, 7.875%, 9/15/23 | United States | 187,350,000 | | 190,160,250 |
| senior bond, 7.125%, 6/15/24 | United States | 240,650,000 | | 235,837,000 |
| senior note, 7.625%, 2/15/25 | United States | 100,000,000 | | 99,500,000 |
| g Telecom Italia SpA, senior note, 144A, 5.303%, 5/30/24 | Italy | 55,000,000 | | 56,266,100 |
| T-Mobile USA Inc., | | | | |
| senior bond, 6.625%, 4/01/23 | United States | 50,000,000 | | 53,875,000 |
| senior note, 6.633%, 4/28/21 | United States | 100,000,000 | | 105,625,000 |
| senior note, 6.00%, 3/01/23 | United States | 30,000,000 | | 32,161,800 |
| senior note, 6.00%, 4/15/24 | United States | 42,250,000 | | 45,313,125 |
| g Wind Acquisition Finance SA, secured note, second lien, 144A, 7.375%, | | | | |
| 4/23/21 | Italy | 270,000,000 | | 282,752,100 |
| Zayo Group LLC/Zayo Capital Inc., | | | | |
| senior note, 6.00%, 4/01/23 | United States | 80,000,000 | | 84,200,000 |
| senior note, 6.375%, 5/15/25 | United States | 50,000,000 | | 53,437,500 |
| | | | | 3,057,944,690 |
| Utilities 2.4% | | | | |
| The AES Corp., | | | | |
| senior bond, 4.875%, 5/15/23 | United States | 110,000,000 | | 112,887,500 |
| senior bond, 5.50%, 3/15/24 | United States | 50,000,000 | | 52,000,000 |
| Calpine Corp., | | | | |
| senior bond, 5.75%, 1/15/25 | United States | 285,000,000 | | 282,150,000 |
| senior note, 5.375%, 1/15/23 | United States | 260,000,000 | | 260,325,000 |
| senior note, 5.50%, 2/01/24 | United States | 100,000,000 | | 99,250,000 |
| g senior secured bond, 144A, 5.25%, 6/01/26. | United States | 60,000,000 | | 60,900,000 |
franklintempleton.com
Annual Report
75
FRANKLIN CUSTODIAN FUNDS
STATEMENT OF INVESTMENTS
| | | | | |
| Franklin Income Fund (continued) | | | | | |
| | | Principal | | | |
| | Country | Amount* | | | Value |
| |
| Corporate Bonds (continued) | | | | | |
| Utilities (continued) | | | | | |
| Dynegy Inc., | | | | | |
| senior note, 6.75%, 11/01/19 | United States | 455,000,000 | | $ | 468,650,000 |
| senior note, 7.375%, 11/01/22 | United States | 270,000,000 | | | 267,975,000 |
| senior note, 5.875%, 6/01/23 | United States | 130,000,000 | | | 118,625,000 |
| g InterGen NV, | | | | | |
| secured bond, 144A, 7.00%, 6/30/23 | Netherlands | 143,700,000 | | | 122,145,000 |
| secured note, 144A, 7.50%, 6/30/21 | Netherlands | 35,800,000 | GBP | | 39,924,337 |
| NGL Energy Partners LP/NGL Energy Finance Corp., senior note, | | | | | |
| 6.875%, 10/15/21. | United States | 30,000,000 | | | 28,575,000 |
| | | | | | 1,913,406,837 |
| Total Corporate Bonds (Cost $28,587,419,022) | | | | | 29,126,767,310 |
| |
| j,p Senior Floating Rate Interests 3.9% | | | | | |
| Consumer Discretionary 1.5% | | | | | |
| 24 Hour Fitness Worldwide Inc., Term Loan, 4.75%, 5/28/21 | United States | 34,299,555 | | | 33,119,650 |
| Academy Ltd., Initial Term Loan, 5.00%, 7/02/22 | United States | 93,270,548 | | | 91,405,137 |
| Belk Inc., Closing Date Term Loan, 5.75%, 12/12/22 | United States | 248,750,000 | | | 227,095,317 |
| iHeartCommunications Inc., | | | | | |
| Tranche D Term Loan, 7.274%, 1/30/19 | United States | 687,373,595 | | | 529,420,642 |
| Tranche E Term Loan, 8.024%, 7/30/19. | United States | 200,744,256 | | | 154,447,612 |
| Neiman Marcus Group Ltd. Inc., Term Loan, 4.25%, 10/25/20 | United States | 71,450,381 | | | 66,231,932 |
| Petco Animal Supplies Stores Inc., Term Loan B-1, 5.00%, 1/26/23 | United States | 74,625,000 | | | 75,412,741 |
| | | | | | 1,177,133,031 |
| Energy 0.4% | | | | | |
| Callon Petroleum Co., Second Lien Term Loan, 8.50%, 10/08/21. | United States | 54,500,000 | | | 55,340,227 |
| Chesapeake Energy Corp., Class A Loans, 8.50%, 8/23/21 | United States | 80,000,000 | | | 84,040,000 |
| McDermott Finance LLC, Term Loan, 8.25%, 4/16/19. | United States | 9,416,212 | | | 9,478,010 |
| b W&T Offshore Inc., | | | | | |
| Second Lien Term Loan, 9.00%, 5/15/20 | United States | 151,850,000 | | | 96,424,750 |
| senior secured, 1.5 lien Term Loan, 11.00%, 11/15/19 | United States | 75,000,000 | | | 75,398,250 |
| | | | | | 320,681,237 |
| Financials 0.3% | | | | | |
| First Eagle Investment Management, Initial Term Loans, 4.838%, | | | | | |
| 12/01/22 | United States | 163,799,812 | | | 163,595,062 |
| Russell Investments US Institutional Holdco Inc., Initial Term Loan, 6.75%, | | | | | |
| 6/01/23 | United States | 49,875,000 | | | 49,594,453 |
| | | | | | 213,189,515 |
| Health Care 0.5% | | | | | |
| Arbor Pharmaceuticals LLC, Initial Term Loan, 6.00%, 7/05/23 | United States | 50,000,000 | | | 50,250,000 |
| Concordia International Corp., Initial Dollar Term Loan, 5.25%, 10/21/21 | United States | 44,662,500 | | | 40,126,487 |
| Lannett Co. Inc., Initial Tranche B Term Loans, 6.375%, 11/25/22 | United States | 62,562,500 | | | 61,832,583 |
| MPH Acquisition Holdings LLC, Initial Term Loan, 5.00%, 6/07/23 | United States | 57,406,340 | | | 58,195,677 |
| US Renal Care Inc., Initial Term Loan, 5.25%, 12/31/22 | United States | 59,550,000 | | | 57,421,088 |
| Vizient Inc., Initial Term Loan, 6.25%, 2/10/23 | United States | 175,970,588 | | | 178,170,221 |
| | | | | | 445,996,056 |
| Industrials 0.5% | | | | | |
| CEVA Group PLC, Pre-Funded L/C, 6.50%, 3/19/21 | United States | 20,320,197 | | | 16,351,419 |
| CEVA Intercompany BV, Dutch BV Term Loan, 6.50%, 3/19/21 | Netherlands | 20,892,857 | | | 16,812,231 |
| CEVA Logistics Canada ULC, Canadian Term Loan, 6.50%, 3/19/21 | Canada | 3,592,981 | | | 2,891,228 |
76 Annual Report
franklintempleton.com
FRANKLIN CUSTODIAN FUNDS
STATEMENT OF INVESTMENTS
| | | | |
| Franklin Income Fund (continued) | | | | |
| | | Principal | | |
| | Country | Amount* | | Value |
| |
| j,p Senior Floating Rate Interests (continued) | | | | |
| Industrials (continued) | | | | |
| CEVA Logistics U.S. Holdings Inc., U.S. Term Loan, 6.50%, 3/19/21. | United States | 28,817,734 | $ | 23,189,285 |
| Commercial Barge Line Co., Initial Term Loan, 9.75%, 11/12/20 | United States | 134,750,000 | | 131,549,688 |
| q Cortes NP Acquisition Corp., Term Loan B, 7.50%, 9/30/23 | United States | 152,000,000 | | 152,000,000 |
| Navistar Inc., Tranche B Term Loans, 6.50%, 8/07/20. | United States | 36,316,346 | | 36,435,282 |
| | | | | 379,229,133 |
| Information Technology 0.3% | | | | |
| BMC Software Finance Inc., Initial U.S. Term Loans, 5.00%, 9/10/20 | United States | 87,676,060 | | 84,729,180 |
| Micron Technology Inc., Term Loan, 6.53%, 4/26/22 | United States | 39,900,000 | | 40,412,994 |
| Uber Technologies Inc., Term Loan, 5.00%, 7/13/23. | United States | 55,000,000 | | 55,108,845 |
| Western Digital Corp., Term Loan B-1, 4.50%, 4/29/23 | United States | 79,800,000 | | 80,772,602 |
| | | | | 261,023,621 |
| Materials 0.2% | | | | |
| q Avantor Performance Materials Holdings Inc., Initial Term Loan, 7.50%, | | | | |
| 6/21/22 | United States | 47,784,431 | | 48,023,354 |
| FMG America Finance Inc. (Fortescue Metals Group), Loans, 3.75%, | | | | |
| 6/30/19 | Australia | 126,000,328 | | 126,019,984 |
| | | | | 174,043,338 |
| Utilities 0.2% | | | | |
| Dynegy Finance IV Inc., Term Loans, 5.00%, 6/27/23. | United States | 50,000,000 | | 50,385,400 |
| Intergen NV, Term Advance, 5.50%, 6/13/20 | Netherlands | 43,525,376 | | 41,240,294 |
| Texas Competitive Electric Holdings Co. LLC, | | | | |
| Term C Loan, 5.00%, 10/31/17. | United States | 9,285,714 | | 9,355,357 |
| Term Loans, 5.00%, 10/31/17 | United States | 40,714,286 | | 41,019,643 |
| | | | | 142,000,694 |
| Total Senior Floating Rate Interests | | | | |
| (Cost $3,263,942,772) | | | | 3,113,296,625 |
| |
| |
| | | Shares | | |
| |
| Escrows and Litigation Trusts 0.0% | | | | |
| a,d Motors Liquidation Co., Escrow Account. | United States | 400,000,000 | | — |
| a,d Motors Liquidation Co., Escrow Account, cvt. pfd., C | United States | 11,000,000 | | — |
| Total Escrows and Litigation Trusts | | | | |
| (Cost $2,416,248) | | | | — |
| |
| |
| | | Number of | | |
| | | Contracts | | |
| |
| Options Purchased 0.1% | | | | |
| Puts - Exchange-Traded | | | | |
| Financials 0.1% | | | | |
| S&P 500 Index, November Strike Price $2,150, Expires 11/18/16 | | 7,500 | | 27,075,000 |
| S&P 500 Index, October Strike Price $2,150, Expires 10/21/16 | | 7,500 | | 13,575,000 |
| Total Options Purchased | | | | |
| (Cost $78,989,000) | | | | 40,650,000 |
| Total Investments before Short Term Investments | | | | |
| (Cost $76,269,493,440) | | | | 78,308,173,069 |
franklintempleton.com
Annual Report
77
FRANKLIN CUSTODIAN FUNDS
STATEMENT OF INVESTMENTS
| | | | | |
| Franklin Income Fund (continued) | | | | | |
| | Country | Shares | | Value | |
| Short Term Investments 1.4% | | | | | |
| Money Market Funds (Cost $1,016,454,640) 1.3% | | | | | |
| a,r Institutional Fiduciary Trust Money Market Portfolio | United States | 1,016,454,640 | $ | 1,016,454,640 | |
| s Investments from Cash Collateral Received for Loaned | | | | | |
| Securities 0.1% | | | | | |
| Money Market Funds 0.1% | | | | | |
| a,r Institutional Fiduciary Trust Money Market Portfolio | United States | 70,907,000 | | 70,907,000 | |
| |
| |
| | | Principal | | | |
| | | Amount* | | Value | |
| Repurchase Agreement 0.0%† | | | | | |
| t Joint Repurchase Agreement, 0.46%, 10/03/16 | | | | | |
| (Maturity Value $10,080,099) | | | | | |
| BNP Paribas Securities Corp. | | | | | |
| Collateralized by uU.S. Treasury Bill, 11/17/16 - 9/09/49; U.S. Treasury | | | | | |
| Bond, 8.75%, 5/15/17 - 5/15/20; U.S. Treasury Note, 0.625% - | | | | | |
| 3.50%, 1/31/17 - 9/09/49; U.S. Treasury Strips, 11/15/17 - 8/15/21 | | | | | |
| (valued at $10,281,307) | United States | 10,079,713 | | 10,079,713 | |
| Total Investments from Cash Collateral Received for | | | | | |
| Loaned Securities (Cost $80,986,713) | | | | 80,986,713 | |
| Total Investments (Cost $77,366,934,793) 99.7% | | | | 79,405,614,422 | |
| Options Written (0.0)%† | | | | (1,735,000 | ) |
| Other Assets, less Liabilities 0.3%. | | | | 229,877,036 | |
| Net Assets 100.0% | | | $ | 79,633,756,458 | |
| |
| |
| | | Number of | | | |
| | | Contracts | | | |
| v Options Written (0.0)%† | | | | | |
| Calls - Exchange-Traded | | | | | |
| Information Technology (0.0)%† | | | | | |
| Cisco Systems Inc., October Strike Price $32, Expires 10/21/16 | | 20,000 | | (400,000 | ) |
| Microsoft Corp., October Strike Price $60, Expires 10/21/16 | | 10,000 | | (460,000 | ) |
| Puts - Exchange-Traded | | | | | |
| Financials (0.0)%† | | | | | |
| S&P 500 Index, October Strike Price $2,000, Expires 10/21/16 | | 5,000 | | (875,000 | ) |
| Total Options Written (Premiums received $10,304,692) . | | | $ | (1,735,000 | ) |
78 Annual Report
franklintempleton.com
FRANKLIN CUSTODIAN FUNDS
STATEMENT OF INVESTMENTS
Franklin Income Fund (continued)
See Abbreviations on page 126.
†Rounds to less than 0.1% of net assets.
*The principal amount is stated in U.S. dollars unless otherwise indicated.
aNon-income producing.
bSee Note 11 regarding holdings of 5% voting securities.
cSee Note 8 regarding restricted securities.
dSecurity has been deemed illiquid because it may not be able to be sold within seven days. At September 30, 2016, the aggregate value of these securities was
$90,305,993, representing 0.1% of net assets.
eA portion or all of the security is held in connection with written option contracts open at year end.
fSee Note 1(f) regarding equity-linked securities.
gSecurity was purchased pursuant to Rule 144A under the Securities Act of 1933 and may be sold in transactions exempt from registration only to qualified institutional buyers
or in a public offering registered under the Securities Act of 1933. These securities have been deemed liquid under guidelines approved by the Trust’s Board of Trustees. At
September 30, 2016, the aggregate value of these securities was $21,649,826,287, representing 27.2% of net assets.
hAt September 30, 2016, pursuant to the Fund’s policies and the requirements of applicable securities law, the Fund is restricted from trading these securities at year end.
iA portion or all of the security is on loan at September 30, 2016. See Note 1(g).
jThe coupon rate shown represents the rate at period end.
kSee Note 7 regarding defaulted securities.
lPrincipal amount is stated in 1,000 Units.
mIncome may be received in additional securities and/or cash.
nPerpetual security with no stated maturity date.
oA portion or all of the security purchased on a when-issued basis. See Note 1(d).
pSee Note 1(i) regarding senior floating rate interests.
qA portion or all of the security purchased on a delayed delivery basis. See Note 1(d).
rSee Note 3(f) regarding investments in affiliated management investment companies.
sSee Note 1(g) regarding securities on loan.
tSee Note 1(c) regarding joint repurchase agreement.
uThe security was issued on a discount basis with no stated coupon rate.
vSee Note 1(e) regarding written options.
franklintempleton.com
The accompanying notes are an integral part of these financial statements. | Annual Report 79
| | | | | | | | | | | | | | | |
| FRANKLIN CUSTODIAN FUNDS | | | | | | | | | | | | | | | |
| |
| |
| |
| Financial Highlights | | | | | | | | | | | | | | | |
| Franklin U.S. Government Securities Fund | | | | | | | | | | | | | | | |
| | | | | | Year Ended September 30, | | | | |
| | | 2016 | | | 2015 | | | 2014 | | | 2013 | | | 2012 | |
| Class A | | | | | | | | | | | | | | | |
| Per share operating performance | | | | | | | | | | | | | | | |
| (for a share outstanding throughout the year) | | | | | | | | | | | | | | | |
| Net asset value, beginning of year | $ | 6.40 | | $ | 6.48 | | $ | 6.53 | | $ | 6.91 | | $ | 6.92 | |
| Income from investment operationsa: | | | | | | | | | | | | | | | |
| Net investment incomeb | | 0.14 | | | 0.15 | | | 0.17 | | | 0.15 | | | 0.20 | |
| Net realized and unrealized gains (losses) | | 0.01 | | | (0.02 | ) | | 0.01 | | | (0.29 | ) | | 0.04 | |
| Total from investment operations | | 0.15 | | | 0.13 | | | 0.18 | | | (0.14 | ) | | 0.24 | |
| Less distributions from net investment income | | (0.20 | ) | | (0.21 | ) | | (0.23 | ) | | (0.24 | ) | | (0.25 | ) |
| Net asset value, end of year. | $ | 6.35 | | $ | 6.40 | | $ | 6.48 | | $ | 6.53 | | $ | 6.91 | |
| |
| Total returnc | | 2.35 | % | | 2.07 | % | | 2.80 | % | | (2.03 | )% | | 3.49 | % |
| |
| Ratios to average net assets | | | | | | | | | | | | | | | |
| Expenses | | 0.76 | %d | | 0.76 | %d | | 0.75 | %d | | 0.73 | % | | 0.73 | % |
| Net investment income | | 2.21 | % | | 2.28 | % | | 2.62 | % | | 2.17 | % | | 2.86 | % |
| |
| Supplemental data | | | | | | | | | | | | | | | |
| Net assets, end of year (000’s) | $ | 4,235,819 | | $ | 4,167,639 | | $ | 4,323,990 | | $ | 5,138,613 | | $ | 6,861,193 | |
| Portfolio turnover rate | | 92.18 | % | | 69.10 | % | | 69.73 | % | | 46.16 | % | | 40.15 | % |
| Portfolio turnover rate excluding mortgage dollar rollse | | 92.18 | % | | 58.70 | % | | 38.79 | % | | 40.83 | % | | 40.15 | % |
aThe amount shown for a share outstanding throughout the period may not correlate with the Statement of Operations for the period due to the timing of sales and
repurchases of the Fund’s shares in relation to income earned and/or fluctuating fair value of the investments of the Fund.
bBased on average daily shares outstanding.
cTotal return does not reflect sales commissions or contingent deferred sales charges, if applicable.
dBenefit of waiver and payments by affiliates and expense reduction rounds to less than 0.01%.
eSee Note 1(h) regarding mortgage dollar rolls.
80 Annual Report | The accompanying notes are an integral part of these financial statements.
franklintempleton.com
| | | | | | | | | | | | | | | |
| | | | | | | | | FRANKLIN CUSTODIAN FUNDS | |
| | | | | | | | | FINANCIAL HIGHLIGHTS | |
| |
| |
| Franklin U.S. Government Securities Fund (continued) | | | | | | | | | | | | | | | |
| | | | | | Year Ended September 30, | | | | |
| | | 2016 | | | 2015 | | | 2014 | | | 2013 | | | 2012 | |
| Class C | | | | | | | | | | | | | | | |
| Per share operating performance | | | | | | | | | | | | | | �� | |
| (for a share outstanding throughout the year) | | | | | | | | | | | | | | | |
| Net asset value, beginning of year | $ | 6.36 | | $ | 6.44 | | $ | 6.49 | | $ | 6.86 | | $ | 6.88 | |
| Income from investment operationsa: | | | | | | | | | | | | | | | |
| Net investment incomeb | | 0.11 | | | 0.11 | | | 0.14 | | | 0.11 | | | 0.16 | |
| Net realized and unrealized gains (losses) | | —c | | | (0.01 | ) | | 0.01 | | | (0.28 | ) | | 0.03 | |
| Total from investment operations | | 0.11 | | | 0.10 | | | 0.15 | | | (0.17 | ) | | 0.19 | |
| Less distributions from net investment income | | (0.17 | ) | | (0.18 | ) | | (0.20 | ) | | (0.20 | ) | | (0.21 | ) |
| Net asset value, end of year. | $ | 6.30 | | $ | 6.36 | | $ | 6.44 | | $ | 6.49 | | $ | 6.86 | |
| |
| Total returnd | | 1.70 | % | | 1.57 | % | | 2.30 | % | | (2.45 | )% | | 2.85 | % |
| |
| Ratios to average net assets | | | | | | | | | | | | | | | |
| Expenses | | 1.26 | %e | | 1.26 | %e | | 1.25 | %e | | 1.23 | % | | 1.23 | % |
| Net investment income | | 1.71 | % | | 1.78 | % | | 2.12 | % | | 1.67 | % | | 2.36 | % |
| |
| Supplemental data | | | | | | | | | | | | | | | |
| Net assets, end of year (000’s) | $ | 1,034,410 | | $ | 1,040,294 | | $ | 1,190,720 | | $ | 1,640,787 | | $ | 2,981,724 | |
| Portfolio turnover rate | | 92.18 | % | | 69.10 | % | | 69.73 | % | | 46.16 | % | | 40.15 | % |
| Portfolio turnover rate excluding mortgage dollar rollsf | | 92.18 | % | | 58.70 | % | | 38.79 | % | | 40.83 | % | | 40.15 | % |
aThe amount shown for a share outstanding throughout the period may not correlate with the Statement of Operations for the period due to the timing of sales and
repurchases of the Fund’s shares in relation to income earned and/or fluctuating fair value of the investments of the Fund.
bBased on average daily shares outstanding.
cAmount rounds to less than $0.01 per share.
dTotal return does not reflect sales commissions or contingent deferred sales charges, if applicable.
eBenefit of waiver and payments by affiliates and expense reduction rounds to less than 0.01%.
fSee Note 1(h) regarding mortgage dollar rolls.
franklintempleton.com
The accompanying notes are an integral part of these financial statements. | Annual Report 81
| | | | | | | | | | | | | | | |
| FRANKLIN CUSTODIAN FUNDS | | | | | | | | | | | | | | | |
| FINANCIAL HIGHLIGHTS | | | | | | | | | | | | | | | |
| |
| |
| Franklin U.S. Government Securities Fund (continued) | | | | | | | | | | | | | | | |
| | | | | | Year Ended September 30, | | | | |
| | | 2016 | | | 2015 | | | 2014 | | | 2013 | | | 2012 | |
| Class R | | | | | | | | | | | | | | | |
| Per share operating performance | | | | | | | | | | | | | | | |
| (for a share outstanding throughout the year) | | | | | | | | | | | | | | | |
| Net asset value, beginning of year | $ | 6.40 | | $ | 6.48 | | $ | 6.53 | | $ | 6.90 | | $ | 6.91 | |
| Income from investment operationsa: | | | | | | | | | | | | | | | |
| Net investment incomeb | | 0.12 | | | 0.13 | | | 0.15 | | | 0.12 | | | 0.17 | |
| Net realized and unrealized gains (losses) | | —c | | | (0.02 | ) | | 0.01 | | | (0.27 | ) | | 0.04 | |
| Total from investment operations | | 0.12 | | | 0.11 | | | 0.16 | | | (0.15 | ) | | 0.21 | |
| Less distributions from net investment income | | (0.18 | ) | | (0.19 | ) | | (0.21 | ) | | (0.22 | ) | | (0.22 | ) |
| Net asset value, end of year. | $ | 6.34 | | $ | 6.40 | | $ | 6.48 | | $ | 6.53 | | $ | 6.90 | |
| |
| Total return | | 1.84 | % | | 1.71 | % | | 2.44 | % | | (2.27 | )% | | 3.13 | % |
| |
| Ratios to average net assets | | | | | | | | | | | | | | | |
| Expenses | | 1.11 | %d | | 1.11 | %d | | 1.10 | %d | | 1.08 | % | | 1.08 | % |
| Net investment income | | 1.86 | % | | 1.93 | % | | 2.27 | % | | 1.82 | % | | 2.51 | % |
| |
| Supplemental data | | | | | | | | | | | | | | | |
| Net assets, end of year (000’s) | $ | 59,785 | | $ | 64,689 | | $ | 74,442 | | $ | 94,110 | | $ | 141,140 | |
| Portfolio turnover rate | | 92.18 | % | | 69.10 | % | | 69.73 | % | | 46.16 | % | | 40.15 | % |
| Portfolio turnover rate excluding mortgage dollar rollse | | 92.18 | % | | 58.70 | % | | 38.79 | % | | 40.83 | % | | 40.15 | % |
aThe amount shown for a share outstanding throughout the period may not correlate with the Statement of Operations for the period due to the timing of sales and
repurchases of the Fund’s shares in relation to income earned and/or fluctuating fair value of the investments of the Fund.
bBased on average daily shares outstanding.
cAmount rounds to less than $0.01 per share.
dBenefit of waiver and payments by affiliates and expense reduction rounds to less than 0.01%.
eSee Note 1(h) regarding mortgage dollar rolls.
82 Annual Report | The accompanying notes are an integral part of these financial statements.
franklintempleton.com
| | | | | | | | | | | | |
| | | | | | FRANKLIN CUSTODIAN FUNDS | |
| | | | | | FINANCIAL HIGHLIGHTS | |
| |
| |
| Franklin U.S. Government Securities Fund (continued) | | | | | | | | | | | | |
| | | Year Ended September 30, | | | | |
| | | 2016 | | | 2015 | | | 2014 | | | 2013 | a |
| Class R6 | | | | | | | | | | | | |
| Per share operating performance | | | | | | | | | | | | |
| (for a share outstanding throughout the year) | | | | | | | | | | | | |
| Net asset value, beginning of year | $ | 6.42 | | $ | 6.50 | | $ | 6.55 | | $ | 6.76 | |
| Income from investment operationsb: | | | | | | | | | | | | |
| Net investment incomec | | 0.16 | | | 0.17 | | | 0.19 | | | 0.07 | |
| Net realized and unrealized gains (losses) | | 0.01 | | | (0.02 | ) | | 0.01 | | | (0.17 | ) |
| Total from investment operations | | 0.17 | | | 0.15 | | | 0.20 | | | (0.10 | ) |
| Less distributions from net investment income | | (0.22 | ) | | (0.23 | ) | | (0.25 | ) | | (0.11 | ) |
| Net asset value, end of year | $ | 6.37 | | $ | 6.42 | | $ | 6.50 | | $ | 6.55 | |
| |
| Total return | | 2.63 | % | | 2.35 | % | | 3.08 | % | | (1.53 | )% |
| |
| Ratios to average net assets | | | | | | | | | | | | |
| Expenses | | 0.48 | %d | | 0.47 | %d | | 0.47 | %d | | 0.46 | % |
| Net investment income | | 2.49 | % | | 2.57 | % | | 2.90 | % | | 2.44 | % |
| |
| Supplemental data | | | | | | | | | | | | |
| Net assets, end of year (000’s) | $ | 624,619 | | $ | 375,644 | | $ | 497,246 | | $ | 480,590 | |
| Portfolio turnover rate | | 92.18 | % | | 69.10 | % | | 69.73 | % | | 46.16 | % |
| Portfolio turnover rate excluding mortgage dollar rollse | | 92.18 | % | | 58.70 | % | | 38.79 | % | | 40.83 | % |
aFor the period May 1, 2013 (effective date) to September 30, 2013.
bThe amount shown for a share outstanding throughout the period may not correlate with the Statement of Operations for the period due to the timing of sales and
repurchases of the Fund’s shares in relation to income earned and/or fluctuating fair value of the investments of the Fund.
cBased on average daily shares outstanding.
dBenefit of waiver and payments by affiliates and expense reduction rounds to less than 0.01%.
eSee Note 1(h) regarding mortgage dollar rolls.
franklintempleton.com
The accompanying notes are an integral part of these financial statements. | Annual Report 83
| | | | | | | | | | | | | | | |
| FRANKLIN CUSTODIAN FUNDS | | | | | | | | | | | | | | | |
| FINANCIAL HIGHLIGHTS | | | | | | | | | | | | | | | |
| |
| |
| Franklin U.S. Government Securities Fund (continued) | | | | | | | | | | | | | | | |
| | | | | | Year Ended September 30, | | | | |
| | | 2016 | | | 2015 | | | 2014 | | | 2013 | | | 2012 | |
| Advisor Class | | | | | | | | | | | | | | | |
| Per share operating performance | | | | | | | | | | | | | | | |
| (for a share outstanding throughout the year) | | | | | | | | | | | | | | | |
| Net asset value, beginning of year | $ | 6.42 | | $ | 6.50 | | $ | 6.55 | | $ | 6.93 | | $ | 6.94 | |
| Income from investment operationsa: | | | | | | | | | | | | | | | |
| Net investment incomeb | | 0.15 | | | 0.16 | | | 0.18 | | | 0.16 | | | 0.21 | |
| Net realized and unrealized gains (losses) | | 0.01 | | | (0.02 | ) | | 0.01 | | | (0.29 | ) | | 0.04 | |
| Total from investment operations | | 0.16 | | | 0.14 | | | 0.19 | | | (0.13 | ) | | 0.25 | |
| Less distributions from net investment income | | (0.21 | ) | | (0.22 | ) | | (0.24 | ) | | (0.25 | ) | | (0.26 | ) |
| Net asset value, end of year. | $ | 6.37 | | $ | 6.42 | | $ | 6.50 | | $ | 6.55 | | $ | 6.93 | |
| |
| Total return | | 2.49 | % | | 2.21 | % | | 2.94 | % | | (1.86 | )% | | 3.63 | % |
| |
| Ratios to average net assets | | | | | | | | | | | | | | | |
| Expenses | | 0.61 | %c | | 0.61 | %c | | 0.60 | %c | | 0.58 | % | | 0.58 | % |
| Net investment income | | 2.36 | % | | 2.43 | % | | 2.77 | % | | 2.32 | % | | 3.01 | % |
| |
| Supplemental data | | | | | | | | | | | | | | | |
| Net assets, end of year (000’s) | $ | 718,975 | | $ | 622,339 | | $ | 652,737 | | $ | 949,085 | | $ | 1,586,928 | |
| Portfolio turnover rate | | 92.18 | % | | 69.10 | % | | 69.73 | % | | 46.16 | % | | 40.15 | % |
| Portfolio turnover rate excluding mortgage dollar rollsd | | 92.18 | % | | 58.70 | % | | 38.79 | % | | 40.83 | % | | 40.15 | % |
aThe amount shown for a share outstanding throughout the period may not correlate with the Statement of Operations for the period due to the timing of sales and
repurchases of the Fund’s shares in relation to income earned and/or fluctuating fair value of the investments of the Fund.
bBased on average daily shares outstanding.
cBenefit of waiver and payments by affiliates and expense reduction rounds to less than 0.01%.
dSee Note 1(h) regarding mortgage dollar rolls.
84 Annual Report | The accompanying notes are an integral part of these financial statements.
franklintempleton.com
FRANKLIN CUSTODIAN FUNDS
| | | | |
| Statement of Investments, September 30, 2016 | | | | |
| Franklin U.S. Government Securities Fund | | | | |
| | | Principal | | |
| | | Amount | | Value |
| |
| Mortgage-Backed Securities 98.4% | | | | |
| Government National Mortgage Association (GNMA) Fixed Rate 98.4% | | | | |
| GNMA GP 30 Year, 8.25%, 3/15/17 - 5/15/17 | $ | 2,831 | $ | 2,839 |
| GNMA GP 30 Year, 9.25%, 12/15/16 | | 2,478 | | 2,483 |
| GNMA I SF 15 Year, 6.50%, 5/15/18 | | 8,564 | | 8,583 |
| GNMA I SF 30 Year, 3.50%, 4/15/43 - 5/15/43 | | 37,139,643 | | 40,033,245 |
| GNMA I SF 30 Year, 4.00%, 10/15/40 - 10/15/44. | | 59,566,770 | | 64,934,212 |
| GNMA I SF 30 Year, 4.00%, 10/15/44 - 3/15/45 | | 59,113,300 | | 64,492,925 |
| GNMA I SF 30 Year, 4.00%, 3/15/45 - 8/15/46 | | 36,342,221 | | 39,690,099 |
| GNMA I SF 30 Year, 4.50%, 2/15/39 - 9/15/39 | | 57,419,042 | | 64,049,413 |
| GNMA I SF 30 Year, 4.50%, 9/15/39 - 2/15/40 | | 58,293,412 | | 64,809,996 |
| GNMA I SF 30 Year, 4.50%, 2/15/40 - 6/15/40 | | 59,432,269 | | 65,913,762 |
| GNMA I SF 30 Year, 4.50%, 6/15/40 - 7/15/40 | | 45,687,690 | | 50,800,137 |
| GNMA I SF 30 Year, 4.50%, 7/15/40 - 8/15/40 | | 59,345,776 | | 65,690,997 |
| GNMA I SF 30 Year, 4.50%, 8/15/40 - 6/15/41 | | 59,283,467 | | 66,192,467 |
| GNMA I SF 30 Year, 5.00%, 2/15/33 - 10/15/33 | | 59,137,513 | | 66,601,905 |
| GNMA I SF 30 Year, 5.00%, 10/15/33 - 8/15/35 | | 59,113,927 | | 66,539,414 |
| GNMA I SF 30 Year, 5.00%, 8/15/35 - 8/15/39 | | 45,027,571 | | 50,561,869 |
| GNMA I SF 30 Year, 5.00%, 8/15/39 - 10/15/39 | | 56,451,877 | | 63,470,909 |
| GNMA I SF 30 Year, 5.00%, 10/15/39 | | 43,689,589 | | 49,412,743 |
| GNMA I SF 30 Year, 5.00%, 10/15/39 - 11/15/39. | | 51,795,981 | | 58,659,288 |
| GNMA I SF 30 Year, 5.00%, 11/15/39 - 1/15/40 | | 57,963,363 | | 65,699,032 |
| GNMA I SF 30 Year, 5.00%, 2/15/40 - 3/15/40 | | 52,752,021 | | 59,587,608 |
| GNMA I SF 30 Year, 5.00%, 3/15/40 - 5/15/40 | | 50,561,647 | | 57,128,221 |
| GNMA I SF 30 Year, 5.00%, 5/15/40 - 6/15/40 | | 49,322,706 | | 55,883,156 |
| GNMA I SF 30 Year, 5.00%, 9/15/40 | | 31,380,501 | | 35,275,251 |
| GNMA I SF 30 Year, 5.50%, 5/15/28 - 5/15/33 | | 58,305,886 | | 66,628,999 |
| GNMA I SF 30 Year, 5.50%, 5/15/33 - 12/15/34 | | 58,153,973 | | 66,417,270 |
| GNMA I SF 30 Year, 5.50%, 12/15/34 - 9/15/38 | | 53,468,714 | | 61,074,789 |
| GNMA I SF 30 Year, 5.50%, 12/15/38 - 2/15/40 | | 54,219,497 | | 61,644,276 |
| GNMA I SF 30 Year, 6.00%, 10/15/23 - 2/15/33 | | 57,441,225 | | 66,662,431 |
| GNMA I SF 30 Year, 6.00%, 2/15/33 - 11/15/36 | | 56,368,531 | | 66,011,077 |
| GNMA I SF 30 Year, 6.00%, 11/15/36 - 11/15/38. | | 54,023,894 | | 62,479,158 |
| GNMA I SF 30 Year, 6.00%, 11/15/38 - 12/15/39. | | 32,540,323 | | 37,321,016 |
| GNMA I SF 30 Year, 6.50%, 5/15/23 - 9/15/36 | | 57,248,301 | | 66,421,346 |
| GNMA I SF 30 Year, 6.50%, 9/15/36 - 8/15/37 | | 5,047,621 | | 5,884,141 |
| GNMA I SF 30 Year, 6.75%, 3/15/26 | | 3,204 | | 3,696 |
| GNMA I SF 30 Year, 7.00%, 12/15/16 - 9/15/32 | | 42,621,494 | | 48,111,067 |
| GNMA I SF 30 Year, 7.25%, 12/15/25 - 1/15/26 | | 100,727 | | 103,190 |
| GNMA I SF 30 Year, 7.50%, 1/15/17 - 8/15/33 | | 12,848,739 | | 14,233,757 |
| GNMA I SF 30 Year, 7.70%, 1/15/21 - 10/15/21 | | 73,380 | | 73,661 |
| GNMA I SF 30 Year, 8.00%, 10/15/16 - 9/15/30 | | 5,447,428 | | 5,730,735 |
| GNMA I SF 30 Year, 8.50%, 12/15/16 - 5/15/25 | | 1,117,175 | | 1,183,472 |
| GNMA I SF 30 Year, 9.00%, 10/15/16 - 7/15/23 | | 1,018,442 | | 1,060,816 |
| GNMA I SF 30 Year, 9.50%, 11/15/16 - 8/15/22 | | 1,015,037 | | 1,033,290 |
| GNMA I SF 30 Year, 10.00%, 12/15/16 - 3/15/25. | | 752,406 | | 765,778 |
| GNMA I SF 30 Year, 10.50%, 6/15/17 - 10/15/21. | | 376,600 | | 382,480 |
| GNMA I SF 30 Year, 11.00%, 11/15/17 - 5/15/21. | | 58,231 | | 58,938 |
| GNMA II GP 30 Year, 8.75%, 3/20/17 - 4/20/17. | | 529 | | 532 |
| GNMA II SF 30 Year, 3.00%, 2/20/45 - 9/20/46 | | 37,812,258 | | 39,681,633 |
| GNMA II SF 30 Year, 3.00%, 7/20/46 | | 173,788,916 | | 182,380,750 |
| GNMA II SF 30 Year, 3.00%, 8/20/46 | | 78,557,329 | | 82,441,072 |
| GNMA II SF 30 Year, 3.50%, 10/20/40 - 8/20/42 | | 47,528,451 | | 50,648,921 |
franklintempleton.com
Annual Report
85
FRANKLIN CUSTODIAN FUNDS
STATEMENT OF INVESTMENTS
| | | | |
| Franklin U.S. Government Securities Fund (continued) | | | | |
| | | Principal | | |
| | | Amount | | Value |
| |
| Mortgage-Backed Securities (continued) | | | | |
| Government National Mortgage Association (GNMA) Fixed Rate (continued) | | | | |
| GNMA II SF 30 Year, 3.50%, 7/20/42 | $ | 76,518,816 | $ | 81,519,750 |
| GNMA II SF 30 Year, 3.50%, 9/20/42 | | 171,337,048 | | 182,535,089 |
| GNMA II SF 30 Year, 3.50%, 10/20/42 - 11/20/42 | | 46,225,051 | | 49,331,191 |
| GNMA II SF 30 Year, 3.50%, 11/20/42 - 3/20/43 | | 44,550,498 | | 47,556,662 |
| GNMA II SF 30 Year, 3.50%, 4/20/43 - 5/20/43 | | 37,981,468 | | 40,474,517 |
| GNMA II SF 30 Year, 3.50%, 5/20/43 | | 49,008,520 | | 52,263,637 |
| GNMA II SF 30 Year, 3.50%, 6/20/43 | | 56,527,951 | | 60,286,207 |
| GNMA II SF 30 Year, 3.50%, 8/20/43 | | 41,087,968 | | 43,759,331 |
| GNMA II SF 30 Year, 3.50%, 3/20/46 | | 438,430,305 | | 466,331,584 |
| GNMA II SF 30 Year, 3.50%, 4/20/46 | | 199,292,670 | | 211,985,883 |
| GNMA II SF 30 Year, 3.50%, 5/20/46 | | 108,114,638 | | 115,023,333 |
| GNMA II SF 30 Year, 3.50%, 7/20/46 | | 496,729,133 | | 528,712,554 |
| GNMA II SF 30 Year, 3.50%, 8/20/46 | | 407,377,284 | | 433,486,290 |
| GNMA II SF 30 Year, 3.50%, 9/20/46 | | 73,080,000 | | 77,910,663 |
| GNMA II SF 30 Year, 4.00%, 5/20/40 - 10/20/40 | | 16,931,370 | | 18,223,575 |
| GNMA II SF 30 Year, 4.00%, 11/20/40 | | 52,113,093 | | 56,107,752 |
| GNMA II SF 30 Year, 4.00%, 12/20/40 | | 30,364,254 | | 32,691,767 |
| GNMA II SF 30 Year, 4.00%, 1/20/41 - 6/20/41 | | 33,436,101 | | 36,068,025 |
| GNMA II SF 30 Year, 4.00%, 7/20/41 | | 42,862,895 | | 46,135,179 |
| GNMA II SF 30 Year, 4.00%, 9/20/41 | | 50,238,311 | | 54,064,129 |
| GNMA II SF 30 Year, 4.00%, 10/20/41 | | 60,790,310 | | 65,419,623 |
| GNMA II SF 30 Year, 4.00%, 11/20/41 | | 55,368,018 | | 59,679,373 |
| GNMA II SF 30 Year, 4.00%, 2/20/44 | | 45,984,710 | | 50,295,772 |
| GNMA II SF 30 Year, 4.00%, 2/20/46 | | 72,710,003 | | 77,986,871 |
| GNMA II SF 30 Year, 4.00%, 4/20/46 | | 133,460,725 | | 143,259,557 |
| GNMA II SF 30 Year, 4.00%, 5/20/46 | | 327,888,941 | | 352,110,917 |
| GNMA II SF 30 Year, 4.50%, 5/20/33 - 11/20/39 | | 25,690,449 | | 28,123,254 |
| GNMA II SF 30 Year, 4.50%, 12/20/39 - 2/20/40 | | 59,945,645 | | 65,669,596 |
| GNMA II SF 30 Year, 4.50%, 6/20/40 - 7/20/40 | | 15,534,863 | | 17,023,305 |
| GNMA II SF 30 Year, 4.50%, 5/20/41 - 6/20/41 | | 60,828,107 | | 66,684,832 |
| GNMA II SF 30 Year, 4.50%, 6/20/41 | | 57,068,544 | | 62,563,329 |
| GNMA II SF 30 Year, 4.50%, 7/20/41 | | 61,461,948 | | 67,379,785 |
| GNMA II SF 30 Year, 4.50%, 8/20/41 - 2/20/44 | | 44,596,796 | | 48,379,490 |
| GNMA II SF 30 Year, 4.50%, 9/20/41 | | 81,330,267 | | 89,284,705 |
| GNMA II SF 30 Year, 4.50%, 10/20/41 | | 61,107,907 | | 67,084,537 |
| GNMA II SF 30 Year, 5.00%, 7/20/33 - 11/20/33 | | 53,261,257 | | 59,882,948 |
| GNMA II SF 30 Year, 5.00%, 12/20/33 - 12/20/39 | | 51,075,886 | | 56,850,225 |
| GNMA II SF 30 Year, 5.00%, 4/20/40 - 9/20/41 | | 48,659,485 | | 54,327,012 |
| GNMA II SF 30 Year, 5.50%, 6/20/34 - 12/20/34 | | 52,660,146 | | 59,790,721 |
| GNMA II SF 30 Year, 5.50%, 1/20/35 - 4/20/38 | | 55,296,585 | | 62,482,760 |
| GNMA II SF 30 Year, 5.50%, 6/20/38 - 4/20/40 | | 16,597,064 | | 18,487,665 |
| GNMA II SF 30 Year, 6.00%, 10/20/23 - 3/20/36 | | 57,084,899 | | 66,640,161 |
| GNMA II SF 30 Year, 6.00%, 4/20/36 - 7/20/39 | | 34,117,953 | | 39,222,991 |
| GNMA II SF 30 Year, 6.50%, 6/20/24 - 1/20/39 | | 31,550,243 | | 37,320,843 |
| GNMA II SF 30 Year, 7.00%, 2/20/28 - 7/20/33 | | 7,091,092 | | 8,746,961 |
| GNMA II SF 30 Year, 7.50%, 10/20/22 - 4/20/32 | | 1,595,561 | | 1,873,289 |
| GNMA II SF 30 Year, 8.00%, 1/20/17 - 6/20/30 | | 742,897 | | 897,892 |
| GNMA II SF 30 Year, 8.50%, 1/20/17 - 6/20/25 | | 239,644 | | 254,905 |
| GNMA II SF 30 Year, 9.00%, 11/20/17 - 11/20/21 | | 43,909 | | 47,862 |
| GNMA II SF 30 Year, 9.50%, 3/20/18 - 4/20/25 | | 72,249 | | 76,045 |
| GNMA II SF 30 Year, 10.00%, 10/20/17 - 3/20/21 | | 88,621 | | 95,255 |
86 Annual Report
franklintempleton.com
FRANKLIN CUSTODIAN FUNDS
STATEMENT OF INVESTMENTS
| | | | |
| Franklin U.S. Government Securities Fund (continued) | | | | |
| | | Principal | | |
| | | Amount | | Value |
| Mortgage-Backed Securities (continued) | | | | |
| Government National Mortgage Association (GNMA) Fixed Rate (continued) | | | | |
| GNMA II SF 30 Year, 10.50%, 10/20/17 - 1/20/21 | $ | 106,934 | $ | 109,354 |
| GNMA II SF 30 Year, 11.00%, 7/20/18 - 1/20/21 | | 21,895 | | 22,073 |
| GNMA II SF 30 Year, 11.50%, 1/20/18 | | 515 | | 522 |
| Total Mortgage-Backed Securities (Cost $6,351,700,991) | | | | 6,566,420,393 |
| |
| |
| | | Shares | | |
| Short Term Investments (Cost $100,549,302) 1.5% | | | | |
| Money Market Funds 1.5% | | | | |
| a,b Institutional Fiduciary Trust Money Market Portfolio | | 100,549,302 | | 100,549,302 |
| Total Investments (Cost $6,452,250,293) 99.9%. | | | | 6,666,969,695 |
| Other Assets, less Liabilities 0.1% | | | | 6,639,154 |
| Net Assets 100.0% | | | $ | 6,673,608,849 |
See Abbreviations on page 126.
aNon-income producing.
bSee Note 3(f) regarding investments in affiliated management investment companies.
franklintempleton.com
The accompanying notes are an integral part of these financial statements. | Annual Report 87
FRANKLIN CUSTODIAN FUNDS
| | | | | | | | | | | | | | | |
| Financial Highlights | | | | | | | | | | | | | | | |
| Franklin Utilities Fund | | | | | | | | | | | | | | | |
| | | | | | Year Ended September 30, | | | | |
| | | 2016 | | | 2015 | | | 2014 | | | 2013 | | | 2012 | |
| Class A | | | | | | | | | | | | | | | |
| Per share operating performance | | | | | | | | | | | | | | | |
| (for a share outstanding throughout the year) | | | | | | | | | | | | | | | |
| Net asset value, beginning of year | $ | 16.08 | | $ | 16.58 | | $ | 14.62 | | $ | 14.04 | | $ | 12.42 | |
| Income from investment operationsa: | | | | | | | | | | | | | | | |
| Net investment incomeb | | 0.48 | | | 0.49 | | | 0.49 | | | 0.49 | | | 0.48 | |
| Net realized and unrealized gains (losses) | | 2.31 | | | (0.09 | ) | | 2.00 | | | 0.60 | | | 1.60 | |
| Total from investment operations | | 2.79 | | | 0.40 | | | 2.49 | | | 1.09 | | | 2.08 | |
| Less distributions from: | | | | | | | | | | | | | | | |
| Net investment income | | (0.50 | ) | | (0.48 | ) | | (0.49 | ) | | (0.51 | ) | | (0.46 | ) |
| Net realized gains | | (0.52 | ) | | (0.42 | ) | | (0.04 | ) | | — | | | — | |
| Total distributions | | (1.02 | ) | | (0.90 | ) | | (0.53 | ) | | (0.51 | ) | | (0.46 | ) |
| Net asset value, end of year. | $ | 17.85 | | $ | 16.08 | | $ | 16.58 | | $ | 14.62 | | $ | 14.04 | |
| |
| Total returnc | | 18.23 | % | | 2.19 | % | | 17.24 | % | | 7.92 | % | | 16.99 | % |
| |
| Ratios to average net assets | | | | | | | | | | | | | | | |
| Expenses | | 0.73 | %d,e | | 0.73 | %e | | 0.75 | %d,e | | 0.75 | %d | | 0.76 | % |
| Net investment income | | 2.81 | % | | 2.88 | % | | 3.05 | % | | 3.34 | % | | 3.61 | % |
| |
| Supplemental data | | | | | | | | | | | | | | | |
| Net assets, end of year (000’s) | $ | 4,180,124 | | $ | 3,524,835 | | $ | 3,717,397 | | $ | 3,275,129 | | $ | 3,076,131 | |
| Portfolio turnover rate | | 7.17 | % | | 9.55 | % | | 8.10 | % | | 4.57 | % | | 1.27 | % |
aThe amount shown for a share outstanding throughout the period may not correlate with the Statement of Operations for the period due to the timing of sales and
repurchases of the Fund’s shares in relation to income earned and/or fluctuating fair value of the investments of the Fund.
bBased on average daily shares outstanding.
cTotal return does not reflect sales commissions or contingent deferred sales charges, if applicable.
dBenefit of expense reduction rounds to less than 0.01%.
eBenefit of waiver and payments by affiliates rounds to less than 0.01%.
88 Annual Report | The accompanying notes are an integral part of these financial statements.
franklintempleton.com
| | | | | | | | | | | | | | | |
| | | | | | | | | FRANKLIN CUSTODIAN FUNDS | |
| | | | | | | | | FINANCIAL HIGHLIGHTS | |
| |
| |
| Franklin Utilities Fund (continued) | | | | | | | | | | | | | | | |
| | | | | | Year Ended September 30, | | | | |
| | | 2016 | | | 2015 | | | 2014 | | | 2013 | | | 2012 | |
| Class C | | | | | | | | | | | | | | | |
| Per share operating performance | | | | | | | | | | | | | | | |
| (for a share outstanding throughout the year) | | | | | | | | | | | | | | | |
| Net asset value, beginning of year | $ | 16.01 | | $ | 16.50 | | $ | 14.56 | | $ | 13.98 | | $ | 12.37 | |
| Income from investment operationsa: | | | | | | | | | | | | | | | |
| Net investment incomeb | | 0.39 | | | 0.40 | | | 0.41 | | | 0.41 | | | 0.42 | |
| Net realized and unrealized gains (losses) | | 2.30 | | | (0.08 | ) | | 1.98 | | | 0.61 | | | 1.58 | |
| Total from investment operations | | 2.69 | | | 0.32 | | | 2.39 | | | 1.02 | | | 2.00 | |
| Less distributions from: | | | | | | | | | | | | | | | |
| Net investment income | | (0.42 | ) | | (0.39 | ) | | (0.41 | ) | | (0.44 | ) | | (0.39 | ) |
| Net realized gains | | (0.52 | ) | | (0.42 | ) | | (0.04 | ) | | — | | | — | |
| Total distributions | | (0.94 | ) | | (0.81 | ) | | (0.45 | ) | | (0.44 | ) | | (0.39 | ) |
| Net asset value, end of year. | $ | 17.76 | | $ | 16.01 | | $ | 16.50 | | $ | 14.56 | | $ | 13.98 | |
| |
| Total returnc | | 17.59 | % | | 1.74 | % | | 16.61 | % | | 7.40 | % | | 16.32 | % |
| |
| Ratios to average net assets | | | | | | | | | | | | | | | |
| Expenses | | 1.23 | %d,e | | 1.23 | %e | | 1.25 | %d,e | | 1.25 | %d | | 1.26 | % |
| Net investment income | | 2.31 | % | | 2.38 | % | | 2.55 | % | | 2.84 | % | | 3.11 | % |
| |
| Supplemental data | | | | | | | | | | | | | | | |
| Net assets, end of year (000’s) | $ | 1,064,065 | | $ | 931,800 | | $ | 986,318 | | $ | 845,173 | | $ | 774,711 | |
| Portfolio turnover rate | | 7.17 | % | | 9.55 | % | | 8.10 | % | | 4.57 | % | | 1.27 | % |
aThe amount shown for a share outstanding throughout the period may not correlate with the Statement of Operations for the period due to the timing of sales and
repurchases of the Fund’s shares in relation to income earned and/or fluctuating fair value of the investments of the Fund.
bBased on average daily shares outstanding.
cTotal return does not reflect sales commissions or contingent deferred sales charges, if applicable.
dBenefit of expense reduction rounds to less than 0.01%.
eBenefit of waiver and payments by affiliates rounds to less than 0.01%.
franklintempleton.com
The accompanying notes are an integral part of these financial statements. | Annual Report 89
| | | | | | | | | | | | | | | |
| FRANKLIN CUSTODIAN FUNDS | | | | | | | | | | | | | | | |
| FINANCIAL HIGHLIGHTS | | | | | | | | | | | | | | | |
| |
| |
| Franklin Utilities Fund (continued) | | | | | | | | | | | | | | | |
| | | | | | Year Ended September 30, | | | | |
| | | 2016 | | | 2015 | | | 2014 | | | 2013 | | | 2012 | |
| Class R | | | | | | | | | | | | | | | |
| Per share operating performance | | | | | | | | | | | | | | | |
| (for a share outstanding throughout the year) | | | | | | | | | | | | | | | |
| Net asset value, beginning of year | $ | 16.02 | | $ | 16.52 | | $ | 14.58 | | $ | 14.00 | | $ | 12.39 | |
| Income from investment operationsa: | | | | | | | | | | | | | | | |
| Net investment incomeb | | 0.42 | | | 0.42 | | | 0.43 | | | 0.44 | | | 0.44 | |
| Net realized and unrealized gains (losses) | | 2.30 | | | (0.09 | ) | | 1.99 | | | 0.60 | | | 1.58 | |
| Total from investment operations | | 2.72 | | | 0.33 | | | 2.42 | | | 1.04 | | | 2.02 | |
| Less distributions from: | | | | | | | | | | | | | | | |
| Net investment income | | (0.44 | ) | | (0.41 | ) | | (0.44 | ) | | (0.46 | ) | | (0.41 | ) |
| Net realized gains | | (0.52 | ) | | (0.42 | ) | | (0.04 | ) | | — | | | — | |
| Total distributions | | (0.96 | ) | | (0.83 | ) | | (0.48 | ) | | (0.46 | ) | | (0.41 | ) |
| Net asset value, end of year. | $ | 17.78 | | $ | 16.02 | | $ | 16.52 | | $ | 14.58 | | $ | 14.00 | |
| |
| Total return | | 17.81 | % | | 1.83 | % | | 16.75 | % | | 7.56 | % | | 16.55 | % |
| |
| Ratios to average net assets | | | | | | | | | | | | | | | |
| Expenses | | 1.08 | %c,d | | 1.08 | %d | | 1.10 | %c,d | | 1.10 | %c | | 1.11 | % |
| Net investment income | | 2.46 | % | | 2.53 | % | | 2.70 | % | | 2.99 | % | | 3.26 | % |
| |
| Supplemental data | | | | | | | | | | | | | | | |
| Net assets, end of year (000’s) | $ | 103,247 | | $ | 83,271 | | $ | 95,498 | | $ | 86,216 | | $ | 80,478 | |
| Portfolio turnover rate | | 7.17 | % | | 9.55 | % | | 8.10 | % | | 4.57 | % | | 1.27 | % |
aThe amount shown for a share outstanding throughout the period may not correlate with the Statement of Operations for the period due to the timing of sales and
repurchases of the Fund’s shares in relation to income earned and/or fluctuating fair value of the investments of the Fund.
bBased on average daily shares outstanding.
cBenefit of expense reduction rounds to less than 0.01%.
dBenefit of waiver and payments by affiliates rounds to less than 0.01%.
90 Annual Report | The accompanying notes are an integral part of these financial statements.
franklintempleton.com
| | | | | | | | | | | | |
| | | | | | FRANKLIN CUSTODIAN FUNDS | |
| | | | | | FINANCIAL HIGHLIGHTS | |
| |
| |
| Franklin Utilities Fund (continued) | | | | | | | | | | | | |
| | | Year Ended September 30, | | | | |
| | | 2016 | | | 2015 | | | 2014 | | | 2013 | a |
| Class R6 | | | | | | | | | | | | |
| Per share operating performance | | | | | | | | | | | | |
| (for a share outstanding throughout the year) | | | | | | | | | | | | |
| Net asset value, beginning of year | $ | 16.18 | | $ | 16.68 | | $ | 14.71 | | $ | 15.88 | |
| Income from investment operationsb: | | | | | | | | | | | | |
| Net investment incomec | | 0.53 | | | 0.53 | | | 0.53 | | | 0.25 | |
| Net realized and unrealized gains (losses) | | 2.32 | | | (0.09 | ) | | 2.01 | | | (1.17 | ) |
| Total from investment operations | | 2.85 | | | 0.44 | | | 2.54 | | | (0.92 | ) |
| Less distributions from: | | | | | | | | | | | | |
| Net investment income. | | (0.54 | ) | | (0.52 | ) | | (0.53 | ) | | (0.25 | ) |
| Net realized gains | | (0.52 | ) | | (0.42 | ) | | (0.04 | ) | | — | |
| Total distributions | | (1.06 | ) | | (0.94 | ) | | (0.57 | ) | | (0.25 | ) |
| Net asset value, end of year | $ | 17.97 | | $ | 16.18 | | $ | 16.68 | | $ | 14.71 | |
| |
| Total returnd | | 18.55 | % | | 2.45 | % | | 17.51 | % | | (5.79 | )% |
| |
| Ratios to average net assetse | | | | | | | | | | | | |
| Expenses | | 0.47 | %f,g | | 0.47 | %g | | 0.48 | %f,g | | 0.48 | %f |
| Net investment income | | 3.07 | % | | 3.14 | % | | 3.32 | % | | 3.61 | % |
| |
| Supplemental data | | | | | | | | | | | | |
| Net assets, end of year (000’s) | $ | 219,587 | | $ | 201,225 | | $ | 236,437 | | $ | 218,746 | |
| Portfolio turnover rate | | 7.17 | % | | 9.55 | % | | 8.10 | % | | 4.57 | % |
aFor the period May 1, 2013 (effective date) to September 30, 2013.
bThe amount shown for a share outstanding throughout the period may not correlate with the Statement of Operations for the period due to the timing of sales and
repurchases of the Fund’s shares in relation to income earned and/or fluctuating fair value of the investments of the Fund.
cBased on average daily shares outstanding.
dTotal return is not annualized for periods less than one year.
eRatios are annualized for periods less than one year.
fBenefit of expense reduction rounds to less than 0.01%.
gBenefit of waiver and payments by affiliates rounds to less than 0.01%.
franklintempleton.com
The accompanying notes are an integral part of these financial statements. | Annual Report 91
| | | | | | | | | | | | | | | |
| FRANKLIN CUSTODIAN FUNDS | | | | | | | | | | | | | | | |
| FINANCIAL HIGHLIGHTS | | | | | | | | | | | | | | | |
| |
| |
| Franklin Utilities Fund (continued) | | | | | | | | | | | | | | | |
| | | | | | Year Ended September 30, | | | | |
| | | 2016 | | | 2015 | | | 2014 | | | 2013 | | | 2012 | |
| Advisor Class | | | | | | | | | | | | | | | |
| Per share operating performance | | | | | | | | | | | | | | | |
| (for a share outstanding throughout the year) | | | | | | | | | | | | | | | |
| Net asset value, beginning of year | $ | 16.19 | | $ | 16.68 | | $ | 14.71 | | $ | 14.12 | | $ | 12.49 | |
| Income from investment operationsa: | | | | | | | | | | | | | | | |
| Net investment incomeb | | 0.51 | | | 0.52 | | | 0.52 | | | 0.50 | | | 0.51 | |
| Net realized and unrealized gains (losses) | | 2.32 | | | (0.09 | ) | | 2.00 | | | 0.62 | | | 1.60 | |
| Total from investment operations | | 2.83 | | | 0.43 | | | 2.52 | | | 1.12 | | | 2.11 | |
| Less distributions from: | | | | | | | | | | | | | | | |
| Net investment income | | (0.53 | ) | | (0.50 | ) | | (0.51 | ) | | (0.53 | ) | | (0.48 | ) |
| Net realized gains | | (0.52 | ) | | (0.42 | ) | | (0.04 | ) | | — | | | — | |
| Total distributions | | (1.05 | ) | | (0.92 | ) | | (0.55 | ) | | (0.53 | ) | | (0.48 | ) |
| Net asset value, end of year. | $ | 17.97 | | $ | 16.19 | | $ | 16.68 | | $ | 14.71 | | $ | 14.12 | |
| |
| Total return | | 18.34 | % | | 2.40 | % | | 17.37 | % | | 8.11 | % | | 17.15 | % |
| |
| Ratios to average net assets | | | | | | | | | | | | | | | |
| Expenses | | 0.58 | %c,d | | 0.58 | %d | | 0.60 | %c,d | | 0.60 | %c | | 0.61 | % |
| Net investment income | | 2.96 | % | | 3.03 | % | | 3.20 | % | | 3.49 | % | | 3.76 | % |
| |
| Supplemental data | | | | | | | | | | | | | | | |
| Net assets, end of year (000’s) | $ | 755,484 | | $ | 549,371 | | $ | 562,202 | | $ | 343,082 | | $ | 574,803 | |
| Portfolio turnover rate | | 7.17 | % | | 9.55 | % | | 8.10 | % | | 4.57 | % | | 1.27 | % |
aThe amount shown for a share outstanding throughout the period may not correlate with the Statement of Operations for the period due to the timing of sales and
repurchases of the Fund’s shares in relation to income earned and/or fluctuating fair value of the investments of the Fund.
bBased on average daily shares outstanding.
cBenefit of expense reduction rounds to less than 0.01%.
dBenefit of waiver and payments by affiliates rounds to less than 0.01%.
92 Annual Report | The accompanying notes are an integral part of these financial statements.
franklintempleton.com
FRANKLIN CUSTODIAN FUNDS
| | | | |
| Statement of Investments, September 30, 2016 | | | | |
| Franklin Utilities Fund | | | | |
| | Country | Shares | | Value |
| |
| Common Stocks 98.9% | | | | |
| Electric Utilities 58.4% | | | | |
| ALLETE Inc | United States | 1,000,000 | $ | 59,620,000 |
| Alliant Energy Corp | United States | 3,800,000 | | 145,578,000 |
| American Electric Power Co. Inc | United States | 4,000,000 | | 256,840,000 |
| Duke Energy Corp | United States | 3,500,000 | | 280,140,000 |
| Edison International | United States | 4,400,000 | | 317,900,000 |
| Emera Inc | Canada | 2,000,000 | | 72,094,175 |
| Entergy Corp | United States | 1,000,000 | | 76,730,000 |
| Eversource Energy | United States | 2,000,000 | | 108,360,000 |
| Exelon Corp | United States | 6,700,000 | | 223,043,000 |
| FirstEnergy Corp | United States | 5,200,000 | | 172,016,000 |
| Great Plains Energy Inc | United States | 5,100,000 | | 139,179,000 |
| a Hydro One Ltd., 144A | Canada | 2,000,000 | | 39,468,170 |
| IDACORP Inc | United States | 400,000 | | 31,312,000 |
| ITC Holdings Corp | United States | 300,000 | | 13,944,000 |
| NextEra Energy Inc | United States | 2,900,000 | | 354,728,000 |
| OGE Energy Corp | United States | 2,000,000 | | 63,240,000 |
| PG&E Corp | United States | 4,700,000 | | 287,499,000 |
| Pinnacle West Capital Corp | United States | 1,900,000 | | 144,381,000 |
| PNM Resources Inc | United States | 3,000,000 | | 98,160,000 |
| Portland General Electric Co | United States | 1,800,000 | | 76,662,000 |
| PPL Corp | United States | 4,400,000 | | 152,108,000 |
| The Southern Co | United States | 4,500,000 | | 230,850,000 |
| Westar Energy Inc | United States | 2,800,000 | | 158,900,000 |
| Xcel Energy Inc | United States | 4,600,000 | | 189,244,000 |
| | | | | 3,691,996,345 |
| Gas Utilities 1.5% | | | | |
| ONE Gas Inc | United States | 438,181 | | 27,097,113 |
| Spire Inc | United States | 1,000,000 | | 63,740,000 |
| | | | | 90,837,113 |
| Multi-Utilities 30.5% | | | | |
| Ameren Corp | United States | 900,000 | | 44,262,000 |
| Black Hills Corp | United States | 500,000 | | 30,610,000 |
| CenterPoint Energy Inc | United States | 6,200,000 | | 144,026,000 |
| CMS Energy Corp | United States | 4,865,000 | | 204,378,650 |
| Consolidated Edison Inc | United States | 1,250,000 | | 94,125,000 |
| Dominion Resources Inc | United States | 4,200,000 | | 311,934,000 |
| DTE Energy Co | United States | 1,800,000 | | 168,606,000 |
| MDU Resources Group Inc | United States | 3,600,000 | | 91,584,000 |
| National Grid PLC | United Kingdom | 11,000,000 | | 155,765,603 |
| NiSource Inc | United States | 2,000,000 | | 48,220,000 |
| NorthWestern Corp | United States | 596,800 | | 34,333,904 |
| Public Service Enterprise Group Inc | United States | 3,100,000 | | 129,797,000 |
| Sempra Energy | United States | 2,800,000 | | 300,132,000 |
| Vectren Corp | United States | 925,100 | | 46,440,020 |
| WEC Energy Group Inc | United States | 2,100,000 | | 125,748,000 |
| | | | | 1,929,962,177 |
| Oil, Gas & Consumable Fuels 5.0% | | | | |
| Enbridge Inc. | Canada | 847,200 | | 37,220,124 |
| Kinder Morgan Inc | United States | 3,700,000 | | 85,581,000 |
| Plains GP Holdings LP, A | United States | 2,400,000 | | 31,056,000 |
| Spectra Energy Corp | United States | 1,000,000 | | 42,750,000 |
franklintempleton.com
Annual Report
93
FRANKLIN CUSTODIAN FUNDS
STATEMENT OF INVESTMENTS
| | | | | | |
| Franklin Utilities Fund (continued) | | | | | | |
| | Country | | Shares | | Value | |
| Common Stocks (continued) | | | | | | |
| Oil, Gas & Consumable Fuels (continued) | | | | | | |
| TransCanada Corp | Canada | | 1,200,000 | $ | 56,971,314 | |
| The Williams Cos. Inc | United States | | 2,000,000 | | 61,460,000 | |
| | | | | | 315,038,438 | |
| Water Utilities 3.5% | | | | | | |
| American Water Works Co. Inc | United States | | 1,800,000 | | 134,712,000 | |
| United Utilities Group PLC | United Kingdom | | 6,700,000 | | 87,142,894 | |
| | | | | | 221,854,894 | |
| Total Common Stocks (Cost $3,756,351,470) | | | | | 6,249,688,967 | |
| |
| | | | Principal | | | |
| | | | Amount | | | |
| Corporate Bonds 0.8% | | | | | | |
| Electric Utilities 0.1% | | | | | | |
| Northeast Generation Co., senior secured note, B-1, 8.812%, 10/15/26 | United States | $ | 6,035,157 | | 6,329,479 | |
| Multi-Utilities 0.7% | | | | | | |
| Aquila Inc., senior note, 8.27%, 11/15/21 | United States | | 6,100,000 | | 7,518,329 | |
| MidAmerican Energy Holdings Co., senior note, 8.48%, 9/15/28 | United States | | 25,000,000 | | 38,604,150 | |
| | | | | | 46,122,479 | |
| Total Corporate Bonds (Cost $37,249,734) | | | | | 52,451,958 | |
| Total Investments before Short Term Investments | | | | | | |
| (Cost $3,793,601,204) | | | | | 6,302,140,925 | |
| |
| | | | Shares | | | |
| Short Term Investments (Cost $35,157,723) 0.5% | | | | | | |
| Money Market Funds 0.5% | | | | | | |
| b,c Institutional Fiduciary Trust Money Market Portfolio. | United States | | 35,157,723 | | 35,157,723 | |
| Total Investments (Cost $3,828,758,927) 100.2% | | | | | 6,337,298,648 | |
| Other Assets, less Liabilities (0.2)% | | | | | (14,790,623 | ) |
| Net Assets 100.0% | | | | $ | 6,322,508,025 | |
aSecurity was purchased pursuant to Rule 144A under the Securities Act of 1933 and may be sold in transactions exempt from registration only to qualified institutional buyers
or in a public offering registered under the Securities Act of 1933. This security has been deemed liquid under guidelines approved by the Trust’s Board of Trustees. At
September 30, 2016, the value of this security was $39,468,170, representing 0.6% of net assets.
bNon-income producing.
cSee Note 3(f) regarding investments in affiliated management investment companies.
94 Annual Report | The accompanying notes are an integral part of these financial statements.
franklintempleton.com
| | | | | | | | |
| | | | | | FRANKLIN CUSTODIAN FUNDS | |
| |
| |
| |
| |
| Financial Statements | | | | | | | | |
| |
| |
| Statements of Assets and Liabilities | | | | | | | | |
| September 30, 2016 | | | | | | | | |
| |
| | | Franklin | | | Franklin | | Franklin | |
| | | DynaTech Fund | | | Growth Fund | | Income Fund | |
| Assets: | | | | | | | | |
| Investments in securities: | | | | | | | | |
| Cost - Unaffiliated issuers | $ | 1,724,897,924 | | $ | 5,135,275,908 | $ | 74,719,100,524 | |
| Cost - Non-controlled affiliates (Note 3f and 11) | | 17,719,400 | | | 856,457,573 | | 2,637,754,556 | |
| Cost - Repurchase agreements | | — | | | — | | 10,079,713 | |
| Total cost of investments | $ | 1,742,617,324 | | $ | 5,991,733,481 | $ | 77,366,934,793 | |
| Value - Unaffiliated issuers | $ | 3,027,197,917 | | $ | 11,366,793,846 | $ | 77,412,930,568 | |
| Value - Non-controlled affiliates (Note 3f and 11) | | 17,719,400 | | | 856,457,573 | | 1,982,604,141 | |
| Value - Repurchase agreements. | | — | | | — | | 10,079,713 | |
| Total value of investmentsa | | 3,044,917,317 | | | 12,223,251,419 | | 79,405,614,422 | |
| Cash. | | — | | | 436,000 | | 94,308,896 | |
| Receivables: | | | | | | | | |
| Investment securities sold | | 4,741,647 | | | — | | 316,256,746 | |
| Capital shares sold | | 6,681,907 | | | 13,782,616 | | 84,875,596 | |
| Dividends and interest | | 950,235 | | | 7,530,025 | | 658,168,108 | |
| Unrealized appreciation on unfunded loan commitments (Note 9) | | — | | | — | | 99,500 | |
| Other assets | | 791 | | | 3,098 | | 20,182 | |
| Total assets | | 3,057,291,897 | | | 12,245,003,158 | | 80,559,343,450 | |
| Liabilities: | | | | | | | | |
| Payables: | | | | | | | | |
| Investment securities purchased | | 1,012,800 | | | — | | 625,893,429 | |
| Capital shares redeemed | | 8,883,608 | | | 32,500,346 | | 140,428,889 | |
| Management fees | | 1,156,102 | | | 4,323,277 | | 24,359,034 | |
| Distribution fees | | 1,445,279 | | | 5,029,118 | | 37,597,439 | |
| Transfer agent fees | | 788,829 | | | 3,544,592 | | 11,344,598 | |
| Options written, at value (premiums received $—, $— and $10,304,692) | | — | | | — | | 1,735,000 | |
| Payable upon return of securities loaned | | — | | | — | | 80,986,713 | |
| Accrued expenses and other liabilities. | | 216,666 | | | 587,984 | | 3,241,890 | |
| Total liabilities | | 13,503,284 | | | 45,985,317 | | 925,586,992 | |
| Net assets, at value | $ | 3,043,788,613 | | $ | 12,199,017,841 | $ | 79,633,756,458 | |
| Net assets consist of: | | | | | | | | |
| Paid-in capital | $ | 1,689,495,359 | | $ | 5,556,308,242 | $ | 84,430,891,693 | |
| Undistributed net investment income (loss) | | (7,486,842 | ) | | 36,852,247 | | — | |
| Distributions in excess of net investment income | | — | | | — | | (70,346,158 | ) |
| Net unrealized appreciation (depreciation) | | 1,302,300,146 | | | 6,201,296,680 | | 2,047,155,716 | |
| Accumulated net realized gain (loss) | | 59,479,950 | | | 404,560,672 | | (6,773,944,793 | ) |
| Net assets, at value | $ | 3,043,788,613 | | $ | 12,199,017,841 | $ | 79,633,756,458 | |
| |
| |
| |
| |
| aIncludes securities loaned | $ | — | | $ | — | $ | 77,938,238 | |
franklintempleton.com The accompanying notes are an integral part of these financial statements. | Annual Report 95
| | | | | | | |
| FRANKLIN CUSTODIAN FUNDS | | | | | | | |
| FINANCIAL STATEMENTS | | | | | | | |
| |
| |
| Statements of Assets and Liabilities (continued) | | | | | | | |
| September 30, 2016 | | | | | | | |
| |
| | | | Franklin | | Franklin | | Franklin |
| | | | DynaTech Fund | | Growth Fund | | Income Fund |
| Class A: | | | | | | | |
| Net assets, at value | $ | | 2,123,082,258 | $ | 7,628,523,135 | $ | 45,515,127,206 |
| Shares outstanding. | | | 40,789,037 | | 97,128,907 | | 20,253,643,677 |
| Net asset value per sharea | | $ | 52.05 | $ | 78.54 | $ | 2.25 |
| Maximum offering price per share (net asset value per share ÷ 94.25%, | | | | | | | |
| 94.25% and 95.75%, respectively) | | $ | 55.23 | $ | 83.33 | $ | 2.35 |
| Class C: | | | | | | | |
| Net assets, at value | $ | | 318,895,868 | $ | 846,965,485 | $ | 23,841,466,161 |
| Shares outstanding. | | | 7,131,775 | | 11,666,379 | | 10,484,319,753 |
| Net asset value and maximum offering price per sharea | | $ | 44.71 | $ | 72.60 | $ | 2.27 |
| Class R: | | | | | | | |
| Net assets, at value | $ | | 38,861,628 | $ | 477,221,426 | $ | 396,107,395 |
| Shares outstanding. | | | 763,416 | | 6,106,986 | | 179,358,302 |
| Net asset value and maximum offering price per share | | $ | 50.90 | $ | 78.14 | $ | 2.21 |
| Class R6: | | | | | | | |
| Net assets, at value | $ | | 359,505,473 | $ | 1,247,824,541 | $ | 1,737,576,662 |
| Shares outstanding. | | | 6,712,000 | | 15,837,883 | | 779,335,473 |
| Net asset value and maximum offering price per share | | $ | 53.56 | $ | 78.79 | $ | 2.23 |
| Advisor Class: | | | | | | | |
| Net assets, at value | $ | | 203,443,386 | $ | 1,998,483,254 | $ | 8,143,479,034 |
| Shares outstanding. | | | 3,820,310 | | 25,360,904 | | 3,653,827,052 |
| Net asset value and maximum offering price per share | | $ | 53.25 | $ | 78.80 | $ | 2.23 |
aRedemption price is equal to net asset value less contingent deferred sales charges, if applicable.
96 Annual Report | The accompanying notes are an integral part of these financial statements.
franklintempleton.com
| | | | | |
| | | FRANKLIN CUSTODIAN FUNDS |
| | | FINANCIAL STATEMENTS |
| |
| |
| Statements of Assets and Liabilities (continued) | | | | | |
| September 30, 2016 | | | | | |
| |
| | | Franklin | | | |
| | | U.S. Government | | | Franklin |
| | | Securities Fund | | | Utilities Fund |
| Assets: | | | | | |
| Investments in securities: | | | | | |
| Cost - Unaffiliated issuers | $ | 6,351,700,991 | | $ | 3,793,601,204 |
| Cost - Non-controlled affiliates (Note 3f and 11) | | 100,549,302 | | | 35,157,723 |
| Total cost of investments | $ | 6,452,250,293 | | $ | 3,828,758,927 |
| Value - Unaffiliated issuers | $ | 6,566,420,393 | | $ | 6,302,140,925 |
| Value - Non-controlled affiliates (Note 3f and 11) | | 100,549,302 | | | 35,157,723 |
| Total value of investments. | | 6,666,969,695 | | | 6,337,298,648 |
| Receivables: | | | | | |
| Capital shares sold | | 10,888,285 | | | 9,211,504 |
| Dividends and interest | | 20,422,607 | | | 14,916,362 |
| Other assets | | 2,121 | | | 1,488 |
| Total assets. | | 6,698,282,708 | | | 6,361,428,002 |
| Liabilities: | | | | | |
| Payables: | | | | | |
| Investment securities purchased | | — | | | 21,175,851 |
| Capital shares redeemed | | 16,339,095 | | | 11,648,841 |
| Management fees | | 2,480,640 | | | 2,382,983 |
| Distribution fees. | | 2,241,241 | | | 2,317,526 |
| Transfer agent fees | | 1,280,941 | | | 1,081,116 |
| Distributions to shareholders | | 1,912,883 | | | — |
| Accrued expenses and other liabilities | | 419,059 | | | 313,660 |
| Total liabilities | | 24,673,859 | | | 38,919,977 |
| Net assets, at value | $ | 6,673,608,849 | | $ | 6,322,508,025 |
| Net assets consist of: | | | | | |
| Paid-in capital | $ | 6,886,380,755 | | $ | 3,805,817,976 |
| Undistributed net investment income | | 367,575 | | | 5,048,906 |
| Net unrealized appreciation (depreciation) | | 214,719,402 | | | 2,508,542,332 |
| Accumulated net realized gain (loss) | | (427,858,883 | ) | | 3,098,811 |
| Net assets, at value | $ | 6,673,608,849 | | $ | 6,322,508,025 |
franklintempleton.com
The accompanying notes are an integral part of these financial statements. | Annual Report 97
| | | | | |
| FRANKLIN CUSTODIAN FUNDS | | | | | |
| FINANCIAL STATEMENTS | | | | | |
| |
| |
| Statements of Assets and Liabilities (continued) | | | | | |
| September 30, 2016 | | | | | |
| |
| | | | Franklin | | |
| | | | U.S. Government | | Franklin |
| | | | Securities Fund | | Utilities Fund |
| Class A: | | | | | |
| Net assets, at value | $ | | 4,235,819,268 | $ | 4,180,124,301 |
| Shares outstanding | | | 667,348,486 | | 234,214,745 |
| Net asset value per sharea | | $ | 6.35 | $ | 17.85 |
| Maximum offering price per share (net asset value per share ÷ 95.75%) | | $ | 6.63 | $ | 18.64 |
| Class C: | | | | | |
| Net assets, at value | $ | | 1,034,410,155 | $ | 1,064,065,283 |
| Shares outstanding | | | 164,086,661 | | 59,909,118 |
| Net asset value and maximum offering price per sharea | | $ | 6.30 | $ | 17.76 |
| Class R: | | | | | |
| Net assets, at value | $ | | 59,785,185 | $ | 103,247,492 |
| Shares outstanding | | | 9,425,514 | | 5,805,821 |
| Net asset value and maximum offering price per share. | | $ | 6.34 | $ | 17.78 |
| Class R6: | | | | | |
| Net assets, at value | $ | | 624,618,771 | $ | 219,586,683 |
| Shares outstanding | | | 98,099,208 | | 12,219,495 |
| Net asset value and maximum offering price per share. | | $ | 6.37 | $ | 17.97 |
| Advisor Class: | | | | | |
| Net assets, at value | $ | | 718,975,470 | $ | 755,484,266 |
| Shares outstanding | | | 112,906,103 | | 42,032,918 |
| Net asset value and maximum offering price per share. | | $ | 6.37 | $ | 17.97 |
aRedemption price is equal to net asset value less contingent deferred sales charges, if applicable.
98 Annual Report | The accompanying notes are an integral part of these financial statements.
franklintempleton.com
| | | | | | | | | |
| | | | | | FRANKLIN CUSTODIAN FUNDS | |
| | | | | | FINANCIAL STATEMENTS | |
| |
| |
| Statements of Operations | | | | | | | | | |
| for the year ended September 30, 2016 | | | | | | | | | |
| |
| | | Franklin | | | Franklin | | | Franklin | |
| | | DynaTech Fund | | | Growth Fund | | | Income Fund | |
| Investment income: | | | | | | | | | |
| Dividends | $ | 17,641,023 | | $ | 174,787,926 | | $ | 1,676,351,084 | |
| Interest: | | | | | | | | | |
| Unaffiliated issuers. | | 4,069 | | | — | | | 2,302,060,109 | |
| Non-controlled affiliates (Note 11) | | — | | | — | | | 40,697,633 | |
| Income from securities loaned (net of fees and rebates) | | — | | | — | | | 1,832,523 | |
| Total investment income | | 17,645,092 | | | 174,787,926 | | | 4,020,941,349 | |
| Expenses: | | | | | | | | | |
| Management fees (Note 3a) | | 13,528,447 | | | 52,715,134 | | | 289,406,332 | |
| Distribution fees: (Note 3c) | | | | | | | | | |
| Class A. | | 5,099,810 | | | 18,787,785 | | | 66,583,985 | |
| Class C. | | 3,049,215 | | | 8,284,192 | | | 152,709,254 | |
| Class R. | | 203,984 | | | 2,398,985 | | | 2,000,189 | |
| Transfer agent fees: (Note 3e) | | | | | | | | | |
| Class A. | | 3,517,646 | | | 12,477,747 | | | 36,649,959 | |
| Class C. | | 525,817 | | | 1,375,452 | | | 19,397,330 | |
| Class R. | | 70,343 | | | 796,539 | | | 330,282 | |
| Class R6 | | 1,238 | | | 3,626 | | | 5,781 | |
| Advisor Class | | 295,019 | | | 2,814,585 | | | 6,219,603 | |
| Custodian fees (Note 4) | | 44,902 | | | 164,967 | | | 1,087,305 | |
| Reports to shareholders | | 412,999 | | | 1,162,636 | | | 5,635,743 | |
| Registration and filing fees | | 166,557 | | | 356,442 | | | 1,081,965 | |
| Professional fees | | 62,038 | | | 149,420 | | | 1,329,104 | |
| Trustees’ fees and expenses | | 12,268 | | | 51,223 | | | 340,401 | |
| Other | | 50,883 | | | 176,753 | | | 1,801,431 | |
| Total expenses | | 27,041,166 | | | 101,715,486 | | | 584,578,664 | |
| Expense reductions (Note 4) | | — | | | (2,009 | ) | | (19,298 | ) |
| Expenses waived/paid by affiliates (Note 3f) | | (189,798 | ) | | (2,701,442 | ) | | (2,556,703 | ) |
| Net expenses | | 26,851,368 | | | 99,012,035 | | | 582,002,663 | |
| Net investment income (loss) | | (9,206,276 | ) | | 75,775,891 | | | 3,438,938,686 | |
| Realized and unrealized gains (losses): | | | | | | | | | |
| Net realized gain (loss) from: | | | | | | | | | |
| Investments: | | | | | | | | | |
| Unaffiliated issuers | | 61,035,852 | | | 403,654,378 | | | (1,277,851,422 | ) |
| Non-controlled affiliates (Note 11) | | — | | | — | | | (37,571,320 | ) |
| Written options | | — | | | — | | | 37,932,814 | |
| Foreign currency transactions | | (116,698 | ) | | (35,675 | ) | | (4,519,493 | ) |
| Net realized gain (loss) | | 60,919,154 | | | 403,618,703 | | | (1,282,009,421 | ) |
| Net change in unrealized appreciation (depreciation) on: | | | | | | | | | |
| Investments. | | 365,746,352 | | | 915,148,356 | | | 7,216,921,501 | |
| Translation of other assets and liabilities | | | | | | | | | |
| denominated in foreign currencies | | (677 | ) | | 25 | | | 216,569 | |
| Written options | | — | | | — | | | 8,569,692 | |
| Net change in unrealized appreciation (depreciation) | | 365,745,675 | | | 915,148,381 | | | 7,225,707,762 | |
| Net realized and unrealized gain (loss) | | 426,664,829 | | | 1,318,767,084 | | | 5,943,698,341 | |
| Net increase (decrease) in net assets resulting from operations | $ | 417,458,553 | | $ | 1,394,542,975 | | $ | 9,382,637,027 | |
franklintempleton.com
The accompanying notes are an integral part of these financial statements. | Annual Report 99
| | | | | | |
| FRANKLIN CUSTODIAN FUNDS | | | | | | |
| FINANCIAL STATEMENTS | | | | | | |
| |
| |
| Statements of Operations (continued) | | | | | | |
| for the year ended September 30, 2016 | | | | | | |
| |
| | | Franklin | | | | |
| | | U.S. Government | | | Franklin | |
| | | Securities Fund | | | Utilities Fund | |
| Investment income: | | | | | | |
| Dividends. | $ | — | | $ | 203,865,579 | |
| Interest | | 248,992,693 | | | 3,139,568 | |
| Paydown gain (loss) | | (57,369,365 | ) | | — | |
| Income from securities loaned (net of fees and rebates) | | — | | | 29,739 | |
| Total investment income. | | 191,623,328 | | | 207,034,886 | |
| Expenses: | | | | | | |
| Management fees (Note 3a) | | 29,371,710 | | | 26,817,731 | |
| Distribution fees: (Note 3c) | | | | | | |
| Class A | | 6,257,604 | | | 5,805,386 | |
| Class C | | 6,774,714 | | | 6,543,975 | |
| Class R | | 309,583 | | | 462,882 | |
| Transfer agent fees: (Note 3e) | | | | | | |
| Class A | | 5,632,889 | | | 4,243,976 | |
| Class C | | 1,385,805 | | | 1,103,970 | |
| Class R | | 82,509 | | | 101,511 | |
| Class R6 | | 1,664 | | | 4,254 | |
| Advisor Class | | 870,060 | | | 713,245 | |
| Custodian fees (Note 4) | | 54,226 | | | 76,414 | |
| Reports to shareholders | | 534,722 | | | 490,349 | |
| Registration and filing fees | | 242,648 | | | 214,539 | |
| Professional fees | | 92,159 | | | 89,523 | |
| Trustees’ fees and expenses | | 27,061 | | | 23,615 | |
| Other. | | 950,349 | | | 92,988 | |
| Total expenses | | 52,587,703 | | | 46,784,358 | |
| Expense reductions (Note 4) | | (2,039 | ) | | (48 | ) |
| Expenses waived/paid by affiliates (Note 3f) | | (454,798 | ) | | (165,413 | ) |
| Net expenses | | 52,130,866 | | | 46,618,897 | |
| Net investment income | | 139,492,462 | | | 160,415,989 | |
| Realized and unrealized gains (losses): | | | | | | |
| Net realized gain (loss) from: | | | | | | |
| Investments: | | | | | | |
| Unaffiliated issuers | | 10,586,197 | | | 20,153,099 | |
| Non-controlled affiliates (Note 11) | | — | | | (9,237,297 | ) |
| Foreign currency transactions | | — | | | (861,175 | ) |
| Net realized gain (loss) | | 10,586,197 | | | 10,054,627 | |
| Net change in unrealized appreciation (depreciation) on: | | | | | | |
| Investments | | (6,613,115 | ) | | 775,623,941 | |
| Translation of other assets and liabilities | | | | | | |
| denominated in foreign currencies | | — | | | 51,108 | |
| Net change in unrealized appreciation (depreciation) | | (6,613,115 | ) | | 775,675,049 | |
| Net realized and unrealized gain (loss) | | 3,973,082 | | | 785,729,676 | |
| Net increase (decrease) in net assets resulting from operations | $ | 143,465,544 | | $ | 946,145,665 | |
100 Annual Report | The accompanying notes are an integral part of these financial statements.
franklintempleton.com
| | | | | | | | | | | | |
| | | | | | | | | FRANKLIN CUSTODIAN FUNDS | |
| | | | | | | | | FINANCIAL STATEMENTS | |
| |
| |
| Statements of Changes in Net Assets | | | | | | | | | | | | |
| |
| | | Franklin DynaTech Fund | | | Franklin Growth Fund | |
| | | Year Ended September 30, | | | Year Ended September 30, | |
| | | 2016 | | | 2015 | | | 2016 | | | 2015 | |
| Increase (decrease) in net assets: | | | | | | | | | | | | |
| Operations: | | | | | | | | | | | | |
| Net investment income (loss) | $ | (9,206,276 | ) | $ | (11,245,962 | ) | $ | 75,775,891 | | $ | 45,073,798 | |
| Net realized gain (loss) | | 60,919,154 | | | 76,713,788 | | | 403,618,703 | | | 443,524,958 | |
| Net change in unrealized appreciation (depreciation) | | | | | | | | | | | | |
| | | 365,745,675 | | | (8,212,061 | ) | | 915,148,381 | | | (201,921,374 | ) |
| Net increase (decrease) in net assets resulting | | | | | | | | | | | | |
| from operations | | 417,458,553 | | | 57,255,765 | | | 1,394,542,975 | | | 286,677,382 | |
| Distributions to shareholders from: | | | | | | | | | | | | |
| Net investment income: | | | | | | | | | | | | |
| Class A. | | — | | | — | | | (47,314,338 | ) | | (17,701,413 | ) |
| Class R | | — | | | — | | | (1,070,343 | ) | | — | |
| Class R6. | | — | | | — | | | (13,934,302 | ) | | (7,173,435 | ) |
| Advisor Class | | — | | | — | | | (14,692,811 | ) | | (7,135,723 | ) |
| Net realized gains: | | | | | | | | | | | | |
| Class A. | | (50,280,433 | ) | | (52,815,773 | ) | | (236,451,446 | ) | | — | |
| Class C | | (8,550,949 | ) | | (8,572,795 | ) | | (27,988,492 | ) | | — | |
| Class R | | (1,147,436 | ) | | (1,588,330 | ) | | (15,909,617 | ) | | — | |
| Class R6. | | (9,395,944 | ) | | (11,564,117 | ) | | (38,078,959 | ) | | — | |
| Advisor Class | | (4,536,946 | ) | | (5,461,764 | ) | | (49,398,589 | ) | | — | |
| Total distributions to shareholders | | (73,911,708 | ) | | (80,002,779 | ) | | (444,838,897 | ) | | (32,010,571 | ) |
| Capital share transactions: (Note 2) | | | | | | | | | | | | |
| Class A. | | 22,189,136 | | | 370,383,990 | | | (162,965,732 | ) | | 411,335,990 | |
| Class C | | 15,466,910 | | | 64,529,697 | | | 6,510,834 | | | 105,104,211 | |
| Class R | | (8,874,020 | ) | | (2,196,266 | ) | | (63,665,280 | ) | | (82,225,233 | ) |
| Class R6. | | (47,875,928 | ) | | 18,888,470 | | | (12,272,599 | ) | | 26,817,282 | |
| Advisor Class | | 9,087,518 | | | 17,214,652 | | | 338,804,621 | | | 65,080,465 | |
| Total capital share transactions. | | (10,006,384 | ) | | 468,820,543 | | | 106,411,844 | | | 526,112,715 | |
| Net increase (decrease) in net assets | | 333,540,461 | | | 446,073,529 | | | 1,056,115,922 | | | 780,779,526 | |
| Net assets: | | | | | | | | | | | | |
| Beginning of year | | 2,710,248,152 | | | 2,264,174,623 | | | 11,142,901,919 | | | 10,362,122,393 | |
| End of year | $ | 3,043,788,613 | | $ | 2,710,248,152 | | $ | 12,199,017,841 | | $ | 11,142,901,919 | |
| Undistributed net investment income (loss) included in | | | | | | | | | | | | |
| net assets: | | | | | | | | | | | | |
| End of year | $ | (7,486,842 | ) | $ | (8,521,276 | ) | $ | 36,852,247 | | $ | 38,123,825 | |
franklintempleton.com
The accompanying notes are an integral part of these financial statements. | Annual Report 101
| | | | | | | | | | | | | | | |
| FRANKLIN CUSTODIAN FUNDS | | | | | | | | | | | | | | | |
| FINANCIAL STATEMENTS | | | | | | | | | | | | | | | |
| |
| |
| Statements of Changes in Net Assets (continued) | | | | | | | | | | | | | |
| |
| | | | Franklin Income Fund | | | Franklin U.S. Government Securities Fund | |
| | | | Year Ended September 30, | | | Year Ended September 30, | |
| | | | 2016 | | | | 2015 | | | 2016 | | | 2015 | |
| Increase (decrease) in net assets: | | | | | | | | | | | | | | | |
| Operations: | | | | | | | | | | | | | | | |
| Net investment income | $ | 3,438,938,686 | | $ | 3,915,982,068 | | $ | 139,492,462 | | $ | 143,482,204 | |
| Net realized gain (loss) | | (1,282,009,421 | ) | | (1,368,512,341 | ) | | 10,586,197 | | | | 6,672,945 | |
| Net change in unrealized appreciation | | | | | | | | | | | | | | | |
| (depreciation) | | 7,225,707,762 | | | (12,457,228,091 | ) | | (6,613,115 | ) | | | (22,546,828 | ) |
| Net increase (decrease) in net assets | | | | | | | | | | | | | | | |
| resulting from operations. | | 9,382,637,027 | | | (9,909,758,364 | ) | | 143,465,544 | | | 127,608,321 | |
| Distributions to shareholders from: | | | | | | | | | | | | | | | |
| Net investment income: | | | | | | | | | | | | | | | |
| Class A | | (2,485,275,665 | ) | | (2,619,399,527 | ) | | (131,450,457 | ) | | (139,163,796 | ) |
| Class C | | (1,181,223,007 | ) | | (1,251,131,091 | ) | | (27,370,513 | ) | | | (31,007,890 | ) |
| Class R | | (21,375,115 | ) | | | (23,492,505 | ) | | (1,712,479 | ) | | | (2,057,369 | ) |
| Class R6 | | (101,566,652 | ) | | | (106,712,525 | ) | | (16,335,592 | ) | | | (13,473,393 | ) |
| Advisor Class. | | (434,811,841 | ) | | | (475,823,657 | ) | | (21,257,710 | ) | | | (21,952,307 | ) |
| Total distributions to shareholders | | (4,224,252,280 | ) | | (4,476,559,305 | ) | | (198,126,751 | ) | | (207,654,755 | ) |
| Capital share transactions: (Note 2) | | | | | | | | | | | | | | | |
| Class A | | (2,328,656,181 | ) | | | (765,848,401 | ) | | 103,644,563 | | | (102,856,884 | ) |
| Class C | | (1,818,661,369 | ) | | | (331,371,839 | ) | | 3,123,563 | | | (136,825,329 | ) |
| Class R | | (46,109,223 | ) | | | (21,217,142 | ) | | (4,370,596 | ) | | | (8,900,898 | ) |
| Class R6 | | (116,842,625 | ) | | | (43,676,141 | ) | | 253,127,815 | | | (117,420,534 | ) |
| Advisor Class. | | (107,969,590 | ) | | | 96,674,297 | | | 102,139,643 | | | | (22,480,703 | ) |
| Total capital share transactions | | (4,418,238,988 | ) | | (1,065,439,226 | ) | | 457,664,988 | | | (388,484,348 | ) |
| Net increase (decrease) in net assets | | 740,145,759 | | | (15,451,756,895 | ) | | 403,003,781 | | | (468,530,782 | ) |
| Net assets: | | | | | | | | | | | | | | | |
| Beginning of year | | 78,893,610,699 | | | 94,345,367,594 | | | 6,270,605,068 | | | 6,739,135,850 | |
| End of year | $ | 79,633,756,458 | | $ | 78,893,610,699 | | $ | 6,673,608,849 | | $ | 6,270,605,068 | |
| Undistributed net investment income included | | | | | | | | | | | | | | | |
| in net assets: | | | | | | | | | | | | | | | |
| End of year | | $ | — | | | $ | 2,068,832 | | $ | 367,575 | | | $ | 294,091 | |
| Distributions in excess of net investment | | | | | | | | | | | | | | | |
| income included in net assets: | | | | | | | | | | | | | | | |
| End of year | $ | (70,346,158 | ) | | $ | — | | $ | — | | | $ | — | |
102 Annual Report | The accompanying notes are an integral part of these financial statements.
franklintempleton.com
| | | | | | |
| | | FRANKLIN CUSTODIAN FUNDS | |
| | | FINANCIAL STATEMENTS | |
| |
| |
| Statements of Changes in Net Assets (continued) | | | | | | |
| |
| | | Franklin Utilities Fund | |
| | | Year Ended September 30, | |
| | | 2016 | | | 2015 | |
| Increase (decrease) in net assets: | | | | | | |
| Operations: | | | | | | |
| Net investment income | $ | 160,415,989 | | $ | 164,273,927 | |
| Net realized gain (loss) | | 10,054,627 | | | 167,117,130 | |
| Net change in unrealized appreciation (depreciation) | | 775,675,049 | | | (215,469,865 | ) |
| Net increase (decrease) in net assets resulting from operations | | 946,145,665 | | | 115,921,192 | |
| Distributions to shareholders from: | | | | | | |
| Net investment income: | | | | | | |
| Class A | | (112,834,284 | ) | | (108,522,416 | ) |
| Class C | | (24,515,967 | ) | | (23,635,072 | ) |
| Class R | | (2,379,943 | ) | | (2,354,864 | ) |
| Class R6 | | (7,365,000 | ) | | (7,004,985 | ) |
| Advisor Class. | | (19,769,621 | ) | | (17,855,048 | ) |
| Net realized gains: | | | | | | |
| Class A | | (112,737,319 | ) | | (94,563,421 | ) |
| Class C | | (29,873,670 | ) | | (25,193,710 | ) |
| Class R | | (2,659,792 | ) | | (2,392,646 | ) |
| Class R6 | | (6,346,334 | ) | | (5,738,511 | ) |
| Advisor Class. | | (17,570,610 | ) | | (14,963,811 | ) |
| Total distributions to shareholders | | (336,052,540 | ) | | (302,224,484 | ) |
| Capital share transactions: (Note 2) | | | | | | |
| Class A | | 250,100,796 | | | (68,305,043 | ) |
| Class C | | 26,911,855 | | | (22,237,201 | ) |
| Class R | | 10,837,743 | | | (9,199,737 | ) |
| Class R6 | | (5,556,096 | ) | | (29,285,137 | ) |
| Advisor Class. | | 139,619,686 | | | 7,979,532 | |
| Total capital share transactions | | 421,913,984 | | | (121,047,586 | ) |
| Net increase (decrease) in net assets | | 1,032,007,109 | | | (307,350,878 | ) |
| Net assets: | | | | | | |
| Beginning of year | | 5,290,500,916 | | | 5,597,851,794 | |
| End of year | $ | 6,322,508,025 | | $ | 5,290,500,916 | |
| Undistributed net investment income included in net assets: | | | | | | |
| End of year | $ | 5,048,906 | | $ | 12,353,529 | |
franklintempleton.com
The accompanying notes are an integral part of these financial statements. | Annual Report 103
FRANKLIN CUSTODIAN FUNDS
Notes to Financial Statements
1. Organization and Significant Accounting Policies
Franklin Custodian Funds (Trust) is registered under the Investment Company Act of 1940 (1940 Act) as an open-end management investment company, consisting of six separate funds, five of which are included in this report (Funds) and applies the specialized accounting and reporting guidance in U.S. Generally Accepted Accounting Principles (U.S. GAAP). The financial statements of the remaining fund in the Trust are presented separately. The Funds offer five classes of shares: Class A, Class C, Class R, Class R6, and Advisor Class. Each class of shares differs by its initial sales load, contingent deferred sales charges, voting rights on matters affecting a single class, its exchange privilege and fees primarily due to differing arrangements for distribution and transfer agent fees.
The following summarizes the Funds’ significant accounting policies.
a. Financial Instrument Valuation
The Funds’ investments in financial instruments are carried at fair value daily. Fair value is the price that would be received to sell an asset or paid to transfer a liability in an orderly transaction between market participants on the measurement date. The Funds calculate the net asset value (NAV) per share as of 4 p.m. Eastern time each day the New York Stock Exchange (NYSE) is open for trading. Under compliance policies and procedures approved by the Trust’s Board of Trustees (the Board), the Funds’ administrator has responsibility for oversight of valuation, including leading the cross-functional Valuation Committee (VC). The VC provides administration and oversight of the Funds’ valuation policies and procedures, which are approved annually by the Board. Among other things, these procedures allow the Funds to utilize independent pricing services, quotations from securities and financial instrument dealers, and other market sources to determine fair value.
Equity securities and derivative financial instruments listed on an exchange or on the NASDAQ National Market System are valued at the last quoted sale price or the official closing price of the day, respectively. Foreign equity securities are valued as of the close of trading on the foreign stock exchange on which the security is primarily traded or as of 4 p.m. Eastern time, whichever is earlier. The value is then converted into its U.S. dollar equivalent at the foreign exchange rate in effect at 4 p.m. Eastern time on the day that the value of the security is determined. Over-the-counter (OTC) securities are valued within the range of the most recent quoted bid and ask prices. Securities that trade in multiple markets or on multiple exchanges are valued according to the broadest and most representative market. Certain equity securities are valued based upon fundamental characteristics or relationships to similar securities.
Debt securities generally trade in the OTC market rather than on a securities exchange. The Funds’ pricing services use multiple valuation techniques to determine fair value. In instances where sufficient market activity exists, the pricing services may utilize a market-based approach through which quotes from market makers are used to determine fair value. In instances where sufficient market activity may not exist or is limited, the pricing services also utilize proprietary valuation models which may consider market characteristics such as benchmark yield curves, credit spreads, estimated default rates, anticipated market interest rate volatility, coupon rates, anticipated timing of principal repayments, underlying collateral, and other unique security features in order to estimate the relevant cash flows, which are then discounted to calculate the fair value. Securities denominated in a foreign currency are converted into their U.S. dollar equivalent at the foreign exchange rate in effect at 4 p.m. Eastern time on the date that the values of the foreign debt securities are determined.
Investments in open-end mutual funds are valued at the closing NAV. Investments in repurchase agreements are valued at cost, which approximates fair value.
The Funds have procedures to determine the fair value of financial instruments for which market prices are not reliable or readily available. Under these procedures, the VC convenes on a regular basis to review such financial instruments and considers a number of factors, including significant unobservable valuation inputs, when arriving at fair value. The VC primarily employs a market-based approach which may use related or comparable assets or liabilities, recent transactions, market multiples, book values, and other relevant information for the investment to determine the fair value of the investment. An income-based valuation approach may also be used in which the anticipated future cash flows of the investment are discounted to calculate fair value. Discounts may also be applied due to the nature or duration of any restrictions on the disposition of the investments. Due to the inherent uncertainty of valuations of such investments, the fair values may differ significantly from the values that would have been used had an
104 Annual Report
franklintempleton.com
FRANKLIN CUSTODIAN FUNDS
NOTES TO FINANCIAL STATEMENTS
active market existed. The VC employs various methods for calibrating these valuation approaches including a regular review of key inputs and assumptions, transactional back-testing or disposition analysis, and reviews of any related market activity.
Trading in securities on foreign securities stock exchanges and OTC markets may be completed before 4 p.m. Eastern time. In addition, trading in certain foreign markets may not take place on every NYSE business day. Occasionally, events occur between the time at which trading in a foreign security is completed and the close of the NYSE that might call into question the reliability of the value of a portfolio security held by the Fund. As a result, differences may arise between the value of the Funds’ portfolio securities as determined at the foreign market close and the latest indications of value at the close of the NYSE. In order to minimize the potential for these differences, the VC monitors price movements following the close of trading in foreign stock markets through a series of country specific market proxies (such as baskets of American Depositary Receipts, futures contracts and exchange traded funds). These price movements are measured against established trigger thresholds for each specific market proxy to assist in determining if an event has occurred that may call into question the reliability of the values of the foreign securities held by the Funds. If such an event occurs, the securities may be valued using fair value procedures, which may include the use of independent pricing services.
When the last day of the reporting period is a non-business day, certain foreign markets may be open on those days that the NYSE is closed, which could result in differences between the value of the Funds’ portfolio securities on the last business day and the last calendar day of the reporting period. Any significant security valuation changes due to an open foreign market are adjusted and reflected by the Funds for financial reporting purposes.
b. Foreign Currency Translation
Portfolio securities and other assets and liabilities denominated in foreign currencies are translated into U.S. dollars based on the exchange rate of such currencies against U.S. dollars on the date of valuation. The Funds may enter into foreign currency exchange contracts to facilitate transactions denominated in a foreign currency. Purchases and sales of securities, income and expense items denominated in foreign currencies are translated into U.S. dollars at the exchange rate in effect on the transaction date. Portfolio securities and assets and liabilities denominated in foreign currencies contain risks that those currencies will decline in value relative to the U.S. dollar. Occasionally, events may impact the availability or reliability of foreign exchange rates used to convert the U.S. dollar equivalent value. If such an event occurs, the foreign exchange rate will be valued at fair value using procedures established and approved by the Board.
The Funds do not separately report the effect of changes in foreign exchange rates from changes in market prices on securities held. Such changes are included in net realized and unrealized gain or loss from investments in the Statements of Operations.
Realized foreign exchange gains or losses arise from sales of foreign currencies, currency gains or losses realized between the trade and settlement dates on securities transactions and the difference between the recorded amounts of dividends, interest, and foreign withholding taxes and the U.S. dollar equivalent of the amounts actually received or paid. Net unrealized foreign exchange gains and losses arise from changes in foreign exchange rates on foreign denominated assets and liabilities other than investments in securities held at the end of the reporting period.
c. Joint Repurchase Agreement
Certain or all Funds enter into a joint repurchase agreement whereby their uninvested cash balance is deposited into a joint cash account with other funds managed by the investment manager or an affiliate of the investment manager and is used to invest in one or more repurchase agreements. The value and face amount of the joint repurchase agreement are allocated to the funds based on their pro-rata interest. A repurchase agreement is accounted for as a loan by the Fund to the seller, collateralized by securities which are delivered to the Funds’ custodian. The fair value, including accrued interest, of the initial collateralization is required to be at least 102% of the dollar amount invested by the funds, with the value of the underlying securities marked to market daily to maintain coverage of at least 100%. Repurchase agreements are subject to the terms of Master Repurchase Agreements (MRAs) with approved counterparties (sellers). The MRAs contain various provisions, including but not limited to events of default and maintenance of collateral for repurchase agreements. In the event of default by either the seller or the Funds, certain MRAs may permit the non-defaulting party to net and close-out all transactions, if any, traded under such agreements. The Funds
franklintempleton.com
Annual Report
105
FRANKLIN CUSTODIAN FUNDS
NOTES TO FINANCIAL STATEMENTS
1. Organization and Significant Accounting
Policies (continued)
c. Joint Repurchase Agreement (continued)
may sell securities it holds as collateral and apply the proceeds towards the repurchase price and any other amounts owed by the seller to the Funds in the event of default by the seller. This could involve costs or delays in addition to a loss on the securities if their value falls below the repurchase price owed by the seller. The joint repurchase agreement held by the Funds at year end, as indicated in the Statements of Investments, had been entered into on September 30, 2016.
d. Securities Purchased on a When-Issued or Delayed Delivery Basis
Certain or all Funds purchase securities on a when-issued or delayed delivery basis, with payment and delivery scheduled for a future date. These transactions are subject to market fluctuations and are subject to the risk that the value at delivery may be more or less than the trade date purchase price. Although the Funds will generally purchase these securities with the intention of holding the securities, they may sell the securities before the settlement date. Sufficient assets have been segregated for these securities.
e. Derivative Financial Instruments
Certain or all Funds invested in derivative financial instruments in order to manage risk or gain exposure to various other investments or markets. Derivatives are financial contracts based on an underlying or notional amount, require no initial investment or an initial net investment that is smaller than would normally be required to have a similar response to changes in market factors, and require or permit net settlement. Derivatives contain various risks including the potential inability of the counterparty to fulfill their obligations under the terms of the contract, the potential for an illiquid secondary market, and/or the potential for market movements which expose the Fund to gains or losses in excess of the amounts shown in the Statements of Assets and Liabilities. Realized gain and loss and unrealized appreciation and depreciation on these contracts for the period are included in the Statements of Operations.
Collateral requirements differ by type of derivative. Collateral or initial margin requirements are set by the broker or exchange clearing house for exchange traded and centrally cleared derivatives. Initial margin deposited is held at the exchange and can be in the form of cash and/or securities.
Certain or all Funds purchased or wrote exchange traded option contracts primarily to manage exposure to equity price risk. An option is a contract entitling the holder to purchase or sell a specific amount of shares or units of an asset or notional amount of a swap (swaption), at a specified price. When an option is purchased or written, an amount equal to the premium paid or received is recorded as an asset or liability, respectively. Upon exercise of an option, the acquisition cost or sales proceeds of the underlying investment is adjusted by any premium received or paid. Upon expiration of an option, any premium received or paid is recorded as a realized gain or loss. Upon closing an option other than through expiration or exercise, the difference between the premium received or paid and the cost to close the position is recorded as a realized gain or loss.
See Notes 6 and 10 regarding investment transactions and other derivative information, respectively.
f. Equity-Linked Securities
Certain or all Funds invest in equity-linked securities. Equity-linked securities are hybrid financial instruments that generally combine both debt and equity characteristics into a single note form. Income received from equity-linked securities is recorded as realized gains in the Statements of Operations and may be based on the performance of an underlying equity security, an equity index, or an option position. The risks of investing in equity-linked securities include unfavorable price movements in the underlying security and the credit risk of the issuing financial institution. There may be no guarantee of a return of principal with equity-linked securities and the appreciation potential may be limited. Equity-linked securities may be more volatile and less liquid than other investments held by the Funds.
g. Securities Lending
Certain or all Funds participate in an agency based securities lending program to earn additional income. The Fund receives cash collateral against the loaned securities in an amount equal to at least 102% of the fair value of the loaned securities. Collateral is maintained over the life of the loan in an amount not less than 100% of the fair value of loaned securities, as
106 Annual Report
franklintempleton.com
FRANKLIN CUSTODIAN FUNDS
NOTES TO FINANCIAL STATEMENTS
determined at the close of Fund business each day; any additional collateral required due to changes in security values is delivered to the Fund on the next business day. The collateral is deposited into a joint cash account with other funds and is used to invest in a money market fund managed by Franklin Advisers, Inc., an affiliate of the Funds, and/or a joint repurchase agreement. The Fund may receive income from the investment of cash collateral, in addition to lending fees and rebates paid by the borrower. Income from securities loaned, net of fees paid to the securities lending agent and/or third-party vendor, is reported separately in the Statements of Operations. The Fund bears the market risk with respect to the collateral investment, securities loaned, and the risk that the agent may default on its obligations to the Fund. If the borrower defaults on its obligation to return the securities loaned, the Fund has the right to repurchase the securities in the open market using the collateral received. The securities lending agent has agreed to indemnify the Fund in the event of default by a third party borrower.
h. Mortgage Dollar Rolls
Certain or all Funds enter into mortgage dollar rolls, typically on a to-be-announced basis. Mortgage dollar rolls are agreements between the Fund and a financial institution where the Fund sells (or buys) mortgage-backed securities for delivery on a specified date and simultaneously contracts to repurchase (or sell) substantially similar (same type, coupon, and maturity) securities at a future date and at a predetermined price. Gains or losses are realized on the initial sale, and the difference between the repurchase price and the sale price is recorded as an unrealized gain or loss to the Fund upon entering into the mortgage dollar roll. In addition, the Fund may invest the cash proceeds that are received from the initial sale. During the period between the sale and repurchase, the Fund is not entitled to principal and interest paid on the mortgage backed securities. Transactions in mortgage dollar rolls are accounted for as purchases and sales and may result in an increase to the Fund’s portfolio turnover rate. The risks of mortgage dollar roll transactions include the potential inability of the counterparty to fulfill its obligations.
i. Senior Floating Rate Interests
Certain or all Funds invest in senior secured corporate loans that pay interest at rates which are periodically reset by reference to a base lending rate plus a spread. These base lending rates are generally the prime rate offered by a designated U.S. bank or the London InterBank Offered Rate (LIBOR). Senior secured corporate loans often require prepayment of principal from excess cash flows or at the discretion of the borrower. As a result, actual maturity may be substantially less than the stated maturity. Senior secured corporate loans in which the Funds invest are generally readily marketable, but may be subject to certain restrictions on resale.
j. Income and Deferred Taxes
It is each Fund’s policy to qualify as a regulated investment company under the Internal Revenue Code. Each Fund intends to distribute to shareholders substantially all of its taxable income and net realized gains to relieve it from federal income and excise taxes. As a result, no provision for U.S. federal income taxes is required.
The Funds may be subject to foreign taxation related to income received, capital gains on the sale of securities and certain foreign currency transactions in the foreign jurisdictions in which the Funds invest. Foreign taxes, if any, are recorded based on the tax regulations and rates that exist in the foreign markets in which the Funds invest. When a capital gain tax is determined to apply, certain or all Funds record an estimated deferred tax liability in an amount that would be payable if the securities were disposed of on the valuation date. As a result of several court cases, in certain countries across the European Union, certain or all Funds filed additional tax reclaims for previously withheld taxes on dividends earned in those countries (EU reclaims). These additional filings are subject to various administrative proceedings by the local jurisdictions’ tax authorities within the European Union, as well as a number of related judicial proceedings. Income recognized, if any, for EU reclaims is reflected as other income in the Statements of Operations and any related receivable, if any, is reflected as European Union tax reclaims in the Statements of Assets and Liabilities. When uncertainty exists as to the ultimate resolution of these proceedings, the likelihood of receipt of these EU reclaims, and the potential timing of payment, no amounts are reflected in the financial statements.
Each Fund may recognize an income tax liability related to its uncertain tax positions under U.S. GAAP when the uncertain tax position has a less than 50% probability that it will be sustained upon examination by the tax authorities based on its technical merits. As of September 30, 2016, each Fund has determined that no tax liability is required in its financial statements related to uncertain tax positions for any open tax
franklintempleton.com
Annual Report
107
FRANKLIN CUSTODIAN FUNDS
NOTES TO FINANCIAL STATEMENTS
1. Organization and Significant Accounting
Policies (continued)
j. Income and Deferred Taxes (continued)
years (or expected to be taken in future tax years). Open tax years are those that remain subject to examination and are based on each tax jurisdiction’s statute of limitation.
k. Security Transactions, Investment Income, Expenses and Distributions
Security transactions are accounted for on trade date. Realized gains and losses on security transactions are determined on a specific identification basis. Interest income and estimated expenses are accrued daily. Amortization of premium and accretion of discount on debt securities are included in interest income. Paydown gains and losses are recorded separately in the Statements of Operations. Facility fees are recognized as income over the expected term of the loan. Dividend income is recorded on the ex-dividend date except for certain dividends from securities where the dividend rate is not available. In such cases, the dividend is recorded as soon as the information is received by the Funds. Distributions to shareholders are recorded on the ex-dividend date and are determined according to income tax regulations (tax basis). Distributable earnings determined on a tax basis may differ from earnings recorded in accordance with U.S. GAAP. These differences may be permanent or temporary. Permanent differences are reclassified among capital accounts to reflect their tax character. These reclassifications have no impact on net assets or the results of operations. Temporary differences are not reclassified, as they may reverse in subsequent periods.
Common expenses incurred by the Trust are allocated among the Funds based on the ratio of net assets of each Fund to the combined net assets of the Trust. Fund specific expenses are charged directly to the Fund that incurred the expense.
Realized and unrealized gains and losses and net investment income, not including class specific expenses, are allocated daily to each class of shares based upon the relative proportion of net assets of each class. Differences in per share distributions, by class, are generally due to differences in class specific expenses.
l. Accounting Estimates
The preparation of financial statements in accordance with U.S. GAAP requires management to make estimates and assumptions that affect the reported amounts of assets and liabilities at the date of the financial statements and the amounts of income and expenses during the reporting period. Actual results could differ from those estimates.
m. Guarantees and Indemnifications
Under the Trust’s organizational documents,its officers and trustees are indemnified by the Trust against certain liabilities arising out of the performance of their duties to the Trust. Additionally, in the normal course of business, the Trust, on behalf of the Funds, enters into contracts with service providers that contain general indemnification clauses. The Trust’s maximum exposure under these arrangements is unknown as this would involve future claims that may be made against the Trust that have not yet occurred. Currently, the Trust expect the risk of loss to be remote.
108 Annual Report
franklintempleton.com
FRANKLIN CUSTODIAN FUNDS
NOTES TO FINANCIAL STATEMENTS
2. Shares of Beneficial Interest
At September 30, 2016, there were an unlimited number of shares authorized (without par value). Transactions in the Funds’ shares were as follows:
| | | | | | | | | | | | |
| | Franklin DynaTech | | Franklin Growth | |
| | | Fund | | Fund | |
| | Shares | | | | Amount | | Shares | | | | Amount | |
| Class A Shares: | | | | | | | | | | | | |
| Year ended September 30, 2016 | | | | | | | | | | | | |
| Shares sold. | 11,719,604 | | $ | 557,476,346 | | 14,730,591 | | $ | 1,091,538,193 | |
| Shares issued in reinvestment of distributions | 934,047 | | | | 46,730,383 | | 3,458,561 | | | | 261,017,574 | |
| Shares issued on reorganization (Note 12) | — | | | | — | | 314,663 | | | | 18,982,031 | |
| Shares redeemed | (12,214,975 | ) | | | (582,017,593 | ) | (20,629,135 | ) | | | (1,534,503,530 | ) |
| Net increase (decrease) | 438,676 | | | $ | 22,189,136 | | (2,125,320 | ) | | $ | (162,965,732 | ) |
| Year ended September 30, 2015 | | | | | | | | | | | | |
| Shares sold. | 18,501,749 | | $ | 892,063,000 | | 21,692,171 | | $ | 1,636,207,846 | |
| Shares issued in reinvestment of distributions | 1,036,739 | | | | 48,011,508 | | 215,218 | | | | 16,016,600 | |
| Shares redeemed | (11,831,219 | ) | | | (569,690,518 | ) | (16,414,655 | ) | | | (1,240,888,456 | ) |
| Net increase (decrease) | 7,707,269 | | $ | 370,383,990 | | 5,492,734 | | | $ | 411,335,990 | |
| Class C Shares: | | | | | | | | | | | | |
| Year ended September 30, 2016 | | | | | | | | | | | | |
| Shares sold. | 2,087,492 | | | $ | 85,801,474 | | 2,416,582 | | | $ | 166,119,695 | |
| Shares issued in reinvestment of distributions | 187,219 | | | | 8,097,222 | | 364,920 | | | | 25,617,358 | |
| Shares issued on reorganization (Note 12) | — | | | | — | | 57,203 | | | | 3,204,287 | |
| Shares redeemed | (1,917,133 | ) | | | (78,431,786 | ) | (2,748,828 | ) | | | (188,430,506 | ) |
| Net increase (decrease) | 357,578 | | | $ | 15,466,910 | | 89,877 | | | $ | 6,510,834 | |
| Year ended September 30, 2015 | | | | | | | | | | | | |
| Shares sold. | 2,327,658 | | | $ | 98,622,323 | | 3,260,956 | | | $ | 229,365,295 | |
| Shares issued in reinvestment of distributions | 197,997 | | | | 8,016,890 | | — | | | | — | |
| Shares redeemed | (1,005,267 | ) | | | (42,109,516 | ) | (1,761,541 | ) | | | (124,261,084 | ) |
| Net increase (decrease) | 1,520,388 | | | $ | 64,529,697 | | 1,499,415 | | | $ | 105,104,211 | |
| Class R Shares: | | | | | | | | | | | | |
| Year ended September 30, 2016 | | | | | | | | | | | | |
| Shares sold. | 165,591 | | | $ | 7,698,887 | | 922,209 | | | $ | 67,929,360 | |
| Shares issued in reinvestment of distributions | 23,085 | | | | 1,131,862 | | 220,024 | | | | 16,556,807 | |
| Shares issued on reorganization (Note 12) | — | | | | — | | 137 | | | | 7,135 | |
| Shares redeemed | (377,470 | ) | | | (17,704,769 | ) | (2,012,219 | ) | | | (148,158,582 | ) |
| Net increase (decrease) | (188,794 | ) | | $ | (8,874,020 | ) | (869,849 | ) | | $ | (63,665,280 | ) |
| Year ended September 30, 2015 | | | | | | | | | | | | |
| Shares sold. | 176,420 | | | $ | 8,339,480 | | 1,222,443 | | | $ | 91,843,479 | |
| Shares issued in reinvestment of distributions | 34,518 | | | | 1,571,239 | | — | | | | — | |
| Shares redeemed | (256,145 | ) | | | (12,106,985 | ) | (2,319,903 | ) | | | (174,068,712 | ) |
| Net increase (decrease) | (45,207 | ) | | $ | (2,196,266 | ) | (1,097,460 | ) | | $ | (82,225,233 | ) |
franklintempleton.com
Annual Report
109
| | | | | | | | | | | | |
| FRANKLIN CUSTODIAN FUNDS | | | | | | | | | | | | |
| NOTES TO FINANCIAL STATEMENTS | | | | | | | | | | | | |
| |
| |
| |
| |
| 2. Shares of Beneficial Interest (continued) | | | | | | | | | | | | |
| |
| | Franklin DynaTech | | Franklin Growth | |
| | | Fund | | Fund | | |
| | Shares | | | | Amount | | Shares | | | | Amount | |
| Class R6 Shares: | | | | | | | | | | | | |
| Year ended September 30, 2016 | | | | | | | | | | | | |
| Shares sold. | 1,005,677 | | | $ | 48,126,111 | | 2,209,612 | | | $ | 166,757,883 | |
| Shares issued in reinvestment of distributions | 183,157 | | | | 9,395,944 | | 637,359 | | | | 48,088,702 | |
| Shares redeemed | (2,168,287 | ) | | | (105,397,983 | ) | (3,013,600 | ) | | | (227,119,184 | ) |
| Net increase (decrease) | (979,453 | ) | $ | (47,875,928 | ) | (166,629 | ) | | $ | (12,272,599 | ) |
| Year ended September 30, 2015 | | | | | | | | | | | | |
| Shares sold. | 498,228 | | | $ | 24,243,849 | | 1,852,609 | | | $ | 140,977,540 | |
| Shares issued in reinvestment of distributions | 244,640 | | | | 11,564,117 | | 88,714 | | | | 6,605,680 | |
| Shares redeemed | (341,976 | ) | | | (16,919,496 | ) | (1,593,869 | ) | | | (120,765,938 | ) |
| Net increase (decrease) | 400,892 | | | $ | 18,888,470 | | 347,454 | | | $ | 26,817,282 | |
| Advisor Class Shares: | | | | | | | | | | | | |
| Year ended September 30, 2016 | | | | | | | | | | | | |
| Shares sold. | 2,188,873 | | $ | 109,144,348 | | 6,862,211 | | | $ | 545,996,733 | |
| Shares issued in reinvestment of distributions | 84,067 | | | | 4,294,126 | | 801,298 | | | | 60,554,117 | |
| Shares issued on reorganization (Note 12) | — | | | | — | | 2,254,565 | | | | 136,327,485 | |
| Shares redeemed | (2,202,327 | ) | | | (104,350,956 | ) | (5,398,462 | ) | | | (404,073,714 | ) |
| Net increase (decrease) | 70,613 | | | $ | 9,087,518 | | 4,519,612 | | | $ | 338,804,621 | |
| Year ended September 30, 2015 | | | | | | | | | | | | |
| Shares sold. | 1,507,866 | | | $ | 73,683,045 | | 5,277,961 | | | $ | 400,540,494 | |
| Shares issued in reinvestment of distributions | 109,767 | | | | 5,174,431 | | 89,253 | | | | 6,652,935 | |
| Shares redeemed | (1,264,457 | ) | | | (61,642,824 | ) | (4,525,051 | ) | | | (342,112,964 | ) |
| Net increase (decrease) | 353,176 | | | $ | 17,214,652 | | 842,163 | | | $ | 65,080,465 | |
| |
| | Franklin Income | | Franklin U.S. Government | |
| | Fund | | | Securities Fund | |
| | Shares | | | | Amount | | Shares | | | | Amount | |
| Class A Shares: | | | | | | | | | | | | |
| Year ended September 30, 2016 | | | | | | | | | | | | |
| Shares sold | 2,296,688,306 | | $ | 4,899,239,525 | | 129,588,253 | | $ | 826,285,803 | |
| Shares issued in reinvestment of distributions | 1,066,919,722 | | | 2,280,635,347 | | 17,544,573 | | | | 111,672,956 | |
| Shares redeemed | (4,454,843,889 | ) | | (9,508,531,053 | ) | (130,888,179 | ) | | | (834,314,196 | ) |
| Net increase (decrease) | (1,091,235,861 | ) | $ | (2,328,656,181 | ) | 16,244,647 | | $ | 103,644,563 | |
| Year ended September 30, 2015 | | | | | | | | | | | | |
| Shares sold | 2,723,862,225 | | $ | 6,464,708,282 | | 99,038,940 | | $ | 641,302,319 | |
| Shares issued in reinvestment of distributions | 990,884,317 | | | 2,344,531,358 | | 17,899,302 | | | | 115,836,536 | |
| Shares redeemed | (4,082,116,553 | ) | | (9,575,088,041 | ) | (132,675,658 | ) | | | (859,995,739 | ) |
| Net increase (decrease) | (367,370,011 | ) | | $ | (765,848,401 | ) | (15,737,416 | ) | $ | (102,856,884 | ) |
110 Annual Report
franklintempleton.com
| | | | | | | | | | |
| | | | | FRANKLIN CUSTODIAN FUNDS | |
| | | | | NOTES TO FINANCIAL STATEMENTS | |
| |
| |
| |
| |
| | Franklin Income | | Franklin U.S. Government | |
| | Fund | | Securities Fund | |
| | Shares | | | Amount | | Shares | | | Amount | |
| Class C Shares: | | | | | | | | | | |
| Year ended September 30, 2016 | | | | | | | | | | |
| Shares sold | 1,068,954,930 | | $ | 2,309,517,092 | | 36,439,976 | | $ | 230,732,462 | |
| Shares issued in reinvestment of distributions | 475,083,681 | | | 1,027,055,245 | | 3,842,286 | | | 24,293,961 | |
| Shares redeemed | (2,389,581,028 | ) | | (5,155,233,706 | ) | (39,789,996 | ) | | (251,902,860 | ) |
| Net increase (decrease) | (845,542,417 | ) | $ | (1,818,661,369 | ) | 492,266 | | $ | 3,123,563 | |
| Year ended September 30, 2015 | | | | | | | | | | |
| Shares sold | 1,515,518,749 | | $ | 3,644,318,312 | | 21,009,366 | | $ | 135,074,176 | |
| Shares issued in reinvestment of distributions | 444,186,624 | | | 1,062,744,412 | | 4,258,005 | | | 27,388,271 | |
| Shares redeemed | (2,129,021,084 | ) | | (5,038,434,563 | ) | (46,483,636 | ) | | (299,287,776 | ) |
| Net increase (decrease) | (169,315,711 | ) | $ | (331,371,839 | ) | (21,216,265 | ) | $ | (136,825,329 | ) |
| Class R Shares: | | | | | | | | | | |
| Year ended September 30, 2016 | | | | | | | | | | |
| Shares sold | 32,442,666 | | $ | 68,219,741 | | 4,014,644 | | $ | 25,582,929 | |
| Shares issued in reinvestment of distributions | 9,659,507 | | | 20,294,130 | | 256,237 | | | 1,629,788 | |
| Shares redeemed | (64,184,548 | ) | | (134,623,094 | ) | (4,958,227 | ) | | (31,583,313 | ) |
| Net increase (decrease) | (22,082,375 | ) | $ | (46,109,223 | ) | (687,346 | ) | $ | (4,370,596 | ) |
| Year ended September 30, 2015 | | | | | | | | | | |
| Shares sold | 45,090,049 | | $ | 105,356,612 | | 2,921,544 | | $ | 18,930,156 | |
| Shares issued in reinvestment of distributions | 9,620,381 | | | 22,391,889 | | 304,019 | | | 1,967,188 | |
| Shares redeemed | (64,261,612 | ) | | (148,965,643 | ) | (4,600,896 | ) | | (29,798,242 | ) |
| Net increase (decrease) | (9,551,182 | ) | $ | (21,217,142 | ) | (1,375,333 | ) | $ | (8,900,898 | ) |
| Class R6 Shares: | | | | | | | | | | |
| Year ended September 30, 2016 | | | | | | | | | | |
| Shares sold | 27,601,182 | | $ | 58,603,240 | | 56,484,578 | | $ | 361,101,116 | |
| Shares issued in reinvestment of distributions | 45,946,719 | | | 97,311,080 | | 2,472,810 | | | 15,785,553 | |
| Shares redeemed | (130,160,220 | ) | | (272,756,945 | ) | (19,368,048 | ) | | (123,758,854 | ) |
| Net increase (decrease) | (56,612,319 | ) | $ | (116,842,625 | ) | 39,589,340 | | $ | 253,127,815 | |
| Year ended September 30, 2015 | | | | | | | | | | |
| Shares sold | 17,167,618 | | $ | 40,192,542 | | 14,239,234 | | $ | 92,767,162 | |
| Shares issued in reinvestment of distributions | 43,733,583 | | | 102,667,315 | | 1,973,225 | | | 12,808,747 | |
| Shares redeemed | (81,471,526 | ) | | (186,535,998 | ) | (34,161,637 | ) | | (222,996,443 | ) |
| Net increase (decrease) | (20,570,325 | ) | $ | (43,676,141 | ) | (17,949,178 | ) | $ | (117,420,534 | ) |
| Advisor Class Shares: | | | | | | | | | | |
| Year ended September 30, 2016 | | | | | | | | | | |
| Shares sold | 1,067,594,317 | | $ | 2,275,707,421 | | 40,939,883 | | $ | 261,734,567 | |
| Shares issued in reinvestment of distributions | 178,298,784 | | | 377,867,092 | | 2,904,764 | | | 18,546,418 | |
| Shares redeemed | (1,308,652,167 | ) | | (2,761,544,103 | ) | (27,863,916 | ) | | (178,141,342 | ) |
| Net increase (decrease) | (62,759,066 | ) | $ | (107,969,590 | ) | 15,980,731 | | $ | 102,139,643 | |
| Year ended September 30, 2015 | | | | | | | | | | |
| Shares sold | 1,046,052,890 | | $ | 2,467,625,168 | | 27,570,106 | | $ | 179,399,346 | |
| Shares issued in reinvestment of distributions | 173,756,747 | | | 407,768,104 | | 2,960,236 | | | 19,220,147 | |
| Shares redeemed | (1,200,237,331 | ) | | (2,778,718,975 | ) | (33,965,158 | ) | | (221,100,196 | ) |
| Net increase (decrease) | 19,572,306 | | $ | 96,674,297 | | (3,434,816 | ) | $ | (22,480,703 | ) |
franklintempleton.com
Annual Report
111
FRANKLIN CUSTODIAN FUNDS
NOTES TO FINANCIAL STATEMENTS
| | | | | | |
| 2. Shares of Beneficial Interest (continued) | | | | | | |
| |
| | Franklin Utilities | |
| | | Fund | |
| | Shares | | | | Amount | |
| Class A Shares: | | | | | | |
| Year ended September 30, 2016 | | | | | | |
| Shares sold | 50,469,532 | | $ | 868,419,143 | |
| Shares issued in reinvestment of distributions. | 13,069,421 | | | | 208,694,820 | |
| Shares redeemed | (48,540,425 | ) | | | (827,013,167 | ) |
| Net increase (decrease) | 14,998,528 | | $ | 250,100,796 | |
| Year ended September 30, 2015 | | | | | | |
| Shares sold | 42,258,371 | | $ | 726,023,381 | |
| Shares issued in reinvestment of distributions. | 10,958,781 | | | | 185,109,264 | |
| Shares redeemed | (58,276,559 | ) | | | (979,437,688 | ) |
| Net increase (decrease) | (5,059,407 | ) | | $ | (68,305,043 | ) |
| Class C Shares: | | | | | | |
| Year ended September 30, 2016 | | | | | | |
| Shares sold | 10,472,053 | | $ | 177,587,549 | |
| Shares issued in reinvestment of distributions. | 2,911,810 | | | | 46,120,996 | |
| Shares redeemed | (11,691,443 | ) | | | (196,796,690 | ) |
| Net increase (decrease) | 1,692,420 | | | $ | 26,911,855 | |
| Year ended September 30, 2015 | | | | | | |
| Shares sold | 9,428,768 | | $ | 161,040,132 | |
| Shares issued in reinvestment of distributions. | 2,420,296 | | | | 40,798,650 | |
| Shares redeemed | (13,401,139 | ) | | | (224,075,983 | ) |
| Net increase (decrease) | (1,552,075 | ) | | $ | (22,237,201 | ) |
| Class R Shares: | | | | | | |
| Year ended September 30, 2016 | | | | | | |
| Shares sold | 2,558,079 | | | $ | 44,212,218 | |
| Shares issued in reinvestment of distributions. | 307,591 | | | | 4,887,986 | |
| Shares redeemed | (2,256,335 | ) | | | (38,262,461 | ) |
| Net increase (decrease) | 609,335 | | | $ | 10,837,743 | |
| Year ended September 30, 2015 | | | | | | |
| Shares sold | 2,047,309 | | | $ | 34,931,594 | |
| Shares issued in reinvestment of distributions. | 272,659 | | | | 4,601,120 | |
| Shares redeemed | (2,904,134 | ) | | | (48,732,451 | ) |
| Net increase (decrease) | (584,166 | ) | | $ | (9,199,737 | ) |
| Class R6 Shares: | | | | | | |
| Year ended September 30, 2016 | | | | | | |
| Shares sold | 4,569,794 | | | $ | 80,441,620 | |
| Shares issued in reinvestment of distributions. | 849,533 | | | | 13,711,334 | |
| Shares redeemed | (5,632,978 | ) | | | (99,709,050 | ) |
| Net increase (decrease) | (213,651 | ) | | $ | (5,556,096 | ) |
| Year ended September 30, 2015 | | | | | | |
| Shares sold | 1,511,769 | | | $ | 26,223,112 | |
| Shares issued in reinvestment of distributions. | 749,780 | | | | 12,743,496 | |
| Shares redeemed | (4,004,853 | ) | | | (68,251,745 | ) |
| Net increase (decrease) | (1,743,304 | ) | | $ | (29,285,137 | ) |
112 Annual Report
franklintempleton.com
FRANKLIN CUSTODIAN FUNDS
NOTES TO FINANCIAL STATEMENTS
| | | | | |
| | Franklin Utilities | |
| | | Fund | |
| | Shares | | | Amount | |
| Advisor Class Shares: | | | | | |
| Year ended September 30, 2016 | | | | | |
| Shares sold | 17,376,033 | | $ | 302,116,278 | |
| Shares issued in reinvestment of distributions. | 2,161,976 | | | 34,915,765 | |
| Shares redeemed | (11,446,675 | ) | | (197,412,357 | ) |
| Net increase (decrease) | 8,091,334 | | $ | 139,619,686 | |
| Year ended September 30, 2015 | | | | | |
| Shares sold | 11,264,405 | | $ | 194,715,849 | |
| Shares issued in reinvestment of distributions. | 1,799,910 | | | 30,585,241 | |
| Shares redeemed | (12,829,193 | ) | | (217,321,558 | ) |
| Net increase (decrease) | 235,122 | | $ | 7,979,532 | |
3. Transactions with Affiliates
Franklin Resources, Inc. is the holding company for various subsidiaries that together are referred to as Franklin Templeton Investments. Certain officers and trustees of the Trust are also officers and/or directors of the following subsidiaries:
| |
| Subsidiary | Affiliation |
| Franklin Advisers, Inc. (Advisers) | Investment manager |
| Franklin Templeton Services, LLC (FT Services) | Administrative manager |
| Franklin Templeton Distributors, Inc. (Distributors) | Principal underwriter |
| Franklin Templeton Investor Services, LLC (Investor Services) | Transfer agent |
a. Management Fees
Franklin Income Fund and Franklin Utilities Fund pay an investment management fee to Advisers based on the month-end net assets of each of the Funds as follows:
| | |
| Annualized Fee Rate | | Net Assets |
| 0.625 | % | Up to and including $100 million |
| 0.500 | % | Over $100 million, up to and including $250 million |
| 0.450 | % | Over $250 million, up to and including $7.5 billion |
| 0.440 | % | Over $7.5 billion, up to and including $10 billion |
| 0.430 | % | Over $10 billion, up to and including $12.5 billion |
| 0.420 | % | Over $12.5 billion, up to and including $15 billion |
| 0.400 | % | Over $15 billion, up to and including $17.5 billion |
| 0.380 | % | Over $17.5 billion, up to and including $20 billion |
| 0.360 | % | Over $20 billion, up to and including $35 billion |
| 0.355 | % | Over $35 billion, up to and including $50 billion |
| 0.350 | % | Over $50 billion, up to and including $65 billion |
| 0.345 | % | Over $65 billion, up to and including $80 billion |
| 0.340 | % | In excess of $80 billion |
franklintempleton.com
Annual Report
113
FRANKLIN CUSTODIAN FUNDS
NOTES TO FINANCIAL STATEMENTS
| 3. | Transactions with Affiliates (continued) |
| a. | Management Fees (continued) |
Franklin DynaTech Fund, Franklin Growth Fund and Franklin U.S. Government Securities Fund pay an investment management fee to Advisers based on the month-end net assets of each of the Funds as follows:
| | |
| Annualized Fee Rate | | Net Assets |
| 0.625 | % | Up to and including $100 million |
| 0.500 | % | Over $100 million, up to and including $250 million |
| 0.450 | % | Over $250 million, up to and including $7.5 billion |
| 0.440 | % | Over $7.5 billion, up to and including $10 billion |
| 0.430 | % | Over $10 billion, up to and including $12.5 billion |
| 0.420 | % | Over $12.5 billion, up to and including $15 billion |
| 0.400 | % | Over $15 billion, up to and including $17.5 billion |
| 0.380 | % | Over $17.5 billion, up to and including $20 billion |
| 0.360 | % | Over $20 billion, up to and including $35 billion |
| 0.355 | % | Over $35 billion, up to and including $50 billion |
| 0.350 | % | In excess of $50 billion |
For the year ended September 30, 2016, each Fund’s effective investment management fee rate based on average daily net assets was as follows:
| | | | | | | | | | |
| | | | | | | | Franklin | | | |
| | Franklin | | Franklin | | Franklin | | U.S. Government | | Franklin | |
| | DynaTech Fund | | Growth Fund | | Income Fund | | Securities Fund | | Utilities Fund | |
| |
| | 0.463 | % | 0.449 | % | 0.373 | % | 0.454 | % | 0.459 | % |
| |
| |
| b. | Administrative Fees | | �� | | | | | | | |
Under an agreement with Advisers, FT Services provides administrative services to the Funds. The fee is paid by Advisers based on each of the Funds’ average daily net assets, and is not an additional expense of the Funds.
c. Distribution Fees
The Board has adopted distribution plans for each share class, with the exception of Class R6 and Advisor Class shares, pursuant to Rule 12b-1 under the 1940 Act. Under the Funds’ Class A reimbursement distribution plans, the Funds reimburse Distributors for costs incurred in connection with the servicing, sale and distribution of each Fund’s shares up to the maximum annual plan rate for each class. Under the Class A reimbursement distribution plans, costs exceeding the maximum for the current plan year cannot be reimbursed in subsequent periods. In addition, under the Funds’ Class C and R compensation distribution plans, the Funds pay Distributors for costs incurred in connection with the servicing, sale and distribution of each Fund’s shares up to the maximum annual plan rate for each class. The plan year, for purposes of monitoring compliance with the maximum annual plan rates, is February 1 through January 31 for each Fund.
114 Annual Report
franklintempleton.com
FRANKLIN CUSTODIAN FUNDS
NOTES TO FINANCIAL STATEMENTS
The maximum annual plan rates, based on the average daily net assets, for each class, are as follows:
| | | | | | | | | | |
| | | | | | | | Franklin | | | |
| | Franklin | | Franklin | | Franklin | | U.S. Government | | Franklin | |
| | DynaTech Fund | | Growth Fund | | Income Fund | | Securities Fund | | Utilities Fund | |
| |
| Reimbursement Plans: | | | | | | | | | | |
| Class A | 0.25 | % | 0.25 | % | 0.15 | % | 0.15 | % | 0.15 | % |
| Compensation Plans: | | | | | | | | | | |
| Class C | 1.00 | % | 1.00 | % | 0.65 | % | 0.65 | % | 0.65 | % |
| Class R | 0.50 | % | 0.50 | % | 0.50 | % | 0.50 | % | 0.50 | % |
d. Sales Charges/Underwriting Agreements
Front-end sales charges and contingent deferred sales charges (CDSC) do not represent expenses of the Funds. These charges are deducted from the proceeds of sales of fund shares prior to investment or from redemption proceeds prior to remittance, as applicable. Distributors has advised the Funds of the following commission transactions related to the sales and redemptions of the Funds’ shares for the year:
| | | | | | | | | | |
| | | | | | | | | Franklin | | |
| | | Franklin | | Franklin | | Franklin | | U.S. Government | | Franklin |
| | | DynaTech Fund | | Growth Fund | | Income Fund | | Securities Fund | | Utilities Fund |
| |
| Sales charges retained net of | | | | | | | | | | |
| commissions paid to | | | | | | | | | | |
| unaffiliated brokers/dealers . | $ | 1,155,237 | $ | 2,546,871 | $ | 13,013,497 | $ | 1,004,498 | $ | 922,833 |
| CDSC retained. | $ | 74,738 | $ | 116,110 | $ | 1,902,350 | $ | 91,076 | $ | 67,599 |
e. Transfer Agent Fees
Each class of shares, except for Class R6, pays transfer agent fees to Investor Services for its performance of shareholder servicing obligations and reimburses Investor Services for out of pocket expenses incurred, including shareholder servicing fees paid to third parties. These fees are allocated daily based upon their relative proportion of such classes’ aggregate net assets. Class R6 pays Investor Services transfer agent fees specific to that class.
For the year ended September 30, 2016, the Funds paid transfer agent fees as noted in the Statements of Operations of which the following amounts were retained by Investor Services:
| | | | | | | | | | |
| | | | | | | | | Franklin | | |
| | | Franklin | | Franklin | | Franklin | | U.S. Government | | Franklin |
| | | DynaTech Fund | | Growth Fund | | Income Fund | | Securities Fund | | Utilities Fund |
| |
| Transfer agent fees. | $ | 1,911,665 | $ | 7,279,863 | $ | 22,322,041 | $ | 3,979,291 | $ | 2,710,534 |
franklintempleton.com
Annual Report
115
FRANKLIN CUSTODIAN FUNDS
NOTES TO FINANCIAL STATEMENTS
| 3. | Transactions with Affiliates (continued) |
| f. | Investments in Affiliated Management Investment Companies |
Certain or all Funds invest in one or more affiliated management investment companies for purposes other than exercising a controlling influence over the management or policies. Management fees paid by the Funds are waived on assets invested in the affiliated management investment companies, as noted in the Statements of Operations, in an amount not to exceed the management and administrative fees paid directly or indirectly by each affiliate. Prior to October 1, 2013, the waiver was accounted for as a reduction to management fees. During the year ended September 30, 2016, certain or all Funds held investments in affiliated management investment companies as follows:
| | | | | | | | | | | |
| | | | | | | | | | | % of | |
| | | | | | | | | | | Affiliated | |
| | Number of | | | | Number of | | | | | Fund Shares | |
| | Shares Held | | | | Shares | | | | | Outstanding | |
| | at Beginning | Gross | Gross | | Held at End | | Value at End | Investment | Realized | Held at End | |
| | of Year | Additions | Reductions | | of Year | | of Year | Income | Gain (Loss) | of Year | |
| |
| Non-Controlled Affiliates | | | | | | | | | | |
| Franklin DynaTech Fund | | | | | | | | | | |
| Institutional | | | | | | | | | | | |
| Fiduciary Trust | | | | | | | | | | | |
| Money Market | | | | | | | | | | | |
| Portfolio | 132,223,790 | 484,570,859 | (599,075,249 | ) | 17,719,400 | $ | 17,719,400 | $ – | $ – | 0.1 | % |
| |
| Franklin Growth Fund | | | | | | | | | | | |
| Institutional | | | | | | | | | | | |
| Fiduciary Trust | | | | | | | | | | | |
| Money Market | | | | | | | | | | | |
| Portfolio | 1,399,136,183 | 792,363,319 | (1,335,041,929 | ) | 856,457,573 | $ | 856,457,573 | $ – | $ – | 5.5 | % |
| |
| Franklin Income Fund | | | | | | | | | | | |
| Institutional | | | | | | | | | | | |
| Fiduciary Trust | | | | | | | | | | | |
| Money Market | | | | | | | | | | | |
| Portfolio | 143,022,415 | 22,517,571,481 | (21,573,232,256 | ) | 1,087,361,640 | $ | 1,087,361,640 | $ – | $ – | 6.9 | % |
| |
| Franklin U.S. Government | | | | | | | | | | |
| Securities Fund | | | | | | | | | | | |
| Institutional | | | | | | | | | | | |
| Fiduciary Trust | | | | | | | | | | | |
| Money Market | | | | | | | | | | | |
| Portfolio | 106,304,328 | 1,498,505,966 | (1,504,260,992 | ) | 100,549,302 | $ | 100,549,302 | $ – | $ – | 0.6 | % |
| |
| Franklin Utilities Fund | | | | | | | | | | | |
| Institutional | | | | | | | | | | | |
| Fiduciary Trust | | | | | | | | | | | |
| Money Market | | | | | | | | | | | |
| Portfolio | 2,850,614 | 669,936,468 | (637,629,359 | ) | 35,157,723 | $ | 35,157,723 | $ – | $ – | 0.2 | % |
| |
| |
| g. Waiver and Expense Reimbursements | | | | | | | | | |
Investor Services has contractually agreed in advance to waive or limit its fees so that the Class R6 transfer agent fees do not exceed 0.01% until January 31, 2017. There were no Class R6 transfer agent fees waived during the year ended September 30, 2016.
116 Annual Report
franklintempleton.com
FRANKLIN CUSTODIAN FUNDS
NOTES TO FINANCIAL STATEMENTS
h. Other Affiliated Transactions
At September 30, 2016, one or more of the funds in Franklin Fund Allocator Series owned a percentage of the following Funds’ outstanding shares:
| | | | | | | | | |
| | | | | | | Franklin | | | |
| Franklin | | Franklin | | Franklin | | U.S. Government | | Franklin | |
| DynaTech Fund | | Growth Fund | | Income Fund | | Securities Fund | | Utilities Fund | |
| |
| 10.7 | % | 8.0 | % | 2.0 | % | 7.7 | % | 2.6 | % |
i. Interfund Transactions
Franklin Income Fund engaged in purchases and sales of investments with funds or other accounts that have common investment managers (or affiliated investment managers), directors, trustees or officers. During the year ended September 30, 2016, the purchase and sale transactions aggregated $38,522,466 and $0, respectively.
4. Expense Offset Arrangement
The Funds have entered into an arrangement with their custodian whereby credits realized as a result of uninvested cash balances are used to reduce a portion of the Funds’ custodian expenses. During the year ended September 30, 2016, the custodian fees were reduced as noted in the Statements of Operations.
5. Income Taxes
For tax purposes, capital losses may be carried over to offset future capital gains. Capital loss carryforwards with no expiration, if any, must be fully utilized before those losses with expiration dates.
| | | | | |
| At September 30, 2016, the capital loss carryforwards were as follows: | | |
| |
| | | | | | Franklin U.S. |
| | | | Franklin | | Government |
| | | | Income Fund | | Securities Fund |
| Capital loss carryforwards subject to expiration: | | | | | |
| 2017 | | $ | — | $ | 18,668,917 |
| 2018 | | | 2,298,838,256 | | 16,923,310 |
| 2019 | | | — | | 4,445,156 |
| Capital loss carryforwards not subject to expiration: | | | | | |
| Short term | | | 2,021,056,701 | | 123,119,594 |
| Long term | | | 2,206,956,366 | | 264,701,909 |
| Total capital loss carryforwards. | $ | 6,526,851,323 | $ | 427,858,886 |
On September 30, 2016, Franklin U.S. Government Securities Fund had expired capital loss carryforwards of $20,514,778, which were reclassified to paid-in capital.
For tax purposes, the Funds may elect to defer any portion of a post-October capital loss or late-year ordinary loss to the first day of the following fiscal year. At September 30, 2016, Franklin Utilities Fund deferred post-October capital losses of $971,183, and Franklin DynaTech Fund and Franklin Income Fund deferred late-year ordinary losses of $7,486,840 and $14,274,549, respectively.
franklintempleton.com
Annual Report
117
FRANKLIN CUSTODIAN FUNDS
NOTES TO FINANCIAL STATEMENTS
5. Income Taxes (continued)
The tax character of distributions paid during the years ended September 30, 2016 and 2015, was as follows:
| | | | | | | | | |
| | | Franklin | | Franklin |
| | | DynaTech Fund | | Growth Fund |
| | | 2016 | | | 2015 | | 2016 | | 2015 |
| Distributions paid from: | | | | | | | | | |
| Ordinary income | $ | — | | $ | — | $ | 77,011,794 | $ | 32,010,571 |
| Long term capital gain | | 73,911,708 | | | 80,002,779 | | 367,827,103 | | — |
| | $ | 73,911,708 | | $ | 80,002,779 | $ | 444,838,897 | $ | 32,010,571 |
| |
| | | | | | | | Franklin |
| | | Franklin | | | U.S. Government |
| | | Income Fund | | Securities Fund |
| | | 2016 | | | 2015 | | 2016 | | 2015 |
| Distributions paid from ordinary income | $ | 4,224,252,280 | $ | 4,476,559,305 | $ | 198,126,751 | $ | 207,654,755 |
| | | | |
| | | Franklin | |
| | | Utilities Fund |
| | | 2016 | | 2015 |
| Distributions paid from: | | | | |
| Ordinary income | $ | 177,871,270 | $ | 181,502,767 |
| Long term capital gain | | 158,181,270 | | 120,721,717 |
| | $ | 336,052,540 | $ | 302,224,484 |
At September 30, 2016, the cost of investments, net unrealized appreciation (depreciation), undistributed ordinary income and undistributed long term capital gains for income tax purposes were as follows:
| | | | | | | | | |
| | | Franklin | | | Franklin | | | Franklin | |
| | | DynaTech Fund | | | Growth Fund | | | Income Fund | |
| Cost of investments | $ | 1,744,253,789 | | $ | 5,996,075,764 | | $ | 77,632,531,364 | |
| |
| Unrealized appreciation | $ | 1,304,910,550 | | $ | 6,327,201,652 | | $ | 6,566,549,027 | |
| Unrealized depreciation | | (4,247,022 | ) | | (100,025,997 | ) | | (4,793,465,969 | ) |
| Net unrealized appreciation (depreciation) | $ | 1,300,663,528 | | $ | 6,227,175,655 | | $ | 1,773,083,058 | |
| |
| Undistributed ordinary income. | $ | — | | $ | 42,102,247 | | $ | — | |
| Undistributed long term capital gains | | 61,116,411 | | | 403,652,954 | | | — | |
| Distributable earnings | $ | 61,116,411 | | $ | 445,755,201 | | $ | — | |
118 Annual Report
franklintempleton.com
FRANKLIN CUSTODIAN FUNDS
NOTES TO FINANCIAL STATEMENTS
| | | | | | |
| | | Franklin | | | | |
| | | U.S. Government | | | Franklin | |
| | | Securities Fund | | | Utilities Fund | |
| |
| Cost of investments | $ | 6,452,265,829 | | $ | 3,828,486,657 | |
| |
| Unrealized appreciation | $ | 224,572,514 | | $ | 2,559,074,995 | |
| Unrealized depreciation | | (9,868,648 | ) | | (50,263,004 | ) |
| Net unrealized appreciation (depreciation) | $ | 214,703,866 | | $ | 2,508,811,991 | |
| Distributable earnings - undistributed ordinary | | | | | | |
| income | $ | 2,295,998 | | $ | 8,846,635 | |
Differences between income and/or capital gains as determined on a book basis and a tax basis are primarily due to differing treatments of paydown losses, bond discounts and premiums, corporate actions, equity-linked securities and wash sales.
6. Investment Transactions
Purchases and sales of investments (excluding short term securities) for the year ended September 30, 2016, were as follows:
| | | | | | | | | | | | |
| | | | | | | | | Franklin | | | | |
| | | Franklin | | Franklin | | Franklin | | U.S. Government | | | Franklin | |
| | | DynaTech Fund | | Growth Fund | | Income Fund | | Securities Fund | | | Utilities Fund | |
| Purchases | $ | 705,017,173 | $ | 878,807,701 | $ | 46,431,447,871 | $ | 6,268,063,969 | | $ | 653,411,259 | |
| Sales | $ | 636,040,439 | $ | 798,742,282 | $ | 51,167,998,559 | $ | 5,802,789,704 | | $ | 415,653,877 | |
| |
| Transactions in options written during the year ended September 30, 2016, were as follows: | | | | | | |
| |
| | | | | | | | | Number of | | | Premiums | |
| | | | | | | | | Contracts | | | Received | |
| Franklin Income Fund | | | | | | | | | | | | |
| Options outstanding at September 30, 2015 | | | | | | — | | $ | — | |
| Options written | | | | | | | | 442,500 | | | 66,428,247 | |
| Options expired | | | | | | | | (185,503 | ) | | (15,041,632 | ) |
| Options exercised | | | | | | | | (157,997 | ) | | (11,667,921 | ) |
| Options closed | | | | | | | | (64,000 | ) | | (29,414,002 | ) |
| Options outstanding at September 30, 2016 | | | | | | 35,000 | | $ | 10,304,692 | |
See Notes 1(e) and 10 regarding derivative financial instruments and other derivative information, respectively.
At September 30, 2016, in connection with securities lending transactions, Franklin Income Fund loaned corporate bonds and notes and received $80,986,713 of cash collateral. The gross amount of recognized liability for such transactions is included in payable upon return of securities loaned in the Statement of Assets and Liabilities. The agreements can be terminated at any time.
7. Credit Risk and Defaulted Securities
At September 30, 2016, Franklin Income Fund had 37.2% of its portfolio invested in high yield, senior secured floating rate notes, or other securities rated below investment grade and unrated securities, if any. These securities may be more sensitive to economic conditions causing greater price volatility and are potentially subject to a greater risk of loss due to default than higher rated securities.
franklintempleton.com
Annual Report
119
FRANKLIN CUSTODIAN FUNDS
NOTES TO FINANCIAL STATEMENTS
7. Credit Risk and Defaulted Securities (continued)
Certain or all Funds held defaulted securities and/or other securities for which the income has been deemed uncollectible. At September 30, 2016, the aggregate value of these securities for Franklin Income Fund was $317,986,219, representing 0.4% of the Fund’s net assets. The Fund discontinues accruing income on securities for which income has been deemed uncollectible and provides an estimate for losses on interest receivable. The securities have been identified in the accompanying Statement of Investments.
8. Restricted Securities
Certain or all Funds invest in securities that are restricted under the Securities Act of 1933 (1933 Act) or which are subject to legal, contractual, or other agreed upon restrictions on resale. Restricted securities are often purchased in private placement transactions, and cannot be sold without prior registration unless the sale is pursuant to an exemption under the 1933 Act. Disposal of these securities may require greater effort and expense, and prompt sale at an acceptable price may be difficult. The Funds may have registration rights for restricted securities. The issuer generally incurs all registration costs.
At September 30, 2016, certain or all Funds held investments in restricted securities, excluding certain securities exempt from registration under the 1933 Act deemed to be liquid, as follows:
| | | | | |
| | Acquisition | | | | |
| Shares Issuer | Dates | | Cost | | Value |
| Franklin Income Fund | | | | | |
| 28,306,773 a Halcon Resources Corp | 6/29/12 - 10/23/15 | $ | 383,820,185 | $ | 233,127,308 |
| 2,520,000 b Rex Energy Corp | 7/14/14 | | 138,796,627 | | 1,459,302 |
| Total Restricted Securities (Value is 0.3% of Net Assets) | | $ | 522,616,812 | $ | 234,586,610 |
aThe Fund also invests in unrestricted securities or other investments in the issuer, valued at $191,425,000 as of September 30, 2016.
bThe Fund also invests in unrestricted securities or other investments in the issuer, valued at $65,216,829 as of September 30, 2016.
9. Unfunded Loan Commitments
Certain or all Funds enter into certain credit agreements, all or a portion of which may be unfunded. The Funds are obligated to fund these loan commitments at the borrowers’ discretion. Unfunded loan commitments and funded portions of credit agreements are marked to market daily and any unrealized appreciation or depreciation is included in the Statements of Assets and Liabilities and the Statements of Operations. Funded portions of credit agreements are presented in the Statements of Investments.
| | |
| At September 30, 2016, unfunded commitments were as follows: | | |
| |
| | | Unfunded |
| Borrower | | Commitment |
| Franklin Income Fund | | |
| PetroQuest Energy, Inc., Multidraw Term Loan Facility, 10/21/16 | $ | 50,000,000 |
120 Annual Report
franklintempleton.com
FRANKLIN CUSTODIAN FUNDS
NOTES TO FINANCIAL STATEMENTS
10. Other Derivative Information
At September 30, 2016, Franklin Income Fund’s investments in derivative contracts are reflected in the Statements of Assets and Liabilities as follows:
| | | | | | | |
| | Asset Derivatives | | | | Liability Derivatives | | |
| |
| Derivative Contracts | Statements of | | | | Statements of | | |
| Not Accounted for as | Assets and Liabilities | | | | Assets and Liabilities | | |
| Hedging Instruments | Location | | Fair Value | | Location | | Fair Value |
| |
| Equity contracts | Investments in securities, at value | $ | 40,650,000 | a | Options written, at value | $ | 1,735,000 |
aPurchased option contracts are included in investments in securities, at value in the Statements of Assets and Liabilities.
For the year ended September 30, 2016, the effect of derivative contracts in Franklin Income Fund’s Statements of Operations was as follows:
| | | | | | | |
| | | | | | | Net Change in | |
| | | | | | | Unrealized | |
| Derivative Contracts | | | Net Realized | | | Appreciation | |
| Not Accounted for as | Statement of | | Gain (Loss) for | Statement of | | (Depreciation) | |
| Hedging Instruments | Operations Locations | | the Year | Operations Locations | | for the Year | |
| |
| | Net realized gain (loss) from: | | | Net change in unrealized | | | |
| | | | | appreciation (depreciation) on: | | | |
| Equity contracts | Investments | $ | —a | Investments | $ | (38,339,000 | )a |
| | Written options | | 37,932,814 | Written options | | 8,569,692 | |
| Totals | | $ | 37,932,814 | | $ | (29,769,308 | ) |
aPurchased option contracts are included in net realized gain (loss) from investments and net change in unrealized appreciation (depreciation) on investments in the
Statements of Operations.
For the year ended September 30, 2016, the average month end fair value of derivatives represented less than 0.1% of average month end net assets. The average month end number of open derivatives contracts for the year was 4.
See Notes 1(e) and 6 regarding derivative financial instruments and investment transactions, respectively.
11. Holdings of 5% Voting Securities of Portfolio Companies
The 1940 Act defines "affiliated companies" to include investments in portfolio companies in which a fund owns 5% or more of the outstanding voting securities. During the year ended September 30, 2016, certain or all Funds held investments in “affiliated companies” as follows:
| | | | | | | | | | | |
| | Number of | | | | Number of | | | | | | |
| | Shares/ | | | | Shares/ | | | | | | |
| | Principal | | | | Principal | | | | | | |
| | Amount* | | | | Amount* | | | | | | |
| | Held at | | | | Held at | Value at | | | | | |
| | Beginning | Gross | Gross | | End | End of | | Investment | | Realized | |
| Name of Issuer | of Year | Additions | Reductions | | of Year | Year | | Income | | Gain (Loss) | |
| |
| Franklin Income Fund | | | | | | | | | | | |
| Non-Controlled Affiliates | | | | | | | | | | | |
| Agrium Inc | 7,500,000 | — | (7,500,000 | ) | — | $— | $ | — | $ | (48,229,021 | ) |
| CEVA Group PLC, | | | | | | | | | | | |
| Pre-Funded L/C, 6.50%, | | | | | | | | | | | |
| 3/19/21 | 20,320,197 | — | — | | 20,320,197 | —a | | 957,589 | | — | |
franklintempleton.com
Annual Report
121
FRANKLIN CUSTODIAN FUNDS
NOTES TO FINANCIAL STATEMENTS
| 11. | Holdings of 5% Voting Securities of Portfolio Companies (continued) |
| | | | | | | | | | | | | |
| | Number of | | | | | Number of | | | | | | | |
| | Shares/ | | | | | Shares/ | | | | | | | |
| | Principal | | | | | Principal | | | | | | | |
| | Amount* | | | | | Amount* | | | | | | | |
| | Held at | | | | | Held at | | Value at | | | | | |
| | Beginning | Gross | | Gross | | End | | End of | | Investment | | Realized | |
| Name of Issuer | of Year | Additions | | Reductions | | of Year | | Year | | Income | | Gain (Loss) | |
| |
| Franklin Income Fund (continued) | | | | | | | | | | | | |
| Non-Controlled Affiliates (continued) | | | | | | | | | | | | |
| CEVA Group PLC, senior | | | | | | | | | | | | | |
| note, first lien, 144A, 4.00%, | | | | | | | | | | | | | |
| 5/01/18 | 174,778,982 | — | | (10,000,000 | ) | 164,778,982 | $ | —a | $ | 4,965,616 | $ | (1,237,500 | ) |
| CEVA Holdings LLC | 91,371 | — | | — | | 91,371 | | 31,979,871 | | — | | — | |
| CEVA Holdings LLC, cvt. | | | | | | | | | | | | | |
| pfd., A-1 | 2,897 | — | | — | | 2,897 | | 1,448,625 | | — | | — | |
| CEVA Holdings LLC, cvt. | | | | | | | | | | | | | |
| pfd., A-2 | 110,565 | — | | — | | 110,565 | | 38,697,778 | | — | | — | |
| Halcon Resources Corp | 47,500,000 | — | | (47,500,000 | ) | — | | — | | — | | (71,022,137 | ) |
| Halcon Resources Corp | — | 28,306,773 | b | — | | 28,306,773 | | 233,127,308 | | — | | — | |
| Halcon Resources Corp., | | | | | | | | | | | | | |
| 5.75%, cvt. pfd., A | 37,000 | — | | (37,000 | )b | — | | — | | — | | (30,893,776 | ) |
| Halcon Resources Corp., | | | | | | | | | | | | | |
| secured note, second lien, | | | | | | | | | | | | | |
| 144A, 8.625%, 2/01/20 | 130,000,000 | 70,000,000 | | (10,000,000 | ) | 190,000,000 | | 191,425,000 | | 19,457,832 | | (575,000 | ) |
| Halcon Resources Corp., | | | | | | | | | | | | | |
| senior note, 8.875%, | | | | | | | | | | | | | |
| 5/15/21 | 13,375,000 | 15,300,000 | | (28,675,000 | ) | — | | — | | 1,297,692 | | (5,654,907 | ) |
| Halcon Resources Corp., | | | | | | | | | | | | | |
| senior note, 9.75%, 7/15/20. | 6,500,000 | 10,000,000 | | (16,500,000 | ) | — | | — | | 213,010 | | (3,657,675 | ) |
| Halcon Resources | | | | | | | | | | | | | |
| Corp.,senior secured note, | | | | | | | | | | | | | |
| third lien, 144A, 13.00%, | | | | | | | | | | | | | |
| 2/15/22 | 341,510,000 | 118,490,000 | | (460,000,000 | )b | — | | — | | — | | (33,711,038 | ) |
| PetroQuest Energy Inc | — | 2,588,318 | b | (1,305,000 | ) | 1,283,318 | | 4,440,280 | | — | | — | |
| PetroQuest Energy Inc., | | | | | | | | | | | | | |
| second lien, secured note, | | | | | | | | | | | | | |
| 144A, PIK, 10.00%, | | | | | | | | | | | | | |
| 2/15/21 | — | 58,725,000 | b | — | | 58,725,000 | | 38,719,780 | | 38,720 | | — | |
| PG&E Corp | 24,910,000 | 2,000,000 | | (16,910,000 | ) | 10,000,000 | | —a | | — | | 190,957,267 | |
| Rex Energy Corp | — | 2,520,000 | b | — | | 2,520,000 | | 1,459,302 | | — | | — | |
| Rex Energy Corp | — | 19,374,471 | b | (13,180,209 | ) | 6,194,262 | | 3,616,829 | | — | | (31,638,478 | ) |
| Rex Energy Corp.,second | | | | | | | | | | | | | |
| lien,1.00% to 10/01/17, | | | | | | | | | | | | | |
| 8.00% thereafter, 10/01/20 . | — | 168,000,000 | | (58,000,000 | )b | 110,000,000 | | 61,600,000 | | 347,097 | | (1,909,055 | ) |
| W&T Offshore Inc | — | 28,041,726 | b | — | | 28,041,726 | | 49,353,438 | | — | | — | |
| W&T Offshore Inc.,second | | | | | | | | | | | | | |
| lien, 144A, PIK, 9.00%, | | | | | | | | | | | | | |
| 5/15/20 | — | 74,140,000 | b | — | | 74,140,000 | | 42,339,709 | | 290,791 | | — | |
| W&T Offshore Inc.,Second | | | | | | | | | | | | | |
| Lien Term Loan, 9.00%, | | | | | | | | | | | | | |
| 5/15/20 | 100,000,000 | 51,850,000 | | — | | 151,850,000 | | 96,424,750 | | 12,424,256 | | — | |
122 Annual Report
franklintempleton.com
FRANKLIN CUSTODIAN FUNDS
NOTES TO FINANCIAL STATEMENTS
| | | | | | | | | | | | | |
| | Number of | | | | | Number of | | | | | | | |
| | Shares/ | | | | | Shares/ | | | | | | | |
| | Principal | | | | | Principal | | | | | | | |
| | Amount* | | | | | Amount* | | | | | | | |
| | Held at | | | | | Held at | | Value at | | | | | |
| | Beginning | Gross | | Gross | | End | | End of | | Investment | | Realized | |
| Name of Issuer | of Year | Additions | | Reductions | | of Year | | Year | | Income | | Gain (Loss) | |
| |
| Franklin Income Fund (continued) | | | | | | | | | | | | |
| Non-Controlled Affiliates (continued) | | | | | | | | | | | | |
| W&T Offshore Inc., senior | | | | | | | | | | | | | |
| secured, 1.5 lien Term | | | | | | | | | | | | | |
| Loan, 11.00%, 11/15/19 | — | 75,000,000 | | — | | 75,000,000 | $ | 75,398,250 | $ | 543,956 | $ | — | |
| W&T Offshore Inc., senior | | | | | | | | | | | | | |
| secured note, third lien, | | | | | | | | | | | | | |
| 144A, PIK, 8.50%, 6/15/21 . | — | 65,903,000 | b | — | | 65,903,000 | | 25,211,581 | | 161,074 | | — | |
| Total Affiliated Securities (Value is 1.1% of Net Assets) | | | | | $ | 895,242,501 | $ | 40,697,633 | $ | (37,571,320 | ) |
| |
| Franklin Utilities Fund | | | | | | | | | | | | | |
| Non-Controlled Affiliates | | | | | | | | | | | | | |
| 8point3 Energy Partners LP . | 1,298,500 | — | | (1,298,500 | ) | — | $ | — | $ | — | $ | (9,237,297 | ) |
*In U.S. dollars unless otherwise indicated.
aAs of September 30, 2016, no longer an affiliate.
bGross addition/reduction was the result of various corporate actions.
12. Reorganization
On March 11, 2016, Franklin Growth Fund (Surviving Fund), pursuant to a plan of reorganization approved on March 9, 2016 by shareholders of Franklin Large Cap Equity Fund (Acquired Fund), a series of Franklin Global Trust, acquired 100% of the Acquired Fund’s net assets, primarily made up of investment securities, which included $30,220,448 of unrealized appreciation (depreciation), through a tax-free exchange of 2,626,568 shares of the Surviving Fund (valued at $158,520,938). Immediately after the completion of the reorganization, the combined net assets of the Surviving Fund were $11,613,893,884.
The primary purpose for the reorganization was to combine the Acquired Fund with a larger fund that had a significant overlap of portfolio holdings, generally similar investment goals, principal investment strategies and principal investment risks. The estimated cost of the reorganization was $110,000 of which the Surviving Fund, the Acquired Fund, Advisers, and Fiduciary Internation-al,Inc., the investment manager of the Acquired Fund, each paid 25%. The allocated portion of the Surviving Fund’s reorganization expenses are included with professional fees and reports to shareholders expenses in the Statements of Operations.
Assuming the reorganization had been completed on October 1, 2015, the Surviving Fund’s pro forma results of operations would have been as follows:
| | | | | | |
| | | | | | | Net Increase |
| | | Net | | Net Realized | | (Decrease) in |
| | | Investment | | and Unrealized | | Net Assets from |
| Period | | Income | | Gain (Loss) | | Operations |
| |
| For the period October 1, 2015 through September 30, 2016 | $ | 76,255,847 | $ | 1,318,513,067 | $ | 1,394,768,914 |
Subsequent to the reorganization, the Surviving Fund has been managed as a single entity. Accordingly, it is impracticable to identify the amounts of investment income and net investment income attributable to the Acquired Fund’s assets after the completion of the reorganization.
franklintempleton.com
Annual Report
123
FRANKLIN CUSTODIAN FUNDS
NOTES TO FINANCIAL STATEMENTS
13. Credit Facility
The Funds, together with other U.S. registered and foreign investment funds (collectively, Borrowers), managed by Franklin Templeton Investments, are borrowers in a joint syndicated senior unsecured credit facility totaling $2 billion (Global Credit Facility) which matures on February 10, 2017. This Global Credit Facility provides a source of funds to the Borrowers for temporary and emergency purposes, including the ability to meet future unanticipated or unusually large redemption requests.
Under the terms of the Global Credit Facility, the Funds shall, in addition to interest charged on any borrowings made by the Funds and other costs incurred by the Funds, pay their share of fees and expenses incurred in connection with the implementation and maintenance of the Global Credit Facility, based upon their relative share of the aggregate net assets of all of the Borrowers, including an annual commitment fee of 0.07% based upon the unused portion of the Global Credit Facility. Effective February 12, 2016, the annual commitment fee is 0.15%. These fees are reflected in other expenses in the Statements of Operations. During the year ended September 30, 2016, the Funds did not use the Global Credit Facility.
14. Fair Value Measurements
The Funds follow a fair value hierarchy that distinguishes between market data obtained from independent sources (observable inputs) and the Funds’ own market assumptions (unobservable inputs). These inputs are used in determining the value of the Funds’ financial instruments and are summarized in the following fair value hierarchy:
- Level 1 – quoted prices in active markets for identical financial instruments
- Level 2 – other significant observable inputs (including quoted prices for similar financial instruments, interest rates, prepayment speed, credit risk, etc.)
- Level 3 – significant unobservable inputs (including the Funds’ own assumptions in determining the fair value of financial instruments)
The input levels are not necessarily an indication of the risk or liquidity associated with financial instruments at that level.
For movements between the levels within the fair value hierarchy, the Funds have adopted a policy of recognizing the transfers as of the date of the underlying event which caused the movement.
A summary of inputs used as of September 30, 2016, in valuing the Funds’ assets and liabilities carried at fair value, is as follows:
| | | | | | | | |
| | | Level 1 | | Level 2 | | Level 3 | | Total |
| Franklin DynaTech Fund | | | | | | | | |
| Assets: | | | | | | | | |
| Investments in Securities: | | | | | | | | |
| Equity Investmentsa | $ | 3,027,197,917 | $ | — | $ | — | $ | 3,027,197,917 |
| Short Term Investments | | 17,719,400 | | — | | — | | 17,719,400 |
| Total Investments in Securities | $ | 3,044,917,317 | $ | — | $ | — | $ | 3,044,917,317 |
| |
| Franklin Growth Fund | | | | | | | | |
| Assets: | | | | | | | | |
| Investments in Securities: | | | | | | | | |
| Equity Investmentsa | $ | 11,366,793,846 | $ | — | $ | — | $ | 11,366,793,846 |
| Short Term Investments | | 856,457,573 | | — | | — | | 856,457,573 |
| Total Investments in Securities | $ | 12,223,251,419 | $ | — | $ | — | $ | 12,223,251,419 |
124 Annual Report
franklintempleton.com
| | | | | | | | |
| | | | | | FRANKLIN CUSTODIAN FUNDS |
| | | | | NOTES TO FINANCIAL STATEMENTS |
| |
| |
| |
| |
| | | Level 1 | | Level 2 | | Level 3 | | Total |
| Franklin Income Fund | | | | | | | | |
| Assets: | | | | | | | | |
| Investments in Securities: | | | | | | | | |
| Equity Investments:b | | | | | | | | |
| Energy. | $ | 5,216,018,147 | $ | — | $ | 234,586,610 | $ | 5,450,604,757 |
| Financials | | 4,670,888,200 | | 48,875,000 | | — | | 4,719,763,200 |
| Industrials | | 3,676,165,000 | | 72,126,274 | | — | | 3,748,291,274 |
| All Other Equity Investmentsa | | 21,277,013,392 | | — | | — | | 21,277,013,392 |
| Equity-Linked Securities | | — | | 10,337,085,701 | | — | | 10,337,085,701 |
| Convertible Bonds | | — | | 494,700,810 | | — | | 494,700,810 |
| Corporate Bonds | | — | | 29,108,587,591 | | 18,179,719 | | 29,126,767,310 |
| Senior Floating Rate Interests | | — | | 3,113,296,625 | | — | | 3,113,296,625 |
| Escrows and Litigation Trusts | | — | | — | | —c | | — |
| Options Purchased | | 40,650,000 | | — | | — | | 40,650,000 |
| Short Term Investments | | 1,087,361,640 | | 10,079,713 | | — | | 1,097,441,353 |
| Total Investments in Securities | $ | 35,968,096,379 | $ | 43,184,751,714 | $ | 252,766,329 | $ | 79,405,614,422 |
| |
| Other Financial Instruments: | | | | | | | | |
| Unfunded Loan Commitments. | $ | — | $ | 99,500 | $ | — | $ | 99,500 |
| |
| Liabilities: | | | | | | | | |
| Other Financial Instruments: | | | | | | | | |
| Options Written | $ | 1,735,000 | $ | — | $ | — | $ | 1,735,000 |
| |
| Franklin U.S. Government Securities Fund | | | | | | | | |
| Assets: | | | | | | | | |
| Investments in Securities: | | | | | | | | |
| Mortgage-Backed Securities | $ | — | $ | 6,566,420,393 | $ | — | $ | 6,566,420,393 |
| Short Term Investments | | 100,549,302 | | — | | — | | 100,549,302 |
| Total Investments in Securities | $ | 100,549,302 | $ | 6,566,420,393 | $ | — | $ | 6,666,969,695 |
| |
| Franklin Utilities Fund | | | | | | | | |
| Assets: | | | | | | | | |
| Investments in Securities: | | | | | | | | |
| Equity Investmentsa | $ | 6,249,688,967 | $ | — | $ | — | $ | 6,249,688,967 |
| Corporate Bonds | | — | | 52,451,958 | | — | | 52,451,958 |
| Short Term Investments | | 35,157,723 | | — | | — | | 35,157,723 |
| Total Investments in Securities | $ | 6,284,846,690 | $ | 52,451,958 | $ | — | $ | 6,337,298,648 |
aFor detailed categories, see the accompanying Statement of Investments.
bIncludes common, preferred and convertible preferred stocks as well as other equity investments.
cIncludes securities determined to have no value at September 30, 2016.
A reconciliation of assets in which Level 3 inputs are used in determining fair value is presented when there are significant Level 3 financial instruments at the end of the year.
15. Subsequent Events
The Funds have evaluated subsequent events through the issuance of the financial statements and determined that no events have occurred that require disclosure.
franklintempleton.com
Annual Report
125
FRANKLIN CUSTODIAN FUNDS
NOTES TO FINANCIAL STATEMENTS
| | |
| Abbreviations | | |
| |
| Currency | Selected Portfolio |
| GBP British Pound Sterling | ADR | American Depositary Receipt |
| | FHLMC | Federal Home Loan Mortgage Corp. |
| | FRN | Floating Rate Note |
| | GP | Graduated Payment |
| | L/C | Letter of Credit |
| | MTN | Medium Term Note |
| | PIK | Payment-In-Kind |
| | SF | Single Family |
126 Annual Report
franklintempleton.com
FRANKLIN CUSTODIAN FUNDS
Report of Independent Registered Public Accounting Firm
To the Board of Trustees and Shareholders of Franklin Custodian Funds
In our opinion, the accompanying statements of assets and liabilities, including the statements of investments, and the related statements of operations and of changes in net assets and the financial highlights present fairly, in all material respects, the financial position of Franklin DynaTech Fund, Franklin Growth Fund, Franklin Income Fund, Franklin U.S. Government Securities Fund and Franklin Utilities Fund (seperate portfolios of Franklin Custodian Funds, hereafter referred to as the "Funds") at September 30, 2016, the results of each of their operations for the year then ended, the changes in each of their net assets for each of the two years in the period then ended and the financial highlights for each of the periods presented, in conformity with accounting principles generally accepted in the United States of America. These financial statements and financial highlights (hereafter referred to as "financial statements") are the responsibility of the Funds’ management. Our responsibility is to express an opinion on these financial statements based on our audits. We conducted our audits of these financial statements in accordance with the standards of the Public Company Accounting Oversight Board (United States). Those standards require that we plan and perform the audit to obtain reasonable assurance about whether the financial statements are free of material misstatement. An audit includes examining, on a test basis, evidence supporting the amounts and disclosures in the financial statements, assessing the accounting principles used and significant estimates made by management, and evaluating the overall financial statement presentation. We believe that our audits, which included confirmation of securities at September 30, 2016 by correspondence with the custodian, transfer agent and brokers, provide a reasonable basis for our opinion.
PricewaterhouseCoopers LLP
San Francisco, California
November 16, 2016
franklintempleton.com
Annual Report
127
FRANKLIN CUSTODIAN FUNDS
Tax Information (unaudited)
Under Section 852(b)(3)(C) of the Internal Revenue Code (Code), the Funds hereby report the maximum amount allowable but no less than the following amounts as long term capital gain dividends for the fiscal year ended September 30, 2016:
| | | | | |
| | Franklin | | Franklin | | Franklin |
| | DynaTech Fund | | Growth Fund | | Utilities Fund |
| |
| $ | 73,911,708 | $ | 367,827,103 | $ | 158,181,270 |
Under Section 871(k)(2)(C) of the Code, Franklin Utilities Fund hereby reports the maximum amount allowable but no less than $11,006,455 as short term capital gain dividends for purposes of the tax imposed under Section 871(a)(1)(A) of the Code for the fiscal year ended September 30, 2016.
Under Section 854(b)(1)(A) of the Code, the Funds hereby report the following percentage amounts of the ordinary income dividends as income qualifying for the dividends received deduction for the fiscal year ended September 30, 2016:
| | | | | |
| Franklin | | Franklin | | Franklin | |
| Growth Fund | | Income Fund | | Utilities Fund | |
| |
| 100 | % | 22.38 | % | 100 | % |
Under Section 854(b)(1)(B) of the Code, the Funds hereby report the maximum amount allowable but no less than the following amounts as qualified dividends for purposes of the maximum rate under Section 1(h)(11) of the Code for the fiscal year ended September 30, 2016:
| | | | | | | |
| | Franklin | | Franklin | | Franklin | | Franklin |
| | DynaTech Fund | | Growth Fund | | Income Fund | | Utilities Fund |
| |
| $ | 13,655,160 | $ | 171,522,267 | $ | 1,631,383,907 | $ | 204,549,474 |
Distributions, including qualified dividend income, paid during calendar year 2016 will be reported to shareholders on Form 1099-DIV by mid-February 2017. Shareholders are advised to check with their tax advisors for information on the treatment of these amounts on their individual income tax returns.
Under Section 871(k)(1)(C) of the Code, the Funds hereby report the maximum amount allowable but no less than the following amounts as interest related dividends for purposes of the tax imposed under Section 871(a)(1)(A) of the Code for the fiscal year ended September 30, 2016:
| | | |
| | | | Franklin U.S. |
| | Franklin | | Government |
| | Income Fund | | Securities Fund |
| |
| $ | 1,696,500,694 | $ | 198,195,368 |
128 Annual Report
franklintempleton.com
FRANKLIN CUSTODIAN FUNDS
Board Members and Officers
The name, year of birth and address of the officers and board members, as well as their affiliations, positions held with the Trust, principal occupations during at least the past five years and number of U.S. registered portfolios overseen in the Franklin Templeton Investments fund complex, are shown below. Generally, each board member serves until that person’s successor is elected and qualified.
| | | | |
| Independent Board Members | | | |
| |
| | | | Number of Portfolios in | |
| Name, Year of Birth | | Length of | Fund Complex Overseen | Other Directorships Held |
| and Address | Position | Time Served | by Board Member* | During at Least the Past 5 Years |
| |
| Harris J. Ashton (1932) | Trustee | Since 1976 | 143 | Bar-S Foods (meat packing company) |
| One Franklin Parkway | | | | (1981-2010). |
| San Mateo, CA 94403-1906 | | | | |
| Principal Occupation During at Least the Past 5 Years: | | |
| Director of various companies; and formerly, Director, RBC Holdings, Inc. (bank holding company) (until 2002); and President, Chief Executive |
| Officer and Chairman of the Board, General Host Corporation (nursery and craft centers) (until 1998). | |
| |
| Mary C. Choksi (1950) | Trustee | Since 2014 | 137 | Avis Budget Group Inc. (car rental) |
| One Franklin Parkway | | | | (2007-present), Omnicom Group Inc. |
| San Mateo, CA 94403-1906 | | | | (advertising and marketing |
| | | | | communications services) |
| | | | | (2011-present) and H.J. Heinz |
| | | | | Company (processed foods and allied |
| | | | | products) (1998-2006). |
| Principal Occupation During at Least the Past 5 Years: | | |
| Senior Advisor, Strategic Investment Group (investment management group) (2015-present); director of various companies; and formerly, |
| Founding Partner and Senior Managing Director, Strategic Investment Group (1987–2015); Founding Partner and Managing Director, Emerging |
| Markets Management LLC (investment management firm) (1987-2011); and Loan Officer/Senior Loan Officer/Senior Pension Investment |
| Officer, World Bank Group (international financial institution) (1977-1987). | |
| |
| Edith E. Holiday (1952) | Trustee | Since 1998 | 143 | Hess Corporation (exploration and |
| One Franklin Parkway | | | | refining of oil and gas) (1993-present), |
| San Mateo, CA 94403-1906 | | | | Canadian National Railway (railroad) |
| | | | | (2001-present), White Mountains |
| | | | | Insurance Group, Ltd. (holding |
| | | | | company) (2004-present), RTI |
| | | | | International Metals, Inc. (manufacture |
| | | | | and distribution of titanium) |
| | | | | (1999-2015) and H.J. Heinz Company |
| | | | | (processed foods and allied products) |
| | | | | (1994-2013). |
| Principal Occupation During at Least the Past 5 Years: | | |
| Director or Trustee of various companies and trusts; and formerly, Assistant to the President of the United States and Secretary of the |
| Cabinet (1990-1993); General Counsel to the United States Treasury Department (1989-1990); and Counselor to the Secretary and Assistant |
| Secretary for Public Affairs and Public Liaison-United States Treasury Department (1988-1989). | |
| |
| J. Michael Luttig (1954) | Trustee | Since 2009 | 143 | Boeing Capital Corporation (aircraft |
| One Franklin Parkway | | | | financing) (2006-2013). |
| San Mateo, CA 94403-1906 | | | | |
| Principal Occupation During at Least the Past 5 Years: | | |
| Executive Vice President, General Counsel and member of the Executive Council, The Boeing Company (aerospace company) (2006-present); |
| and formerly, Federal Appeals Court Judge, U.S. Court of Appeals for the Fourth Circuit (1991-2006). | |
franklintempleton.com
Annual Report
129
FRANKLIN CUSTODIAN FUNDS
| | | | |
| Independent Board Members (continued) | | |
| |
| |
| |
| | | | Number of Portfolios in | |
| Name, Year of Birth | | Length of | Fund Complex Overseen | Other Directorships Held |
| and Address | Position | Time Served | by Board Member* | During at Least the Past 5 Years |
| |
| Larry D. Thompson | Trustee | Since 2007 | 143 | The Southern Company (energy |
| One Franklin Parkway | | | | company) (2014-present; previously |
| San Mateo, CA 94403-1906 | | | | 2010-2012), Graham Holdings |
| | | | | Company (education and media |
| | | | | organization) (2011-present) and |
| | | | | Cbeyond, Inc. (business |
| | | | | communications provider) |
| | | | | (2010-2012). |
| Principal Occupation During at Least the Past 5 Years: | | |
| Director of various companies; John A. Sibley Professor of Corporate and Business Law, University of Georgia School of Law (2015-present; |
| previously 2011-2012); and formerly, Executive Vice President - Government Affairs, General Counsel and Corporate Secretary, PepsiCo, Inc. |
| (consumer products) (2012-2014); Senior Vice President - Government Affairs, General Counsel and Secretary, PepsiCo, Inc. (2004-2011); |
| Senior Fellow of The Brookings Institution (2003-2004); Visiting Professor, University of Georgia School of Law (2004); and Deputy Attorney |
| General, U.S. Department of Justice (2001-2003). | | | |
| |
| John B. Wilson (1959) | Lead | Trustee since | 117 | None |
| One Franklin Parkway | Independent | 2007 and Lead | | |
| San Mateo, CA 94403-1906 | Trustee | Independent | | |
| | | Trustee since 2008 | | |
| Principal Occupation During at Least the Past 5 Years: | | |
| President, Staples Europe (office supplies) (2012-present); President and Founder, Hyannis Port Capital, Inc. (real estate and private equity |
| investing); serves on private and non-profit boards; and formerly, Chief Operating Officer and Executive Vice President, Gap, Inc. (retail) |
| (1996-2000); Chief Financial Officer and Executive Vice President – Finance and Strategy, Staples, Inc. (1992-1996); Senior Vice President – |
| Corporate Planning, Northwest Airlines, Inc. (airlines) (1990-1992); and Vice President and Partner, Bain & Company (consulting firm) |
| (1986-1990). | | | | |
| |
| |
| Interested Board Members and Officers | | |
| |
| | | | Number of Portfolios in | |
| Name, Year of Birth | | Length of | Fund Complex Overseen | Other Directorships Held |
| and Address | Position | Time Served | by Board Member* | During at Least the Past 5 Years |
| |
| **Gregory E. Johnson (1961) | Trustee | Since 2013 | 159 | None |
| One Franklin Parkway | | | | |
| San Mateo, CA 94403-1906 | | | | |
| Principal Occupation During at Least the Past 5 Years: | | |
| Chairman of the Board, Member - Office of the Chairman, Director and Chief Executive Officer, Franklin Resources, Inc.; officer and/or director |
| or trustee, as the case may be, of some of the other subsidiaries of Franklin Resources, Inc. and of 44 of the investment companies in Franklin |
| Templeton Investments; Vice Chairman, Investment Company Institute; and formerly, President, Franklin Resources, Inc. (1994-2015). |
| |
| **Rupert H. Johnson, Jr. (1940) | Chairman of | Chairman of the | 143 | None |
| One Franklin Parkway | the Board, | Board since 2013, | | |
| San Mateo, CA 94403-1906 | Trustee and | Trustee since 1983 | | |
| | Vice President | and Vice President | | |
| | | since 1982 | | |
| Principal Occupation During at Least the Past 5 Years: | | |
| Vice Chairman, Member - Office of the Chairman and Director, Franklin Resources, Inc.; Director, Franklin Advisers, Inc.; Senior Vice |
| President, Franklin Advisory Services, LLC; and officer and/or director or trustee, as the case may be, of some of the other subsidiaries of |
| Franklin Resources, Inc. and of 42 of the investment companies in Franklin Templeton Investments. | |
| |
| Alison E. Baur (1964) | Vice President | Since 2012 | Not Applicable | Not Applicable |
| One Franklin Parkway | | | | |
| San Mateo, CA 94403-1906 | | | | |
| Principal Occupation During at Least the Past 5 Years: | | |
| Deputy General Counsel, Franklin Templeton Investments; and officer of some of the other subsidiaries of Franklin Resources, Inc. and of 45 |
| of the investment companies in Franklin Templeton Investments. | | |
130 Annual Report
franklintempleton.com
FRANKLIN CUSTODIAN FUNDS
| | | | |
| Interested Board Members and Officers (continued) | |
| |
| |
| |
| | | | Number of Portfolios in | |
| Name, Year of Birth | | Length of | Fund Complex Overseen | Other Directorships Held |
| and Address | Position | Time Served | by Board Member* | During at Least the Past 5 Years |
| |
| Laura F. Fergerson (1962) | Chief Executive Since 2009 | Not Applicable | Not Applicable |
| One Franklin Parkway | Officer – | | | |
| San Mateo, CA 94403-1906 | Finance and | | |
| | Administration | | |
| Principal Occupation During at Least the Past 5 Years: | | |
| Senior Vice President, Franklin Templeton Services, LLC; Vice President, Franklin Advisers, Inc. and Franklin Templeton Institutional, LLC; and |
| officer of 45 of the investment companies in Franklin Templeton Investments. | |
| |
| Gaston Gardey (1967) | Treasurer, | Since 2009 | Not Applicable | Not Applicable |
| One Franklin Parkway | Chief Financial | | |
| San Mateo, CA 94403-1906 | Officer and | | | |
| | Chief | | | |
| | Accounting | | | |
| | Officer | | | |
| Principal Occupation During at Least the Past 5 Years: | | |
| Treasurer, U.S. Fund Administration & Reporting, Franklin Templeton Investments; and officer of 27 of the investment companies in Franklin |
| Templeton Investments. | | | | |
| |
| Aliya S. Gordon (1973) | Vice President Since 2009 | Not Applicable | Not Applicable |
| One Franklin Parkway | | | | |
| San Mateo, CA 94403-1906 | | | | |
| Principal Occupation During at Least the Past 5 Years: | | |
| Senior Associate General Counsel, Franklin Templeton Investments; and officer of 45 of the investment companies in Franklin Templeton |
| Investments. | | | | |
| |
| Steven J. Gray (1955) | Vice President Since 2009 | Not Applicable | Not Applicable |
| One Franklin Parkway | | | | |
| San Mateo, CA 94403-1906 | | | | |
| Principal Occupation During at Least the Past 5 Years: | | |
| Senior Associate General Counsel, Franklin Templeton Investments; Vice President, Franklin Templeton Distributors, Inc. and Franklin |
| Alternative Strategies Advisers, LLC; and officer of 45 of the investment companies in Franklin Templeton Investments. |
| |
| Edward B. Jamieson (1948) | President and Since 2010 | Not Applicable | Not Applicable |
| One Franklin Parkway | Chief Executive | | |
| San Mateo, CA 94403-1906 | Officer – | | | |
| | Investment | | | |
| | Management | | |
| Principal Occupation During at Least the Past 5 Years: | | |
| President, Chief Investment Officer and Director, Franklin Advisers, Inc.; Executive Vice President, Franklin Templeton Institutional, LLC; and |
| officer and/or trustee, as the case may be, of some of the other subsidiaries of Franklin Resources, Inc. and of 10 of the investment |
| companies in Franklin Templeton Investments. | | | |
| |
| Robert Lim (1948) | Vice | Since May 2016 | Not Applicable | Not Applicable |
| One Franklin Parkway | President | | | |
| San Mateo, CA 94403-1906 | – AML | | | |
| | Compliance | | | |
| Principal Occupation During at Least the Past 5 Years: | | |
| Vice President, Franklin Templeton Companies, LLC; Chief Compliance Officer, Franklin Templeton Distributors, Inc. and Franklin Templeton |
| Investor Services, LLC; and officer of 45 of the investment companies in Franklin Templeton Investments. |
| |
| Kimberly H. Novotny (1972) | Vice President Since 2013 | Not Applicable | Not Applicable |
| 300 S.E. 2nd Street | | | | |
| Fort Lauderdale, FL 33301-1923 | | | | |
| Principal Occupation During at Least the Past 5 Years: | | |
| Associate General Counsel, Franklin Templeton Investments; Vice President and Corporate Secretary, Fiduciary Trust International of the |
| South; Vice President, Templeton Investment Counsel, LLC; Assistant Secretary, Franklin Resources, Inc.; and officer of 45 of the investment |
| companies in Franklin Templeton Investments. | | | |
franklintempleton.com
Annual Report
131
FRANKLIN CUSTODIAN FUNDS
| | | | |
| Interested Board Members and Officers (continued) | |
| |
| |
| |
| | | | Number of Portfolios in | |
| Name, Year of Birth | | Length of | Fund Complex Overseen | Other Directorships Held |
| and Address | Position | Time Served | by Board Member* | During at Least the Past 5 Years |
| |
| Robert C. Rosselot (1960) | Chief | Since 2013 | Not Applicable | Not Applicable |
| 300 S.E. 2nd Street | Compliance | | | |
| Fort Lauderdale, FL 33301-1923 | Officer | | | |
| Principal Occupation During at Least the Past 5 Years: | | |
| Director, Global Compliance, Franklin Templeton Investments; Vice President, Franklin Templeton Companies, LLC; officer of 45 of the |
| investment companies in Franklin Templeton Investments; and formerly, Senior Associate General Counsel, Franklin Templeton Investments |
| (2007-2013); and Secretary and Vice President, Templeton Group of Funds (2004-2013). | |
| |
| Karen L. Skidmore (1952) | Vice President | Since 2006 | Not Applicable | Not Applicable |
| One Franklin Parkway | and Secretary | | | |
| San Mateo, CA 94403-1906 | | | | |
| Principal Occupation During at Least the Past 5 Years: | | |
| Senior Associate General Counsel, Franklin Templeton Investments; and officer of 45 of the investment companies in Franklin Templeton |
| Investments. | | | | |
| |
| Navid J. Tofigh (1972) | Vice President | Since 2015 | Not Applicable | Not Applicable |
| One Franklin Parkway | | | | |
| San Mateo, CA 94403-1906 | | | | |
| Principal Occupation During at Least the Past 5 Years: | | |
| Associate General Counsel, Franklin Templeton Investments; and officer of 45 of the investment companies in Franklin Templeton Investments. |
| |
| Craig S. Tyle (1960) | Vice President | Since 2005 | Not Applicable | Not Applicable |
| One Franklin Parkway | | | | |
| San Mateo, CA 94403-1906 | | | | |
| Principal Occupation During at Least the Past 5 Years: | | |
| General Counsel and Executive Vice President, Franklin Resources, Inc.; and officer of some of the other subsidiaries of Franklin Resources, |
| Inc. and of 45 of the investment companies in Franklin Templeton Investments. | |
| |
| Lori A. Weber (1964) | Vice President | Since 2013 | Not Applicable | Not Applicable |
| 300 S.E. 2nd Street | | | | |
| Fort Lauderdale, FL 33301-1923 | | | | |
| Principal Occupation During at Least the Past 5 Years: | | |
| Senior Associate General Counsel, Franklin Templeton Investments; Assistant Secretary, Franklin Resources, Inc.; Vice President and |
| Secretary, Templeton Investment Counsel, LLC; and officer of 45 of the investment companies in Franklin Templeton Investments. |
*We base the number of portfolios on each separate series of the U.S. registered investment companies within the Franklin Templeton Investments fund complex. These
portfolios have a common investment manager or affiliated investment managers.
**Gregory E. Johnson is considered to be an interested person of the Fund under the federal securities laws due to his position as an officer and director ofFranklin
Resources, Inc. (Resources), which is the parent company of the Fund’s investment manager and distributor. Rupert H. Johnson, Jr. is considered to be an interested person
of the Fund under the federal securities laws due to his position as officer and director and major shareholder of Resources.
Note 1: Rupert H. Johnson, Jr. is the uncle of Gregory E. Johnson.
Note 2: Officer information is current as of the date of this report. It is possible that after this date, information about officers may change.
Note 3: Effective November 1, 2016, Frank A. Olson ceased to be a trustee of the Trust.
The Sarbanes-Oxley Act of 2002 and Rules adopted by the Securities and Exchange Commission require the Fund to disclose whether the Fund’s Audit
Committee includes at least one member who is an audit committee financial expert within the meaning of such Act and Rules. The Fund’s Board has determined
that there is at least one such financial expert on the Audit Committee and has designated John B. Wilson as its audit committee financial expert. The Board
believes that Mr. Wilson qualifies as such an expert in view of his extensive business background and experience, including service as chief financial officer of
Staples, Inc. from 1992 to 1996. Mr. Wilson has been a Member and Chairman of the Fund’s Audit Committee since 2007. As a result of such background and
experience, the Board believes that Mr. Wilson has acquired an understanding of generally accepted accounting principles and financial statements, the general
application of such principles in connection with the accounting estimates, accruals and reserves, and analyzing and evaluating financial statements that
present a breadth and level of complexity of accounting issues generally comparable to those of the Fund, as well as an understanding of internal controls and
procedures for financial reporting and an understanding of audit committee functions. Mr. Wilson is an independent Board member as that term is defined under
the relevant Securities and Exchange Commission Rules and Releases.
The Statement of Additional Information (SAI) includes additional information about the board members and is available, without charge, upon request.
Shareholders may call (800) DIAL BEN/342-5236 to request the SAI.
132 Annual Report
franklintempleton.com
FRANKLIN CUSTODIAN FUNDS
Shareholder Information
Proxy Voting Policies and Procedures
The Trust’s investment manager has established Proxy Voting
Policies and Procedures (Policies) that the Trust uses to
determine how to vote proxies relating to portfolio securities.
Shareholders may view the Trust’s complete Policies online at
franklintempleton.com. Alternatively, shareholders may request
copies of the Policies free of charge by calling the Proxy Group
collect at (954) 527-7678 or by sending a written request
to: Franklin Templeton Companies, LLC, 300 S.E. 2nd Street,
Fort Lauderdale, FL 33301, Attention: Proxy Group. Copies of
the Trust’s proxy voting records are also made available online
at franklintempleton.com and posted on the U.S. Securities and
Exchange Commission’s website at sec.gov and reflect the
most recent 12-month period ended June 30.
Quarterly Statement of Investments
The Trust files a complete statement of investments with the
U.S. Securities and Exchange Commission for the first and
third quarters for each fiscal year on Form N-Q. Shareholders
may view the filed Form N-Q by visiting the Commission’s
website at sec.gov. The filed form may also be viewed and
copied at the Commission’s Public Reference Room in
Washington, DC. Information regarding the operations of the
Public Reference Room may be obtained by calling (800)
SEC-0330.
Householding of Reports and Prospectuses
You will receive each Fund’s financial reports every six
months as well as an annual updated summary prospectus
(prospectus available upon request). To reduce Fund expenses,
we try to identify related shareholders in a household and send
only one copy of the financial reports and summary prospectus.
This process, called “householding,” will continue indefinitely
unless you instruct us otherwise. If you prefer not to have these
documents householded, please call us at (800) 632-2301. At
any time you may view current prospectuses/summary
prospectuses and financial reports on our website. If you
choose, you may receive these documents through electronic
delivery.
franklintempleton.com
Annual Report
133
This page intentionally left blank.
This page intentionally left blank.
This page intentionally left blank.
| |
| Contents | |
| |
| Franklin Focused Growth Fund | 2 |
| Performance Summary | 5 |
| Your Fund’s Expenses | 6 |
| Financial Highlights and Statement of Investments | 7 |
| Financial Statements | 10 |
| Notes to Financial Statements | 13 |
| Report of Independent Registered | |
| Public Accounting Firm | 19 |
| Tax Information | 20 |
| Board Members and Officers | 21 |
| Shareholder Information | 25 |
Franklin Focused Growth Fund
We are pleased to bring you this annual report for Franklin Focused Growth Fund, which covers the period since the Fund’s inception on April 12, 2016, through September 30, 2016.
Your Fund’s Goal and Main Investments
The Fund seeks capital appreciation by investing in a portfolio of approximately 20–50 stocks that the investment manager believes have favorable growth, quality and valuation characteristics.
Performance Overview
For the period since inception on April 12, 2016, through September 30, 2016, the Fund’s Advisor Class shares had a cumulative total return of +9.30%. In comparison, the Russell 1000® Growth Index, which measures performance of those Russell 1000® Index companies with higher price-to-book ratios and higher forecasted growth values, generated a +5.61% total return.1 You can find more of the Fund’s performance data in the Performance Summary on page 5.
Performance data represent past performance, which does not guarantee future results. Investment return and principal value will fluctuate, and you may have a gain or loss when you sell your shares. Current performance may differ from figures shown.
Economic and Market Overview
The U.S. economy expanded during the period. The economy grew at a slightly faster pace in 2016’s third quarter, compared to the second quarter, mainly due to increases in consumer spending, business investment and exports. Manufacturing conditions remained volatile. The services sector continued to grow throughout the period. The unemployment rate began the period at 5.0% in April, dipped slightly in May, and then ticked back up to 5.0% in September.2 Monthly retail sales were volatile during the review period, and overall retail sales declined in August but rose in September, driven by sales in auto and auto components dealers, gasoline stations and grocery stores. Inflation, as measured by the Consumer Price Index, remained relatively subdued during the period.
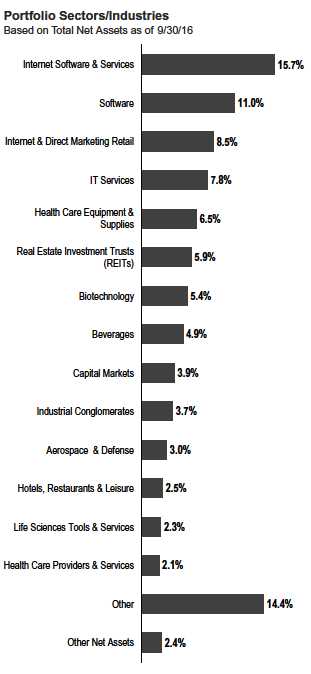
The U.S. Federal Reserve (Fed) kept its target interest rate at 0.25–0.50%, while considering when an increase might be appropriate. In July, the Fed Chair signaled the possibility of a near-term increase in interest rates citing strengthening labor
1. Source: Morningstar. Russell Investment Group is the source and owner of the trademarks, service marks and copyrights related to the Russell Indexes. Russell® is a
trademark of Russell Investment Group.
The index is unmanaged and includes reinvestment of any income or distributions. It does not reflect any fees, expenses or sales charges. One cannot invest directly in an
index, and an index is not representative of the Fund’s portfolio.
2. Source: Bureau of Labor Statistics.
The dollar value, number of shares or principal amount, and names of all portfolio holdings are listed in the Fund’s Statement of Investments (SOI).
TheSOIbeginsonpage8.
Annual Report
2
FRANKLIN FOCUSED GROWTH FUND
market conditions and the Fed’s optimism about future economic growth. However, following lower-than-expected job growth in August, the Fed kept interest rates unchanged at its September meeting and lowered its forecast for 2016 U.S. economic growth.
U.S. equity markets rose during the period, benefiting from mostly upbeat economic data and better corporate earnings in the U.S., signs of improvement in the Chinese and European economies, and ongoing easy-money policies from key central banks. The rally in crude oil prices and the Fed’s decision to keep interest rates unchanged near period-end boosted investor confidence. However, the U.K.’s historic referendum to leave the European Union (also known as the “Brexit”) and global growth concerns weighed on market sentiment. The broad U.S. stock market ended the period higher, as measured by the S&P 500 Index.
Investment Strategy
We are research-driven, bottom-up, fundamental investors. Under normal market conditions, we will invest predominantly in equity securities of companies that we believe offer compelling growth opportunities. The equity securities in which we will invest are predominantly common stock. We may invest in companies of any size, including small and medium capitalization companies. In addition to our main investments, we may invest a portion (up to 25%) of net assets in foreign securities. We will generally seek to maintain a portfolio consisting of securities of approximately 20–50 companies. Although we seek investments across a number of sectors, from time to time, based on economic conditions, we may have significant positions in particular sectors.
Manager’s Discussion
During the period under review, all investment sectors contributed to absolute performance including information technology (IT), consumer discretionary and health care.3 In IT, ARM Holdings was a major contributor.4 ARM is the leading licensor of merchant microprocessor architecture. ARM-based microprocessor cores power a majority of the world’s smart phones. ARM’s architecture rapidly gained share in the massive 32-bit microcontroller market during the period. Also, ARM’s business model, licenses and royalties generated the excellent operating margins. Social media company Facebook also helped Fund returns. The company continued to outperform expectations, and grew its advertising revenues for three consecutive quarters based on continued strong customer engagement, strong performance of its immersive advertising formats, and the initial ramp up of the monetization of its Instagram division. Chinese Internet portal Tencent Holdings was another key contributor. The company’s accelerated revenue growth was driven by the popularity of WeChat, a leading social/messaging platform in China. Tencent also built out its ecosystem around its social media platforms, which included games, subscriptions, advertising and online-to-offline services.
The consumer discretionary sector also helped Fund performance during the period. Internet retailer Amazon.com enjoyed strong performance, driven by record-breaking sales during its Prime Day promotion. Discount retailer Dollar Tree delivered solid results at its core Dollar Tree stores and continued to make progress improving and integrating its acquired Family Dollar stores.
Top 10 Holdings
9/30/16
| | |
| Company | % of Total | |
| Sector/Industry | Net Assets | |
| Amazon.com Inc. | 6.7 | % |
| Internet & Direct Marketing Retail | | |
| Alphabet Inc. | 5.9 | % |
| Internet Software & Services | | |
| Facebook Inc. | 5.6 | % |
| Internet Software & Services | | |
| Visa Inc. | 3.9 | % |
| IT Services | | |
| Celgene Corp. | 3.8 | % |
| Biotechnology | | |
| Microsoft Corp. | 3.7 | % |
| Software | | |
| Adobe Systems Inc. | 3.2 | % |
| Software | | |
| Constellation Brands Inc. | 3.0 | % |
| Beverages | | |
| Equinix Inc. | 3.0 | % |
| Real Estate Investment Trusts (REITs) | | |
| Raytheon Co. | 3.0 | % |
| Aerospace & Defense | | |
3. The IT sector comprises communications equipment, Internet software and services, IT Services, semiconductors and semiconductor equipment, and softwareintheSOI.
The consumer discretionary sector comprises hotels, restaurants and leisure; Internet and direct marketing retail; multiline retail; and textiles, apparel and luxury goods in the
SOI. The health care sector comprises biotechnology, health care equipment and services, health care providers and services, and life sciences tools and services in the SOI.
4. No longer held at period-end.
See www.franklintempletondatasources.com for additional data provider information.
FRANKLIN FOCUSED GROWTH FUND
In health care, IDEXX Laboratories performed well after its successful transition to a direct sales model boosted sales and profits. Shares of precision instrument manufacturer Mettler-Toledo International benefited from strong earnings growth based on strong execution of its operating platforms and a more aggressive share buyback program. Also, the company’s new business-management software enabled improved margins and capital management.
Some individual positions detracted from Fund results. Shares of biopharmaceutical company Bristol-Myers Squibb4 declined after Phase 3 trials of its lung cancer therapy Opdivo failed, bringing into question the company’s leadership in next-generation oncology medicines. Biopharmaceutical company Celgene Corporation had weak performance during the period. The company’s solid tumor therapy franchise was impacted by increased competition from immuno-oncology drugs. Also, Celgene lacked meaningful pipeline catalysts to drive outperformance. Furthermore, the company lagged its peers that provided dividends, which disappointed investors seeking yields.
Sportswear maker NIKE underperformed primarily because growth decelerated. Sales during the period were impacted by one-time factors including sports retailer bankruptcies and unfavorable weather leading to excess inventory.
Beauty products maker Estee Lauder Companies was negatively affected by unfavorable currency exchange rates due to its exposure to emerging markets, including China, whose growth trends have slowed during the past two years. Digital content company Netflix suffered during the period after its effort to enroll new subscribers failed to meet expectations. The company also raised prices for long-time subscribers.
Software engineering and IT consulting services provider EPAM Systems underperformed the IT sector during the period. This underperformance can be attributed to industry weakness based on investor concerns about tightening IT budgets and pricing pressure on new services contracts. Also, the company had high exposure to Europe, and its client list included large European banks. Given the Brexit-inspired economic weakness in the region and investors’ perceived financial instability of European banks, EPAM underperformed relative to other IT services companies with less exposure to Europe.
Salesforce.com, a developer of business software, made several acquisitions during the period. The company’s billings results in its second quarter, however, were disappointing, which further stoked investor fears in light of the recent acquisitions.
General Electric Company delivered strong performance in its fiscal year 2015. Its performance during the Fund’s reporting period, however, lagged the industrial sector as a result of relative underleverage to the short-cycle industrial recovery that began in February.

The foregoing information reflects our analysis, opinions and portfolio holdings as of September 30, 2016, the end of the reporting period. The way we implement our main investment strategies and the resulting portfolio holdings may change depending on factors such as market and economic conditions. These opinions may not be relied upon as investment advice or an offer for a particular security. The information is not a complete analysis of every aspect of any market, country, industry, security or the Fund. Statements of fact are from sources considered reliable, but the investment manager makes no representation or warranty as to their completeness or accuracy. Although historical performance is no guarantee of future results, these insights may help you understand our investment management philosophy.
Annual Report
4
FRANKLIN FOCUSED GROWTH FUND
Performance Summary as of September 30, 2016
The performance table does not reflect any taxes that a shareholder would pay on Fund dividends, capital gain distributions, if any, or any realized gains on the sale of Fund shares. Total return reflects reinvestment of the Fund’s dividends and capital gain distributions, if any, and any unrealized gains or losses.
Performance as of 9/30/161
Cumulative total return excludes sales charges. Average annual total return includes maximum sales charges. Sales charges will vary depending on the size of the investment and the class of share purchased. Advisor Class shares are offered without sales charges.
| | | | | | | | |
| | | | | | Total Annual Operating Expenses4 | |
| | Cumulative | | Average Annual | | | | | |
| Share Class | Total Return2 | | Total Return3 | | (with waiver) | | (without waiver) | |
| |
| Advisor | | | | | 1.00 | % | 4.52 | % |
| Since Inception (4/12/16) | +9.30 | % | +9.30 | % | | | | |
Performance data represent past performance, which does not guarantee future results. Investment return and principal value will
fluctuate, and you may have a gain or loss when you sell your shares. Current performance may differ from figures shown.
All investments involve risks, including possible loss of principal. To the extent the Fund focuses on particular countries, regions, industries, sectors or types of
investment from time to time, it may be subject to greater risks of adverse developments in such areas of focus than a fund that invests in a wider variety of
countries, regions, industries, sectors or investments. Growth stock prices reflect projections of future earnings or revenues, and can, therefore, fall dramatically
if the company fails to meet those projections. Foreign securities involve special risks, including currency fluctuations and economic and political uncertainties.
The Fund is actively managed but there is no guarantee that the manager’s investment decisions will produce the desired results. The Fund’s prospectus also
includes a description of the main investment risks.
1. The Fund has an expense reduction contractually guaranteed through 4/3/17. Fund investment results reflect the expense reduction; without this reduction, the results would
have been lower.
2. Cumulative total return represents the change in value of an investment over the periods indicated.
3. Average annual total return represents the average annual change in value of an investment over the periods indicated. Return for less than one year, ifany,hasnotbeen
annualized.
4. Figures are as stated in the Fund’s current prospectus and may differ from the expense ratios disclosed in the Financial Highlights in this report. In periods of market volatility,
assets may decline significantly, causing total annual Fund operating expenses to become higher than the figures shown.
5 Annual Report
FRANKLIN FOCUSED GROWTH FUND
Your Fund’s Expenses
As a Fund shareholder, you can incur two types of costs: (1) transaction costs, including sales charges (loads) on Fund purchases and redemptions; and (2) ongoing Fund costs, including management fees, distribution and service (12b-1) fees, and other Fund expenses. All mutual funds have ongoing costs, sometimes referred to as operating expenses. The table below shows ongoing costs of investing in the Fund and can help you understand these costs and compare them with those of other mutual funds. The table assumes a $1,000 investment held for the six months indicated.
Actual Fund Expenses
The table below provides information about actual account values and actual expenses in the columns under the heading “Actual.” In these columns the Fund’s actual return, which includes the effect of Fund expenses, is used to calculate the “Ending Account Value.” You can estimate the expenses you paid during the period by following these steps (of course, your account value and expenses will differ from those in this illustration): Divide your account value by $1,000 (if your account had an $8,600 value, then $8,600 ÷ $1,000 = 8.6). Then multiply the result by the number in the row for your class of shares under the headings “Actual” and “Expenses Paid During Period” (if Actual Expenses Paid During Period were $7.50, then 8.6 x $7.50 = $64.50). In this illustration, the actual expenses paid this period are $64.50.
Hypothetical Example for Comparison with Other Funds
Under the heading “Hypothetical” in the table, information is provided about hypothetical account values and hypothetical expenses based on the Fund’s actual expense ratio and an assumed rate of return of 5% per year before expenses, which is not the Fund’s actual return. This information may not be used to estimate the actual ending account balance or expenses you paid for the period, but it can help you compare ongoing costs of investing in the Fund with those of other funds. To do so, compare this 5% hypothetical example for the class of shares you hold with the 5% hypothetical examples that appear in the shareholder reports of other funds.
Please note that expenses shown in the table are meant to highlight ongoing costs and do not reflect any transactional costs. Therefore, information under the heading “Hypothetical” is useful in comparing ongoing costs only, and will not help you compare total costs of owning different funds. In addition, if transactional costs were included, your total costs would have been higher.
| | | | | | | | | | | | |
| | | | | | | Actual | | Hypothetical | | |
| | | | | (actual return after expenses) | | (5% annual return before expenses) | | |
| |
| | | | | | | Expenses | | | | Expenses | Net | |
| | | Beginning | | Ending | | Paid During | | Ending | | Paid During | Annualized | |
| Share | | Account | | Account | | Period | | Account | | Period | Expense | |
| Class | | Value1 | | Value 9/30/16 | | 4/12/16–9/30/162,3 | | Value 9/30/16 | | 4/1/16–9/30/162,3 | Ratio3 | |
| |
| Advisor | $ | 1,000 | $ | 1,093.00 | $ | 4.89 | $ | 1,018.69 | $ | 5.05 | 1.00 | % |
1. April 12, 2016 for Actual; April 1, 2016 for Hypothetical.
2. Expenses are equal to the annualized expense ratio for the six-month period as indicated above–in the far right column–multiplied by the simple average account value
over the period indicated, and then multiplied by183/366 to reflect the one-half year period for Hypothetical expenses. For Actual expenses, the multiplier is 171/366 to reflect
the number of days since commencement of operations.
3. Reflects expenses after fee waivers and expense reimbursements.
Annual Report
6
| | | |
| FRANKLIN CUSTODIAN FUNDS | | | |
| |
| |
| |
| Financial Highlights | | | |
| Franklin Focused Growth Fund | | | |
| | | Period Ended | |
| | | September 30, | |
| | | 2016 | a |
| Advisor Class | | | |
| Per share operating performance | | | |
| (for a share outstanding throughout the period) | | | |
| Net asset value, beginning of period | $ | 10.00 | |
| Income from investment operationsb: | | | |
| Net investment income (loss)c | | (0.01 | ) |
| Net realized and unrealized gains (losses) | | 0.94 | |
| Total from investment operations | | 0.93 | |
| Net asset value, end of period | $ | 10.93 | |
| |
| Total returnd | | 9.30 | % |
| |
| Ratios to average net assetse | | | |
| Expenses before waiver and payments by affiliates | | 4.76 | % |
| Expenses net of waiver and payments by affiliates | | 1.00 | % |
| Net investment income (loss) | | (0.18 | )% |
| |
| Supplemental data | | | |
| Net assets, end of period (000’s) | $ | 2,732 | |
| Portfolio turnover rate | | 7.46 | % |
aFor the period April 12, 2016 (commencement of operations) to September 30, 2016.
bThe amount shown for a share outstanding throughout the period may not correlate with the Statement of Operations for the period due to the timing of sales and
repurchases of the Fund’s shares in relation to income earned and/or fluctuating fair value of the investments of the Fund.
cBased on average daily shares outstanding.
dTotal return is not annualized for periods less than one year.
eRatios are annualized for periods less than one year, except for non-recurring expenses, if any.
| 7 | Annual Report | The accompanying notes are an integral part of these financial statements. |
FRANKLIN CUSTODIAN FUNDS
| | | |
| Statement of Investments, September 30, 2016 | | | |
| Franklin Focused Growth Fund | | | |
| | Shares | | Value |
| |
| Common Stocks 97.6% | | | |
| Aerospace & Defense 3.0% | | | |
| Raytheon Co | 600 | $ | 81,678 |
| Beverages 4.9% | | | |
| Constellation Brands Inc., A | 500 | | 83,245 |
| a Monster Beverage Corp | 350 | | 51,384 |
| | | | 134,629 |
| Biotechnology 5.4% | | | |
| a Biogen Inc | 140 | | 43,824 |
| a Celgene Corp | 1,000 | | 104,530 |
| | | | 148,354 |
| Capital Markets 3.9% | | | |
| BlackRock Inc | 200 | | 72,492 |
| MarketAxess Holdings Inc | 200 | | 33,118 |
| | | | 105,610 |
| Communications Equipment 2.0% | | | |
| a Palo Alto Networks Inc | 350 | | 55,766 |
| Food & Staples Retailing 2.0% | | | |
| Costco Wholesale Corp | 350 | | 53,379 |
| Health Care Equipment & Supplies 6.5% | | | |
| Danaher Corp | 550 | | 43,114 |
| a DexCom Inc | 400 | | 35,064 |
| a Edwards Lifesciences Corp | 500 | | 60,280 |
| a IDEXX Laboratories Inc | 350 | | 39,456 |
| | | | 177,914 |
| Health Care Providers & Services 2.1% | | | |
| UnitedHealth Group Inc | 400 | | 56,000 |
| Hotels, Restaurants & Leisure 2.5% | | | |
| Starbucks Corp | 1,250 | | 67,675 |
| Industrial Conglomerates 3.7% | | | |
| 3M Co | 300 | | 52,869 |
| General Electric Co | 1,600 | | 47,392 |
| | | | 100,261 |
| Internet & Direct Marketing Retail 8.5% | | | |
| a Amazon.com Inc | 220 | | 184,208 |
| a Netflix Inc | 200 | | 19,710 |
| a The Priceline Group Inc | 20 | | 29,430 |
| | | | 233,348 |
| Internet Software & Services 15.7% | | | |
| a Alibaba Group Holding Ltd., ADR (China) | 400 | | 42,316 |
| a Alphabet Inc., A | 200 | | 160,812 |
| a Facebook Inc., A | 1,200 | | 153,924 |
| a Nutanix Inc., A | 100 | | 3,700 |
| Tencent Holdings Ltd. (China) | 2,500 | | 68,653 |
| | | | 429,405 |
Annual Report
8
FRANKLIN CUSTODIAN FUNDS
STATEMENT OF INVESTMENTS
| | | |
| Franklin Focused Growth Fund (continued) | | | |
| | Shares | | Value |
| Common Stocks (continued) | | | |
| IT Services 7.8% | | | |
| a EPAM Systems Inc | 350 | $ | 24,258 |
| Mastercard Inc., A | 800 | | 81,416 |
| Visa Inc., A | 1,300 | | 107,510 |
| | | | 213,184 |
| Life Sciences Tools & Services 2.3% | | | |
| a Mettler-Toledo International Inc | 150 | | 62,975 |
| Machinery 1.5% | | | |
| Fortive Corp | 800 | | 40,720 |
| Multiline Retail 1.7% | | | |
| a Dollar Tree Inc | 600 | | 47,358 |
| Oil, Gas & Consumable Fuels 1.3% | | | |
| a Concho Resources Inc | 250 | | 34,338 |
| Personal Products 1.7% | | | |
| ELF Beauty Inc | 100 | | 2,812 |
| Estee Lauder Cos. Inc., A | 500 | | 44,280 |
| | | | 47,092 |
| Professional Services 1.0% | | | |
| a Verisk Analytics Inc | 350 | | 28,448 |
| Real Estate Investment Trusts (REITs) 5.9% | | | |
| American Tower Corp | 700 | | 79,331 |
| Equinix Inc | 230 | | 82,857 |
| | | | 162,188 |
| Semiconductors & Semiconductor Equipment 2.0% | | | |
| Xilinx Inc | 1,000 | | 54,340 |
| Software 11.0% | | | |
| a Adobe Systems Inc | 800 | | 86,832 |
| Microsoft Corp | 1,750 | | 100,800 |
| a Salesforce.com Inc | 1,000 | | 71,330 |
| a Workday Inc., A | 450 | | 41,260 |
| | | | 300,222 |
| Textiles, Apparel & Luxury Goods 1.2% | | | |
| NIKE Inc., B | 600 | | 31,590 |
| Total Common Stocks (Cost $2,439,113) | | | 2,666,474 |
| Total Investments (Cost $2,439,113) 97.6% | | | 2,666,474 |
| Other Assets, less Liabilities 2.4% | | | 65,598 |
| Net Assets 100.0%. | | $ | 2,732,072 |
See Abbreviations on page 18.
aNon-income producing.
| 9 | Annual Report | The accompanying notes are an integral part of these financial statements. |
FRANKLIN CUSTODIAN FUNDS
Financial Statements
Statement of Assets and Liabilities
September 30, 2016
| | |
| Franklin Focused Growth Fund | | |
| |
| Assets: | | |
| Investments in securities: | | |
| Cost | $ | 2,439,113 |
| Value | $ | 2,666,474 |
| Cash | | 60,549 |
| Receivables: | | |
| Dividends | | 918 |
| Affiliates. | | 47,939 |
| Offering costs. | | 26,575 |
| Total assets | | 2,802,455 |
| Liabilities: | | |
| Payables: | | |
| Investment securities purchased | | 1,600 |
| Professional fees | | 67,324 |
| Accrued expenses and other liabilities | | 1,459 |
| Total liabilities | | 70,383 |
| Net assets, at value | $ | 2,732,072 |
| Net assets consist of: | | |
| Paid-in capital | $ | 2,495,247 |
| Undistributed net investment income | | 2,576 |
| Net unrealized appreciation (depreciation) | | 227,361 |
| Accumulated net realized gain (loss) | | 6,888 |
| Net assets, at value | $ | 2,732,072 |
| Shares outstanding | | 250,000 |
| Net asset value and maximum offering price per share | $ | 10.93 |
The accompanying notes are an integral part of these financial statements. | Annual Report 10
|
| FRANKLIN CUSTODIAN FUNDS |
| FINANCIAL STATEMENTS |
Statement of Operations
for the period ended September 30, 2016a
| | | |
| Franklin Focused Growth Fund | | | |
| |
| Investment income: | | | |
| Dividends | $ | 10,002 | |
| Expenses: | | | |
| Management fees (Note 3a) | | 10,372 | |
| Custodian fees (Note 4) | | 12 | |
| Reports to shareholders | | 1,924 | |
| Registration and filing fees | | 266 | |
| Professional fees | | 32,633 | |
| Amortization of offering costs | | 23,425 | |
| Other | | 1,881 | |
| Total expenses | | 70,513 | |
| Expenses waived/paid by affiliates (Note 3e) | | (58,311 | ) |
| Net expenses | | 12,202 | |
| Net investment income (loss) | | (2,200 | ) |
| Realized and unrealized gains (losses): | | | |
| Net realized gain (loss) from: | | | |
| Investments | | 6,888 | |
| Foreign currency transactions | | 23 | |
| Net realized gain (loss) | | 6,911 | |
| Net change in unrealized appreciation (depreciation) on investments | | 227,361 | |
| Net realized and unrealized gain (loss) | | 234,272 | |
| Net increase (decrease) in net assets resulting from operations | $ | 232,072 | |
aFor the period April 12, 2016 (commencement of operations) to September 30, 2016.
| 11 | Annual Report | The accompanying notes are an integral part of these financial statements. |
| | | |
| | | FRANKLIN CUSTODIAN FUNDS | |
| | | FINANCIAL STATEMENTS | |
| |
| |
| Statement of Changes in Net Assets | | | |
| |
| Franklin Focused Growth Fund | | | |
| |
| | | Period Ended | |
| | | September 30, 2016a | |
| Increase (decrease) in net assets: | | | |
| Operations: | | | |
| Net investment income (loss) | $ | (2,200 | ) |
| Net realized gain (loss) | | 6,911 | |
| Net change in unrealized appreciation (depreciation) | | 227,361 | |
| Net increase (decrease) in net assets resulting from operations | | 232,072 | |
| Capital share transactions (Note 2) | | 2,500,000 | |
| Net increase (decrease) in net assets | | 2,732,072 | |
| Net assets: | | | |
| End of period | $ | 2,732,072 | |
| Undistributed net investment income included in net assets: | | | |
| End of period | $ | 2,576 | |
aFor the period April 12, 2016 (commencement of operations) to September 30, 2016.
The accompanying notes are an integral part of these financial statements. | Annual Report 12
FRANKLIN CUSTODIAN FUNDS
Notes to Financial Statements
Franklin Focused Growth Fund
1. Organization and Significant Accounting Policies
Franklin Custodian Funds (Trust) is registered under the Investment Company Act of 1940 (1940 Act) as an open-end management investment company, consisting of six separate funds and applies the specialized accounting and reporting guidance in U.S. Generally Accepted Accounting Principles (U.S. GAAP). Franklin Focused Growth Fund (Fund) is included in this report. The financial statements of the remaining funds in the Trust are presented separately. The Fund offers five classes of shares: Class A, Class C, Class R, Class R6 and Advisor Class. Each class differs by its initial sales load, contingent deferred sales charges, voting rights on matters affecting a single class its exchange privilege and fees primarily due to a differing arrangements for distribution and transfer agent fees.
The Fund commenced operations effective April 12, 2016 with one class of shares, Advisor Class.
The following summarizes the Fund’s significant accounting policies.
a. Financial Instrument Valuation
The Fund’s investments in financial instruments are carried at fair value daily. Fair value is the price that would be received to sell an asset or paid to transfer a liability in an orderly transaction between market participants on the measurement date. The Fund calculates the net asset value (NAV) per share as of 4 p.m. Eastern time each day the New York Stock Exchange (NYSE) is open for trading. Under compliance policies and procedures approved by the Fund’s Board of Trustees (the Board), the Fund’s administrator has responsibility for oversight of valuation, including leading the cross-functional Valuation Committee (VC). The VC provides administration and oversight of the Fund’s valuation policies and procedures, which are approved annually by the Board. Among other things, these procedures allow the Fund to utilize independent pricing services, quotations from securities and financial instrument dealers, and other market sources to determine fair value.
Equity securities listed on an exchange or on the NASDAQ National Market System are valued at the last quoted sale price or the official closing price of the day, respectively. Foreign equity securities are valued as of the close of trading on the foreign stock exchange on which the security is primarily traded or as of 4 p.m. Eastern time, whichever is earlier. The value is then converted into its U.S. dollar equivalent at the foreign exchange rate in effect at 4 p.m. Eastern time on the day that the value of the security is determined. Over-the-counter (OTC) securities are valued within the range of the most recent quoted bid and ask prices. Securities that trade in multiple markets or on multiple exchanges are valued according to the broadest and most representative market. Certain equity securities are valued based upon fundamental characteristics or relationships to similar securities.
The Fund has procedures to determine the fair value of financial instruments for which market prices are not reliable or readily available. Under these procedures, the VC convenes on a regular basis to review such financial instruments and considers a number of factors, including significant unobservable valuation inputs, when arriving at fair value. The VC primarily employs a market-based approach which may use related or comparable assets or liabilities, recent transactions, market multiples, book values, and other relevant information for the investment to determine the fair value of the investment. An income-based valuation approach may also be used in which the anticipated future cash flows of the investment are discounted to calculate fair value. Discounts may also be applied due to the nature or duration of any restrictions on the disposition of the investments. Due to the inherent uncertainty of valuations of such investments, the fair values may differ significantly from the values that would have been used had an active market existed. The VC employs various methods for calibrating these valuation approaches including a regular review of key inputs and assumptions, transactional back-testing or disposition analysis, and reviews of any related market activity.
Trading in securities on foreign securities stock exchanges and OTC markets may be completed before 4 p.m. Eastern time. In addition, trading in certain foreign markets may not take place on every NYSE business day. Occasionally, events occur between the time at which trading in a foreign security is completed and the close of the NYSE that might call into question the reliability of the value of a portfolio security held by the Fund. As a result, differences may arise between the value of the Fund’s portfolio securities as determined at the foreign market close and the latest indications of value at the close of the NYSE. In order to minimize the potential for these differences, the VC monitors price movements following the close of trading in foreign stock markets through a series of country specific market proxies (such as baskets of American
FRANKLIN CUSTODIAN FUNDS
NOTES TO FINANCIAL STATEMENTS
Franklin Focused Growth Fund (continued)
Depositary Receipts, futures contracts and exchange traded funds). These price movements are measured against established trigger thresholds for each specific market proxy to assist in determining if an event has occurred that may call into question the reliability of the values of the foreign securities held by the Fund. If such an event occurs, the securities may be valued using fair value procedures, which may include the use of independent pricing services.
When the last day of the reporting period is a non-business day, certain foreign markets may be open on those days that the NYSE is closed, which could result in differences between the value of the Fund’s portfolio securities on the last business day and the last calendar day of the reporting period. Any significant security valuation changes due to an open foreign market are adjusted and reflected by the Fund for financial reporting purposes.
b. Foreign Currency Translation
Portfolio securities and other assets and liabilities denominated in foreign currencies are translated into U.S. dollars based on the exchange rate of such currencies against U.S. dollars on the date of valuation. The Fund may enter into foreign currency exchange contracts to facilitate transactions denominated in a foreign currency. Purchases and sales of securities, income and expense items denominated in foreign currencies are translated into U.S. dollars at the exchange rate in effect on the transaction date. Portfolio securities and assets and liabilities denominated in foreign currencies contain risks that those currencies will decline in value relative to the U.S. dollar. Occasionally, events may impact the availability or reliability of foreign exchange rates used to convert the U.S. dollar equivalent value. If such an event occurs, the foreign exchange rate will be valued at fair value using procedures established and approved by the Board.
The Fund does not separately report the effect of changes in foreign exchange rates from changes in market prices on securities held. Such changes are included in net realized and unrealized gain or loss from investments in the Statement of Operations.
Realized foreign exchange gains or losses arise from sales of foreign currencies, currency gains or losses realized between the trade and settlement dates on securities transactions and the difference between the recorded amounts of dividends, interest, and foreign withholding taxes and the U.S. dollar equivalent of the amounts actually received or paid. Net unrealized foreign exchange gains and losses arise from changes in foreign exchange rates on foreign denominated assets and liabilities other than investments in securities held at the end of the reporting period.
c. Income and Deferred Taxes
It is the Fund’s policy to qualify as a regulated investment company under the Internal Revenue Code. The Fund intends to distribute to shareholders substantially all of its taxable income and net realized gains to relieve it from federal income and excise taxes. As a result, no provision for U.S. federal income taxes is required.
The Fund may be subject to foreign taxation related to income received, capital gains on the sale of securities and certain foreign currency transactions in the foreign jurisdictions in which it invests. Foreign taxes, if any, are recorded based on the tax regulations and rates that exist in the foreign markets in which the Fund invests. When a capital gain tax is determined to apply, the Fund records an estimated deferred tax liability in an amount that would be payable if the securities were disposed of on the valuation date.
The Fund may recognize an income tax liability related to its uncertain tax positions under U.S. GAAP when the uncertain tax position has a less than 50% probability that it will be sustained upon examination by the tax authorities based on its technical merits. As of September 30, 2016, the Fund has determined that no tax liability is required in its financial statements related to uncertain tax positions for any open tax years (or expected to be taken in future tax years). Open tax years are those that remain subject to examination and are based on each tax jurisdiction’s statute of limitation.
d. Security Transactions, Investment Income, Expenses and Distributions
Security transactions are accounted for on trade date. Realized gains and losses on security transactions are determined on a specific identification basis. Estimated expenses are accrued daily. Dividend income is recorded on the ex-dividend date except for certain dividends from securities where the dividend rate is not available. In such cases, the dividend is recorded as soon as the information is received by the Fund. Distributions to shareholders are recorded on the ex-dividend date and are determined according to income tax regulations (tax basis). Distributable earnings determined on a tax basis may differ from earnings recorded in accordance with U.S. GAAP. These
Annual Report
14
FRANKLIN CUSTODIAN FUNDS
NOTES TO FINANCIAL STATEMENTS
Franklin Focused Growth Fund (continued)
1. Organization and Significant Accounting
Policies (continued)
d. Security Transactions, Investment Income, Expenses and Distributions (continued)
differences may be permanent or temporary. Permanent differences are reclassified among capital accounts to reflect their tax character. These reclassifications have no impact on net assets or the results of operations. Temporary differences are not reclassified, as they may reverse in subsequent periods.
Common expenses incurred by the Trust are allocated among the Funds based on the ratio of net assets of each Fund to the combined net assets of the Trust. Fund specific expenses are charged directly to the Fund that incurred the expense.
Realized and unrealized gains and losses and net investment income, not including class specific expenses are allocated daily to each of the shares classes based upon the relative proportion of net assets of each class. Differences in per share distributions, by class, are generally due to differences in class specific expenses.
e. Offering Costs
Offering costs are amortized on a straight line basis over twelve months.
2. Shares of Beneficial Interest
f. Accounting Estimates
The preparation of financial statements in accordance with U.S. GAAP requires management to make estimates and assumptions that affect the reported amounts of assets and liabilities at the date of the financial statements and the amounts of income and expenses during the reporting period. Actual results could differ from those estimates.
g. Guarantees and Indemnifications
Under the Trust’s organizational documents, its officers and trustees are indemnified by the Trust against certain liabilities arising out of the performance of their duties to the Trust. Additionally, in the normal course of business, the Trust, on behalf of the Fund, enters into contracts with service providers that contain general indemnification clauses. The Trust’s maximum exposure under these arrangements is unknown as this would involve future claims that may be made against the Trust that have not yet occurred. Currently, the Trust expects the risk of loss to be remote.
At September 30, 2016, there were an unlimited number of shares authorized (without par value). Transactions in the Fund’s shares were as follows:
| | | |
| | Period Ended |
| | September 30, 2016a |
| | Shares | | Amount |
| Shares sold | 250,000 | $ | 2,500,000 |
| aFor the period April 12, 2016 (commencement of operations) to September 30, 2016. | | | |
3. Transactions with Affiliates
Franklin Resources, Inc. is the holding company for various subsidiaries that together are referred to as Franklin Templeton Investments. Certain officers and trustees of the Trust are also officers and/or directors of the following subsidiaries:
| |
| Subsidiary | Affiliation |
| Franklin Advisers, Inc. (Advisers) | Investment manager |
| Franklin Templeton Services, LLC (FT Services) | Administrative manager |
| Franklin Templeton Distributors, Inc. (Distributors) | Principal underwriter |
| Franklin Templeton Investor Services, LLC (Investor Services) | Transfer agent |
FRANKLIN CUSTODIAN FUNDS
NOTES TO FINANCIAL STATEMENTS
Franklin Focused Growth Fund (continued)
a. Management Fees
The Fund pays an investment management fee to Advisers based on the average daily net assets of the Fund as follows:
| | |
| Annualized Fee Rate | | Net Assets |
| 0.850 | % | Up to and including $500 million |
| 0.800 | % | Over $500 million, up to and including $1 billion |
| 0.750 | % | Over $1 billion, up to and including $3 billion |
| 0.730 | % | Over $3 billion, up to and including $5 billion |
| 0.700 | % | In excess of $5 billion |
For the period ended September 30, 2016, the annualized effective investment management fee rate was 0.850% of the Fund’s average daily net assets.
b. Administrative Fees
Under an agreement with Advisers, FT Services provides administrative services to the Fund. The fee is paid by Advisers based on each of the Fund’s average daily net assets, and is not an additional expense of the Fund.
c. Distribution Fees
The Board has adopted distribution plans for each share class, with the exception of Class R6 and Advisor Class shares, pursuant to Rule 12b-1 under the 1940 Act. Under the Fund’s Class A reimbursement distribution plan, the Fund reimburses Distributors for costs incurred in connection with the servicing, sale and distribution of the Fund’s shares up to the maximum annual plan rate. Under the Class A reimbursement distribution plan, costs exceeding the maximum for the current plan year cannot be reimbursed in subsequent periods. In addition, under the Fund’s Class C and R compensation distribution plans, the Fund pays Distributors for costs incurred in connection with the servicing, sale and distribution of the Fund’s shares up to the maximum annual plan rate for each class. The plan year, for purposes of monitoring compliance with the maximum annual plan rates, is February 1 through January 31.
The maximum annual plan rates, based on the average daily net assets, for each class, are as follows:
| | |
| Class A | 0.25 | % |
| Class C | 1.00 | % |
| Class R | 0.50 | % |
| |
| d. Transfer Agent Fees | | |
Each class of shares, except for Class R6, pays transfer agent fees to Investor Services for its performance of shareholder servicing obligations and reimburses Investor Services for out of pocket expenses incurred, including shareholder servicing fees paid to third parties. These fees are allocated daily based upon their relative proportion of such classes’ aggregate net assets. Class R6 pays Investor Services transfer agent fees specific to that class.
e. Waiver and Expense Reimbursements
Advisers and FT Services contractually agreed in advance to waive or limit their respective fees and to assume as their own expense certain expenses otherwise payable by the Fund so that the expenses (excluding distribution fees, acquired fund fees and expenses) of the Fund do not exceed 1.00% based on the average net assets of each class (other than certain non-routine expenses or costs, including those relating to litigation, indemnification, reorganizations, and liquidations) until April 3, 2017. Total expenses waived or paid are not subject to recapture subsequent to the Fund’s fiscal year end.
Annual Report
16
FRANKLIN CUSTODIAN FUNDS
NOTES TO FINANCIAL STATEMENTS
Franklin Focused Growth Fund (continued)
| 3. | Transactions with Affiliates (continued) |
| f. | Other Affiliated Transactions |
At September 30, 2016, Franklin Resources Inc. owned 100% of the Fund’s outstanding shares. Investment activities of this shareholder could have a material impact on the Fund.
4. Expense Offset Arrangement
The Fund has entered into an arrangement with their custodian whereby credits realized as a result of uninvested cash balances are used to reduce a portion of the Funds’ custodian expenses. During the period ended September 30, 2016, there were no credits earned.
5. Income Taxes
At September 30, 2016, the cost of investments, net unrealized appreciation (depreciation), and undistributed ordinary income for income tax purposes were as follows:
| | | |
| Cost of investments | $ | 2,439,113 | |
| |
| Unrealized appreciation | $ | 254,472 | |
| Unrealized depreciation | | (27,111 | ) |
| Net unrealized appreciation (depreciation) | $ | 227,361 | |
| Distributable earnings - undistributed ordinary income | $ | 9,463 | |
Differences between income and/or capital gains as determined on a book basis and a tax basis are primarily due to differing treatment of offering costs.
6. Investment Transactions
Purchases and sales of investments (excluding short term securities) for the period ended September 30, 2016, aggregated $2,624,320 and $192,096, respectively.
7. Fair Value Measurements
The Fund follows a fair value hierarchy that distinguishes between market data obtained from The independent sources (observable inputs) and the Fund’s own market assumptions (unobservable inputs). These inputs are used in determining the value of the Fund’s financial instruments and are summarized in the following fair value hierarchy:
- Level 1 – quoted prices in active markets for identical financial instruments
- Level 2 – other significant observable inputs (including quoted prices for similar financial instruments, interest rates, prepayment speed, credit risk, etc.)
- Level 3 – significant unobservable inputs (including the Fund’s own assumptions in determining the fair value of financial instruments)
The input levels are not necessarily an indication of the risk or liquidity associated with financial instruments at that level.
FRANKLIN CUSTODIAN FUNDS
NOTES TO FINANCIAL STATEMENTS
Franklin Focused Growth Fund (continued)
For movements between the levels within the fair value hierarchy, the Fund has adopted a policy of recognizing the transfers as of the date of the underlying event which caused the movement.
At September 30, 2016, all of the Fund’s investments in financial instruments carried at fair value were valued using Level 1 inputs.
8. Subsequent Events
The Fund has evaluated subsequent events through the issuance of the financial statements and determined that no events have occurred that require disclosure.
|
| Abbreviations |
| Selected Portfolio |
| ADR American Depository Receipt |
Annual Report
18
FRANKLIN CUSTODIAN FUNDS
Report of Independent Registered Public Accounting Firm
To the Board of Trustees and Shareholders of Franklin Focused Growth Fund
In our opinion, the accompanying statement of assets and liabilities, including the statement of investments, and the related statements of operations and of changes in net assets and the financial highlights present fairly, in all material respects, the financial position of The Franklin Focused Growth Fund (the “Fund”) at September 30, 2016, and the results of its operations, the changes in its net assets and the financial highlights for the period April 12, 2016 (commencement of operations) through September 30, 2016, in conformity with accounting principles generally accepted in the United States of America. These financial statements and financial highlights (hereafter referred to as “financial statements”) are the responsibility of the Fund’s management. Our responsibility is to express an opinion on these financial statements based on our audit. We conducted our audit of these financial statements in accordance with the standards of the Public Company Accounting Oversight Board (United States). Those standards require that we plan and perform the audit to obtain reasonable assurance about whether the financial statements are free of material misstatement. An audit includes examining, on a test basis, evidence supporting the amounts and disclosures in the financial statements, assessing the accounting principles used and significant estimates made by management, and evaluating the overall financial statement presentation. We believe that our audit, which included confirmation of securities at September 30, 2016 by correspondence with the custodian, transfer agent and brokers, provides a reasonable basis for our opinion.
PricewaterhouseCoopers LLP
San Francisco, California
November 16, 2016
FRANKLIN CUSTODIAN FUNDS
Tax Information (unaudited)
Franklin Focused Growth Fund
Under Section 854(b)(1)(B) of the Internal Revenue Code (Code), the Fund hereby reports the maximum amount allowable but no less than $8,313 as qualified dividends for purposes of the maximum rate under Section 1(h)(11) of the Code for the period ended September 30, 2016.
Distributions, including qualifies dividend income, paid during calendar year 2016 will be reported to shareholders on Form 1099-DIV by mid-February 2017. Shareholders are advised to check with their tax advisors for information on the treatment of these amounts on their individual income tax returns.
Annual Report
20
FRANKLIN CUSTODIAN FUNDS
Board Members and Officers
The name, year of birth and address of the officers and board members, as well as their affiliations, positions held with the Trust, principal occupations during at least the past five years and number of U.S. registered portfolios overseen in the Franklin Templeton Investments fund complex, are shown below. Generally, each board member serves until that person’s successor is elected and qualified.
| | | | |
| Independent Board Members | | | |
| |
| | | | Number of Portfolios in | |
| Name, Year of Birth | | Length of | Fund Complex Overseen | Other Directorships Held |
| and Address | Position | Time Served | by Board Member* | During at Least the Past 5 Years |
| |
| Harris J. Ashton (1932) | Trustee | Since 1976 | 143 | Bar-S Foods (meat packing company) |
| One Franklin Parkway | | | | (1981-2010). |
| San Mateo, CA 94403-1906 | | | | |
| Principal Occupation During at Least the Past 5 Years: | | |
| Director of various companies; and formerly, Director, RBC Holdings, Inc. (bank holding company) (until 2002); and President, Chief Executive |
| Officer and Chairman of the Board, General Host Corporation (nursery and craft centers) (until 1998). | |
| |
| Mary C. Choksi (1950) | Trustee | Since 2014 | 137 | Avis Budget Group Inc. (car rental) |
| One Franklin Parkway | | | | (2007-present), Omnicom Group Inc. |
| San Mateo, CA 94403-1906 | | | | (advertising and marketing |
| | | | | communications services) |
| | | | | (2011-present) and H.J. Heinz |
| | | | | Company (processed foods and allied |
| | | | | products) (1998-2006). |
| Principal Occupation During at Least the Past 5 Years: | | |
| Senior Advisor, Strategic Investment Group (investment management group) (2015-present); director of various companies; and formerly, |
| Founding Partner and Senior Managing Director, Strategic Investment Group (1987–2015); Founding Partner and Managing Director, Emerging |
| Markets Management LLC (investment management firm) (1987-2011); and Loan Officer/Senior Loan Officer/Senior Pension Investment |
| Officer, World Bank Group (international financial institution) (1977-1987). | |
| |
| Edith E. Holiday (1952) | Trustee | Since 1998 | 143 | Hess Corporation (exploration and |
| One Franklin Parkway | | | | refining of oil and gas) (1993-present), |
| San Mateo, CA 94403-1906 | | | | Canadian National Railway (railroad) |
| | | | | (2001-present), White Mountains |
| | | | | Insurance Group, Ltd. (holding |
| | | | | company) (2004-present), RTI |
| | | | | International Metals, Inc. (manufacture |
| | | | | and distribution of titanium) |
| | | | | (1999-2015) and H.J. Heinz Company |
| | | | | (processed foods and allied products) |
| | | | | (1994-2013). |
| Principal Occupation During at Least the Past 5 Years: | | |
| Director or Trustee of various companies and trusts; and formerly, Assistant to the President of the United States and Secretary of the |
| Cabinet (1990-1993); General Counsel to the United States Treasury Department (1989-1990); and Counselor to the Secretary and Assistant |
| Secretary for Public Affairs and Public Liaison-United States Treasury Department (1988-1989). | |
| |
| J. Michael Luttig (1954) | Trustee | Since 2009 | 143 | Boeing Capital Corporation (aircraft |
| One Franklin Parkway | | | | financing) (2006-2013). |
| San Mateo, CA 94403-1906 | | | | |
| Principal Occupation During at Least the Past 5 Years: | | |
| Executive Vice President, General Counsel and member of the Executive Council, The Boeing Company (aerospace company) (2006-present); |
| and formerly, Federal Appeals Court Judge, U.S. Court of Appeals for the Fourth Circuit (1991-2006). | |
FRANKLIN CUSTODIAN FUNDS
| | | | |
| Independent Board Members (continued) | | |
| |
| |
| |
| | | | Number of Portfolios in | |
| Name, Year of Birth | | Length of | Fund Complex Overseen | Other Directorships Held |
| and Address | Position | Time Served | by Board Member* | During at Least the Past 5 Years |
| |
| Larry D. Thompson | Trustee | Since 2007 | 143 | The Southern Company (energy |
| One Franklin Parkway | | | | company) (2014-present; previously |
| San Mateo, CA 94403-1906 | | | | 2010-2012), Graham Holdings |
| | | | | Company (education and media |
| | | | | organization) (2011-present) and |
| | | | | Cbeyond, Inc. (business |
| | | | | communications provider) |
| | | | | (2010-2012). |
| Principal Occupation During at Least the Past 5 Years: | | |
| Director of various companies; John A. Sibley Professor of Corporate and Business Law, University of Georgia School of Law (2015-present; |
| previously 2011-2012); and formerly, Executive Vice President - Government Affairs, General Counsel and Corporate Secretary, PepsiCo, Inc. |
| (consumer products) (2012-2014); Senior Vice President - Government Affairs, General Counsel and Secretary, PepsiCo, Inc. (2004-2011); |
| Senior Fellow of The Brookings Institution (2003-2004); Visiting Professor, University of Georgia School of Law (2004); and Deputy Attorney |
| General, U.S. Department of Justice (2001-2003). | | | |
| |
| John B. Wilson (1959) | Lead | Trustee since | 117 | None |
| One Franklin Parkway | Independent | 2007 and Lead | | |
| San Mateo, CA 94403-1906 | Trustee | Independent | | |
| | | Trustee since 2008 | | |
| Principal Occupation During at Least the Past 5 Years: | | |
| President, Staples Europe (office supplies) (2012-present); President and Founder, Hyannis Port Capital, Inc. (real estate and private equity |
| investing); serves on private and non-profit boards; and formerly, Chief Operating Officer and Executive Vice President, Gap, Inc. (retail) |
| (1996-2000); Chief Financial Officer and Executive Vice President – Finance and Strategy, Staples, Inc. (1992-1996); Senior Vice President – |
| Corporate Planning, Northwest Airlines, Inc. (airlines) (1990-1992); and Vice President and Partner, Bain & Company (consulting firm) |
| (1986-1990). | | | | |
| |
| |
| Interested Board Members and Officers | | |
| |
| | | | Number of Portfolios in | |
| Name, Year of Birth | | Length of | Fund Complex Overseen | Other Directorships Held |
| and Address | Position | Time Served | by Board Member* | During at Least the Past 5 Years |
| |
| **Gregory E. Johnson (1961) | Trustee | Since 2013 | 159 | None |
| One Franklin Parkway | | | | |
| San Mateo, CA 94403-1906 | | | | |
| Principal Occupation During at Least the Past 5 Years: | | |
| Chairman of the Board, Member - Office of the Chairman, Director and Chief Executive Officer, Franklin Resources, Inc.; officer and/or director |
| or trustee, as the case may be, of some of the other subsidiaries of Franklin Resources, Inc. and of 44 of the investment companies in Franklin |
| Templeton Investments; Vice Chairman, Investment Company Institute; and formerly, President, Franklin Resources, Inc. (1994-2015). |
| |
| **Rupert H. Johnson, Jr. (1940) | Chairman of | Chairman of the | 143 | None |
| One Franklin Parkway | the Board, | Board since 2013, | | |
| San Mateo, CA 94403-1906 | Trustee and | Trustee since 1983 | | |
| | Vice President | and Vice President | | |
| | | since 1982 | | |
| Principal Occupation During at Least the Past 5 Years: | | |
| Vice Chairman, Member - Office of the Chairman and Director, Franklin Resources, Inc.; Director, Franklin Advisers, Inc.; Senior Vice |
| President, Franklin Advisory Services, LLC; and officer and/or director or trustee, as the case may be, of some of the other subsidiaries of |
| Franklin Resources, Inc. and of 42 of the investment companies in Franklin Templeton Investments. | |
| |
| Alison E. Baur (1964) | Vice President | Since 2012 | Not Applicable | Not Applicable |
| One Franklin Parkway | | | | |
| San Mateo, CA 94403-1906 | | | | |
| Principal Occupation During at Least the Past 5 Years: | | |
| Deputy General Counsel, Franklin Templeton Investments; and officer of some of the other subsidiaries of Franklin Resources, Inc. and of 45 |
| of the investment companies in Franklin Templeton Investments. | | |
Annual Report
22
FRANKLIN CUSTODIAN FUNDS
| | | | |
| Interested Board Members and Officers (continued) | |
| |
| |
| |
| | | | Number of Portfolios in | |
| Name, Year of Birth | | Length of | Fund Complex Overseen | Other Directorships Held |
| and Address | Position | Time Served | by Board Member* | During at Least the Past 5 Years |
| |
| Laura F. Fergerson (1962) | Chief Executive Since 2009 | Not Applicable | Not Applicable |
| One Franklin Parkway | Officer – | | | |
| San Mateo, CA 94403-1906 | Finance and | | |
| | Administration | | |
| Principal Occupation During at Least the Past 5 Years: | | |
| Senior Vice President, Franklin Templeton Services, LLC; Vice President, Franklin Advisers, Inc. and Franklin Templeton Institutional, LLC; and |
| officer of 45 of the investment companies in Franklin Templeton Investments. | |
| |
| Gaston Gardey (1967) | Treasurer, | Since 2009 | Not Applicable | Not Applicable |
| One Franklin Parkway | Chief Financial | | |
| San Mateo, CA 94403-1906 | Officer and | | | |
| | Chief | | | |
| | Accounting | | | |
| | Officer | | | |
| Principal Occupation During at Least the Past 5 Years: | | |
| Treasurer, U.S. Fund Administration & Reporting, Franklin Templeton Investments; and officer of 27 of the investment companies in Franklin |
| Templeton Investments. | | | | |
| |
| Aliya S. Gordon (1973) | Vice President Since 2009 | Not Applicable | Not Applicable |
| One Franklin Parkway | | | | |
| San Mateo, CA 94403-1906 | | | | |
| Principal Occupation During at Least the Past 5 Years: | | |
| Senior Associate General Counsel, Franklin Templeton Investments; and officer of 45 of the investment companies in Franklin Templeton |
| Investments. | | | | |
| |
| Steven J. Gray (1955) | Vice President Since 2009 | Not Applicable | Not Applicable |
| One Franklin Parkway | | | | |
| San Mateo, CA 94403-1906 | | | | |
| Principal Occupation During at Least the Past 5 Years: | | |
| Senior Associate General Counsel, Franklin Templeton Investments; Vice President, Franklin Templeton Distributors, Inc. and Franklin |
| Alternative Strategies Advisers, LLC; and officer of 45 of the investment companies in Franklin Templeton Investments. |
| |
| Edward B. Jamieson (1948) | President and Since 2010 | Not Applicable | Not Applicable |
| One Franklin Parkway | Chief Executive | | |
| San Mateo, CA 94403-1906 | Officer – | | | |
| | Investment | | | |
| | Management | | |
| Principal Occupation During at Least the Past 5 Years: | | |
| President, Chief Investment Officer and Director, Franklin Advisers, Inc.; Executive Vice President, Franklin Templeton Institutional, LLC; and |
| officer and/or trustee, as the case may be, of some of the other subsidiaries of Franklin Resources, Inc. and of 10 of the investment |
| companies in Franklin Templeton Investments. | | | |
| |
| Robert Lim (1948) | Vice | Since May 2016 | Not Applicable | Not Applicable |
| One Franklin Parkway | President | | | |
| San Mateo, CA 94403-1906 | – AML | | | |
| | Compliance | | | |
| Principal Occupation During at Least the Past 5 Years: | | |
| Vice President, Franklin Templeton Companies, LLC; Chief Compliance Officer, Franklin Templeton Distributors, Inc. and Franklin Templeton |
| Investor Services, LLC; and officer of 45 of the investment companies in Franklin Templeton Investments. |
| |
| Kimberly H. Novotny (1972) | Vice President Since 2013 | Not Applicable | Not Applicable |
| 300 S.E. 2nd Street | | | | |
| Fort Lauderdale, FL 33301-1923 | | | | |
| Principal Occupation During at Least the Past 5 Years: | | |
| Associate General Counsel, Franklin Templeton Investments; Vice President and Corporate Secretary, Fiduciary Trust International of the |
| South; Vice President, Templeton Investment Counsel, LLC; Assistant Secretary, Franklin Resources, Inc.; and officer of 45 of the investment |
| companies in Franklin Templeton Investments. | | | |
FRANKLIN CUSTODIAN FUNDS
| | | | |
| Interested Board Members and Officers (continued) | |
| |
| |
| |
| | | | Number of Portfolios in | |
| Name, Year of Birth | | Length of | Fund Complex Overseen | Other Directorships Held |
| and Address | Position | Time Served | by Board Member* | During at Least the Past 5 Years |
| |
| Robert C. Rosselot (1960) | Chief | Since 2013 | Not Applicable | Not Applicable |
| 300 S.E. 2nd Street | Compliance | | | |
| Fort Lauderdale, FL 33301-1923 | Officer | | | |
| Principal Occupation During at Least the Past 5 Years: | | |
| Director, Global Compliance, Franklin Templeton Investments; Vice President, Franklin Templeton Companies, LLC; officer of 45 of the |
| investment companies in Franklin Templeton Investments; and formerly, Senior Associate General Counsel, Franklin Templeton Investments |
| (2007-2013); and Secretary and Vice President, Templeton Group of Funds (2004-2013). | |
| |
| Karen L. Skidmore (1952) | Vice President | Since 2006 | Not Applicable | Not Applicable |
| One Franklin Parkway | and Secretary | | | |
| San Mateo, CA 94403-1906 | | | | |
| Principal Occupation During at Least the Past 5 Years: | | |
| Senior Associate General Counsel, Franklin Templeton Investments; and officer of 45 of the investment companies in Franklin Templeton |
| Investments. | | | | |
| |
| Navid J. Tofigh (1972) | Vice President | Since 2015 | Not Applicable | Not Applicable |
| One Franklin Parkway | | | | |
| San Mateo, CA 94403-1906 | | | | |
| Principal Occupation During at Least the Past 5 Years: | | |
| Associate General Counsel, Franklin Templeton Investments; and officer of 45 of the investment companies in Franklin Templeton Investments. |
| |
| Craig S. Tyle (1960) | Vice President | Since 2005 | Not Applicable | Not Applicable |
| One Franklin Parkway | | | | |
| San Mateo, CA 94403-1906 | | | | |
| Principal Occupation During at Least the Past 5 Years: | | |
| General Counsel and Executive Vice President, Franklin Resources, Inc.; and officer of some of the other subsidiaries of Franklin Resources, |
| Inc. and of 45 of the investment companies in Franklin Templeton Investments. | |
| |
| Lori A. Weber (1964) | Vice President | Since 2013 | Not Applicable | Not Applicable |
| 300 S.E. 2nd Street | | | | |
| Fort Lauderdale, FL 33301-1923 | | | | |
| Principal Occupation During at Least the Past 5 Years: | | |
| Senior Associate General Counsel, Franklin Templeton Investments; Assistant Secretary, Franklin Resources, Inc.; Vice President and |
| Secretary, Templeton Investment Counsel, LLC; and officer of 45 of the investment companies in Franklin Templeton Investments. |
*We base the number of portfolios on each separate series of the U.S. registered investment companies within the Franklin Templeton Investments fund complex. These
portfolios have a common investment manager or affiliated investment managers.
**Gregory E. Johnson is considered to be an interested person of the Fund under the federal securities laws due to his position as an officer and director ofFranklin
Resources, Inc. (Resources), which is the parent company of the Fund’s investment manager and distributor. Rupert H. Johnson, Jr. is considered to be an interested person
of the Fund under the federal securities laws due to his position as officer and director and major shareholder of Resources.
Note 1: Rupert H. Johnson, Jr. is the uncle of Gregory E. Johnson.
Note 2: Officer information is current as of the date of this report. It is possible that after this date, information about officers may change.
Note 3: Effective November 1, 2016, Frank A. Olson ceased to be a trustee of the Trust.
The Sarbanes-Oxley Act of 2002 and Rules adopted by the Securities and Exchange Commission require the Fund to disclose whether the Fund’s Audit
Committee includes at least one member who is an audit committee financial expert within the meaning of such Act and Rules. The Fund’s Board has determined
that there is at least one such financial expert on the Audit Committee and has designated John B. Wilson as its audit committee financial expert. The Board
believes that Mr. Wilson qualifies as such an expert in view of his extensive business background and experience, including service as chief financial officer of
Staples, Inc. from 1992 to 1996. Mr. Wilson has been a Member and Chairman of the Fund’s Audit Committee since 2007. As a result of such background and
experience, the Board believes that Mr. Wilson has acquired an understanding of generally accepted accounting principles and financial statements, the general
application of such principles in connection with the accounting estimates, accruals and reserves, and analyzing and evaluating financial statements that
present a breadth and level of complexity of accounting issues generally comparable to those of the Fund, as well as an understanding of internal controls and
procedures for financial reporting and an understanding of audit committee functions. Mr. Wilson is an independent Board member as that term is defined under
the relevant Securities and Exchange Commission Rules and Releases.
The Statement of Additional Information (SAI) includes additional information about the board members and is available, without charge, upon request.
Shareholders may call (800) DIAL BEN/342-5236 to request the SAI.
Annual Report
24
FRANKLIN CUSTODIAN FUNDS FRANKLIN FOCUSED GROWTH FUND
Shareholder Information
Proxy Voting Policies and Procedures
The Fund’s investment manager has established Proxy Voting Policies and Procedures (Policies) that the Fund uses to determine how to vote proxies relating to portfolio securities. Shareholders may view the Fund’s complete Policies online at franklintempleton.com. Alternatively, shareholders may request copies of the Policies free of charge by calling the Proxy Group collect at (954) 527-7678 or by sending a written request to: Franklin Templeton Companies, LLC, 300 S.E. 2nd Street, Fort Lauderdale, FL 33301, Attention: Proxy Group. Copies of the Fund’s proxy voting records are also made available online at franklintempleton.com and posted on the U.S. Securities and Exchange Commission’s website at sec.gov and reflect the most recent 12-month period ended June 30.
Quarterly Statement of Investments
The Trust, on behalf of the Fund, files a complete statement of investments with the U.S. Securities and Exchange Commission for the first and third quarters for each fiscal year on Form N-Q. Shareholders may view the filed Form N-Q by visiting the Commission’s website at sec.gov. The filed form may also be viewed and copied at the Commission’s Public Reference Room in Washington, DC. Information regarding the operations of the Public Reference Room may be obtained by calling (800) SEC-0330.
Item 2. Code of Ethics.
(a) The Registrant has adopted a code of ethics that applies to its principal executive officers and principal financial and accounting officer.
(c) N/A
(d) N/A
(f) Pursuant to Item 12(a)(1), the Registrant is attaching as an exhibit a copy of its code of ethics that applies to its principal executive officers and principal financial and accounting officer.
Item 3. Audit Committee Financial Expert.
(a)(1) The Registrant has an audit committee financial expert serving on its audit committee.
(2) The audit committee financial expert is John B. Wilson and he is "independent" as defined under the relevant Securities and Exchange Commission Rules and Releases.
Item 4. Principal Accountant Fees and Services.
(a) Audit Fees
The aggregate fees paid to the principal accountant for professional services rendered by the principal accountant for the audit of the registrant’s annual financial statements or for services that are normally provided by the principal accountant in connection with statutory and regulatory filings or engagements were $467,181 for the fiscal year ended September 30, 2016 and $466,850 for the fiscal year ended September 30, 2015.
(b) Audit-Related Fees
The aggregate fees paid to the principal accountant for assurance and related services rendered by the principal accountant to the registrant that are reasonably related to the performance of the audit of the registrant's financial statements and are not reported under paragraph (a) of Item 4 were $9,033 for the fiscal year ended September 30, 2016 and $8,856 for the fiscal year ended September 30, 2015. The services for which these fees were paid included attestation services.
There were no fees paid to the principal accountant for assurance and related services rendered by the principal accountant to the registrant's investment adviser and any entity controlling, controlled by or under common control with the investment adviser that provides ongoing services to the registrant that are reasonably related to the performance of the audit of their financial statements.
(c) Tax Fees
There were no fees paid to the principal accountant for professional services rendered by the principal accountant to the registrant for tax compliance, tax advice and tax planning.
There were no fees paid to the principal accountant for professional services rendered by the principal accountant to the registrant’s investment adviser and any entity controlling, controlled by or under common control with the investment adviser that provides ongoing services to the registrant for tax compliance, tax advice and tax planning.
(d) All Other Fees
The aggregate fees paid to the principal accountant for products and services rendered by the principal accountant to the registrant not reported in paragraphs (a)-(c) of Item 4 were $0 for the fiscal year ended September 30, 2016 and $36,043 for the fiscal year ended September 30, 2015. The services for which these fees were paid include review of materials provided to the fund Board in connection with the investment management contract renewal process.
The aggregate fees paid to the principal accountant for products and services rendered by the principal accountant to the registrant’s investment adviser and any entity controlling, controlled by or under common control with the investment adviser that provides ongoing services to the registrant not reported in paragraphs (a)-(c) of Item 4 were $539,168 for the fiscal year ended September 30, 2016 and $387,983 for the fiscal year ended September 30, 2015. The services for which these fees were paid included review of materials provided to the fund Board in connection with the investment management contract renewal process and derivatives assessments, and review of system processes related to fixed income securities.
(e) (1) The registrant’s audit committee is directly responsible for approving the services to be provided by the auditors, including:
(i) pre-approval of all audit and audit related services;
(ii) pre-approval of all non-audit related services to be provided to the Fund by the auditors;
(iii) pre-approval of all non-audit related services to be provided to the registrant by the auditors to the registrant’s investment adviser or to any entity that controls, is controlled by or is under common control with the registrant’s investment adviser and that provides ongoing services to the registrant where the non-audit services relate directly to the operations or financial reporting of the registrant; and
(iv) establishment by the audit committee, if deemed necessary or appropriate, as an alternative to committee pre-approval of services to be provided by the auditors, as required by paragraphs (ii) and (iii) above, of policies and procedures to permit such services to be pre-approved by other means, such as through establishment of guidelines or by action of a designated member or members of the committee; provided the policies and procedures are detailed as to the particular service and the committee is informed of each service and such policies and procedures do not include delegation of audit committee responsibilities, as contemplated under the Securities Exchange Act of 1934, to management; subject, in the case of (ii) through (iv), to any waivers, exceptions or exemptions that may be available under applicable law or rules.
(e) (2) None of the services provided to the registrant described in paragraphs (b)-(d) of Item 4 were approved by the audit committee pursuant to paragraph (c)(7)(i)(C) of Rule 2-01 of regulation S-X.
(f) No disclosures are required by this Item 4(f).
(g) The aggregate non-audit fees paid to the principal accountant for services rendered by the principal accountant to the registrant and the registrant’s investment adviser and any entity controlling, controlled by or under common control with the investment adviser that provides ongoing services to the registrant were $548,201 for the fiscal year ended September 30, 2016 and $432,882 for the fiscal year ended September 30, 2015.
(h) The registrant’s audit committee of the board has considered whether the provision of non-audit services that were rendered to the registrant’s investment adviser (not including any sub-adviser whose role is primarily portfolio management and is subcontracted with or overseen by another investment adviser), and any entity controlling, controlled by, or under common control with the investment adviser that provides ongoing services to the registrant that were not pre-approved pursuant to paragraph (c)(7)(ii) of Rule 2-01 of Regulation S-X is compatible with maintaining the principal accountant’s independence.
Item 5. Audit Committee of Listed Registrants. N/A
Item 6. Schedule of Investments. N/A
Item 7. Disclosure of Proxy Voting Policies and Procedures for Closed-End Management Investment Companies. N/A
Item 8. Portfolio Managers of Closed-End Management Investment Companies. N/A
Item 9. Purchases of Equity Securities by Closed-End Management Investment Company and Affiliated Purchasers. N/A
Item 10. Submission of Matters to a Vote of Security Holders.
There have been no changes to the procedures by which shareholders may recommend nominees to the Registrant's Board of Trustees that would require disclosure herein.
Item 11. Controls and Procedures.
(a) Evaluation of Disclosure Controls and Procedures. The Registrant maintains disclosure controls and procedures that are designed to ensure that information required to be disclosed in the Registrant’s filings under the Securities Exchange Act of 1934 and the Investment Company Act of 1940 is recorded, processed, summarized and reported within the periods specified in the rules and forms of the Securities and Exchange Commission. Such information is accumulated and communicated to the Registrant’s management, including its principal executive officer and principal financial officer, as appropriate, to allow timely decisions regarding required disclosure. The Registrant’s management, including the principal executive officer and the principal financial officer, recognizes that any set of controls and procedures, no matter how well designed and operated, can provide only reasonable assurance of achieving the desired control objectives.
Within 90 days prior to the filing date of this Shareholder Report on Form N-CSR, the Registrant had carried out an evaluation, under the supervision and with the participation of the Registrant’s management, including the Registrant’s principal executive officer and the Registrant’s principal financial officer, of the effectiveness of the design and operation of the Registrant’s disclosure controls and procedures. Based on such evaluation, the Registrant’s principal executive officer and principal financial officer concluded that the Registrant’s disclosure controls and procedures are effective.
(b) Changes in Internal Controls. There have been no changes in the Registrant’s internal controls or in other factors that could materially affect the internal controls over financial reporting subsequent to the date of their evaluation in connection with the preparation of this Shareholder Report on Form N-CSR.
Item 12. Exhibits.
(a)(1) Code of Ethics
(a)(2) Certifications pursuant to Section 302 of the Sarbanes-Oxley Act of 2002 of Laura F. Fergerson, Chief Executive Officer - Finance and Administration, and Gaston Gardey, Chief Financial Officer and Chief Accounting Officer
(b) Certifications pursuant to Section 906 of the Sarbanes-Oxley Act of 2002 of Laura F. Fergerson, Chief Executive Officer - Finance and Administration, and Gaston Gardey, Chief Financial Officer and Chief Accounting Officer
SIGNATURES
Pursuant to the requirements of the Securities Exchange Act of 1934 and the Investment Company Act of 1940, the registrant has duly caused this report to be signed on its behalf by the undersigned, thereunto duly authorized.
FRANKLIN CUSTODIAN FUNDS
By /s/Laura F. Fergerson
Laura F. Fergerson
Chief Executive Officer - Finance and Administration
Date November 25, 2016
Pursuant to the requirements of the Securities Exchange Act of 1934 and the Investment Company Act of 1940, this report has been signed below by the following persons on behalf of the registrant and in the capacities and on the dates indicated.
By /s/Laura F. Fergerson
Laura F. Fergerson
Chief Executive Officer - Finance and Administration
Date November 25, 2016
By /s/Gaston Gardey
Gaston Gardey
Chief Financial Officer and Chief Accounting Officer
Date November 25, 2016