0000038721 tsr:C000018329Member 2022-09-30 0000038721 tsr:C000018344Member 2014-09-30
UNITED STATES
SECURITIES AND EXCHANGE COMMISSION
Washington, DC 20549
FORM N-CSR
CERTIFIED SHAREHOLDER REPORT OF REGISTERED
MANAGEMENT INVESTMENT COMPANIES
Investment Company Act file number 811-00537
Franklin Custodian Funds
(Exact name of registrant as specified in charter)
One Franklin Parkway, San Mateo, CA 94403-1906
(Address of principal executive offices)(Zip code)
Alison Baur, One Franklin Parkway, San Mateo, CA 94403-1906
(Name and address of agent for service)
Registrant’s telephone number, including area code: 650 312-2000
Date of fiscal year end: 9/30
Date of reporting period: 9/30/24
Item 1. Reports to Stockholders.
| a.) | The following is a copy of the report transmitted to shareholders pursuant to Rule 30e-1 under the Investment Company Act of 1940, as amended (the “1940 Act”) (17 CFR 270.30e-1).
|
| b.) | Include a copy of each notice transmitted to stockholders in reliance on Rule 30e-3 under the Act (17 CFR 270.30e-3) that contains disclosures specified by paragraph (c)(3) of that rule. |
Not Applicable.
| | |
Franklin DynaTech Fund | |
| Class A [FKDNX] |
| Annual Shareholder Report | September 30, 2024 |
|
This annual shareholder report contains important information about Franklin DynaTech Fund for the period October 1, 2023, to September 30, 2024.
You can find additional information about the Fund at https://www.franklintempleton.com/regulatory-fund-documents. You can also request this information by contacting us at (800) DIAL BEN/342-5236.
WHAT WERE THE FUND COSTS FOR THE LAST YEAR? (based on a hypothetical $10,000 investment)
| | |
Class Name | Costs of a $10,000 investment | Costs paid as a percentage of a $10,000 investment* |
| Class A | $96 | 0.79% |
| * | Reflects fee waivers and/or expense reimbursements, without which expenses would have been higher. |
HOW DID THE FUND PERFORM LAST YEAR AND WHAT AFFECTED ITS PERFORMANCE?
For the twelve months ended September 30, 2024, Class A shares of Franklin DynaTech Fund returned 42.49%. The Fund compares its performance to the Russell 1000 Growth Index and the S&P 500 Index, which returned 42.19% and 36.35%, respectively, for the same period.
| |
Top contributors to performance: |
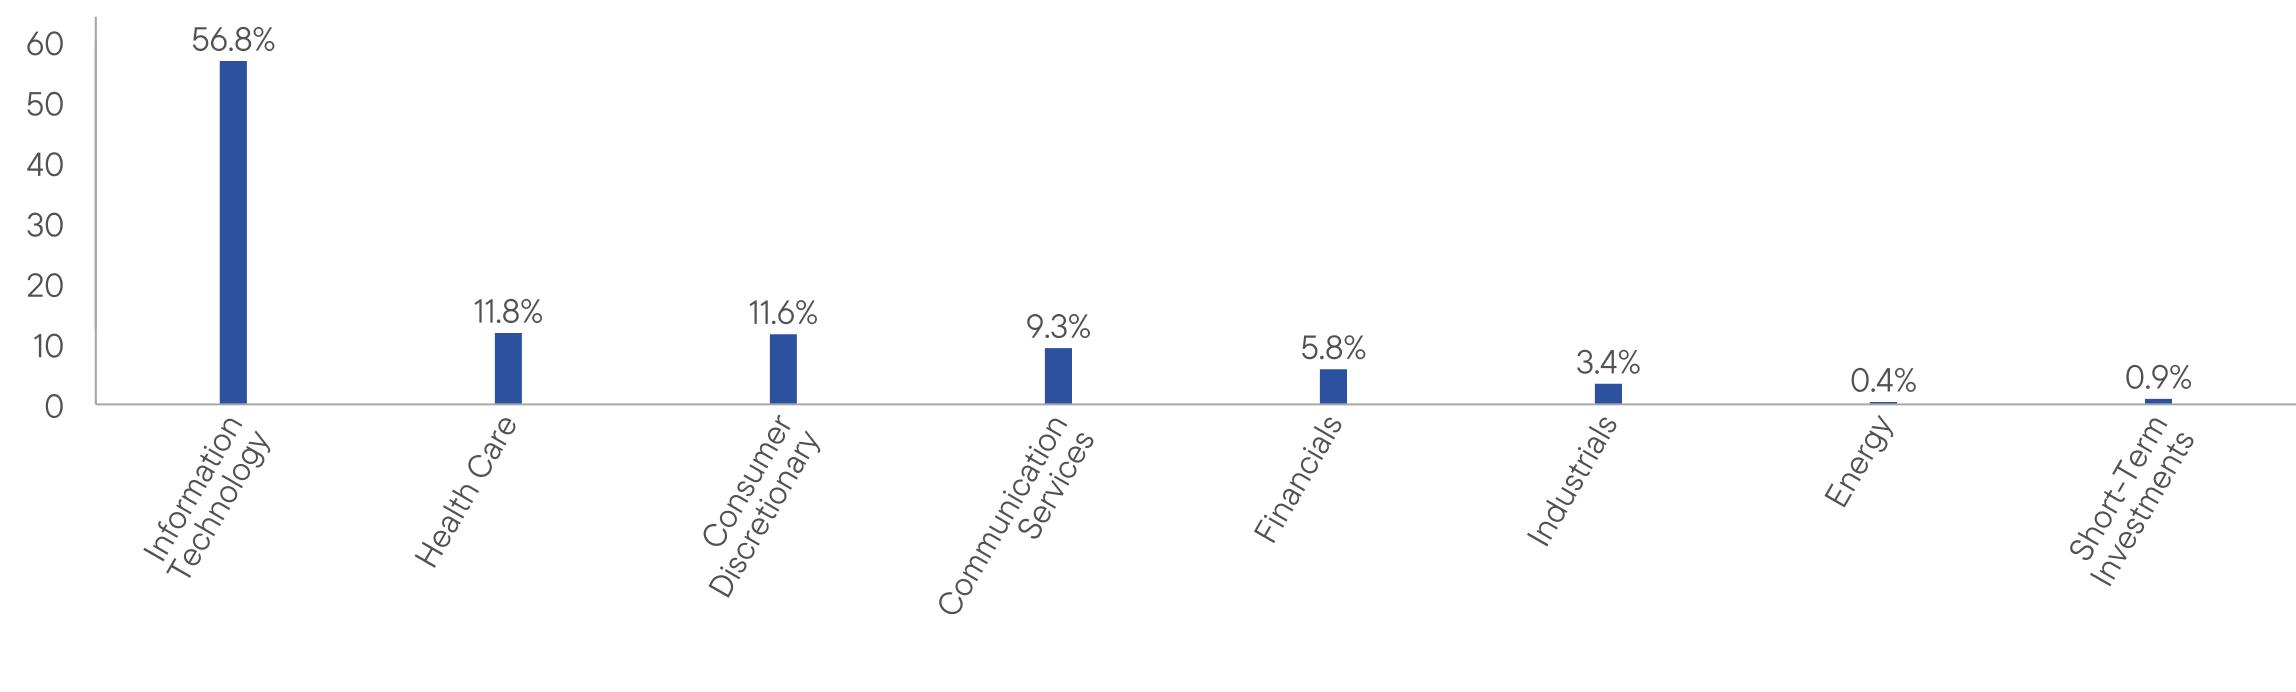
| ↑ | Stock selection and underweightings in the consumer discretionary and industrials sectors, along with a substantial overweighting in rallying information technology (IT) companies; when combined, these three sectors comprised almost three quarters of the overall portfolio. |
| ↑ | Overweight positions in key contributors such as NVIDIA, Monolithic Power Systems and KLA, IT companies within the semiconductors and semiconductor equipment industry, helped this core allocation more than double in value during the period under review. |
| ↑ | Strategic underweightings in select mega-capitalization tech companies proved beneficial as the overall gains in Apple, Alphabet (Google) and Microsoft lagged the Russell 1000 Growth Index. Relative returns were further buoyed by having no sector exposure to consumer staples or real estate. |
| |
Top detractors from performance: |
| ↓ | Stock selection and underweighting in communication services, including a lighter-than-index position in Meta Platforms (Facebook) as its share price nearly doubled, and lagging gains for Netflix (purchased during the period) in the entertainment industry. |
| ↓ | IT sector results were curbed by unfavorable stock selection and a significant overweighting in software stocks (centered on sub-par gains for Synopsys, Cadence Design Systems, HubSpot and Intuit) as they trailed the benchmark; underweighting in Broadcom in the semiconductor space as its equity value skyrocketed; and overweighting in IT services companies such as MongoDB (sold by period-end) as the group barely advanced. |
| ↓ | Individual securities that weighed on performance in other sectors, including a steep selloff in off-benchmark oilfield services provider Schlumberger (sold by period-end) in energy, and poor outcome for Tesla in the consumer discretionary sector during what turned out to be a volatile year for sales of electric vehicles, solar products and battery-based energy storage solutions. |
| Franklin DynaTech Fund | PAGE 1 | 108-ATSR-1124 |
HOW DID THE FUND PERFORM OVER THE LAST 10 YEARS?
The Fund’s past performance is not necessarily an indication of how the Fund will perform in the future. The graph and table do not reflect the deduction of taxes that a shareholder would pay on Fund distributions or redemption of Fund shares.
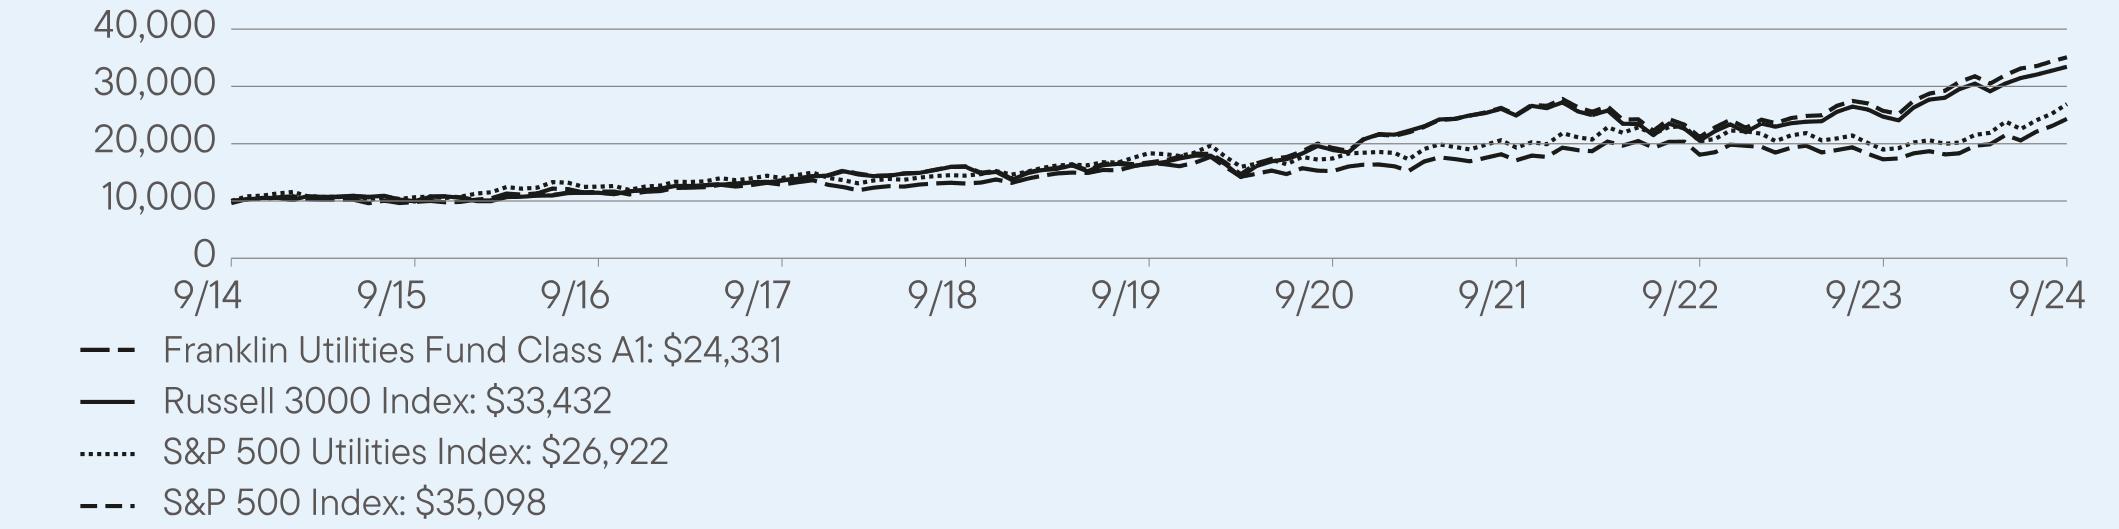
VALUE OF A $10000 INVESTMENT ($9,450 AFTER MAXIMUM APPLICABLE SALES CHARGE) –
Class A 9/30/2014 — 9/30/2024
AVERAGE ANNUAL TOTAL RETURNS (%) Period Ended September 30, 2024
| | | |
| | 1 Year | 5 Year | 10 Year |
Class A | 42.49 | 15.40 | 15.49 |
Class A (with sales charge) | 34.64 | 14.10 | 14.83 |
Russell 3000 Index | 35.19 | 15.26 | 12.83 |
Russell 1000 Growth Index | 42.19 | 19.73 | 16.52 |
S&P 500 Index | 36.35 | 15.97 | 13.38 |
Fund performance figures may reflect fee waivers and/or expense reimbursements, without which the performance would have been lower.
Performance for periods prior to September 10, 2018, has been restated to reflect the current maximum sales charge, which is lower than the maximum sales charge prior to that date.
For current month-end performance, please call Franklin Templeton at (800) DIAL BEN/342-5236 or visit https://www.franklintempleton.com/investments/options/mutual-funds.
Important data provider notices and terms available at www.franklintempletondatasources.com.
KEY FUND STATISTICS (as of September 30, 2024)
| |
Total Net Assets | $25,397,621,872 |
Total Number of Portfolio Holdings* | 105 |
Total Management Fee Paid | $97,407,595 |
Portfolio Turnover Rate | 11.94% |
| * | Does not include derivatives, except purchased options, if any. |
| Franklin DynaTech Fund | PAGE 2 | 108-ATSR-1124 |
WHAT DID THE FUND INVEST IN? (as of September 30, 2024)
Portfolio Composition* (% of Total Investments)
| * | Does not include derivatives, except purchased options, if any. |
| |
| WHERE CAN I FIND ADDITIONAL INFORMATION ABOUT THE FUND? |
Additional information is available on https://www.franklintempleton.com/regulatory-fund-documents, including its: |
| • prospectus • proxy voting information • financial information • holdings • tax information |
HOUSEHOLDING
You will receive the Fund’s shareholder reports every six months. In addition, you will receive an annual updated summary prospectus (detail prospectus available upon request). To reduce Fund expenses, we try to identify related shareholders in a household and send only one copy of the shareholder reports and summary prospectus. This process, called “householding,” will continue indefinitely unless you instruct us otherwise. If you prefer not to have these documents householded, please call us at (800) DIAL BEN/342-5236. At any time, you may view current prospectuses/summary prospectuses and shareholder reports on our website. If you choose, you may receive these documents through electronic delivery.
| Franklin DynaTech Fund | PAGE 3 | 108-ATSR-1124 |
94509771113081421018598194842873337264223032798439876100009950114391357915967164331889824921205282472933432100001031711737143121807618746257823282425409324534614510000993911472136071604416727192602504021165257413509856.811.811.69.35.83.40.40.9
| | |
Franklin DynaTech Fund | |
| Class C [FDYNX] |
| Annual Shareholder Report | September 30, 2024 |
|
This annual shareholder report contains important information about Franklin DynaTech Fund for the period October 1, 2023, to September 30, 2024.
You can find additional information about the Fund at https://www.franklintempleton.com/regulatory-fund-documents. You can also request this information by contacting us at (800) DIAL BEN/342-5236.
WHAT WERE THE FUND COSTS FOR THE LAST YEAR? (based on a hypothetical $10,000 investment)
| | |
Class Name | Costs of a $10,000 investment | Costs paid as a percentage of a $10,000 investment* |
| Class C | $186 | 1.54% |
| * | Reflects fee waivers and/or expense reimbursements, without which expenses would have been higher. |
HOW DID THE FUND PERFORM LAST YEAR AND WHAT AFFECTED ITS PERFORMANCE?
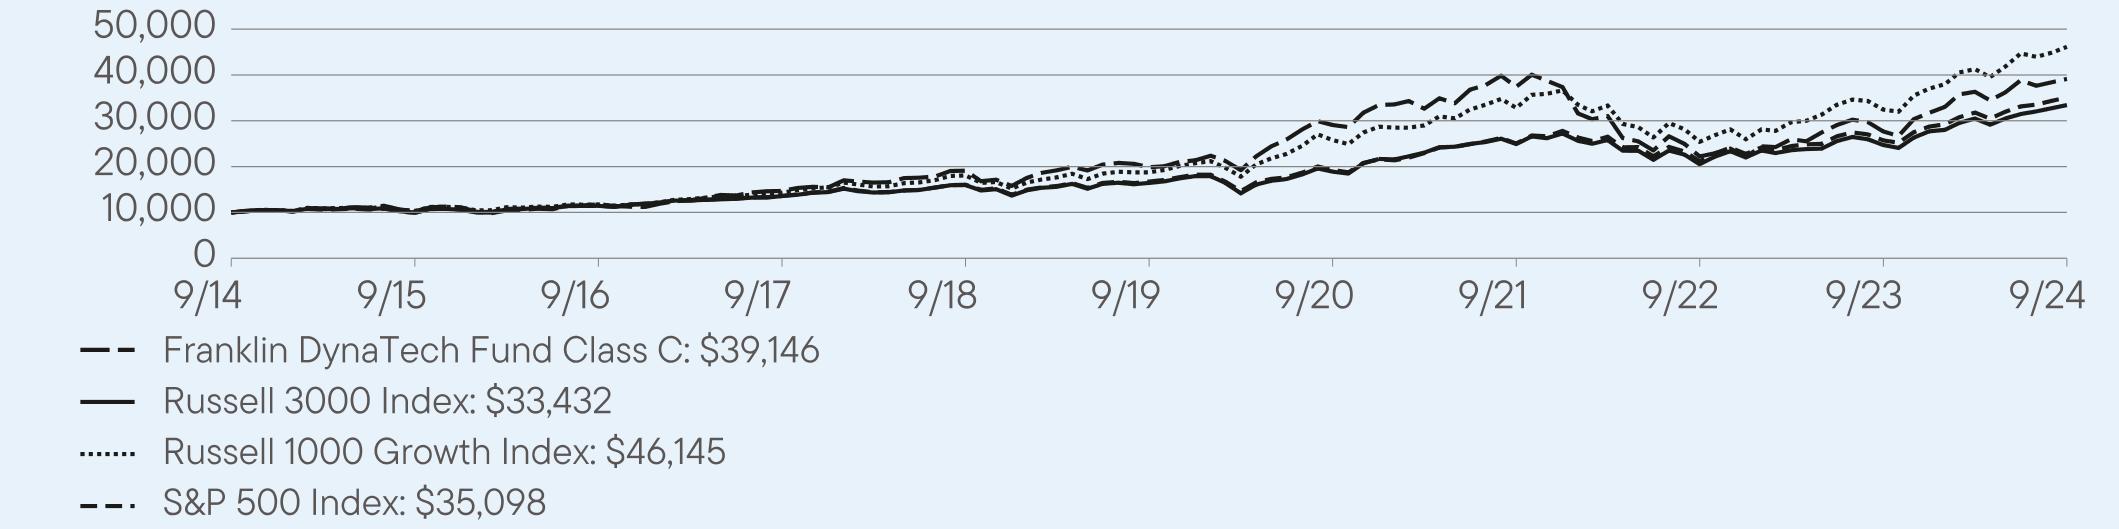
For the twelve months ended September 30, 2024, Class C shares of Franklin DynaTech Fund returned 41.41%. The Fund compares its performance to the Russell 1000 Growth Index and the S&P 500 Index, which returned 42.19% and 36.35%, respectively, for the same period.
| |
Top contributors to performance: |
| ↑ | Stock selection and underweightings in the consumer discretionary and industrials sectors, along with a substantial overweighting in rallying information technology (IT) companies; when combined, these three sectors comprised almost three quarters of the overall portfolio. |
| ↑ | Overweight positions in key contributors such as NVIDIA, Monolithic Power Systems and KLA, IT companies within the semiconductors and semiconductor equipment industry, helped this core allocation more than double in value during the period under review. |
| ↑ | Strategic underweightings in select mega-capitalization tech companies proved beneficial as the overall gains in Apple, Alphabet (Google) and Microsoft lagged the Russell 1000 Growth Index. Relative returns were further buoyed by having no sector exposure to consumer staples or real estate. |
| |
Top detractors from performance: |
| ↓ | Stock selection and underweighting in communication services, including a lighter-than-index position in Meta Platforms (Facebook) as its share price nearly doubled, and lagging gains for Netflix (purchased during the period) in the entertainment industry. |
| ↓ | IT sector results were curbed by unfavorable stock selection and a significant overweighting in software stocks (centered on sub-par gains for Synopsys, Cadence Design Systems, HubSpot and Intuit) as they trailed the benchmark; underweighting in Broadcom in the semiconductor space as its equity value skyrocketed; and overweighting in IT services companies such as MongoDB (sold by period-end) as the group barely advanced. |
| ↓ | Individual securities that weighed on performance in other sectors, including a steep selloff in off-benchmark oilfield services provider Schlumberger (sold by period-end) in energy, and poor outcome for Tesla in the consumer discretionary sector during what turned out to be a volatile year for sales of electric vehicles, solar products and battery-based energy storage solutions. |
| Franklin DynaTech Fund | PAGE 1 | 208-ATSR-1124 |
HOW DID THE FUND PERFORM OVER THE LAST 10 YEARS?
The Fund’s past performance is not necessarily an indication of how the Fund will perform in the future. The graph and table do not reflect the deduction of taxes that a shareholder would pay on Fund distributions or redemption of Fund shares.
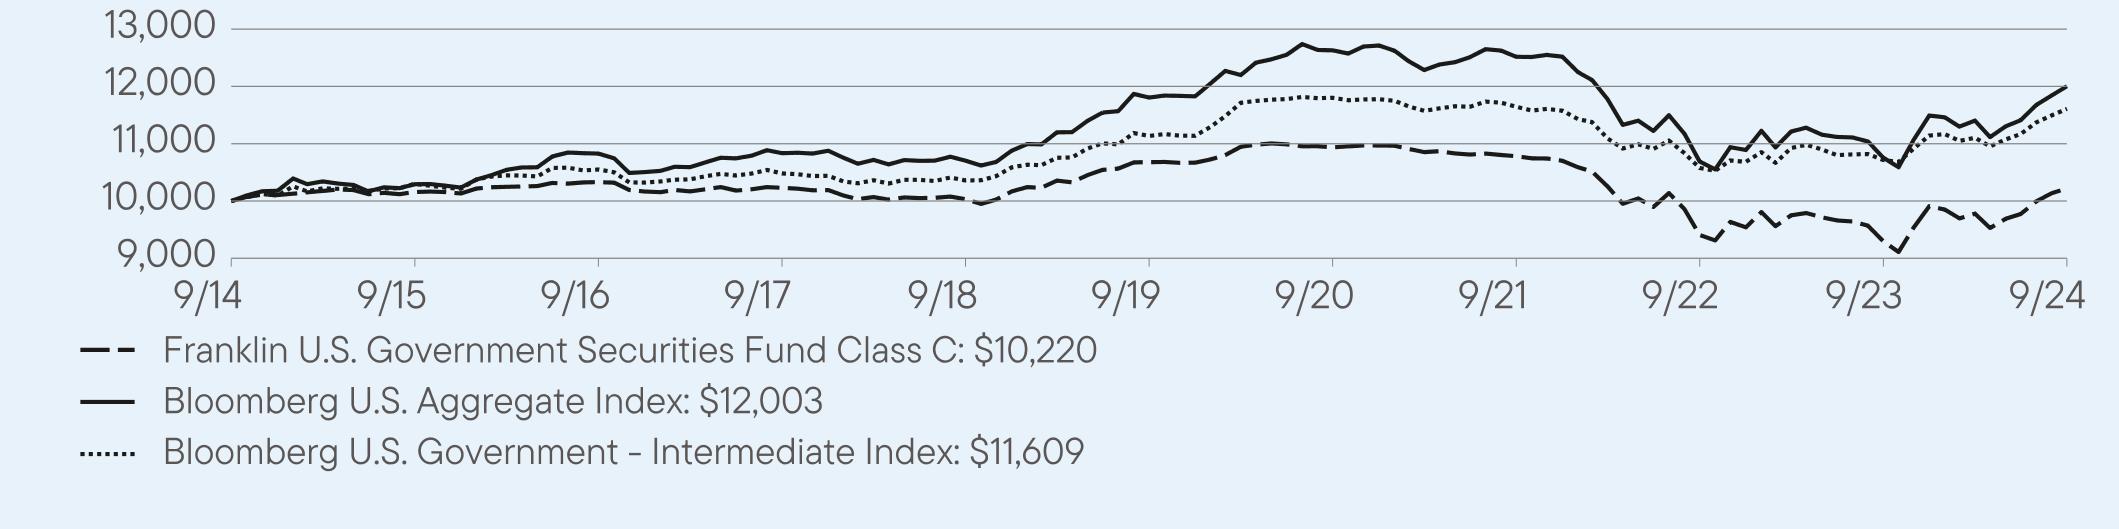
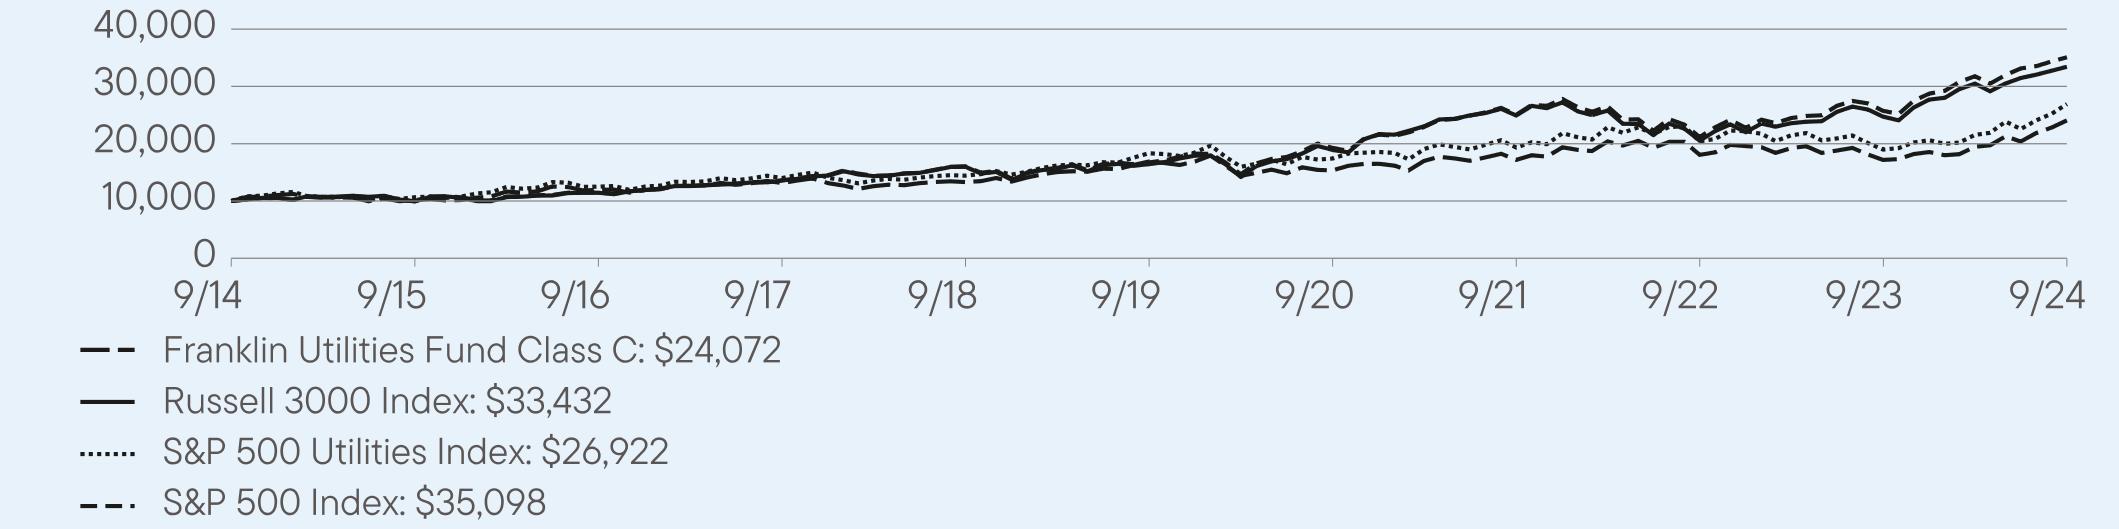
VALUE OF A $10,000 INVESTMENT – Class C 9/30/2014 — 9/30/2024
AVERAGE ANNUAL TOTAL RETURNS (%) Period Ended September 30, 2024
| | | |
| | 1 Year | 5 Year | 10 Year |
Class C | 41.41 | 14.54 | 14.62 |
Class C (with sales charge) | 40.41 | 14.54 | 14.62 |
Russell 3000 Index | 35.19 | 15.26 | 12.83 |
Russell 1000 Growth Index | 42.19 | 19.73 | 16.52 |
S&P 500 Index | 36.35 | 15.97 | 13.38 |
Fund performance figures may reflect fee waivers and/or expense reimbursements, without which the performance would have been lower.
For current month-end performance, please call Franklin Templeton at (800) DIAL BEN/342-5236 or visit https://www.franklintempleton.com/investments/options/mutual-funds.
Important data provider notices and terms available at www.franklintempletondatasources.com.
KEY FUND STATISTICS (as of September 30, 2024)
| |
Total Net Assets | $25,397,621,872 |
Total Number of Portfolio Holdings* | 105 |
Total Management Fee Paid | $97,407,595 |
Portfolio Turnover Rate | 11.94% |
| * | Does not include derivatives, except purchased options, if any. |
| Franklin DynaTech Fund | PAGE 2 | 208-ATSR-1124 |
WHAT DID THE FUND INVEST IN? (as of September 30, 2024)
Portfolio Composition* (% of Total Investments)
| * | Does not include derivatives, except purchased options, if any. |
| |
| WHERE CAN I FIND ADDITIONAL INFORMATION ABOUT THE FUND? |
Additional information is available on https://www.franklintempleton.com/regulatory-fund-documents, including its: |
| • prospectus • proxy voting information • financial information • holdings • tax information |
HOUSEHOLDING
You will receive the Fund’s shareholder reports every six months. In addition, you will receive an annual updated summary prospectus (detail prospectus available upon request). To reduce Fund expenses, we try to identify related shareholders in a household and send only one copy of the shareholder reports and summary prospectus. This process, called “householding,” will continue indefinitely unless you instruct us otherwise. If you prefer not to have these documents householded, please call us at (800) DIAL BEN/342-5236. At any time, you may view current prospectuses/summary prospectuses and shareholder reports on our website. If you choose, you may receive these documents through electronic delivery.
| Franklin DynaTech Fund | PAGE 3 | 208-ATSR-1124 |
1000010263117881470219102198612907037419222272768439146100009950114391357915967164331889824921205282472933432100001031711737143121807618746257823282425409324534614510000993911472136071604416727192602504021165257413509856.811.811.69.35.83.40.40.9
| | |
Franklin DynaTech Fund | |
| Class R [FDNRX] |
| Annual Shareholder Report | September 30, 2024 |
|
This annual shareholder report contains important information about Franklin DynaTech Fund for the period October 1, 2023, to September 30, 2024.
You can find additional information about the Fund at https://www.franklintempleton.com/regulatory-fund-documents. You can also request this information by contacting us at (800) DIAL BEN/342-5236.
WHAT WERE THE FUND COSTS FOR THE LAST YEAR? (based on a hypothetical $10,000 investment)
| | |
Class Name | Costs of a $10,000 investment | Costs paid as a percentage of a $10,000 investment* |
| Class R | $126 | 1.04% |
| * | Reflects fee waivers and/or expense reimbursements, without which expenses would have been higher. |
HOW DID THE FUND PERFORM LAST YEAR AND WHAT AFFECTED ITS PERFORMANCE?
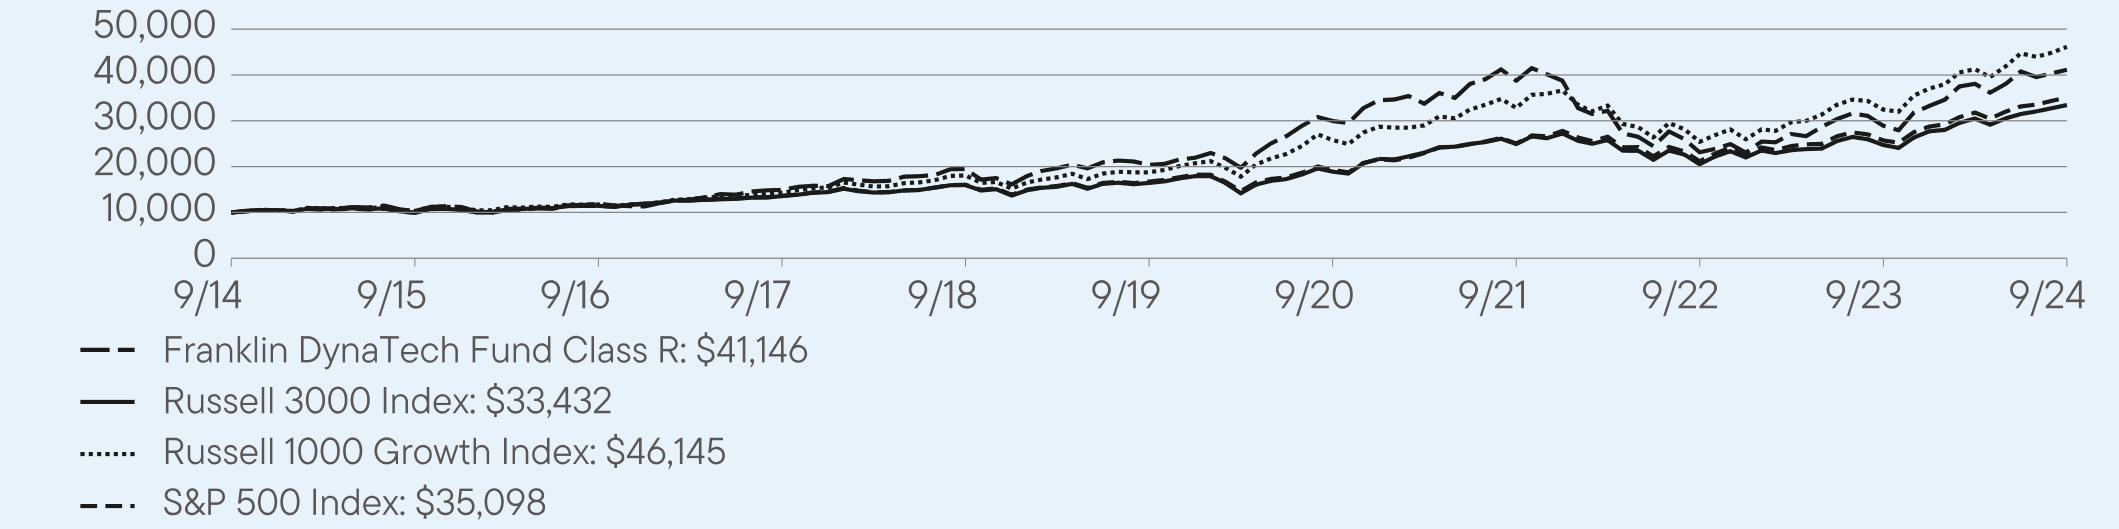
For the twelve months ended September 30, 2024, Class R shares of Franklin DynaTech Fund returned 42.12%. The Fund compares its performance to the Russell 1000 Growth Index and the S&P 500 Index, which returned 42.19% and 36.35%, respectively, for the same period.
| |
Top contributors to performance: |
| ↑ | Stock selection and underweightings in the consumer discretionary and industrials sectors, along with a substantial overweighting in rallying information technology (IT) companies; when combined, these three sectors comprised almost three quarters of the overall portfolio. |
| ↑ | Overweight positions in key contributors such as NVIDIA, Monolithic Power Systems and KLA, IT companies within the semiconductors and semiconductor equipment industry, helped this core allocation more than double in value during the period under review. |
| ↑ | Strategic underweightings in select mega-capitalization tech companies proved beneficial as the overall gains in Apple, Alphabet (Google) and Microsoft lagged the Russell 1000 Growth Index. Relative returns were further buoyed by having no sector exposure to consumer staples or real estate. |
| |
Top detractors from performance: |
| ↓ | Stock selection and underweighting in communication services, including a lighter-than-index position in Meta Platforms (Facebook) as its share price nearly doubled, and lagging gains for Netflix (purchased during the period) in the entertainment industry. |
| ↓ | IT sector results were curbed by unfavorable stock selection and a significant overweighting in software stocks (centered on sub-par gains for Synopsys, Cadence Design Systems, HubSpot and Intuit) as they trailed the benchmark; underweighting in Broadcom in the semiconductor space as its equity value skyrocketed; and overweighting in IT services companies such as MongoDB (sold by period-end) as the group barely advanced. |
| ↓ | Individual securities that weighed on performance in other sectors, including a steep selloff in off-benchmark oilfield services provider Schlumberger (sold by period-end) in energy, and poor outcome for Tesla in the consumer discretionary sector during what turned out to be a volatile year for sales of electric vehicles, solar products and battery-based energy storage solutions. |
| Franklin DynaTech Fund | PAGE 1 | 818-ATSR-1124 |
HOW DID THE FUND PERFORM OVER THE LAST 10 YEARS?
The Fund’s past performance is not necessarily an indication of how the Fund will perform in the future. The graph and table do not reflect the deduction of taxes that a shareholder would pay on Fund distributions or redemption of Fund shares.
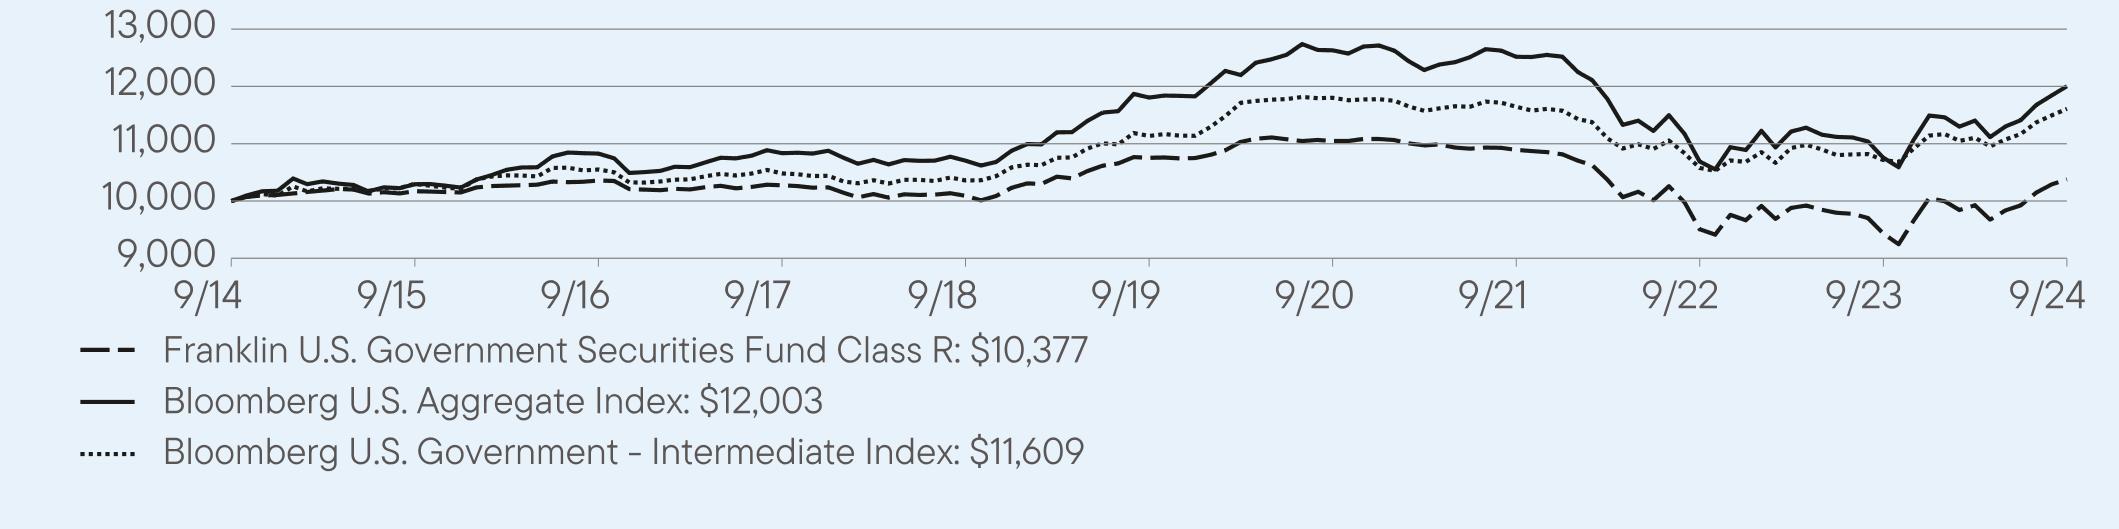
VALUE OF A $10,000 INVESTMENT – Class R 9/30/2014 — 9/30/2024
AVERAGE ANNUAL TOTAL RETURNS (%) Period Ended September 30, 2024
| | | |
| | 1 Year | 5 Year | 10 Year |
Class R | 42.12 | 15.11 | 15.19 |
Russell 3000 Index | 35.19 | 15.26 | 12.83 |
Russell 1000 Growth Index | 42.19 | 19.73 | 16.52 |
S&P 500 Index | 36.35 | 15.97 | 13.38 |
Fund performance figures may reflect fee waivers and/or expense reimbursements, without which the performance would have been lower.
For current month-end performance, please call Franklin Templeton at (800) DIAL BEN/342-5236 or visit https://www.franklintempleton.com/investments/options/mutual-funds.
Important data provider notices and terms available at www.franklintempletondatasources.com.
KEY FUND STATISTICS (as of September 30, 2024)
| |
Total Net Assets | $25,397,621,872 |
Total Number of Portfolio Holdings* | 105 |
Total Management Fee Paid | $97,407,595 |
Portfolio Turnover Rate | 11.94% |
| * | Does not include derivatives, except purchased options, if any. |
| Franklin DynaTech Fund | PAGE 2 | 818-ATSR-1124 |
WHAT DID THE FUND INVEST IN? (as of September 30, 2024)
Portfolio Composition* (% of Total Investments)
| * | Does not include derivatives, except purchased options, if any. |
| |
| WHERE CAN I FIND ADDITIONAL INFORMATION ABOUT THE FUND? |
Additional information is available on https://www.franklintempleton.com/regulatory-fund-documents, including its: |
| • prospectus • proxy voting information • financial information • holdings • tax information |
HOUSEHOLDING
You will receive the Fund’s shareholder reports every six months. In addition, you will receive an annual updated summary prospectus (detail prospectus available upon request). To reduce Fund expenses, we try to identify related shareholders in a household and send only one copy of the shareholder reports and summary prospectus. This process, called “householding,” will continue indefinitely unless you instruct us otherwise. If you prefer not to have these documents householded, please call us at (800) DIAL BEN/342-5236. At any time, you may view current prospectuses/summary prospectuses and shareholder reports on our website. If you choose, you may receive these documents through electronic delivery.
| Franklin DynaTech Fund | PAGE 3 | 818-ATSR-1124 |
1000010311119021492019481203612994938743231322895341146100009950114391357915967164331889824921205282472933432100001031711737143121807618746257823282425409324534614510000993911472136071604416727192602504021165257413509856.811.811.69.35.83.40.40.9
| | |
Franklin DynaTech Fund | |
| Class R6 [FDTRX] |
| Annual Shareholder Report | September 30, 2024 |
|
This annual shareholder report contains important information about Franklin DynaTech Fund for the period October 1, 2023, to September 30, 2024.
You can find additional information about the Fund at https://www.franklintempleton.com/regulatory-fund-documents. You can also request this information by contacting us at (800) DIAL BEN/342-5236.
WHAT WERE THE FUND COSTS FOR THE LAST YEAR? (based on a hypothetical $10,000 investment)
| | |
Class Name | Costs of a $10,000 investment | Costs paid as a percentage of a $10,000 investment* |
| Class R6 | $55 | 0.45% |
| * | Reflects fee waivers and/or expense reimbursements, without which expenses would have been higher. |
HOW DID THE FUND PERFORM LAST YEAR AND WHAT AFFECTED ITS PERFORMANCE?
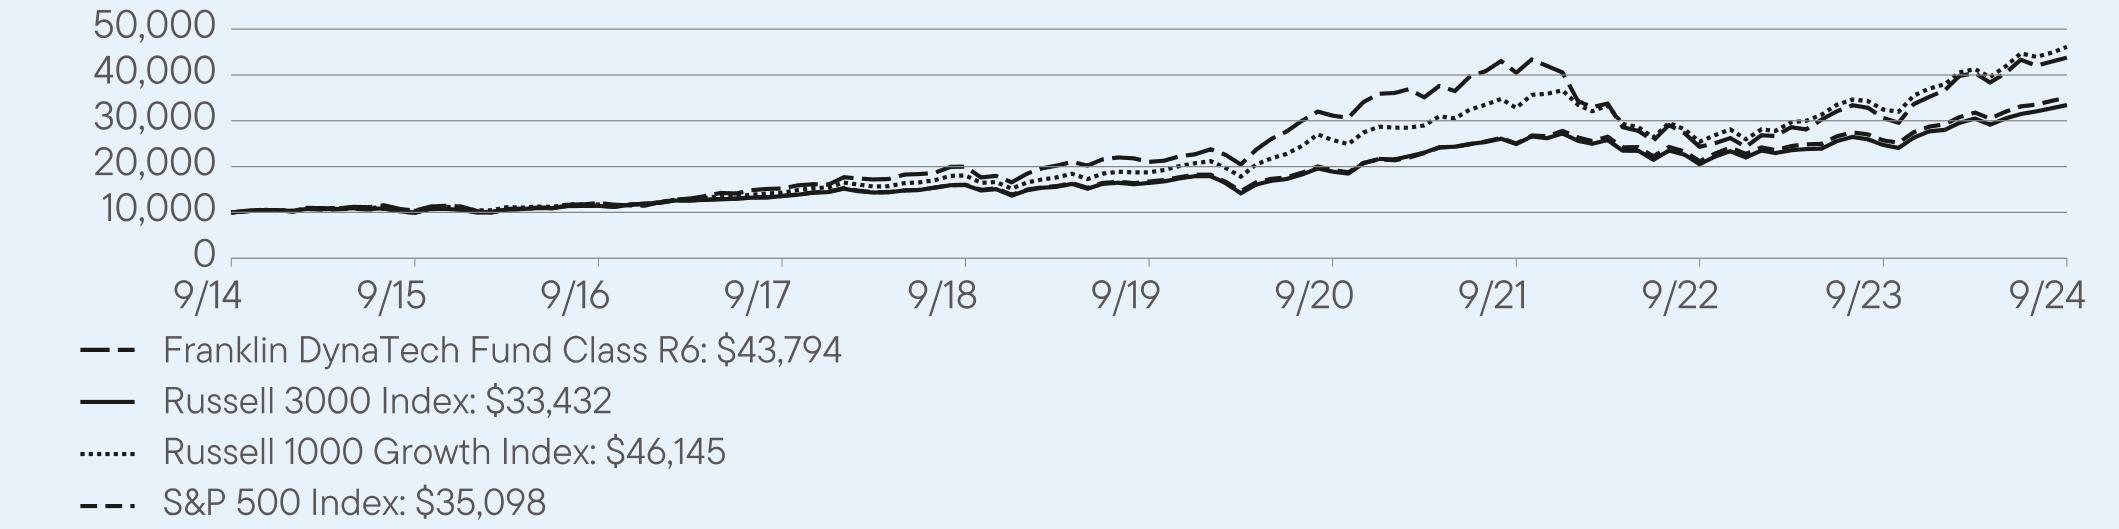
For the twelve months ended September 30, 2024, Class R6 shares of Franklin DynaTech Fund returned 42.97%. The Fund compares its performance to the Russell 1000 Growth Index and the S&P 500 Index, which returned 42.19% and 36.35%, respectively, for the same period.
| |
Top contributors to performance: |
| ↑ | Stock selection and underweightings in the consumer discretionary and industrials sectors, along with a substantial overweighting in rallying information technology (IT) companies; when combined, these three sectors comprised almost three quarters of the overall portfolio. |
| ↑ | Overweight positions in key contributors such as NVIDIA, Monolithic Power Systems and KLA, IT companies within the semiconductors and semiconductor equipment industry, helped this core allocation more than double in value during the period under review. |
| ↑ | Strategic underweightings in select mega-capitalization tech companies proved beneficial as the overall gains in Apple, Alphabet (Google) and Microsoft lagged the Russell 1000 Growth Index. Relative returns were further buoyed by having no sector exposure to consumer staples or real estate. |
| |
Top detractors from performance: |
| ↓ | Stock selection and underweighting in communication services, including a lighter-than-index position in Meta Platforms (Facebook) as its share price nearly doubled, and lagging gains for Netflix (purchased during the period) in the entertainment industry. |
| ↓ | IT sector results were curbed by unfavorable stock selection and a significant overweighting in software stocks (centered on sub-par gains for Synopsys, Cadence Design Systems, HubSpot and Intuit) as they trailed the benchmark; underweighting in Broadcom in the semiconductor space as its equity value skyrocketed; and overweighting in IT services companies such as MongoDB (sold by period-end) as the group barely advanced. |
| ↓ | Individual securities that weighed on performance in other sectors, including a steep selloff in off-benchmark oilfield services provider Schlumberger (sold by period-end) in energy, and poor outcome for Tesla in the consumer discretionary sector during what turned out to be a volatile year for sales of electric vehicles, solar products and battery-based energy storage solutions. |
| Franklin DynaTech Fund | PAGE 1 | 328-ATSR-1124 |
HOW DID THE FUND PERFORM OVER THE LAST 10 YEARS?
The Fund’s past performance is not necessarily an indication of how the Fund will perform in the future. The graph and table do not reflect the deduction of taxes that a shareholder would pay on Fund distributions or redemption of Fund shares.
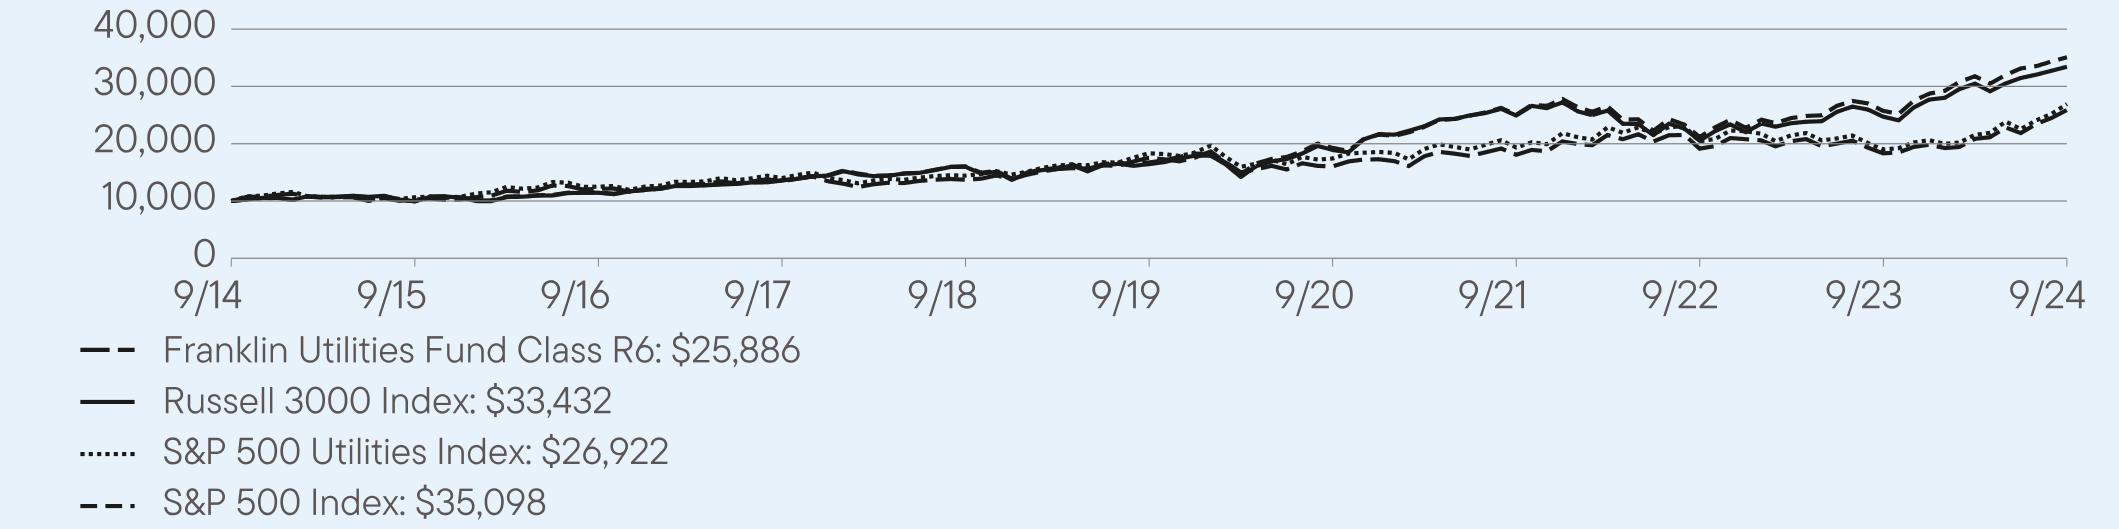
VALUE OF A $10,000 INVESTMENT – Class R6 9/30/2014 — 9/30/2024
AVERAGE ANNUAL TOTAL RETURNS (%) Period Ended September 30, 2024
| | | |
| | 1 Year | 5 Year | 10 Year |
Class R6 | 42.97 | 15.80 | 15.92 |
Russell 3000 Index | 35.19 | 15.26 | 12.83 |
Russell 1000 Growth Index | 42.19 | 19.73 | 16.52 |
S&P 500 Index | 36.35 | 15.97 | 13.38 |
Fund performance figures may reflect fee waivers and/or expense reimbursements, without which the performance would have been lower.
For current month-end performance, please call Franklin Templeton at (800) DIAL BEN/342-5236 or visit https://www.franklintempleton.com/investments/options/mutual-funds.
Important data provider notices and terms available at www.franklintempletondatasources.com.
KEY FUND STATISTICS (as of September 30, 2024)
| |
Total Net Assets | $25,397,621,872 |
Total Number of Portfolio Holdings* | 105 |
Total Management Fee Paid | $97,407,595 |
Portfolio Turnover Rate | 11.94% |
| * | Does not include derivatives, except purchased options, if any. |
| Franklin DynaTech Fund | PAGE 2 | 328-ATSR-1124 |
WHAT DID THE FUND INVEST IN? (as of September 30, 2024)
Portfolio Composition* (% of Total Investments)
| * | Does not include derivatives, except purchased options, if any. |
| |
| WHERE CAN I FIND ADDITIONAL INFORMATION ABOUT THE FUND? |
Additional information is available on https://www.franklintempleton.com/regulatory-fund-documents, including its: |
| • prospectus • proxy voting information • financial information • holdings • tax information |
HOUSEHOLDING
You will receive the Fund’s shareholder reports every six months. In addition, you will receive an annual updated summary prospectus (detail prospectus available upon request). To reduce Fund expenses, we try to identify related shareholders in a household and send only one copy of the shareholder reports and summary prospectus. This process, called “householding,” will continue indefinitely unless you instruct us otherwise. If you prefer not to have these documents householded, please call us at (800) DIAL BEN/342-5236. At any time, you may view current prospectuses/summary prospectuses and shareholder reports on our website. If you choose, you may receive these documents through electronic delivery.
| Franklin DynaTech Fund | PAGE 3 | 328-ATSR-1124 |
1000010381120641522219998210293111740488243263063143794100009950114391357915967164331889824921205282472933432100001031711737143121807618746257823282425409324534614510000993911472136071604416727192602504021165257413509856.811.811.69.35.83.40.40.9
| | |
Franklin DynaTech Fund | |
| Advisor Class [FDYZX] |
| Annual Shareholder Report | September 30, 2024 |
|
This annual shareholder report contains important information about Franklin DynaTech Fund for the period October 1, 2023, to September 30, 2024.
You can find additional information about the Fund at https://www.franklintempleton.com/regulatory-fund-documents. You can also request this information by contacting us at (800) DIAL BEN/342-5236.
WHAT WERE THE FUND COSTS FOR THE LAST YEAR? (based on a hypothetical $10,000 investment)
| | |
Class Name | Costs of a $10,000 investment | Costs paid as a percentage of a $10,000 investment* |
| Advisor Class | $66 | 0.54% |
| * | Reflects fee waivers and/or expense reimbursements, without which expenses would have been higher. |
HOW DID THE FUND PERFORM LAST YEAR AND WHAT AFFECTED ITS PERFORMANCE?
For the twelve months ended September 30, 2024, Advisor Class shares of Franklin DynaTech Fund returned 42.83%. The Fund compares its performance to the Russell 1000 Growth Index and the S&P 500 Index, which returned 42.19% and 36.35%, respectively, for the same period.
| |
Top contributors to performance: |
| ↑ | Stock selection and underweightings in the consumer discretionary and industrials sectors, along with a substantial overweighting in rallying information technology (IT) companies; when combined, these three sectors comprised almost three quarters of the overall portfolio. |
| ↑ | Overweight positions in key contributors such as NVIDIA, Monolithic Power Systems and KLA, IT companies within the semiconductors and semiconductor equipment industry, helped this core allocation more than double in value during the period under review. |
| ↑ | Strategic underweightings in select mega-capitalization tech companies proved beneficial as the overall gains in Apple, Alphabet (Google) and Microsoft lagged the Russell 1000 Growth Index. Relative returns were further buoyed by having no sector exposure to consumer staples or real estate. |
| |
Top detractors from performance: |
| ↓ | Stock selection and underweighting in communication services, including a lighter-than-index position in Meta Platforms (Facebook) as its share price nearly doubled, and lagging gains for Netflix (purchased during the period) in the entertainment industry. |
| ↓ | IT sector results were curbed by unfavorable stock selection and a significant overweighting in software stocks (centered on sub-par gains for Synopsys, Cadence Design Systems, HubSpot and Intuit) as they trailed the benchmark; underweighting in Broadcom in the semiconductor space as its equity value skyrocketed; and overweighting in IT services companies such as MongoDB (sold by period-end) as the group barely advanced. |
| ↓ | Individual securities that weighed on performance in other sectors, including a steep selloff in off-benchmark oilfield services provider Schlumberger (sold by period-end) in energy, and poor outcome for Tesla in the consumer discretionary sector during what turned out to be a volatile year for sales of electric vehicles, solar products and battery-based energy storage solutions. |
| Franklin DynaTech Fund | PAGE 1 | 628-ATSR-1124 |
HOW DID THE FUND PERFORM OVER THE LAST 10 YEARS?
The Fund’s past performance is not necessarily an indication of how the Fund will perform in the future. The graph and table do not reflect the deduction of taxes that a shareholder would pay on Fund distributions or redemption of Fund shares.
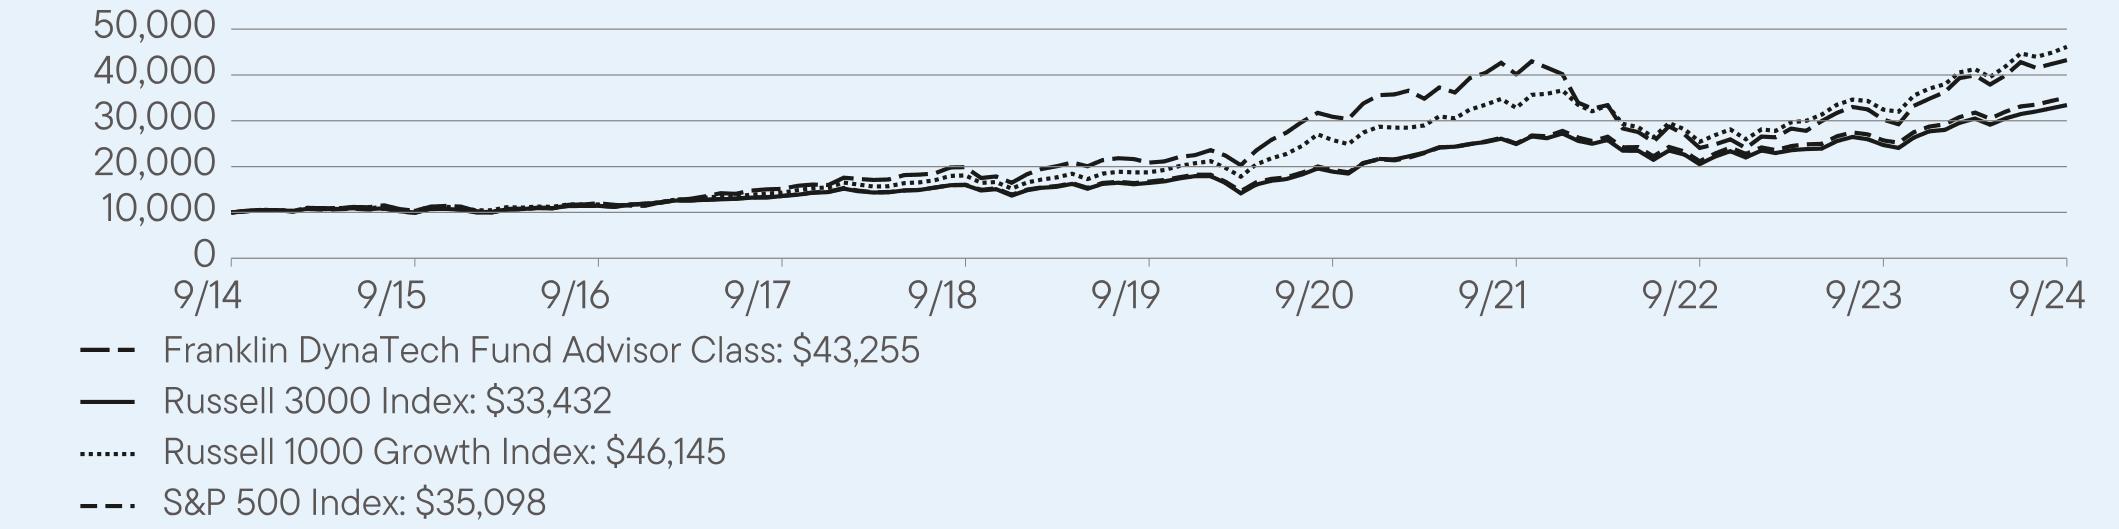
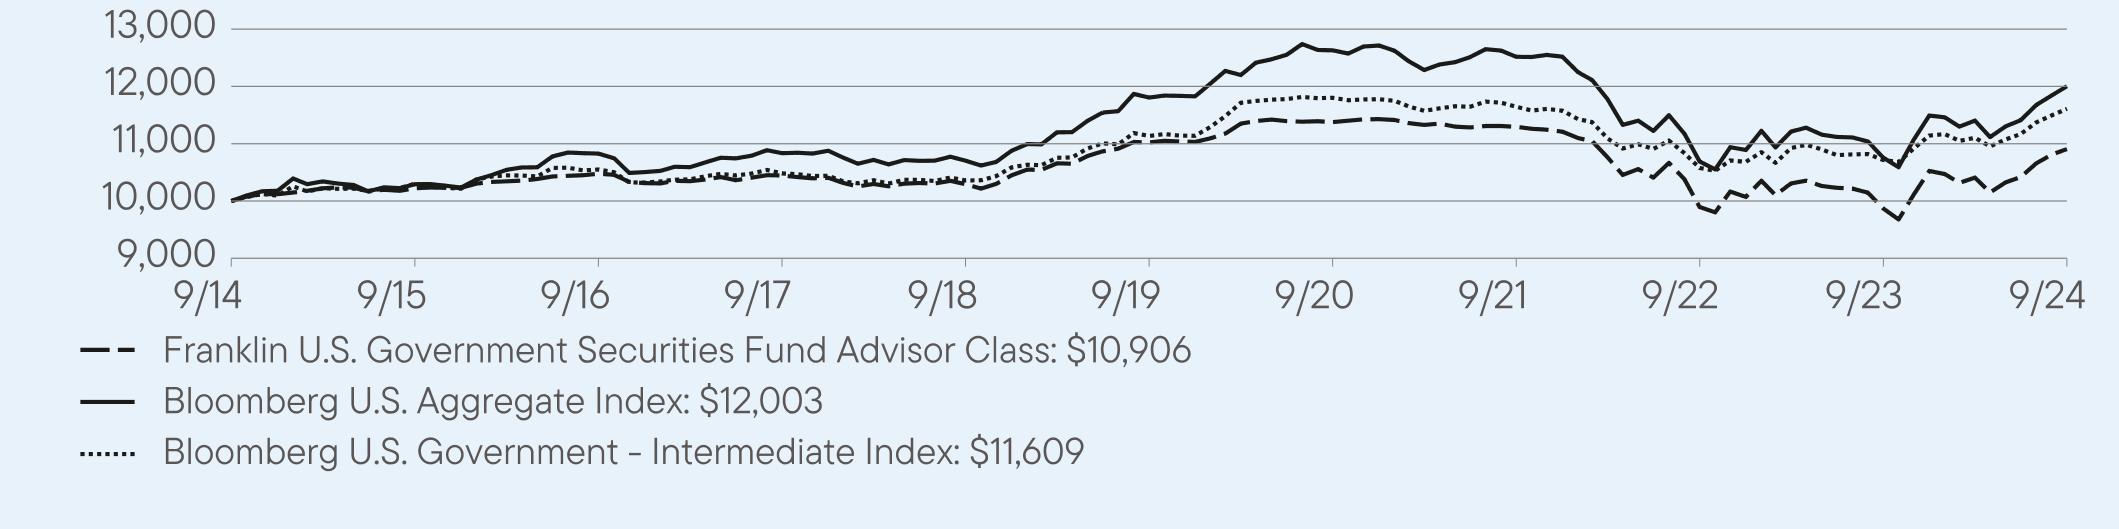
VALUE OF A $10,000 INVESTMENT – Advisor Class 9/30/2014 — 9/30/2024
AVERAGE ANNUAL TOTAL RETURNS (%) Period Ended September 30, 2024
| | | |
| | 1 Year | 5 Year | 10 Year |
Advisor Class | 42.83 | 15.69 | 15.77 |
Russell 3000 Index | 35.19 | 15.26 | 12.83 |
Russell 1000 Growth Index | 42.19 | 19.73 | 16.52 |
S&P 500 Index | 36.35 | 15.97 | 13.38 |
Fund performance figures may reflect fee waivers and/or expense reimbursements, without which the performance would have been lower.
For current month-end performance, please call Franklin Templeton at (800) DIAL BEN/342-5236 or visit https://www.franklintempleton.com/investments/options/mutual-funds.
Important data provider notices and terms available at www.franklintempletondatasources.com.
KEY FUND STATISTICS (as of September 30, 2024)
| |
Total Net Assets | $25,397,621,872 |
Total Number of Portfolio Holdings* | 105 |
Total Management Fee Paid | $97,407,595 |
Portfolio Turnover Rate | 11.94% |
| * | Does not include derivatives, except purchased options, if any. |
| Franklin DynaTech Fund | PAGE 2 | 628-ATSR-1124 |
WHAT DID THE FUND INVEST IN? (as of September 30, 2024)
Portfolio Composition* (% of Total Investments)
| * | Does not include derivatives, except purchased options, if any. |
| |
| WHERE CAN I FIND ADDITIONAL INFORMATION ABOUT THE FUND? |
Additional information is available on https://www.franklintempleton.com/regulatory-fund-documents, including its: |
| • prospectus • proxy voting information • financial information • holdings • tax information |
HOUSEHOLDING
You will receive the Fund’s shareholder reports every six months. In addition, you will receive an annual updated summary prospectus (detail prospectus available upon request). To reduce Fund expenses, we try to identify related shareholders in a household and send only one copy of the shareholder reports and summary prospectus. This process, called “householding,” will continue indefinitely unless you instruct us otherwise. If you prefer not to have these documents householded, please call us at (800) DIAL BEN/342-5236. At any time, you may view current prospectuses/summary prospectuses and shareholder reports on our website. If you choose, you may receive these documents through electronic delivery.
| Franklin DynaTech Fund | PAGE 3 | 628-ATSR-1124 |
1000010362120231514619874208763086140122240753028343255100009950114391357915967164331889824921205282472933432100001031711737143121807618746257823282425409324534614510000993911472136071604416727192602504021165257413509856.811.811.69.35.83.40.40.9
| | |
Franklin Growth Fund | |
| Class A [FKGRX] |
| Annual Shareholder Report | September 30, 2024 |
|
This annual shareholder report contains important information about Franklin Growth Fund for the period October 1, 2023, to September 30, 2024.
You can find additional information about the Fund at https://www.franklintempleton.com/regulatory-fund-documents. You can also request this information by contacting us at (800) DIAL BEN/342-5236.
WHAT WERE THE FUND COSTS FOR THE LAST YEAR? (based on a hypothetical $10,000 investment)
| | |
Class Name | Costs of a $10,000 investment | Costs paid as a percentage of a $10,000 investment* |
| Class A | $93 | 0.79% |
| * | Reflects fee waivers and/or expense reimbursements, without which expenses would have been higher. |
HOW DID THE FUND PERFORM LAST YEAR AND WHAT AFFECTED ITS PERFORMANCE?
For the twelve months ended September 30, 2024, Class A shares of Franklin Growth Fund returned 34.70%. The Fund compares its performance to the S&P 500 Index and the Russell 1000 Growth Index, which returned 36.35% and 42.19%, respectively, for the same period.
| |
Top contributors to performance: |
| ↑ | Lack of exposure to energy and stock selection in health care were top relative contributors. |
| ↑ | Monolithic Power Systems, a provider of power circuits, and chip maker NVIDIA, benefited relative returns in the information technology (IT) sector. These companies have been growing revenue by leveraging artificial intelligence (AI) to enhance their products and services across various industries. |
| ↑ | Trane Technologies was a top relative contributor in the industrials sector. Strong sales, orders and backlog have been tailwinds for the climate control products company. |
| |
Top detractors from performance: |
| ↓ | Sectors with the largest negative impact on relative returns were communication services, financials and consumer staples. |
| ↓ | Bill Holdings (not held at period-end) weighed on the IT sector. The financial software provider faced a challenging macroeconomic environment and lower spending by businesses, which pressured revenues. |
| ↓ | Monster Beverage, an energy drink maker in the consumer staples sector, faced headwinds from high inflation and interest rates. In the health care sector, laboratory equipment provider Sartorius saw its revenues suffer from lower demand in China and reduced spending on more expensive equipment. |
| Franklin Growth Fund | PAGE 1 | 106-ATSR-1124 |
HOW DID THE FUND PERFORM OVER THE LAST 10 YEARS?
The Fund’s past performance is not necessarily an indication of how the Fund will perform in the future. The graph and table do not reflect the deduction of taxes that a shareholder would pay on Fund distributions or redemption of Fund shares.
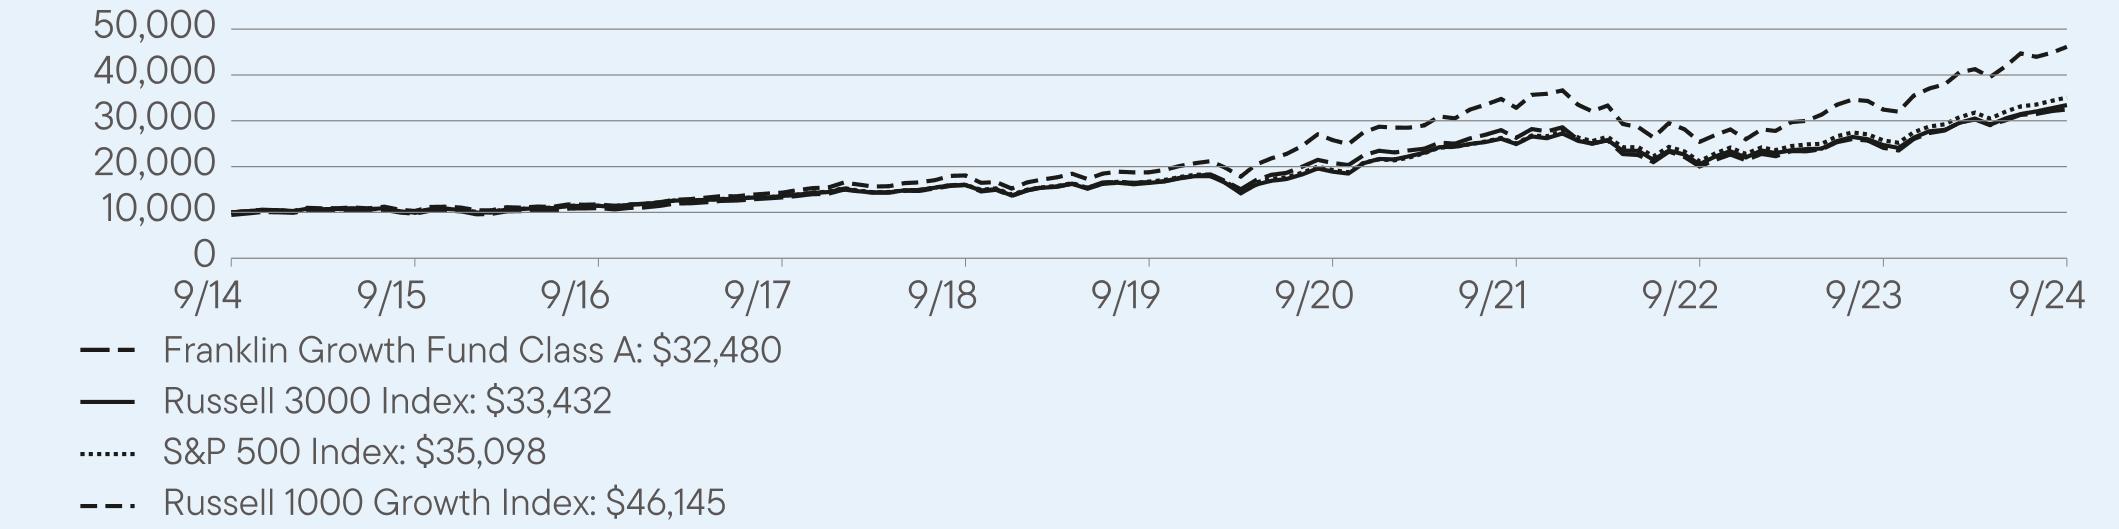
VALUE OF A $10000 INVESTMENT ($9,450 AFTER MAXIMUM APPLICABLE SALES CHARGE) –
Class A 9/30/2014 — 9/30/2024
AVERAGE ANNUAL TOTAL RETURNS (%) Period Ended September 30, 2024
| | | |
| | 1 Year | 5 Year | 10 Year |
Class A | 34.70 | 14.34 | 13.14 |
Class A (with sales charge) | 27.29 | 13.06 | 12.50 |
Russell 3000 Index | 35.19 | 15.26 | 12.83 |
S&P 500 Index | 36.35 | 15.97 | 13.38 |
Russell 1000 Growth Index | 42.19 | 19.73 | 16.52 |
Fund performance figures may reflect fee waivers and/or expense reimbursements, without which the performance would have been lower.
Performance for periods prior to September 10, 2018, has been restated to reflect the current maximum sales charge, which is lower than the maximum sales charge prior to that date.
For current month-end performance, please call Franklin Templeton at (800) DIAL BEN/342-5236 or visit https://www.franklintempleton.com/investments/options/mutual-funds.
Important data provider notices and terms available at www.franklintempletondatasources.com.
KEY FUND STATISTICS (as of September 30, 2024)
| |
Total Net Assets | $19,370,387,946 |
Total Number of Portfolio Holdings* | 101 |
Total Management Fee Paid | $77,988,684 |
Portfolio Turnover Rate | 7.35% |
| * | Does not include derivatives, except purchased options, if any. |
| Franklin Growth Fund | PAGE 2 | 106-ATSR-1124 |
WHAT DID THE FUND INVEST IN? (as of September 30, 2024)
Portfolio Composition* (% of Total Investments)
| * | Does not include derivatives, except purchased options, if any. |
| |
| WHERE CAN I FIND ADDITIONAL INFORMATION ABOUT THE FUND? |
Additional information is available on https://www.franklintempleton.com/regulatory-fund-documents, including its: |
| • prospectus • proxy voting information • financial information • holdings • tax information |
HOUSEHOLDING
You will receive the Fund’s shareholder reports every six months. In addition, you will receive an annual updated summary prospectus (detail prospectus available upon request). To reduce Fund expenses, we try to identify related shareholders in a household and send only one copy of the shareholder reports and summary prospectus. This process, called “householding,” will continue indefinitely unless you instruct us otherwise. If you prefer not to have these documents householded, please call us at (800) DIAL BEN/342-5236. At any time, you may view current prospectuses/summary prospectuses and shareholder reports on our website. If you choose, you may receive these documents through electronic delivery.
| Franklin Growth Fund | PAGE 3 | 106-ATSR-1124 |
94509728109511326316012166182078826286200212411132480100009950114391357915967164331889824921205282472933432100009939114721360716044167271926025040211652574135098100001031711737143121807618746257823282425409324534614537.716.416.28.66.94.13.83.51.60.50.7
| | |
Franklin Growth Fund | |
| Class C [FRGSX] |
| Annual Shareholder Report | September 30, 2024 |
|
This annual shareholder report contains important information about Franklin Growth Fund for the period October 1, 2023, to September 30, 2024.
You can find additional information about the Fund at https://www.franklintempleton.com/regulatory-fund-documents. You can also request this information by contacting us at (800) DIAL BEN/342-5236.
WHAT WERE THE FUND COSTS FOR THE LAST YEAR? (based on a hypothetical $10,000 investment)
| | |
Class Name | Costs of a $10,000 investment | Costs paid as a percentage of a $10,000 investment* |
| Class C | $180 | 1.54% |
| * | Reflects fee waivers and/or expense reimbursements, without which expenses would have been higher. |
HOW DID THE FUND PERFORM LAST YEAR AND WHAT AFFECTED ITS PERFORMANCE?
For the twelve months ended September 30, 2024, Class C shares of Franklin Growth Fund returned 33.69%. The Fund compares its performance to the S&P 500 Index and the Russell 1000 Growth Index, which returned 36.35% and 42.19%, respectively, for the same period.
| |
Top contributors to performance: |
| ↑ | Lack of exposure to energy and stock selection in health care were top relative contributors. |
| ↑ | Monolithic Power Systems, a provider of power circuits, and chip maker NVIDIA, benefited relative returns in the information technology (IT) sector. These companies have been growing revenue by leveraging artificial intelligence (AI) to enhance their products and services across various industries. |
| ↑ | Trane Technologies was a top relative contributor in the industrials sector. Strong sales, orders and backlog have been tailwinds for the climate control products company. |
| |
Top detractors from performance: |
| ↓ | Sectors with the largest negative impact on relative returns were communication services, financials and consumer staples. |
| ↓ | Bill Holdings (not held at period-end) weighed on the IT sector. The financial software provider faced a challenging macroeconomic environment and lower spending by businesses, which pressured revenues. |
| ↓ | Monster Beverage, an energy drink maker in the consumer staples sector, faced headwinds from high inflation and interest rates. In the health care sector, laboratory equipment provider Sartorius saw its revenues suffer from lower demand in China and reduced spending on more expensive equipment. |
| Franklin Growth Fund | PAGE 1 | 206-ATSR-1124 |
HOW DID THE FUND PERFORM OVER THE LAST 10 YEARS?
The Fund’s past performance is not necessarily an indication of how the Fund will perform in the future. The graph and table do not reflect the deduction of taxes that a shareholder would pay on Fund distributions or redemption of Fund shares.
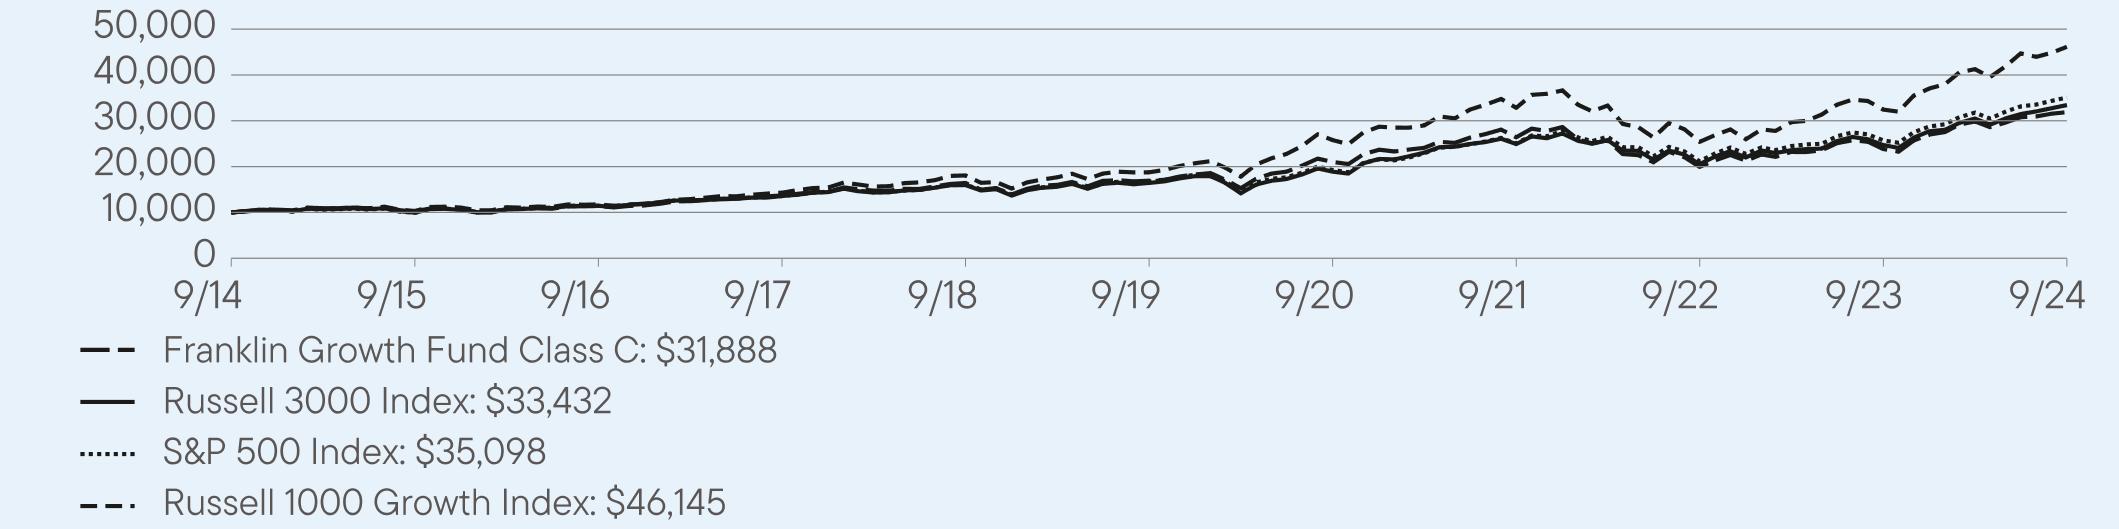
VALUE OF A $10,000 INVESTMENT – Class C 9/30/2014 — 9/30/2024
AVERAGE ANNUAL TOTAL RETURNS (%) Period Ended September 30, 2024
| | | |
| | 1 Year | 5 Year | 10 Year |
Class C | 33.69 | 13.49 | 12.30 |
Class C (with sales charge) | 32.69 | 13.49 | 12.30 |
Russell 3000 Index | 35.19 | 15.26 | 12.83 |
S&P 500 Index | 36.35 | 15.97 | 13.38 |
Russell 1000 Growth Index | 42.19 | 19.73 | 16.52 |
Fund performance figures may reflect fee waivers and/or expense reimbursements, without which the performance would have been lower.
For current month-end performance, please call Franklin Templeton at (800) DIAL BEN/342-5236 or visit https://www.franklintempleton.com/investments/options/mutual-funds.
Important data provider notices and terms available at www.franklintempletondatasources.com.
KEY FUND STATISTICS (as of September 30, 2024)
| |
Total Net Assets | $19,370,387,946 |
Total Number of Portfolio Holdings* | 101 |
Total Management Fee Paid | $77,988,684 |
Portfolio Turnover Rate | 7.35% |
| * | Does not include derivatives, except purchased options, if any. |
| Franklin Growth Fund | PAGE 2 | 206-ATSR-1124 |
WHAT DID THE FUND INVEST IN? (as of September 30, 2024)
Portfolio Composition* (% of Total Investments)
| * | Does not include derivatives, except purchased options, if any. |
| |
| WHERE CAN I FIND ADDITIONAL INFORMATION ABOUT THE FUND? |
Additional information is available on https://www.franklintempleton.com/regulatory-fund-documents, including its: |
| • prospectus • proxy voting information • financial information • holdings • tax information |
HOUSEHOLDING
You will receive the Fund’s shareholder reports every six months. In addition, you will receive an annual updated summary prospectus (detail prospectus available upon request). To reduce Fund expenses, we try to identify related shareholders in a household and send only one copy of the shareholder reports and summary prospectus. This process, called “householding,” will continue indefinitely unless you instruct us otherwise. If you prefer not to have these documents householded, please call us at (800) DIAL BEN/342-5236. At any time, you may view current prospectuses/summary prospectuses and shareholder reports on our website. If you choose, you may receive these documents through electronic delivery.
| Franklin Growth Fund | PAGE 3 | 206-ATSR-1124 |
1000010216114151372216442169382103026394199552385331888100009950114391357915967164331889824921205282472933432100009939114721360716044167271926025040211652574135098100001031711737143121807618746257823282425409324534614537.716.416.28.66.94.13.83.51.60.50.7
| | |
Franklin Growth Fund | |
| Class R [FGSRX] |
| Annual Shareholder Report | September 30, 2024 |
|
This annual shareholder report contains important information about Franklin Growth Fund for the period October 1, 2023, to September 30, 2024.
You can find additional information about the Fund at https://www.franklintempleton.com/regulatory-fund-documents. You can also request this information by contacting us at (800) DIAL BEN/342-5236.
WHAT WERE THE FUND COSTS FOR THE LAST YEAR? (based on a hypothetical $10,000 investment)
| | |
Class Name | Costs of a $10,000 investment | Costs paid as a percentage of a $10,000 investment* |
| Class R | $122 | 1.04% |
| * | Reflects fee waivers and/or expense reimbursements, without which expenses would have been higher. |
HOW DID THE FUND PERFORM LAST YEAR AND WHAT AFFECTED ITS PERFORMANCE?
For the twelve months ended September 30, 2024, Class R shares of Franklin Growth Fund returned 34.36%. The Fund compares its performance to the S&P 500 Index and the Russell 1000 Growth Index, which returned 36.35% and 42.19%, respectively, for the same period.
| |
Top contributors to performance: |
| ↑ | Lack of exposure to energy and stock selection in health care were top relative contributors. |
| ↑ | Monolithic Power Systems, a provider of power circuits, and chip maker NVIDIA, benefited relative returns in the information technology (IT) sector. These companies have been growing revenue by leveraging artificial intelligence (AI) to enhance their products and services across various industries. |
| ↑ | Trane Technologies was a top relative contributor in the industrials sector. Strong sales, orders and backlog have been tailwinds for the climate control products company. |
| |
Top detractors from performance: |
| ↓ | Sectors with the largest negative impact on relative returns were communication services, financials and consumer staples. |
| ↓ | Bill Holdings (not held at period-end) weighed on the IT sector. The financial software provider faced a challenging macroeconomic environment and lower spending by businesses, which pressured revenues. |
| ↓ | Monster Beverage, an energy drink maker in the consumer staples sector, faced headwinds from high inflation and interest rates. In the health care sector, laboratory equipment provider Sartorius saw its revenues suffer from lower demand in China and reduced spending on more expensive equipment. |
| Franklin Growth Fund | PAGE 1 | 806-ATSR-1124 |
HOW DID THE FUND PERFORM OVER THE LAST 10 YEARS?
The Fund’s past performance is not necessarily an indication of how the Fund will perform in the future. The graph and table do not reflect the deduction of taxes that a shareholder would pay on Fund distributions or redemption of Fund shares.
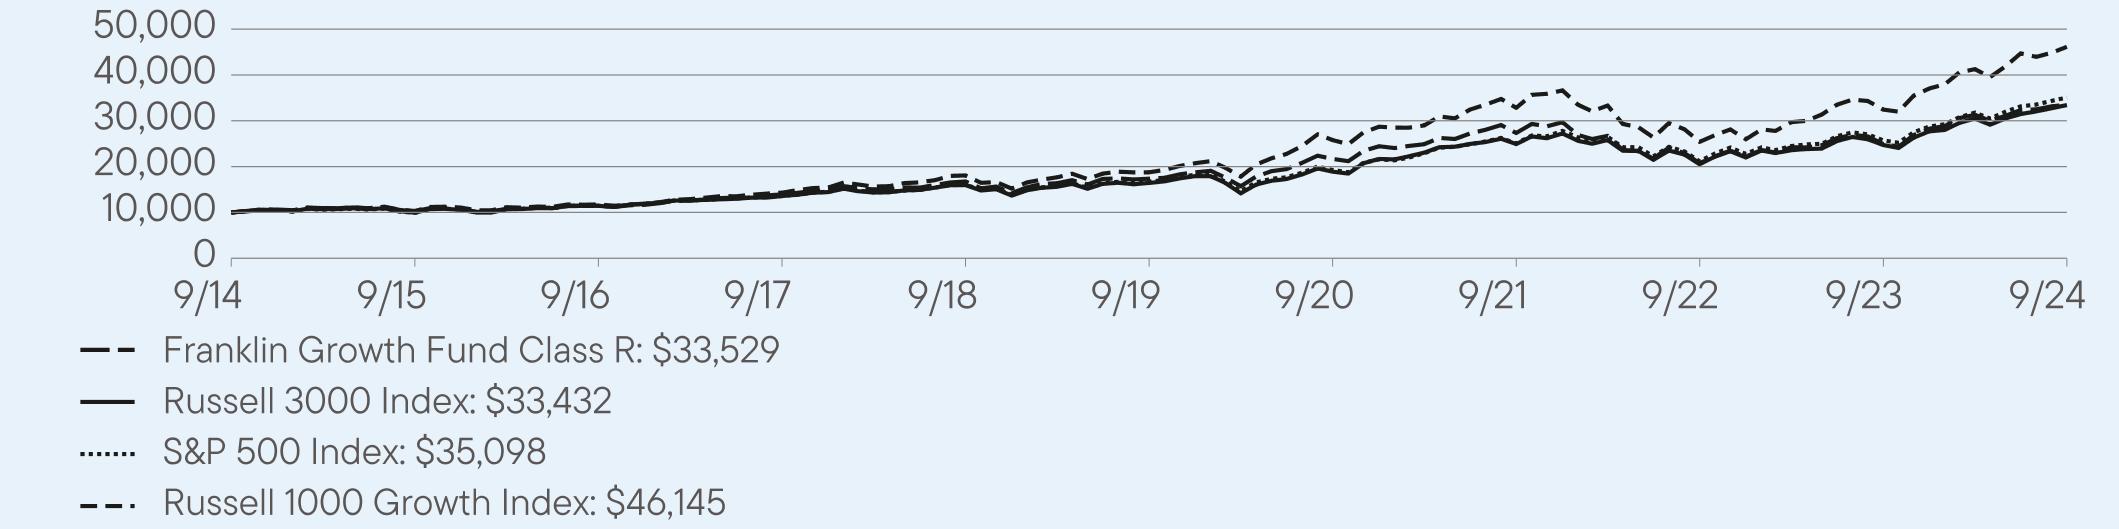
VALUE OF A $10,000 INVESTMENT – Class R 9/30/2014 — 9/30/2024
AVERAGE ANNUAL TOTAL RETURNS (%) Period Ended September 30, 2024
| | | |
| | 1 Year | 5 Year | 10 Year |
Class R | 34.36 | 14.06 | 12.86 |
Russell 3000 Index | 35.19 | 15.26 | 12.83 |
S&P 500 Index | 36.35 | 15.97 | 13.38 |
Russell 1000 Growth Index | 42.19 | 19.73 | 16.52 |
Fund performance figures may reflect fee waivers and/or expense reimbursements, without which the performance would have been lower.
For current month-end performance, please call Franklin Templeton at (800) DIAL BEN/342-5236 or visit https://www.franklintempleton.com/investments/options/mutual-funds.
Important data provider notices and terms available at www.franklintempletondatasources.com.
KEY FUND STATISTICS (as of September 30, 2024)
| |
Total Net Assets | $19,370,387,946 |
Total Number of Portfolio Holdings* | 101 |
Total Management Fee Paid | $77,988,684 |
Portfolio Turnover Rate | 7.35% |
| * | Does not include derivatives, except purchased options, if any. |
| Franklin Growth Fund | PAGE 2 | 806-ATSR-1124 |
WHAT DID THE FUND INVEST IN? (as of September 30, 2024)
Portfolio Composition* (% of Total Investments)
| * | Does not include derivatives, except purchased options, if any. |
| |
| WHERE CAN I FIND ADDITIONAL INFORMATION ABOUT THE FUND? |
Additional information is available on https://www.franklintempleton.com/regulatory-fund-documents, including its: |
| • prospectus • proxy voting information • financial information • holdings • tax information |
HOUSEHOLDING
You will receive the Fund’s shareholder reports every six months. In addition, you will receive an annual updated summary prospectus (detail prospectus available upon request). To reduce Fund expenses, we try to identify related shareholders in a household and send only one copy of the shareholder reports and summary prospectus. This process, called “householding,” will continue indefinitely unless you instruct us otherwise. If you prefer not to have these documents householded, please call us at (800) DIAL BEN/342-5236. At any time, you may view current prospectuses/summary prospectuses and shareholder reports on our website. If you choose, you may receive these documents through electronic delivery.
| Franklin Growth Fund | PAGE 3 | 806-ATSR-1124 |
1000010268115301393016774173682167127334207712495333529100009950114391357915967164331889824921205282472933432100009939114721360716044167271926025040211652574135098100001031711737143121807618746257823282425409324534614537.716.416.28.66.94.13.83.51.60.50.7
| | |
Franklin Growth Fund | |
| Class R6 [FIFRX] |
| Annual Shareholder Report | September 30, 2024 |
|
This annual shareholder report contains important information about Franklin Growth Fund for the period October 1, 2023, to September 30, 2024.
You can find additional information about the Fund at https://www.franklintempleton.com/regulatory-fund-documents. You can also request this information by contacting us at (800) DIAL BEN/342-5236.
WHAT WERE THE FUND COSTS FOR THE LAST YEAR? (based on a hypothetical $10,000 investment)
| | |
Class Name | Costs of a $10,000 investment | Costs paid as a percentage of a $10,000 investment* |
| Class R6 | $54 | 0.46% |
| * | Reflects fee waivers and/or expense reimbursements, without which expenses would have been higher. |
HOW DID THE FUND PERFORM LAST YEAR AND WHAT AFFECTED ITS PERFORMANCE?
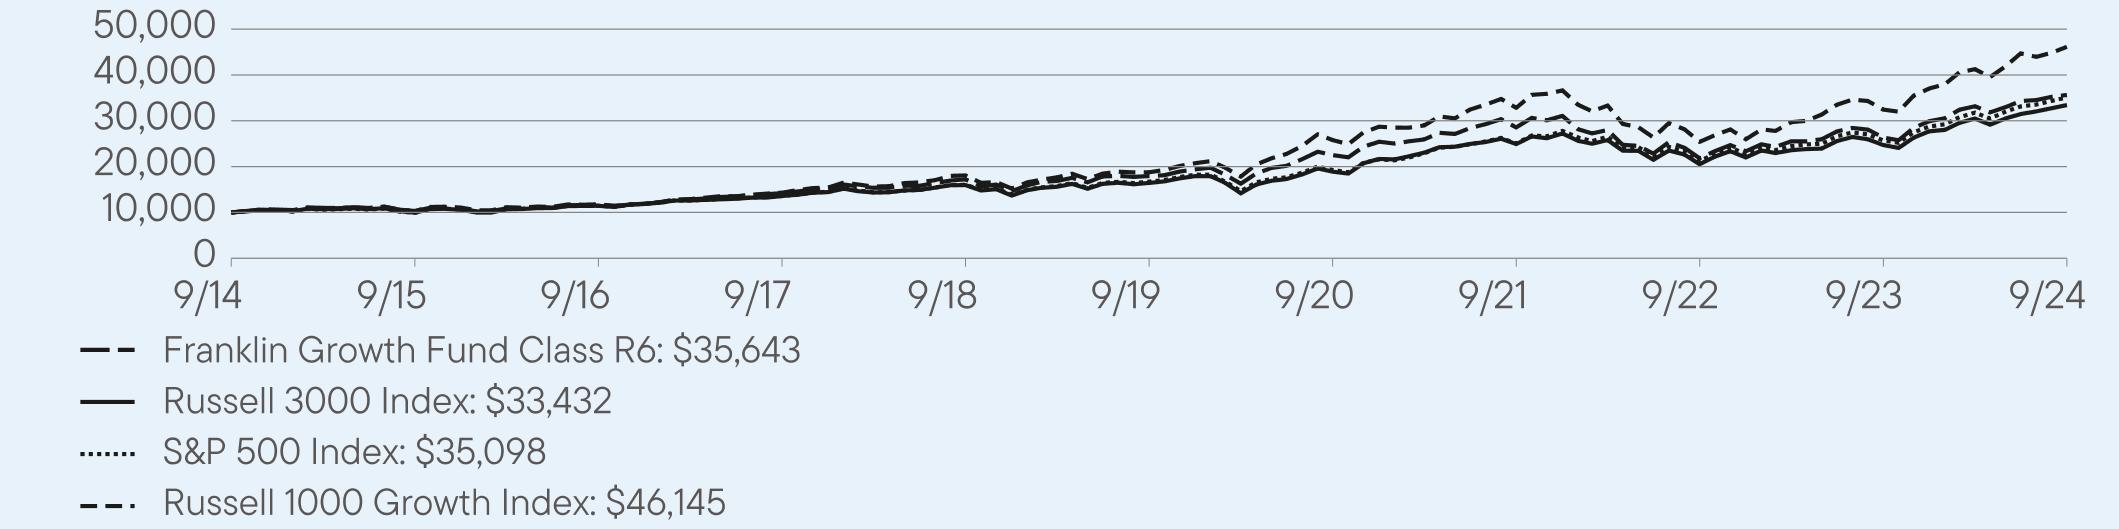
For the twelve months ended September 30, 2024, Class R6 shares of Franklin Growth Fund returned 35.14%. The Fund compares its performance to the S&P 500 Index and the Russell 1000 Growth Index, which returned 36.35% and 42.19%, respectively, for the same period.
| |
Top contributors to performance: |
| ↑ | Lack of exposure to energy and stock selection in health care were top relative contributors. |
| ↑ | Monolithic Power Systems, a provider of power circuits, and chip maker NVIDIA, benefited relative returns in the information technology (IT) sector. These companies have been growing revenue by leveraging artificial intelligence (AI) to enhance their products and services across various industries. |
| ↑ | Trane Technologies was a top relative contributor in the industrials sector. Strong sales, orders and backlog have been tailwinds for the climate control products company. |
| |
Top detractors from performance: |
| ↓ | Sectors with the largest negative impact on relative returns were communication services, financials and consumer staples. |
| ↓ | Bill Holdings (not held at period-end) weighed on the IT sector. The financial software provider faced a challenging macroeconomic environment and lower spending by businesses, which pressured revenues. |
| ↓ | Monster Beverage, an energy drink maker in the consumer staples sector, faced headwinds from high inflation and interest rates. In the health care sector, laboratory equipment provider Sartorius saw its revenues suffer from lower demand in China and reduced spending on more expensive equipment. |
| Franklin Growth Fund | PAGE 1 | 366-ATSR-1124 |
HOW DID THE FUND PERFORM OVER THE LAST 10 YEARS?
The Fund’s past performance is not necessarily an indication of how the Fund will perform in the future. The graph and table do not reflect the deduction of taxes that a shareholder would pay on Fund distributions or redemption of Fund shares.
VALUE OF A $10,000 INVESTMENT – Class R6 9/30/2014 — 9/30/2024
AVERAGE ANNUAL TOTAL RETURNS (%) Period Ended September 30, 2024
| | | |
| | 1 Year | 5 Year | 10 Year |
Class R6 | 35.14 | 14.72 | 13.55 |
Russell 3000 Index | 35.19 | 15.26 | 12.83 |
S&P 500 Index | 36.35 | 15.97 | 13.38 |
Russell 1000 Growth Index | 42.19 | 19.73 | 16.52 |
Fund performance figures may reflect fee waivers and/or expense reimbursements, without which the performance would have been lower.
For current month-end performance, please call Franklin Templeton at (800) DIAL BEN/342-5236 or visit https://www.franklintempleton.com/investments/options/mutual-funds.
Important data provider notices and terms available at www.franklintempletondatasources.com.
KEY FUND STATISTICS (as of September 30, 2024)
| |
Total Net Assets | $19,370,387,946 |
Total Number of Portfolio Holdings* | 101 |
Total Management Fee Paid | $77,988,684 |
Portfolio Turnover Rate | 7.35% |
| * | Does not include derivatives, except purchased options, if any. |
| Franklin Growth Fund | PAGE 2 | 366-ATSR-1124 |
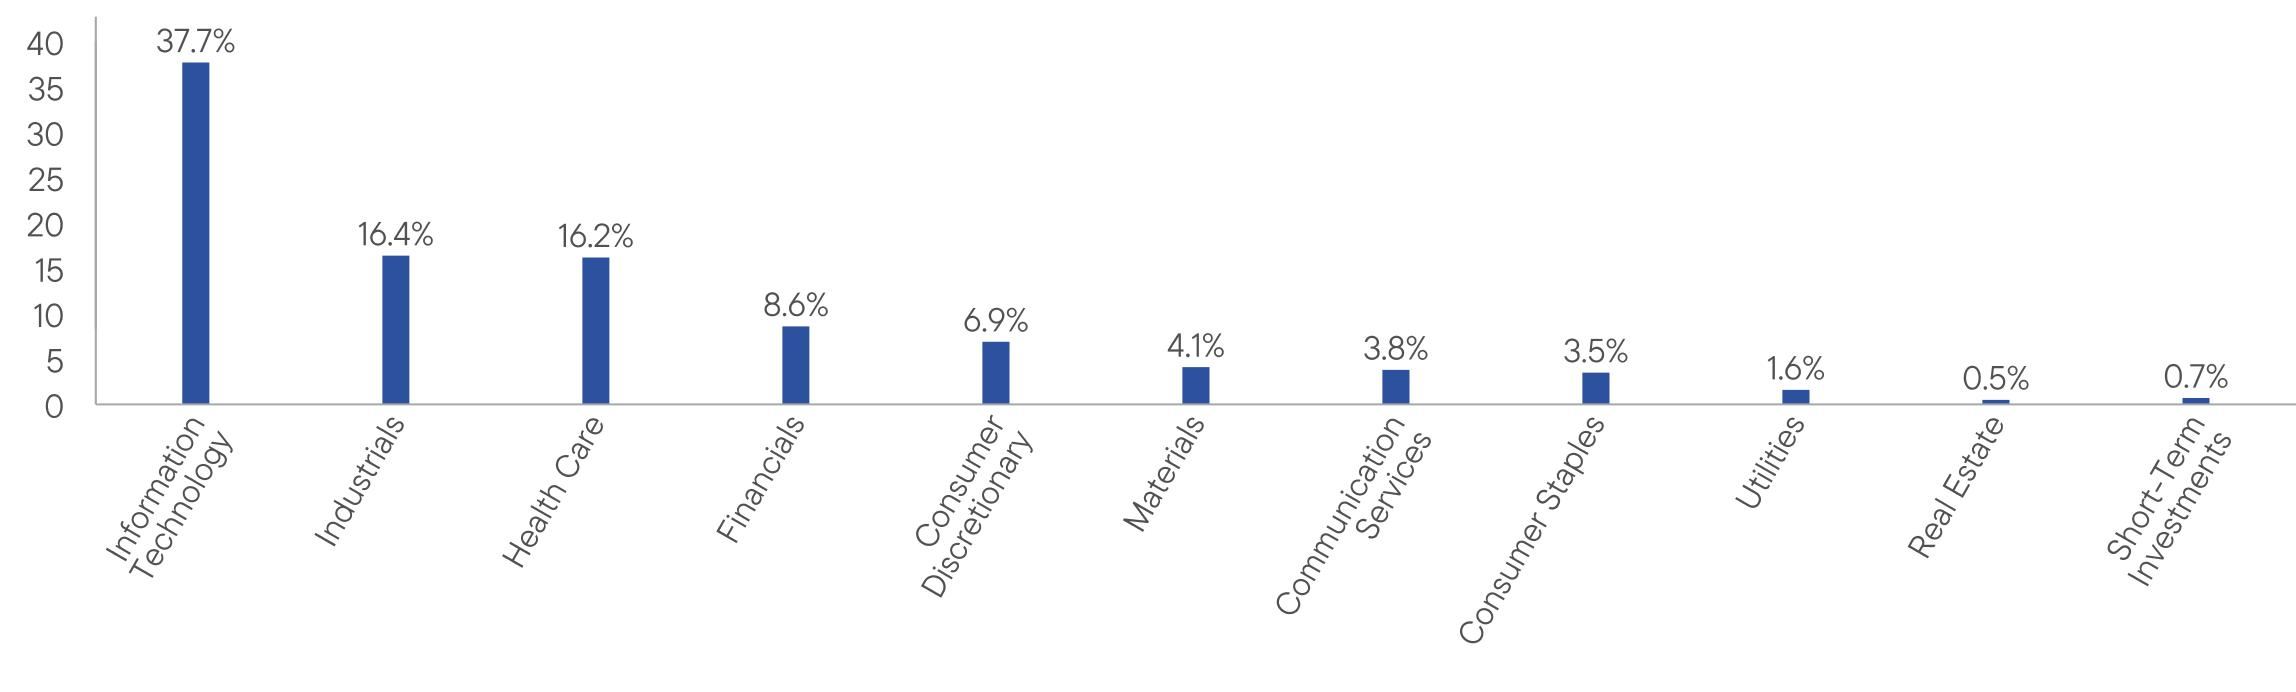
WHAT DID THE FUND INVEST IN? (as of September 30, 2024)
Portfolio Composition* (% of Total Investments)
| * | Does not include derivatives, except purchased options, if any. |
| |
| WHERE CAN I FIND ADDITIONAL INFORMATION ABOUT THE FUND? |
Additional information is available on https://www.franklintempleton.com/regulatory-fund-documents, including its: |
| • prospectus • proxy voting information • financial information • holdings • tax information |
HOUSEHOLDING
You will receive the Fund’s shareholder reports every six months. In addition, you will receive an annual updated summary prospectus (detail prospectus available upon request). To reduce Fund expenses, we try to identify related shareholders in a household and send only one copy of the shareholder reports and summary prospectus. This process, called “householding,” will continue indefinitely unless you instruct us otherwise. If you prefer not to have these documents householded, please call us at (800) DIAL BEN/342-5236. At any time, you may view current prospectuses/summary prospectuses and shareholder reports on our website. If you choose, you may receive these documents through electronic delivery.
| Franklin Growth Fund | PAGE 3 | 366-ATSR-1124 |
1000010337116861421117219179352251028558218272637535643100009950114391357915967164331889824921205282472933432100009939114721360716044167271926025040211652574135098100001031711737143121807618746257823282425409324534614537.716.416.28.66.94.13.83.51.60.50.7
| | |
Franklin Growth Fund | |
| Advisor Class [FCGAX] |
| Annual Shareholder Report | September 30, 2024 |
|
This annual shareholder report contains important information about Franklin Growth Fund for the period October 1, 2023, to September 30, 2024.
You can find additional information about the Fund at https://www.franklintempleton.com/regulatory-fund-documents. You can also request this information by contacting us at (800) DIAL BEN/342-5236.
WHAT WERE THE FUND COSTS FOR THE LAST YEAR? (based on a hypothetical $10,000 investment)
| | |
Class Name | Costs of a $10,000 investment | Costs paid as a percentage of a $10,000 investment* |
| Advisor Class | $63 | 0.54% |
| * | Reflects fee waivers and/or expense reimbursements, without which expenses would have been higher. |
HOW DID THE FUND PERFORM LAST YEAR AND WHAT AFFECTED ITS PERFORMANCE?
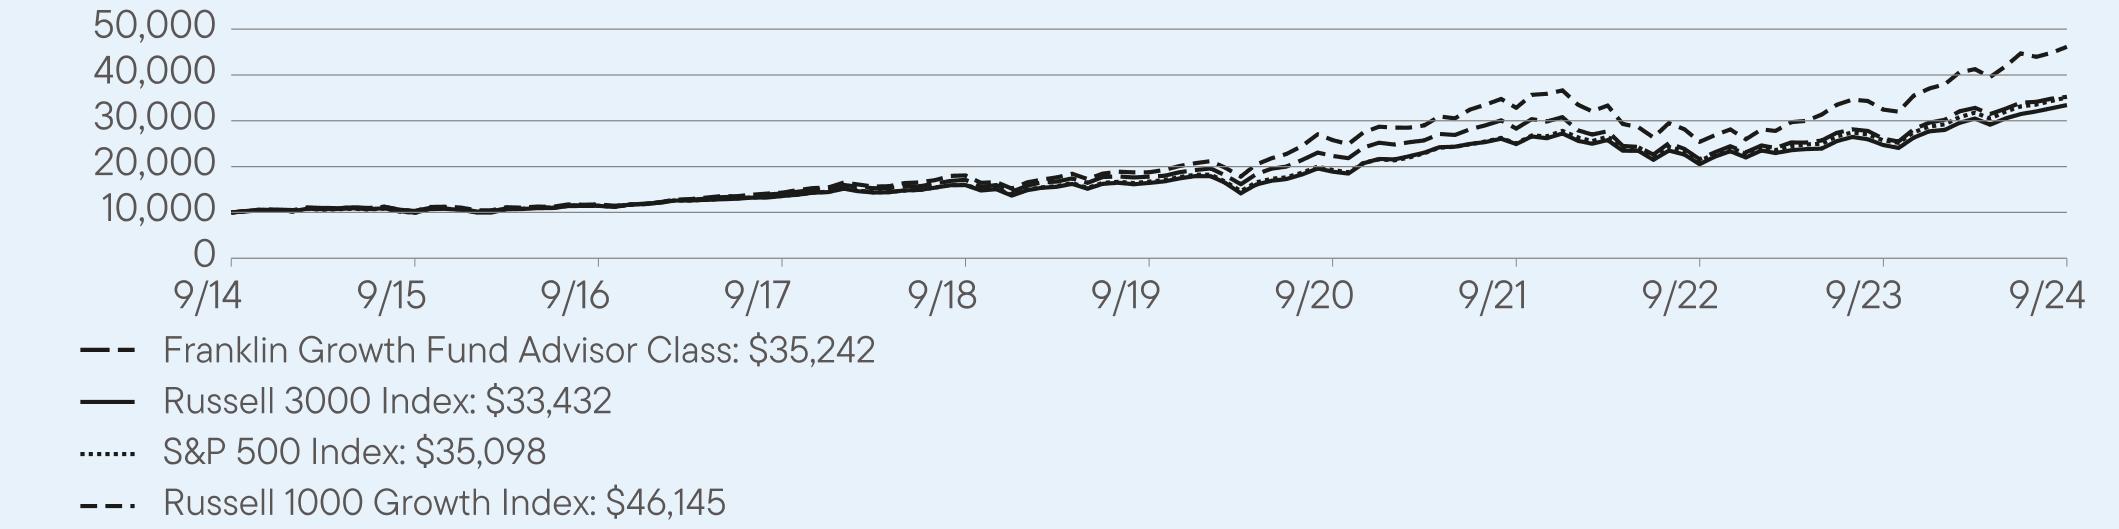
For the twelve months ended September 30, 2024, Advisor Class shares of Franklin Growth Fund returned 35.04%. The Fund compares its performance to the S&P 500 Index and the Russell 1000 Growth Index, which returned 36.35% and 42.19%, respectively, for the same period.
| |
Top contributors to performance: |
| ↑ | Lack of exposure to energy and stock selection in health care were top relative contributors. |
| ↑ | Monolithic Power Systems, a provider of power circuits, and chip maker NVIDIA, benefited relative returns in the information technology (IT) sector. These companies have been growing revenue by leveraging artificial intelligence (AI) to enhance their products and services across various industries. |
| ↑ | Trane Technologies was a top relative contributor in the industrials sector. Strong sales, orders and backlog have been tailwinds for the climate control products company. |
| |
Top detractors from performance: |
| ↓ | Sectors with the largest negative impact on relative returns were communication services, financials and consumer staples. |
| ↓ | Bill Holdings (not held at period-end) weighed on the IT sector. The financial software provider faced a challenging macroeconomic environment and lower spending by businesses, which pressured revenues. |
| ↓ | Monster Beverage, an energy drink maker in the consumer staples sector, faced headwinds from high inflation and interest rates. In the health care sector, laboratory equipment provider Sartorius saw its revenues suffer from lower demand in China and reduced spending on more expensive equipment. |
| Franklin Growth Fund | PAGE 1 | 606-ATSR-1124 |
HOW DID THE FUND PERFORM OVER THE LAST 10 YEARS?
The Fund’s past performance is not necessarily an indication of how the Fund will perform in the future. The graph and table do not reflect the deduction of taxes that a shareholder would pay on Fund distributions or redemption of Fund shares.
VALUE OF A $10,000 INVESTMENT – Advisor Class 9/30/2014 — 9/30/2024
AVERAGE ANNUAL TOTAL RETURNS (%) Period Ended September 30, 2024
| | | |
| | 1 Year | 5 Year | 10 Year |
Advisor Class | 35.04 | 14.63 | 13.42 |
Russell 3000 Index | 35.19 | 15.26 | 12.83 |
S&P 500 Index | 36.35 | 15.97 | 13.38 |
Russell 1000 Growth Index | 42.19 | 19.73 | 16.52 |
Fund performance figures may reflect fee waivers and/or expense reimbursements, without which the performance would have been lower.
For current month-end performance, please call Franklin Templeton at (800) DIAL BEN/342-5236 or visit https://www.franklintempleton.com/investments/options/mutual-funds.
Important data provider notices and terms available at www.franklintempletondatasources.com.
KEY FUND STATISTICS (as of September 30, 2024)
| |
Total Net Assets | $19,370,387,946 |
Total Number of Portfolio Holdings* | 101 |
Total Management Fee Paid | $77,988,684 |
Portfolio Turnover Rate | 7.35% |
| * | Does not include derivatives, except purchased options, if any. |
| Franklin Growth Fund | PAGE 2 | 606-ATSR-1124 |
WHAT DID THE FUND INVEST IN? (as of September 30, 2024)
Portfolio Composition* (% of Total Investments)
| * | Does not include derivatives, except purchased options, if any. |
| |
| WHERE CAN I FIND ADDITIONAL INFORMATION ABOUT THE FUND? |
Additional information is available on https://www.franklintempleton.com/regulatory-fund-documents, including its: |
| • prospectus • proxy voting information • financial information • holdings • tax information |
HOUSEHOLDING
You will receive the Fund’s shareholder reports every six months. In addition, you will receive an annual updated summary prospectus (detail prospectus available upon request). To reduce Fund expenses, we try to identify related shareholders in a household and send only one copy of the shareholder reports and summary prospectus. This process, called “householding,” will continue indefinitely unless you instruct us otherwise. If you prefer not to have these documents householded, please call us at (800) DIAL BEN/342-5236. At any time, you may view current prospectuses/summary prospectuses and shareholder reports on our website. If you choose, you may receive these documents through electronic delivery.
| Franklin Growth Fund | PAGE 3 | 606-ATSR-1124 |
1000010320116461414217114178062233128306216162609735242100009950114391357915967164331889824921205282472933432100009939114721360716044167271926025040211652574135098100001031711737143121807618746257823282425409324534614537.716.416.28.66.94.13.83.51.60.50.7
| | |
Franklin Income Fund | |
| Class A [FKIQX] |
| Annual Shareholder Report | September 30, 2024 |
|
This annual shareholder report contains important information about Franklin Income Fund for the period October 1, 2023, to September 30, 2024.
You can find additional information about the Fund at https://www.franklintempleton.com/regulatory-fund-documents. You can also request this information by contacting us at (800) DIAL BEN/342-5236.
WHAT WERE THE FUND COSTS FOR THE LAST YEAR? (based on a hypothetical $10,000 investment)
| | |
Class Name | Costs of a $10,000 investment | Costs paid as a percentage of a $10,000 investment* |
| Class A | $76 | 0.70% |
| * | Reflects fee waivers and/or expense reimbursements, without which expenses would have been higher. |
HOW DID THE FUND PERFORM LAST YEAR AND WHAT AFFECTED ITS PERFORMANCE?
For the twelve months ended September 30, 2024, Class A shares of Franklin Income Fund returned 18.33%. The Fund compares its performance to the S&P 500 Index and the Blended Benchmark (consisting of 50% MSCI USA High Dividend Yield Index + 25% Bloomberg High Yield Very Liquid Index + 25% Bloomberg U.S. Aggregate Index), which returned 36.35% and 19.84%, respectively, for the same period.
| |
Top contributors to performance: |
| ↑ | U.S. Treasuries (USTs), along with the health care and financials sectors, led absolute fixed income returns during the period. Community Health Systems and Bausch Health were the top contributors within health care. |
| ↑ | Among equities, returns were driven by the financials, utilities, and information technology (IT) sectors. On an individual issuer basis, NextEra Energy, Bank of America, and Lockheed Martin added value. |
| ↑ | Underweight fixed income allocation to securitized products assisted returns, as did selection within the health care sector. Equity returns benefited from an overweight allocation to utilities and an underweight allocation to energy. |
| |
Top detractors from performance: |
| ↓ | Among fixed income allocation, Multiplan, a cost management, payment, and revenue integrity solution provider, weakened returns within the health care sector. |
| ↓ | Equity returns were hindered by performance within the energy sector. By issuer, Intel, Bristol-Myers Squibb, and Chevron were the leading detractors during the period. |
| ↓ | Relative fixed income returns were weakened by an overweight allocation to USTs, as well as selection and overweight positioning within the consumer discretionary sector. Moreover, selection and underweight allocations to the IT and industrials sectors detracted from equity returns. |
Use of derivatives and the impact on performance:
The Fund used U.S. Treasury futures to hedge duration positioning, while equity call and put options were used to sell and reduce positions and/or to initiate and add to positions, which in aggregate contributed modestly to performance.
| Franklin Income Fund | PAGE 1 | 1109-ATSR-1124 |
HOW DID THE FUND PERFORM OVER THE LAST 10 YEARS?
The Fund’s past performance is not necessarily an indication of how the Fund will perform in the future. The graph and table do not reflect the deduction of taxes that a shareholder would pay on Fund distributions or redemption of Fund shares.
VALUE OF A $10,000 INVESTMENT ($9,625 AFTER MAXIMUM APPLICABLE SALES CHARGE) –
Class A 9/30/2014 — 9/30/2024
AVERAGE ANNUAL TOTAL RETURNS (%) Period Ended September 30, 2024
| | | |
| | 1 Year | 5 Year | 10 Year |
Class A | 18.33 | 7.17 | 5.47 |
Class A (with sales charge) | 13.89 | 6.36 | 5.06 |
Russell 3000 Index | 35.19 | 15.26 | 12.83 |
Bloomberg U.S. Aggregate Index | 11.57 | 0.33 | 1.84 |
S&P 500 Index | 36.35 | 15.97 | 13.38 |
Blended 50% MSCI USA High Dividend Yield Index + 25% Bloomberg High Yield Very Liquid Index + 25% Bloomberg U.S. Aggregate Index | 19.84 | 5.95 | 6.74 |
Fund performance figures may reflect fee waivers and/or expense reimbursements, without which the performance would have been lower.
The Fund began offering Class A shares on 9/10/2018. Returns for periods before 9/10/2018, are based on the Fund’s Class A1 performance, which has been adjusted to take into account differences in class-specific operating expenses and maximum sales charges. For periods after the share class offering, performance for the specific share class is used, reflecting the applicable expenses and maximum sales charges.
Performance for periods prior to March 1, 2019, has been restated to reflect the current maximum sales charge, which is lower than the maximum sales charge prior to that date.
The Fund was able to successfully meet its monthly distributions under its managed distribution policy without the return of capital.
For current month-end performance, please call Franklin Templeton at (800) DIAL BEN/342-5236 or visit https://www.franklintempleton.com/investments/options/mutual-funds.
Important data provider notices and terms available at www.franklintempletondatasources.com.
| Franklin Income Fund | PAGE 2 | 1109-ATSR-1124 |
KEY FUND STATISTICS (as of September 30, 2024)
| |
Total Net Assets | $75,739,183,163 |
Total Number of Portfolio Holdings* | 615 |
Total Management Fee Paid | $265,024,782 |
Portfolio Turnover Rate | 49.72% |
| * | Does not include derivatives, except purchased options, if any. |
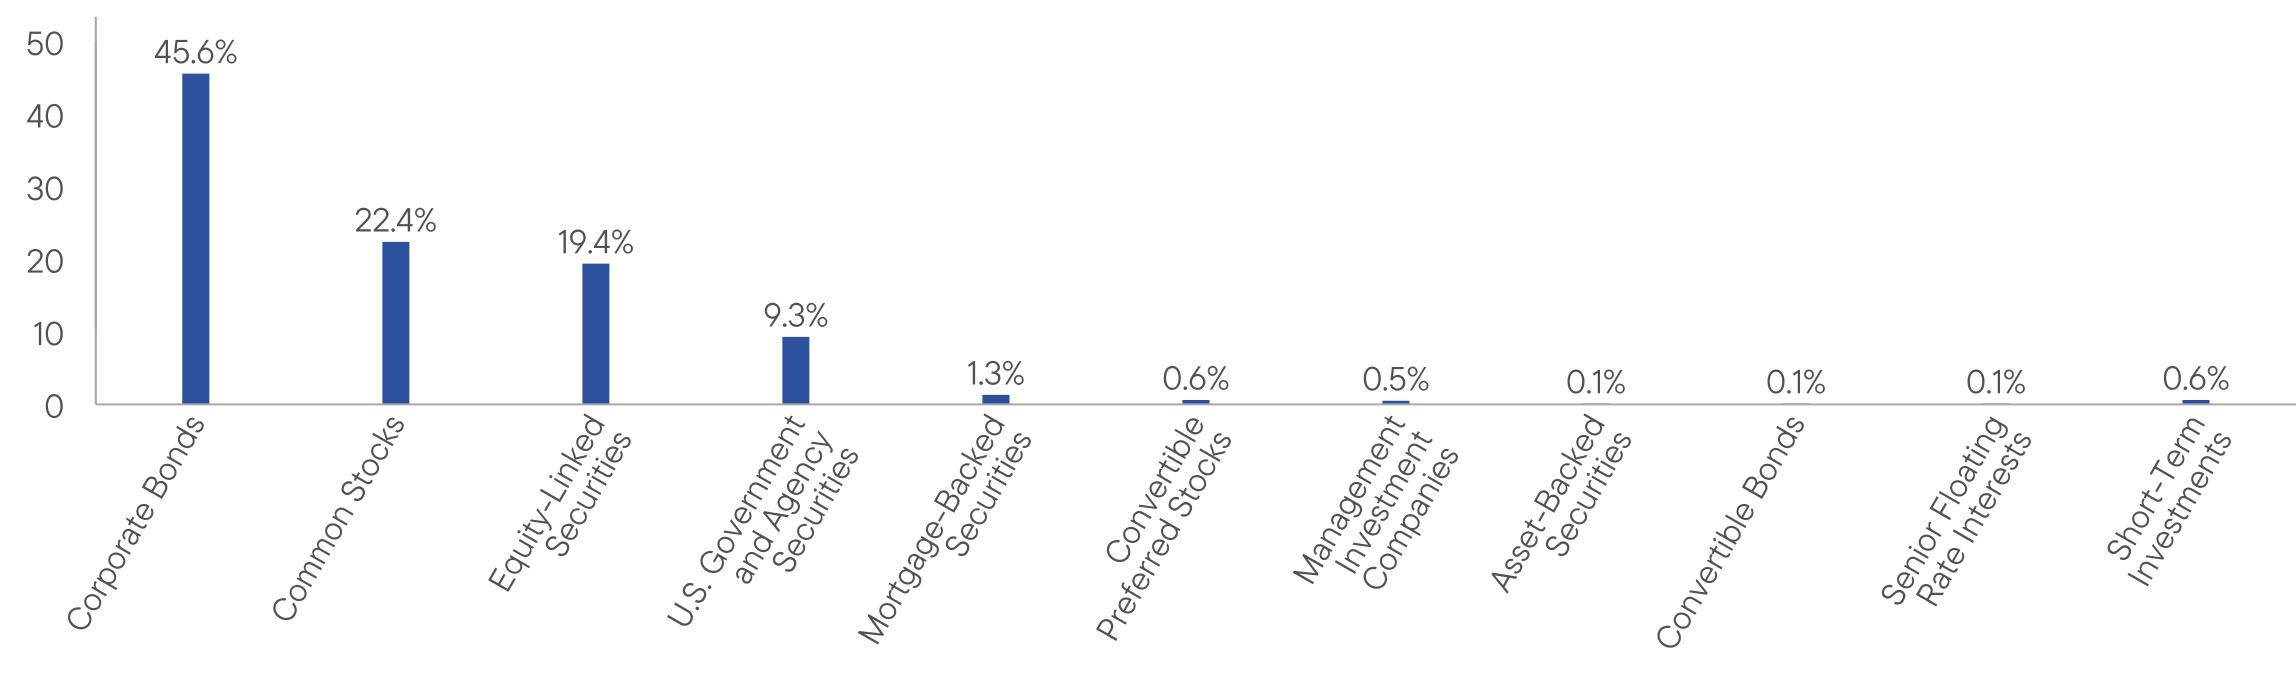
WHAT DID THE FUND INVEST IN? (as of September 30, 2024)
Portfolio Composition* (% of Total Investments)
| * | Does not include derivatives, except purchased options, if any. |
| |
| WHERE CAN I FIND ADDITIONAL INFORMATION ABOUT THE FUND? |
Additional information is available on https://www.franklintempleton.com/regulatory-fund-documents, including its: |
| • prospectus • proxy voting information • financial information • holdings • tax information |
HOUSEHOLDING
You will receive the Fund’s shareholder reports every six months. In addition, you will receive an annual updated summary prospectus (detail prospectus available upon request). To reduce Fund expenses, we try to identify related shareholders in a household and send only one copy of the shareholder reports and summary prospectus. This process, called “householding,” will continue indefinitely unless you instruct us otherwise. If you prefer not to have these documents householded, please call us at (800) DIAL BEN/342-5236. At any time, you may view current prospectuses/summary prospectuses and shareholder reports on our website. If you choose, you may receive these documents through electronic delivery.
| Franklin Income Fund | PAGE 3 | 1109-ATSR-1124 |
9625857397131086511149116401111813847128401390916388100009950114391357915967164331889824921205282472933432100001029310827108351070411806126301251710690107591200310000993911472136071604416727192602504021165257413509810000984511368124601332114379146051647914673160191919945.622.419.49.31.30.60.50.10.10.10.6
| | |
Franklin Income Fund | |
| Class A1 [FKINX] |
| Annual Shareholder Report | September 30, 2024 |
|
This annual shareholder report contains important information about Franklin Income Fund for the period October 1, 2023, to September 30, 2024.
You can find additional information about the Fund at https://www.franklintempleton.com/regulatory-fund-documents. You can also request this information by contacting us at (800) DIAL BEN/342-5236.
WHAT WERE THE FUND COSTS FOR THE LAST YEAR? (based on a hypothetical $10,000 investment)
| | |
Class Name | Costs of a $10,000 investment | Costs paid as a percentage of a $10,000 investment* |
| Class A1 | $65 | 0.60% |
| * | Reflects fee waivers and/or expense reimbursements, without which expenses would have been higher. |
HOW DID THE FUND PERFORM LAST YEAR AND WHAT AFFECTED ITS PERFORMANCE?
For the twelve months ended September 30, 2024, Class A1 shares of Franklin Income Fund returned 17.91%. The Fund compares its performance to the S&P 500 Index and the Blended Benchmark (consisting of 50% MSCI USA High Dividend Yield Index + 25% Bloomberg High Yield Very Liquid Index + 25% Bloomberg U.S. Aggregate Index), which returned 36.35% and 19.84%, respectively, for the same period.
| |
Top contributors to performance: |
| ↑ | U.S. Treasuries (USTs), along with the health care and financials sectors, led absolute fixed income returns during the period. Community Health Systems and Bausch Health were the top contributors within health care. |
| ↑ | Among equities, returns were driven by the financials, utilities, and information technology (IT) sectors. On an individual issuer basis, NextEra Energy, Bank of America, and Lockheed Martin added value. |
| ↑ | Underweight fixed income allocation to securitized products assisted returns, as did selection within the health care sector. Equity returns benefited from an overweight allocation to utilities and an underweight allocation to energy. |
| |
Top detractors from performance: |
| ↓ | Among fixed income allocation, Multiplan, a cost management, payment, and revenue integrity solution provider, weakened returns within the health care sector. |
| ↓ | Equity returns were hindered by performance within the energy sector. By issuer, Intel, Bristol-Myers Squibb, and Chevron were the leading detractors during the period. |
| ↓ | Relative fixed income returns were weakened by an overweight allocation to USTs, as well as selection and overweight positioning within the consumer discretionary sector. Moreover, selection and underweight allocations to the IT and industrials sectors detracted from equity returns. |
Use of derivatives and the impact on performance:
The Fund used U.S. Treasury futures to hedge duration positioning, while equity call and put options were used to sell and reduce positions and/or to initiate and add to positions, which in aggregate contributed modestly to performance.
| Franklin Income Fund | PAGE 1 | 109-ATSR-1124 |
HOW DID THE FUND PERFORM OVER THE LAST 10 YEARS?
The Fund’s past performance is not necessarily an indication of how the Fund will perform in the future. The graph and table do not reflect the deduction of taxes that a shareholder would pay on Fund distributions or redemption of Fund shares.
VALUE OF A $10,000 INVESTMENT ($9,625 AFTER MAXIMUM APPLICABLE SALES CHARGE) –
Class A1 9/30/2014 — 9/30/2024
AVERAGE ANNUAL TOTAL RETURNS (%) Period Ended September 30, 2024
| | | |
| | 1 Year | 5 Year | 10 Year |
Class A1 | 17.91 | 7.29 | 5.54 |
Class A1 (with sales charge) | 13.27 | 6.47 | 5.12 |
Russell 3000 Index | 35.19 | 15.26 | 12.83 |
Bloomberg U.S. Aggregate Index | 11.57 | 0.33 | 1.84 |
S&P 500 Index | 36.35 | 15.97 | 13.38 |
Blended 50% MSCI USA High Dividend Yield Index + 25% Bloomberg High Yield Very Liquid Index + 25% Bloomberg U.S. Aggregate Index | 19.84 | 5.95 | 6.74 |
Fund performance figures may reflect fee waivers and/or expense reimbursements, without which the performance would have been lower.
Effective 9/10/18, Class A shares closed to new investors, were renamed Class A1 shares, and a new Class A share with a different expense structure became available.
Performance for periods prior to March 1, 2019, has been restated to reflect the current maximum sales charge, which is lower than the maximum sales charge prior to that date.
The Fund was able to successfully meet its monthly distributions under its managed distribution policy without the return of capital.
For current month-end performance, please call Franklin Templeton at (800) DIAL BEN/342-5236 or visit https://www.franklintempleton.com/investments/options/mutual-funds.
Important data provider notices and terms available at www.franklintempletondatasources.com.
KEY FUND STATISTICS (as of September 30, 2024)
| |
Total Net Assets | $75,739,183,163 |
Total Number of Portfolio Holdings* | 615 |
Total Management Fee Paid | $265,024,782 |
Portfolio Turnover Rate | 49.72% |
| * | Does not include derivatives, except purchased options, if any. |
| Franklin Income Fund | PAGE 2 | 109-ATSR-1124 |
WHAT DID THE FUND INVEST IN? (as of September 30, 2024)
Portfolio Composition* (% of Total Investments)
| * | Does not include derivatives, except purchased options, if any. |
| |
| WHERE CAN I FIND ADDITIONAL INFORMATION ABOUT THE FUND? |
Additional information is available on https://www.franklintempleton.com/regulatory-fund-documents, including its: |
| • prospectus • proxy voting information • financial information • holdings • tax information |
HOUSEHOLDING
You will receive the Fund’s shareholder reports every six months. In addition, you will receive an annual updated summary prospectus (detail prospectus available upon request). To reduce Fund expenses, we try to identify related shareholders in a household and send only one copy of the shareholder reports and summary prospectus. This process, called “householding,” will continue indefinitely unless you instruct us otherwise. If you prefer not to have these documents householded, please call us at (800) DIAL BEN/342-5236. At any time, you may view current prospectuses/summary prospectuses and shareholder reports on our website. If you choose, you may receive these documents through electronic delivery.
| Franklin Income Fund | PAGE 3 | 109-ATSR-1124 |
9625857397151086711105116051109513889129041399116497100009950114391357915967164331889824921205282472933432100001029310827108351070411806126301251710690107591200310000993911472136071604416727192602504021165257413509810000984511368124601332114379146051647914673160191919945.622.419.49.31.30.60.50.10.10.10.6
| | |
Franklin Income Fund | |
| Class C [FCISX] |
| Annual Shareholder Report | September 30, 2024 |
|
This annual shareholder report contains important information about Franklin Income Fund for the period October 1, 2023, to September 30, 2024.
You can find additional information about the Fund at https://www.franklintempleton.com/regulatory-fund-documents. You can also request this information by contacting us at (800) DIAL BEN/342-5236.
WHAT WERE THE FUND COSTS FOR THE LAST YEAR? (based on a hypothetical $10,000 investment)
| | |
Class Name | Costs of a $10,000 investment | Costs paid as a percentage of a $10,000 investment* |
| Class C | $120 | 1.10% |
| * | Reflects fee waivers and/or expense reimbursements, without which expenses would have been higher. |
HOW DID THE FUND PERFORM LAST YEAR AND WHAT AFFECTED ITS PERFORMANCE?
For the twelve months ended September 30, 2024, Class C shares of Franklin Income Fund returned 17.43%. The Fund compares its performance to the S&P 500 Index and the Blended Benchmark (consisting of 50% MSCI USA High Dividend Yield Index + 25% Bloomberg High Yield Very Liquid Index + 25% Bloomberg U.S. Aggregate Index), which returned 36.35% and 19.84%, respectively, for the same period.
| |
Top contributors to performance: |
| ↑ | U.S. Treasuries (USTs), along with the health care and financials sectors, led absolute fixed income returns during the period. Community Health Systems and Bausch Health were the top contributors within health care. |
| ↑ | Among equities, returns were driven by the financials, utilities, and information technology (IT) sectors. On an individual issuer basis, NextEra Energy, Bank of America, and Lockheed Martin added value. |
| ↑ | Underweight fixed income allocation to securitized products assisted returns, as did selection within the health care sector. Equity returns benefited from an overweight allocation to utilities and an underweight allocation to energy. |
| |
Top detractors from performance: |
| ↓ | Among fixed income allocation, Multiplan, a cost management, payment, and revenue integrity solution provider, weakened returns within the health care sector. |
| ↓ | Equity returns were hindered by performance within the energy sector. By issuer, Intel, Bristol-Myers Squibb, and Chevron were the leading detractors during the period. |
| ↓ | Relative fixed income returns were weakened by an overweight allocation to USTs, as well as selection and overweight positioning within the consumer discretionary sector. Moreover, selection and underweight allocations to the IT and industrials sectors detracted from equity returns. |
Use of derivatives and the impact on performance:
The Fund used U.S. Treasury futures to hedge duration positioning, while equity call and put options were used to sell and reduce positions and/or to initiate and add to positions, which in aggregate contributed modestly to performance.
| Franklin Income Fund | PAGE 1 | 209-ATSR-1124 |
HOW DID THE FUND PERFORM OVER THE LAST 10 YEARS?
The Fund’s past performance is not necessarily an indication of how the Fund will perform in the future. The graph and table do not reflect the deduction of taxes that a shareholder would pay on Fund distributions or redemption of Fund shares.
VALUE OF A $10,000 INVESTMENT – Class C 9/30/2014 — 9/30/2024
AVERAGE ANNUAL TOTAL RETURNS (%) Period Ended September 30, 2024
| | | |
| | 1 Year | 5 Year | 10 Year |
Class C | 17.43 | 6.69 | 5.03 |
Class C (with sales charge) | 16.43 | 6.69 | 5.03 |
Russell 3000 Index | 35.19 | 15.26 | 12.83 |
Bloomberg U.S. Aggregate Index | 11.57 | 0.33 | 1.84 |
S&P 500 Index | 36.35 | 15.97 | 13.38 |
Blended 50% MSCI USA High Dividend Yield Index + 25% Bloomberg High Yield Very Liquid Index + 25% Bloomberg U.S. Aggregate Index | 19.84 | 5.95 | 6.74 |
Fund performance figures may reflect fee waivers and/or expense reimbursements, without which the performance would have been lower.
The Fund was able to successfully meet its monthly distributions under its managed distribution policy without the return of capital.
For current month-end performance, please call Franklin Templeton at (800) DIAL BEN/342-5236 or visit https://www.franklintempleton.com/investments/options/mutual-funds.
Important data provider notices and terms available at www.franklintempletondatasources.com.
KEY FUND STATISTICS (as of September 30, 2024)
| |
Total Net Assets | $75,739,183,163 |
Total Number of Portfolio Holdings* | 615 |
Total Management Fee Paid | $265,024,782 |
Portfolio Turnover Rate | 49.72% |
| * | Does not include derivatives, except purchased options, if any. |
| Franklin Income Fund | PAGE 2 | 209-ATSR-1124 |
WHAT DID THE FUND INVEST IN? (as of September 30, 2024)
Portfolio Composition* (% of Total Investments)
| * | Does not include derivatives, except purchased options, if any. |
| |
| WHERE CAN I FIND ADDITIONAL INFORMATION ABOUT THE FUND? |
Additional information is available on https://www.franklintempleton.com/regulatory-fund-documents, including its: |
| • prospectus • proxy voting information • financial information • holdings • tax information |
HOUSEHOLDING
You will receive the Fund’s shareholder reports every six months. In addition, you will receive an annual updated summary prospectus (detail prospectus available upon request). To reduce Fund expenses, we try to identify related shareholders in a household and send only one copy of the shareholder reports and summary prospectus. This process, called “householding,” will continue indefinitely unless you instruct us otherwise. If you prefer not to have these documents householded, please call us at (800) DIAL BEN/342-5236. At any time, you may view current prospectuses/summary prospectuses and shareholder reports on our website. If you choose, you may receive these documents through electronic delivery.
| Franklin Income Fund | PAGE 3 | 209-ATSR-1124 |
10000891199861114711327118191125113962128591391316338100009950114391357915967164331889824921205282472933432100001029310827108351070411806126301251710690107591200310000993911472136071604416727192602504021165257413509810000984511368124601332114379146051647914673160191919945.622.419.49.31.30.60.50.10.10.10.6
| | |
Franklin Income Fund | |
| Class R [FISRX] |
| Annual Shareholder Report | September 30, 2024 |
|
This annual shareholder report contains important information about Franklin Income Fund for the period October 1, 2023, to September 30, 2024.
You can find additional information about the Fund at https://www.franklintempleton.com/regulatory-fund-documents. You can also request this information by contacting us at (800) DIAL BEN/342-5236.
WHAT WERE THE FUND COSTS FOR THE LAST YEAR? (based on a hypothetical $10,000 investment)
| | |
Class Name | Costs of a $10,000 investment | Costs paid as a percentage of a $10,000 investment* |
| Class R | $103 | 0.95% |
| * | Reflects fee waivers and/or expense reimbursements, without which expenses would have been higher. |
HOW DID THE FUND PERFORM LAST YEAR AND WHAT AFFECTED ITS PERFORMANCE?
For the twelve months ended September 30, 2024, Class R shares of Franklin Income Fund returned 17.41%. The Fund compares its performance to the S&P 500 Index and the Blended Benchmark (consisting of 50% MSCI USA High Dividend Yield Index + 25% Bloomberg High Yield Very Liquid Index + 25% Bloomberg U.S. Aggregate Index), which returned 36.35% and 19.84%, respectively, for the same period.
| |
Top contributors to performance: |
| ↑ | U.S. Treasuries (USTs), along with the health care and financials sectors, led absolute fixed income returns during the period. Community Health Systems and Bausch Health were the top contributors within health care. |
| ↑ | Among equities, returns were driven by the financials, utilities, and information technology (IT) sectors. On an individual issuer basis, NextEra Energy, Bank of America, and Lockheed Martin added value. |
| ↑ | Underweight fixed income allocation to securitized products assisted returns, as did selection within the health care sector. Equity returns benefited from an overweight allocation to utilities and an underweight allocation to energy. |
| |
Top detractors from performance: |
| ↓ | Among fixed income allocation, Multiplan, a cost management, payment, and revenue integrity solution provider, weakened returns within the health care sector. |
| ↓ | Equity returns were hindered by performance within the energy sector. By issuer, Intel, Bristol-Myers Squibb, and Chevron were the leading detractors during the period. |
| ↓ | Relative fixed income returns were weakened by an overweight allocation to USTs, as well as selection and overweight positioning within the consumer discretionary sector. Moreover, selection and underweight allocations to the IT and industrials sectors detracted from equity returns. |
Use of derivatives and the impact on performance:
The Fund used U.S. Treasury futures to hedge duration positioning, while equity call and put options were used to sell and reduce positions and/or to initiate and add to positions, which in aggregate contributed modestly to performance.
| Franklin Income Fund | PAGE 1 | 809-ATSR-1124 |
HOW DID THE FUND PERFORM OVER THE LAST 10 YEARS?
The Fund’s past performance is not necessarily an indication of how the Fund will perform in the future. The graph and table do not reflect the deduction of taxes that a shareholder would pay on Fund distributions or redemption of Fund shares.
VALUE OF A $10,000 INVESTMENT – Class R 9/30/2014 — 9/30/2024
AVERAGE ANNUAL TOTAL RETURNS (%) Period Ended September 30, 2024
| | | |
| | 1 Year | 5 Year | 10 Year |
Class R | 17.41 | 6.87 | 5.17 |
Russell 3000 Index | 35.19 | 15.26 | 12.83 |
Bloomberg U.S. Aggregate Index | 11.57 | 0.33 | 1.84 |
S&P 500 Index | 36.35 | 15.97 | 13.38 |
Blended 50% MSCI USA High Dividend Yield Index + 25% Bloomberg High Yield Very Liquid Index + 25% Bloomberg U.S. Aggregate Index | 19.84 | 5.95 | 6.74 |
Fund performance figures may reflect fee waivers and/or expense reimbursements, without which the performance would have been lower.
The Fund was able to successfully meet its monthly distributions under its managed distribution policy without the return of capital.
For current month-end performance, please call Franklin Templeton at (800) DIAL BEN/342-5236 or visit https://www.franklintempleton.com/investments/options/mutual-funds.
Important data provider notices and terms available at www.franklintempletondatasources.com.
KEY FUND STATISTICS (as of September 30, 2024)
| |
Total Net Assets | $75,739,183,163 |
Total Number of Portfolio Holdings* | 615 |
Total Management Fee Paid | $265,024,782 |
Portfolio Turnover Rate | 49.72% |
| * | Does not include derivatives, except purchased options, if any. |
| Franklin Income Fund | PAGE 2 | 809-ATSR-1124 |
WHAT DID THE FUND INVEST IN? (as of September 30, 2024)
Portfolio Composition* (% of Total Investments)
| * | Does not include derivatives, except purchased options, if any. |
| |
| WHERE CAN I FIND ADDITIONAL INFORMATION ABOUT THE FUND? |
Additional information is available on https://www.franklintempleton.com/regulatory-fund-documents, including its: |
| • prospectus • proxy voting information • financial information • holdings • tax information |
HOUSEHOLDING
You will receive the Fund’s shareholder reports every six months. In addition, you will receive an annual updated summary prospectus (detail prospectus available upon request). To reduce Fund expenses, we try to identify related shareholders in a household and send only one copy of the shareholder reports and summary prospectus. This process, called “householding,” will continue indefinitely unless you instruct us otherwise. If you prefer not to have these documents householded, please call us at (800) DIAL BEN/342-5236. At any time, you may view current prospectuses/summary prospectuses and shareholder reports on our website. If you choose, you may receive these documents through electronic delivery.
| Franklin Income Fund | PAGE 3 | 809-ATSR-1124 |
100008901100241119411402118811130814107130331410416560100009950114391357915967164331889824921205282472933432100001029310827108351070411806126301251710690107591200310000993911472136071604416727192602504021165257413509810000984511368124601332114379146051647914673160191919945.622.419.49.31.30.60.50.10.10.10.6
| | |
Franklin Income Fund | |
| Class R6 [FNCFX] |
| Annual Shareholder Report | September 30, 2024 |
|
This annual shareholder report contains important information about Franklin Income Fund for the period October 1, 2023, to September 30, 2024.
You can find additional information about the Fund at https://www.franklintempleton.com/regulatory-fund-documents. You can also request this information by contacting us at (800) DIAL BEN/342-5236.
WHAT WERE THE FUND COSTS FOR THE LAST YEAR? (based on a hypothetical $10,000 investment)
| | |
Class Name | Costs of a $10,000 investment | Costs paid as a percentage of a $10,000 investment* |
| Class R6 | $44 | 0.40% |
| * | Reflects fee waivers and/or expense reimbursements, without which expenses would have been higher. |
HOW DID THE FUND PERFORM LAST YEAR AND WHAT AFFECTED ITS PERFORMANCE?
For the twelve months ended September 30, 2024, Class R6 shares of Franklin Income Fund returned 18.18%. The Fund compares its performance to the S&P 500 Index and the Blended Benchmark (consisting of 50% MSCI USA High Dividend Yield Index + 25% Bloomberg High Yield Very Liquid Index + 25% Bloomberg U.S. Aggregate Index), which returned 36.35% and 19.84%, respectively, for the same period.
| |
Top contributors to performance: |
| ↑ | U.S. Treasuries (USTs), along with the health care and financials sectors, led absolute fixed income returns during the period. Community Health Systems and Bausch Health were the top contributors within health care. |
| ↑ | Among equities, returns were driven by the financials, utilities, and information technology (IT) sectors. On an individual issuer basis, NextEra Energy, Bank of America, and Lockheed Martin added value. |
| ↑ | Underweight fixed income allocation to securitized products assisted returns, as did selection within the health care sector. Equity returns benefited from an overweight allocation to utilities and an underweight allocation to energy. |
| |
Top detractors from performance: |
| ↓ | Among fixed income allocation, Multiplan, a cost management, payment, and revenue integrity solution provider, weakened returns within the health care sector. |
| ↓ | Equity returns were hindered by performance within the energy sector. By issuer, Intel, Bristol-Myers Squibb, and Chevron were the leading detractors during the period. |
| ↓ | Relative fixed income returns were weakened by an overweight allocation to USTs, as well as selection and overweight positioning within the consumer discretionary sector. Moreover, selection and underweight allocations to the IT and industrials sectors detracted from equity returns. |
Use of derivatives and the impact on performance:
The Fund used U.S. Treasury futures to hedge duration positioning, while equity call and put options were used to sell and reduce positions and/or to initiate and add to positions, which in aggregate contributed modestly to performance.
| Franklin Income Fund | PAGE 1 | 390-ATSR-1124 |
HOW DID THE FUND PERFORM OVER THE LAST 10 YEARS?
The Fund’s past performance is not necessarily an indication of how the Fund will perform in the future. The graph and table do not reflect the deduction of taxes that a shareholder would pay on Fund distributions or redemption of Fund shares.
VALUE OF A $10,000 INVESTMENT – Class R6 9/30/2014 — 9/30/2024
AVERAGE ANNUAL TOTAL RETURNS (%) Period Ended September 30, 2024
| | | |
| | 1 Year | 5 Year | 10 Year |
Class R6 | 18.18 | 7.51 | 5.81 |
Russell 3000 Index | 35.19 | 15.26 | 12.83 |
Bloomberg U.S. Aggregate Index | 11.57 | 0.33 | 1.84 |
S&P 500 Index | 36.35 | 15.97 | 13.38 |
Blended 50% MSCI USA High Dividend Yield Index + 25% Bloomberg High Yield Very Liquid Index + 25% Bloomberg U.S. Aggregate Index | 19.84 | 5.95 | 6.74 |
Fund performance figures may reflect fee waivers and/or expense reimbursements, without which the performance would have been lower.
The Fund was able to successfully meet its monthly distributions under its managed distribution policy without the return of capital.
For current month-end performance, please call Franklin Templeton at (800) DIAL BEN/342-5236 or visit https://www.franklintempleton.com/investments/options/mutual-funds.
Important data provider notices and terms available at www.franklintempletondatasources.com.
KEY FUND STATISTICS (as of September 30, 2024)
| |
Total Net Assets | $75,739,183,163 |
Total Number of Portfolio Holdings* | 615 |
Total Management Fee Paid | $265,024,782 |
Portfolio Turnover Rate | 49.72% |
| * | Does not include derivatives, except purchased options, if any. |
| Franklin Income Fund | PAGE 2 | 390-ATSR-1124 |
WHAT DID THE FUND INVEST IN? (as of September 30, 2024)
Portfolio Composition* (% of Total Investments)
| * | Does not include derivatives, except purchased options, if any. |
| |
| WHERE CAN I FIND ADDITIONAL INFORMATION ABOUT THE FUND? |
Additional information is available on https://www.franklintempleton.com/regulatory-fund-documents, including its: |
| • prospectus • proxy voting information • financial information • holdings • tax information |
HOUSEHOLDING
You will receive the Fund’s shareholder reports every six months. In addition, you will receive an annual updated summary prospectus (detail prospectus available upon request). To reduce Fund expenses, we try to identify related shareholders in a household and send only one copy of the shareholder reports and summary prospectus. This process, called “householding,” will continue indefinitely unless you instruct us otherwise. If you prefer not to have these documents householded, please call us at (800) DIAL BEN/342-5236. At any time, you may view current prospectuses/summary prospectuses and shareholder reports on our website. If you choose, you may receive these documents through electronic delivery.
| Franklin Income Fund | PAGE 3 | 390-ATSR-1124 |
100008961101391137111643122451172714720136341488516475100009950114391357915967164331889824921205282472933432100001029310827108351070411806126301251710690107591200310000993911472136071604416727192602504021165257413509810000984511368124601332114379146051647914673160191919945.622.419.49.31.30.60.50.10.10.10.6
| | |
Franklin Income Fund | |
| Advisor Class [FRIAX] |
| Annual Shareholder Report | September 30, 2024 |
|
This annual shareholder report contains important information about Franklin Income Fund for the period October 1, 2023, to September 30, 2024.
You can find additional information about the Fund at https://www.franklintempleton.com/regulatory-fund-documents. You can also request this information by contacting us at (800) DIAL BEN/342-5236.
WHAT WERE THE FUND COSTS FOR THE LAST YEAR? (based on a hypothetical $10,000 investment)
| | |
Class Name | Costs of a $10,000 investment | Costs paid as a percentage of a $10,000 investment* |
| Advisor Class | $49 | 0.45% |
| * | Reflects fee waivers and/or expense reimbursements, without which expenses would have been higher. |
HOW DID THE FUND PERFORM LAST YEAR AND WHAT AFFECTED ITS PERFORMANCE?
For the twelve months ended September 30, 2024, Advisor Class shares of Franklin Income Fund returned 18.20%. The Fund compares its performance to the S&P 500 Index and the Blended Benchmark (consisting of 50% MSCI USA High Dividend Yield Index + 25% Bloomberg High Yield Very Liquid Index + 25% Bloomberg U.S. Aggregate Index), which returned 36.35% and 19.84%, respectively, for the same period.
| |
Top contributors to performance: |
| ↑ | U.S. Treasuries (USTs), along with the health care and financials sectors, led absolute fixed income returns during the period. Community Health Systems and Bausch Health were the top contributors within health care. |
| ↑ | Among equities, returns were driven by the financials, utilities, and information technology (IT) sectors. On an individual issuer basis, NextEra Energy, Bank of America, and Lockheed Martin added value. |
| ↑ | Underweight fixed income allocation to securitized products assisted returns, as did selection within the health care sector. Equity returns benefited from an overweight allocation to utilities and an underweight allocation to energy. |
| |
Top detractors from performance: |
| ↓ | Among fixed income allocation, Multiplan, a cost management, payment, and revenue integrity solution provider, weakened returns within the health care sector. |
| ↓ | Equity returns were hindered by performance within the energy sector. By issuer, Intel, Bristol-Myers Squibb, and Chevron were the leading detractors during the period. |
| ↓ | Relative fixed income returns were weakened by an overweight allocation to USTs, as well as selection and overweight positioning within the consumer discretionary sector. Moreover, selection and underweight allocations to the IT and industrials sectors detracted from equity returns. |
Use of derivatives and the impact on performance:
The Fund used U.S. Treasury futures to hedge duration positioning, while equity call and put options were used to sell and reduce positions and/or to initiate and add to positions, which in aggregate contributed modestly to performance.
| Franklin Income Fund | PAGE 1 | 609-ATSR-1124 |
HOW DID THE FUND PERFORM OVER THE LAST 10 YEARS?
The Fund’s past performance is not necessarily an indication of how the Fund will perform in the future. The graph and table do not reflect the deduction of taxes that a shareholder would pay on Fund distributions or redemption of Fund shares.
VALUE OF A $10,000 INVESTMENT – Advisor Class 9/30/2014 — 9/30/2024
AVERAGE ANNUAL TOTAL RETURNS (%) Period Ended September 30, 2024
| | | |
| | 1 Year | 5 Year | 10 Year |
Advisor Class | 18.20 | 7.49 | 5.72 |
Russell 3000 Index | 35.19 | 15.26 | 12.83 |
Bloomberg U.S. Aggregate Index | 11.57 | 0.33 | 1.84 |
S&P 500 Index | 36.35 | 15.97 | 13.38 |
Blended 50% MSCI USA High Dividend Yield Index + 25% Bloomberg High Yield Very Liquid Index + 25% Bloomberg U.S. Aggregate Index | 19.84 | 5.95 | 6.74 |
Fund performance figures may reflect fee waivers and/or expense reimbursements, without which the performance would have been lower.
The Fund was able to successfully meet its monthly distributions under its managed distribution policy without the return of capital.
For current month-end performance, please call Franklin Templeton at (800) DIAL BEN/342-5236 or visit https://www.franklintempleton.com/investments/options/mutual-funds.
Important data provider notices and terms available at www.franklintempletondatasources.com.
KEY FUND STATISTICS (as of September 30, 2024)
| |
Total Net Assets | $75,739,183,163 |
Total Number of Portfolio Holdings* | 615 |
Total Management Fee Paid | $265,024,782 |
Portfolio Turnover Rate | 49.72% |
| * | Does not include derivatives, except purchased options, if any. |
| Franklin Income Fund | PAGE 2 | 609-ATSR-1124 |
WHAT DID THE FUND INVEST IN? (as of September 30, 2024)
Portfolio Composition* (% of Total Investments)
| * | Does not include derivatives, except purchased options, if any. |
| |
| WHERE CAN I FIND ADDITIONAL INFORMATION ABOUT THE FUND? |
Additional information is available on https://www.franklintempleton.com/regulatory-fund-documents, including its: |
| • prospectus • proxy voting information • financial information • holdings • tax information |
HOUSEHOLDING
You will receive the Fund’s shareholder reports every six months. In addition, you will receive an annual updated summary prospectus (detail prospectus available upon request). To reduce Fund expenses, we try to identify related shareholders in a household and send only one copy of the shareholder reports and summary prospectus. This process, called “householding,” will continue indefinitely unless you instruct us otherwise. If you prefer not to have these documents householded, please call us at (800) DIAL BEN/342-5236. At any time, you may view current prospectuses/summary prospectuses and shareholder reports on our website. If you choose, you may receive these documents through electronic delivery.
| Franklin Income Fund | PAGE 3 | 609-ATSR-1124 |
100008954101241134711613121541168514603135161475417440100009950114391357915967164331889824921205282472933432100001029310827108351070411806126301251710690107591200310000993911472136071604416727192602504021165257413509810000984511368124601332114379146051647914673160191919945.622.419.49.31.30.60.50.10.10.10.6
| | |
Franklin U.S. Government Securities Fund | |
| Class A [FKFSX] |
| Annual Shareholder Report | September 30, 2024 |
|
This annual shareholder report contains important information about Franklin U.S. Government Securities Fund for the period October 1, 2023, to September 30, 2024.
You can find additional information about the Fund at https://www.franklintempleton.com/regulatory-fund-documents. You can also request this information by contacting us at (800) DIAL BEN/342-5236.
This report describes changes to the Fund that occurred during the reporting period.
WHAT WERE THE FUND COSTS FOR THE LAST YEAR? (based on a hypothetical $10,000 investment)
| | |
Class Name | Costs of a $10,000 investment | Costs paid as a percentage of a $10,000 investment* |
| Class A | $88 | 0.84% |
| * | Reflects fee waivers and/or expense reimbursements, without which expenses would have been higher. |
HOW DID THE FUND PERFORM LAST YEAR AND WHAT AFFECTED ITS PERFORMANCE?
For the twelve months ended September 30, 2024, Class A shares of Franklin U.S. Government Securities Fund returned 10.25%. The Fund compares its performance to the Bloomberg U.S. Government - Intermediate Index, which returned 8.33% for the same period.
| |
Top contributors to performance: |
| ↑ | Overweight allocation to Ginnie Mae (GN) II 2.5% and 3.5% coupons, evenweight in 4.0% coupons and a shift in allocation from an overweight to underweight in 3.0% coupons. |
| ↑ | Overweight allocation to GN I 4.0% through 5.5% coupon securities (especially the 4.5% and 5.0% coupons). |
| ↑ | Security selection in GN I 5.0% and GN II 2.5% and 3.5% coupons. |
| |
Top detractors from performance: |
| ↓ | Underweight allocation to GN II 2.0%, and 4.5% through 7.0% coupons (especially the 2.0% coupons). |
| ↓ | Security selection in GN I 4.0 and 4.5% coupons. Selection in GN II 3.0%, and 4.0% through 5.0% coupons. |
| ↓ | Allocation to GN I 3.0% coupons. |
| Franklin U.S. Government Securities Fund | PAGE 1 | 1110-ATSR-1124 |
HOW DID THE FUND PERFORM OVER THE LAST 10 YEARS?
The Fund’s past performance is not necessarily an indication of how the Fund will perform in the future. The graph and table do not reflect the deduction of taxes that a shareholder would pay on Fund distributions or redemption of Fund shares.
VALUE OF A $10,000 INVESTMENT ($9,625 AFTER MAXIMUM APPLICABLE SALES CHARGE) –
Class A 9/30/2014 — 9/30/2024
AVERAGE ANNUAL TOTAL RETURNS (%) Period Ended September 30, 2024
| | | |
| | 1 Year | 5 Year | 10 Year |
Class A | 10.25 | -0.46 | 0.67 |
Class A (with sales charge) | 6.11 | -1.21 | 0.28 |
Bloomberg U.S. Aggregate Index | 11.57 | 0.33 | 1.84 |
Bloomberg U.S. Government - Intermediate Index | 8.33 | 0.83 | 1.50 |
Fund performance figures may reflect fee waivers and/or expense reimbursements, without which the performance would have been lower.
The Fund began offering Class A shares on 9/10/2018. Returns for periods before 9/10/2018, are based on the Fund’s Class A1 performance, which has been adjusted to take into account differences in class-specific operating expenses and maximum sales charges. For periods after the share class offering, performance for the specific share class is used, reflecting the applicable expenses and maximum sales charges.
Performance for periods prior to March 1, 2019, has been restated to reflect the current maximum sales charge, which is lower than the maximum sales charge prior to that date.
For current month-end performance, please call Franklin Templeton at (800) DIAL BEN/342-5236 or visit https://www.franklintempleton.com/investments/options/mutual-funds.
Important data provider notices and terms available at www.franklintempletondatasources.com.
KEY FUND STATISTICS (as of September 30, 2024)
| |
Total Net Assets | $2,384,479,516 |
Total Number of Portfolio Holdings* | 672 |
Total Management Fee Paid | $11,072,696 |
Portfolio Turnover Rate | 30.97% |
| * | Does not include derivatives, except purchased options, if any. |
| Franklin U.S. Government Securities Fund | PAGE 2 | 1110-ATSR-1124 |
WHAT DID THE FUND INVEST IN? (as of September 30, 2024)
Portfolio Composition* (% of Total Investments)
| * | Does not include derivatives, except purchased options, if any. |
HOW HAS THE FUND CHANGED?
Effective September 30, 2024, Jatin Misra and Michael V. Salm replaced Paul Varunok and Neil Dhruv as portfolio managers of the Fund.
This is a summary of a change to the Fund since October 1, 2023. For more complete information, you may review the Fund’s current prospectus, any applicable supplements, and the Fund’s next prospectus, which we expect to be available by February 1, 2025 at
https://www.franklintempleton.com/regulatory-fund-documents or upon request at (800) DIAL BEN/342-5236 or
prospectus@franklintempleton.com.
| |
| WHERE CAN I FIND ADDITIONAL INFORMATION ABOUT THE FUND? |
Additional information is available on https://www.franklintempleton.com/regulatory-fund-documents, including its: |
| • prospectus • proxy voting information • financial information • holdings • tax information |
HOUSEHOLDING
You will receive the Fund’s shareholder reports every six months. In addition, you will receive an annual updated summary prospectus (detail prospectus available upon request). To reduce Fund expenses, we try to identify related shareholders in a household and send only one copy of the shareholder reports and summary prospectus. This process, called “householding,” will continue indefinitely unless you instruct us otherwise. If you prefer not to have these documents householded, please call us at (800) DIAL BEN/342-5236. At any time, you may view current prospectuses/summary prospectuses and shareholder reports on our website. If you choose, you may receive these documents through electronic delivery.
| Franklin U.S. Government Securities Fund | PAGE 3 | 1110-ATSR-1124 |
962598241005410008982310481107961067293389292102891000010293108271083510704118061263012517106901075912003100001030010551104811035811136118021164510576107171160995.03.51.5
| | |
Franklin U.S. Government Securities Fund | |
| Class A1 [FKUSX] |
| Annual Shareholder Report | September 30, 2024 |
|
This annual shareholder report contains important information about Franklin U.S. Government Securities Fund for the period October 1, 2023, to September 30, 2024.
You can find additional information about the Fund at https://www.franklintempleton.com/regulatory-fund-documents. You can also request this information by contacting us at (800) DIAL BEN/342-5236.
This report describes changes to the Fund that occurred during the reporting period.
WHAT WERE THE FUND COSTS FOR THE LAST YEAR? (based on a hypothetical $10,000 investment)
| | |
Class Name | Costs of a $10,000 investment | Costs paid as a percentage of a $10,000 investment* |
| Class A1 | $78 | 0.74% |
| * | Reflects fee waivers and/or expense reimbursements, without which expenses would have been higher. |
HOW DID THE FUND PERFORM LAST YEAR AND WHAT AFFECTED ITS PERFORMANCE?
For the twelve months ended September 30, 2024, Class A1 shares of Franklin U.S. Government Securities Fund returned 10.58%. The Fund compares its performance to the Bloomberg U.S. Government - Intermediate Index, which returned 8.33% for the same period.
| |
Top contributors to performance: |
| ↑ | Overweight allocation to Ginnie Mae (GN) II 2.5% and 3.5% coupons, evenweight in 4.0% coupons and a shift in allocation from an overweight to underweight in 3.0% coupons. |
| ↑ | Overweight allocation to GN I 4.0% through 5.5% coupon securities (especially the 4.5% and 5.0% coupons). |
| ↑ | Security selection in GN I 5.0% and GN II 2.5% and 3.5% coupons. |
| |
Top detractors from performance: |
| ↓ | Underweight allocation to GN II 2.0%, and 4.5% through 7.0% coupons (especially the 2.0% coupons). |
| ↓ | Security selection in GN I 4.0 and 4.5% coupons. Selection in GN II 3.0%, and 4.0% through 5.0% coupons. |
| ↓ | Allocation to GN I 3.0% coupons. |
| Franklin U.S. Government Securities Fund | PAGE 1 | 110-ATSR-1124 |
HOW DID THE FUND PERFORM OVER THE LAST 10 YEARS?
The Fund’s past performance is not necessarily an indication of how the Fund will perform in the future. The graph and table do not reflect the deduction of taxes that a shareholder would pay on Fund distributions or redemption of Fund shares.
VALUE OF A $10,000 INVESTMENT ($9,625 AFTER MAXIMUM APPLICABLE SALES CHARGE) –
Class A1 9/30/2014 — 9/30/2024
AVERAGE ANNUAL TOTAL RETURNS (%) Period Ended September 30, 2024
| | | |
| | 1 Year | 5 Year | 10 Year |
Class A1 | 10.58 | -0.32 | 0.75 |
Class A1 (with sales charge) | 6.42 | -1.09 | 0.36 |
Bloomberg U.S. Aggregate Index | 11.57 | 0.33 | 1.84 |
Bloomberg U.S. Government - Intermediate Index | 8.33 | 0.83 | 1.50 |
Fund performance figures may reflect fee waivers and/or expense reimbursements, without which the performance would have been lower.
Effective 9/10/18, Class A shares closed to new investors, were renamed Class A1 shares, and a new Class A share with a different expense structure became available.
Performance for periods prior to March 1, 2019, has been restated to reflect the current maximum sales charge, which is lower than the maximum sales charge prior to that date.
For current month-end performance, please call Franklin Templeton at (800) DIAL BEN/342-5236 or visit https://www.franklintempleton.com/investments/options/mutual-funds.
Important data provider notices and terms available at www.franklintempletondatasources.com.
KEY FUND STATISTICS (as of September 30, 2024)
| |
Total Net Assets | $2,384,479,516 |
Total Number of Portfolio Holdings* | 672 |
Total Management Fee Paid | $11,072,696 |
Portfolio Turnover Rate | 30.97% |
| * | Does not include derivatives, except purchased options, if any. |
| Franklin U.S. Government Securities Fund | PAGE 2 | 110-ATSR-1124 |
WHAT DID THE FUND INVEST IN? (as of September 30, 2024)
Portfolio Composition* (% of Total Investments)
| * | Does not include derivatives, except purchased options, if any. |
HOW HAS THE FUND CHANGED?
Effective September 30, 2024, Jatin Misra and Michael V. Salm replaced Paul Varunok and Neil Dhruv as portfolio managers of the Fund.
This is a summary of a change to the Fund since October 1, 2023. For more complete information, you may review the Fund’s current prospectus, any applicable supplements, and the Fund’s next prospectus, which we expect to be available by February 1, 2025 at
https://www.franklintempleton.com/regulatory-fund-documents or upon request at (800) DIAL BEN/342-5236 or
prospectus@franklintempleton.com.
| |
| WHERE CAN I FIND ADDITIONAL INFORMATION ABOUT THE FUND? |
Additional information is available on https://www.franklintempleton.com/regulatory-fund-documents, including its: |
| • prospectus • proxy voting information • financial information • holdings • tax information |
HOUSEHOLDING
You will receive the Fund’s shareholder reports every six months. In addition, you will receive an annual updated summary prospectus (detail prospectus available upon request). To reduce Fund expenses, we try to identify related shareholders in a household and send only one copy of the shareholder reports and summary prospectus. This process, called “householding,” will continue indefinitely unless you instruct us otherwise. If you prefer not to have these documents householded, please call us at (800) DIAL BEN/342-5236. At any time, you may view current prospectuses/summary prospectuses and shareholder reports on our website. If you choose, you may receive these documents through electronic delivery.
| Franklin U.S. Government Securities Fund | PAGE 3 | 110-ATSR-1124 |
962598241005510009985010533108591076394129376103711000010293108271083510704118061263012517106901075912003100001030010551104811035811136118021164510576107171160995.03.51.5
| | |
Franklin U.S. Government Securities Fund | |
| Class C [FRUGX] |
| Annual Shareholder Report | September 30, 2024 |
|
This annual shareholder report contains important information about Franklin U.S. Government Securities Fund for the period October 1, 2023, to September 30, 2024.
You can find additional information about the Fund at https://www.franklintempleton.com/regulatory-fund-documents. You can also request this information by contacting us at (800) DIAL BEN/342-5236.
This report describes changes to the Fund that occurred during the reporting period.
WHAT WERE THE FUND COSTS FOR THE LAST YEAR? (based on a hypothetical $10,000 investment)
| | |
Class Name | Costs of a $10,000 investment | Costs paid as a percentage of a $10,000 investment* |
| Class C | $130 | 1.24% |
| * | Reflects fee waivers and/or expense reimbursements, without which expenses would have been higher. |
HOW DID THE FUND PERFORM LAST YEAR AND WHAT AFFECTED ITS PERFORMANCE?
For the twelve months ended September 30, 2024, Class C shares of Franklin U.S. Government Securities Fund returned 9.88%. The Fund compares its performance to the Bloomberg U.S. Government - Intermediate Index, which returned 8.33% for the same period.
| |
Top contributors to performance: |
| ↑ | Overweight allocation to Ginnie Mae (GN) II 2.5% and 3.5% coupons, evenweight in 4.0% coupons and a shift in allocation from an overweight to underweight in 3.0% coupons. |
| ↑ | Overweight allocation to GN I 4.0% through 5.5% coupon securities (especially the 4.5% and 5.0% coupons). |
| ↑ | Security selection in GN I 5.0% and GN II 2.5% and 3.5% coupons. |
| |
Top detractors from performance: |
| ↓ | Underweight allocation to GN II 2.0%, and 4.5% through 7.0% coupons (especially the 2.0% coupons). |
| ↓ | Security selection in GN I 4.0 and 4.5% coupons. Selection in GN II 3.0%, and 4.0% through 5.0% coupons. |
| ↓ | Allocation to GN I 3.0% coupons. |
| Franklin U.S. Government Securities Fund | PAGE 1 | 210-ATSR-1124 |
HOW DID THE FUND PERFORM OVER THE LAST 10 YEARS?
The Fund’s past performance is not necessarily an indication of how the Fund will perform in the future. The graph and table do not reflect the deduction of taxes that a shareholder would pay on Fund distributions or redemption of Fund shares.
VALUE OF A $10,000 INVESTMENT – Class C 9/30/2014 — 9/30/2024
AVERAGE ANNUAL TOTAL RETURNS (%) Period Ended September 30, 2024
| | | |
| | 1 Year | 5 Year | 10 Year |
Class C | 9.88 | -0.87 | 0.22 |
Class C (with sales charge) | 8.88 | -0.87 | 0.22 |
Bloomberg U.S. Aggregate Index | 11.57 | 0.33 | 1.84 |
Bloomberg U.S. Government - Intermediate Index | 8.33 | 0.83 | 1.50 |
Fund performance figures may reflect fee waivers and/or expense reimbursements, without which the performance would have been lower.
For current month-end performance, please call Franklin Templeton at (800) DIAL BEN/342-5236 or visit https://www.franklintempleton.com/investments/options/mutual-funds.
Important data provider notices and terms available at www.franklintempletondatasources.com.
KEY FUND STATISTICS (as of September 30, 2024)
| |
Total Net Assets | $2,384,479,516 |
Total Number of Portfolio Holdings* | 672 |
Total Management Fee Paid | $11,072,696 |
Portfolio Turnover Rate | 30.97% |
| * | Does not include derivatives, except purchased options, if any. |
| Franklin U.S. Government Securities Fund | PAGE 2 | 210-ATSR-1124 |
WHAT DID THE FUND INVEST IN? (as of September 30, 2024)
Portfolio Composition* (% of Total Investments)
| * | Does not include derivatives, except purchased options, if any. |
HOW HAS THE FUND CHANGED?
Effective September 30, 2024, Jatin Misra and Michael V. Salm replaced Paul Varunok and Neil Dhruv as portfolio managers of the Fund.
This is a summary of a change to the Fund since October 1, 2023. For more complete information, you may review the Fund’s current prospectus, any applicable supplements, and the Fund’s next prospectus, which we expect to be available by February 1, 2025 at
https://www.franklintempleton.com/regulatory-fund-documents or upon request at (800) DIAL BEN/342-5236 or
prospectus@franklintempleton.com.
| |
| WHERE CAN I FIND ADDITIONAL INFORMATION ABOUT THE FUND? |
Additional information is available on https://www.franklintempleton.com/regulatory-fund-documents, including its: |
| • prospectus • proxy voting information • financial information • holdings • tax information |
HOUSEHOLDING
You will receive the Fund’s shareholder reports every six months. In addition, you will receive an annual updated summary prospectus (detail prospectus available upon request). To reduce Fund expenses, we try to identify related shareholders in a household and send only one copy of the shareholder reports and summary prospectus. This process, called “householding,” will continue indefinitely unless you instruct us otherwise. If you prefer not to have these documents householded, please call us at (800) DIAL BEN/342-5236. At any time, you may view current prospectuses/summary prospectuses and shareholder reports on our website. If you choose, you may receive these documents through electronic delivery.
| Franklin U.S. Government Securities Fund | PAGE 3 | 210-ATSR-1124 |
100001015710329102301003110678109371078394069301102201000010293108271083510704118061263012517106901075912003100001030010551104811035811136118021164510576107171160995.03.51.5
| | |
Franklin U.S. Government Securities Fund | |
| Class R [FUSRX] |
| Annual Shareholder Report | September 30, 2024 |
|
This annual shareholder report contains important information about Franklin U.S. Government Securities Fund for the period October 1, 2023, to September 30, 2024.
You can find additional information about the Fund at https://www.franklintempleton.com/regulatory-fund-documents. You can also request this information by contacting us at (800) DIAL BEN/342-5236.
This report describes changes to the Fund that occurred during the reporting period.
WHAT WERE THE FUND COSTS FOR THE LAST YEAR? (based on a hypothetical $10,000 investment)
| | |
Class Name | Costs of a $10,000 investment | Costs paid as a percentage of a $10,000 investment* |
| Class R | $114 | 1.09% |
| * | Reflects fee waivers and/or expense reimbursements, without which expenses would have been higher. |
HOW DID THE FUND PERFORM LAST YEAR AND WHAT AFFECTED ITS PERFORMANCE?
For the twelve months ended September 30, 2024, Class R shares of Franklin U.S. Government Securities Fund returned 9.97%. The Fund compares its performance to the Bloomberg U.S. Government - Intermediate Index, which returned 8.33% for the same period.
| |
Top contributors to performance: |
| ↑ | Overweight allocation to Ginnie Mae (GN) II 2.5% and 3.5% coupons, evenweight in 4.0% coupons and a shift in allocation from an overweight to underweight in 3.0% coupons. |
| ↑ | Overweight allocation to GN I 4.0% through 5.5% coupon securities (especially the 4.5% and 5.0% coupons). |
| ↑ | Security selection in GN I 5.0% and GN II 2.5% and 3.5% coupons. |
| |
Top detractors from performance: |
| ↓ | Underweight allocation to GN II 2.0%, and 4.5% through 7.0% coupons (especially the 2.0% coupons). |
| ↓ | Security selection in GN I 4.0 and 4.5% coupons. Selection in GN II 3.0%, and 4.0% through 5.0% coupons. |
| ↓ | Allocation to GN I 3.0% coupons. |
| Franklin U.S. Government Securities Fund | PAGE 1 | 810-ATSR-1124 |
HOW DID THE FUND PERFORM OVER THE LAST 10 YEARS?
The Fund’s past performance is not necessarily an indication of how the Fund will perform in the future. The graph and table do not reflect the deduction of taxes that a shareholder would pay on Fund distributions or redemption of Fund shares.
VALUE OF A $10,000 INVESTMENT – Class R 9/30/2014 — 9/30/2024
AVERAGE ANNUAL TOTAL RETURNS (%) Period Ended September 30, 2024
| | | |
| | 1 Year | 5 Year | 10 Year |
Class R | 9.97 | -0.71 | 0.37 |
Bloomberg U.S. Aggregate Index | 11.57 | 0.33 | 1.84 |
Bloomberg U.S. Government - Intermediate Index | 8.33 | 0.83 | 1.50 |
Fund performance figures may reflect fee waivers and/or expense reimbursements, without which the performance would have been lower.
For current month-end performance, please call Franklin Templeton at (800) DIAL BEN/342-5236 or visit https://www.franklintempleton.com/investments/options/mutual-funds.
Important data provider notices and terms available at www.franklintempletondatasources.com.
KEY FUND STATISTICS (as of September 30, 2024)
| |
Total Net Assets | $2,384,479,516 |
Total Number of Portfolio Holdings* | 672 |
Total Management Fee Paid | $11,072,696 |
Portfolio Turnover Rate | 30.97% |
| * | Does not include derivatives, except purchased options, if any. |
WHAT DID THE FUND INVEST IN? (as of September 30, 2024)
Portfolio Composition* (% of Total Investments)
| * | Does not include derivatives, except purchased options, if any. |
| Franklin U.S. Government Securities Fund | PAGE 2 | 810-ATSR-1124 |
HOW HAS THE FUND CHANGED?
Effective September 30, 2024, Jatin Misra and Michael V. Salm replaced Paul Varunok and Neil Dhruv as portfolio managers of the Fund.
This is a summary of a change to the Fund since October 1, 2023. For more complete information, you may review the Fund’s current prospectus, any applicable supplements, and the Fund’s next prospectus, which we expect to be available by February 1, 2025 at
https://www.franklintempleton.com/regulatory-fund-documents or upon request at (800) DIAL BEN/342-5236 or
prospectus@franklintempleton.com.
| |
| WHERE CAN I FIND ADDITIONAL INFORMATION ABOUT THE FUND? |
Additional information is available on https://www.franklintempleton.com/regulatory-fund-documents, including its: |
| • prospectus • proxy voting information • financial information • holdings • tax information |
HOUSEHOLDING
You will receive the Fund’s shareholder reports every six months. In addition, you will receive an annual updated summary prospectus (detail prospectus available upon request). To reduce Fund expenses, we try to identify related shareholders in a household and send only one copy of the shareholder reports and summary prospectus. This process, called “householding,” will continue indefinitely unless you instruct us otherwise. If you prefer not to have these documents householded, please call us at (800) DIAL BEN/342-5236. At any time, you may view current prospectuses/summary prospectuses and shareholder reports on our website. If you choose, you may receive these documents through electronic delivery.
| Franklin U.S. Government Securities Fund | PAGE 3 | 810-ATSR-1124 |
100001017110358102741009110754110471089295069436103771000010293108271083510704118061263012517106901075912003100001030010551104811035811136118021164510576107171160995.03.51.5
| | |
Franklin U.S. Government Securities Fund | |
| Class R6 [FGORX] |
| Annual Shareholder Report | September 30, 2024 |
|
This annual shareholder report contains important information about Franklin U.S. Government Securities Fund for the period October 1, 2023, to September 30, 2024.
You can find additional information about the Fund at https://www.franklintempleton.com/regulatory-fund-documents. You can also request this information by contacting us at (800) DIAL BEN/342-5236.
This report describes changes to the Fund that occurred during the reporting period.
WHAT WERE THE FUND COSTS FOR THE LAST YEAR? (based on a hypothetical $10,000 investment)
| | |
Class Name | Costs of a $10,000 investment | Costs paid as a percentage of a $10,000 investment* |
| Class R6 | $53 | 0.50% |
| * | Reflects fee waivers and/or expense reimbursements, without which expenses would have been higher. |
HOW DID THE FUND PERFORM LAST YEAR AND WHAT AFFECTED ITS PERFORMANCE?
For the twelve months ended September 30, 2024, Class R6 shares of Franklin U.S. Government Securities Fund returned 10.81%. The Fund compares its performance to the Bloomberg U.S. Government - Intermediate Index, which returned 8.33% for the same period.
| |
Top contributors to performance: |
| ↑ | Overweight allocation to Ginnie Mae (GN) II 2.5% and 3.5% coupons, evenweight in 4.0% coupons and a shift in allocation from an overweight to underweight in 3.0% coupons. |
| ↑ | Overweight allocation to GN I 4.0% through 5.5% coupon securities (especially the 4.5% and 5.0% coupons). |
| ↑ | Security selection in GN I 5.0% and GN II 2.5% and 3.5% coupons. |
| |
Top detractors from performance: |
| ↓ | Underweight allocation to GN II 2.0%, and 4.5% through 7.0% coupons (especially the 2.0% coupons). |
| ↓ | Security selection in GN I 4.0 and 4.5% coupons. Selection in GN II 3.0%, and 4.0% through 5.0% coupons. |
| ↓ | Allocation to GN I 3.0% coupons. |
| Franklin U.S. Government Securities Fund | PAGE 1 | 320-ATSR-1124 |
HOW DID THE FUND PERFORM OVER THE LAST 10 YEARS?
The Fund’s past performance is not necessarily an indication of how the Fund will perform in the future. The graph and table do not reflect the deduction of taxes that a shareholder would pay on Fund distributions or redemption of Fund shares.
VALUE OF A $10,000 INVESTMENT – Class R6 9/30/2014 — 9/30/2024
AVERAGE ANNUAL TOTAL RETURNS (%) Period Ended September 30, 2024
| | | |
| | 1 Year | 5 Year | 10 Year |
Class R6 | 10.81 | -0.10 | 1.01 |
Bloomberg U.S. Aggregate Index | 11.57 | 0.33 | 1.84 |
Bloomberg U.S. Government - Intermediate Index | 8.33 | 0.83 | 1.50 |
Fund performance figures may reflect fee waivers and/or expense reimbursements, without which the performance would have been lower.
For current month-end performance, please call Franklin Templeton at (800) DIAL BEN/342-5236 or visit https://www.franklintempleton.com/investments/options/mutual-funds.
Important data provider notices and terms available at www.franklintempletondatasources.com.
KEY FUND STATISTICS (as of September 30, 2024)
| |
Total Net Assets | $2,384,479,516 |
Total Number of Portfolio Holdings* | 672 |
Total Management Fee Paid | $11,072,696 |
Portfolio Turnover Rate | 30.97% |
| * | Does not include derivatives, except purchased options, if any. |
WHAT DID THE FUND INVEST IN? (as of September 30, 2024)
Portfolio Composition* (% of Total Investments)
| * | Does not include derivatives, except purchased options, if any. |
| Franklin U.S. Government Securities Fund | PAGE 2 | 320-ATSR-1124 |
HOW HAS THE FUND CHANGED?
Effective September 30, 2024, Jatin Misra and Michael V. Salm replaced Paul Varunok and Neil Dhruv as portfolio managers of the Fund.
This is a summary of a change to the Fund since October 1, 2023. For more complete information, you may review the Fund’s current prospectus, any applicable supplements, and the Fund’s next prospectus, which we expect to be available by February 1, 2025 at
https://www.franklintempleton.com/regulatory-fund-documents or upon request at (800) DIAL BEN/342-5236 or
prospectus@franklintempleton.com.
| |
| WHERE CAN I FIND ADDITIONAL INFORMATION ABOUT THE FUND? |
Additional information is available on https://www.franklintempleton.com/regulatory-fund-documents, including its: |
| • prospectus • proxy voting information • financial information • holdings • tax information |
HOUSEHOLDING
You will receive the Fund’s shareholder reports every six months. In addition, you will receive an annual updated summary prospectus (detail prospectus available upon request). To reduce Fund expenses, we try to identify related shareholders in a household and send only one copy of the shareholder reports and summary prospectus. This process, called “householding,” will continue indefinitely unless you instruct us otherwise. If you prefer not to have these documents householded, please call us at (800) DIAL BEN/342-5236. At any time, you may view current prospectuses/summary prospectuses and shareholder reports on our website. If you choose, you may receive these documents through electronic delivery.
| Franklin U.S. Government Securities Fund | PAGE 3 | 320-ATSR-1124 |
1000010235105041048710348111121148311392100139978110571000010293108271083510704118061263012517106901075912003100001030010551104811035811136118021164510576107171160995.03.51.5
| | |
Franklin U.S. Government Securities Fund | |
| Advisor Class [FUSAX] |
| Annual Shareholder Report | September 30, 2024 |
|
This annual shareholder report contains important information about Franklin U.S. Government Securities Fund for the period October 1, 2023, to September 30, 2024.
You can find additional information about the Fund at https://www.franklintempleton.com/regulatory-fund-documents. You can also request this information by contacting us at (800) DIAL BEN/342-5236.
This report describes changes to the Fund that occurred during the reporting period.
WHAT WERE THE FUND COSTS FOR THE LAST YEAR? (based on a hypothetical $10,000 investment)
| | |
Class Name | Costs of a $10,000 investment | Costs paid as a percentage of a $10,000 investment* |
| Advisor Class | $62 | 0.59% |
| * | Reflects fee waivers and/or expense reimbursements, without which expenses would have been higher. |
HOW DID THE FUND PERFORM LAST YEAR AND WHAT AFFECTED ITS PERFORMANCE?
For the twelve months ended September 30, 2024, Advisor Class shares of Franklin U.S. Government Securities Fund returned 10.48%. The Fund compares its performance to the Bloomberg U.S. Government - Intermediate Index, which returned 8.33% for the same period.
| |
Top contributors to performance: |
| ↑ | Overweight allocation to Ginnie Mae (GN) II 2.5% and 3.5% coupons, evenweight in 4.0% coupons and a shift in allocation from an overweight to underweight in 3.0% coupons. |
| ↑ | Overweight allocation to GN I 4.0% through 5.5% coupon securities (especially the 4.5% and 5.0% coupons). |
| ↑ | Security selection in GN I 5.0% and GN II 2.5% and 3.5% coupons. |
| |
Top detractors from performance: |
| ↓ | Underweight allocation to GN II 2.0%, and 4.5% through 7.0% coupons (especially the 2.0% coupons). |
| ↓ | Security selection in GN I 4.0 and 4.5% coupons. Selection in GN II 3.0%, and 4.0% through 5.0% coupons. |
| ↓ | Allocation to GN I 3.0% coupons. |
| Franklin U.S. Government Securities Fund | PAGE 1 | 610-ATSR-1124 |
HOW DID THE FUND PERFORM OVER THE LAST 10 YEARS?
The Fund’s past performance is not necessarily an indication of how the Fund will perform in the future. The graph and table do not reflect the deduction of taxes that a shareholder would pay on Fund distributions or redemption of Fund shares.
VALUE OF A $10,000 INVESTMENT – Advisor Class 9/30/2014 — 9/30/2024
AVERAGE ANNUAL TOTAL RETURNS (%) Period Ended September 30, 2024
| | | |
| | 1 Year | 5 Year | 10 Year |
Advisor Class | 10.48 | -0.21 | 0.87 |
Bloomberg U.S. Aggregate Index | 11.57 | 0.33 | 1.84 |
Bloomberg U.S. Government - Intermediate Index | 8.33 | 0.83 | 1.50 |
Fund performance figures may reflect fee waivers and/or expense reimbursements, without which the performance would have been lower.
For current month-end performance, please call Franklin Templeton at (800) DIAL BEN/342-5236 or visit https://www.franklintempleton.com/investments/options/mutual-funds.
Important data provider notices and terms available at www.franklintempletondatasources.com.
KEY FUND STATISTICS (as of September 30, 2024)
| |
Total Net Assets | $2,384,479,516 |
Total Number of Portfolio Holdings* | 672 |
Total Management Fee Paid | $11,072,696 |
Portfolio Turnover Rate | 30.97% |
| * | Does not include derivatives, except purchased options, if any. |
WHAT DID THE FUND INVEST IN? (as of September 30, 2024)
Portfolio Composition* (% of Total Investments)
| * | Does not include derivatives, except purchased options, if any. |
| Franklin U.S. Government Securities Fund | PAGE 2 | 610-ATSR-1124 |
HOW HAS THE FUND CHANGED?
Effective September 30, 2024, Jatin Misra and Michael V. Salm replaced Paul Varunok and Neil Dhruv as portfolio managers of the Fund.
This is a summary of a change to the Fund since October 1, 2023. For more complete information, you may review the Fund’s current prospectus, any applicable supplements, and the Fund’s next prospectus, which we expect to be available by February 1, 2025 at
https://www.franklintempleton.com/regulatory-fund-documents or upon request at (800) DIAL BEN/342-5236 or
prospectus@franklintempleton.com.
| |
| WHERE CAN I FIND ADDITIONAL INFORMATION ABOUT THE FUND? |
Additional information is available on https://www.franklintempleton.com/regulatory-fund-documents, including its: |
| • prospectus • proxy voting information • financial information • holdings • tax information |
HOUSEHOLDING
You will receive the Fund’s shareholder reports every six months. In addition, you will receive an annual updated summary prospectus (detail prospectus available upon request). To reduce Fund expenses, we try to identify related shareholders in a household and send only one copy of the shareholder reports and summary prospectus. This process, called “householding,” will continue indefinitely unless you instruct us otherwise. If you prefer not to have these documents householded, please call us at (800) DIAL BEN/342-5236. At any time, you may view current prospectuses/summary prospectuses and shareholder reports on our website. If you choose, you may receive these documents through electronic delivery.
| Franklin U.S. Government Securities Fund | PAGE 3 | 610-ATSR-1124 |
100001022110476104451029311022113781129598959872109061000010293108271083510704118061263012517106901075912003100001030010551104811035811136118021164510576107171160995.03.51.5
| | |
Franklin Utilities Fund | |
| Class A [FKUQX] |
| Annual Shareholder Report | September 30, 2024 |
|
This annual shareholder report contains important information about Franklin Utilities Fund for the period October 1, 2023, to September 30, 2024.
You can find additional information about the Fund at https://www.franklintempleton.com/regulatory-fund-documents. You can also request this information by contacting us at (800) DIAL BEN/342-5236.
WHAT WERE THE FUND COSTS FOR THE LAST YEAR? (based on a hypothetical $10,000 investment)
| | |
Class Name | Costs of a $10,000 investment | Costs paid as a percentage of a $10,000 investment* |
| Class A | $97 | 0.81% |
| * | Reflects fee waivers and/or expense reimbursements, without which expenses would have been higher. |
HOW DID THE FUND PERFORM LAST YEAR AND WHAT AFFECTED ITS PERFORMANCE?
For the twelve months ended September 30, 2024, Class A shares of Franklin Utilities Fund returned 40.74%. The Fund compares its performance to the S&P 500 Utilities Index and the S&P 500 Index, which returned 41.82% and 36.35%, respectively, for the same period.
| |
Top contributors to performance: |
| ↑ | At the industry level, the Fund was moderately underweight independent power producers but delivered strong selection effect due to investment in power generator Vistra. An out-of-benchmark holding for most of the period, it has been a beneficiary of growing electricity demand forecasts in the U.S., which pushed power prices higher, amid strong capacity expansion of data centers to meet cloud and artificial intelligence (AI) requirements. |
| ↑ | Underweight in Xcel Energy was a top relative contributor in the electric utilities industry. Xcel came under pressure amid concerns that its equipment sparked a large wildfire in Texas. |
| ↑ | Underweight in Consolidated Edison (not held at period-end) in the utilities industry. The company continues to invest in its energy delivery systems and clean energy projects to support the growing demand for power, but growth remains below peers. |
| |
Top detractors from performance: |
| ↓ | Underweight in electric utilities companies, Constellation Energy and NRG Energy were leading detractors from relative returns. |
| ↓ | Cheniere Energy (not part of the index), a liquid natural gas (LNG) supplier within the oil & gas storage & transportation industry, was negatively impacted by sluggish demand for new contracted capacity at the company’s plants under development amid a narrowing global arbitrage between U.S. and international gas prices. The company was also detrimentally impacted by a pause established by the U.S. government on permitting new LNG export facilities. |
| Franklin Utilities Fund | PAGE 1 | 1107-ATSR-1124 |
HOW DID THE FUND PERFORM OVER THE LAST 10 YEARS?
The Fund’s past performance is not necessarily an indication of how the Fund will perform in the future. The graph and table do not reflect the deduction of taxes that a shareholder would pay on Fund distributions or redemption of Fund shares.
VALUE OF A $10,000 INVESTMENT ($9,625 AFTER MAXIMUM APPLICABLE SALES CHARGE) –
Class A 9/30/2014 — 9/30/2024
AVERAGE ANNUAL TOTAL RETURNS (%) Period Ended September 30, 2024
| | | |
| | 1 Year | 5 Year | 10 Year |
Class A | 40.74 | 7.77 | 9.65 |
Class A (with sales charge) | 35.46 | 6.95 | 9.23 |
Russell 3000 Index | 35.19 | 15.26 | 12.83 |
S&P 500 Utilities Index | 41.82 | 7.99 | 10.41 |
S&P 500 Index | 36.35 | 15.97 | 13.38 |
Fund performance figures may reflect fee waivers and/or expense reimbursements, without which the performance would have been lower.
The Fund began offering Class A shares on 9/10/2018. Returns for periods before 9/10/2018, are based on the Fund’s Class A1 performance, which has been adjusted to take into account differences in class-specific operating expenses and maximum sales charges. For periods after the share class offering, performance for the specific share class is used, reflecting the applicable expenses and maximum sales charges.
Performance for periods prior to March 1, 2019, has been restated to reflect the current maximum sales charge, which is lower than the maximum sales charge prior to that date.
The Fund was able to successfully meet its monthly distributions under its managed distribution policy without the return of capital.
For current month-end performance, please call Franklin Templeton at (800) DIAL BEN/342-5236 or visit https://www.franklintempleton.com/investments/options/mutual-funds.
Important data provider notices and terms available at www.franklintempletondatasources.com.
KEY FUND STATISTICS (as of September 30, 2024)
| |
Total Net Assets | $6,718,864,291 |
Total Number of Portfolio Holdings* | 45 |
Total Management Fee Paid | $26,184,806 |
Portfolio Turnover Rate | 6.80% |
| * | Does not include derivatives, except purchased options, if any. |
| Franklin Utilities Fund | PAGE 2 | 1107-ATSR-1124 |
WHAT DID THE FUND INVEST IN? (as of September 30, 2024)
Portfolio Composition*,† (% of Total Investments)
| * | Does not include derivatives, except purchased options, if any. |
| † | Certain categories may represent less than 0.1%. |
| |
| WHERE CAN I FIND ADDITIONAL INFORMATION ABOUT THE FUND? |
Additional information is available on https://www.franklintempleton.com/regulatory-fund-documents, including its: |
| • prospectus • proxy voting information • financial information • holdings • tax information |
HOUSEHOLDING
You will receive the Fund’s shareholder reports every six months. In addition, you will receive an annual updated summary prospectus (detail prospectus available upon request). To reduce Fund expenses, we try to identify related shareholders in a household and send only one copy of the shareholder reports and summary prospectus. This process, called “householding,” will continue indefinitely unless you instruct us otherwise. If you prefer not to have these documents householded, please call us at (800) DIAL BEN/342-5236. At any time, you may view current prospectuses/summary prospectuses and shareholder reports on our website. If you choose, you may receive these documents through electronic delivery.
| Franklin Utilities Fund | PAGE 3 | 1107-ATSR-1124 |
96259836116281283412925164701504016889178271701724178100009950114391357915967164331889824921205282472933432100001065712508140121442218331174201933820417189842692210000993911472136071604416727192602504021165257413509895.73.80.00.5
| | |
Franklin Utilities Fund | |
| Class A1 [FKUTX] |
| Annual Shareholder Report | September 30, 2024 |
|
This annual shareholder report contains important information about Franklin Utilities Fund for the period October 1, 2023, to September 30, 2024.
You can find additional information about the Fund at https://www.franklintempleton.com/regulatory-fund-documents. You can also request this information by contacting us at (800) DIAL BEN/342-5236.
WHAT WERE THE FUND COSTS FOR THE LAST YEAR? (based on a hypothetical $10,000 investment)
| | |
Class Name | Costs of a $10,000 investment | Costs paid as a percentage of a $10,000 investment* |
| Class A1 | $86 | 0.71% |
| * | Reflects fee waivers and/or expense reimbursements, without which expenses would have been higher. |
HOW DID THE FUND PERFORM LAST YEAR AND WHAT AFFECTED ITS PERFORMANCE?
For the twelve months ended September 30, 2024, Class A1 shares of Franklin Utilities Fund returned 40.85%. The Fund compares its performance to the S&P 500 Utilities Index and the S&P 500 Index, which returned 41.82% and 36.35%, respectively, for the same period.
| |
Top contributors to performance: |
| ↑ | At the industry level, the Fund was moderately underweight independent power producers but delivered strong selection effect due to investment in power generator Vistra. An out-of-benchmark holding for most of the period, it has been a beneficiary of growing electricity demand forecasts in the U.S., which pushed power prices higher, amid strong capacity expansion of data centers to meet cloud and artificial intelligence (AI) requirements. |
| ↑ | Underweight in Xcel Energy was a top relative contributor in the electric utilities industry. Xcel came under pressure amid concerns that its equipment sparked a large wildfire in Texas. |
| ↑ | Underweight in Consolidated Edison (not held at period-end) in the utilities industry. The company continues to invest in its energy delivery systems and clean energy projects to support the growing demand for power, but growth remains below peers. |
| |
Top detractors from performance: |
| ↓ | Underweight in electric utilities companies, Constellation Energy and NRG Energy were leading detractors from relative returns. |
| ↓ | Cheniere Energy (not part of the index), a liquid natural gas (LNG) supplier within the oil & gas storage & transportation industry, was negatively impacted by sluggish demand for new contracted capacity at the company’s plants under development amid a narrowing global arbitrage between U.S. and international gas prices. The company was also detrimentally impacted by a pause established by the U.S. government on permitting new LNG export facilities. |
| Franklin Utilities Fund | PAGE 1 | 107-ATSR-1124 |
HOW DID THE FUND PERFORM OVER THE LAST 10 YEARS?
The Fund’s past performance is not necessarily an indication of how the Fund will perform in the future. The graph and table do not reflect the deduction of taxes that a shareholder would pay on Fund distributions or redemption of Fund shares.
VALUE OF A $10,000 INVESTMENT ($9,625 AFTER MAXIMUM APPLICABLE SALES CHARGE) –
Class A1 9/30/2014 — 9/30/2024
AVERAGE ANNUAL TOTAL RETURNS (%) Period Ended September 30, 2024
| | | |
| | 1 Year | 5 Year | 10 Year |
Class A1 | 40.85 | 7.88 | 9.72 |
Class A1 (with sales charge) | 35.54 | 7.06 | 9.30 |
Russell 3000 Index | 35.19 | 15.26 | 12.83 |
S&P 500 Utilities Index | 41.82 | 7.99 | 10.41 |
S&P 500 Index | 36.35 | 15.97 | 13.38 |
Fund performance figures may reflect fee waivers and/or expense reimbursements, without which the performance would have been lower.
Effective 9/10/18, Class A shares closed to new investors, were renamed Class A1 shares, and a new Class A share with a different expense structure became available.
Performance for periods prior to March 1, 2019, has been restated to reflect the current maximum sales charge, which is lower than the maximum sales charge prior to that date.
The Fund was able to successfully meet its monthly distributions under its managed distribution policy without the return of capital.
For current month-end performance, please call Franklin Templeton at (800) DIAL BEN/342-5236 or visit https://www.franklintempleton.com/investments/options/mutual-funds.
Important data provider notices and terms available at www.franklintempletondatasources.com.
KEY FUND STATISTICS (as of September 30, 2024)
| |
Total Net Assets | $6,718,864,291 |
Total Number of Portfolio Holdings* | 45 |
Total Management Fee Paid | $26,184,806 |
Portfolio Turnover Rate | 6.80% |
| * | Does not include derivatives, except purchased options, if any. |
| Franklin Utilities Fund | PAGE 2 | 107-ATSR-1124 |
WHAT DID THE FUND INVEST IN? (as of September 30, 2024)
Portfolio Composition*,† (% of Total Investments)
| * | Does not include derivatives, except purchased options, if any. |
| † | Certain categories may represent less than 0.1%. |
| |
| WHERE CAN I FIND ADDITIONAL INFORMATION ABOUT THE FUND? |
Additional information is available on https://www.franklintempleton.com/regulatory-fund-documents, including its: |
| • prospectus • proxy voting information • financial information • holdings • tax information |
HOUSEHOLDING
You will receive the Fund’s shareholder reports every six months. In addition, you will receive an annual updated summary prospectus (detail prospectus available upon request). To reduce Fund expenses, we try to identify related shareholders in a household and send only one copy of the shareholder reports and summary prospectus. This process, called “householding,” will continue indefinitely unless you instruct us otherwise. If you prefer not to have these documents householded, please call us at (800) DIAL BEN/342-5236. At any time, you may view current prospectuses/summary prospectuses and shareholder reports on our website. If you choose, you may receive these documents through electronic delivery.
| Franklin Utilities Fund | PAGE 3 | 107-ATSR-1124 |
96259836116291283613052166551522517113180821727824331100009950114391357915967164331889824921205282472933432100001065712508140121442218331174201933820417189842692210000993911472136071604416727192602504021165257413509895.73.80.00.5
| | |
Franklin Utilities Fund | |
| Class C [FRUSX] |
| Annual Shareholder Report | September 30, 2024 |
|
This annual shareholder report contains important information about Franklin Utilities Fund for the period October 1, 2023, to September 30, 2024.
You can find additional information about the Fund at https://www.franklintempleton.com/regulatory-fund-documents. You can also request this information by contacting us at (800) DIAL BEN/342-5236.
WHAT WERE THE FUND COSTS FOR THE LAST YEAR? (based on a hypothetical $10,000 investment)
| | |
Class Name | Costs of a $10,000 investment | Costs paid as a percentage of a $10,000 investment* |
| Class C | $145 | 1.21% |
| * | Reflects fee waivers and/or expense reimbursements, without which expenses would have been higher. |
HOW DID THE FUND PERFORM LAST YEAR AND WHAT AFFECTED ITS PERFORMANCE?
For the twelve months ended September 30, 2024, Class C shares of Franklin Utilities Fund returned 40.18%. The Fund compares its performance to the S&P 500 Utilities Index and the S&P 500 Index, which returned 41.82% and 36.35%, respectively, for the same period.
| |
Top contributors to performance: |
| ↑ | At the industry level, the Fund was moderately underweight independent power producers but delivered strong selection effect due to investment in power generator Vistra. An out-of-benchmark holding for most of the period, it has been a beneficiary of growing electricity demand forecasts in the U.S., which pushed power prices higher, amid strong capacity expansion of data centers to meet cloud and artificial intelligence (AI) requirements. |
| ↑ | Underweight in Xcel Energy was a top relative contributor in the electric utilities industry. Xcel came under pressure amid concerns that its equipment sparked a large wildfire in Texas. |
| ↑ | Underweight in Consolidated Edison (not held at period-end) in the utilities industry. The company continues to invest in its energy delivery systems and clean energy projects to support the growing demand for power, but growth remains below peers. |
| |
Top detractors from performance: |
| ↓ | Underweight in electric utilities companies, Constellation Energy and NRG Energy were leading detractors from relative returns. |
| ↓ | Cheniere Energy (not part of the index), a liquid natural gas (LNG) supplier within the oil & gas storage & transportation industry, was negatively impacted by sluggish demand for new contracted capacity at the company’s plants under development amid a narrowing global arbitrage between U.S. and international gas prices. The company was also detrimentally impacted by a pause established by the U.S. government on permitting new LNG export facilities. |
| Franklin Utilities Fund | PAGE 1 | 207-ATSR-1124 |
HOW DID THE FUND PERFORM OVER THE LAST 10 YEARS?
The Fund’s past performance is not necessarily an indication of how the Fund will perform in the future. The graph and table do not reflect the deduction of taxes that a shareholder would pay on Fund distributions or redemption of Fund shares.
VALUE OF A $10,000 INVESTMENT – Class C 9/30/2014 — 9/30/2024
AVERAGE ANNUAL TOTAL RETURNS (%) Period Ended September 30, 2024
| | | |
| | 1 Year | 5 Year | 10 Year |
Class C | 40.18 | 7.35 | 9.18 |
Class C (with sales charge) | 39.18 | 7.35 | 9.18 |
Russell 3000 Index | 35.19 | 15.26 | 12.83 |
S&P 500 Utilities Index | 41.82 | 7.99 | 10.41 |
S&P 500 Index | 36.35 | 15.97 | 13.38 |
Fund performance figures may reflect fee waivers and/or expense reimbursements, without which the performance would have been lower.
The Fund was able to successfully meet its monthly distributions under its managed distribution policy without the return of capital.
For current month-end performance, please call Franklin Templeton at (800) DIAL BEN/342-5236 or visit https://www.franklintempleton.com/investments/options/mutual-funds.
Important data provider notices and terms available at www.franklintempletondatasources.com.
KEY FUND STATISTICS (as of September 30, 2024)
| |
Total Net Assets | $6,718,864,291 |
Total Number of Portfolio Holdings* | 45 |
Total Management Fee Paid | $26,184,806 |
Portfolio Turnover Rate | 6.80% |
| * | Does not include derivatives, except purchased options, if any. |
| Franklin Utilities Fund | PAGE 2 | 207-ATSR-1124 |
WHAT DID THE FUND INVEST IN? (as of September 30, 2024)
Portfolio Composition*,† (% of Total Investments)
| * | Does not include derivatives, except purchased options, if any. |
| † | Certain categories may represent less than 0.1%. |
| |
| WHERE CAN I FIND ADDITIONAL INFORMATION ABOUT THE FUND? |
Additional information is available on https://www.franklintempleton.com/regulatory-fund-documents, including its: |
| • prospectus • proxy voting information • financial information • holdings • tax information |
HOUSEHOLDING
You will receive the Fund’s shareholder reports every six months. In addition, you will receive an annual updated summary prospectus (detail prospectus available upon request). To reduce Fund expenses, we try to identify related shareholders in a household and send only one copy of the shareholder reports and summary prospectus. This process, called “householding,” will continue indefinitely unless you instruct us otherwise. If you prefer not to have these documents householded, please call us at (800) DIAL BEN/342-5236. At any time, you may view current prospectuses/summary prospectuses and shareholder reports on our website. If you choose, you may receive these documents through electronic delivery.
| Franklin Utilities Fund | PAGE 3 | 207-ATSR-1124 |
1000010174119641314613301168871535117180180581717224072100009950114391357915967164331889824921205282472933432100001065712508140121442218331174201933820417189842692210000993911472136071604416727192602504021165257413509895.73.80.00.5
| | |
Franklin Utilities Fund | |
| Class R [FRURX] |
| Annual Shareholder Report | September 30, 2024 |
|
This annual shareholder report contains important information about Franklin Utilities Fund for the period October 1, 2023, to September 30, 2024.
You can find additional information about the Fund at https://www.franklintempleton.com/regulatory-fund-documents. You can also request this information by contacting us at (800) DIAL BEN/342-5236.
WHAT WERE THE FUND COSTS FOR THE LAST YEAR? (based on a hypothetical $10,000 investment)
| | |
Class Name | Costs of a $10,000 investment | Costs paid as a percentage of a $10,000 investment* |
| Class R | $127 | 1.06% |
| * | Reflects fee waivers and/or expense reimbursements, without which expenses would have been higher. |
HOW DID THE FUND PERFORM LAST YEAR AND WHAT AFFECTED ITS PERFORMANCE?
For the twelve months ended September 30, 2024, Class R shares of Franklin Utilities Fund returned 40.36%. The Fund compares its performance to the S&P 500 Utilities Index and the S&P 500 Index, which returned 41.82% and 36.35%, respectively, for the same period.
| |
Top contributors to performance: |
| ↑ | At the industry level, the Fund was moderately underweight independent power producers but delivered strong selection effect due to investment in power generator Vistra. An out-of-benchmark holding for most of the period, it has been a beneficiary of growing electricity demand forecasts in the U.S., which pushed power prices higher, amid strong capacity expansion of data centers to meet cloud and artificial intelligence (AI) requirements. |
| ↑ | Underweight in Xcel Energy was a top relative contributor in the electric utilities industry. Xcel came under pressure amid concerns that its equipment sparked a large wildfire in Texas. |
| ↑ | Underweight in Consolidated Edison (not held at period-end) in the utilities industry. The company continues to invest in its energy delivery systems and clean energy projects to support the growing demand for power, but growth remains below peers. |
| |
Top detractors from performance: |
| ↓ | Underweight in electric utilities companies, Constellation Energy and NRG Energy were leading detractors from relative returns. |
| ↓ | Cheniere Energy (not part of the index), a liquid natural gas (LNG) supplier within the oil & gas storage & transportation industry, was negatively impacted by sluggish demand for new contracted capacity at the company’s plants under development amid a narrowing global arbitrage between U.S. and international gas prices. The company was also detrimentally impacted by a pause established by the U.S. government on permitting new LNG export facilities. |
| Franklin Utilities Fund | PAGE 1 | 807-ATSR-1124 |
HOW DID THE FUND PERFORM OVER THE LAST 10 YEARS?
The Fund’s past performance is not necessarily an indication of how the Fund will perform in the future. The graph and table do not reflect the deduction of taxes that a shareholder would pay on Fund distributions or redemption of Fund shares.
VALUE OF A $10,000 INVESTMENT – Class R 9/30/2014 — 9/30/2024
AVERAGE ANNUAL TOTAL RETURNS (%) Period Ended September 30, 2024
| | | |
| | 1 Year | 5 Year | 10 Year |
Class R | 40.36 | 7.50 | 9.34 |
Russell 3000 Index | 35.19 | 15.26 | 12.83 |
S&P 500 Utilities Index | 41.82 | 7.99 | 10.41 |
S&P 500 Index | 36.35 | 15.97 | 13.38 |
Fund performance figures may reflect fee waivers and/or expense reimbursements, without which the performance would have been lower.
The Fund was able to successfully meet its monthly distributions under its managed distribution policy without the return of capital.
For current month-end performance, please call Franklin Templeton at (800) DIAL BEN/342-5236 or visit https://www.franklintempleton.com/investments/options/mutual-funds.
Important data provider notices and terms available at www.franklintempletondatasources.com.
KEY FUND STATISTICS (as of September 30, 2024)
| |
Total Net Assets | $6,718,864,291 |
Total Number of Portfolio Holdings* | 45 |
Total Management Fee Paid | $26,184,806 |
Portfolio Turnover Rate | 6.80% |
| * | Does not include derivatives, except purchased options, if any. |
| Franklin Utilities Fund | PAGE 2 | 807-ATSR-1124 |
WHAT DID THE FUND INVEST IN? (as of September 30, 2024)
Portfolio Composition*,† (% of Total Investments)
| * | Does not include derivatives, except purchased options, if any. |
| † | Certain categories may represent less than 0.1%. |
| |
| WHERE CAN I FIND ADDITIONAL INFORMATION ABOUT THE FUND? |
Additional information is available on https://www.franklintempleton.com/regulatory-fund-documents, including its: |
| • prospectus • proxy voting information • financial information • holdings • tax information |
HOUSEHOLDING
You will receive the Fund’s shareholder reports every six months. In addition, you will receive an annual updated summary prospectus (detail prospectus available upon request). To reduce Fund expenses, we try to identify related shareholders in a household and send only one copy of the shareholder reports and summary prospectus. This process, called “householding,” will continue indefinitely unless you instruct us otherwise. If you prefer not to have these documents householded, please call us at (800) DIAL BEN/342-5236. At any time, you may view current prospectuses/summary prospectuses and shareholder reports on our website. If you choose, you may receive these documents through electronic delivery.
| Franklin Utilities Fund | PAGE 3 | 807-ATSR-1124 |
1000010183119971320113376170111548917357182711740224426100009950114391357915967164331889824921205282472933432100001065712508140121442218331174201933820417189842692210000993911472136071604416727192602504021165257413509895.73.80.00.5
| | |
Franklin Utilities Fund | |
| Class R6 [FUFRX] |
| Annual Shareholder Report | September 30, 2024 |
|
This annual shareholder report contains important information about Franklin Utilities Fund for the period October 1, 2023, to September 30, 2024.
You can find additional information about the Fund at https://www.franklintempleton.com/regulatory-fund-documents. You can also request this information by contacting us at (800) DIAL BEN/342-5236.
WHAT WERE THE FUND COSTS FOR THE LAST YEAR? (based on a hypothetical $10,000 investment)
| | |
Class Name | Costs of a $10,000 investment | Costs paid as a percentage of a $10,000 investment* |
| Class R6 | $60 | 0.50% |
| * | Reflects fee waivers and/or expense reimbursements, without which expenses would have been higher. |
HOW DID THE FUND PERFORM LAST YEAR AND WHAT AFFECTED ITS PERFORMANCE?
For the twelve months ended September 30, 2024, Class R6 shares of Franklin Utilities Fund returned 41.15%. The Fund compares its performance to the S&P 500 Utilities Index and the S&P 500 Index, which returned 41.82% and 36.35%, respectively, for the same period.
| |
Top contributors to performance: |
| ↑ | At the industry level, the Fund was moderately underweight independent power producers but delivered strong selection effect due to investment in power generator Vistra. An out-of-benchmark holding for most of the period, it has been a beneficiary of growing electricity demand forecasts in the U.S., which pushed power prices higher, amid strong capacity expansion of data centers to meet cloud and artificial intelligence (AI) requirements. |
| ↑ | Underweight in Xcel Energy was a top relative contributor in the electric utilities industry. Xcel came under pressure amid concerns that its equipment sparked a large wildfire in Texas. |
| ↑ | Underweight in Consolidated Edison (not held at period-end) in the utilities industry. The company continues to invest in its energy delivery systems and clean energy projects to support the growing demand for power, but growth remains below peers. |
| |
Top detractors from performance: |
| ↓ | Underweight in electric utilities companies, Constellation Energy and NRG Energy were leading detractors from relative returns. |
| ↓ | Cheniere Energy (not part of the index), a liquid natural gas (LNG) supplier within the oil & gas storage & transportation industry, was negatively impacted by sluggish demand for new contracted capacity at the company’s plants under development amid a narrowing global arbitrage between U.S. and international gas prices. The company was also detrimentally impacted by a pause established by the U.S. government on permitting new LNG export facilities. |
| Franklin Utilities Fund | PAGE 1 | 370-ATSR-1124 |
HOW DID THE FUND PERFORM OVER THE LAST 10 YEARS?
The Fund’s past performance is not necessarily an indication of how the Fund will perform in the future. The graph and table do not reflect the deduction of taxes that a shareholder would pay on Fund distributions or redemption of Fund shares.
VALUE OF A $10,000 INVESTMENT – Class R6 9/30/2014 — 9/30/2024
AVERAGE ANNUAL TOTAL RETURNS (%) Period Ended September 30, 2024
| | | |
| | 1 Year | 5 Year | 10 Year |
Class R6 | 41.15 | 8.10 | 9.98 |
Russell 3000 Index | 35.19 | 15.26 | 12.83 |
S&P 500 Utilities Index | 41.82 | 7.99 | 10.41 |
S&P 500 Index | 36.35 | 15.97 | 13.38 |
Fund performance figures may reflect fee waivers and/or expense reimbursements, without which the performance would have been lower.
The Fund was able to successfully meet its monthly distributions under its managed distribution policy without the return of capital.
For current month-end performance, please call Franklin Templeton at (800) DIAL BEN/342-5236 or visit https://www.franklintempleton.com/investments/options/mutual-funds.
Important data provider notices and terms available at www.franklintempletondatasources.com.
KEY FUND STATISTICS (as of September 30, 2024)
| |
Total Net Assets | $6,718,864,291 |
Total Number of Portfolio Holdings* | 45 |
Total Management Fee Paid | $26,184,806 |
Portfolio Turnover Rate | 6.80% |
| * | Does not include derivatives, except purchased options, if any. |
| Franklin Utilities Fund | PAGE 2 | 370-ATSR-1124 |
WHAT DID THE FUND INVEST IN? (as of September 30, 2024)
Portfolio Composition*,† (% of Total Investments)
| * | Does not include derivatives, except purchased options, if any. |
| † | Certain categories may represent less than 0.1%. |
| |
| WHERE CAN I FIND ADDITIONAL INFORMATION ABOUT THE FUND? |
Additional information is available on https://www.franklintempleton.com/regulatory-fund-documents, including its: |
| • prospectus • proxy voting information • financial information • holdings • tax information |
HOUSEHOLDING
You will receive the Fund’s shareholder reports every six months. In addition, you will receive an annual updated summary prospectus (detail prospectus available upon request). To reduce Fund expenses, we try to identify related shareholders in a household and send only one copy of the shareholder reports and summary prospectus. This process, called “householding,” will continue indefinitely unless you instruct us otherwise. If you prefer not to have these documents householded, please call us at (800) DIAL BEN/342-5236. At any time, you may view current prospectuses/summary prospectuses and shareholder reports on our website. If you choose, you may receive these documents through electronic delivery.
| Franklin Utilities Fund | PAGE 3 | 370-ATSR-1124 |
1000010245121451344413709175331605418060191251831525886100009950114391357915967164331889824921205282472933432100001065712508140121442218331174201933820417189842692210000993911472136071604416727192602504021165257413509895.73.80.00.5
| | |
Franklin Utilities Fund | |
| Advisor Class [FRUAX] |
| Annual Shareholder Report | September 30, 2024 |
|
This annual shareholder report contains important information about Franklin Utilities Fund for the period October 1, 2023, to September 30, 2024.
You can find additional information about the Fund at https://www.franklintempleton.com/regulatory-fund-documents. You can also request this information by contacting us at (800) DIAL BEN/342-5236.
WHAT WERE THE FUND COSTS FOR THE LAST YEAR? (based on a hypothetical $10,000 investment)
| | |
Class Name | Costs of a $10,000 investment | Costs paid as a percentage of a $10,000 investment* |
| Advisor Class | $68 | 0.56% |
| * | Reflects fee waivers and/or expense reimbursements, without which expenses would have been higher. |
HOW DID THE FUND PERFORM LAST YEAR AND WHAT AFFECTED ITS PERFORMANCE?
For the twelve months ended September 30, 2024, Advisor Class shares of Franklin Utilities Fund returned 41.12%. The Fund compares its performance to the S&P 500 Utilities Index and the S&P 500 Index, which returned 41.82% and 36.35%, respectively, for the same period.
| |
Top contributors to performance: |
| ↑ | At the industry level, the Fund was moderately underweight independent power producers but delivered strong selection effect due to investment in power generator Vistra. An out-of-benchmark holding for most of the period, it has been a beneficiary of growing electricity demand forecasts in the U.S., which pushed power prices higher, amid strong capacity expansion of data centers to meet cloud and artificial intelligence (AI) requirements. |
| ↑ | Underweight in Xcel Energy was a top relative contributor in the electric utilities industry. Xcel came under pressure amid concerns that its equipment sparked a large wildfire in Texas. |
| ↑ | Underweight in Consolidated Edison (not held at period-end) in the utilities industry. The company continues to invest in its energy delivery systems and clean energy projects to support the growing demand for power, but growth remains below peers. |
| |
Top detractors from performance: |
| ↓ | Underweight in electric utilities companies, Constellation Energy and NRG Energy were leading detractors from relative returns. |
| ↓ | Cheniere Energy (not part of the index), a liquid natural gas (LNG) supplier within the oil & gas storage & transportation industry, was negatively impacted by sluggish demand for new contracted capacity at the company’s plants under development amid a narrowing global arbitrage between U.S. and international gas prices. The company was also detrimentally impacted by a pause established by the U.S. government on permitting new LNG export facilities. |
| Franklin Utilities Fund | PAGE 1 | 607-ATSR-1124 |
HOW DID THE FUND PERFORM OVER THE LAST 10 YEARS?
The Fund’s past performance is not necessarily an indication of how the Fund will perform in the future. The graph and table do not reflect the deduction of taxes that a shareholder would pay on Fund distributions or redemption of Fund shares.
VALUE OF A $10,000 INVESTMENT – Advisor Class 9/30/2014 — 9/30/2024
AVERAGE ANNUAL TOTAL RETURNS (%) Period Ended September 30, 2024
| | | |
| | 1 Year | 5 Year | 10 Year |
Advisor Class | 41.12 | 8.04 | 9.89 |
Russell 3000 Index | 35.19 | 15.26 | 12.83 |
S&P 500 Utilities Index | 41.82 | 7.99 | 10.41 |
S&P 500 Index | 36.35 | 15.97 | 13.38 |
Fund performance figures may reflect fee waivers and/or expense reimbursements, without which the performance would have been lower.
The Fund was able to successfully meet its monthly distributions under its managed distribution policy without the return of capital.
For current month-end performance, please call Franklin Templeton at (800) DIAL BEN/342-5236 or visit https://www.franklintempleton.com/investments/options/mutual-funds.
Important data provider notices and terms available at www.franklintempletondatasources.com.
KEY FUND STATISTICS (as of September 30, 2024)
| |
Total Net Assets | $6,718,864,291 |
Total Number of Portfolio Holdings* | 45 |
Total Management Fee Paid | $26,184,806 |
Portfolio Turnover Rate | 6.80% |
| * | Does not include derivatives, except purchased options, if any. |
| Franklin Utilities Fund | PAGE 2 | 607-ATSR-1124 |
WHAT DID THE FUND INVEST IN? (as of September 30, 2024)
Portfolio Composition*,† (% of Total Investments)
| * | Does not include derivatives, except purchased options, if any. |
| † | Certain categories may represent less than 0.1%. |
| |
| WHERE CAN I FIND ADDITIONAL INFORMATION ABOUT THE FUND? |
Additional information is available on https://www.franklintempleton.com/regulatory-fund-documents, including its: |
| • prospectus • proxy voting information • financial information • holdings • tax information |
HOUSEHOLDING
You will receive the Fund’s shareholder reports every six months. In addition, you will receive an annual updated summary prospectus (detail prospectus available upon request). To reduce Fund expenses, we try to identify related shareholders in a household and send only one copy of the shareholder reports and summary prospectus. This process, called “householding,” will continue indefinitely unless you instruct us otherwise. If you prefer not to have these documents householded, please call us at (800) DIAL BEN/342-5236. At any time, you may view current prospectuses/summary prospectuses and shareholder reports on our website. If you choose, you may receive these documents through electronic delivery.
| Franklin Utilities Fund | PAGE 3 | 607-ATSR-1124 |
1000010240121181340713651174441596017973190201820025683100009950114391357915967164331889824921205282472933432100001065712508140121442218331174201933820417189842692210000993911472136071604416727192602504021165257413509895.73.80.00.5
Item 2. Code of Ethics.
(a) The Registrant has adopted a code of ethics that applies to its principal executive officers and principal financial and accounting officer.
(c) N/A
(d) N/A
(f) Pursuant to Item 19(a)(1), the Registrant is attaching as an exhibit a copy of its code of ethics that applies to its principal executive officers and principal financial and accounting officer.
Item 3. Audit Committee Financial Expert.
(a) (1) The Registrant has an audit committee financial expert serving on its audit committee.
(2) The audit committee financial expert is Mary C. Choksi and she is "independent" as defined under the relevant Securities and Exchange Commission Rules and Releases.
Item 4. Principal Accountant Fees and Services.
(a) Audit Fees
The aggregate fees paid to the principal accountant for professional services rendered by the principal accountant for the audit of the registrant’s annual financial statements or for services that are normally provided by the principal accountant in connection with statutory and regulatory filings or engagements were $438,078 for the fiscal year ended September 30, 2024 and $443,151 for the fiscal year ended September 30, 2023.
(b) Audit-Related Fees
The aggregate fees paid to the principal accountant for assurance and related services rendered by the principal accountant to the registrant that are reasonably related to the performance of the audit of the registrant’s financial statements and are not reported under paragraph (a) of Item 4 were $9,000 for the fiscal year ended September 30, 2024 and $9,000 for the fiscal year ended September 30, 2023. The services for which these fees were paid included attestation services.
There were no fees paid to the principal accountant for assurance and related services rendered by the principal accountant to the registrant’s investment adviser and any entity controlling, controlled by or under common control with the investment adviser that provides ongoing services to the registrant that are reasonably related to the performance of the audit of their financial statements.
(c) Tax Fees
The aggregate fees paid to the principal accountant for professional services rendered by the principal accountant to the registrant for tax compliance, tax advice and tax planning were $0 for the fiscal year ended September 30, 2024 and $25,250 for the fiscal year ended September 30, 2023. The services for which these fees were paid included fees for tax compliance matters.
The aggregate fees paid to the principal accountant for professional services rendered by the principal accountant to the registrant’s investment adviser and any entity controlling, controlled by or under common control with the investment adviser that provides ongoing services to the registrant for tax compliance, tax advice and tax planning were $70,000 for the fiscal year ended September 30, 2024 and $140,000 for the fiscal year ended September 30, 2023. The services for which these fees were paid included global access to tax platform International Tax View.
(d) All Other Fees
The aggregate fees paid to the principal accountant for products and services rendered by the principal accountant to the registrant not reported in paragraphs (a)-(c) of Item 4 were $0 for the fiscal year ended September 30, 2024 and $56,548 for the fiscal year ended September 30, 2023. The services for which these fees were paid included review of materials provided to the fund Board in connection with the investment management contract renewal process.
The aggregate fees paid to the principal accountant for products and services rendered by the principal accountant to the registrant’s investment adviser and any entity controlling, controlled by or under
common control with the investment adviser that provides ongoing services to the registrant not reported in paragraphs (a)-(c) of Item 4 were $163,638 for the fiscal year ended September 30, 2024 and $75,699 for the fiscal year ended September 30, 2023. The services for which these fees were paid included professional services relating to the readiness assessment over Greenhouse Gas Emissions and Energy, fees in connection with a license for accounting and business knowledge platform Viewpoint, professional fees relating to security counts and professional fees in connection with SOC 1 Reports.
(e) (1) The registrant’s audit committee is directly responsible for approving the services to be provided by the auditors, including:
(i) pre-approval of all audit and audit related services;
(ii) pre-approval of all non-audit related services to be provided to the Fund by the auditors;
(iii) pre-approval of all non-audit related services to be provided to the registrant by the auditors to the registrant’s investment adviser or to any entity that controls, is controlled by or is under common control with the registrant’s investment adviser and that provides ongoing services to the registrant where the non-audit services relate directly to the operations or financial reporting of the registrant; and
(iv) establishment by the audit committee, if deemed necessary or appropriate, as an alternative to committee pre-approval of services to be provided by the auditors, as required by paragraphs (ii) and (iii) above, of policies and procedures to permit such services to be pre-approved by other means, such as through establishment of guidelines or by action of a designated member or members of the committee; provided the policies and procedures are detailed as to the particular service and the committee is informed of each service and such policies and procedures do not include delegation of audit committee responsibilities, as contemplated under the Securities Exchange Act of 1934, to management; subject, in the case of (ii) through (iv), to any waivers, exceptions or exemptions that may be available under applicable law or rules.
(e) (2) None of the services provided to the registrant described in paragraphs (b)-(d) of Item 4 were approved by the audit committee pursuant to paragraph (c)(7)(i)(C) of Rule 2-01 of regulation S-X.
(f) No disclosures are required by this Item 4(f).
(g) The aggregate non-audit fees paid to the principal accountant for services rendered by the principal accountant to the registrant and the registrant’s investment adviser and any entity controlling, controlled by or under common control with the investment adviser that provides ongoing services to the registrant were $242,638 for the fiscal year ended September 30, 2024 and $306,497 for the fiscal year ended September 30, 2023.
(h) The registrant’s audit committee of the board has considered whether the provision of non-audit services that were rendered to the registrant’s investment adviser (not including any sub-adviser whose role is primarily portfolio management and is subcontracted with or overseen by another investment adviser), and any entity controlling, controlled by, or under common control with the investment adviser that provides ongoing services to the registrant that were not pre-approved pursuant to paragraph (c)(7)(ii) of Rule 2-01 of Regulation S-X is compatible with maintaining the principal accountant’s independence.
(i) N/A
(j) N/A
Item 5. Audit Committee of Listed Registrants. N/A
Item 6. Schedule of Investments.
(a) Please see schedule of investments contained in the Financial Statements and Financial Highlights included under Item 7 of this Form N-CSR.
(b) N/A
Item 7. Financial Statements and Financial Highlights for Open-End Management Investment Companies.
Franklin
Custodian
Funds
Financial
Statements
and
Other
Important
Information
Annual
|
September
30,
2024
Franklin
DynaTech
Fund
Franklin
Growth
Fund
Franklin
Income
Fund
Franklin
U.S.
Government
Securities
Fund
Franklin
Utilities
Fund
Financial
Statements
and
Other
Important
Information—Annual
Financial
Highlights
and
Schedules
of
Investments
2
Financial
Statements
66
Notes
to
Financial
Statements
76
Report
of
Independent
Registered
Public
Accounting
Firm
101
Tax
Information
102
Changes
In
and
Disagreements
with
Accountants
103
Results
of
Meeting(s)
of
Shareholders
103
Remuneration
Paid
to
Directors,
Officers
and
Others
103
Board
Approval
of
Management
and
Subadvisory
Agreements
103
Financial
Highlights
Franklin
DynaTech
Fund
Annual
Report
The
accompanying
notes
are
an
integral
part
of
these
financial
statements.
a
Year
Ended
September
30,
2024
2023
2022
2021
2020
Class
A
Per
share
operating
performance
(for
a
share
outstanding
throughout
the
year)
Net
asset
value,
beginning
of
year
...................
$116.42
$92.78
$157.23
$121.24
$82.84
Income
from
investment
operations
a
:
Net
investment
(loss)
b
..........................
(0.59)
(0.38)
(0.64)
(0.82)
(0.38)
Net
realized
and
unrealized
gains
(losses)
...........
50.04
24.02
(61.59)
36.81
39.44
Total
from
investment
operations
....................
49.45
23.64
(62.23)
35.99
39.06
Less
distributions
from:
Net
realized
gains
.............................
—
—
(2.22)
—
(0.66)
Net
asset
value,
end
of
year
.......................
$165.87
$116.42
$92.78
$157.23
$121.24
Total
return
c
...................................
42.49%
25.47%
(40.15)%
29.68%
47.47%
Ratios
to
average
net
assets
Expenses
before
waiver
and
payments
by
affiliates
......
0.79%
0.83%
0.82%
0.79%
0.85%
Expenses
net
of
waiver
and
payments
by
affiliates
.......
0.79%
d
0.83%
d,e
0.82%
d,e
0.79%
d,e
0.84%
e
Net
investment
(loss)
............................
(0.41)%
(0.35)%
(0.50)%
(0.56)%
(0.39)%
Supplemental
data
Net
assets,
end
of
year
(000’s)
.....................
$11,920,330
$8,669,145
$7,214,315
$12,129,483
$8,378,574
Portfolio
turnover
rate
............................
11.94%
15.29%
40.72%
18.77%
13.82%
a
The
amount
shown
for
a
share
outstanding
throughout
the
period
may
not
correlate
with
the
Statement
of
Operations
for
the
period
due
to
the
timing
of
sales
and
repurchases
of
the
Fund’s
shares
in
relation
to
income
earned
and/or
fluctuating
fair
value
of
the
investments
of
the
Fund.
b
Based
on
average
daily
shares
outstanding.
c
Total
return
does
not
reflect
sales
commissions
or
contingent
deferred
sales
charges,
if
applicable.
d
Benefit
of
waiver
and
payments
by
affiliates
rounds
to
less
than
0.01%.
e
Benefit
of
expense
reduction
rounds
to
less
than
0.01%.
Franklin
Custodian
Funds
Financial
Highlights
Franklin
DynaTech
Fund
(continued)
The
accompanying
notes
are
an
integral
part
of
these
financial
statements.
Annual
Report
a
Year
Ended
September
30,
2024
2023
2022
2021
2020
Class
C
Per
share
operating
performance
(for
a
share
outstanding
throughout
the
year)
Net
asset
value,
beginning
of
year
...................
$93.09
$74.75
$128.06
$99.49
$68.60
Income
from
investment
operations
a
:
Net
investment
(loss)
b
..........................
(1.34)
(0.95)
(1.29)
(1.55)
(0.91)
Net
realized
and
unrealized
gains
(losses)
...........
39.90
19.29
(49.80)
30.12
32.46
Total
from
investment
operations
....................
38.56
18.34
(51.09)
28.57
31.55
Less
distributions
from:
Net
realized
gains
.............................
—
—
(2.22)
—
(0.66)
Net
asset
value,
end
of
year
.......................
$131.65
$93.09
$74.75
$128.06
$99.49
Total
return
c
...................................
41.41%
24.55%
(40.60)%
28.72%
46.37%
Ratios
to
average
net
assets
Expenses
before
waiver
and
payments
by
affiliates
......
1.54%
1.58%
1.57%
1.54%
1.60%
Expenses
net
of
waiver
and
payments
by
affiliates
.......
1.54%
d
1.58%
d,e
1.57%
d,e
1.54%
d,e
1.59%
e
Net
investment
(loss)
............................
(1.16)%
(1.10)%
(1.26)%
(1.31)%
(1.14)%
Supplemental
data
Net
assets,
end
of
year
(000’s)
.....................
$947,544
$774,154
$715,976
$1,339,016
$1,095,702
Portfolio
turnover
rate
............................
11.94%
15.29%
40.72%
18.77%
13.82%
a
The
amount
shown
for
a
share
outstanding
throughout
the
period
may
not
correlate
with
the
Statement
of
Operations
for
the
period
due
to
the
timing
of
sales
and
repurchases
of
the
Fund’s
shares
in
relation
to
income
earned
and/or
fluctuating
fair
value
of
the
investments
of
the
Fund.
b
Based
on
average
daily
shares
outstanding.
c
Total
return
does
not
reflect
sales
commissions
or
contingent
deferred
sales
charges,
if
applicable.
d
Benefit
of
waiver
and
payments
by
affiliates
rounds
to
less
than
0.01%.
e
Benefit
of
expense
reduction
rounds
to
less
than
0.01%.
Franklin
Custodian
Funds
Financial
Highlights
Franklin
DynaTech
Fund
(continued)
Annual
Report
The
accompanying
notes
are
an
integral
part
of
these
financial
statements.
a
Year
Ended
September
30,
2024
2023
2022
2021
2020
Class
R
Per
share
operating
performance
(for
a
share
outstanding
throughout
the
year)
Net
asset
value,
beginning
of
year
...................
$111.57
$89.14
$151.52
$117.13
$80.26
Income
from
investment
operations
a
:
Net
investment
(loss)
b
..........................
(0.92)
(0.62)
(0.91)
(1.14)
(0.60)
Net
realized
and
unrealized
gains
(losses)
...........
47.92
23.05
(59.25)
35.53
38.13
Total
from
investment
operations
....................
47.00
22.43
(60.16)
34.39
37.53
Less
distributions
from:
Net
realized
gains
.............................
—
—
(2.22)
—
(0.66)
Net
asset
value,
end
of
year
.......................
$158.57
$111.57
$89.14
$151.52
$117.13
Total
return
....................................
42.12%
25.16%
(40.29)%
29.36%
47.09%
Ratios
to
average
net
assets
Expenses
before
waiver
and
payments
by
affiliates
......
1.04%
1.08%
1.07%
1.04%
1.10%
Expenses
net
of
waiver
and
payments
by
affiliates
.......
1.04%
c
1.08%
c,d
1.07%
c,d
1.04%
c,d
1.09%
d
Net
investment
(loss)
............................
(0.66)%
(0.60)%
(0.75)%
(0.81)%
(0.63)%
Supplemental
data
Net
assets,
end
of
year
(000’s)
.....................
$268,319
$212,068
$188,831
$311,646
$221,041
Portfolio
turnover
rate
............................
11.94%
15.29%
40.72%
18.77%
13.82%
a
The
amount
shown
for
a
share
outstanding
throughout
the
period
may
not
correlate
with
the
Statement
of
Operations
for
the
period
due
to
the
timing
of
sales
and
repurchases
of
the
Fund’s
shares
in
relation
to
income
earned
and/or
fluctuating
fair
value
of
the
investments
of
the
Fund.
b
Based
on
average
daily
shares
outstanding.
c
Benefit
of
waiver
and
payments
by
affiliates
rounds
to
less
than
0.01%.
d
Benefit
of
expense
reduction
rounds
to
less
than
0.01%.
Franklin
Custodian
Funds
Financial
Highlights
Franklin
DynaTech
Fund
(continued)
The
accompanying
notes
are
an
integral
part
of
these
financial
statements.
Annual
Report
a
Year
Ended
September
30,
2024
2023
2022
2021
2020
Class
R6
Per
share
operating
performance
(for
a
share
outstanding
throughout
the
year)
Net
asset
value,
beginning
of
year
...................
$123.35
$97.95
$165.26
$127.01
$86.46
Income
from
investment
operations
a
:
Net
investment
income
(loss)
b
....................
(0.11)
—
c
(0.18)
(0.36)
(0.05)
Net
realized
and
unrealized
gains
(losses)
...........
53.11
25.40
(64.91)
38.61
41.26
Total
from
investment
operations
....................
53.00
25.40
(65.09)
38.25
41.21
Less
distributions
from:
Net
realized
gains
.............................
—
—
(2.22)
—
(0.66)
Net
asset
value,
end
of
year
.......................
$176.35
$123.35
$97.95
$165.26
$127.01
Total
return
....................................
42.97%
25.92%
(39.92)%
30.12%
47.97%
Ratios
to
average
net
assets
Expenses
before
waiver
and
payments
by
affiliates
......
0.45%
0.48%
0.46%
0.46%
0.50%
Expenses
net
of
waiver
and
payments
by
affiliates
.......
0.45%
d
0.47%
e
0.45%
e
0.46%
d,e
0.50%
d,e
Net
investment
income
(loss)
......................
(0.07)%
—%
f
(0.13)%
(0.23)%
(0.05)%
Supplemental
data
Net
assets,
end
of
year
(000’s)
.....................
$8,980,818
$7,515,703
$6,322,021
$9,820,184
$5,817,028
Portfolio
turnover
rate
............................
11.94%
15.29%
40.72%
18.77%
13.82%
a
The
amount
shown
for
a
share
outstanding
throughout
the
period
may
not
correlate
with
the
Statement
of
Operations
for
the
period
due
to
the
timing
of
sales
and
repurchases
of
the
Fund’s
shares
in
relation
to
income
earned
and/or
fluctuating
fair
value
of
the
investments
of
the
Fund.
b
Based
on
average
daily
shares
outstanding.
c
Amount
rounds
to
less
than
$0.01
per
share.
d
Benefit
of
waiver
and
payments
by
affiliates
rounds
to
less
than
0.01%.
e
Benefit
of
expense
reduction
rounds
to
less
than
0.01%.
f
Rounds
to
less
than
0.01%.
Franklin
Custodian
Funds
Financial
Highlights
Franklin
DynaTech
Fund
(continued)
Annual
Report
The
accompanying
notes
are
an
integral
part
of
these
financial
statements.
a
Year
Ended
September
30,
2024
2023
2022
2021
2020
Advisor
Class
Per
share
operating
performance
(for
a
share
outstanding
throughout
the
year)
Net
asset
value,
beginning
of
year
...................
$121.56
$96.64
$163.27
$125.58
$85.58
Income
from
investment
operations
a
:
Net
investment
(loss)
b
..........................
(0.24)
(0.11)
(0.34)
(0.48)
(0.15)
Net
realized
and
unrealized
gains
(losses)
...........
52.31
25.03
(64.07)
38.17
40.81
Total
from
investment
operations
....................
52.07
24.92
(64.41)
37.69
40.66
Less
distributions
from:
Net
realized
gains
.............................
—
—
(2.22)
—
(0.66)
Net
asset
value,
end
of
year
.......................
$173.63
$121.56
$96.64
$163.27
$125.58
Total
return
....................................
42.83%
25.79%
(39.99)%
30.01%
47.83%
Ratios
to
average
net
assets
Expenses
before
waiver
and
payments
by
affiliates
......
0.54%
0.58%
0.57%
0.54%
0.60%
Expenses
net
of
waiver
and
payments
by
affiliates
.......
0.54%
c
0.58%
c,d
0.57%
c,d
0.54%
c,d
0.59%
d
Net
investment
(loss)
............................
(0.16)%
(0.10)%
(0.26)%
(0.32)%
(0.15)%
Supplemental
data
Net
assets,
end
of
year
(000’s)
.....................
$3,280,611
$2,499,474
$2,280,138
$4,352,531
$2,884,489
Portfolio
turnover
rate
............................
11.94%
15.29%
40.72%
18.77%
13.82%
a
The
amount
shown
for
a
share
outstanding
throughout
the
period
may
not
correlate
with
the
Statement
of
Operations
for
the
period
due
to
the
timing
of
sales
and
repurchases
of
the
Fund’s
shares
in
relation
to
income
earned
and/or
fluctuating
fair
value
of
the
investments
of
the
Fund.
b
Based
on
average
daily
shares
outstanding.
c
Benefit
of
waiver
and
payments
by
affiliates
rounds
to
less
than
0.01%.
d
Benefit
of
expense
reduction
rounds
to
less
than
0.01%.
Schedule
of
Investments,
September
30,
2024
Franklin
DynaTech
Fund
The
accompanying
notes
are
an
integral
part
of
these
financial
statements.
Annual
Report
a
a
Country
Shares
a
Value
a
a
a
a
a
a
Common
Stocks
99.2%
Aerospace
&
Defense
1.5%
a
Axon
Enterprise,
Inc.
.................................
United
States
925,000
$
369,630,000
Automobiles
1.4%
a
Tesla,
Inc.
.........................................
United
States
1,350,000
353,200,500
Banks
0.0%
†
a
NU
Holdings
Ltd.
,
A
..................................
Brazil
500,000
6,825,000
Biotechnology
1.3%
a
Argenx
SE
........................................
Netherlands
100,000
54,073,875
a
Ascendis
Pharma
A/S
,
ADR
...........................
Denmark
100,000
14,931,000
a
Crinetics
Pharmaceuticals,
Inc.
.........................
United
States
350,000
17,885,000
a
Insmed,
Inc.
.......................................
United
States
250,000
18,250,000
a
Krystal
Biotech,
Inc.
.................................
United
States
150,000
27,304,500
a
Merus
NV
.........................................
Netherlands
300,000
14,988,000
a
Natera,
Inc.
........................................
United
States
900,000
114,255,000
a
United
Therapeutics
Corp.
.............................
United
States
125,000
44,793,750
a
Vertex
Pharmaceuticals,
Inc.
...........................
United
States
25,000
11,627,000
318,108,125
Broadline
Retail
9.0%
a
Amazon.com,
Inc.
...................................
United
States
10,000,000
1,863,300,000
a
MercadoLibre,
Inc.
..................................
Brazil
200,000
410,392,000
2,273,692,000
Capital
Markets
1.4%
Moody's
Corp.
......................................
United
States
150,000
71,188,500
MSCI,
Inc.
,
A
.......................................
United
States
75,000
43,719,750
Tradeweb
Markets,
Inc.
,
A
.............................
United
States
2,000,000
247,340,000
362,248,250
Communications
Equipment
0.4%
a
Arista
Networks,
Inc.
.................................
United
States
280,000
107,469,600
Construction
&
Engineering
0.8%
Quanta
Services,
Inc.
................................
United
States
700,000
208,705,000
Diversified
Consumer
Services
0.1%
a
Duolingo,
Inc.
,
A
....................................
United
States
100,000
28,202,000
Electrical
Equipment
0.0%
†
Vertiv
Holdings
Co.
,
A
................................
United
States
100,000
9,949,000
Electronic
Equipment,
Instruments
&
Components
0.5%
Amphenol
Corp.
,
A
..................................
United
States
1,200,000
78,192,000
a
Celestica,
Inc.
......................................
Canada
250,000
12,780,000
Keyence
Corp.
.....................................
Japan
100,000
47,922,883
138,894,883
Energy
Equipment
&
Services
0.4%
Baker
Hughes
Co.
,
A
.................................
United
States
1,000,000
36,150,000
a
Oceaneering
International,
Inc.
.........................
United
States
1,000,000
24,870,000
TechnipFMC
plc
....................................
United
Kingdom
1,250,000
32,787,500
93,807,500
Entertainment
0.2%
a
Netflix,
Inc.
........................................
United
States
50,000
35,463,500
a
Spotify
Technology
SA
................................
United
States
50,000
18,426,500
53,890,000
Financial
Services
4.4%
Mastercard,
Inc.
,
A
..................................
United
States
1,700,000
839,460,000
Franklin
Custodian
Funds
Schedule
of
Investments
Franklin
DynaTech
Fund
(continued)
Annual
Report
The
accompanying
notes
are
an
integral
part
of
these
financial
statements.
a
a
Country
Shares
a
Value
a
a
a
a
a
a
Common
Stocks
(continued)
Financial
Services
(continued)
Visa,
Inc.
,
A
........................................
United
States
1,000,000
$
274,950,000
1,114,410,000
Ground
Transportation
0.9%
a
Uber
Technologies,
Inc.
...............................
United
States
3,000,000
225,480,000
Health
Care
Equipment
&
Supplies
3.5%
a
Boston
Scientific
Corp.
...............................
United
States
300,000
25,140,000
a
Globus
Medical,
Inc.
,
A
...............................
United
States
50,000
3,577,000
a
IDEXX
Laboratories,
Inc.
..............................
United
States
500,000
252,610,000
a
Intuitive
Surgical,
Inc.
................................
United
States
1,050,000
515,833,500
a
PROCEPT
BioRobotics
Corp.
..........................
United
States
550,000
44,066,000
Stryker
Corp.
......................................
United
States
50,000
18,063,000
a
TransMedics
Group,
Inc.
..............................
United
States
150,000
23,550,000
882,839,500
Health
Care
Providers
&
Services
0.6%
a
HealthEquity,
Inc.
...................................
United
States
500,000
40,925,000
UnitedHealth
Group,
Inc.
..............................
United
States
200,000
116,936,000
157,861,000
Health
Care
Technology
0.2%
Pro
Medicus
Ltd.
....................................
Australia
400,000
49,240,948
a
Veeva
Systems,
Inc.
,
A
...............................
United
States
50,000
10,493,500
59,734,448
Hotels,
Restaurants
&
Leisure
1.2%
Booking
Holdings,
Inc.
...............................
United
States
40,000
168,484,800
a
DoorDash,
Inc.
,
A
...................................
United
States
700,000
99,911,000
a
MakeMyTrip
Ltd.
....................................
India
400,000
37,180,000
305,575,800
Interactive
Media
&
Services
9.1%
Alphabet,
Inc.
,
A
....................................
United
States
7,000,000
1,160,950,000
Meta
Platforms,
Inc.
,
A
...............................
United
States
2,000,000
1,144,880,000
2,305,830,000
IT
Services
1.8%
a
Gartner,
Inc.
.......................................
United
States
125,000
63,345,000
a
Shopify,
Inc.
,
A
.....................................
Canada
4,800,000
384,574,999
a
Wix.com
Ltd.
.......................................
Israel
25,000
4,179,250
452,099,249
Life
Sciences
Tools
&
Services
3.3%
Danaher
Corp.
.....................................
United
States
1,350,000
375,327,000
a,b
Tempus
AI,
Inc.
,
A
...................................
United
States
396,200
22,424,920
Thermo
Fisher
Scientific,
Inc.
..........................
United
States
700,000
432,999,000
830,750,920
Media
0.0%
†
a
Trade
Desk,
Inc.
(The)
,
A
..............................
United
States
100,000
10,965,000
Pharmaceuticals
3.0%
AstraZeneca
plc
,
ADR
................................
United
Kingdom
1,000,000
77,910,000
Eli
Lilly
&
Co.
......................................
United
States
700,000
620,158,000
a
Intra-Cellular
Therapies,
Inc.
...........................
United
States
150,000
10,975,500
a
Ligand
Pharmaceuticals,
Inc.
...........................
United
States
75,000
7,506,750
Novo
Nordisk
A/S
,
ADR
...............................
Denmark
350,000
41,674,500
758,224,750
Franklin
Custodian
Funds
Schedule
of
Investments
Franklin
DynaTech
Fund
(continued)
The
accompanying
notes
are
an
integral
part
of
these
financial
statements.
Annual
Report
a
a
Country
Shares
a
Value
a
a
a
a
a
a
Common
Stocks
(continued)
Professional
Services
0.1%
Verisk
Analytics,
Inc.
,
A
...............................
United
States
100,000
$
26,796,000
Semiconductors
&
Semiconductor
Equipment
26.1%
a
Advanced
Micro
Devices,
Inc.
..........................
United
States
1,600,000
262,528,000
Analog
Devices,
Inc.
.................................
United
States
2,000,000
460,340,000
a
ARM
Holdings
plc
,
ADR
..............................
United
States
100,000
14,301,000
ASM
International
NV
................................
Netherlands
200,000
131,963,826
ASML
Holding
NV
,
ADR
..............................
Netherlands
750,000
624,937,500
Broadcom,
Inc.
.....................................
United
States
1,600,000
276,000,000
Entegris,
Inc.
.......................................
United
States
200,000
22,506,000
Intel
Corp.
.........................................
United
States
500,000
11,730,000
KLA
Corp.
.........................................
United
States
500,000
387,205,000
Lam
Research
Corp.
.................................
United
States
500,000
408,040,000
Monolithic
Power
Systems,
Inc.
.........................
United
States
500,000
462,250,000
NVIDIA
Corp.
......................................
United
States
29,000,000
3,521,760,000
Taiwan
Semiconductor
Manufacturing
Co.
Ltd.
,
ADR
.........
Taiwan
250,000
43,417,500
6,626,978,826
Software
25.6%
a
Appfolio,
Inc.
,
A
.....................................
United
States
200,000
47,080,000
a
AppLovin
Corp.
,
A
...................................
United
States
600,000
78,330,000
a
Aspen
Technology,
Inc.
...............................
United
States
25,000
5,970,500
a
Cadence
Design
Systems,
Inc.
.........................
United
States
2,000,000
542,060,000
Constellation
Software,
Inc.
............................
Canada
75,000
244,019,670
a
Datadog,
Inc.
,
A
....................................
United
States
450,000
51,777,000
a
Descartes
Systems
Group,
Inc.
(The)
....................
Canada
800,000
82,368,000
a
Fair
Isaac
Corp.
....................................
United
States
50,000
97,176,000
a
Guidewire
Software,
Inc.
..............................
United
States
100,000
18,294,000
a
HubSpot,
Inc.
......................................
United
States
325,000
172,770,000
Intuit,
Inc.
.........................................
United
States
1,000,000
621,000,000
a
Klaviyo,
Inc.
,
A
.....................................
United
States
400,000
14,152,000
a
Life360,
Inc.
.......................................
United
States
100,000
3,935,000
a,c
Lumine
Group,
Inc.
,
Reg
S
............................
Canada
500,000
11,683,366
a
Manhattan
Associates,
Inc.
............................
United
States
300,000
84,414,000
Microsoft
Corp.
.....................................
United
States
4,500,000
1,936,350,000
a
Monday.com
Ltd.
....................................
United
States
500,000
138,885,000
a
Palo
Alto
Networks,
Inc.
..............................
United
States
1,000,000
341,800,000
Roper
Technologies,
Inc.
..............................
United
States
350,000
194,754,000
Salesforce,
Inc.
.....................................
United
States
400,000
109,484,000
a
Samsara,
Inc.
,
A
....................................
United
States
200,000
9,624,000
a
ServiceNow,
Inc.
....................................
United
States
1,100,000
983,829,000
a
SPS
Commerce,
Inc.
.................................
United
States
125,000
24,271,250
a
Synopsys,
Inc.
.....................................
United
States
1,150,000
582,348,500
a
Tyler
Technologies,
Inc.
...............................
United
States
150,000
87,558,000
a
Workday,
Inc.
,
A
....................................
United
States
100,000
24,441,000
6,508,374,286
Technology
Hardware,
Storage
&
Peripherals
2.3%
Apple,
Inc.
........................................
United
States
2,500,000
582,500,000
Trading
Companies
&
Distributors
0.1%
Fastenal
Co.
.......................................
United
States
200,000
14,284,000
Total
Common
Stocks
(Cost
$
9,563,643,922
)
..................................
25,187,325,637
Franklin
Custodian
Funds
Schedule
of
Investments
Franklin
DynaTech
Fund
(continued)
Annual
Report
The
accompanying
notes
are
an
integral
part
of
these
financial
statements.
a
a
Country
Warrants
a
Value
a
a
a
a
a
a
Warrants
0.0%
Software
0.0%
a,d
Constellation
Software,
Inc.
,
3/31/40
.....................
Canada
50,000
$
—
Total
Warrants
(Cost
$
–
)
....................................................
—
Total
Long
Term
Investments
(Cost
$
9,563,643,922
)
...........................
25,187,325,637
a
Short
Term
Investments
0.9%
a
a
Country
Shares
a
Value
a
a
a
a
a
a
Money
Market
Funds
0.8%
e,f
Institutional
Fiduciary
Trust
-
Money
Market
Portfolio
,
4.74
%
...
United
States
220,607,622
220,607,622
Total
Money
Market
Funds
(Cost
$
220,607,622
)
...............................
220,607,622
g
Investments
from
Cash
Collateral
Received
for
Loaned
Securities
0.1%
Money
Market
Funds
0.1%
e,f
Institutional
Fiduciary
Trust
-
Money
Market
Portfolio
,
4.74
%
...
United
States
19,487,000
19,487,000
Total
Investments
from
Cash
Collateral
Received
for
Loaned
Securities
(Cost
$
19,487,000
)
.........................................................
19,487,000
Total
Short
Term
Investments
(Cost
$
240,094,622
)
.............................
240,094,622
a
Total
Investments
(Cost
$
9,803,738,544
)
100.1
%
..............................
$25,427,420,259
Other
Assets,
less
Liabilities
(
0.1
)
%
.........................................
(29,798,387)
Net
Assets
100.0%
.........................................................
$25,397,621,872
a
a
a
See
Abbreviations
on
page
100
.
†
Rounds
to
less
than
0.1%
of
net
assets.
a
Non-income
producing.
b
A
portion
or
all
of
the
security
is
on
loan
at
September
30,
2024.
See
Note
1(e).
c
Security
was
purchased
pursuant
to
Rule
144A
or
Regulation
S
under
the
Securities
Act
of
1933.
144A
securities
may
be
sold
in
transactions
exempt
from
registration
only
to
qualified
institutional
buyers
or
in
a
public
offering
registered
under
the
Securities
Act
of
1933.
Regulation
S
securities
cannot
be
sold
in
the
United
States
without
either
an
effective
registration
statement
filed
pursuant
to
the
Securities
Act
of
1933,
or
pursuant
to
an
exemption
from
registration.
At
September
30,
2024,
the
value
of
this
security
was
$11,683,366,
representing
less
than
0.1%
of
net
assets.
d
Fair
valued
using
significant
unobservable
inputs.
See
Note
12
regarding
fair
value
measurements.
e
See
Note
3(f)
regarding
investments
in
affiliated
management
investment
companies.
f
The
rate
shown
is
the
annualized
seven-day
effective
yield
at
period
end.
g
See
Note
1(e)
regarding
securities
on
loan.
Financial
Highlights
Franklin
Growth
Fund
The
accompanying
notes
are
an
integral
part
of
these
financial
statements.
Annual
Report
a
Year
Ended
September
30,
2024
2023
2022
2021
2020
Class
A
Per
share
operating
performance
(for
a
share
outstanding
throughout
the
year)
Net
asset
value,
beginning
of
year
...................
$115.08
$105.41
$151.73
$129.91
$110.04
Income
from
investment
operations
a
:
Net
investment
income
(loss)
b
....................
0.09
0.19
0.01
(0.06)
0.33
Net
realized
and
unrealized
gains
(losses)
...........
38.24
20.19
(32.51)
32.67
25.99
Total
from
investment
operations
....................
38.33
20.38
(32.50)
32.61
26.32
Less
distributions
from:
Net
investment
income
..........................
(0.22)
—
—
(0.18)
(0.46)
Net
realized
gains
.............................
(7.45)
(10.71)
(13.82)
(10.61)
(5.99)
Total
distributions
...............................
(7.67)
(10.71)
(13.82)
(10.79)
(6.45)
Net
asset
value,
end
of
year
.......................
$145.74
$115.08
$105.41
$151.73
$129.91
Total
return
c
...................................
34.70%
20.43%
(23.83)%
26.44%
25.09%
Ratios
to
average
net
assets
Expenses
before
waiver
and
payments
by
affiliates
......
0.79%
0.80%
0.80%
0.79%
0.82%
Expenses
net
of
waiver
and
payments
by
affiliates
.......
0.79%
d
0.80%
d,e
0.80%
d,e
0.79%
d,e
0.81%
e
Net
investment
income
(loss)
......................
0.07%
0.17%
0.01%
(0.04)%
0.29%
Supplemental
data
Net
assets,
end
of
year
(000’s)
.....................
$12,619,339
$10,072,509
$9,118,403
$12,927,577
$10,990,297
Portfolio
turnover
rate
............................
7.35%
2.86%
4.95%
f
6.04%
f
9.01%
a
The
amount
shown
for
a
share
outstanding
throughout
the
period
may
not
correlate
with
the
Statement
of
Operations
for
the
period
due
to
the
timing
of
sales
and
repurchases
of
the
Fund’s
shares
in
relation
to
income
earned
and/or
fluctuating
fair
value
of
the
investments
of
the
Fund.
b
Based
on
average
daily
shares
outstanding.
c
Total
return
does
not
reflect
sales
commissions
or
contingent
deferred
sales
charges,
if
applicable.
d
Benefit
of
waiver
and
payments
by
affiliates
rounds
to
less
than
0.01%.
e
Benefit
of
expense
reduction
rounds
to
less
than
0.01%.
f
Excludes
the
value
of
portfolio
activity
as
a
result
of
in-kind
transactions.
Franklin
Custodian
Funds
Financial
Highlights
Franklin
Growth
Fund
(continued)
Annual
Report
The
accompanying
notes
are
an
integral
part
of
these
financial
statements.
a
Year
Ended
September
30,
2024
2023
2022
2021
2020
Class
C
Per
share
operating
performance
(for
a
share
outstanding
throughout
the
year)
Net
asset
value,
beginning
of
year
...................
$98.08
$91.92
$134.93
$117.27
$100.21
Income
from
investment
operations
a
:
Net
investment
(loss)
b
..........................
(0.76)
(0.57)
(0.87)
(1.01)
(0.47)
Net
realized
and
unrealized
gains
(losses)
...........
32.30
17.44
(28.32)
29.28
23.52
Total
from
investment
operations
....................
31.54
16.87
(29.19)
28.27
23.05
Less
distributions
from:
Net
realized
gains
.............................
(7.45)
(10.71)
(13.82)
(10.61)
(5.99)
Net
asset
value,
end
of
year
.......................
$122.17
$98.08
$91.92
$134.93
$117.27
Total
return
c
...................................
33.69%
19.53%
(24.40)%
25.51%
24.16%
Ratios
to
average
net
assets
Expenses
before
waiver
and
payments
by
affiliates
......
1.54%
1.55%
1.55%
1.54%
1.57%
Expenses
net
of
waiver
and
payments
by
affiliates
.......
1.54%
d
1.55%
d,e
1.55%
d,e
1.54%
d,e
1.56%
e
Net
investment
(loss)
............................
(0.68)%
(0.59)%
(0.75)%
(0.79)%
(0.46)%
Supplemental
data
Net
assets,
end
of
year
(000’s)
.....................
$355,424
$333,956
$407,722
$666,348
$727,093
Portfolio
turnover
rate
............................
7.35%
2.86%
4.95%
f
6.04%
f
9.01%
a
The
amount
shown
for
a
share
outstanding
throughout
the
period
may
not
correlate
with
the
Statement
of
Operations
for
the
period
due
to
the
timing
of
sales
and
repurchases
of
the
Fund’s
shares
in
relation
to
income
earned
and/or
fluctuating
fair
value
of
the
investments
of
the
Fund.
b
Based
on
average
daily
shares
outstanding.
c
Total
return
does
not
reflect
sales
commissions
or
contingent
deferred
sales
charges,
if
applicable.
d
Benefit
of
waiver
and
payments
by
affiliates
rounds
to
less
than
0.01%.
e
Benefit
of
expense
reduction
rounds
to
less
than
0.01%.
f
Excludes
the
value
of
portfolio
activity
as
a
result
of
in-kind
transactions.
Franklin
Custodian
Funds
Financial
Highlights
Franklin
Growth
Fund
(continued)
The
accompanying
notes
are
an
integral
part
of
these
financial
statements.
Annual
Report
a
Year
Ended
September
30,
2024
2023
2022
2021
2020
Class
R
Per
share
operating
performance
(for
a
share
outstanding
throughout
the
year)
Net
asset
value,
beginning
of
year
...................
$113.60
$104.43
$150.77
$129.28
$109.49
Income
from
investment
operations
a
:
Net
investment
income
(loss)
b
....................
(0.24)
(0.10)
(0.32)
(0.41)
0.05
Net
realized
and
unrealized
gains
(losses)
...........
37.75
19.98
(32.20)
32.51
25.86
Total
from
investment
operations
....................
37.51
19.88
(32.52)
32.10
25.91
Less
distributions
from:
Net
investment
income
..........................
—
—
—
—
(0.13)
Net
realized
gains
.............................
(7.45)
(10.71)
(13.82)
(10.61)
(5.99)
Total
distributions
...............................
(7.45)
(10.71)
(13.82)
(10.61)
(6.12)
Net
asset
value,
end
of
year
.......................
$143.66
$113.60
$104.43
$150.77
$129.28
Total
return
....................................
34.36%
20.13%
(24.01)%
26.13%
24.78%
Ratios
to
average
net
assets
Expenses
before
waiver
and
payments
by
affiliates
......
1.04%
1.05%
1.05%
1.04%
1.07%
Expenses
net
of
waiver
and
payments
by
affiliates
.......
1.04%
c
1.05%
c,d
1.05%
c,d
1.04%
c,d
1.06%
d
Net
investment
income
(loss)
......................
(0.18)%
(0.09)%
(0.25)%
(0.29)%
0.04%
Supplemental
data
Net
assets,
end
of
year
(000’s)
.....................
$305,786
$256,889
$249,874
$395,301
$420,082
Portfolio
turnover
rate
............................
7.35%
2.86%
4.95%
e
6.04%
e
9.01%
a
The
amount
shown
for
a
share
outstanding
throughout
the
period
may
not
correlate
with
the
Statement
of
Operations
for
the
period
due
to
the
timing
of
sales
and
repurchases
of
the
Fund’s
shares
in
relation
to
income
earned
and/or
fluctuating
fair
value
of
the
investments
of
the
Fund.
b
Based
on
average
daily
shares
outstanding.
c
Benefit
of
waiver
and
payments
by
affiliates
rounds
to
less
than
0.01%.
d
Benefit
of
expense
reduction
rounds
to
less
than
0.01%.
e
Excludes
the
value
of
portfolio
activity
as
a
result
of
in-kind
transactions.
Franklin
Custodian
Funds
Financial
Highlights
Franklin
Growth
Fund
(continued)
Annual
Report
The
accompanying
notes
are
an
integral
part
of
these
financial
statements.
a
Year
Ended
September
30,
2024
2023
2022
2021
2020
Class
R6
Per
share
operating
performance
(for
a
share
outstanding
throughout
the
year)
Net
asset
value,
beginning
of
year
...................
$116.16
$106.22
$152.40
$130.31
$110.37
Income
from
investment
operations
a
:
Net
investment
income
b
.........................
0.52
0.56
0.46
0.41
0.71
Net
realized
and
unrealized
gains
(losses)
...........
38.60
20.34
(32.72)
32.76
26.06
Total
from
investment
operations
....................
39.12
20.90
(32.26)
33.17
26.77
Less
distributions
from:
Net
investment
income
..........................
(0.61)
(0.25)
(0.10)
(0.47)
(0.84)
Net
realized
gains
.............................
(7.45)
(10.71)
(13.82)
(10.61)
(5.99)
Total
distributions
...............................
(8.06)
(10.96)
(13.92)
(11.08)
(6.83)
Net
asset
value,
end
of
year
.......................
$147.22
$116.16
$106.22
$152.40
$130.31
Total
return
....................................
35.14%
20.83%
(23.57)%
26.86%
25.51%
Ratios
to
average
net
assets
Expenses
c
.....................................
0.46%
0.47%
d
0.46%
d
0.47%
d
0.48%
d
Net
investment
income
...........................
0.39%
0.49%
0.34%
0.29%
0.63%
Supplemental
data
Net
assets,
end
of
year
(000’s)
.....................
$2,735,878
$2,114,155
$2,000,923
$3,113,946
$2,999,370
Portfolio
turnover
rate
............................
7.35%
2.86%
4.95%
e
6.04%
e
9.01%
a
The
amount
shown
for
a
share
outstanding
throughout
the
period
may
not
correlate
with
the
Statement
of
Operations
for
the
period
due
to
the
timing
of
sales
and
repurchases
of
the
Fund’s
shares
in
relation
to
income
earned
and/or
fluctuating
fair
value
of
the
investments
of
the
Fund.
b
Based
on
average
daily
shares
outstanding.
c
Benefit
of
waiver
and
payments
by
affiliates
rounds
to
less
than
0.01%.
d
Benefit
of
expense
reduction
rounds
to
less
than
0.01%.
e
Excludes
the
value
of
portfolio
activity
as
a
result
of
in-kind
transactions.
Franklin
Custodian
Funds
Financial
Highlights
Franklin
Growth
Fund
(continued)
The
accompanying
notes
are
an
integral
part
of
these
financial
statements.
Annual
Report
a
Year
Ended
September
30,
2024
2023
2022
2021
2020
Advisor
Class
Per
share
operating
performance
(for
a
share
outstanding
throughout
the
year)
Net
asset
value,
beginning
of
year
...................
$116.21
$106.25
$152.47
$130.38
$110.41
Income
from
investment
operations
a
:
Net
investment
income
b
.........................
0.42
0.47
0.34
0.30
0.62
Net
realized
and
unrealized
gains
(losses)
...........
38.62
20.36
(32.74)
32.79
26.07
Total
from
investment
operations
....................
39.04
20.83
(32.40)
33.09
26.69
Less
distributions
from:
Net
investment
income
..........................
(0.52)
(0.16)
—
(0.39)
(0.73)
Net
realized
gains
.............................
(7.45)
(10.71)
(13.82)
(10.61)
(5.99)
Total
distributions
...............................
(7.97)
(10.87)
(13.82)
(11.00)
(6.72)
Net
asset
value,
end
of
year
.......................
$147.28
$116.21
$106.25
$152.47
$130.38
Total
return
....................................
35.04%
20.73%
(23.64)%
26.76%
25.41%
Ratios
to
average
net
assets
Expenses
before
waiver
and
payments
by
affiliates
......
0.54%
0.55%
0.55%
0.54%
0.57%
Expenses
net
of
waiver
and
payments
by
affiliates
.......
0.54%
c
0.55%
c,d
0.55%
c,d
0.54%
c,d
0.56%
d
Net
investment
income
...........................
0.32%
0.42%
0.25%
0.21%
0.54%
Supplemental
data
Net
assets,
end
of
year
(000’s)
.....................
$3,353,961
$2,860,970
$2,652,765
$4,229,679
$3,549,412
Portfolio
turnover
rate
............................
7.35%
2.86%
4.95%
e
6.04%
e
9.01%
a
The
amount
shown
for
a
share
outstanding
throughout
the
period
may
not
correlate
with
the
Statement
of
Operations
for
the
period
due
to
the
timing
of
sales
and
repurchases
of
the
Fund’s
shares
in
relation
to
income
earned
and/or
fluctuating
fair
value
of
the
investments
of
the
Fund.
b
Based
on
average
daily
shares
outstanding.
c
Benefit
of
waiver
and
payments
by
affiliates
rounds
to
less
than
0.01%.
d
Benefit
of
expense
reduction
rounds
to
less
than
0.01%.
e
Excludes
the
value
of
portfolio
activity
as
a
result
of
in-kind
transactions.
Schedule
of
Investments,
September
30,
2024
Franklin
Growth
Fund
Annual
Report
The
accompanying
notes
are
an
integral
part
of
these
financial
statements.
a
a
Country
Shares
a
Value
a
a
a
a
a
a
Common
Stocks
98.1%
Aerospace
&
Defense
4.3%
BWX
Technologies,
Inc.
..............................
United
States
1,344,011
$
146,093,996
Curtiss-Wright
Corp.
.................................
United
States
244,600
80,397,574
Lockheed
Martin
Corp.
...............................
United
States
202,955
118,639,375
Northrop
Grumman
Corp.
.............................
United
States
562,697
297,143,405
RTX
Corp.
........................................
United
States
1,505,110
182,359,127
824,633,477
Beverages
2.4%
Constellation
Brands,
Inc.
,
A
...........................
United
States
452,178
116,521,749
a
Monster
Beverage
Corp.
..............................
United
States
3,914,026
204,194,737
PepsiCo,
Inc.
......................................
United
States
813,145
138,275,307
458,991,793
Biotechnology
1.8%
AbbVie,
Inc.
.......................................
United
States
435,787
86,059,217
Amgen,
Inc.
.......................................
United
States
576,436
185,733,443
a
Regeneron
Pharmaceuticals,
Inc.
.......................
United
States
72,246
75,947,885
347,740,545
Broadline
Retail
4.4%
a
Amazon.com,
Inc.
...................................
United
States
4,539,124
845,774,975
Building
Products
2.0%
Trane
Technologies
plc
...............................
United
States
989,869
384,791,776
Capital
Markets
4.7%
BlackRock,
Inc.
.....................................
United
States
123,820
117,568,328
Blackstone,
Inc.
....................................
United
States
798,607
122,290,690
Charles
Schwab
Corp.
(The)
...........................
United
States
2,102,782
136,281,301
Intercontinental
Exchange,
Inc.
.........................
United
States
1,350,590
216,958,778
S&P
Global,
Inc.
....................................
United
States
350,525
181,088,226
Tradeweb
Markets,
Inc.
,
A
.............................
United
States
1,129,220
139,650,637
913,837,960
Chemicals
3.1%
Air
Products
and
Chemicals,
Inc.
........................
United
States
473,767
141,059,387
Ecolab,
Inc.
........................................
United
States
590,978
150,894,413
Linde
plc
..........................................
United
States
664,827
317,029,403
608,983,203
Commercial
Services
&
Supplies
0.6%
Republic
Services,
Inc.
,
A
.............................
United
States
616,799
123,877,911
Construction
Materials
0.9%
Martin
Marietta
Materials,
Inc.
..........................
United
States
334,397
179,989,185
Consumer
Staples
Distribution
&
Retail
1.2%
Costco
Wholesale
Corp.
..............................
United
States
253,449
224,687,608
Electric
Utilities
1.1%
NextEra
Energy,
Inc.
.................................
United
States
2,555,446
216,011,850
Electrical
Equipment
1.4%
AMETEK,
Inc.
......................................
United
States
674,967
115,898,584
Eaton
Corp.
plc
.....................................
United
States
437,964
145,158,788
261,057,372
Electronic
Equipment,
Instruments
&
Components
1.7%
Amphenol
Corp.
,
A
..................................
United
States
4,932,630
321,410,171
Franklin
Custodian
Funds
Schedule
of
Investments
Franklin
Growth
Fund
(continued)
The
accompanying
notes
are
an
integral
part
of
these
financial
statements.
Annual
Report
a
a
Country
Shares
a
Value
a
a
a
a
a
a
Common
Stocks
(continued)
Financial
Services
3.9%
Mastercard,
Inc.
,
A
..................................
United
States
964,326
$
476,184,179
Visa,
Inc.
,
A
........................................
United
States
1,011,118
278,006,894
754,191,073
Ground
Transportation
3.0%
Canadian
Pacific
Kansas
City
Ltd.
.......................
Canada
1,346,949
115,218,018
Old
Dominion
Freight
Line,
Inc.
.........................
United
States
383,100
76,098,984
a
Uber
Technologies,
Inc.
...............................
United
States
557,439
41,897,115
Union
Pacific
Corp.
..................................
United
States
1,433,210
353,257,601
586,471,718
Health
Care
Equipment
&
Supplies
3.7%
Abbott
Laboratories
..................................
United
States
741,502
84,538,643
a
Edwards
Lifesciences
Corp.
...........................
United
States
966,324
63,767,721
a
Intuitive
Surgical,
Inc.
................................
United
States
878,240
431,452,965
Stryker
Corp.
......................................
United
States
388,847
140,474,867
720,234,196
Health
Care
Providers
&
Services
1.3%
UnitedHealth
Group,
Inc.
..............................
United
States
442,515
258,729,670
Health
Care
Technology
0.4%
a
Veeva
Systems,
Inc.
,
A
...............................
United
States
408,813
85,797,584
Hotels,
Restaurants
&
Leisure
1.7%
a
Airbnb,
Inc.
,
A
......................................
United
States
579,890
73,535,851
Booking
Holdings,
Inc.
...............................
United
States
28,173
118,668,057
a
Chipotle
Mexican
Grill,
Inc.
,
A
..........................
United
States
2,460,000
141,745,200
333,949,108
Industrial
REITs
0.6%
Prologis,
Inc.
.......................................
United
States
840,900
106,188,852
Interactive
Media
&
Services
3.8%
Alphabet,
Inc.
,
A
....................................
United
States
2,056,520
341,073,842
Alphabet,
Inc.
,
C
....................................
United
States
2,401,900
401,573,661
742,647,503
IT
Services
2.0%
a,b,c
Canva,
Inc.
,
B
......................................
Australia
25,413
31,148,647
a
MongoDB,
Inc.
,
A
...................................
United
States
186,200
50,339,170
a
Shopify,
Inc.
,
A
.....................................
Canada
411,700
32,993,638
TE
Connectivity
plc
..................................
Ireland
1,770,857
267,381,699
381,863,154
Life
Sciences
Tools
&
Services
5.3%
Agilent
Technologies,
Inc.
.............................
United
States
1,038,568
154,206,577
Danaher
Corp.
.....................................
United
States
1,132,672
314,905,470
a
Mettler-Toledo
International,
Inc.
........................
United
States
149,209
223,768,737
Thermo
Fisher
Scientific,
Inc.
..........................
United
States
370,334
229,077,502
West
Pharmaceutical
Services,
Inc.
......................
United
States
358,800
107,697,408
1,029,655,694
Machinery
3.6%
Deere
&
Co.
.......................................
United
States
353,851
147,672,638
Illinois
Tool
Works,
Inc.
...............................
United
States
753,519
197,474,724
Ingersoll
Rand,
Inc.
..................................
United
States
1,980,276
194,383,892
Parker-Hannifin
Corp.
................................
United
States
48,700
30,769,634
Franklin
Custodian
Funds
Schedule
of
Investments
Franklin
Growth
Fund
(continued)
Annual
Report
The
accompanying
notes
are
an
integral
part
of
these
financial
statements.
a
a
Country
Shares
a
Value
a
a
a
a
a
a
Common
Stocks
(continued)
Machinery
(continued)
Xylem,
Inc.
........................................
United
States
983,901
$
132,856,152
703,157,040
Pharmaceuticals
2.9%
AstraZeneca
plc
,
ADR
................................
United
Kingdom
2,110,216
164,406,929
Eli
Lilly
&
Co.
......................................
United
States
456,384
404,328,841
568,735,770
Professional
Services
0.4%
Automatic
Data
Processing,
Inc.
........................
United
States
105,229
29,120,021
Verisk
Analytics,
Inc.
,
A
...............................
United
States
178,221
47,756,099
76,876,120
Semiconductors
&
Semiconductor
Equipment
12.8%
a,d
ARM
Holdings
plc
,
ADR
..............................
United
States
356,500
50,983,065
ASML
Holding
NV
,
ADR
..............................
Netherlands
388,894
324,045,926
Lam
Research
Corp.
.................................
United
States
28,550
23,299,084
a
Lattice
Semiconductor
Corp.
...........................
United
States
695,800
36,926,106
Monolithic
Power
Systems,
Inc.
.........................
United
States
359,745
332,584,252
NVIDIA
Corp.
......................................
United
States
10,506,670
1,275,930,005
NXP
Semiconductors
NV
.............................
China
665,330
159,685,853
Texas
Instruments,
Inc.
...............................
United
States
1,326,618
274,039,480
2,477,493,771
Software
16.9%
a
Adobe,
Inc.
........................................
United
States
143,493
74,297,806
a
Autodesk,
Inc.
......................................
United
States
790,713
217,825,617
a,b,c
Checkout
Payments
Group
Ltd.
,
B
.......................
United
Kingdom
96,603
8,855,741
a
Crowdstrike
Holdings,
Inc.
,
A
...........................
United
States
132,753
37,233,234
Intuit,
Inc.
.........................................
United
States
710,431
441,177,651
Microsoft
Corp.
.....................................
United
States
2,793,768
1,202,158,370
a
PTC,
Inc.
.........................................
United
States
1,026,515
185,450,200
Salesforce,
Inc.
.....................................
United
States
534,162
146,205,481
a
ServiceNow,
Inc.
....................................
United
States
524,995
469,550,278
a,b,c
Stripe,
Inc.
,
B
......................................
United
States
540,043
14,879,583
a
Synopsys,
Inc.
.....................................
United
States
537,220
272,042,836
a
Tyler
Technologies,
Inc.
...............................
United
States
114,252
66,691,177
a
Workday,
Inc.
,
A
....................................
United
States
546,901
133,668,073
3,270,036,047
Technology
Hardware,
Storage
&
Peripherals
4.0%
Apple,
Inc.
........................................
United
States
3,279,793
764,191,769
Textiles,
Apparel
&
Luxury
Goods
0.8%
NIKE,
Inc.
,
B
.......................................
United
States
1,757,536
155,366,182
Trading
Companies
&
Distributors
1.0%
Fastenal
Co.
.......................................
United
States
2,605,313
186,071,454
Water
Utilities
0.4%
American
Water
Works
Co.,
Inc.
........................
United
States
579,967
84,814,374
Total
Common
Stocks
(Cost
$
4,532,212,581
)
..................................
18,998,258,905
Convertible
Preferred
Stocks
0.6%
IT
Services
0.0%
†
a,b,c
Canva,
Inc.
,
A
......................................
Australia
2,353
2,884,066
a,b,c
Canva,
Inc.
,
A-3
....................................
Australia
94
115,216
Franklin
Custodian
Funds
Schedule
of
Investments
Franklin
Growth
Fund
(continued)
The
accompanying
notes
are
an
integral
part
of
these
financial
statements.
Annual
Report
See
Abbreviations
on
page
100
.
a
a
Country
Shares
a
Value
a
a
a
a
a
a
Convertible
Preferred
Stocks
(continued)
IT
Services
(continued)
a,b,c
Canva,
Inc.
,
A-4
....................................
Australia
8
$
9,806
a,b,c
Canva,
Inc.
,
A-5
....................................
Australia
5
6,128
3,015,216
Software
0.5%
a,b,c
Gusto,
Inc.
,
E
......................................
United
States
822,494
26,007,722
a,b,c
OneTrust
LLC
,
C
....................................
United
States
849,894
14,987,106
a,b,c
Stripe,
Inc.
,
I
.......................................
United
States
1,759,545
48,480,020
89,474,848
Trading
Companies
&
Distributors
0.1%
a,b,c
Anduril
Industries,
Inc.
,
F
..............................
United
States
1,150,134
25,000,003
a
Total
Convertible
Preferred
Stocks
(Cost
$
106,287,288
)
........................
117,490,067
Preferred
Stocks
0.7%
Life
Sciences
Tools
&
Services
0.7%
e
Sartorius
AG
,
0.29
%
.................................
Germany
475,000
133,572,335
Total
Preferred
Stocks
(Cost
$
164,568,096
)
...................................
133,572,335
Total
Long
Term
Investments
(Cost
$
4,803,067,965
)
...........................
19,249,321,307
a
Short
Term
Investments
0.7%
a
a
Country
Shares
a
Value
a
a
a
a
a
a
Money
Market
Funds
0.7%
f,g
Institutional
Fiduciary
Trust
-
Money
Market
Portfolio
,
4.74
%
...
United
States
132,381,860
132,381,860
Total
Money
Market
Funds
(Cost
$
132,381,860
)
...............................
132,381,860
h
Investments
from
Cash
Collateral
Received
for
Loaned
Securities
0.0%
†
Money
Market
Funds
0.0%
†
f,g
Institutional
Fiduciary
Trust
-
Money
Market
Portfolio
,
4.74
%
...
United
States
3,085,000
3,085,000
Total
Investments
from
Cash
Collateral
Received
for
Loaned
Securities
(Cost
$
3,085,000
)
..........................................................
3,085,000
Total
Short
Term
Investments
(Cost
$
135,466,860
)
.............................
135,466,860
a
Total
Investments
(Cost
$
4,938,534,825
)
100.1
%
..............................
$19,384,788,167
Other
Assets,
less
Liabilities
(
0.1
)
%
.........................................
(14,400,221)
Net
Assets
100.0%
.........................................................
$19,370,387,946
a
a
a
†
Rounds
to
less
than
0.1%
of
net
assets.
a
Non-income
producing.
b
Fair
valued
using
significant
unobservable
inputs.
See
Note
12
regarding
fair
value
measurements.
c
See
Note
7
regarding
restricted
securities.
d
A
portion
or
all
of
the
security
is
on
loan
at
September
30,
2024.
See
Note
1
(
e
).
Franklin
Custodian
Funds
Schedule
of
Investments
Franklin
Growth
Fund
(continued)
Annual
Report
The
accompanying
notes
are
an
integral
part
of
these
financial
statements.
e
Variable
rate
security.
The
rate
shown
represents
the
yield
at
period
end.
f
See
Note
3
(
f
)
regarding
investments
in
affiliated
management
investment
companies.
g
The
rate
shown
is
the
annualized
seven-day
effective
yield
at
period
end.
h
See
Note
1
(
e
)
regarding
securities
on
loan.
Financial
Highlights
Franklin
Income
Fund
The
accompanying
notes
are
an
integral
part
of
these
financial
statements.
Annual
Report
a
Year
Ended
September
30,
2024
2023
2022
2021
2020
Class
A
Per
share
operating
performance
(for
a
share
outstanding
throughout
the
year)
Net
asset
value,
beginning
of
year
...................
$2.19
$2.14
$2.47
$2.08
$2.30
Income
from
investment
operations
a
:
Net
investment
income
b
.........................
0.09
0.09
0.07
0.08
0.08
Net
realized
and
unrealized
gains
(losses)
...........
0.30
0.09
(0.24)
0.42
(0.18)
Total
from
investment
operations
....................
0.39
0.18
(0.17)
0.50
(0.10)
Less
distributions
from:
Net
investment
income
..........................
(0.13)
(0.13)
(0.11)
(0.11)
(0.12)
Net
realized
gains
.............................
—
—
(0.05)
—
—
Total
distributions
...............................
(0.13)
(0.13)
(0.16)
(0.11)
(0.12)
Net
asset
value,
end
of
year
.......................
$2.45
$2.19
$2.14
$2.47
$2.08
Total
return
c
...................................
18.33%
8.33%
(7.28)%
24.55%
(4.48)%
Ratios
to
average
net
assets
Expenses
before
waiver
and
payments
by
affiliates
......
0.71%
0.71%
0.72%
0.72%
0.71%
Expenses
net
of
waiver
and
payments
by
affiliates
.......
0.70%
0.71%
d
0.71%
e
0.72%
d,e
0.70%
e
Net
investment
income
...........................
4.04%
4.02%
3.08%
3.19%
3.64%
Supplemental
data
Net
assets,
end
of
year
(000’s)
.....................
$23,331,018
$19,705,319
$16,829,899
$16,044,379
$10,072,437
Portfolio
turnover
rate
............................
49.72%
56.23%
77.65%
68.93%
69.13%
a
The
amount
shown
for
a
share
outstanding
throughout
the
period
may
not
correlate
with
the
Statement
of
Operations
for
the
period
due
to
the
timing
of
sales
and
repurchases
of
the
Fund’s
shares
in
relation
to
income
earned
and/or
fluctuating
fair
value
of
the
investments
of
the
Fund.
b
Based
on
average
daily
shares
outstanding.
c
Total
return
does
not
reflect
sales
commissions
or
contingent
deferred
sales
charges,
if
applicable.
d
Benefit
of
waiver
and
payments
by
affiliates
rounds
to
less
than
0.01%.
e
Benefit
of
expense
reduction
rounds
to
less
than
0.01%.
Franklin
Custodian
Funds
Financial
Highlights
Franklin
Income
Fund
(continued)
Annual
Report
The
accompanying
notes
are
an
integral
part
of
these
financial
statements.
a
Year
Ended
September
30,
2024
2023
2022
2021
2020
Class
A1
Per
share
operating
performance
(for
a
share
outstanding
throughout
the
year)
Net
asset
value,
beginning
of
year
...................
$2.20
$2.15
$2.48
$2.08
$2.30
Income
from
investment
operations
a
:
Net
investment
income
b
.........................
0.10
0.09
0.08
0.08
0.08
Net
realized
and
unrealized
gains
(losses)
...........
0.28
0.09
(0.24)
0.43
(0.18)
Total
from
investment
operations
....................
0.38
0.18
(0.16)
0.51
(0.10)
Less
distributions
from:
Net
investment
income
..........................
(0.13)
(0.13)
(0.12)
(0.11)
(0.12)
Net
realized
gains
.............................
—
—
(0.05)
—
—
Total
distributions
...............................
(0.13)
(0.13)
(0.17)
(0.11)
(0.12)
Net
asset
value,
end
of
year
.......................
$2.45
$2.20
$2.15
$2.48
$2.08
Total
return
c
...................................
17.91%
8.43%
(7.10)%
25.19%
(4.39)%
Ratios
to
average
net
assets
Expenses
before
waiver
and
payments
by
affiliates
......
0.61%
0.61%
0.62%
0.62%
0.61%
Expenses
net
of
waiver
and
payments
by
affiliates
.......
0.60%
0.61%
d
0.61%
e
0.62%
d,e
0.60%
e
Net
investment
income
...........................
4.15%
4.11%
3.15%
3.32%
3.74%
Supplemental
data
Net
assets,
end
of
year
(000’s)
.....................
$30,981,936
$29,633,019
$30,236,582
$35,704,730
$32,693,224
Portfolio
turnover
rate
............................
49.72%
56.23%
77.65%
68.93%
69.13%
a
The
amount
shown
for
a
share
outstanding
throughout
the
period
may
not
correlate
with
the
Statement
of
Operations
for
the
period
due
to
the
timing
of
sales
and
repurchases
of
the
Fund’s
shares
in
relation
to
income
earned
and/or
fluctuating
fair
value
of
the
investments
of
the
Fund.
b
Based
on
average
daily
shares
outstanding.
c
Total
return
does
not
reflect
sales
commissions
or
contingent
deferred
sales
charges,
if
applicable.
d
Benefit
of
waiver
and
payments
by
affiliates
rounds
to
less
than
0.01%.
e
Benefit
of
expense
reduction
rounds
to
less
than
0.01%.
Franklin
Custodian
Funds
Financial
Highlights
Franklin
Income
Fund
(continued)
The
accompanying
notes
are
an
integral
part
of
these
financial
statements.
Annual
Report
a
Year
Ended
September
30,
2024
2023
2022
2021
2020
Class
C
Per
share
operating
performance
(for
a
share
outstanding
throughout
the
year)
Net
asset
value,
beginning
of
year
...................
$2.24
$2.19
$2.52
$2.12
$2.34
Income
from
investment
operations
a
:
Net
investment
income
b
.........................
0.09
0.08
0.07
0.07
0.07
Net
realized
and
unrealized
gains
(losses)
...........
0.29
0.09
(0.25)
0.43
(0.18)
Total
from
investment
operations
....................
0.38
0.17
(0.18)
0.50
(0.11)
Less
distributions
from:
Net
investment
income
..........................
(0.12)
(0.12)
(0.10)
(0.10)
(0.11)
Net
realized
gains
.............................
—
—
(0.05)
—
—
Total
distributions
...............................
(0.12)
(0.12)
(0.15)
(0.10)
(0.11)
Net
asset
value,
end
of
year
.......................
$2.50
$2.24
$2.19
$2.52
$2.12
Total
return
c
...................................
17.43%
8.19%
(7.89)%
24.09%
(4.80)%
Ratios
to
average
net
assets
Expenses
before
waiver
and
payments
by
affiliates
......
1.11%
1.11%
1.12%
1.13%
1.11%
Expenses
net
of
waiver
and
payments
by
affiliates
.......
1.10%
1.11%
d
1.11%
e
1.12%
e
1.10%
e
Net
investment
income
...........................
3.65%
3.61%
2.63%
2.84%
3.24%
Supplemental
data
Net
assets,
end
of
year
(000’s)
.....................
$4,549,815
$4,905,480
$5,654,802
$7,507,658
$9,339,238
Portfolio
turnover
rate
............................
49.72%
56.23%
77.65%
68.93%
69.13%
a
The
amount
shown
for
a
share
outstanding
throughout
the
period
may
not
correlate
with
the
Statement
of
Operations
for
the
period
due
to
the
timing
of
sales
and
repurchases
of
the
Fund’s
shares
in
relation
to
income
earned
and/or
fluctuating
fair
value
of
the
investments
of
the
Fund.
b
Based
on
average
daily
shares
outstanding.
c
Total
return
does
not
reflect
sales
commissions
or
contingent
deferred
sales
charges,
if
applicable.
d
Benefit
of
waiver
and
payments
by
affiliates
rounds
to
less
than
0.01%.
e
Benefit
of
expense
reduction
rounds
to
less
than
0.01%.
Franklin
Custodian
Funds
Financial
Highlights
Franklin
Income
Fund
(continued)
Annual
Report
The
accompanying
notes
are
an
integral
part
of
these
financial
statements.
a
Year
Ended
September
30,
2024
2023
2022
2021
2020
Class
R
Per
share
operating
performance
(for
a
share
outstanding
throughout
the
year)
Net
asset
value,
beginning
of
year
...................
$2.15
$2.10
$2.43
$2.04
$2.26
Income
from
investment
operations
a
:
Net
investment
income
b
.........................
0.09
0.08
0.07
0.07
0.07
Net
realized
and
unrealized
gains
(losses)
...........
0.27
0.09
(0.24)
0.43
(0.18)
Total
from
investment
operations
....................
0.36
0.17
(0.17)
0.50
(0.11)
Less
distributions
from:
Net
investment
income
..........................
(0.12)
(0.12)
(0.11)
(0.11)
(0.11)
Net
realized
gains
.............................
—
—
(0.05)
—
—
Total
distributions
...............................
(0.12)
(0.12)
(0.16)
(0.11)
(0.11)
Net
asset
value,
end
of
year
.......................
$2.39
$2.15
$2.10
$2.43
$2.04
Total
return
....................................
17.41%
8.21%
(7.61)%
24.75%
(4.82)%
Ratios
to
average
net
assets
Expenses
before
waiver
and
payments
by
affiliates
......
0.96%
0.96%
0.97%
0.97%
0.96%
Expenses
net
of
waiver
and
payments
by
affiliates
.......
0.95%
0.96%
c
0.96%
d
0.97%
c,d
0.95%
d
Net
investment
income
...........................
3.80%
3.77%
2.84%
2.97%
3.40%
Supplemental
data
Net
assets,
end
of
year
(000’s)
.....................
$334,157
$300,283
$270,060
$257,109
$221,584
Portfolio
turnover
rate
............................
49.72%
56.23%
77.65%
68.93%
69.13%
a
The
amount
shown
for
a
share
outstanding
throughout
the
period
may
not
correlate
with
the
Statement
of
Operations
for
the
period
due
to
the
timing
of
sales
and
repurchases
of
the
Fund’s
shares
in
relation
to
income
earned
and/or
fluctuating
fair
value
of
the
investments
of
the
Fund.
b
Based
on
average
daily
shares
outstanding.
c
Benefit
of
waiver
and
payments
by
affiliates
rounds
to
less
than
0.01%.
d
Benefit
of
expense
reduction
rounds
to
less
than
0.01%.
Franklin
Custodian
Funds
Financial
Highlights
Franklin
Income
Fund
(continued)
The
accompanying
notes
are
an
integral
part
of
these
financial
statements.
Annual
Report
a
Year
Ended
September
30,
2024
2023
2022
2021
2020
Class
R6
Per
share
operating
performance
(for
a
share
outstanding
throughout
the
year)
Net
asset
value,
beginning
of
year
...................
$2.19
$2.14
$2.47
$2.07
$2.29
Income
from
investment
operations
a
:
Net
investment
income
b
.........................
0.10
0.10
0.08
0.08
0.09
Net
realized
and
unrealized
gains
(losses)
...........
0.28
0.09
(0.24)
0.44
(0.19)
Total
from
investment
operations
....................
0.38
0.19
(0.16)
0.52
(0.10)
Less
distributions
from:
Net
investment
income
..........................
(0.13)
(0.14)
(0.12)
(0.12)
(0.12)
Net
realized
gains
.............................
—
—
(0.05)
—
—
Total
distributions
...............................
(0.13)
(0.14)
(0.17)
(0.12)
(0.12)
Net
asset
value,
end
of
year
.......................
$2.44
$2.19
$2.14
$2.47
$2.07
Total
return
....................................
18.18%
9.17%
(7.38)%
25.53%
(4.23)%
Ratios
to
average
net
assets
Expenses
before
waiver
and
payments
by
affiliates
......
0.41%
0.41%
0.42%
0.43%
0.40%
Expenses
net
of
waiver
and
payments
by
affiliates
.......
0.40%
0.40%
0.40%
c
0.41%
c
0.39%
c
Net
investment
income
...........................
4.35%
4.35%
3.43%
3.50%
3.96%
Supplemental
data
Net
assets,
end
of
year
(000’s)
.....................
$1,938,998
$1,662,931
$1,158,685
$748,355
$1,626,735
Portfolio
turnover
rate
............................
49.72%
56.23%
77.65%
68.93%
69.13%
a
The
amount
shown
for
a
share
outstanding
throughout
the
period
may
not
correlate
with
the
Statement
of
Operations
for
the
period
due
to
the
timing
of
sales
and
repurchases
of
the
Fund’s
shares
in
relation
to
income
earned
and/or
fluctuating
fair
value
of
the
investments
of
the
Fund.
b
Based
on
average
daily
shares
outstanding.
c
Benefit
of
expense
reduction
rounds
to
less
than
0.01%.
Franklin
Custodian
Funds
Financial
Highlights
Franklin
Income
Fund
(continued)
Annual
Report
The
accompanying
notes
are
an
integral
part
of
these
financial
statements.
a
Year
Ended
September
30,
2024
2023
2022
2021
2020
Advisor
Class
Per
share
operating
performance
(for
a
share
outstanding
throughout
the
year)
Net
asset
value,
beginning
of
year
...................
$2.18
$2.13
$2.46
$2.07
$2.28
Income
from
investment
operations
a
:
Net
investment
income
b
.........................
0.10
0.10
0.08
0.08
0.08
Net
realized
and
unrealized
gains
(losses)
...........
0.28
0.09
(0.24)
0.43
(0.17)
Total
from
investment
operations
....................
0.38
0.19
(0.16)
0.51
(0.09)
Less
distributions
from:
Net
investment
income
..........................
(0.13)
(0.14)
(0.12)
(0.12)
(0.12)
Net
realized
gains
.............................
—
—
(0.05)
—
—
Total
distributions
...............................
(0.13)
(0.14)
(0.17)
(0.12)
(0.12)
Net
asset
value,
end
of
year
.......................
$2.43
$2.18
$2.13
$2.46
$2.07
Total
return
....................................
18.20%
9.16%
(7.44)%
24.98%
(3.86)%
Ratios
to
average
net
assets
Expenses
before
waiver
and
payments
by
affiliates
......
0.46%
0.46%
0.47%
0.47%
0.46%
Expenses
net
of
waiver
and
payments
by
affiliates
.......
0.45%
0.46%
c
0.46%
d
0.47%
c,d
0.45%
d
Net
investment
income
...........................
4.30%
4.27%
3.32%
3.46%
3.89%
Supplemental
data
Net
assets,
end
of
year
(000’s)
.....................
$14,603,259
$12,941,766
$11,638,757
$11,969,691
$9,712,076
Portfolio
turnover
rate
............................
49.72%
56.23%
77.65%
68.93%
69.13%
a
The
amount
shown
for
a
share
outstanding
throughout
the
period
may
not
correlate
with
the
Statement
of
Operations
for
the
period
due
to
the
timing
of
sales
and
repurchases
of
the
Fund’s
shares
in
relation
to
income
earned
and/or
fluctuating
fair
value
of
the
investments
of
the
Fund.
b
Based
on
average
daily
shares
outstanding.
c
Benefit
of
waiver
and
payments
by
affiliates
rounds
to
less
than
0.01%.
d
Benefit
of
expense
reduction
rounds
to
less
than
0.01%.
Schedule
of
Investments,
September
30,
2024
Franklin
Income
Fund
The
accompanying
notes
are
an
integral
part
of
these
financial
statements.
Annual
Report
a
a
Country
Shares
a
Value
a
a
a
a
a
a
Common
Stocks
22.3%
Aerospace
&
Defense
1.3%
a,b
Boeing
Co.
(The)
...................................
United
States
1,000,000
$
152,040,000
b
Lockheed
Martin
Corp.
...............................
United
States
1,250,000
730,700,000
RTX
Corp.
........................................
United
States
950,000
115,102,000
997,842,000
Air
Freight
&
Logistics
0.3%
United
Parcel
Service,
Inc.,
B
..........................
United
States
1,500,000
204,510,000
Banks
1.9%
b
Bank
of
America
Corp.
...............................
United
States
8,000,000
317,440,000
b
Citigroup,
Inc.
......................................
United
States
2,500,000
156,500,000
Fifth
Third
Bancorp
..................................
United
States
4,000,000
171,360,000
b
JPMorgan
Chase
&
Co.
...............................
United
States
1,000,000
210,860,000
PNC
Financial
Services
Group,
Inc.
(The)
.................
United
States
1,250,000
231,062,500
Truist
Financial
Corp.
................................
United
States
1,000,000
42,770,000
US
Bancorp
.......................................
United
States
5,814,951
265,917,709
1,395,910,209
Beverages
1.4%
Coca-Cola
Co.
(The)
.................................
United
States
3,000,000
215,580,000
b
PepsiCo,
Inc.
......................................
United
States
5,000,000
850,250,000
1,065,830,000
Biotechnology
0.2%
b
Amgen,
Inc.
.......................................
United
States
500,000
161,105,000
Chemicals
0.7%
Air
Products
and
Chemicals,
Inc.
........................
United
States
1,000,000
297,740,000
Albemarle
Corp.
....................................
United
States
1,000,000
94,710,000
LyondellBasell
Industries
NV,
A
.........................
United
States
1,700,000
163,030,000
555,480,000
Communications
Equipment
0.5%
Cisco
Systems,
Inc.
.................................
United
States
7,395,000
393,561,900
Containers
&
Packaging
0.1%
International
Paper
Co.
...............................
United
States
1,000,000
48,850,000
Diversified
Telecommunication
Services
0.3%
Verizon
Communications,
Inc.
..........................
United
States
5,000,000
224,550,000
Electric
Utilities
2.9%
American
Electric
Power
Co.,
Inc.
.......................
United
States
2,000,000
205,200,000
b
Duke
Energy
Corp.
..................................
United
States
3,500,000
403,550,000
Edison
International
.................................
United
States
1,800,000
156,762,000
Entergy
Corp.
......................................
United
States
500,000
65,805,000
NextEra
Energy,
Inc.
.................................
United
States
5,300,975
448,091,417
Southern
Co.
(The)
..................................
United
States
8,000,000
721,440,000
Xcel
Energy,
Inc.
....................................
United
States
3,000,000
195,900,000
2,196,748,417
Energy
Equipment
&
Services
0.1%
Halliburton
Co.
.....................................
United
States
3,500,000
101,675,000
Ground
Transportation
0.6%
Union
Pacific
Corp.
..................................
United
States
1,750,000
431,340,000
Health
Care
Equipment
&
Supplies
0.3%
b
Abbott
Laboratories
..................................
United
States
500,000
57,005,000
Medtronic
plc
......................................
United
States
2,000,000
180,060,000
237,065,000
Franklin
Custodian
Funds
Schedule
of
Investments
Franklin
Income
Fund
(continued)
Annual
Report
The
accompanying
notes
are
an
integral
part
of
these
financial
statements.
a
a
Country
Shares
a
Value
a
a
a
a
a
a
Common
Stocks
(continued)
Health
Care
Providers
&
Services
0.4%
b
CVS
Health
Corp.
...................................
United
States
5,000,000
$
314,400,000
Household
Products
1.2%
b
Procter
&
Gamble
Co.
(The)
...........................
United
States
5,000,000
866,000,000
Industrial
Conglomerates
0.4%
b
Honeywell
International,
Inc.
...........................
United
States
1,500,000
310,065,000
IT
Services
0.2%
b
International
Business
Machines
Corp.
...................
United
States
750,000
165,810,000
Machinery
0.1%
Illinois
Tool
Works,
Inc.
...............................
United
States
300,000
78,621,000
Media
0.2%
Comcast
Corp.,
A
...................................
United
States
4,000,000
167,080,000
Metals
&
Mining
0.4%
Fortescue
Ltd.
......................................
Australia
5,000,000
70,533,101
b
Rio
Tinto
plc,
ADR
...................................
Australia
3,500,000
249,095,000
319,628,101
Multi-Utilities
0.7%
Dominion
Energy,
Inc.
................................
United
States
5,000,000
288,950,000
Sempra
...........................................
United
States
3,000,000
250,890,000
539,840,000
Oil,
Gas
&
Consumable
Fuels
3.8%
Chevron
Corp.
.....................................
United
States
7,500,000
1,104,525,000
ConocoPhillips
.....................................
United
States
3,500,000
368,480,000
Exxon
Mobil
Corp.
...................................
United
States
8,343,000
977,966,460
Shell
plc,
ADR
......................................
United
States
4,000,000
263,800,000
TotalEnergies
SE,
ADR
...............................
France
3,000,000
193,860,000
2,908,631,460
Pharmaceuticals
2.8%
a
Bausch
Health
Cos.,
Inc.
..............................
United
States
5,000,000
40,800,000
a,c
Endo,
Inc.
.........................................
United
States
4,484,322
114,260,525
Johnson
&
Johnson
.................................
United
States
8,000,000
1,296,480,000
Merck
&
Co.,
Inc.
...................................
United
States
3,000,000
340,680,000
Pfizer,
Inc.
.........................................
United
States
10,000,000
289,400,000
2,081,620,525
Semiconductors
&
Semiconductor
Equipment
0.2%
Analog
Devices,
Inc.
.................................
United
States
350,000
80,559,500
Microchip
Technology,
Inc.
............................
United
States
800,000
64,232,000
144,791,500
Specialty
Retail
0.8%
b
Home
Depot,
Inc.
(The)
...............................
United
States
1,488,300
603,059,160
Technology
Hardware,
Storage
&
Peripherals
0.0%
†
Dell
Technologies,
Inc.,
C
.............................
United
States
7,400
877,196
Tobacco
0.5%
Philip
Morris
International,
Inc.
.........................
United
States
3,000,000
364,200,000
Total
Common
Stocks
(Cost
$14,129,999,021)
.................................
16,879,091,468
Franklin
Custodian
Funds
Schedule
of
Investments
Franklin
Income
Fund
(continued)
The
accompanying
notes
are
an
integral
part
of
these
financial
statements.
Annual
Report
a
a
Country
Shares
a
Value
a
a
a
a
a
a
Management
Investment
Companies
0.5%
Capital
Markets
0.5%
d
Clarion
Partners
Real
Estate
Income
Fund,
Inc.,
Class
I
......
United
States
7,867,833
$
91,974,965
a,d,e,f
Franklin
BSP
Real
Estate
Credit
BDC
....................
United
States
10,254,325
265,381,931
357,356,896
Total
Management
Investment
Companies
(Cost
$361,158,594)
.................
357,356,896
g
Equity-Linked
Securities
19.2%
Aerospace
&
Defense
0.8%
h
Barclays
Bank
plc
into
Northrop
Grumman
Corp.,
144A,
7%,
11/08/24
........................................
United
States
315,000
166,984,584
h
Barclays
Bank
plc
into
RTX
Corp.,
144A,
7.5%,
10/16/25
......
United
States
2,100,000
251,511,935
h
Wells
Fargo
Bank
NA
into
Boeing
Co.
(The),
144A,
9%,
6/17/25
United
States
1,350,000
212,555,466
631,051,985
Air
Freight
&
Logistics
0.3%
h
J.P.
Morgan
Structured
Products
BV
into
United
Parcel
Service,
Inc.,
144A,
9%,
10/22/24
............................
United
States
1,530,000
214,563,060
Banks
1.6%
h
BNP
Paribas
Issuance
BV
into
Bank
of
America
Corp.,
144A,
8.5%,
2/26/25
....................................
United
States
6,800,000
248,087,684
h
JPMorgan
Chase
Bank
NA
into
Truist
Financial
Corp.,
144A,
9.5%,
3/02/26
....................................
United
States
5,400,000
233,622,338
h
Merrill
Lynch
International
&
Co.
CV
into
Fifth
Third
Bancorp,
144A,
10%,
3/10/25
................................
United
States
3,150,000
120,583,695
h
Royal
Bank
of
Canada
into
Citigroup,
Inc.,
144A,
8.5%,
8/27/25
.
United
States
3,700,000
228,714,703
h
Royal
Bank
of
Canada
into
Citigroup,
Inc.,
144A,
10%,
10/15/24
United
States
6,300,000
303,100,913
h
Royal
Bank
of
Canada
into
Truist
Financial
Corp.,
144A,
8.5%,
8/04/25
.........................................
United
States
2,420,000
104,975,764
1,239,085,097
Biotechnology
0.3%
h
Merrill
Lynch
International
&
Co.
CV
into
AbbVie,
Inc.,
144A,
7.5%,
4/23/25
....................................
United
States
1,385,000
266,020,849
Broadline
Retail
0.4%
h
Goldman
Sachs
International
Bank
into
Amazon.com,
Inc.,
144A,
9%,
11/20/24
.....................................
United
States
2,375,000
315,517,937
Building
Products
0.2%
h
Wells
Fargo
Bank
NA
into
Johnson
Controls
International
plc,
144A,
9%,
12/10/24
................................
United
States
2,450,000
142,357,385
Capital
Markets
0.9%
h
Goldman
Sachs
International
Bank
into
Morgan
Stanley,
144A,
9%,
12/24/24
.....................................
United
States
2,812,000
274,843,530
h
Merrill
Lynch
International
&
Co.
CV
into
Charles
Schwab
Corp.
(The),
144A,
9%,
2/25/25
............................
United
States
3,550,000
229,423,312
h
Merrill
Lynch
International
&
Co.
CV
into
Morgan
Stanley,
144A,
9%,
7/14/25
......................................
United
States
1,650,000
169,678,312
673,945,154
Chemicals
0.4%
h
Barclays
Bank
plc
into
Air
Products
and
Chemicals,
Inc.,
144A,
8.5%,
3/10/25
....................................
United
States
730,000
186,350,048
h
National
Bank
of
Canada
into
Albemarle
Corp.,
144A,
12%,
3/31/25
.........................................
United
States
830,000
82,522,887
268,872,935
Franklin
Custodian
Funds
Schedule
of
Investments
Franklin
Income
Fund
(continued)
Annual
Report
The
accompanying
notes
are
an
integral
part
of
these
financial
statements.
a
a
Country
Shares
a
Value
a
a
a
a
a
a
g
Equity-Linked
Securities
(continued)
Communications
Equipment
0.7%
h
Royal
Bank
of
Canada
into
Cisco
Systems,
Inc.,
144A,
8%,
9/17/25
.........................................
United
States
5,000,000
$
259,815,671
h
UBS
AG
into
Cisco
Systems,
Inc.,
144A,
8%,
6/10/25
........
United
States
5,000,000
255,591,380
515,407,051
Consumer
Staples
Distribution
&
Retail
0.4%
h
UBS
AG
into
Target
Corp.,
144A,
10%,
9/15/25
.............
United
States
1,900,000
287,954,981
Containers
&
Packaging
0.5%
h
BNP
Paribas
SA
into
International
Paper
Co.,
144A,
9%,
10/20/25
United
States
5,100,000
250,614,687
h
Mizuho
Markets
Cayman
LP
into
International
Paper
Co.,
144A,
10%,
1/22/25
.....................................
United
States
2,900,000
122,537,633
373,152,320
Electric
Utilities
0.7%
h
Mizuho
Markets
Cayman
LP
into
NextEra
Energy,
Inc.,
144A,
9%,
4/08/25
.........................................
United
States
3,290,000
229,969,161
h
Wells
Fargo
Bank
NA
into
NextEra
Energy,
Inc.,
144A,
8%,
5/20/25
.........................................
United
States
3,500,000
273,415,670
503,384,831
Ground
Transportation
0.4%
h
Merrill
Lynch
BV
into
Union
Pacific
Corp.,
144A,
8%,
11/05/24
..
United
States
1,300,000
309,009,964
Health
Care
Providers
&
Services
0.3%
h
Wells
Fargo
Bank
NA
into
UnitedHealth
Group,
Inc.,
144A,
7%,
7/14/25
.........................................
United
States
425,000
225,212,258
Hotels,
Restaurants
&
Leisure
0.3%
h
Wells
Fargo
Bank
NA
into
Starbucks
Corp.,
144A,
8%,
3/04/25
.
United
States
2,500,000
241,346,294
Insurance
0.4%
h
BNP
Paribas
Issuance
BV
into
MetLife,
Inc.,
144A,
9%,
10/23/24
United
States
3,800,000
273,980,661
Interactive
Media
&
Services
0.7%
h
Citigroup
Global
Markets
Holdings,
Inc.
into
Alphabet,
Inc.,
144A,
8.5%,
8/20/25
....................................
United
States
1,750,000
299,172,506
h
JPMorgan
Chase
Bank
NA
into
Alphabet,
Inc.,
144A,
8%,
3/18/25
United
States
1,805,000
264,539,034
563,711,540
IT
Services
0.3%
h
Barclays
Bank
plc
into
International
Business
Machines
Corp.,
144A,
8.5%,
6/09/25
...............................
United
States
1,340,000
257,473,767
Media
0.5%
h
BNP
Paribas
Issuance
BV
into
Comcast
Corp.,
144A,
8%,
1/15/25
United
States
3,100,000
131,681,134
h
JPMorgan
Chase
Bank
NA
into
Comcast
Corp.,
144A,
8.5%,
9/02/25
.........................................
United
States
6,100,000
250,878,788
382,559,922
Metals
&
Mining
1.4%
h
BNP
Paribas
Issuance
BV
into
Freeport-McMoRan,
Inc.,
144A,
10%,
8/12/25
.....................................
United
States
3,100,000
149,634,717
h
Citigroup
Global
Markets
Holdings,
Inc.
into
Freeport-McMoRan,
Inc.,
144A,
10%,
5/20/25
............................
United
States
4,100,000
208,022,770
h
Mizuho
Markets
Cayman
LP
into
Barrick
Gold
Corp.,
144A,
9%,
7/01/25
.........................................
Canada
3,225,000
59,859,239
h
Mizuho
Markets
Cayman
LP
into
Freeport-McMoRan,
Inc.,
144A,
11%,
12/10/24
....................................
United
States
7,539,000
340,771,798
h
UBS
AG
into
Newmont
Corp.,
144A,
11%,
1/16/25
...........
United
States
6,000,000
279,064,788
1,037,353,312
Franklin
Custodian
Funds
Schedule
of
Investments
Franklin
Income
Fund
(continued)
The
accompanying
notes
are
an
integral
part
of
these
financial
statements.
Annual
Report
a
a
Country
Shares
a
Value
a
a
a
a
a
a
g
Equity-Linked
Securities
(continued)
Multi-Utilities
0.2%
h
Wells
Fargo
Bank
NA
into
Dominion
Energy,
Inc.,
144A,
9%,
1/10/25
.........................................
United
States
2,130,000
$
119,047,919
Oil,
Gas
&
Consumable
Fuels
1.2%
h
BNP
Paribas
Issuance
BV
into
BP
plc,
144A,
8.5%,
5/15/25
....
United
States
4,750,000
157,212,624
h
Citigroup
Global
Markets
Holdings,
Inc.
into
BP
plc,
144A,
10%,
12/30/24
........................................
United
States
6,600,000
216,606,814
h
Citigroup
Global
Markets
Holdings,
Inc.
into
Exxon
Mobil
Corp.,
144A,
9%,
3/12/25
.................................
United
States
2,600,000
287,355,318
h
JPMorgan
Chase
Bank
NA
into
Exxon
Mobil
Corp.,
144A,
8.5%,
11/03/25
........................................
United
States
2,500,000
285,847,139
947,021,895
Pharmaceuticals
0.7%
h
BNP
Paribas
SA
into
Pfizer,
Inc.,
144A,
10.5%,
7/23/25
.......
United
States
9,000,000
266,092,483
h
Mizuho
Markets
Cayman
LP
into
Bristol-Myers
Squibb
Co.,
144A,
9.5%,
5/08/25
....................................
United
States
4,800,000
245,646,085
511,738,568
Semiconductors
&
Semiconductor
Equipment
3.4%
h
Barclays
Bank
plc
into
Microchip
Technology,
Inc.,
144A,
10%,
10/14/25
........................................
United
States
1,950,000
157,030,456
h
Citigroup
Global
Markets
Holdings,
Inc.
into
Intel
Corp.,
144A,
10%,
10/03/24
....................................
United
States
6,700,000
163,260,789
h
Goldman
Sachs
International
Bank
into
Texas
Instruments,
Inc.,
144A,
9%,
11/10/25
................................
United
States
1,670,000
295,384,603
h
Merrill
Lynch
BV
into
Micron
Technology,
Inc.,
144A,
10%,
8/18/25
United
States
1,615,000
170,458,385
h
Mizuho
Markets
Cayman
LP
into
Microchip
Technology,
Inc.,
144A,
10%,
11/12/24
...............................
United
States
3,500,000
284,792,443
h
Morgan
Stanley
Finance
II
Ltd.
into
Microchip
Technology,
Inc.,
144A,
10%,
3/03/25
................................
United
States
1,850,000
148,832,270
h
National
Bank
of
Canada
into
Broadcom,
Inc.,
144A,
11.5%,
5/13/25
.........................................
United
States
200,000
279,364,778
h
Royal
Bank
of
Canada
into
Texas
Instruments,
Inc.,
144A,
8%,
6/11/25
.........................................
United
States
800,000
163,697,390
h
Royal
Bank
of
Canada
into
Texas
Instruments,
Inc.,
144A,
8.5%,
7/15/25
.........................................
United
States
890,000
180,422,396
h
UBS
AG
into
Analog
Devices,
Inc.,
144A,
9%,
9/17/25
........
United
States
1,120,000
256,363,522
h
UBS
AG
into
Intel
Corp.,
144A,
10%,
7/29/25
...............
United
States
5,100,000
132,662,927
h
Wells
Fargo
Bank
NA
into
Intel
Corp.,
144A,
11%,
2/14/25
.....
United
States
4,000,000
102,883,921
h
Wells
Fargo
Bank
NA
into
QUALCOMM,
Inc.,
144A,
10%,
10/22/25
........................................
United
States
1,250,000
210,746,220
2,545,900,100
Software
0.7%
h
Merrill
Lynch
BV
into
Microsoft
Corp,
144A,
7.5%,
10/06/25
....
United
States
615,000
265,398,834
h
Mizuho
Markets
Cayman
LP
into
Oracle
Corp.,
144A,
8.5%,
2/10/25
.........................................
United
States
2,350,000
303,220,341
568,619,175
Specialty
Retail
0.7%
h
Citigroup
Global
Markets
Holdings,
Inc.
into
Home
Depot,
Inc.
(The),
144A,
7.5%,
7/21/25
..........................
United
States
745,000
275,756,670
h
J.P.
Morgan
Structured
Products
BV
into
Home
Depot,
Inc.
(The),
144A,
8%,
10/15/25
................................
United
States
735,000
285,256,795
561,013,465
Technology
Hardware,
Storage
&
Peripherals
0.8%
h
Barclays
Bank
plc
into
Dell
Technologies
Inc,
144A,
12%,
9/03/25
United
States
1,635,000
193,342,319
Franklin
Custodian
Funds
Schedule
of
Investments
Franklin
Income
Fund
(continued)
Annual
Report
The
accompanying
notes
are
an
integral
part
of
these
financial
statements.
a
a
Country
Shares
a
Value
a
a
a
a
a
a
g
Equity-Linked
Securities
(continued)
Technology
Hardware,
Storage
&
Peripherals
(continued)
h
Mizuho
Markets
Cayman
LP
into
Hewlett
Packard
Enterprise
Co.,
144A,
9.5%,
9/30/25
...............................
United
States
9,500,000
$
179,108,226
h
UBS
AG
into
Apple,
Inc.,
144A,
7%,
4/02/25
...............
United
States
1,150,000
222,195,463
594,646,008
Total
Equity-Linked
Securities
(Cost
$13,946,588,770)
.........................
14,569,948,433
Convertible
Preferred
Stocks
0.6%
Chemicals
0.3%
Albemarle
Corp.,
7.25%
..............................
United
States
5,500,000
247,500,000
Electric
Utilities
0.2%
NextEra
Energy,
Inc.,
7.299%
..........................
United
States
2,500,000
138,625,000
Financial
Services
0.1%
a
FNMA,
5.375%
.....................................
United
States
4,240
52,152,000
a
Total
Convertible
Preferred
Stocks
(Cost
$741,511,639)
........................
438,277,000
Preferred
Stocks
0.0%
†
Financial
Services
0.0%
†
a
FNMA,
8.25%,
S
....................................
United
States
4,000,000
17,120,000
a
Total
Preferred
Stocks
(Cost
$93,801,501)
....................................
17,120,000
Principal
Amount
*
Convertible
Bonds
0.1%
Pharmaceuticals
0.1%
h
Jazz
Investments
I
Ltd.
,
Senior
Note
,
144A,
3.125
%
,
9/15/30
...
United
States
50,000,000
52,325,000
Total
Convertible
Bonds
(Cost
$50,000,000)
..................................
52,325,000
Corporate
Bonds
45.3%
Aerospace
&
Defense
1.8%
Boeing
Co.
(The)
,
Senior
Bond,
3.2%,
3/01/29
..........................
United
States
25,000,000
23,149,269
Senior
Bond,
3.625%,
2/01/31
........................
United
States
59,000,000
54,069,061
Senior
Bond,
3.6%,
5/01/34
..........................
United
States
25,000,000
21,318,820
Senior
Bond,
3.25%,
2/01/35
.........................
United
States
25,000,000
20,364,732
h
Senior
Bond,
144A,
6.528%,
5/01/34
...................
United
States
25,000,000
26,841,059
Senior
Note,
2.196%,
2/04/26
........................
United
States
45,000,000
43,351,394
Senior
Note,
5.04%,
5/01/27
.........................
United
States
180,000,000
180,588,303
Senior
Note,
3.25%,
2/01/28
.........................
United
States
70,000,000
66,344,245
Senior
Note,
5.15%,
5/01/30
.........................
United
States
390,000,000
391,068,608
h
Senior
Note,
144A,
6.388%,
5/01/31
...................
United
States
20,000,000
21,274,631
h
Bombardier,
Inc.
,
Senior
Note
,
144A,
7.25
%
,
7/01/31
.........
Canada
40,000,000
42,337,400
RTX
Corp.
,
Senior
Bond
,
6.1
%
,
3/15/34
...................
United
States
25,000,000
27,609,283
Textron,
Inc.
,
Senior
Bond,
3%,
6/01/30
...........................
United
States
30,000,000
27,798,186
Senior
Bond,
2.45%,
3/15/31
.........................
United
States
40,000,000
34,997,262
h
TransDigm,
Inc.
,
Senior
Secured
Note,
144A,
6.75%,
8/15/28
.............
United
States
100,000,000
103,053,800
Senior
Secured
Note,
144A,
6.375%,
3/01/29
............
United
States
135,000,000
139,450,946
Senior
Secured
Note,
144A,
6.875%,
12/15/30
...........
United
States
50,000,000
52,405,800
Senior
Secured
Note,
144A,
6.625%,
3/01/32
............
United
States
100,000,000
104,259,200
1,380,281,999
Franklin
Custodian
Funds
Schedule
of
Investments
Franklin
Income
Fund
(continued)
The
accompanying
notes
are
an
integral
part
of
these
financial
statements.
Annual
Report
a
a
Country
Principal
Amount
*
a
Value
a
a
a
a
a
Corporate
Bonds
(continued)
Air
Freight
&
Logistics
0.0%
†
FedEx
Corp.
,
Senior
Bond
,
2.4
%
,
5/15/31
.................
United
States
29,000,000
$
25,670,789
Automobile
Components
0.3%
h
Dornoch
Debt
Merger
Sub,
Inc.
,
Senior
Note
,
144A,
6.625
%
,
10/15/29
........................................
United
States
85,000,000
74,905,086
Goodyear
Tire
&
Rubber
Co.
(The)
,
Senior
Bond,
5%,
5/31/26
...........................
United
States
57,000,000
56,169,368
i
Senior
Bond,
4.875%,
3/15/27
........................
United
States
34,757,000
33,973,491
Senior
Bond,
5.25%,
4/30/31
.........................
United
States
5,000,000
4,517,181
Senior
Note,
5%,
7/15/29
...........................
United
States
40,000,000
36,821,312
206,386,438
Automobiles
0.9%
Ford
Motor
Co.
,
Senior
Bond,
4.346%,
12/08/26
.......................
United
States
65,000,000
64,463,159
Senior
Bond,
3.25%,
2/12/32
.........................
United
States
120,000,000
102,233,948
Senior
Bond,
6.1%,
8/19/32
..........................
United
States
195,000,000
199,948,053
General
Motors
Co.
,
Senior
Bond,
5%,
10/01/28
..........................
United
States
25,000,000
25,323,933
Senior
Bond,
5.6%,
10/15/32
.........................
United
States
25,000,000
25,797,358
Senior
Bond,
5.15%,
4/01/38
.........................
United
States
140,000,000
134,277,657
h
Volkswagen
Group
of
America
Finance
LLC
,
Senior
Note
,
144A,
1.25
%
,
11/24/25
...................................
Germany
97,000,000
93,416,408
645,460,516
Banks
3.1%
Bank
of
America
Corp.
,
j
AA,
Junior
Sub.
Bond,
6.1%
to
3/16/25,
FRN
thereafter,
Perpetual
.......................................
United
States
70,000,000
70,271,670
Senior
Bond,
3.419%
to
12/19/27,
FRN
thereafter,
12/20/28
.
United
States
45,000,000
43,786,255
Senior
Bond,
4.571%
to
4/26/32,
FRN
thereafter,
4/27/33
...
United
States
185,000,000
184,170,329
Sub.
Bond,
5.425%
to
8/14/34,
FRN
thereafter,
8/15/35
.....
United
States
90,000,000
92,294,357
Barclays
plc
,
Senior
Bond,
4.337%,
1/10/28
........................
United
Kingdom
31,000,000
30,810,639
Senior
Bond,
2.645%
to
6/23/30,
FRN
thereafter,
6/24/31
...
United
Kingdom
49,000,000
43,815,470
Senior
Bond,
5.746%
to
8/08/32,
FRN
thereafter,
8/09/33
...
United
Kingdom
100,000,000
104,613,366
Senior
Bond,
7.437%
to
11/01/32,
FRN
thereafter,
11/02/33
..
United
Kingdom
75,000,000
86,616,603
Senior
Bond,
6.692%
to
9/12/33,
FRN
thereafter,
9/13/34
...
United
Kingdom
70,000,000
77,886,637
Senior
Note,
7.325%
to
11/01/25,
FRN
thereafter,
11/02/26
..
United
Kingdom
30,000,000
30,792,760
Senior
Note,
5.501%
to
8/08/27,
FRN
thereafter,
8/09/28
....
United
Kingdom
80,000,000
82,083,013
Sub.
Bond,
7.119%
to
6/26/33,
FRN
thereafter,
6/27/34
.....
United
Kingdom
55,000,000
61,264,566
Citigroup,
Inc.
,
Senior
Bond,
6.27%
to
11/16/32,
FRN
thereafter,
11/17/33
...
United
States
85,000,000
93,404,750
Sub.
Bond,
6.174%
to
5/24/33,
FRN
thereafter,
5/25/34
.....
United
States
155,000,000
165,447,544
Sub.
Bond,
5.411%
to
9/18/34,
FRN
thereafter,
9/19/39
.....
United
States
50,000,000
49,877,950
Fifth
Third
Bancorp
,
Senior
Note,
6.339%
to
7/26/28,
FRN
thereafter,
7/27/29
....
United
States
20,000,000
21,267,700
Senior
Note,
5.631%
to
1/28/31,
FRN
thereafter,
1/29/32
....
United
States
20,000,000
20,896,188
Fifth
Third
Bank
NA
,
Senior
Note
,
5.852%
to
10/26/24,
FRN
thereafter
,
10/27/25
................................
United
States
65,185,000
65,208,273
JPMorgan
Chase
&
Co.
,
j
Junior
Sub.
Bond,
6.875%
to
5/31/29,
FRN
thereafter,
Perpetual
.......................................
United
States
50,000,000
53,739,550
Senior
Bond,
6.254%
to
10/22/33,
FRN
thereafter,
10/23/34
.
United
States
90,000,000
100,132,338
Senior
Note,
5.04%
to
1/22/27,
FRN
thereafter,
1/23/28
.....
United
States
40,000,000
40,674,028
KeyBank
NA
,
Senior
Note,
5.85%,
11/15/27
........................
United
States
50,000,000
51,856,689
Franklin
Custodian
Funds
Schedule
of
Investments
Franklin
Income
Fund
(continued)
Annual
Report
The
accompanying
notes
are
an
integral
part
of
these
financial
statements.
a
a
Country
Principal
Amount
*
a
Value
a
a
a
a
a
Corporate
Bonds
(continued)
Banks
(continued)
KeyBank
NA,
(continued)
Sub.
Bond,
4.9%,
8/08/32
...........................
United
States
35,000,000
$
34,086,838
Morgan
Stanley
Bank
NA
,
Senior
Note
,
4.952%
to
1/13/27,
FRN
thereafter
,
1/14/28
.................................
United
States
55,000,000
55,836,950
PNC
Financial
Services
Group,
Inc.
(The)
,
Senior
Bond,
6.037%
to
10/27/32,
FRN
thereafter,
10/28/33
.
United
States
70,000,000
75,675,275
Senior
Note,
5.582%
to
6/11/28,
FRN
thereafter,
6/12/29
....
United
States
20,000,000
20,822,867
Royal
Bank
of
Canada
,
Senior
Bond
,
5
%
,
2/01/33
...........
Canada
50,000,000
51,757,743
Truist
Bank
,
Sub.
Bond
,
2.25
%
,
3/11/30
...................
United
States
42,645,000
37,631,385
Truist
Financial
Corp.
,
Senior
Note,
6.047%
to
6/07/26,
FRN
thereafter,
6/08/27
....
United
States
45,000,000
46,191,081
Sub.
Bond,
4.916%
to
7/27/32,
FRN
thereafter,
7/28/33
.....
United
States
95,000,000
93,191,452
US
Bancorp
,
Senior
Bond,
5.85%
to
10/20/32,
FRN
thereafter,
10/21/33
..
United
States
45,000,000
48,016,773
Senior
Bond,
5.836%
to
6/09/33,
FRN
thereafter,
6/12/34
...
United
States
35,000,000
37,384,855
Senior
Note,
5.775%
to
6/11/28,
FRN
thereafter,
6/12/29
....
United
States
40,000,000
41,932,321
Senior
Note,
5.384%
to
1/22/29,
FRN
thereafter,
1/23/30
....
United
States
20,000,000
20,774,799
Wells
Fargo
&
Co.
,
Senior
Bond,
4.897%
to
7/24/32,
FRN
thereafter,
7/25/33
...
United
States
50,000,000
50,589,945
Senior
Bond,
5.557%
to
7/24/33,
FRN
thereafter,
7/25/34
...
United
States
90,000,000
94,463,158
Senior
Bond,
6.491%
to
10/22/33,
FRN
thereafter,
10/23/34
.
United
States
60,000,000
67,071,499
2,346,337,616
Beverages
0.2%
Coca-Cola
Co.
(The)
,
Senior
Bond
,
1.65
%
,
6/01/30
..........
United
States
110,000,000
96,972,477
Constellation
Brands,
Inc.
,
Senior
Bond
,
3.15
%
,
8/01/29
......
United
States
35,000,000
33,225,209
130,197,686
Biotechnology
0.3%
AbbVie,
Inc.
,
Senior
Bond,
4.5%,
5/14/35
..........................
United
States
45,000,000
44,874,687
Senior
Note,
3.2%,
11/21/29
.........................
United
States
65,000,000
62,176,484
Amgen,
Inc.
,
Senior
Bond,
2.45%,
2/21/30
.........................
United
States
25,000,000
22,841,249
Senior
Bond,
5.25%,
3/02/33
.........................
United
States
50,000,000
52,071,883
Senior
Note,
5.25%,
3/02/30
.........................
United
States
20,000,000
20,873,922
202,838,225
Broadline
Retail
0.0%
†
Amazon.com,
Inc.
,
Senior
Bond
,
3.6
%
,
4/13/32
.............
United
States
32,500,000
31,420,877
Building
Products
0.3%
h
AmeriTex
HoldCo
Intermediate
LLC
,
Senior
Secured
Note
,
144A,
10.25
%
,
10/15/28
..................................
United
States
39,000,000
40,845,987
h
Camelot
Return
Merger
Sub,
Inc.
,
Senior
Secured
Note
,
144A,
8.75
%
,
8/01/28
...................................
United
States
47,600,000
48,217,039
Carrier
Global
Corp.
,
Senior
Note
,
2.722
%
,
2/15/30
..........
United
States
65,000,000
60,111,354
h
EMRLD
Borrower
LP
/
Emerald
Co-Issuer,
Inc.
,
Senior
Secured
Note,
144A,
6.625%,
12/15/30
...........
United
States
50,000,000
51,617,250
Senior
Secured
Note,
144A,
6.75%,
7/15/31
.............
United
States
20,000,000
20,873,840
Johnson
Controls
International
plc
/
Tyco
Fire
&
Security
Finance
SCA
,
Senior
Bond
,
4.9
%
,
12/01/32
.....................
United
States
39,500,000
40,353,197
262,018,667
Capital
Markets
1.2%
Brookfield
Finance,
Inc.
,
Senior
Bond
,
4.85
%
,
3/29/29
........
Canada
25,000,000
25,501,029
Franklin
Custodian
Funds
Schedule
of
Investments
Franklin
Income
Fund
(continued)
The
accompanying
notes
are
an
integral
part
of
these
financial
statements.
Annual
Report
a
a
Country
Principal
Amount
*
a
Value
a
a
a
a
a
Corporate
Bonds
(continued)
Capital
Markets
(continued)
Charles
Schwab
Corp.
(The)
,
Senior
Bond,
5.853%
to
5/18/33,
FRN
thereafter,
5/19/34
...
United
States
30,000,000
$
32,137,401
Senior
Bond,
6.136%
to
8/23/33,
FRN
thereafter,
8/24/34
...
United
States
30,000,000
32,809,225
Senior
Note,
5.643%
to
5/18/28,
FRN
thereafter,
5/19/29
....
United
States
25,000,000
26,111,291
Senior
Note,
6.196%
to
11/16/28,
FRN
thereafter,
11/17/29
..
United
States
40,000,000
42,769,616
Goldman
Sachs
Group,
Inc.
(The)
,
Senior
Bond,
2.65%
to
10/20/31,
FRN
thereafter,
10/21/32
..
United
States
100,000,000
87,884,645
Senior
Bond,
6.561%
to
10/23/33,
FRN
thereafter,
10/24/34
.
United
States
100,000,000
112,937,788
Senior
Bond,
5.851%
to
4/24/34,
FRN
thereafter,
4/25/35
...
United
States
65,000,000
69,869,532
Sub.
Bond,
6.75%,
10/01/37
.........................
United
States
60,000,000
69,120,215
Morgan
Stanley
,
Senior
Bond,
6.342%
to
10/17/32,
FRN
thereafter,
10/18/33
.
United
States
35,000,000
38,934,753
Senior
Bond,
5.25%
to
4/20/33,
FRN
thereafter,
4/21/34
....
United
States
251,000,000
259,327,971
Senior
Bond,
6.627%
to
10/31/33,
FRN
thereafter,
11/01/34
..
United
States
30,000,000
33,945,628
Sub.
Bond,
5.948%
to
1/18/33,
FRN
thereafter,
1/19/38
.....
United
States
67,095,000
70,360,956
901,710,050
Chemicals
0.9%
Celanese
US
Holdings
LLC
,
Senior
Bond,
6.379%,
7/15/32
........................
United
States
50,000,000
53,479,964
Senior
Note,
6.165%,
7/15/27
........................
United
States
40,000,000
41,463,043
Senior
Note,
6.55%,
11/15/30
........................
United
States
20,000,000
21,568,799
h
Consolidated
Energy
Finance
SA
,
Senior
Note
,
144A,
6.5
%
,
5/15/26
.........................................
Switzerland
100,000,000
98,929,080
h
CVR
Partners
LP
/
CVR
Nitrogen
Finance
Corp.
,
Senior
Secured
Note
,
144A,
6.125
%
,
6/15/28
.........................
United
States
25,000,000
24,493,335
Dow
Chemical
Co.
(The)
,
Senior
Bond
,
6.3
%
,
3/15/33
........
United
States
35,000,000
38,630,266
Huntsman
International
LLC
,
Senior
Bond
,
4.5
%
,
5/01/29
.....
United
States
25,000,000
24,558,698
h
International
Flavors
&
Fragrances,
Inc.
,
Senior
Bond,
144A,
2.3%,
11/01/30
....................
United
States
75,000,000
65,813,986
Senior
Note,
144A,
1.832%,
10/15/27
..................
United
States
20,000,000
18,531,633
h
Olin
Corp.
,
Senior
Note
,
144A,
9.5
%
,
6/01/25
..............
United
States
30,000,000
30,594,150
h,i
Rain
Carbon,
Inc.
,
Senior
Secured
Note
,
144A,
12.25
%
,
9/01/29
United
States
38,000,000
41,091,186
h
Rain
CII
Carbon
LLC
/
CII
Carbon
Corp.
,
Secured
Note
,
144A,
7.25
%
,
4/01/25
...................................
United
States
717,000
710,013
h
SCIH
Salt
Holdings,
Inc.
,
Senior
Note,
144A,
6.625%,
5/01/29
...................
United
States
112,500,000
108,282,881
Senior
Secured
Note,
144A,
4.875%,
5/01/28
............
United
States
135,000,000
130,279,388
698,426,422
Commercial
Services
&
Supplies
0.3%
h
ADT
Security
Corp.
(The)
,
Senior
Secured
Note
,
144A,
4.125
%
,
8/01/29
.........................................
United
States
16,000,000
15,296,915
h
APX
Group,
Inc.
,
Senior
Note,
144A,
5.75%,
7/15/29
....................
United
States
80,000,000
79,286,664
Senior
Secured
Note,
144A,
6.75%,
2/15/27
.............
United
States
140,000,000
140,519,400
235,102,979
Communications
Equipment
1.3%
h
CommScope
LLC
,
Senior
Note,
144A,
8.25%,
3/01/27
....................
United
States
188,000,000
169,530,485
Senior
Note,
144A,
7.125%,
7/01/28
...................
United
States
200,000,000
166,043,280
Senior
Secured
Note,
144A,
6%,
3/01/26
................
United
States
224,085,000
218,202,769
Senior
Secured
Note,
144A,
4.75%,
9/01/29
.............
United
States
53,454,000
44,968,177
h
CommScope
Technologies
LLC
,
Senior
Bond,
144A,
6%,
6/15/25
......................
United
States
323,000,000
312,906,250
Franklin
Custodian
Funds
Schedule
of
Investments
Franklin
Income
Fund
(continued)
Annual
Report
The
accompanying
notes
are
an
integral
part
of
these
financial
statements.
a
a
Country
Principal
Amount
*
a
Value
a
a
a
a
a
Corporate
Bonds
(continued)
Communications
Equipment
(continued)
h
CommScope
Technologies
LLC,
(continued)
Senior
Bond,
144A,
5%,
3/15/27
......................
United
States
45,000,000
$
37,706,931
949,357,892
Construction
&
Engineering
0.1%
Quanta
Services,
Inc.
,
Senior
Bond
,
2.9
%
,
10/01/30
.........
United
States
96,963,000
89,315,458
Consumer
Finance
2.4%
AerCap
Ireland
Capital
DAC
/
AerCap
Global
Aviation
Trust
,
Senior
Bond,
3.3%,
1/30/32
..........................
Ireland
50,000,000
45,141,163
Senior
Bond,
5.3%,
1/19/34
..........................
Ireland
45,000,000
46,097,880
Senior
Bond,
4.95%,
9/10/34
.........................
Ireland
35,000,000
34,824,736
Senior
Note,
5.75%,
6/06/28
.........................
Ireland
40,000,000
41,702,876
Capital
One
Financial
Corp.
,
Senior
Bond,
3.8%,
1/31/28
..........................
United
States
27,300,000
26,718,792
Senior
Bond,
5.268%
to
5/09/32,
FRN
thereafter,
5/10/33
...
United
States
50,000,000
50,490,026
Senior
Bond,
5.817%
to
1/31/33,
FRN
thereafter,
2/01/34
...
United
States
85,000,000
88,481,321
Senior
Note,
4.927%
to
5/09/27,
FRN
thereafter,
5/10/28
....
United
States
159,532,733
161,468,872
Senior
Note,
6.312%
to
6/07/28,
FRN
thereafter,
6/08/29
....
United
States
75,000,000
79,019,559
Senior
Note,
5.247%
to
7/25/29,
FRN
thereafter,
7/26/30
....
United
States
40,000,000
40,696,395
Senior
Note,
7.624%
to
10/29/30,
FRN
thereafter,
10/30/31
..
United
States
40,000,000
45,475,095
Sub.
Bond,
4.2%,
10/29/25
..........................
United
States
43,500,000
43,205,693
Sub.
Bond,
3.75%,
7/28/26
..........................
United
States
74,800,000
73,792,634
Ford
Motor
Credit
Co.
LLC
,
Senior
Bond,
4.134%,
8/04/25
........................
United
States
50,000,000
49,550,143
Senior
Bond,
5.113%,
5/03/29
........................
United
States
85,000,000
84,234,139
Senior
Note,
5.125%,
6/16/25
........................
United
States
108,015,000
107,998,005
Senior
Note,
3.375%,
11/13/25
.......................
United
States
32,000,000
31,399,408
Senior
Note,
6.95%,
6/10/26
.........................
United
States
35,000,000
36,046,490
Senior
Note,
2.7%,
8/10/26
..........................
United
States
60,000,000
57,678,819
Senior
Note,
4.95%,
5/28/27
.........................
United
States
85,000,000
84,812,173
Senior
Note,
6.8%,
5/12/28
..........................
United
States
92,000,000
96,425,447
Senior
Note,
7.35%,
3/06/30
.........................
United
States
45,000,000
48,750,166
General
Motors
Financial
Co.,
Inc.
,
Senior
Bond,
4.35%,
1/17/27
.........................
United
States
20,000,000
19,959,339
Senior
Bond,
3.6%,
6/21/30
..........................
United
States
37,720,000
35,254,920
Senior
Bond,
3.1%,
1/12/32
..........................
United
States
80,000,000
70,010,309
Senior
Bond,
6.4%,
1/09/33
..........................
United
States
50,000,000
53,334,307
Senior
Note,
5%,
4/09/27
...........................
United
States
50,000,000
50,561,521
Senior
Note,
5.8%,
6/23/28
..........................
United
States
50,000,000
51,894,772
Senior
Note,
5.8%,
1/07/29
..........................
United
States
75,000,000
78,032,987
Senior
Note,
4.3%,
4/06/29
..........................
United
States
19,000,000
18,605,614
Senior
Note,
5.85%,
4/06/30
.........................
United
States
20,000,000
20,850,442
John
Deere
Capital
Corp.
,
Senior
Bond
,
4.35
%
,
9/15/32
......
United
States
15,000,000
15,116,445
h
Macquarie
Airfinance
Holdings
Ltd.
,
Senior
Note
,
144A,
6.5
%
,
3/26/31
.........................................
United
Kingdom
15,000,000
15,843,265
1,803,473,753
Consumer
Staples
Distribution
&
Retail
0.1%
h
7-Eleven,
Inc.
,
Senior
Bond
,
144A,
1.8
%
,
2/10/31
...........
United
States
85,000,000
71,660,336
Containers
&
Packaging
1.8%
h
Ardagh
Metal
Packaging
Finance
USA
LLC
/
Ardagh
Metal
Packaging
Finance
plc
,
Senior
Note,
144A,
4%,
9/01/29
......................
United
States
124,275,000
111,043,779
Senior
Secured
Note,
144A,
6%,
6/15/27
................
United
States
20,115,000
20,278,092
h
Ardagh
Packaging
Finance
plc
/
Ardagh
Holdings
USA,
Inc.
,
Senior
Note,
144A,
5.25%,
8/15/27
....................
United
States
508,009,000
379,160,290
Franklin
Custodian
Funds
Schedule
of
Investments
Franklin
Income
Fund
(continued)
The
accompanying
notes
are
an
integral
part
of
these
financial
statements.
Annual
Report
a
a
Country
Principal
Amount
*
a
Value
a
a
a
a
a
Corporate
Bonds
(continued)
Containers
&
Packaging
(continued)
h
Ardagh
Packaging
Finance
plc
/
Ardagh
Holdings
USA,
Inc.,
(continued)
Senior
Secured
Note,
144A,
4.125%,
8/15/26
............
United
States
226,100,000
$
204,032,640
h
Mauser
Packaging
Solutions
Holding
Co.
,
Secured
Note,
144A,
9.25%,
4/15/27
...................
United
States
325,000,000
333,550,425
Senior
Secured
Note,
144A,
7.875%,
4/15/27
............
United
States
245,000,000
253,434,738
h
Pactiv
Evergreen
Group
Issuer,
Inc.
/
Pactiv
Evergreen
Group
Issuer
LLC
,
Senior
Secured
Note
,
144A,
4
%
,
10/15/27
......
United
States
62,400,000
60,058,296
h
Sealed
Air
Corp.
,
Senior
Note
,
144A,
6.125
%
,
2/01/28
........
United
States
20,000,000
20,352,540
1,381,910,800
Diversified
REITs
0.3%
VICI
Properties
LP
,
Senior
Bond,
5.125%,
5/15/32
........................
United
States
60,000,000
60,295,440
Senior
Bond,
5.75%,
4/01/34
.........................
United
States
20,000,000
20,963,320
Senior
Note,
4.95%,
2/15/30
.........................
United
States
63,357,000
63,784,596
h
VICI
Properties
LP
/
VICI
Note
Co.,
Inc.
,
Senior
Note
,
144A,
4.25
%
,
12/01/26
...................................
United
States
100,000,000
99,101,410
244,144,766
Diversified
Telecommunication
Services
0.6%
h
CCO
Holdings
LLC
/
CCO
Holdings
Capital
Corp.
,
Senior
Bond,
144A,
5.5%,
5/01/26
.....................
United
States
20,000,000
19,975,934
Senior
Bond,
144A,
5.125%,
5/01/27
...................
United
States
300,100,000
295,585,356
Senior
Bond,
144A,
5%,
2/01/28
......................
United
States
126,000,000
122,661,302
Verizon
Communications,
Inc.
,
Senior
Bond
,
4.016
%
,
12/03/29
.
United
States
50,000,000
49,282,206
487,504,798
Electric
Utilities
2.2%
American
Electric
Power
Co.,
Inc.
,
Senior
Bond,
5.95%,
11/01/32
........................
United
States
30,000,000
32,535,681
i
Senior
Bond,
5.625%,
3/01/33
........................
United
States
30,000,000
31,670,822
Duke
Energy
Corp.
,
Senior
Bond
,
4.5
%
,
8/15/32
............
United
States
56,891,000
56,284,882
NextEra
Energy
Capital
Holdings,
Inc.
,
Senior
Bond,
5.25%,
3/15/34
.........................
United
States
92,380,000
95,983,702
Senior
Note,
1.875%,
1/15/27
........................
United
States
30,000,000
28,494,931
NRG
Energy,
Inc.
,
h
Senior
Bond,
144A,
3.625%,
2/15/31
...................
United
States
65,000,000
58,960,330
Senior
Note,
5.75%,
1/15/28
.........................
United
States
18,075,000
18,223,757
h
Senior
Note,
144A,
3.375%,
2/15/29
...................
United
States
38,300,000
35,735,443
h
Senior
Secured
Bond,
144A,
7%,
3/15/33
...............
United
States
30,000,000
33,345,300
h
Senior
Secured
Note,
144A,
2.45%,
12/02/27
............
United
States
30,000,000
28,117,418
Pacific
Gas
and
Electric
Co.
,
Senior
Bond,
4.55%,
7/01/30
.........................
United
States
136,500,000
135,499,448
Senior
Bond,
6.15%,
1/15/33
.........................
United
States
50,000,000
53,709,122
Senior
Bond,
6.4%,
6/15/33
..........................
United
States
30,000,000
32,803,224
Senior
Note,
3.15%,
1/01/26
.........................
United
States
50,000,000
49,070,357
Senior
Note,
6.1%,
1/15/29
..........................
United
States
49,000,000
51,765,296
PG&E
Corp.
,
Senior
Secured
Note
,
5
%
,
7/01/28
............
United
States
107,284,000
106,432,882
Southern
Co.
(The)
,
Senior
Bond,
5.7%,
10/15/32
.........................
United
States
45,000,000
48,250,919
Senior
Bond,
5.2%,
6/15/33
..........................
United
States
50,000,000
51,865,293
Senior
Note,
4.85%,
6/15/28
.........................
United
States
40,000,000
40,976,783
h
Vistra
Operations
Co.
LLC
,
Senior
Note,
144A,
5.5%,
9/01/26
.....................
United
States
109,160,000
109,210,061
Senior
Note,
144A,
5%,
7/31/27
......................
United
States
61,000,000
60,750,150
Senior
Note,
144A,
4.375%,
5/01/29
...................
United
States
144,000,000
139,488,797
Franklin
Custodian
Funds
Schedule
of
Investments
Franklin
Income
Fund
(continued)
Annual
Report
The
accompanying
notes
are
an
integral
part
of
these
financial
statements.
a
a
Country
Principal
Amount
*
a
Value
a
a
a
a
a
Corporate
Bonds
(continued)
Electric
Utilities
(continued)
h
Vistra
Operations
Co.
LLC,
(continued)
Senior
Note,
144A,
7.75%,
10/15/31
...................
United
States
79,000,000
$
85,112,072
Senior
Note,
144A,
6.875%,
4/15/32
...................
United
States
100,000,000
105,274,800
Senior
Secured
Bond,
144A,
4.3%,
7/15/29
..............
United
States
35,000,000
34,325,052
Senior
Secured
Bond,
144A,
6.95%,
10/15/33
............
United
States
75,000,000
84,615,450
Senior
Secured
Note,
144A,
3.7%,
1/30/27
..............
United
States
33,500,000
32,837,081
1,641,339,053
Electrical
Equipment
0.1%
Regal
Rexnord
Corp.
,
Senior
Note,
6.3%,
2/15/30
..........................
United
States
25,000,000
26,604,666
Senior
Note,
6.4%,
4/15/33
..........................
United
States
60,000,000
64,212,854
90,817,520
Electronic
Equipment,
Instruments
&
Components
0.1%
Flex
Ltd.
,
Senior
Note
,
4.75
%
,
6/15/25
...................
United
States
40,000,000
39,905,336
Energy
Equipment
&
Services
0.4%
h
Schlumberger
Holdings
Corp.
,
Senior
Note
,
144A,
3.9
%
,
5/17/28
United
States
42,500,000
42,042,505
h
USA
Compression
Partners
LP
/
USA
Compression
Finance
Corp.
,
Senior
Note
,
144A,
7.125
%
,
3/15/29
..............
United
States
40,000,000
41,229,680
h
Weatherford
International
Ltd.
,
Senior
Note
,
144A,
8.625
%
,
4/30/30
.........................................
United
States
245,000,000
255,472,900
338,745,085
Entertainment
0.3%
Netflix,
Inc.
,
Senior
Bond,
4.375%,
11/15/26
.......................
United
States
100,000,000
100,752,527
Senior
Bond,
4.875%,
4/15/28
........................
United
States
89,300,000
91,513,809
Senior
Bond,
5.875%,
11/15/28
.......................
United
States
50,000,000
53,300,872
245,567,208
Financial
Services
0.2%
Fiserv,
Inc.
,
Senior
Bond,
4.2%,
10/01/28
.........................
United
States
52,000,000
51,828,266
Senior
Bond,
3.5%,
7/01/29
..........................
United
States
40,000,000
38,659,622
Senior
Bond,
2.65%,
6/01/30
.........................
United
States
38,000,000
34,636,300
Senior
Bond,
5.6%,
3/02/33
..........................
United
States
30,000,000
31,791,479
156,915,667
Food
Products
0.6%
h
Darling
Ingredients,
Inc.
,
Senior
Note
,
144A,
6
%
,
6/15/30
.....
United
States
22,000,000
22,230,977
JBS
USA
Holding
Lux
SARL
/
JBS
USA
Food
Co.
/
JBS
Lux
Co.
SARL
,
h
Senior
Bond,
144A,
6.75%,
3/15/34
....................
United
States
50,000,000
55,426,071
Senior
Note,
5.125%,
2/01/28
........................
United
States
30,000,000
30,431,250
Senior
Note,
5.75%,
4/01/33
.........................
United
States
110,000,000
114,037,550
Pilgrim's
Pride
Corp.
,
Senior
Bond,
6.25%,
7/01/33
.........................
United
States
68,000,000
72,230,348
Senior
Bond,
6.875%,
5/15/34
........................
United
States
40,000,000
44,442,040
h
Post
Holdings,
Inc.
,
Senior
Bond,
144A,
5.625%,
1/15/28
...................
United
States
22,444,000
22,655,557
Senior
Bond,
144A,
4.5%,
9/15/31
.....................
United
States
50,000,000
46,757,410
Senior
Secured
Note,
144A,
6.25%,
2/15/32
.............
United
States
45,000,000
46,393,110
454,604,313
Franklin
Custodian
Funds
Schedule
of
Investments
Franklin
Income
Fund
(continued)
The
accompanying
notes
are
an
integral
part
of
these
financial
statements.
Annual
Report
a
a
Country
Principal
Amount
*
a
Value
a
a
a
a
a
Corporate
Bonds
(continued)
Ground
Transportation
0.2%
h
Ashtead
Capital,
Inc.
,
Senior
Bond,
144A,
4.375%,
8/15/27
...................
United
Kingdom
34,500,000
$
34,250,298
Senior
Bond,
144A,
5.55%,
5/30/33
....................
United
Kingdom
55,000,000
56,320,311
Senior
Bond,
144A,
5.95%,
10/15/33
...................
United
Kingdom
35,000,000
36,887,719
127,458,328
Health
Care
Equipment
&
Supplies
0.6%
DENTSPLY
SIRONA,
Inc.
,
Senior
Bond
,
3.25
%
,
6/01/30
......
United
States
21,249,000
19,528,766
GE
HealthCare
Technologies,
Inc.
,
Senior
Note
,
5.905
%
,
11/22/32
United
States
105,000,000
113,784,758
h
Medline
Borrower
LP
,
Senior
Note,
144A,
5.25%,
10/01/29
...................
United
States
45,000,000
44,186,521
Senior
Secured
Note,
144A,
3.875%,
4/01/29
............
United
States
265,000,000
251,117,843
h
Medline
Borrower
LP
/
Medline
Co-Issuer,
Inc.
,
Senior
Secured
Note
,
144A,
6.25
%
,
4/01/29
..........................
United
States
25,000,000
25,789,529
454,407,417
Health
Care
Providers
&
Services
7.1%
Centene
Corp.
,
Senior
Note,
4.25%,
12/15/27
........................
United
States
81,745,000
80,350,545
Senior
Note,
4.625%,
12/15/29
.......................
United
States
166,100,000
162,656,239
Senior
Note,
3.375%,
2/15/30
........................
United
States
47,000,000
43,346,765
h
CHS/Community
Health
Systems,
Inc.
,
Secured
Note,
144A,
6.875%,
4/15/29
..................
United
States
500,000,000
453,857,000
Secured
Note,
144A,
6.125%,
4/01/30
..................
United
States
600,000,000
513,508,860
Senior
Note,
144A,
6.875%,
4/01/28
...................
United
States
435,000,000
367,738,286
Senior
Secured
Note,
144A,
8%,
12/15/27
...............
United
States
300,000,000
301,231,800
Senior
Secured
Note,
144A,
10.875%,
1/15/32
...........
United
States
500,000,000
551,617,500
CVS
Health
Corp.
,
Senior
Bond,
1.875%,
2/28/31
........................
United
States
35,000,000
29,492,142
Senior
Bond,
5.25%,
2/21/33
.........................
United
States
145,000,000
148,204,778
Senior
Bond,
4.78%,
3/25/38
.........................
United
States
61,925,000
58,455,278
h
DaVita,
Inc.
,
Senior
Bond,
144A,
3.75%,
2/15/31
....................
United
States
65,000,000
58,684,274
Senior
Note,
144A,
4.625%,
6/01/30
...................
United
States
285,000,000
271,900,020
Senior
Note,
144A,
6.875%,
9/01/32
...................
United
States
50,000,000
51,695,250
h
Fresenius
Medical
Care
US
Finance
III,
Inc.
,
Senior
Bond
,
144A,
2.375
%
,
2/16/31
...................................
Germany
30,000,000
25,384,391
HCA,
Inc.
,
Senior
Bond,
5.625%,
9/01/28
........................
United
States
115,000,000
119,425,952
Senior
Bond,
4.125%,
6/15/29
........................
United
States
38,500,000
37,907,914
Senior
Bond,
2.375%,
7/15/31
........................
United
States
28,716,000
24,841,770
Senior
Bond,
5.5%,
6/01/33
..........................
United
States
80,000,000
83,102,222
Senior
Note,
3.625%,
3/15/32
........................
United
States
82,954,000
76,733,346
Humana,
Inc.
,
Senior
Bond
,
5.875
%
,
3/01/33
...............
United
States
35,000,000
37,175,398
h,i
Kedrion
SpA
,
Senior
Secured
Note
,
144A,
6.5
%
,
9/01/29
......
Italy
50,000,000
47,656,500
h
MPH
Acquisition
Holdings
LLC
,
Senior
Note,
144A,
5.75%,
11/01/28
...................
United
States
115,000,000
52,788,869
Senior
Secured
Note,
144A,
5.5%,
9/01/28
..............
United
States
170,000,000
122,739,046
Quest
Diagnostics,
Inc.
,
Senior
Bond
,
2.95
%
,
6/30/30
........
United
States
58,755,000
54,512,481
Tenet
Healthcare
Corp.
,
Secured
Note,
6.25%,
2/01/27
........................
United
States
150,000,000
150,327,600
Senior
Bond,
6.875%,
11/15/31
.......................
United
States
55,258,000
60,529,337
Senior
Note,
6.125%,
10/01/28
.......................
United
States
510,000,000
514,477,800
Senior
Secured
Note,
4.25%,
6/01/29
..................
United
States
130,000,000
125,445,879
Senior
Secured
Note,
4.375%,
1/15/30
.................
United
States
30,000,000
28,804,122
Senior
Secured
Note,
6.125%,
6/15/30
.................
United
States
425,000,000
432,476,600
Senior
Secured
Note,
6.75%,
5/15/31
..................
United
States
159,775,000
166,675,043
Franklin
Custodian
Funds
Schedule
of
Investments
Franklin
Income
Fund
(continued)
Annual
Report
The
accompanying
notes
are
an
integral
part
of
these
financial
statements.
a
a
Country
Principal
Amount
*
a
Value
a
a
a
a
a
Corporate
Bonds
(continued)
Health
Care
Providers
&
Services
(continued)
UnitedHealth
Group,
Inc.
,
Senior
Bond
,
5.35
%
,
2/15/33
.......
United
States
125,000,000
$
132,825,124
5,386,568,131
Health
Care
Technology
0.1%
h,k
Multiplan
Corp.
,
Senior
Note
,
144A,
PIK,
6
%
,
10/15/27
.......
United
States
100,000,000
62,500,000
Hotels,
Restaurants
&
Leisure
2.8%
h
Caesars
Entertainment,
Inc.
,
Senior
Note,
144A,
8.125%,
7/01/27
...................
United
States
99,750,000
101,866,296
i
Senior
Note,
144A,
4.625%,
10/15/29
..................
United
States
115,000,000
109,464,233
Senior
Secured
Note,
144A,
7%,
2/15/30
................
United
States
52,000,000
54,359,812
Senior
Secured
Note,
144A,
6.5%,
2/15/32
..............
United
States
45,000,000
46,576,755
h
Carnival
Corp.
,
Senior
Note,
144A,
7.625%,
3/01/26
...................
United
States
165,000,000
166,630,995
Senior
Note,
144A,
5.75%,
3/01/27
....................
United
States
230,000,000
233,076,820
i
Senior
Note,
144A,
6%,
5/01/29
......................
United
States
30,000,000
30,414,729
Senior
Note,
144A,
10.5%,
6/01/30
....................
United
States
97,000,000
105,379,390
Expedia
Group,
Inc.
,
Senior
Bond,
3.8%,
2/15/28
..........................
United
States
57,000,000
55,944,257
Senior
Note,
5%,
2/15/26
...........................
United
States
30,000,000
30,170,132
Senior
Note,
3.25%,
2/15/30
.........................
United
States
60,000,000
56,603,370
h
Senior
Note,
144A,
6.25%,
5/01/25
....................
United
States
54,596,000
54,741,940
h
Fertitta
Entertainment
LLC
/
Fertitta
Entertainment
Finance
Co.,
Inc.
,
Senior
Note,
144A,
6.75%,
1/15/30
....................
United
States
75,000,000
69,923,468
Senior
Secured
Note,
144A,
4.625%,
1/15/29
............
United
States
140,000,000
133,780,948
h
Hilton
Domestic
Operating
Co.,
Inc.
,
Senior
Note
,
144A,
6.125
%
,
4/01/32
.........................................
United
States
40,000,000
41,216,000
Marriott
International,
Inc.
,
Senior
Note,
5%,
10/15/27
..........................
United
States
25,000,000
25,518,145
Senior
Note,
4.9%,
4/15/29
..........................
United
States
20,000,000
20,421,489
h
Royal
Caribbean
Cruises
Ltd.
,
Senior
Note,
144A,
4.25%,
7/01/26
....................
United
States
20,000,000
19,788,416
Senior
Note,
144A,
5.5%,
4/01/28
.....................
United
States
50,000,000
50,665,195
h
Wynn
Las
Vegas
LLC
/
Wynn
Las
Vegas
Capital
Corp.
,
Senior
Bond,
144A,
5.5%,
3/01/25
.....................
United
States
367,152,000
367,219,079
Senior
Bond,
144A,
5.25%,
5/15/27
....................
United
States
135,000,000
135,195,075
h
Wynn
Macau
Ltd.
,
i
Senior
Bond,
144A,
5.5%,
10/01/27
....................
Macau
51,457,000
50,347,721
Senior
Note,
144A,
5.5%,
1/15/26
.....................
Macau
50,000,000
49,658,565
h
Wynn
Resorts
Finance
LLC
/
Wynn
Resorts
Capital
Corp.
,
Senior
Note,
144A,
7.125%,
2/15/31
...................
United
States
30,000,000
32,385,683
Senior
Note,
144A,
6.25%,
3/15/33
....................
United
States
100,000,000
101,367,139
2,142,715,652
Household
Durables
0.1%
KB
Home
,
Senior
Note
,
7.25
%
,
7/15/30
...................
United
States
20,000,000
20,902,220
Shea
Homes
LP
/
Shea
Homes
Funding
Corp.
,
Senior
Note,
4.75%,
2/15/28
.........................
United
States
34,630,000
33,909,398
Senior
Note,
4.75%,
4/01/29
.........................
United
States
49,895,000
48,396,209
103,207,827
Household
Products
0.1%
h
Energizer
Holdings,
Inc.
,
Senior
Note,
144A,
6.5%,
12/31/27
....................
United
States
20,000,000
20,417,760
i
Senior
Note,
144A,
4.75%,
6/15/28
....................
United
States
24,000,000
23,311,423
43,729,183
Franklin
Custodian
Funds
Schedule
of
Investments
Franklin
Income
Fund
(continued)
The
accompanying
notes
are
an
integral
part
of
these
financial
statements.
Annual
Report
a
a
Country
Principal
Amount
*
a
Value
a
a
a
a
a
Corporate
Bonds
(continued)
Independent
Power
and
Renewable
Electricity
Producers
0.6%
h
Calpine
Corp.
,
Senior
Note,
144A,
5.125%,
3/15/28
...................
United
States
192,000,000
$
189,469,920
Senior
Note,
144A,
4.625%,
2/01/29
...................
United
States
22,000,000
21,266,797
Senior
Secured
Bond,
144A,
3.75%,
3/01/31
.............
United
States
40,000,000
37,102,317
Senior
Secured
Note,
144A,
4.5%,
2/15/28
..............
United
States
122,475,000
119,667,138
h,j
Vistra
Corp.
,
Junior
Sub.
Bond
,
144A,
7%
to
12/14/26,
FRN
thereafter
,
Perpetual
...............................
United
States
90,000,000
91,948,860
459,455,032
Insurance
0.2%
h
Five
Corners
Funding
Trust
III
,
Senior
Note
,
144A,
5.791
%
,
2/15/33
.........................................
United
States
30,000,000
32,225,841
h
Northwestern
Mutual
Global
Funding
,
Secured
Note
,
144A,
4.35
%
,
9/15/27
...................................
United
States
40,000,000
40,442,628
Prudential
Financial,
Inc.
,
Junior
Sub.
Bond
,
5.7%
to
9/14/28,
FRN
thereafter
,
9/15/48
.............................
United
States
65,000,000
65,873,860
138,542,329
Interactive
Media
&
Services
0.0%
†
Meta
Platforms,
Inc.
,
Senior
Note
,
3.85
%
,
8/15/32
...........
United
States
35,000,000
34,041,090
IT
Services
0.0%
†
Twilio,
Inc.
,
Senior
Bond
,
3.875
%
,
3/15/31
.................
United
States
40,000,000
36,995,200
Machinery
0.1%
Parker-Hannifin
Corp.
,
Senior
Bond
,
3.25
%
,
6/14/29
.........
United
States
10,000,000
9,602,175
h
TK
Elevator
US
Newco,
Inc.
,
Senior
Secured
Note
,
144A,
5.25
%
,
7/15/27
.........................................
Germany
35,000,000
34,649,888
44,252,063
Media
0.7%
Charter
Communications
Operating
LLC
/
Charter
Communications
Operating
Capital
Corp.
,
Senior
Secured
Note
,
4.908
%
,
7/23/25
...................................
United
States
150,000,000
149,795,291
h
Clear
Channel
Outdoor
Holdings,
Inc.
,
Senior
Note,
144A,
7.75%,
4/15/28
....................
United
States
179,000,000
160,322,055
Senior
Secured
Note,
144A,
5.125%,
8/15/27
............
United
States
80,417,564
79,117,027
h
Stagwell
Global
LLC
,
Senior
Note
,
144A,
5.625
%
,
8/15/29
.....
United
States
55,000,000
53,217,366
h
Univision
Communications,
Inc.
,
Senior
Secured
Note,
144A,
6.625%,
6/01/27
............
United
States
60,000,000
60,235,740
Senior
Secured
Note,
144A,
8%,
8/15/28
................
United
States
30,000,000
30,697,800
Senior
Secured
Note,
144A,
7.375%,
6/30/30
............
United
States
4,500,000
4,358,874
537,744,153
Metals
&
Mining
1.2%
h
Alcoa
Nederland
Holding
BV
,
Senior
Note,
144A,
5.5%,
12/15/27
....................
United
States
104,742,000
105,229,725
Senior
Note,
144A,
4.125%,
3/31/29
...................
United
States
101,547,000
97,488,156
ArcelorMittal
SA
,
i
Senior
Bond,
6.8%,
11/29/32
.........................
Luxembourg
55,000,000
61,379,772
Senior
Note,
6.55%,
11/29/27
........................
Luxembourg
25,000,000
26,543,479
h
Cleveland-Cliffs,
Inc.
,
Senior
Bond
,
144A,
4.875
%
,
3/01/31
....
United
States
25,000,000
23,256,105
h
FMG
Resources
August
2006
Pty.
Ltd.
,
Senior
Bond,
144A,
4.375%,
4/01/31
...................
Australia
198,000,000
185,203,189
i
Senior
Bond,
144A,
6.125%,
4/15/32
...................
Australia
32,500,000
33,277,042
Senior
Note,
144A,
4.5%,
9/15/27
.....................
Australia
16,000,000
15,759,383
Senior
Note,
144A,
5.875%,
4/15/30
...................
Australia
62,035,000
62,891,269
Franklin
Custodian
Funds
Schedule
of
Investments
Franklin
Income
Fund
(continued)
Annual
Report
The
accompanying
notes
are
an
integral
part
of
these
financial
statements.
a
a
Country
Principal
Amount
*
a
Value
a
a
a
a
a
Corporate
Bonds
(continued)
Metals
&
Mining
(continued)
Freeport-McMoRan,
Inc.
,
Senior
Bond,
5.25%,
9/01/29
.........................
United
States
61,402,000
$
62,276,902
Senior
Bond,
5.4%,
11/14/34
.........................
United
States
59,500,000
61,770,342
h
Glencore
Funding
LLC
,
Senior
Bond
,
144A,
2.5
%
,
9/01/30
....
Australia
95,000,000
85,211,835
h,i
Mineral
Resources
Ltd.
,
Senior
Note,
144A,
8%,
11/01/27
......................
Australia
20,000,000
20,562,760
Senior
Note,
144A,
8.5%,
5/01/30
.....................
Australia
35,000,000
36,500,415
877,350,374
Multi-Utilities
0.2%
Dominion
Energy,
Inc.
,
Senior
Note,
5.375%,
11/15/32
.......................
United
States
32,854,000
34,406,036
A,
Senior
Note,
4.35%,
8/15/32
.......................
United
States
30,000,000
29,664,343
C,
Senior
Note,
3.375%,
4/01/30
......................
United
States
30,000,000
28,443,279
NiSource,
Inc.
,
Senior
Bond
,
3.6
%
,
5/01/30
................
United
States
10,000,000
9,605,415
Sempra
,
Senior
Bond
,
5.5
%
,
8/01/33
.....................
United
States
35,000,000
36,727,191
Southern
Co.
Gas
Capital
Corp.
,
Senior
Bond
,
5.15
%
,
9/15/32
.
United
States
40,000,000
41,421,910
180,268,174
Oil,
Gas
&
Consumable
Fuels
2.9%
BP
Capital
Markets
America,
Inc.
,
Senior
Bond
,
3.633
%
,
4/06/30
United
States
46,500,000
45,156,017
h
Calumet
Specialty
Products
Partners
LP
/
Calumet
Finance
Corp.
,
Senior
Note,
144A,
11%,
4/15/25
......................
United
States
224,172,000
223,944,824
Senior
Note,
144A,
8.125%,
1/15/27
...................
United
States
124,000,000
120,784,679
Senior
Note,
144A,
9.75%,
7/15/28
....................
United
States
73,565,000
72,365,883
Senior
Secured
Note,
144A,
9.25%,
7/15/29
.............
United
States
140,000,000
144,016,740
Cheniere
Corpus
Christi
Holdings
LLC
,
Senior
Secured
Note,
5.125%,
6/30/27
.................
United
States
87,973,000
89,442,958
Senior
Secured
Note,
3.7%,
11/15/29
..................
United
States
92,245,000
88,729,861
Cheniere
Energy
Partners
LP
,
Senior
Note
,
5.95
%
,
6/30/33
....
United
States
30,000,000
31,765,380
h
Cheniere
Energy,
Inc.
,
Senior
Bond
,
144A,
5.65
%
,
4/15/34
....
United
States
40,000,000
41,416,000
h
CITGO
Petroleum
Corp.
,
Senior
Secured
Note,
144A,
7%,
6/15/25
................
United
States
33,224,000
33,263,749
Senior
Secured
Note,
144A,
6.375%,
6/15/26
............
United
States
77,000,000
77,185,416
h
Civitas
Resources,
Inc.
,
Senior
Note
,
144A,
8.75
%
,
7/01/31
....
United
States
25,000,000
26,494,700
Energy
Transfer
LP
,
Senior
Bond,
5.75%,
2/15/33
.........................
United
States
30,000,000
31,399,769
Senior
Bond,
6.55%,
12/01/33
........................
United
States
25,000,000
27,617,325
h
Hilcorp
Energy
I
LP
/
Hilcorp
Finance
Co.
,
Senior
Note
,
144A,
6
%
,
4/15/30
.........................................
United
States
25,000,000
24,390,237
Kinder
Morgan,
Inc.
,
Senior
Bond,
5.2%,
6/01/33
..........................
United
States
87,000,000
88,108,152
Senior
Bond,
5.4%,
2/01/34
..........................
United
States
50,000,000
51,257,960
Senior
Note,
5%,
2/01/29
...........................
United
States
40,000,000
40,871,952
h
Matador
Resources
Co.
,
Senior
Note,
144A,
6.5%,
4/15/32
.....................
United
States
35,000,000
34,973,974
Senior
Note,
144A,
6.25%,
4/15/33
....................
United
States
40,000,000
39,429,118
Occidental
Petroleum
Corp.
,
Senior
Bond,
6.625%,
9/01/30
........................
United
States
80,000,000
86,358,080
Senior
Bond,
6.125%,
1/01/31
........................
United
States
52,000,000
54,907,736
Senior
Note,
5.5%,
12/01/25
.........................
United
States
30,000,000
30,149,910
Senior
Note,
6.375%,
9/01/28
........................
United
States
60,000,000
63,138,180
h
Tennessee
Gas
Pipeline
Co.
LLC
,
Senior
Bond
,
144A,
2.9
%
,
3/01/30
.........................................
United
States
40,050,000
36,687,984
h
Venture
Global
Calcasieu
Pass
LLC
,
Senior
Secured
Note
,
144A,
6.25
%
,
1/15/30
...................................
United
States
25,000,000
26,223,025
Franklin
Custodian
Funds
Schedule
of
Investments
Franklin
Income
Fund
(continued)
The
accompanying
notes
are
an
integral
part
of
these
financial
statements.
Annual
Report
a
a
Country
Principal
Amount
*
a
Value
a
a
a
a
a
Corporate
Bonds
(continued)
Oil,
Gas
&
Consumable
Fuels
(continued)
h
Venture
Global
LNG,
Inc.
,
j
Junior
Sub.
Bond,
144A,
9%
to
9/29/29,
FRN
thereafter,
Perpetual
.......................................
United
States
230,000,000
$
233,310,599
Senior
Secured
Note,
144A,
8.125%,
6/01/28
............
United
States
14,500,000
15,126,248
Senior
Secured
Note,
144A,
7%,
1/15/30
................
United
States
20,000,000
20,447,240
Senior
Secured
Note,
144A,
8.375%,
6/01/31
............
United
States
50,000,000
52,830,300
Williams
Cos.,
Inc.
(The)
,
Senior
Bond,
3.5%,
11/15/30
.........................
United
States
130,000,000
122,939,300
Senior
Bond,
2.6%,
3/15/31
..........................
United
States
61,000,000
53,923,784
Senior
Bond,
4.65%,
8/15/32
.........................
United
States
35,000,000
34,785,093
Senior
Bond,
5.65%,
3/15/33
.........................
United
States
55,000,000
57,604,971
2,221,047,144
Passenger
Airlines
2.0%
h
American
Airlines
Group,
Inc.
,
Senior
Note,
144A,
3.75%,
3/01/25
....................
United
States
64,000,000
63,401,171
k
Senior
Secured
Note,
144A,
PIK,
10.75%,
2/15/26
.........
United
States
145,000,000
149,350,000
h
American
Airlines,
Inc.
,
Senior
Secured
Note
,
144A,
8.5
%
,
5/15/29
.........................................
United
States
75,000,000
79,622,937
h
American
Airlines,
Inc.
/
AAdvantage
Loyalty
IP
Ltd.
,
Senior
Secured
Note,
144A,
5.5%,
4/20/26
..............
United
States
150,499,999
150,194,105
Senior
Secured
Note,
144A,
5.75%,
4/20/29
.............
United
States
185,795,000
185,640,344
h
Avianca
Midco
2
plc
,
Senior
Secured
Note
,
144A,
9
%
,
12/01/28
United
Kingdom
60,000,000
59,900,285
h
Delta
Air
Lines,
Inc.
/
SkyMiles
IP
Ltd.
,
Senior
Secured
Note,
144A,
4.5%,
10/20/25
.............
United
States
39,013,467
38,782,413
Senior
Secured
Note,
144A,
4.75%,
10/20/28
............
United
States
341,718,000
341,414,301
h
JetBlue
Airways
Corp.
/
JetBlue
Loyalty
LP
,
Senior
Secured
Note
,
144A,
9.875
%
,
9/20/31
..............................
United
States
70,000,000
73,800,300
h
Mileage
Plus
Holdings
LLC
/
Mileage
Plus
Intellectual
Property
Assets
Ltd.
,
Senior
Secured
Note
,
144A,
6.5
%
,
6/20/27
.....
United
States
107,525,000
108,942,610
h
United
Airlines,
Inc.
,
Senior
Secured
Note,
144A,
4.375%,
4/15/26
............
United
States
107,762,000
106,117,405
Senior
Secured
Note,
144A,
4.625%,
4/15/29
............
United
States
136,643,000
132,122,720
1,489,288,591
Personal
Care
Products
0.2%
h
BellRing
Brands,
Inc.
,
Senior
Note
,
144A,
7
%
,
3/15/30
.......
United
States
30,000,000
31,426,890
Haleon
US
Capital
LLC
,
Senior
Note,
3.375%,
3/24/29
........................
United
States
30,000,000
28,976,122
Senior
Note,
3.625%,
3/24/32
........................
United
States
65,043,000
61,201,048
121,604,060
Pharmaceuticals
1.3%
h,i
1375209
BC
Ltd.
,
Senior
Secured
Note
,
144A,
9
%
,
1/30/28
....
Canada
467,060,000
463,337,485
h
Bausch
Health
Cos.,
Inc.
,
Secured
Note,
144A,
14%,
10/15/30
...................
United
States
47,000,000
42,963,875
Senior
Secured
Note,
144A,
11%,
9/30/28
...............
United
States
250,000,000
233,750,000
h
Endo
Finance
Holdings,
Inc.
,
Senior
Secured
Note
,
144A,
8.5
%
,
4/15/31
.........................................
United
States
50,000,000
53,639,150
Royalty
Pharma
plc
,
Senior
Note
,
2.2
%
,
9/02/30
............
United
States
10,000,000
8,759,552
Teva
Pharmaceutical
Finance
Netherlands
III
BV
,
Senior
Note,
7.125%,
1/31/25
........................
Israel
27,220,000
27,258,217
Senior
Note,
6.75%,
3/01/28
.........................
Israel
26,000,000
27,119,378
Senior
Note,
7.875%,
9/15/29
........................
Israel
25,000,000
27,650,550
Senior
Note,
8.125%,
9/15/31
........................
Israel
30,000,000
34,432,620
Utah
Acquisition
Sub,
Inc.
,
Senior
Note
,
3.95
%
,
6/15/26
.......
United
States
58,161,000
57,612,053
Franklin
Custodian
Funds
Schedule
of
Investments
Franklin
Income
Fund
(continued)
Annual
Report
The
accompanying
notes
are
an
integral
part
of
these
financial
statements.
a
a
Country
Principal
Amount
*
a
Value
a
a
a
a
a
Corporate
Bonds
(continued)
Pharmaceuticals
(continued)
Viatris,
Inc.
,
Senior
Note
,
2.7
%
,
6/22/30
...................
United
States
40,000,000
$
35,557,215
1,012,080,095
Semiconductors
&
Semiconductor
Equipment
0.9%
Broadcom,
Inc.
,
Senior
Bond,
4.15%,
11/15/30
........................
United
States
20,000,000
19,757,548
Senior
Bond,
4.3%,
11/15/32
.........................
United
States
140,000,000
137,560,042
h
Senior
Bond,
144A,
2.45%,
2/15/31
....................
United
States
80,000,000
70,917,210
h
Senior
Bond,
144A,
4.15%,
4/15/32
....................
United
States
35,000,000
33,967,670
h
Senior
Bond,
144A,
3.469%,
4/15/34
...................
United
States
66,000,000
59,458,641
h
Senior
Note,
144A,
4%,
4/15/29
......................
United
States
28,000,000
27,593,096
h
Entegris,
Inc.
,
Senior
Secured
Note
,
144A,
4.75
%
,
4/15/29
....
United
States
60,000,000
59,181,012
Intel
Corp.
,
Senior
Bond,
5.2%,
2/10/33
..........................
United
States
25,000,000
25,340,316
Senior
Note,
5.125%,
2/10/30
........................
United
States
30,000,000
30,660,761
Micron
Technology,
Inc.
,
Senior
Bond,
5.327%,
2/06/29
........................
United
States
25,000,000
25,843,838
Senior
Bond,
4.663%,
2/15/30
........................
United
States
34,000,000
34,181,344
Senior
Bond,
5.875%,
2/09/33
........................
United
States
40,000,000
42,739,982
Senior
Note,
6.75%,
11/01/29
........................
United
States
55,000,000
60,447,351
NXP
BV
/
NXP
Funding
LLC
/
NXP
USA,
Inc.
,
Senior
Note
,
3.4
%
,
5/01/30
.........................................
China
31,200,000
29,480,384
h
Qorvo,
Inc.
,
Senior
Bond
,
144A,
3.375
%
,
4/01/31
...........
United
States
30,800,000
27,608,473
684,737,668
Software
0.8%
h
McAfee
Corp.
,
Senior
Note
,
144A,
7.375
%
,
2/15/30
..........
United
States
55,000,000
53,698,574
Oracle
Corp.
,
Senior
Bond,
2.65%,
7/15/26
.........................
United
States
100,000,000
97,237,301
Senior
Bond,
3.25%,
11/15/27
........................
United
States
40,000,000
38,951,468
Senior
Bond,
2.95%,
4/01/30
.........................
United
States
30,000,000
27,907,231
Senior
Bond,
2.875%,
3/25/31
........................
United
States
101,000,000
91,932,444
Senior
Bond,
6.25%,
11/09/32
........................
United
States
95,000,000
105,151,061
Roper
Technologies,
Inc.
,
Senior
Bond,
2%,
6/30/30
...........................
United
States
20,000,000
17,579,521
Senior
Bond,
1.75%,
2/15/31
.........................
United
States
20,000,000
16,930,481
Workday,
Inc.
,
Senior
Bond
,
3.8
%
,
4/01/32
................
United
States
155,000,000
147,197,717
596,585,798
Specialized
REITs
0.5%
American
Tower
Corp.
,
Senior
Bond,
3.55%,
7/15/27
.........................
United
States
20,000,000
19,588,153
Senior
Bond,
2.9%,
1/15/30
..........................
United
States
30,000,000
27,755,739
Senior
Bond,
5.65%,
3/15/33
.........................
United
States
105,000,000
110,990,905
Senior
Note,
5.5%,
3/15/28
..........................
United
States
20,000,000
20,721,389
Crown
Castle,
Inc.
,
Senior
Bond,
3.3%,
7/01/30
..........................
United
States
74,583,000
69,774,729
Senior
Bond,
5.1%,
5/01/33
..........................
United
States
60,000,000
60,791,314
h
Iron
Mountain,
Inc.
,
Senior
Note
,
144A,
4.875
%
,
9/15/27
......
United
States
65,000,000
64,561,133
Weyerhaeuser
Co.
,
Senior
Bond
,
3.375
%
,
3/09/33
..........
United
States
42,300,000
38,691,802
412,875,164
Specialty
Retail
0.7%
AutoNation,
Inc.
,
Senior
Bond,
4.75%,
6/01/30
.........................
United
States
40,959,000
40,789,177
Senior
Bond,
2.4%,
8/01/31
..........................
United
States
44,451,000
37,735,199
Senior
Bond,
3.85%,
3/01/32
.........................
United
States
32,953,000
30,408,915
Franklin
Custodian
Funds
Schedule
of
Investments
Franklin
Income
Fund
(continued)
The
accompanying
notes
are
an
integral
part
of
these
financial
statements.
Annual
Report
a
a
Country
Principal
Amount
*
a
Value
a
a
a
a
a
Corporate
Bonds
(continued)
Specialty
Retail
(continued)
Bath
&
Body
Works,
Inc.
,
Senior
Bond
,
6.875
%
,
11/01/35
.....
United
States
30,000,000
$
31,293,510
Home
Depot,
Inc.
(The)
,
Senior
Bond,
1.375%,
3/15/31
........................
United
States
40,000,000
33,691,866
Senior
Bond,
5.875%,
12/16/36
.......................
United
States
20,000,000
22,372,462
Senior
Note,
4.5%,
9/15/32
..........................
United
States
30,000,000
30,694,407
Lowe's
Cos.,
Inc.
,
Senior
Bond,
2.625%,
4/01/31
........................
United
States
40,000,000
35,969,309
Senior
Bond,
3.75%,
4/01/32
.........................
United
States
88,000,000
84,003,060
Senior
Bond,
5%,
4/15/33
...........................
United
States
115,000,000
118,644,310
i
Senior
Bond,
5.15%,
7/01/33
.........................
United
States
35,000,000
36,489,915
TJX
Cos.,
Inc.
(The)
,
Senior
Bond
,
1.6
%
,
5/15/31
...........
United
States
20,000,000
16,980,974
519,073,104
Technology
Hardware,
Storage
&
Peripherals
0.5%
i
Apple,
Inc.
,
Senior
Bond
,
4.3
%
,
5/10/33
...................
United
States
40,000,000
41,267,877
Dell
International
LLC
/
EMC
Corp.
,
i
Senior
Bond,
5.75%,
2/01/33
.........................
United
States
40,000,000
42,942,355
Senior
Note,
5.3%,
10/01/29
.........................
United
States
55,000,000
57,305,738
Hewlett
Packard
Enterprise
Co.
,
Senior
Bond,
5%,
10/15/34
..........................
United
States
30,000,000
29,712,811
Senior
Note,
4.85%,
10/15/31
........................
United
States
30,000,000
29,947,498
HP,
Inc.
,
i
Senior
Bond,
5.5%,
1/15/33
..........................
United
States
70,000,000
73,659,628
Senior
Note,
4%,
4/15/29
...........................
United
States
123,630,000
121,663,999
396,499,906
Textiles,
Apparel
&
Luxury
Goods
0.1%
h,i
Hanesbrands,
Inc.
,
Senior
Note
,
144A,
9
%
,
2/15/31
..........
United
States
19,200,000
20,742,605
Tapestry,
Inc.
,
Senior
Bond
,
7.85
%
,
11/27/33
...............
United
States
30,000,000
32,541,592
53,284,197
Tobacco
0.7%
BAT
Capital
Corp.
,
Senior
Bond,
2.726%,
3/25/31
........................
United
Kingdom
25,000,000
22,364,189
Senior
Bond,
6.421%,
8/02/33
........................
United
Kingdom
53,500,000
58,784,739
Senior
Bond,
6%,
2/20/34
...........................
United
Kingdom
40,000,000
42,771,260
Senior
Note,
3.557%,
8/15/27
........................
United
Kingdom
212,000,000
207,721,723
Senior
Note,
2.259%,
3/25/28
........................
United
Kingdom
37,812,000
35,192,996
Philip
Morris
International,
Inc.
,
Senior
Bond,
5.75%,
11/17/32
........................
United
States
41,000,000
44,080,045
Senior
Bond,
5.375%,
2/15/33
........................
United
States
70,000,000
73,235,193
Senior
Bond,
5.625%,
9/07/33
........................
United
States
15,000,000
15,976,473
500,126,618
Trading
Companies
&
Distributors
0.4%
United
Rentals
North
America,
Inc.
,
Senior
Bond,
4.875%,
1/15/28
........................
United
States
140,000,000
139,071,996
Senior
Bond,
3.875%,
2/15/31
........................
United
States
45,000,000
41,897,758
Senior
Bond,
3.75%,
1/15/32
.........................
United
States
31,000,000
28,329,006
h
Senior
Secured
Note,
144A,
6%,
12/15/29
...............
United
States
73,800,000
76,235,179
285,533,939
Water
Utilities
0.1%
American
Water
Capital
Corp.
,
Senior
Bond
,
4.45
%
,
6/01/32
...
United
States
40,336,000
40,552,909
Wireless
Telecommunication
Services
0.4%
Sprint
LLC
,
Senior
Note
,
7.625
%
,
3/01/26
.................
United
States
86,300,000
89,209,173
Franklin
Custodian
Funds
Schedule
of
Investments
Franklin
Income
Fund
(continued)
Annual
Report
The
accompanying
notes
are
an
integral
part
of
these
financial
statements.
a
a
Country
Principal
Amount
*
a
Value
a
a
a
a
a
Corporate
Bonds
(continued)
Wireless
Telecommunication
Services
(continued)
h
Sprint
Spectrum
Co.
LLC
/
Sprint
Spectrum
Co.
II
LLC
/
Sprint
Spectrum
Co.
III
LLC
,
Senior
Secured
Bond
,
144A,
5.152
%
,
3/20/28
.........................................
United
States
63,000,000
$
63,636,424
T-Mobile
USA,
Inc.
,
Senior
Bond,
5.2%,
1/15/33
..........................
United
States
45,000,000
46,646,881
Senior
Note,
3.375%,
4/15/29
........................
United
States
68,000,000
65,317,692
264,810,170
Total
Corporate
Bonds
(Cost
$33,162,101,209)
................................
34,288,448,565
l
Senior
Floating
Rate
Interests
0.0%
†
Building
Products
0.0%
†
m
EMRLD
Borrower
LP,
First
Lien,
Second
Amendment
Incremental
CME
Term
Loan,
7.557%,
(3-month
SOFR
+
2.5%),
8/04/31
..
United
States
35,000,000
34,971,825
Total
Senior
Floating
Rate
Interests
(Cost
$34,913,250)
........................
34,971,825
U.S.
Government
and
Agency
Securities
9.3%
U.S.
Treasury
Bonds
,
3.375%,
8/15/42
...................................
United
States
600,000,000
541,675,782
3.875%,
5/15/43
...................................
United
States
250,000,000
240,771,485
4.125%,
8/15/53
...................................
United
States
1,500,000,000
1,494,199,215
U.S.
Treasury
Notes
,
4.125%,
10/31/27
..................................
United
States
1,250,000,000
1,270,043,950
4%,
10/31/29
.....................................
United
States
1,000,000,000
1,018,710,940
2.75%,
8/15/32
...................................
United
States
1,000,000,000
934,687,500
3.875%,
8/15/33
...................................
United
States
1,500,000,000
1,512,480,465
Total
U.S.
Government
and
Agency
Securities
(Cost
$6,783,072,474)
............
7,012,569,337
Asset-Backed
Securities
0.1%
Passenger
Airlines
0.1%
United
Airlines
Pass-Through
Trust
,
2020-1,
A,
5.875%,
10/15/27
.........................
United
States
50,294,583
51,376,198
2023-1,
A,
5.8%,
1/15/36
............................
United
States
48,882,850
51,494,622
102,870,820
a
a
a
a
a
a
Total
Asset-Backed
Securities
(Cost
$99,013,976)
.............................
102,870,820
Mortgage-Backed
Securities
1.3%
Federal
Home
Loan
Mortgage
Corp.
(FHLMC)
Fixed
Rate
0.6%
FHLMC
Pool,
30
Year,
5%,
5/01/53
......................
United
States
166,075,465
166,149,849
FHLMC
Pool,
30
Year,
5.5%,
6/01/53
-
11/01/53
............
United
States
249,370,123
252,391,489
418,541,338
Federal
National
Mortgage
Association
(FNMA)
Fixed
Rate
0.6%
FNMA,
30
Year,
4%,
8/01/49
...........................
United
States
23,547,930
23,017,214
FNMA,
30
Year,
5%,
5/01/53
-
11/01/53
...................
United
States
367,245,331
367,303,469
FNMA,
30
Year,
5.5%,
7/01/53
.........................
United
States
80,782,815
81,773,978
472,094,661
Government
National
Mortgage
Association
(GNMA)
Fixed
Rate
0.1%
GNMA
II,
Single-family,
30
Year,
5.5%,
5/20/53
.............
United
States
79,497,880
80,368,840
Total
Mortgage-Backed
Securities
(Cost
$940,605,644)
.........................
971,004,839
Franklin
Custodian
Funds
Schedule
of
Investments
Franklin
Income
Fund
(continued)
The
accompanying
notes
are
an
integral
part
of
these
financial
statements.
Annual
Report
a
a
Country
Shares
a
Value
a
a
a
a
a
a
Escrows
and
Litigation
Trusts
0.0%
a,c,e
Endo,
Inc.,
Escrow
Account
............................
United
States
307,256,000
$
—
Total
Escrows
and
Litigation
Trusts
(Cost
$–)
.................................
—
Total
Long
Term
Investments
(Cost
$70,342,766,078)
..........................
74,723,984,183
a
Short
Term
Investments
0.6%
a
a
Country
Shares
a
Value
a
a
a
a
a
a
Money
Market
Funds
0.4%
d,n
Institutional
Fiduciary
Trust
-
Money
Market
Portfolio,
4.74%
...
United
States
298,170,275
298,170,275
Total
Money
Market
Funds
(Cost
$298,170,275)
...............................
298,170,275
o
Investments
from
Cash
Collateral
Received
for
Loaned
Securities
0.2%
Money
Market
Funds
0.2%
d,n
Institutional
Fiduciary
Trust
-
Money
Market
Portfolio,
4.74%
...
United
States
177,261,000
177,261,000
Total
Investments
from
Cash
Collateral
Received
for
Loaned
Securities
(Cost
$177,261,000)
........................................................
177,261,000
Total
Short
Term
Investments
(Cost
$475,431,275
)
.............................
475,431,275
a
Total
Investments
(Cost
$70,818,197,353)
99.3%
..............................
$75,199,415,458
Options
Written
(0.1)%
.....................................................
(57,067,500)
Other
Assets,
less
Liabilities
0.8%
...........................................
596,835,205
Net
Assets
100.0%
.........................................................
$75,739,183,163
a
a
a
Number
of
Contracts
Notional
Amount
#
p
Options
Written
(0.1)%
Calls
-
Exchange-Traded
Equity
Options
Abbott
Laboratories,
Inc.,
October
Strike
Price
$115.00,
Expires
10/18/24
........................................
5,000
57,005,000
(1,095,000)
Amgen,
Inc.,
November
Strike
Price
$370.00,
Expires
11/15/24
.
5,000
161,105,000
(1,175,000)
Bank
of
America
Corp.,
October
Strike
Price
$42.00,
Expires
10/18/24
........................................
20,000
79,360,000
(560,000)
Boeing
Co.
(The),
November
Strike
Price
$185.00,
Expires
11/15/24
........................................
10,000
152,040,000
(1,570,000)
Citigroup,
Inc.,
October
Strike
Price
$65.00,
Expires
10/18/24
..
10,000
62,600,000
(850,000)
CVS
Health
Corp.,
October
Strike
Price
$60.00,
Expires
10/18/24
5,000
31,440,000
(2,010,000)
Duke
Energy
Corp.,
October
Strike
Price
$115.00,
Expires
10/18/24
........................................
5,000
57,650,000
(975,000)
Home
Depot,
Inc.
(The),
November
Strike
Price
$420.00,
Expires
11/15/24
........................................
5,000
202,600,000
(4,385,000)
Honeywell
International,
Inc.,
October
Strike
Price
$210.00,
Expires
10/18/24
..................................
5,000
103,355,000
(990,000)
International
Business
Machines
Corp.,
October
Strike
Price
$200.00,
Expires
10/18/24
...........................
7,500
165,810,000
(15,682,500)
JPMorgan
Chase
&
Co.,
November
Strike
Price
$225.00,
Expires
11/15/24
........................................
10,000
210,860,000
(2,620,000)
Lockheed
Martin
Corp.,
October
Strike
Price
$575.00,
Expires
10/18/24
........................................
2,500
146,140,000
(3,230,000)
Franklin
Custodian
Funds
Schedule
of
Investments
Franklin
Income
Fund
(continued)
Annual
Report
The
accompanying
notes
are
an
integral
part
of
these
financial
statements.
See
Abbreviations
on
page
100
.
a
a
a
Number
of
Contracts
Notional
Amount
#
a
Value
a
a
a
a
a
a
p
Options
Written
(continued)
Calls
-
Exchange-Traded
(continued)
Equity
Options
(continued)
PepsiCo,
Inc.,
November
Strike
Price
$185.00,
Expires
11/15/24
10,000
170,050,000
$
(620,000)
Procter
&
Gamble
Co.
(The),
October
Strike
Price
$175.00,
Expires
10/18/24
..................................
10,000
173,200,000
(2,230,000)
Rio
Tinto
plc,
November
Strike
Price
$75.00,
Expires
11/15/24
..
5,000
35,585,000
(650,000)
Rio
Tinto
plc,
December
Strike
Price
$75.00,
Expires
12/20/24
.
5,000
35,585,000
(1,000,000)
(39,642,500)
Puts
-
Exchange-Traded
Equity
Options
Abbott
Laboratories,
Inc.,
October
Strike
Price
$105.00,
Expires
10/18/24
........................................
5,000
57,005,000
(270,000)
Amgen,
Inc.,
November
Strike
Price
$300.00,
Expires
11/15/24
.
5,000
161,105,000
(3,625,000)
Boeing
Co.
(The),
November
Strike
Price
$145.00,
Expires
11/15/24
........................................
10,000
152,040,000
(6,030,000)
Exxon
Mobil
Corp.,
October
Strike
Price
$105.00,
Expires
10/18/24
........................................
10,000
117,220,000
(160,000)
Exxon
Mobil
Corp.,
November
Strike
Price
$105.00,
Expires
11/15/24
........................................
15,000
175,830,000
(1,320,000)
Honeywell
International,
Inc.,
October
Strike
Price
$190.00,
Expires
10/18/24
..................................
5,000
103,355,000
(150,000)
International
Business
Machines
Corp.,
October
Strike
Price
$185.00,
Expires
10/18/24
...........................
5,000
110,540,000
(50,000)
JPMorgan
Chase
&
Co.,
October
Strike
Price
$185.00,
Expires
10/18/24
........................................
10,000
210,860,000
(360,000)
Microsoft
Corp.,
November
Strike
Price
$360.00,
Expires
11/15/24
5,000
215,150,000
(595,000)
PepsiCo,
Inc.,
November
Strike
Price
$170.00,
Expires
11/15/24
5,000
85,025,000
(2,175,000)
Procter
&
Gamble
Co.
(The),
October
Strike
Price
$160.00,
Expires
10/18/24
..................................
10,000
173,200,000
(420,000)
Procter
&
Gamble
Co.
(The),
November
Strike
Price
$160.00,
Expires
11/15/24
..................................
10,000
173,200,000
(960,000)
Schlumberger
NV,
November
Strike
Price
$40.00,
Expires
11/15/24
........................................
10,000
41,950,000
(1,210,000)
Starbucks
Corp.,
October
Strike
Price
$85.00,
Expires
10/18/24
10,000
97,490,000
(100,000)
(17,425,000)
Total
Options
Written
(Premiums
received
$44,798,643)
........................
$
(57,067,500)
#
Notional
amount
is
the
number
of
contracts
multiplied
by
contract
size,
and
may
be
multiplied
by
the
underlying
price.
May
include
currency
units,
bushels,
shares,
pounds,
barrels
or
other
units.
Currency
units
are
stated
in
U.S.
dollars
unless
otherwise
indicated.
*
The
principal
amount
is
stated
in
U.S.
dollars
unless
otherwise
indicated.
†
Rounds
to
less
than
0.1%
of
net
assets.
a
Non-income
producing.
b
A
portion
or
all
of
the
security
is
held
in
connection
with
written
option
contracts
open
at
year
end.
c
See
Note
10
regarding
holdings
of
5%
voting
securities.
d
See
Note
3(f)
regarding
investments
in
affiliated
management
investment
companies.
e
Fair
valued
using
significant
unobservable
inputs.
See
Note
12
regarding
fair
value
measurements.
Franklin
Custodian
Funds
Schedule
of
Investments
Franklin
Income
Fund
(continued)
The
accompanying
notes
are
an
integral
part
of
these
financial
statements.
Annual
Report
f
Security
is
a
business
development
company.
See
Note
1(f).
g
See
Note
1(d)
regarding
equity-linked
securities.
h
Security
was
purchased
pursuant
to
Rule
144A
or
Regulation
S
under
the
Securities
Act
of
1933.
144A
securities
may
be
sold
in
transactions
exempt
from
registration
only
to
qualified
institutional
buyers
or
in
a
public
offering
registered
under
the
Securities
Act
of
1933.
Regulation
S
securities
cannot
be
sold
in
the
United
States
without
either
an
effective
registration
statement
filed
pursuant
to
the
Securities
Act
of
1933,
or
pursuant
to
an
exemption
from
registration.
At
September
30,
2024,
the
aggregate
value
of
these
securities
was
$31,534,317,282,
representing
41.6%
of
net
assets.
i
A
portion
or
all
of
the
security
is
on
loan
at
September
30,
2024.
See
Note
1(e).
j
Perpetual
security
with
no
stated
maturity
date.
k
Income
may
be
received
in
additional
securities
and/or
cash.
l
See
Note
1(g)
regarding
senior
floating
rate
interests.
m
The
coupon
rate
shown
represents
the
rate
inclusive
of
any
caps
or
floors,
if
applicable,
in
effect
at
period
end.
n
The
rate
shown
is
the
annualized
seven-day
effective
yield
at
period
end.
o
See
Note
1(e)
regarding
securities
on
loan.
p
See
Note
1(c)
regarding
written
options.
Financial
Highlights
Franklin
U.S.
Government
Securities
Fund
Annual
Report
The
accompanying
notes
are
an
integral
part
of
these
financial
statements.
1
a
Year
Ended
September
30,
2024
2023
2022
2021
2020
Class
A
Per
share
operating
performance
(for
a
share
outstanding
throughout
the
year)
Net
asset
value,
beginning
of
year
...................
$4.86
$5.03
$5.89
$6.09
$6.07
Income
from
investment
operations
a
:
Net
investment
income
b
.........................
0.14
0.12
0.08
0.05
0.10
Net
realized
and
unrealized
gains
(losses)
...........
0.35
(0.14)
(0.81)
(0.12)
0.08
Total
from
investment
operations
....................
0.49
(0.02)
(0.73)
(0.07)
0.18
Less
distributions
from:
Net
investment
income
..........................
(0.16)
(0.15)
(0.13)
(0.13)
(0.16)
Net
asset
value,
end
of
year
.......................
$5.19
$4.86
$5.03
$5.89
$6.09
Total
return
c
...................................
10.25%
(0.49)%
(12.50)%
(1.15)%
3.01%
Ratios
to
average
net
assets
Expenses
before
waiver
and
payments
by
affiliates
......
0.85%
0.81%
0.87%
0.87%
0.89%
Expenses
net
of
waiver
and
payments
by
affiliates
.......
0.84%
0.80%
0.86%
d
0.87%
d,e
0.88%
d
Net
investment
income
...........................
2.79%
2.45%
1.44%
0.79%
1.58%
Supplemental
data
Net
assets,
end
of
year
(000’s)
.....................
$592,336
$607,527
$687,607
$1,020,574
$1,097,545
Portfolio
turnover
rate
............................
30.97%
2.81%
53.63%
89.16%
65.54%
a
The
amount
shown
for
a
share
outstanding
throughout
the
period
may
not
correlate
with
the
Statement
of
Operations
for
the
period
due
to
the
timing
of
sales
and
repurchases
of
the
Fund’s
shares
in
relation
to
income
earned
and/or
fluctuating
fair
value
of
the
investments
of
the
Fund.
b
Based
on
average
daily
shares
outstanding.
c
Total
return
does
not
reflect
sales
commissions
or
contingent
deferred
sales
charges,
if
applicable.
d
Benefit
of
expense
reduction
rounds
to
less
than
0.01%.
e
Benefit
of
waiver
and
payments
by
affiliates
rounds
to
less
than
0.01%.
Franklin
Custodian
Funds
Financial
Highlights
Franklin
U.S.
Government
Securities
Fund
(continued)
The
accompanying
notes
are
an
integral
part
of
these
financial
statements.
Annual
Report
a
Year
Ended
September
30,
2024
2023
2022
2021
2020
Class
A1
Per
share
operating
performance
(for
a
share
outstanding
throughout
the
year)
Net
asset
value,
beginning
of
year
...................
$4.86
$5.03
$5.90
$6.09
$6.07
Income
from
investment
operations
a
:
Net
investment
income
b
.........................
0.15
0.13
0.09
0.05
0.10
Net
realized
and
unrealized
gains
(losses)
...........
0.36
(0.14)
(0.82)
(0.10)
0.09
Total
from
investment
operations
....................
0.51
(0.01)
(0.73)
(0.05)
0.19
Less
distributions
from:
Net
investment
income
..........................
(0.17)
(0.16)
(0.14)
(0.14)
(0.17)
Net
asset
value,
end
of
year
.......................
$5.20
$4.86
$5.03
$5.90
$6.09
Total
return
c
...................................
10.58%
(0.38)%
(12.55)%
(0.89)%
3.09%
Ratios
to
average
net
assets
Expenses
before
waiver
and
payments
by
affiliates
......
0.74%
0.70%
0.76%
0.77%
0.78%
Expenses
net
of
waiver
and
payments
by
affiliates
.......
0.74%
d
0.69%
0.76%
d,e
0.76%
e
0.77%
e
Net
investment
income
...........................
2.90%
2.55%
1.56%
0.90%
1.69%
Supplemental
data
Net
assets,
end
of
year
(000’s)
.....................
$1,293,199
$1,362,598
$1,592,268
$2,104,978
$2,661,888
Portfolio
turnover
rate
............................
30.97%
2.81%
53.63%
89.16%
65.54%
a
The
amount
shown
for
a
share
outstanding
throughout
the
period
may
not
correlate
with
the
Statement
of
Operations
for
the
period
due
to
the
timing
of
sales
and
repurchases
of
the
Fund’s
shares
in
relation
to
income
earned
and/or
fluctuating
fair
value
of
the
investments
of
the
Fund.
b
Based
on
average
daily
shares
outstanding.
c
Total
return
does
not
reflect
sales
commissions
or
contingent
deferred
sales
charges,
if
applicable.
d
Benefit
of
waiver
and
payments
by
affiliates
rounds
to
less
than
0.01%.
e
Benefit
of
expense
reduction
rounds
to
less
than
0.01%.
Franklin
Custodian
Funds
Financial
Highlights
Franklin
U.S.
Government
Securities
Fund
(continued)
Annual
Report
The
accompanying
notes
are
an
integral
part
of
these
financial
statements.
a
Year
Ended
September
30,
2024
2023
2022
2021
2020
Class
C
Per
share
operating
performance
(for
a
share
outstanding
throughout
the
year)
Net
asset
value,
beginning
of
year
...................
$4.82
$5.00
$5.85
$6.04
$6.03
Income
from
investment
operations
a
:
Net
investment
income
b
.........................
0.12
0.10
0.06
0.02
0.07
Net
realized
and
unrealized
gains
(losses)
...........
0.35
(0.15)
(0.80)
(0.10)
0.08
Total
from
investment
operations
....................
0.47
(0.05)
(0.74)
(0.08)
0.15
Less
distributions
from:
Net
investment
income
..........................
(0.14)
(0.13)
(0.11)
(0.11)
(0.14)
Net
asset
value,
end
of
year
.......................
$5.15
$4.82
$5.00
$5.85
$6.04
Total
return
c
...................................
9.88%
(1.12)%
(12.77)%
(1.41)%
2.43%
Ratios
to
average
net
assets
Expenses
before
waiver
and
payments
by
affiliates
......
1.25%
1.21%
1.27%
1.27%
1.29%
Expenses
net
of
waiver
and
payments
by
affiliates
.......
1.24%
1.20%
1.26%
d
1.27%
d,e
1.28%
d
Net
investment
income
...........................
2.39%
2.04%
1.04%
0.39%
1.18%
Supplemental
data
Net
assets,
end
of
year
(000’s)
.....................
$43,646
$60,693
$116,145
$196,643
$354,483
Portfolio
turnover
rate
............................
30.97%
2.81%
53.63%
89.16%
65.54%
a
The
amount
shown
for
a
share
outstanding
throughout
the
period
may
not
correlate
with
the
Statement
of
Operations
for
the
period
due
to
the
timing
of
sales
and
repurchases
of
the
Fund’s
shares
in
relation
to
income
earned
and/or
fluctuating
fair
value
of
the
investments
of
the
Fund.
b
Based
on
average
daily
shares
outstanding.
c
Total
return
does
not
reflect
sales
commissions
or
contingent
deferred
sales
charges,
if
applicable.
d
Benefit
of
expense
reduction
rounds
to
less
than
0.01%.
e
Benefit
of
waiver
and
payments
by
affiliates
rounds
to
less
than
0.01%.
Franklin
Custodian
Funds
Financial
Highlights
Franklin
U.S.
Government
Securities
Fund
(continued)
The
accompanying
notes
are
an
integral
part
of
these
financial
statements.
Annual
Report
a
Year
Ended
September
30,
2024
2023
2022
2021
2020
Class
R
Per
share
operating
performance
(for
a
share
outstanding
throughout
the
year)
Net
asset
value,
beginning
of
year
...................
$4.86
$5.03
$5.89
$6.09
$6.07
Income
from
investment
operations
a
:
Net
investment
income
b
.........................
0.13
0.11
0.07
0.03
0.08
Net
realized
and
unrealized
gains
(losses)
...........
0.35
(0.14)
(0.81)
(0.11)
0.08
Total
from
investment
operations
....................
0.48
(0.03)
(0.74)
(0.08)
0.16
Less
distributions
from:
Net
investment
income
..........................
(0.15)
(0.14)
(0.12)
(0.12)
(0.14)
Net
asset
value,
end
of
year
.......................
$5.19
$4.86
$5.03
$5.89
$6.09
Total
return
....................................
9.97%
(0.74)%
(12.72)%
(1.41)%
2.73%
Ratios
to
average
net
assets
Expenses
before
waiver
and
payments
by
affiliates
......
1.10%
1.05%
1.12%
1.11%
1.13%
Expenses
net
of
waiver
and
payments
by
affiliates
.......
1.09%
1.05%
c
1.11%
d
1.11%
c,d
1.12%
d
Net
investment
income
...........................
2.54%
2.20%
1.20%
0.55%
1.34%
Supplemental
data
Net
assets,
end
of
year
(000’s)
.....................
$13,803
$14,078
$15,476
$19,513
$27,746
Portfolio
turnover
rate
............................
30.97%
2.81%
53.63%
89.16%
65.54%
a
The
amount
shown
for
a
share
outstanding
throughout
the
period
may
not
correlate
with
the
Statement
of
Operations
for
the
period
due
to
the
timing
of
sales
and
repurchases
of
the
Fund’s
shares
in
relation
to
income
earned
and/or
fluctuating
fair
value
of
the
investments
of
the
Fund.
b
Based
on
average
daily
shares
outstanding.
c
Benefit
of
waiver
and
payments
by
affiliates
rounds
to
less
than
0.01%.
d
Benefit
of
expense
reduction
rounds
to
less
than
0.01%.
Franklin
Custodian
Funds
Financial
Highlights
Franklin
U.S.
Government
Securities
Fund
(continued)
Annual
Report
The
accompanying
notes
are
an
integral
part
of
these
financial
statements.
a
Year
Ended
September
30,
2024
2023
2022
2021
2020
Class
R6
Per
share
operating
performance
(for
a
share
outstanding
throughout
the
year)
Net
asset
value,
beginning
of
year
...................
$4.88
$5.06
$5.92
$6.12
$6.10
Income
from
investment
operations
a
:
Net
investment
income
b
.........................
0.16
0.14
0.10
0.07
0.12
Net
realized
and
unrealized
gains
(losses)
...........
0.36
(0.15)
(0.81)
(0.12)
0.08
Total
from
investment
operations
....................
0.52
(0.01)
(0.71)
(0.05)
0.20
Less
distributions
from:
Net
investment
income
..........................
(0.18)
(0.17)
(0.15)
(0.15)
(0.18)
Net
asset
value,
end
of
year
.......................
$5.22
$4.88
$5.06
$5.92
$6.12
Total
return
....................................
10.81%
(0.34)%
(12.11)%
(0.80)%
3.34%
Ratios
to
average
net
assets
Expenses
before
waiver
and
payments
by
affiliates
......
0.51%
0.46%
0.50%
0.53%
0.54%
Expenses
net
of
waiver
and
payments
by
affiliates
.......
0.50%
0.45%
0.50%
c,d
0.51%
c
0.52%
c
Net
investment
income
...........................
3.14%
2.80%
1.81%
1.15%
1.96%
Supplemental
data
Net
assets,
end
of
year
(000’s)
.....................
$186,048
$204,317
$202,611
$304,650
$361,791
Portfolio
turnover
rate
............................
30.97%
2.81%
53.63%
89.16%
65.54%
a
The
amount
shown
for
a
share
outstanding
throughout
the
period
may
not
correlate
with
the
Statement
of
Operations
for
the
period
due
to
the
timing
of
sales
and
repurchases
of
the
Fund’s
shares
in
relation
to
income
earned
and/or
fluctuating
fair
value
of
the
investments
of
the
Fund.
b
Based
on
average
daily
shares
outstanding.
c
Benefit
of
expense
reduction
rounds
to
less
than
0.01%.
d
Benefit
of
waiver
and
payments
by
affiliates
rounds
to
less
than
0.01%.
Franklin
Custodian
Funds
Financial
Highlights
Franklin
U.S.
Government
Securities
Fund
(continued)
The
accompanying
notes
are
an
integral
part
of
these
financial
statements.
Annual
Report
a
Year
Ended
September
30,
2024
2023
2022
2021
2020
Advisor
Class
Per
share
operating
performance
(for
a
share
outstanding
throughout
the
year)
Net
asset
value,
beginning
of
year
...................
$4.88
$5.05
$5.92
$6.11
$6.10
Income
from
investment
operations
a
:
Net
investment
income
b
.........................
0.15
0.14
0.09
0.06
0.11
Net
realized
and
unrealized
gains
(losses)
...........
0.35
(0.15)
(0.81)
(0.10)
0.07
Total
from
investment
operations
....................
0.50
(0.01)
(0.72)
(0.04)
0.18
Less
distributions
from:
Net
investment
income
..........................
(0.17)
(0.16)
(0.15)
(0.15)
(0.17)
Net
asset
value,
end
of
year
.......................
$5.21
$4.88
$5.05
$5.92
$6.11
Total
return
....................................
10.48%
(0.24)%
(12.39)%
(0.74)%
3.23%
Ratios
to
average
net
assets
Expenses
before
waiver
and
payments
by
affiliates
......
0.60%
0.55%
0.62%
0.62%
0.64%
Expenses
net
of
waiver
and
payments
by
affiliates
.......
0.59%
0.55%
c
0.61%
d
0.62%
c,d
0.63%
d
Net
investment
income
...........................
3.04%
2.70%
1.67%
1.04%
1.84%
Supplemental
data
Net
assets,
end
of
year
(000’s)
.....................
$255,448
$262,569
$300,303
$692,010
$743,012
Portfolio
turnover
rate
............................
30.97%
2.81%
53.63%
89.16%
65.54%
a
The
amount
shown
for
a
share
outstanding
throughout
the
period
may
not
correlate
with
the
Statement
of
Operations
for
the
period
due
to
the
timing
of
sales
and
repurchases
of
the
Fund’s
shares
in
relation
to
income
earned
and/or
fluctuating
fair
value
of
the
investments
of
the
Fund.
b
Based
on
average
daily
shares
outstanding.
c
Benefit
of
waiver
and
payments
by
affiliates
rounds
to
less
than
0.01%.
d
Benefit
of
expense
reduction
rounds
to
less
than
0.01%.
Schedule
of
Investments,
September
30,
2024
Franklin
U.S.
Government
Securities
Fund
Annual
Report
The
accompanying
notes
are
an
integral
part
of
these
financial
statements.
a
a
Principal
Amount
a
Value
a
a
a
a
a
U.S.
Government
and
Agency
Securities
3.5%
U.S.
Treasury
Bonds
,
4.75
%,
2/15/37
...................................................
$
37,500,000
$
40,984,864
4.5
%,
2/15/44
....................................................
33,400,000
34,861,250
4.625
%,
5/15/54
...................................................
6,000,000
6,509,531
Total
U.S.
Government
and
Agency
Securities
(Cost
$
80,372,240
)
.................
82,355,645
Mortgage-Backed
Securities
94.8%
Government
National
Mortgage
Association
(GNMA)
Fixed
Rate
94.8%
GNMA
I,
30
Year
,
4.5
%,
4/15/40
........................................
2,998,933
3,031,436
GNMA
I,
30
Year
,
5
%,
9/15/40
..........................................
104,197,925
106,600,686
GNMA
I,
30
Year
,
5.5
%,
2/15/40
........................................
45,094,060
46,703,535
GNMA
I,
30
Year
,
6
%,
12/15/39
.........................................
41,238,084
43,282,013
GNMA
I,
30
Year
,
6.5
%,
8/15/37
........................................
9,196,578
9,575,858
GNMA
I,
30
Year
,
7
%,
9/15/32
..........................................
5,638,755
5,971,400
GNMA
I,
30
Year
,
7.5
%,
7/15/26
-
8/15/33
.................................
388,014
405,457
GNMA
I,
30
Year
,
8
%,
10/15/29
.........................................
822
859
GNMA
I,
Single-family,
30
Year
,
3.5
%,
4/15/43
-
5/15/43
......................
9,748,323
9,389,137
GNMA
I,
Single-family,
30
Year
,
4
%,
10/15/40
-
8/15/46
.......................
29,567,673
29,103,648
GNMA
I,
Single-family,
30
Year
,
4.5
%,
2/15/39
-
6/15/41
......................
55,539,965
56,041,008
GNMA
I,
Single-family,
30
Year
,
5
%,
2/15/35
...............................
1,817
1,811
GNMA
I,
Single-family,
30
Year
,
5.5
%,
10/15/48
.............................
542,583
552,644
GNMA
I,
Single-family,
30
Year
,
7.25
%,
12/15/25
............................
10,801
10,790
GNMA
I,
Single-family,
30
Year
,
7.5
%,
8/15/25
-
7/15/31
......................
621,362
629,606
GNMA
I,
Single-family,
30
Year
,
8
%,
10/15/24
-
9/15/30
.......................
212,434
213,871
GNMA
I,
Single-family,
30
Year
,
8.5
%,
11/15/24
.............................
5
5
GNMA
I,
Single-family,
30
Year
,
10
%,
2/15/25
..............................
320
320
GNMA
II,
30
Year
,
4.5
%,
5/20/34
-
6/20/41
.................................
2,503,523
2,533,273
GNMA
II,
30
Year
,
6
%,
3/20/34
-
9/20/34
..................................
804,706
815,629
GNMA
II,
30
Year
,
6
%,
7/20/39
.........................................
18,506,733
19,356,901
GNMA
II,
30
Year
,
6.5
%,
9/20/31
-
9/20/32
.................................
695,162
723,509
GNMA
II,
30
Year
,
7
%,
7/20/32
.........................................
202,150
212,873
GNMA
II,
30
Year
,
8
%,
12/20/28
........................................
14,867
14,892
GNMA
II,
Single-family,
30
Year
,
2
%,
8/20/51
...............................
156,257,804
132,588,955
GNMA
II,
Single-family,
30
Year
,
2
%,
2/20/51
-
4/20/52
.......................
60,310,603
51,180,276
GNMA
II,
Single-family,
30
Year
,
2.5
%,
11/20/50
............................
13,421,480
11,568,589
GNMA
II,
Single-family,
30
Year
,
2.5
%,
7/20/51
.............................
64,780,725
57,144,577
GNMA
II,
Single-family,
30
Year
,
2.5
%,
8/20/51
.............................
195,254,822
172,189,774
GNMA
II,
Single-family,
30
Year
,
2.5
%,
9/20/51
.............................
80,321,724
70,815,542
GNMA
II,
Single-family,
30
Year
,
2.5
%,
10/20/51
............................
56,157,467
49,510,557
GNMA
II,
Single-family,
30
Year
,
2.5
%,
12/20/51
............................
78,124,470
68,882,881
GNMA
II,
Single-family,
30
Year
,
2.5
%,
1/20/52
.............................
31,883,903
28,109,403
GNMA
II,
Single-family,
30
Year
,
2.5
%,
6/20/52
.............................
694,204
612,020
GNMA
II,
Single-family,
30
Year
,
3
%,
10/20/44
..............................
16,687,676
15,515,675
GNMA
II,
Single-family,
30
Year
,
3
%,
5/20/45
...............................
12,144,655
11,280,582
GNMA
II,
Single-family,
30
Year
,
3
%,
4/20/46
...............................
16,273,152
15,068,127
GNMA
II,
Single-family,
30
Year
,
3
%,
9/20/47
...............................
13,144,357
12,107,603
GNMA
II,
Single-family,
30
Year
,
3
%,
10/20/47
..............................
20,973,318
19,349,395
GNMA
II,
Single-family,
30
Year
,
3
%,
6/20/50
...............................
9,939,544
8,869,473
GNMA
II,
Single-family,
30
Year
,
3
%,
8/20/51
...............................
116,515,941
106,368,519
GNMA
II,
Single-family,
30
Year
,
3
%,
9/20/51
...............................
24,786,750
22,623,168
GNMA
II,
Single-family,
30
Year
,
3
%,
12/20/44
-
10/20/50
......................
71,076,943
64,322,520
GNMA
II,
Single-family,
30
Year
,
3.5
%,
7/20/42
.............................
25,960,500
24,932,211
GNMA
II,
Single-family,
30
Year
,
3.5
%,
9/20/42
.............................
32,678,213
31,338,468
GNMA
II,
Single-family,
30
Year
,
3.5
%,
5/20/43
.............................
9,778,442
9,380,301
GNMA
II,
Single-family,
30
Year
,
3.5
%,
6/20/43
.............................
11,289,983
10,830,870
GNMA
II,
Single-family,
30
Year
,
3.5
%,
9/20/47
.............................
116,926,092
110,893,862
GNMA
II,
Single-family,
30
Year
,
3.5
%,
11/20/47
............................
78,011,398
74,011,097
GNMA
II,
Single-family,
30
Year
,
3.5
%,
10/20/40
-
1/20/49
.....................
42,580,250
40,767,042
Franklin
Custodian
Funds
Schedule
of
Investments
Franklin
U.S.
Government
Securities
Fund
(continued)
The
accompanying
notes
are
an
integral
part
of
these
financial
statements.
Annual
Report
a
a
Principal
Amount
a
Value
a
a
a
a
a
Mortgage-Backed
Securities
(continued)
Government
National
Mortgage
Association
(GNMA)
Fixed
Rate
(continued)
GNMA
II,
Single-family,
30
Year
,
4
%,
11/20/40
..............................
$
8,534,663
$
8,474,752
GNMA
II,
Single-family,
30
Year
,
4
%,
10/20/41
..............................
10,454,049
10,380,673
GNMA
II,
Single-family,
30
Year
,
4
%,
11/20/41
..............................
9,918,663
9,849,045
GNMA
II,
Single-family,
30
Year
,
4
%,
5/20/47
...............................
28,002,829
27,322,635
GNMA
II,
Single-family,
30
Year
,
4
%,
6/20/47
...............................
21,474,037
20,978,898
GNMA
II,
Single-family,
30
Year
,
4
%,
7/20/47
...............................
13,650,502
13,391,867
GNMA
II,
Single-family,
30
Year
,
4
%,
6/20/52
...............................
33,399,260
32,319,062
GNMA
II,
Single-family,
30
Year
,
4
%,
5/20/40
-
2/20/54
.......................
49,786,890
48,895,807
GNMA
II,
Single-family,
30
Year
,
4.5
%,
6/20/41
.............................
9,611,233
9,729,851
GNMA
II,
Single-family,
30
Year
,
4.5
%,
7/20/41
.............................
10,677,923
10,809,709
GNMA
II,
Single-family,
30
Year
,
4.5
%,
9/20/41
.............................
15,414,857
15,605,110
GNMA
II,
Single-family,
30
Year
,
4.5
%,
10/20/41
............................
10,887,996
11,022,382
GNMA
II,
Single-family,
30
Year
,
4.5
%,
5/20/52
.............................
34,784,301
34,420,324
GNMA
II,
Single-family,
30
Year
,
4.5
%,
5/20/33
-
7/20/54
......................
51,031,713
51,179,369
GNMA
II,
Single-family,
30
Year
,
5
%,
7/20/53
...............................
24,965,319
25,042,601
GNMA
II,
Single-family,
30
Year
,
5
%,
8/20/53
...............................
29,371,093
29,448,800
GNMA
II,
Single-family,
30
Year
,
5
%,
7/20/33
-
12/20/53
......................
28,148,682
28,856,394
GNMA
II,
Single-family,
30
Year
,
5.5
%,
7/20/53
.............................
23,821,181
24,081,582
GNMA
II,
Single-family,
30
Year
,
5.5
%,
1/20/54
.............................
48,577,726
49,078,406
GNMA
II,
Single-family,
30
Year
,
5.5
%,
6/20/34
-
9/20/54
......................
42,951,304
44,166,876
GNMA
II,
Single-family,
30
Year
,
6
%,
5/20/54
...............................
59,350,866
60,493,453
GNMA
II,
Single-family,
30
Year
,
6
%,
6/20/34
-
7/20/54
.......................
7,711,985
7,856,447
GNMA
II,
Single-family,
30
Year
,
6
%,
8/20/54
...............................
37,445,447
38,119,622
GNMA
II,
Single-family,
30
Year
,
6.5
%,
8/20/25
-
5/20/54
......................
17,602,062
18,153,890
GNMA
II,
Single-family,
30
Year
,
6.5
%,
8/20/54
.............................
36,386,998
37,265,137
GNMA
II,
Single-family,
30
Year
,
7
%,
2/20/28
-
7/20/33
.......................
1,419,743
1,477,356
GNMA
II,
Single-family,
30
Year
,
7
%,
7/20/54
...............................
35,691,870
36,688,248
GNMA
II,
Single-family,
30
Year
,
7.5
%,
10/20/25
-
4/20/32
.....................
138,295
142,785
GNMA
II,
Single-family,
30
Year
,
8
%,
12/20/24
-
6/20/30
......................
64,715
66,805
GNMA
II,
Single-family,
30
Year
,
8.5
%,
1/20/25
-
6/20/25
......................
13
12
GNMA
II,
Single-family,
30
Year
,
9.5
%,
1/20/25
.............................
15
15
2,260,750,561
Total
Mortgage-Backed
Securities
(Cost
$
2,452,498,920
)
.........................
2,260,750,561
Total
Long
Term
Investments
(Cost
$
2,532,871,160
)
.............................
2,343,106,206
a
a
a
a
a
Short
Term
Investments
1.5%
Shares
a
Money
Market
Funds
1.5%
a,b
Institutional
Fiduciary
Trust
-
Money
Market
Portfolio
,
4.74
%
...................
36,624,604
36,624,604
Total
Money
Market
Funds
(Cost
$
36,624,604
)
..................................
36,624,604
Total
Short
Term
Investments
(Cost
$
36,624,604
)
................................
36,624,604
a
Total
Investments
(Cost
$
2,569,495,764
)
99.8
%
..................................
$2,379,730,810
Other
Assets,
less
Liabilities
0.2
%
.............................................
4,748,706
Net
Assets
100.0%
...........................................................
$2,384,479,516
See
Abbreviations
on
page
100
.
a
See
Note
3
(
f
)
regarding
investments
in
affiliated
management
investment
companies.
b
The
rate
shown
is
the
annualized
seven-day
effective
yield
at
period
end.
Financial
Highlights
Franklin
Utilities
Fund
Annual
Report
The
accompanying
notes
are
an
integral
part
of
these
financial
statements.
a
Year
Ended
September
30,
2024
2023
2022
2021
2020
Class
A
Per
share
operating
performance
(for
a
share
outstanding
throughout
the
year)
Net
asset
value,
beginning
of
year
...................
$18.64
$20.26
$20.20
$19.76
$22.53
Income
from
investment
operations
a
:
Net
investment
income
b
.........................
0.52
0.49
0.46
0.43
0.51
Net
realized
and
unrealized
gains
(losses)
...........
6.74
(1.33)
0.67
1.94
(2.43)
Total
from
investment
operations
....................
7.26
(0.84)
1.13
2.37
(1.92)
Less
distributions
from:
Net
investment
income
..........................
(0.49)
(0.47)
(0.47)
(0.52)
(0.50)
Net
realized
gains
.............................
(0.74)
(0.31)
(0.60)
(1.41)
(0.35)
Total
distributions
...............................
(1.23)
(0.78)
(1.07)
(1.93)
(0.85)
Net
asset
value,
end
of
year
.......................
$24.67
$18.64
$20.26
$20.20
$19.76
Total
return
c
...................................
40.74%
(4.55)%
5.56%
12.29%
(8.68)%
Ratios
to
average
net
assets
Expenses
d
....................................
0.81%
0.81%
e
0.82%
e
0.82%
e
0.83%
e
Net
investment
income
...........................
2.54%
2.34%
2.08%
2.10%
2.46%
Supplemental
data
Net
assets,
end
of
year
(000’s)
.....................
$1,386,488
$1,116,740
$1,200,671
$982,201
$742,188
Portfolio
turnover
rate
............................
6.80%
4.43%
5.66%
5.18%
12.19%
a
The
amount
shown
for
a
share
outstanding
throughout
the
period
may
not
correlate
with
the
Statement
of
Operations
for
the
period
due
to
the
timing
of
sales
and
repurchases
of
the
Fund’s
shares
in
relation
to
income
earned
and/or
fluctuating
fair
value
of
the
investments
of
the
Fund.
b
Based
on
average
daily
shares
outstanding.
c
Total
return
does
not
reflect
sales
commissions
or
contingent
deferred
sales
charges,
if
applicable.
d
Benefit
of
waiver
and
payments
by
affiliates
rounds
to
less
than
0.01%.
e
Benefit
of
expense
reduction
rounds
to
less
than
0.01%.
Franklin
Custodian
Funds
Financial
Highlights
Franklin
Utilities
Fund
(continued)
The
accompanying
notes
are
an
integral
part
of
these
financial
statements.
Annual
Report
a
Year
Ended
September
30,
2024
2023
2022
2021
2020
Class
A1
Per
share
operating
performance
(for
a
share
outstanding
throughout
the
year)
Net
asset
value,
beginning
of
year
...................
$18.65
$20.27
$20.21
$19.77
$22.54
Income
from
investment
operations
a
:
Net
investment
income
b
.........................
0.54
0.50
0.47
0.45
0.52
Net
realized
and
unrealized
gains
(losses)
...........
6.74
(1.31)
0.68
1.94
(2.41)
Total
from
investment
operations
....................
7.28
(0.81)
1.15
2.39
(1.89)
Less
distributions
from:
Net
investment
income
..........................
(0.51)
(0.50)
(0.49)
(0.54)
(0.53)
Net
realized
gains
.............................
(0.74)
(0.31)
(0.60)
(1.41)
(0.35)
Total
distributions
...............................
(1.25)
(0.81)
(1.09)
(1.95)
(0.88)
Net
asset
value,
end
of
year
.......................
$24.68
$18.65
$20.27
$20.21
$19.77
Total
return
c
...................................
40.85%
(4.45)%
5.67%
12.40%
(8.59)%
Ratios
to
average
net
assets
Expenses
d
....................................
0.71%
0.71%
e
0.72%
e
0.72%
e
0.73%
e
Net
investment
income
...........................
2.65%
2.42%
2.16%
2.20%
2.50%
Supplemental
data
Net
assets,
end
of
year
(000’s)
.....................
$3,373,642
$2,752,653
$3,230,150
$3,321,370
$3,388,126
Portfolio
turnover
rate
............................
6.80%
4.43%
5.66%
5.18%
12.19%
a
The
amount
shown
for
a
share
outstanding
throughout
the
period
may
not
correlate
with
the
Statement
of
Operations
for
the
period
due
to
the
timing
of
sales
and
repurchases
of
the
Fund’s
shares
in
relation
to
income
earned
and/or
fluctuating
fair
value
of
the
investments
of
the
Fund.
b
Based
on
average
daily
shares
outstanding.
c
Total
return
does
not
reflect
sales
commissions
or
contingent
deferred
sales
charges,
if
applicable.
d
Benefit
of
waiver
and
payments
by
affiliates
rounds
to
less
than
0.01%.
e
Benefit
of
expense
reduction
rounds
to
less
than
0.01%.
Franklin
Custodian
Funds
Financial
Highlights
Franklin
Utilities
Fund
(continued)
Annual
Report
The
accompanying
notes
are
an
integral
part
of
these
financial
statements.
a
Year
Ended
September
30,
2024
2023
2022
2021
2020
Class
C
Per
share
operating
performance
(for
a
share
outstanding
throughout
the
year)
Net
asset
value,
beginning
of
year
...................
$18.53
$20.14
$20.09
$19.65
$22.42
Income
from
investment
operations
a
:
Net
investment
income
b
.........................
0.43
0.39
0.36
0.34
0.41
Net
realized
and
unrealized
gains
(losses)
...........
6.70
(1.30)
0.67
1.95
(2.41)
Total
from
investment
operations
....................
7.13
(0.91)
1.03
2.29
(2.00)
Less
distributions
from:
Net
investment
income
..........................
(0.41)
(0.39)
(0.38)
(0.44)
(0.42)
Net
realized
gains
.............................
(0.74)
(0.31)
(0.60)
(1.41)
(0.35)
Total
distributions
...............................
(1.15)
(0.70)
(0.98)
(1.85)
(0.77)
Net
asset
value,
end
of
year
.......................
$24.51
$18.53
$20.14
$20.09
$19.65
Total
return
c
...................................
40.18%
(4.91)%
5.11%
11.91%
(9.10)%
Ratios
to
average
net
assets
Expenses
d
....................................
1.21%
1.21%
e
1.22%
e
1.22%
e
1.23%
e
Net
investment
income
...........................
2.13%
1.90%
1.66%
1.69%
1.98%
Supplemental
data
Net
assets,
end
of
year
(000’s)
.....................
$214,725
$218,134
$302,959
$350,553
$537,808
Portfolio
turnover
rate
............................
6.80%
4.43%
5.66%
5.18%
12.19%
a
The
amount
shown
for
a
share
outstanding
throughout
the
period
may
not
correlate
with
the
Statement
of
Operations
for
the
period
due
to
the
timing
of
sales
and
repurchases
of
the
Fund’s
shares
in
relation
to
income
earned
and/or
fluctuating
fair
value
of
the
investments
of
the
Fund.
b
Based
on
average
daily
shares
outstanding.
c
Total
return
does
not
reflect
sales
commissions
or
contingent
deferred
sales
charges,
if
applicable.
d
Benefit
of
waiver
and
payments
by
affiliates
rounds
to
less
than
0.01%.
e
Benefit
of
expense
reduction
rounds
to
less
than
0.01%.
Franklin
Custodian
Funds
Financial
Highlights
Franklin
Utilities
Fund
(continued)
The
accompanying
notes
are
an
integral
part
of
these
financial
statements.
Annual
Report
a
Year
Ended
September
30,
2024
2023
2022
2021
2020
Class
R
Per
share
operating
performance
(for
a
share
outstanding
throughout
the
year)
Net
asset
value,
beginning
of
year
...................
$18.56
$20.17
$20.12
$19.68
$22.45
Income
from
investment
operations
a
:
Net
investment
income
b
.........................
0.47
0.43
0.40
0.38
0.44
Net
realized
and
unrealized
gains
(losses)
...........
6.70
(1.31)
0.67
1.94
(2.41)
Total
from
investment
operations
....................
7.17
(0.88)
1.07
2.32
(1.97)
Less
distributions
from:
Net
investment
income
..........................
(0.44)
(0.42)
(0.42)
(0.47)
(0.45)
Net
realized
gains
.............................
(0.74)
(0.31)
(0.60)
(1.41)
(0.35)
Total
distributions
...............................
(1.18)
(0.73)
(1.02)
(1.88)
(0.80)
Net
asset
value,
end
of
year
.......................
$24.55
$18.56
$20.17
$20.12
$19.68
Total
return
....................................
40.36%
(4.76)%
5.26%
12.06%
(8.95)%
Ratios
to
average
net
assets
Expenses
c
.....................................
1.06%
1.06%
d
1.07%
d
1.07%
d
1.08%
d
Net
investment
income
...........................
2.29%
2.08%
1.83%
1.85%
2.15%
Supplemental
data
Net
assets,
end
of
year
(000’s)
.....................
$105,849
$89,085
$103,579
$83,441
$84,488
Portfolio
turnover
rate
............................
6.80%
4.43%
5.66%
5.18%
12.19%
a
The
amount
shown
for
a
share
outstanding
throughout
the
period
may
not
correlate
with
the
Statement
of
Operations
for
the
period
due
to
the
timing
of
sales
and
repurchases
of
the
Fund’s
shares
in
relation
to
income
earned
and/or
fluctuating
fair
value
of
the
investments
of
the
Fund.
b
Based
on
average
daily
shares
outstanding.
c
Benefit
of
waiver
and
payments
by
affiliates
rounds
to
less
than
0.01%.
d
Benefit
of
expense
reduction
rounds
to
less
than
0.01%.
Franklin
Custodian
Funds
Financial
Highlights
Franklin
Utilities
Fund
(continued)
Annual
Report
The
accompanying
notes
are
an
integral
part
of
these
financial
statements.
a
Year
Ended
September
30,
2024
2023
2022
2021
2020
Class
R6
Per
share
operating
performance
(for
a
share
outstanding
throughout
the
year)
Net
asset
value,
beginning
of
year
...................
$18.84
$20.47
$20.40
$19.93
$22.73
Income
from
investment
operations
a
:
Net
investment
income
b
.........................
0.59
0.56
0.54
0.50
0.58
Net
realized
and
unrealized
gains
(losses)
...........
6.81
(1.34)
0.67
1.96
(2.46)
Total
from
investment
operations
....................
7.40
(0.78)
1.21
2.46
(1.88)
Less
distributions
from:
Net
investment
income
..........................
(0.55)
(0.54)
(0.54)
(0.58)
(0.57)
Net
realized
gains
.............................
(0.74)
(0.31)
(0.60)
(1.41)
(0.35)
Total
distributions
...............................
(1.29)
(0.85)
(1.14)
(1.99)
(0.92)
Net
asset
value,
end
of
year
.......................
$24.95
$18.84
$20.47
$20.40
$19.93
Total
return
....................................
41.15%
(4.24)%
5.90%
12.71%
(8.44)%
Ratios
to
average
net
assets
Expenses
before
waiver
and
payments
by
affiliates
......
0.52%
0.52%
0.54%
0.58%
0.56%
Expenses
net
of
waiver
and
payments
by
affiliates
.......
0.50%
0.49%
c
0.50%
c
0.50%
c
0.50%
c
Net
investment
income
...........................
2.85%
2.64%
2.41%
2.42%
2.75%
Supplemental
data
Net
assets,
end
of
year
(000’s)
.....................
$271,797
$187,585
$223,710
$153,969
$144,079
Portfolio
turnover
rate
............................
6.80%
4.43%
5.66%
5.18%
12.19%
a
The
amount
shown
for
a
share
outstanding
throughout
the
period
may
not
correlate
with
the
Statement
of
Operations
for
the
period
due
to
the
timing
of
sales
and
repurchases
of
the
Fund’s
shares
in
relation
to
income
earned
and/or
fluctuating
fair
value
of
the
investments
of
the
Fund.
b
Based
on
average
daily
shares
outstanding.
c
Benefit
of
expense
reduction
rounds
to
less
than
0.01%.
Franklin
Custodian
Funds
Financial
Highlights
Franklin
Utilities
Fund
(continued)
The
accompanying
notes
are
an
integral
part
of
these
financial
statements.
Annual
Report
a
Year
Ended
September
30,
2024
2023
2022
2021
2020
Advisor
Class
Per
share
operating
performance
(for
a
share
outstanding
throughout
the
year)
Net
asset
value,
beginning
of
year
...................
$18.84
$20.47
$20.40
$19.93
$22.73
Income
from
investment
operations
a
:
Net
investment
income
b
.........................
0.58
0.54
0.52
0.48
0.56
Net
realized
and
unrealized
gains
(losses)
...........
6.82
(1.33)
0.68
1.97
(2.46)
Total
from
investment
operations
....................
7.40
(0.79)
1.20
2.45
(1.90)
Less
distributions
from:
Net
investment
income
..........................
(0.54)
(0.53)
(0.53)
(0.57)
(0.55)
Net
realized
gains
.............................
(0.74)
(0.31)
(0.60)
(1.41)
(0.35)
Total
distributions
...............................
(1.28)
(0.84)
(1.13)
(1.98)
(0.90)
Net
asset
value,
end
of
year
.......................
$24.96
$18.84
$20.47
$20.40
$19.93
Total
return
....................................
41.12%
(4.31)%
5.82%
12.62%
(8.51)%
Ratios
to
average
net
assets
Expenses
c
.....................................
0.56%
0.56%
d
0.57%
d
0.57%
d
0.58%
d
Net
investment
income
...........................
2.79%
2.57%
2.32%
2.35%
2.66%
Supplemental
data
Net
assets,
end
of
year
(000’s)
.....................
$1,366,364
$1,134,602
$1,383,667
$1,200,859
$1,179,002
Portfolio
turnover
rate
............................
6.80%
4.43%
5.66%
5.18%
12.19%
a
The
amount
shown
for
a
share
outstanding
throughout
the
period
may
not
correlate
with
the
Statement
of
Operations
for
the
period
due
to
the
timing
of
sales
and
repurchases
of
the
Fund’s
shares
in
relation
to
income
earned
and/or
fluctuating
fair
value
of
the
investments
of
the
Fund.
b
Based
on
average
daily
shares
outstanding.
c
Benefit
of
waiver
and
payments
by
affiliates
rounds
to
less
than
0.01%.
d
Benefit
of
expense
reduction
rounds
to
less
than
0.01%.
Schedule
of
Investments,
September
30,
2024
Franklin
Utilities
Fund
Annual
Report
The
accompanying
notes
are
an
integral
part
of
these
financial
statements.
a
a
Country
Shares
a
Value
a
a
a
a
a
a
Common
Stocks
99.4%
Construction
&
Engineering
0.0%
†
MDU
Resources
Group,
Inc.
...........................
United
States
107,363
$
2,942,820
Electric
Utilities
58.0%
Alliant
Energy
Corp.
.................................
United
States
3,500,000
212,415,000
American
Electric
Power
Co.,
Inc.
.......................
United
States
1,000,000
102,600,000
Constellation
Energy
Corp.
............................
United
States
100,000
26,002,000
Duke
Energy
Corp.
..................................
United
States
2,300,000
265,190,000
Edison
International
.................................
United
States
3,900,000
339,651,000
Entergy
Corp.
......................................
United
States
2,300,000
302,703,000
Evergy,
Inc.
........................................
United
States
4,250,000
263,542,500
Eversource
Energy
..................................
United
States
1,500,000
102,075,000
Exelon
Corp.
.......................................
United
States
5,350,000
216,942,500
FirstEnergy
Corp.
...................................
United
States
3,200,000
141,920,000
a
Hawaiian
Electric
Industries,
Inc.
........................
United
States
2,702,702
26,162,155
NextEra
Energy,
Inc.
.................................
United
States
8,550,000
722,731,500
NRG
Energy,
Inc.
...................................
United
States
800,000
72,880,000
OGE
Energy
Corp.
..................................
United
States
1,600,000
65,632,000
PG&E
Corp.
.......................................
United
States
12,400,000
245,148,000
Pinnacle
West
Capital
Corp.
...........................
United
States
775,000
68,657,250
PPL
Corp.
.........................................
United
States
7,000,000
231,560,000
Southern
Co.
(The)
..................................
United
States
4,100,000
369,738,000
TXNM
Energy,
Inc.
..................................
United
States
1,600,000
70,032,000
Xcel
Energy,
Inc.
....................................
United
States
800,000
52,240,000
3,897,821,905
Gas
Utilities
1.5%
ONE
Gas,
Inc.
.....................................
United
States
682,494
50,791,203
Spire,
Inc.
.........................................
United
States
700,000
47,103,000
97,894,203
Independent
Power
and
Renewable
Electricity
Producers
6.8%
AES
Corp.
(The)
....................................
United
States
1,300,000
26,078,000
Clearway
Energy,
Inc.
,
C
..............................
United
States
900,000
27,612,000
Drax
Group
plc
.....................................
United
Kingdom
11,000,000
94,714,290
Vistra
Corp.
........................................
United
States
2,600,000
308,204,000
456,608,290
Multi-Utilities
28.4%
Ameren
Corp.
......................................
United
States
1,800,000
157,428,000
CenterPoint
Energy,
Inc.
..............................
United
States
6,050,000
177,991,000
CMS
Energy
Corp.
..................................
United
States
2,600,000
183,638,000
Dominion
Energy,
Inc.
................................
United
States
2,137,717
123,538,666
DTE
Energy
Co.
....................................
United
States
1,500,000
192,615,000
E.ON
SE
..........................................
Germany
9,000,000
134,039,506
National
Grid
plc
....................................
United
Kingdom
7,458,333
103,104,310
NiSource,
Inc.
......................................
United
States
6,300,000
218,295,000
Northwestern
Energy
Group,
Inc.
.......................
United
States
1,300,000
74,386,000
Public
Service
Enterprise
Group,
Inc.
....................
United
States
2,200,000
196,262,000
Sempra
...........................................
United
States
3,550,000
296,886,500
WEC
Energy
Group,
Inc.
..............................
United
States
500,000
48,090,000
1,906,273,982
Oil,
Gas
&
Consumable
Fuels
3.8%
Cheniere
Energy,
Inc.
................................
United
States
650,000
116,896,000
DT
Midstream,
Inc.
..................................
United
States
1,000,000
78,660,000
Williams
Cos.,
Inc.
(The)
..............................
United
States
1,300,000
59,345,000
254,901,000
Franklin
Custodian
Funds
Schedule
of
Investments
Franklin
Utilities
Fund
(continued)
The
accompanying
notes
are
an
integral
part
of
these
financial
statements.
Annual
Report
a
a
Country
Shares
a
Value
a
a
a
a
a
a
Common
Stocks
(continued)
Water
Utilities
0.9%
Essential
Utilities,
Inc.
................................
United
States
900,000
$
34,713,000
United
Utilities
Group
plc
..............................
United
Kingdom
2,000,000
28,042,738
62,755,738
Total
Common
Stocks
(Cost
$
2,796,002,869
)
..................................
6,679,197,938
Short
Term
Investments
0.5%
a
a
Country
Shares
a
Value
a
a
a
a
a
a
Money
Market
Funds
0.5%
b,c
Institutional
Fiduciary
Trust
-
Money
Market
Portfolio
,
4.74
%
...
United
States
31,088,886
31,088,886
Total
Money
Market
Funds
(Cost
$
31,088,886
)
................................
31,088,886
Total
Short
Term
Investments
(Cost
$
31,088,886
)
..............................
31,088,886
a
Total
Investments
(Cost
$
2,827,091,755
)
99.9
%
................................
$6,710,286,824
Other
Assets,
less
Liabilities
0.1
%
...........................................
8,577,467
Net
Assets
100.0%
.........................................................
$6,718,864,291
a
a
a
†
Rounds
to
less
than
0.1%
of
net
assets.
a
Non-income
producing.
b
See
Note
3(f)
regarding
investments
in
affiliated
management
investment
companies.
c
The
rate
shown
is
the
annualized
seven-day
effective
yield
at
period
end.
Franklin
Custodian
Funds
Financial
Statements
Statements
of
Assets
and
Liabilities
September
30,
2024
Annual
Report
The
accompanying
notes
are
an
integral
part
of
these
financial
statements.
Franklin
DynaTech
Fund
Franklin
Growth
Fund
Franklin
Income
Fund
Assets:
Investments
in
securities:
Cost
-
Unaffiliated
issuers
.................................
$9,563,643,922
$4,803,067,965
$69,902,737,692
Cost
-
Non-controlled
affiliates
(Note
3
f
and
10
)
.................
240,094,622
135,466,860
915,459,661
Value
-
Unaffiliated
issuers
(Includes
securities
loaned
of
$20,058,814,
$2,972,034
and
$169,729,589,
respectively)
...................
$25,187,325,637
$19,249,321,307
$74,252,366,762
Value
-
Non-controlled
affiliate
s
(Note
3f
and
10)
................
240,094,622
135,466,860
947,048,696
Cash
..................................................
—
2,827,230
18,239,977
Receivables:
Investment
securities
sold
(Includes
securities
loaned
$–,
$–
and
$3,117,
respectively)
.....................................
—
—
152,190,284
Capital
shares
sold
......................................
45,046,944
13,302,131
34,530,032
Dividends
and
interest
...................................
4,514,621
6,496,624
666,190,306
European
Union
tax
reclaims
(Note
1
h
)
.......................
—
—
13,735,098
Total
assets
........................................
25,476,981,824
19,407,414,152
76,084,301,155
Liabilities:
Payables:
Investment
securities
purchased
............................
13,374,027
—
26,078,913
Capital
shares
redeemed
.................................
29,934,278
19,696,068
36,358,052
Management
fees
.......................................
8,503,720
6,808,459
23,039,749
Distribution
fees
........................................
3,241,121
2,953,423
11,058,500
Transfer
agent
fees
......................................
3,735,986
3,844,830
11,868,148
Trustees'
fees
and
expenses
...............................
14,481
13,855
64,572
Options
written,
at
value
(premiums
received
$–,
$–
and
$44,798,643,
respectively)
............................................
—
—
57,067,500
Payable
upon
return
of
securities
loane
d
(Note
1e)
................
19,487,000
3,085,000
177,261,000
Accrued
expenses
and
other
liabilities
.........................
1,069,339
624,571
2,321,558
Total
liabilities
.......................................
79,359,952
37,026,206
345,117,992
Net
assets,
at
value
...............................
$25,397,621,872
$19,370,387,946
$75,739,183,163
Net
assets
consist
of:
Paid-in
capital
...........................................
$10,199,492,153
$3,611,346,541
$72,280,833,751
Total
distributable
earnings
(losses)
...........................
15,198,129,719
15,759,041,405
3,458,349,412
Net
assets,
at
value
...............................
$25,397,621,872
$19,370,387,946
$75,739,183,163
Franklin
Custodian
Funds
Financial
Statements
Statements
of
Assets
and
Liabilities
(continued)
September
30,
2024
The
accompanying
notes
are
an
integral
part
of
these
financial
statements.
Annual
Report
Franklin
DynaTech
Fund
Franklin
Growth
Fund
Franklin
Income
Fund
Class
A:
Net
assets,
at
value
.....................................
$11,920,330,071
$12,619,338,592
$23,331,018,228
Shares
outstanding
......................................
71,865,777
86,587,520
9,530,386,198
Net
asset
value
per
share
a,b
................................
$165.87
$145.74
$2.45
Maximum
offering
price
per
share
(net
asset
value
per
share
÷
94.50%,
94.50%
and
96.25%,
respectively)
b
..........................
$175.52
$154.22
$2.55
Class
A1:
Net
assets,
at
value
.....................................
$—
$—
$30,981,935,944
Shares
outstanding
......................................
—
—
12,627,528,291
Net
asset
value
per
share
a,b
................................
$—
$—
$2.45
Maximum
offering
price
per
share
(net
asset
value
per
share
÷
—%,
—%
and
96.25%,
respectively)
b
............................
$—
$—
$2.55
Class
C:
Net
assets,
at
value
.....................................
$947,544,242
$355,424,223
$4,549,814,703
Shares
outstanding
......................................
7,197,380
2,909,245
1,817,492,767
Net
asset
value
and
maximum
offering
price
per
share
a,b
..........
$131.65
$122.17
$2.50
Class
R:
Net
assets,
at
value
.....................................
$268,318,726
$305,785,992
$334,157,329
Shares
outstanding
......................................
1,692,166
2,128,594
139,600,878
Net
asset
value
and
maximum
offering
price
per
share
b
...........
$158.57
$143.66
$2.39
Class
R6:
Net
assets,
at
value
.....................................
$8,980,817,535
$2,735,878,222
$1,938,997,976
Shares
outstanding
......................................
50,927,160
18,583,882
793,850,058
Net
asset
value
and
maximum
offering
price
per
share
b
...........
$176.35
$147.22
$2.44
Advisor
Class:
Net
assets,
at
value
.....................................
$3,280,611,298
$3,353,960,917
$14,603,258,983
Shares
outstanding
......................................
18,893,844
22,772,209
6,011,153,805
Net
asset
value
and
maximum
offering
price
per
share
b
...........
$173.63
$147.28
$2.43
a
Redemption
price
is
equal
to
net
asset
value
less
contingent
deferred
sales
charges,
if
applicable.
b
Net
asset
value
per
share
may
not
recalculate
due
to
rounding.
Franklin
Custodian
Funds
Financial
Statements
Statements
of
Assets
and
Liabilities
(continued)
September
30,
2024
Annual
Report
The
accompanying
notes
are
an
integral
part
of
these
financial
statements.
Franklin
U.S.
Government
Securities
Fund
Franklin
Utilities
Fund
Assets:
Investments
in
securities:
Cost
-
Unaffiliated
issuers
..................................................
$2,532,871,160
$2,796,002,869
Cost
-
Non-controlled
affiliates
(Note
3
f
)
.......................................
36,624,604
31,088,886
Value
-
Unaffiliated
issuers
.................................................
$2,343,106,206
$6,679,197,938
Value
-
Non-controlled
affiliates
(Note
3
f
)
.......................................
36,624,604
31,088,886
Cash
...................................................................
—
3,514,360
Receivables:
Investment
securities
sold
..................................................
—
669,671
Capital
shares
sold
.......................................................
930,815
2,701,544
Dividends
and
interest
....................................................
8,032,249
10,383,824
Total
assets
.........................................................
2,388,693,874
6,727,556,223
Liabilities:
Payables:
Capital
shares
redeemed
..................................................
2,083,385
3,731,582
Management
fees
........................................................
912,436
2,615,825
Distribution
fees
.........................................................
305,331
831,268
Transfer
agent
fees
.......................................................
676,569
1,206,224
Trustees'
fees
and
expenses
................................................
2,938
5,686
Accrued
expenses
and
other
liabilities
..........................................
233,699
301,347
Total
liabilities
........................................................
4,214,358
8,691,932
Net
assets,
at
value
................................................
$2,384,479,516
$6,718,864,291
Net
assets
consist
of:
Paid-in
capital
............................................................
$3,463,413,337
$2,438,776,636
Total
distributable
earnings
(losses)
............................................
(1,078,933,821)
4,280,087,655
Net
assets,
at
value
................................................
$2,384,479,516
$6,718,864,291
Franklin
Custodian
Funds
Financial
Statements
Statements
of
Assets
and
Liabilities
(continued)
September
30,
2024
The
accompanying
notes
are
an
integral
part
of
these
financial
statements.
Annual
Report
Franklin
U.S.
Government
Securities
Fund
Franklin
Utilities
Fund
Class
A:
Net
assets,
at
value
......................................................
$592,335,521
$1,386,488,300
Shares
outstanding
.......................................................
114,067,256
56,192,848
Net
asset
value
per
share
a,b
.................................................
$5.19
$24.67
Maximum
offering
price
per
share
(net
asset
value
per
share
÷
96.25%)
b
...............
$5.39
$25.63
Class
A1:
Net
assets,
at
value
......................................................
$1,293,199,278
$3,373,641,708
Shares
outstanding
.......................................................
248,915,134
136,672,466
Net
asset
value
per
share
a,b
.................................................
$5.20
$24.68
Maximum
offering
price
per
share
(net
asset
value
per
share
÷
96.25%)
b
...............
$5.40
$25.64
Class
C:
Net
assets,
at
value
......................................................
$43,645,620
$214,725,130
Shares
outstanding
.......................................................
8,468,851
8,761,990
Net
asset
value
and
maximum
offering
price
per
share
a,b
...........................
$5.15
$24.51
Class
R:
Net
assets,
at
value
......................................................
$13,803,094
$105,848,517
Shares
outstanding
.......................................................
2,657,353
4,311,157
Net
asset
value
and
maximum
offering
price
per
share
b
............................
$5.19
$24.55
Class
R6:
Net
assets,
at
value
......................................................
$186,048,322
$271,796,530
Shares
outstanding
.......................................................
35,644,137
10,892,347
Net
asset
value
and
maximum
offering
price
per
share
b
............................
$5.22
$24.95
Advisor
Class:
Net
assets,
at
value
......................................................
$255,447,681
$1,366,364,106
Shares
outstanding
.......................................................
48,986,574
54,751,760
Net
asset
value
and
maximum
offering
price
per
share
b
............................
$5.21
$24.96
a
Redemption
price
is
equal
to
net
asset
value
less
contingent
deferred
sales
charges,
if
applicable.
b
Net
asset
value
per
share
may
not
recalculate
due
to
rounding.
Franklin
Custodian
Funds
Financial
Statements
Statements
of
Operations
for
the
year
ended
September
30,
2024
Annual
Report
The
accompanying
notes
are
an
integral
part
of
these
financial
statements.
Franklin
DynaTech
Fund
Franklin
Growth
Fund
Franklin
Income
Fund
Investment
income:
Dividends:
(net
of
foreign
taxes
of
$1,078,847,
$1,185,967
and
$6,428,056,
respectively)
Unaffiliated
issuers
......................................
$79,879,946
$146,141,768
$532,655,348
Non-controlled
affiliates
(Note
3
f
and
10
)
......................
5,963,047
6,665,898
65,972,657
Interest:
Unaffiliated
issuers
......................................
—
—
2,807,209,354
Income
from
securities
loaned:
Unaffiliated
entities
(net
of
fees
and
rebates)
...................
1,709,506
(54,195)
(506,916)
Non-controlled
affiliates
(Note
3
f
)
...........................
269,974
209,630
2,361,873
Other
income
(Note
1
h
)
....................................
—
—
1,600,403
Total
investment
income
.................................
87,822,473
152,963,101
3,409,292,719
Expenses:
Management
fees
(Note
3
a
)
.................................
97,860,022
78,465,048
269,842,525
Distribution
fees:
(Note
3c
)
Class
A
..............................................
26,595,397
29,057,290
53,426,814
Class
A1
.............................................
—
—
45,138,062
Class
C
..............................................
8,945,811
3,525,973
30,223,583
Class
R
..............................................
1,246,652
1,453,269
1,582,443
Transfer
agent
fees:
(Note
3e
)
Class
A
..............................................
11,342,453
10,746,287
15,718,827
Class
A1
.............................................
—
—
22,115,365
Class
C
..............................................
953,408
324,816
3,414,659
Class
R
..............................................
265,840
268,196
232,664
Class
R6
.............................................
1,311,594
456,550
388,036
Advisor
Class
..........................................
3,196,095
2,941,885
10,003,892
Custodian
fees
..........................................
180,953
88,322
490,798
Reports
to
shareholders
fees
................................
1,481,938
494,571
1,917,450
Registration
and
filing
fees
..................................
147,117
127,935
657,416
Professional
fees
.........................................
115,583
126,879
335,892
Trustees'
fees
and
expenses
................................
267,782
209,975
872,261
Interest
expense
.........................................
—
—
8,077
Other
..................................................
471,489
383,420
2,107,859
Total
expenses
.......................................
154,382,134
128,670,416
458,476,623
Expenses
waived/paid
by
affiliates
(Note
3
f
and
3
g
)
............
(452,427)
(476,364)
(4,817,743)
Net
expenses
.......................................
153,929,707
128,194,052
453,658,880
Net
investment
income
(loss)
..........................
(66,107,234)
24,769,049
2,955,633,839
Franklin
Custodian
Funds
Financial
Statements
Statements
of
Operations
(continued)
for
the
year
ended
September
30,
2024
The
accompanying
notes
are
an
integral
part
of
these
financial
statements.
Annual
Report
Franklin
DynaTech
Fund
Franklin
Growth
Fund
Franklin
Income
Fund
Realized
and
unrealized
gains
(losses):
Net
realized
gain
(loss)
from:
Investments:
Unaffiliated
issuers
....................................
1,135,811,242
1,430,881,010
631,301,473
Non-controlled
affiliates
(Note
3
f
and
10
)
....................
—
—
3,757,016
Written
options
.........................................
—
—
328,998,601
Foreign
currency
transactions
..............................
(561,781)
4,290
845,262
Futures
contracts
.......................................
—
—
(7,577,477)
Net
realized
gain
(loss)
................................
1,135,249,461
1,430,885,300
957,324,875
Net
change
in
unrealized
appreciation
(depreciation)
on:
Investments:
Unaffiliated
issuers
....................................
6,965,773,529
3,820,878,300
7,895,073,054
Non-controlled
affiliates
(Note
3
f
and
10
)
....................
—
—
37,568,433
Translation
of
other
assets
and
liabilities
denominated
in
foreign
currencies
...........................................
47,670
2,127
2,117,693
Written
options
.........................................
—
—
(23,558,500)
Futures
contracts
.......................................
—
—
165,417,574
Net
change
in
unrealized
appreciation
(depreciation)
..........
6,965,821,199
3,820,880,427
8,076,618,254
Net
realized
and
unrealized
gain
(loss)
..........................
8,101,070,660
5,251,765,727
9,033,943,129
Net
increase
(decrease)
in
net
assets
resulting
from
operations
........
$8,034,963,426
$5,276,534,776
$11,989,576,968
Franklin
Custodian
Funds
Financial
Statements
Statements
of
Operations
(continued)
for
the
year
ended
September
30,
2024
Annual
Report
The
accompanying
notes
are
an
integral
part
of
these
financial
statements.
Franklin
U.S.
Government
Securities
Fund
Franklin
Utilities
Fund
Investment
income:
Dividends:
(net
of
foreign
taxes
of
$–
and
$777,927,
respectively)
Unaffiliated
issuers
.......................................................
$—
$191,866,630
Non-controlled
affiliates
(Note
3
f
)
............................................
2,104,455
998,420
Interest:
Unaffiliated
issuers:
Paydown
gain
(loss)
....................................................
(8,142,759)
—
Paid
in
cash
a
..........................................................
95,109,847
—
Total
investment
income
..................................................
89,071,543
192,865,050
Expenses:
Management
fees
(Note
3
a
)
..................................................
11,220,540
26,251,842
Distribution
fees:
(Note
3c
)
Class
A
...............................................................
1,508,846
2,939,497
Class
A1
..............................................................
1,905,445
4,367,138
Class
C
...............................................................
334,236
1,345,030
Class
R
...............................................................
70,359
452,249
Transfer
agent
fees:
(Note
3e
)
Class
A
...............................................................
741,266
1,066,821
Class
A1
..............................................................
1,625,916
2,642,354
Class
C
...............................................................
62,886
188,851
Class
R
...............................................................
17,317
82,123
Class
R6
..............................................................
62,673
108,087
Advisor
Class
...........................................................
315,978
1,049,734
Custodian
fees
...........................................................
15,097
42,232
Reports
to
shareholders
fees
.................................................
137,740
235,840
Registration
and
filing
fees
...................................................
116,440
152,157
Professional
fees
..........................................................
98,437
90,956
Trustees'
fees
and
expenses
.................................................
30,006
70,860
Interest
expense
..........................................................
—
6,163
Other
...................................................................
68,666
112,089
Total
expenses
........................................................
18,331,848
41,204,023
Expenses
waived/paid
by
affiliates
(Note
3
f
and
3
g
)
.............................
(150,302)
(111,804)
Net
expenses
........................................................
18,181,546
41,092,219
Net
investment
income
...............................................
70,889,997
151,772,831
Realized
and
unrealized
gains
(losses):
Net
realized
gain
(loss)
from:
Investments:
Unaffiliated
issuers
.....................................................
(70,876,389)
429,435,236
Foreign
currency
transactions
...............................................
—
(24,195)
Net
realized
gain
(loss)
.................................................
(70,876,389)
429,411,041
Net
change
in
unrealized
appreciation
(depreciation)
on:
Investments:
Unaffiliated
issuers
.....................................................
244,830,263
1,438,997,688
Translation
of
other
assets
and
liabilities
denominated
in
foreign
currencies
.............
—
81,587
Net
change
in
unrealized
appreciation
(depreciation)
...........................
244,830,263
1,439,079,275
Net
realized
and
unrealized
gain
(loss)
...........................................
173,953,874
1,868,490,316
Net
increase
(decrease)
in
net
assets
resulting
from
operations
.........................
$244,843,871
$2,020,263,147
a
Includes
amortization
of
premium
and
accretion
of
discount.
Franklin
Custodian
Funds
Financial
Statements
Statements
of
Changes
in
Net
Assets
The
accompanying
notes
are
an
integral
part
of
these
financial
statements.
Annual
Report
Franklin
DynaTech
Fund
Franklin
Growth
Fund
Year
Ended
September
30,
2024
Year
Ended
September
30,
2023
Year
Ended
September
30,
2024
Year
Ended
September
30,
2023
Increase
(decrease)
in
net
assets:
Operations:
Net
investment
income
(loss)
.......
$(66,107,234)
$(40,586,737)
$24,769,049
$36,504,303
Net
realized
gain
(loss)
............
1,135,249,461
(625,701,869)
1,430,885,300
1,015,622,488
Net
change
in
unrealized
appreciation
(depreciation)
.................
6,965,821,199
4,822,674,776
3,820,880,427
1,828,972,646
Net
increase
(decrease)
in
net
assets
resulting
from
operations
.
8,034,963,426
4,156,386,170
5,276,534,776
2,881,099,437
Distributions
to
shareholders:
Class
A
........................
—
—
(661,586,794)
(909,635,091)
Class
C
........................
—
—
(23,849,244)
(44,719,554)
Class
R
........................
—
—
(16,322,231)
(24,964,554)
Class
R6
.......................
—
—
(154,945,909)
(198,355,706)
Advisor
Class
...................
—
—
(189,159,041)
(266,375,785)
Total
distributions
to
shareholders
.....
—
—
(1,045,863,219)
(1,444,050,690)
Capital
share
transactions:
(Note
2
)
Class
A
........................
(369,330,890)
(337,773,209)
(177,186,610)
43,938,573
Class
C
........................
(129,077,207)
(106,526,277)
(56,298,623)
(105,822,260)
Class
R
........................
(28,342,862)
(23,054,438)
(18,812,341)
(16,786,530)
Class
R6
.......................
(1,527,348,189)
(428,242,325)
13,294,459
(87,230,658)
Advisor
Class
...................
(253,787,168)
(311,526,640)
(259,760,424)
(62,355,424)
Total
capital
share
transactions
.......
(2,307,886,316)
(1,207,122,889)
(498,763,539)
(228,256,299)
Net
increase
(decrease)
in
net
assets
.....................
5,727,077,110
2,949,263,281
3,731,908,018
1,208,792,448
Net
assets:
Beginning
of
year
..................
19,670,544,762
16,721,281,481
15,638,479,928
14,429,687,480
End
of
year
......................
$25,397,621,872
$19,670,544,762
$19,370,387,946
$15,638,479,928
Franklin
Custodian
Funds
Financial
Statements
Statements
of
Changes
in
Net
Assets
(continued)
Annual
Report
The
accompanying
notes
are
an
integral
part
of
these
financial
statements.
Franklin
Income
Fund
Franklin
U.S.
Government
Securities
Fund
Year
Ended
September
30,
2024
Year
Ended
September
30,
2023
Year
Ended
September
30,
2024
Year
Ended
September
30,
2023
Increase
(decrease)
in
net
assets:
Operations:
Net
investment
income
............
$2,955,633,839
$2,897,504,972
$70,889,997
$70,388,010
Net
realized
gain
(loss)
............
957,324,875
1,275,064,110
(70,876,389)
(11,489,373)
Net
change
in
unrealized
appreciation
(depreciation)
.................
8,076,618,254
1,374,899,174
244,830,263
(63,522,640)
Net
increase
(decrease)
in
net
assets
resulting
from
operations
.
11,989,576,968
5,547,468,256
244,843,871
(4,624,003)
Distributions
to
shareholders:
Class
A
........................
(1,190,149,394)
(1,088,887,170)
(19,138,516)
(18,992,408)
Class
A1
.......................
(1,712,071,733)
(1,829,113,474)
(43,307,752)
(45,747,379)
Class
C
........................
(236,965,690)
(288,652,148)
(1,414,959)
(2,788,226)
Class
R
........................
(17,206,302)
(16,524,734)
(410,373)
(418,094)
Class
R6
.......................
(104,069,107)
(89,382,048)
(7,036,685)
(6,525,019)
Advisor
Class
...................
(793,509,862)
(775,029,689)
(8,738,727)
(9,122,636)
Total
distributions
to
shareholders
.....
(4,053,972,088)
(4,087,589,263)
(80,047,012)
(83,593,762)
Capital
share
transactions:
(Note
2
)
Class
A
........................
1,254,763,903
2,570,603,933
(55,099,580)
(58,993,421)
Class
A1
.......................
(1,968,610,500)
(1,352,914,020)
(158,843,724)
(182,231,037)
Class
C
........................
(868,715,435)
(915,970,034)
(20,460,137)
(53,026,368)
Class
R
........................
(722,250)
25,115,227
(1,204,497)
(850,366)
Class
R6
.......................
77,775,374
491,347,753
(31,811,163)
8,774,608
Advisor
Class
...................
160,288,613
1,081,950,846
(24,679,808)
(28,084,539)
Total
capital
share
transactions
.......
(1,345,220,295)
1,900,133,705
(292,098,909)
(314,411,123)
Net
increase
(decrease)
in
net
assets
.....................
6,590,384,585
3,360,012,698
(127,302,050)
(402,628,888)
Net
assets:
Beginning
of
year
..................
69,148,798,578
65,788,785,880
2,511,781,566
2,914,410,454
End
of
year
......................
$75,739,183,163
$69,148,798,578
$2,384,479,516
$2,511,781,566
Franklin
Custodian
Funds
Financial
Statements
Statements
of
Changes
in
Net
Assets
(continued)
The
accompanying
notes
are
an
integral
part
of
these
financial
statements.
Annual
Report
Franklin
Utilities
Fund
Year
Ended
September
30,
2024
Year
Ended
September
30,
2023
Increase
(decrease)
in
net
assets:
Operations:
Net
investment
income
.................................................
$151,772,831
$155,707,445
Net
realized
gain
(loss)
.................................................
429,411,041
196,124,486
Net
change
in
unrealized
appreciation
(depreciation)
...........................
1,439,079,275
(574,064,096)
Net
increase
(decrease)
in
net
assets
resulting
from
operations
................
2,020,263,147
(222,232,165)
Distributions
to
shareholders:
Class
A
.............................................................
(70,125,563)
(47,301,433)
Class
A1
............................................................
(176,666,126)
(123,955,611)
Class
C
.............................................................
(12,011,262)
(9,576,816)
Class
R
.............................................................
(5,206,975)
(3,775,562)
Class
R6
............................................................
(12,523,037)
(9,040,783)
Advisor
Class
........................................................
(72,177,774)
(54,549,649)
Total
distributions
to
shareholders
..........................................
(348,710,737)
(248,199,854)
Capital
share
transactions:
(Note
2
)
Class
A
.............................................................
(73,462,609)
14,298,922
Class
A1
............................................................
(225,366,785)
(241,581,831)
Class
C
.............................................................
(61,134,193)
(67,137,551)
Class
R
.............................................................
(9,431,911)
(6,763,361)
Class
R6
............................................................
20,052,851
(20,302,748)
Advisor
Class
........................................................
(102,143,870)
(154,018,141)
Total
capital
share
transactions
............................................
(451,486,517)
(475,504,710)
Net
increase
(decrease)
in
net
assets
...................................
1,220,065,893
(945,936,729)
Net
assets:
Beginning
of
year
.......................................................
5,498,798,398
6,444,735,127
End
of
year
...........................................................
$6,718,864,291
$5,498,798,398
Notes
to
Financial
Statements
1.
Organization
and
Significant
Accounting
Policies
Franklin
Custodian
Funds (Trust)
is
registered
under
the
Investment
Company
Act
of
1940
(1940
Act)
as
an
open-
end
management
investment
company,
consisting
of five
separate
funds
(Funds). The
Funds
follow
the
accounting
and
reporting
guidance
in
Financial
Accounting
Standards
Board
(FASB)
Accounting
Standards
Codification
Topic
946,
Financial
Services
–
Investment
Companies
(ASC
946)
and apply
the
specialized
accounting
and
reporting
guidance
in
U.S.
Generally
Accepted
Accounting
Principles
(U.S.
GAAP),
including,
but
not
limited
to,
ASC
946. The
classes of
shares
offered
within
each
of
the Funds
are
indicated
below. Class
C
shares
automatically
convert
to
Class
A
shares
on
a
monthly
basis,
after
they
have
been
held
for
8
years.
Each
class
of
shares
may
differ
by
its initial
sales
load,
contingent
deferred
sales
charges,
voting
rights
on
matters
affecting
a
single
class,
its
exchange
privilege
and
fees
due
to
differing
arrangements
for
distribution
and
transfer
agent
fees.
Class
A,
Class
C,
Class
R,
Class
R6,
&
Advisor
Class
Franklin
DynaTech
Fund
Franklin
Growth
Fund
Class
A,
Class
A1,
Class
C,
Class
R,
Class
R6,
&
Advisor
Class
Franklin
Income
Fund
Franklin
U.S.
Government
Securities
Fund
Franklin
Utilities
Fund
The
following
summarizes
the Funds'
significant
accounting
policies.
a.
Financial
Instrument
Valuation
The Funds'
investments
in
financial
instruments
are
carried
at
fair
value
daily.
Fair
value
is
the
price
that
would
be
received
to
sell
an
asset
or
paid
to
transfer
a
liability
in
an
orderly
transaction
between
market
participants
on
the
measurement
date.
The Funds calculate the
net
asset
value
(NAV)
per
share
each
business
day
as
of
4
p.m.
Eastern
time
or
the
regularly
scheduled
close
of
the
New
York
Stock
Exchange
(NYSE),
whichever
is
earlier. Under
compliance
policies
and
procedures
approved
by
the
Trust’s
Board
of
Trustees
(the
Board),
the
Board
has
designated
the
Funds’
investment
manager
as
the
valuation
designee
and
has
responsibility
for
oversight
of
valuation.
The
investment
manager
is
assisted
by
the
Funds'
administrator
in
performing
this
responsibility,
including
leading
the
cross-
functional
Valuation
Committee
(VC).
The
Funds
may
utilize
independent
pricing
services,
quotations
from
securities
and
financial
instrument
dealers,
and
other
market
sources
to
determine
fair
value.
Equity
securities
and
derivative
financial instruments listed
on
an
exchange
or
on
the
NASDAQ
National
Market
System
are
valued
at
the
last
quoted
sale
price
or
the
official
closing
price of
the
day,
respectively.
Foreign
equity
securities
are
valued
as
of
the
close
of
trading
on
the
foreign
stock
exchange
on
which
the
security
is
primarily
traded,
or
as
of
4
p.m.
Eastern
time.
The
value
is
then
converted
into
its
U.S.
dollar
equivalent
at
the
foreign
exchange
rate
in
effect
at
4
p.m.
Eastern
time
on
the
day
that
the
value
of
the
security
is
determined.
Over-the-counter
(OTC)
securities
are
valued
within
the
range
of
the
most
recent
quoted
bid
and
ask
prices.
Securities
that
trade
in
multiple
markets
or
on
multiple
exchanges
are
valued
according
to
the
broadest
and
most
representative
market.
Certain
equity
securities
are
valued
based
upon
fundamental
characteristics
or
relationships
to
similar
securities.
Debt
securities
generally
trade
in
the
OTC
market rather
than
on
a
securities
exchange.
The
Funds'
pricing
services
use
multiple
valuation
techniques
to
determine
fair
value.
In
instances
where
sufficient
market
activity
exists,
the
pricing
services
may
utilize
a
market-based
approach
through
which
quotes
from
market
makers
are
used
to
determine
fair
value.
In
instances
where
sufficient
market
activity
may
not
exist
or
is
limited,
the
pricing
services
also
utilize
proprietary
valuation
models
which
may
consider
market
characteristics
such
as
benchmark
yield
curves,
credit
spreads,
estimated
default
rates,
anticipated
market
interest
rate
volatility,
coupon
rates,
anticipated
timing
of
principal
repayments,
underlying
collateral,
and
other
unique
security
features
in
order
to
estimate
the
relevant
cash
flows,
which
are
then
discounted
to
calculate
the
fair
value.
Securities
denominated
in
a
foreign
currency
are
converted
into
their
U.S.
dollar
equivalent
at
the
foreign
exchange
rate
in
effect
at
4
p.m.
Eastern
time
on
the
date
that
the
values
of
the
foreign
debt
securities
are
determined.
Investments
in open-end mutual
funds
are
valued
at
the
closing
NAV.
The
Funds
have
procedures
to
determine
the
fair
value
of
financial
instruments
for
which
market
prices
are
not
reliable
or
readily
available.
Under
these
procedures,
the
Funds
primarily
employ
a
market-based
approach
which
may
use
related
or
comparable
assets
or
liabilities,
recent
transactions,
market
multiples,
and
other
relevant
Franklin
Custodian
Funds
Notes
to
Financial
Statements
information
for
the
investment
to
determine
the
fair
value
of
the
investment.
An
income-based
valuation
approach
may
also
be
used
in
which
the
anticipated
future
cash
flows
of
the
investment
are
discounted
to
calculate
fair
value.
Discounts
may
also
be
applied
due
to
the
nature
or
duration
of
any
restrictions
on
the
disposition
of
the
investments.
Due
to
the
inherent
uncertainty
of
valuations
of
such
investments,
the
fair
values
may
differ
significantly
from
the
values
that
would
have
been
used
had
an
active
market
existed.
Trading
in
securities
on
foreign
securities
stock
exchanges
and
OTC
markets
may
be
completed
before
4
p.m.
Eastern
time.
In
addition,
trading
in
certain
foreign
markets
may
not
take
place
on
every
Funds'
business
day.
Events
can occur
between
the
time
at
which
trading
in
a
foreign
security
is
completed
and
4
p.m.
Eastern
time
that
might
call
into
question
the
reliability
of
the
value
of
a
portfolio
security
held
by
the
Fund.
As
a
result,
differences
may
arise
between
the
value
of
the
Funds'
portfolio
securities
as
determined
at
the
foreign
market
close
and
the
latest
indications
of
value
at
4
p.m.
Eastern
time.
In
order
to
minimize
the
potential
for
these
differences,
an
independent
pricing
service
may
be
used
to
adjust
the
value
of
the
Funds'
portfolio
securities
to
the
latest
indications
of
fair
value
at
4
p.m.
Eastern
time.
At
September
30,
2024,
certain
securities
may
have
been
fair
valued
using
these
procedures,
in
which
case
the
securities
were
categorized
as
Level
2
within
the
fair
value
hierarchy
(referred
to
as
“market
level
fair
value”).
See
the
Fair
Value
Measurements
note
for
more
information.
When
the
last
day
of
the
reporting
period
is
a
non-business
day,
certain
foreign
markets
may
be
open
on
those
days
that
the
Funds'
NAV
is
not
calculated,
which
could
result
in
differences
between
the
value
of
the
Funds'
portfolio
securities
on
the
last
business
day
and
the
last
calendar
day
of
the
reporting
period.
Any
security
valuation
changes
due
to
an
open
foreign
market
are
adjusted
and
reflected
by
the
Funds
for
financial
reporting
purposes.
b.
Foreign
Currency
Translation
Portfolio
securities
and
other
assets
and
liabilities
denominated
in
foreign
currencies
are
translated
into
U.S.
dollars
based
on
the
exchange
rate
of
such
currencies
against
U.S.
dollars
on
the
date
of
valuation.
The
Funds
may
enter
into
foreign
currency
exchange
contracts
to
facilitate
transactions
denominated
in
a
foreign
currency.
Purchases
and
sales
of
securities,
income
and
expense
items
denominated
in
foreign
currencies
are
translated
into
U.S.
dollars
at
the
exchange
rate
in
effect
on
the
transaction
date.
Portfolio
securities
and
assets
and
liabilities
denominated
in
foreign
currencies
contain
risks
that
those
currencies
will
decline
in
value
relative
to
the
U.S.
dollar.
Occasionally,
events
may
impact
the
availability
or
reliability
of
foreign
exchange
rates
used
to
convert
the
U.S.
dollar
equivalent
value.
If
such
an
event
occurs,
the
foreign
exchange
rate
will
be
valued
at
fair
value
using
procedures
established
and
approved
by
the
Board.
The
Funds
do
not
separately
report
the
effect
of
changes
in
foreign
exchange
rates
from
changes
in
market
prices
on
securities
held.
Such
changes
are
included
in
net
realized
and
unrealized
gain
or
loss
from
investments
in
the
Statements
of
Operations.
Realized
foreign
exchange
gains
or
losses
arise
from
sales
of
foreign
currencies,
currency
gains
or
losses
realized
between
the
trade
and
settlement
dates
on
securities
transactions
and
the
difference
between
the
recorded
amounts
of
dividends,
interest,
and
foreign
withholding
taxes
and
the
U.S.
dollar
equivalent
of
the
amounts
actually
received
or
paid.
Net
unrealized
foreign
exchange
gains
and
losses
arise
from
changes
in
foreign
exchange
rates
on
foreign
denominated
assets
and
liabilities
other
than
investments
in
securities
held
at
the
end
of
the
reporting
period.
c.
Derivative
Financial
Instruments
Certain
or
all
Funds
invested
in
derivative
financial
instruments
in
order
to
manage
risk
or
gain
exposure
to
various
other
investments
or
markets.
Derivatives
are
financial
contracts
based
on
an
underlying
or
notional
amount,
require
no
initial
investment
or
an
initial
net
investment
that
is
smaller
than
would
normally
be
required
to
have
a
similar
response
to
changes
in
market
factors,
and
require
or
permit
net
settlement.
Derivatives
contain
various
risks
including
the
potential
inability
of
the
counterparty
to
fulfill
their
obligations
under
the
terms
of
the
contract,
the
potential
for
an
illiquid
secondary
market,
and/or
the
potential
for
market
movements
which
expose
the
Fund
to
gains
or
losses
in
excess
of
the
amounts
shown
in
the
Statements
of
Assets
and
Liabilities.
Realized
gain
and
loss
and
unrealized
appreciation
and
depreciation
on
these
contracts
for
the
period
are
included
in
the
Statements
of
Operations.
1.
Organization
and
Significant
Accounting
Policies
(continued)
a.
Financial
Instrument
Valuation
(continued)
Franklin
Custodian
Funds
Notes
to
Financial
Statements
Collateral
requirements
differ
by
type
of
derivative.
Collateral
or
initial
margin
requirements
are
set
by
the
broker
or
exchange
clearing
house
for
exchange
traded
and
centrally
cleared
derivatives.
Initial
margin
deposited
is
held
at
the
exchange
and
can
be
in
the
form
of
cash
and/or
securities.
Certain
or
all
Funds
entered
into
exchange
traded
futures
contracts
primarily
to
manage
and/or
gain
exposure
to
interest
rate
risk. A
futures
contract
is
an
agreement
between
the
Fund
and
a
counterparty
to
buy
or
sell
an
asset
at
a
specified
price
on
a
future
date.
Required
initial
margins
are
pledged
by
the
Fund,
and
the
daily
change
in
fair
value
is
accounted
for
as
a
variation
margin
payable
or
receivable
in
the
Statements
of
Assets
and
Liabilities.
At
September
30,
2024,
the
Funds
had
no
futures
contracts.
Certain
or
all
Funds
purchased
or
wrote
exchange
traded
option
contracts
primarily
to
manage
exposure
to
equity
price
risk.
An
option
is
a
contract
entitling
the
holder
to
purchase
or
sell
a
specific
amount
of
shares
or
units
of
an
asset
or
notional
amount
of
a
swap
(swaption),
at
a
specified
price.
When
an
option
is
purchased
or
written,
an
amount
equal
to
the
premium
paid
or
received
is
recorded
as
an
asset
or
liability,
respectively.
Upon
exercise
of
an
option,
the
acquisition
cost
or
sales
proceeds
of
the
underlying
investment
is
adjusted
by
any
premium
received
or
paid.
Upon
expiration
of
an
option,
any
premium
received
or
paid
is
recorded
as
a
realized
gain
or
loss.
Upon
closing
an
option
other
than
through
expiration
or
exercise,
the
difference
between
the
premium
received
or
paid
and
the
cost
to
close
the
position
is
recorded
as
a
realized
gain
or
loss.
At September
30,
2024,
Franklin
DynaTech
Fund,
Franklin
Growth
Fund,
Franklin
U.S.
Government
Securities
Fund
and
Franklin
Utilities
Fund
had
no
option
contracts.
See
Note
9 regarding
other
derivative
information.
d.
Equity-Linked
Securities
Certain
or
all
Funds
invest in
equity-linked
securities.
Equity-linked
securities
are
hybrid
financial
instruments
that
generally
combine
both
debt
and
equity
characteristics
into
a
single
note
form.
Income
received
from
equity-linked
securities
is
recorded
as
realized
gains
in
the
Statements
of
Operations
and
may
be
based
on
the
performance
of
an
underlying
equity
security,
an
equity
index,
or
an
option
position.
The
risks
of
investing
in
equity-linked
securities
include
unfavorable
price
movements
in
the
underlying
security
and
the
credit
risk
of
the
issuing
financial
institution.
There
may
be
no
guarantee
of
a
return
of
principal
with
equity-linked
securities
and
the
appreciation
potential
may
be
limited.
Equity-linked
securities
may
be
more
volatile
and
less
liquid
than
other
investments
held
by
the
Funds.
e.
Securities
Lending
Certain
or
all
Funds
participate
in
an
agency
based
securities
lending
program
to
earn
additional
income.
The
Fund
receives
collateral
in
the
form
of
cash
and/or
U.S.
Government
and
Agency
securities
against
the
loaned
securities
in
an
amount
equal
to
at
least
102%
of
the
fair
value
of
the
loaned
securities.
Collateral
is
maintained
over
the
life
of
the
loan
in
an
amount
not
less
than
100%
of
the
fair
value
of
loaned
securities,
as
determined
at
the
close
of
Fund
business
each
day;
any
additional
collateral
required
due
to
changes
in
security
values
is
delivered
to
the
Fund
on
the
next
business
day.
Any
cash
collateral
received
is
deposited
into
a
joint
cash
account
with
other
funds
and
is
used
to
invest
in
a
money
market
fund
managed
by
Franklin
Advisers,
Inc.,
an
affiliate
of
the
Funds. The
Fund
may
receive
income
from
the
investment
of
cash
collateral,
in
addition
to
lending
fees
paid
by
the
borrower.
Income
from
securities
loaned,
net
of
fees
paid
to
the
securities
lending
agent
and/or
third-party
vendor,
is
reported
separately
in
the Statements of
Operations.
The
Fund
bears
the
market
risk
with
respect
to
any
cash
collateral
investment,
securities
loaned,
and
the
risk
that
the
agent
may
default
on
its
obligations
to
the
Fund.
If
the
borrower
defaults
on
its
obligation
to
return
the
securities
loaned,
the
Fund
has
the
right
to
repurchase
the
securities
in
the
open
market
using
the
collateral
received.
The
securities
lending
agent
has
agreed
to
indemnify
the
Fund
in
the
event
of
default
by
a
third
party
borrower.
At
September
30,
2024,
Franklin
U.S.
Government
Securities
Fund
and
Franklin
Utilities
Fund
had
no
securities
on
loan.
f.
Business
Development
Companies
Certain
or
all
Funds may
invest
in
securities
of
closed-end
investment
companies
that
have
elected
to
be
treated
as
a
business
development
company
under
the
1940
Act.
The
Funds
may
purchase
a
business
development
company
to
gain
exposure
to
the
securities
in
the
underlying
portfolio.
The
risks
of
owning
a
business
development
company
1.
Organization
and
Significant
Accounting
Policies
(continued)
c.
Derivative
Financial
Instruments
(continued)
Franklin
Custodian
Funds
Notes
to
Financial
Statements
generally
reflect
the
risks
of
owning
the
underlying
securities.
Business
development
companies
have
expenses
that
reduce
their
value.
g.
Senior
Floating
Rate
Interests
Certain
or
all
Funds
invest
in
senior
secured
corporate
loans
that
pay
interest
at
rates
which
are
periodically
reset
by
reference
to
a
base
lending
rate
plus
a
spread.
These
base
lending
rates
are
generally
the
prime
rate
offered
by
a
designated
U.S.
bank
or
the
Secured
Overnight
Financing
Rate
(SOFR).
Senior
secured
corporate
loans
often
require
prepayment
of
principal
from
excess
cash
flows
or
at
the
discretion
of
the
borrower.
As
a
result,
actual
maturity
may
be
substantially
less
than
the
stated
maturity.
Senior
secured
corporate
loans
in
which
the
Funds
invest
are
generally
readily
marketable,
but
may
be
subject
to
certain
restrictions
on
resale.
h.
Income
and
Deferred
Taxes
It
is each
Fund's
policy
to
qualify
as
a
regulated
investment
company
under
the
Internal
Revenue
Code. Each
Fund
intends
to
distribute
to
shareholders
substantially
all
of
its
taxable
income
and
net
realized
gains
to
relieve
it
from
federal
income
and excise
taxes.
As
a
result,
no
provision
for
U.S.
federal
income
taxes
is
required.
The
Funds
may
be
subject
to
foreign
taxation
related
to
income
received,
capital
gains
on
the
sale
of
securities
and
certain
foreign
currency
transactions
in
the
foreign
jurisdictions
in
which
the
Funds
invest.
Foreign
taxes,
if
any,
are
recorded
based
on
the
tax
regulations
and
rates
that
exist
in
the
foreign
markets
in
which
the
Funds
invest.
When
a
capital
gain
tax
is
determined
to
apply,
certain
or
all
Funds
record
an
estimated
deferred
tax
liability
in
an
amount
that
would
be
payable
if
the
securities
were
disposed
of
on
the
valuation
date.
As
a
result
of
several
court
cases,
in
certain
countries
across
the
European
Union,
certain
or
all
Funds
filed
additional
tax
reclaims
for
previously
withheld
taxes
on
dividends
earned
in
those
countries
(EU
reclaims). Income
recognized,
if
any,
for
EU
reclaims
is
reflected
as
other
income
in
the
Statements of
Operations
and
any
related
receivable,
if
any,
is
reflected
as
European
Union
tax
reclaims
in
the
Statements
of
Assets
and
Liabilities.
Any
fees
associated
with
these
filings
are
reflected
in
other
expenses
in
the
Statements
of
Operations.
When
uncertainty
exists
as
to
the
ultimate
resolution
of
these
proceedings,
the
likelihood
of
receipt
of
these
EU
reclaims,
and
the
potential
timing
of
payment,
no
amounts
are
reflected
in
the
financial
statements.
For
U.S.
income
tax
purposes,
EU
reclaims
received
by
the
Funds,
if
any,
reduce
the
amount
of
foreign
taxes
Fund
shareholders
can
use
as
tax
deductions
or credits
on
their income
tax
returns.
Each
Fund
may
recognize
an
income
tax
liability
related
to
its
uncertain
tax
positions
under
U.S.
GAAP
when
the
uncertain
tax
position
has
a
less
than
50%
probability
that
it
will
be
sustained
upon
examination
by
the
tax
authorities
based
on
its
technical
merits.
As
of
September
30,
2024, each
Fund
has
determined
that
no
tax
liability
is
required
in
its
financial
statements
related
to
uncertain
tax
positions
for
any
open
tax
years
(or
expected
to
be
taken
in
future
tax
years).
Open
tax
years
are
those
that
remain
subject
to
examination
and
are
based
on
the
statute
of
limitations
in
each
jurisdiction
in
which
the
Fund
invests.
i.
Security
Transactions,
Investment
Income,
Expenses
and
Distributions
Security
transactions
are
accounted
for
on
trade
date.
Realized
gains
and
losses
on
security
transactions
are
determined
on
a
specific
identification
basis.
Interest
income
(including
interest
income
from
payment-in-kind
securities,
if
any)
and
estimated
expenses
are
accrued
daily.
Amortization
of
premium
and
accretion
of
discount
on
debt
securities
are
included
in
interest
income.
Paydown
gains
and
losses
are
recorded
separately
in
the
Statements
of
Operations.
Certain
or
all
Funds
may
receive
other
income
from
investments
in
senior
secured
corporate
loans
or
unfunded
commitments,
including
amendment
fees,
consent
fees
or
commitment
fees.
These
fees
are
recorded
as
income
when
received
by
the
Funds.
Facility
fees
are
recognized
as
income
over
the
expected
term
of
the
loan.
Dividend
income
is
recorded
on
the
ex-dividend
date
except
for
certain
dividends
from
securities
where
the
dividend
rate
is
not
available.
In
such
cases,
the
dividend
is
recorded
as
soon
as
the
information
is
received
by
the
Funds.
Distributions
to
shareholders
are
recorded
on
the
ex-dividend
date.
Distributable
earnings
are
determined
according
to
income
tax
regulations
(tax
basis)
and
may
differ
from
earnings
recorded
in
accordance
with
U.S.
GAAP.
These
differences
may
be
permanent
or
temporary.
Permanent
differences
are
reclassified
among
capital
accounts
to
reflect
their
tax
character.
These
1.
Organization
and
Significant
Accounting
Policies
(continued)
f.
Business
Development
Companies
(continued)
Franklin
Custodian
Funds
Notes
to
Financial
Statements
reclassifications
have
no
impact
on
net
assets
or
the
results
of
operations.
Temporary
differences
are
not
reclassified,
as
they
may
reverse
in
subsequent
periods.
Common
expenses
incurred
by
the
Trust
are
allocated
among
the
Funds
based
on
the
ratio
of
net
assets
of
each
Fund
to
the
combined
net
assets
of
the
Trust
or
based
on
the
ratio
of
number
of
shareholders
of
each
Fund
to
the
combined
number
of
shareholders
of
the
Trust.
Fund
specific
expenses
are
charged
directly
to
the
Fund
that
incurred
the
expense.
Realized
and
unrealized
gains
and
losses
and
net
investment
income,
excluding
class
specific
expenses,
are
allocated
daily
to
each
class
of
shares
based
upon
the
relative
proportion
of
net
assets
of
each
class.
Differences
in
per
share
distributions
by
class
are
generally
due
to
differences
in
class
specific
expenses.
j.
Accounting
Estimates
The
preparation
of
financial
statements
in
accordance
with
U.S.
GAAP
requires
management
to
make
estimates
and
assumptions
that
affect
the
reported
amounts
of
assets
and
liabilities
at
the
date
of
the
financial
statements
and
the
amounts
of
income
and
expenses
during
the
reporting
period.
Actual
results
could
differ
from
those
estimates.
k.
Guarantees
and
Indemnifications
Under
the Trust's
organizational
documents,
its
officers
and trustees
are
indemnified
by
the Trust against
certain
liabilities
arising
out
of
the
performance
of
their
duties
to
the
Trust.
Additionally,
in
the
normal
course
of
business,
the Trust,
on
behalf
of
the
Funds, enters
into
contracts
with
service
providers
that
contain
general
indemnification
clauses.
The Trust's
maximum
exposure
under
these
arrangements
is
unknown
as
this
would
involve
future
claims
that
may
be
made
against
the Trust
that
have
not
yet
occurred.
Currently,
the Trust
expects
the
risk
of
loss
to
be
remote.
1.
Organization
and
Significant
Accounting
Policies
(continued)
i.
Security
Transactions,
Investment
Income,
Expenses
and
Distributions
(continued)
Franklin
Custodian
Funds
Notes
to
Financial
Statements
2.
Shares
of
Beneficial
Interest
At
September
30,
2024,
there
were
an
unlimited
number
of
shares
authorized
(without
par value).
Transactions
in
the
Funds'
shares
were
as
follows:
Franklin
DynaTech
Fund
Franklin
Growth
Fund
Shares
Amount
Shares
Amount
Class
A
Class
A
Shares:
Year
ended
September
30,
2024
Shares
sold
a
...................................
9,905,250
$1,449,356,442
6,605,253
$863,939,603
Shares
issued
in
reinvestment
of
distributions
..........
—
—
5,277,042
636,411,290
Shares
redeemed
...............................
(12,507,008)
(1,818,687,332)
(12,820,200)
(1,677,537,503)
Net
increase
(decrease)
..........................
(2,601,758)
$(369,330,890)
(937,905)
$(177,186,610)
Year
ended
September
30,
2023
Shares
sold
a
...................................
10,835,412
$1,175,640,499
8,919,861
$1,004,330,038
Shares
issued
in
reinvestment
of
distributions
..........
—
—
8,412,633
874,241,477
Shares
redeemed
...............................
(14,127,682)
(1,513,413,708)
(16,309,554)
(1,834,632,942)
Net
increase
(decrease)
..........................
(3,292,270)
$(337,773,209)
1,022,940
$43,938,573
Class
C
Class
C
Shares:
Year
ended
September
30,
2024
Shares
sold
...................................
840,150
$96,976,781
388,405
$42,780,022
Shares
issued
in
reinvestment
of
distributions
..........
—
—
231,563
23,547,385
Shares
redeemed
a
..............................
(1,958,630)
(226,053,988)
(1,115,757)
(122,626,030)
Net
increase
(decrease)
..........................
(1,118,480)
$(129,077,207)
(495,789)
$(56,298,623)
Year
ended
September
30,
2023
Shares
sold
...................................
1,092,810
$94,835,391
668,819
$64,223,834
Shares
issued
in
reinvestment
of
distributions
..........
—
—
495,681
44,160,212
Shares
redeemed
a
..............................
(2,355,286)
(201,361,668)
(2,195,278)
(214,206,306)
Net
increase
(decrease)
..........................
(1,262,476)
$(106,526,277)
(1,030,778)
$(105,822,260)
Class
R
Class
R
Shares:
Year
ended
September
30,
2024
Shares
sold
...................................
186,994
$26,603,709
306,228
$39,484,635
Shares
issued
in
reinvestment
of
distributions
..........
—
—
136,869
16,301,129
Shares
redeemed
...............................
(395,633)
(54,946,571)
(575,757)
(74,598,105)
Net
increase
(decrease)
..........................
(208,639)
$(28,342,862)
(132,660)
$(18,812,341)
Year
ended
September
30,
2023
Shares
sold
...................................
255,007
$26,525,522
294,779
$32,903,635
Shares
issued
in
reinvestment
of
distributions
..........
—
—
242,555
24,932,223
Shares
redeemed
...............................
(472,660)
(49,579,960)
(668,878)
(74,622,388)
Net
increase
(decrease)
..........................
(217,653)
$(23,054,438)
(131,544)
$(16,786,530)
Class
R6
Franklin
Custodian
Funds
Notes
to
Financial
Statements
Franklin
DynaTech
Fund
Franklin
Growth
Fund
Shares
Amount
Shares
Amount
Class
R6
Shares:
Year
ended
September
30,
2024
Shares
sold
...................................
7,497,219
$1,151,513,477
3,793,287
$479,174,104
Shares
issued
in
reinvestment
of
distributions
..........
—
—
1,096,546
133,241,291
Shares
redeemed
...............................
(17,501,439)
(2,678,861,666)
(4,505,619)
(599,120,936)
Net
increase
(decrease)
..........................
(10,004,220)
$(1,527,348,189)
384,214
$13,294,459
Year
ended
September
30,
2023
Shares
sold
...................................
13,862,160
$1,552,849,083
2,621,003
$298,026,426
Shares
issued
in
reinvestment
of
distributions
..........
—
—
1,715,972
179,878,131
Shares
redeemed
...............................
(17,471,967)
(1,981,091,408)
(4,974,150)
(565,135,215)
Net
increase
(decrease)
..........................
(3,609,807)
$(428,242,325)
(637,175)
$(87,230,658)
Advisor
Class
Advisor
Class
Shares:
Year
ended
September
30,
2024
Shares
sold
...................................
3,923,751
$592,603,452
2,701,328
$351,970,430
Shares
issued
in
reinvestment
of
distributions
..........
—
—
1,402,113
170,553,032
Shares
redeemed
...............................
(5,591,300)
(846,390,620)
(5,949,779)
(782,283,886)
Net
increase
(decrease)
..........................
(1,667,549)
$(253,787,168)
(1,846,338)
$(259,760,424)
Year
ended
September
30,
2023
Shares
sold
...................................
4,935,450
$549,668,851
3,710,821
$417,749,821
Shares
issued
in
reinvestment
of
distributions
..........
—
—
2,262,495
237,226,372
Shares
redeemed
...............................
(7,969,253)
(861,195,491)
(6,322,439)
(717,331,617)
Net
increase
(decrease)
..........................
(3,033,803)
$(311,526,640)
(349,123)
$(62,355,424)
Franklin
Income
Fund
Franklin
U.S.
Government
Securities
Fund
Shares
Amount
Shares
Amount
Class
A
Class
A
Shares:
Year
ended
September
30,
2024
Shares
sold
a
...................................
1,623,025,090
$3,729,668,863
19,956,121
$100,138,639
Shares
issued
in
reinvestment
of
distributions
..........
483,215,602
1,105,781,882
3,642,161
18,259,923
Shares
redeemed
...............................
(1,559,664,856)
(3,580,686,842)
(34,652,630)
(173,498,142)
Net
increase
(decrease)
..........................
546,575,836
$1,254,763,903
(11,054,348)
$(55,099,580)
Year
ended
September
30,
2023
Shares
sold
a
...................................
1,958,333,384
$4,444,609,074
25,502,060
$128,982,735
Shares
issued
in
reinvestment
of
distributions
..........
442,719,983
1,006,637,852
3,560,276
18,048,016
Shares
redeemed
...............................
(1,270,723,185)
(2,880,642,993)
(40,571,399)
(206,024,172)
Net
increase
(decrease)
..........................
1,130,330,182
$2,570,603,933
(11,509,063)
$(58,993,421)
Class
A1
2.
Shares
of
Beneficial
Interest
(continued)
Franklin
Custodian
Funds
Notes
to
Financial
Statements
Franklin
Income
Fund
Franklin
U.S.
Government
Securities
Fund
Shares
Amount
Shares
Amount
Class
A1
Shares:
Year
ended
September
30,
2024
Shares
sold
...................................
338,496,229
$779,919,152
11,161,551
$54,955,522
Shares
issued
in
reinvestment
of
distributions
..........
686,846,136
1,572,895,912
7,843,198
39,340,251
Shares
redeemed
...............................
(1,878,624,541)
(4,321,425,564)
(50,593,513)
(253,139,497)
Net
increase
(decrease)
..........................
(853,282,176)
$(1,968,610,500)
(31,588,764)
$(158,843,724)
Year
ended
September
30,
2023
Shares
sold
...................................
459,374,313
$1,043,033,441
16,661,587
$84,268,130
Shares
issued
in
reinvestment
of
distributions
..........
737,289,877
1,678,831,635
8,176,665
41,483,470
Shares
redeemed
...............................
(1,793,735,206)
(4,074,779,096)
(60,580,369)
(307,982,637)
Net
increase
(decrease)
..........................
(597,071,016)
$(1,352,914,020)
(35,742,117)
$(182,231,037)
Class
C
Class
C
Shares:
Year
ended
September
30,
2024
Shares
sold
...................................
226,946,469
$534,790,625
809,891
$4,024,731
Shares
issued
in
reinvestment
of
distributions
..........
97,204,118
226,818,090
280,683
1,395,322
Shares
redeemed
a
..............................
(696,565,075)
(1,630,324,150)
(5,215,216)
(25,880,190)
Net
increase
(decrease)
..........................
(372,414,488)
$(868,715,435)
(4,124,642)
$(20,460,137)
Year
ended
September
30,
2023
Shares
sold
...................................
313,172,661
$725,942,414
11,456,357
$57,859,125
Shares
issued
in
reinvestment
of
distributions
..........
119,089,335
276,353,693
546,291
2,755,118
Shares
redeemed
a
..............................
(829,490,789)
(1,918,266,141)
(22,658,314)
(113,640,611)
Net
increase
(decrease)
..........................
(397,228,793)
$(915,970,034)
(10,655,666)
$(53,026,368)
Class
R
Class
R
Shares:
Year
ended
September
30,
2024
Shares
sold
...................................
21,555,768
$48,554,144
516,633
$2,601,567
Shares
issued
in
reinvestment
of
distributions
..........
7,645,419
17,104,999
81,592
409,389
Shares
redeemed
...............................
(29,467,571)
(66,381,393)
(839,623)
(4,215,453)
Net
increase
(decrease)
..........................
(266,384)
$(722,250)
(241,398)
$(1,204,497)
Year
ended
September
30,
2023
Shares
sold
...................................
30,456,104
$67,677,054
798,409
$4,104,492
Shares
issued
in
reinvestment
of
distributions
..........
7,381,783
16,432,512
81,889
415,457
Shares
redeemed
...............................
(26,586,799)
(58,994,339)
(1,056,206)
(5,370,315)
Net
increase
(decrease)
..........................
11,251,088
$25,115,227
(175,908)
$(850,366)
Class
R6
2.
Shares
of
Beneficial
Interest
(continued)
Franklin
Custodian
Funds
Notes
to
Financial
Statements
Franklin
Income
Fund
Franklin
U.S.
Government
Securities
Fund
Shares
Amount
Shares
Amount
Class
R6
Shares:
Year
ended
September
30,
2024
Shares
sold
...................................
155,231,833
$356,689,747
8,866,106
$44,796,960
Shares
issued
in
reinvestment
of
distributions
..........
41,510,339
94,701,337
1,372,278
6,911,076
Shares
redeemed
...............................
(162,944,248)
(373,615,710)
(16,459,413)
(83,519,199)
Net
increase
(decrease)
..........................
33,797,924
$77,775,374
(6,221,029)
$(31,811,163)
Year
ended
September
30,
2023
Shares
sold
...................................
322,258,788
$726,763,497
12,838,713
$65,145,828
Shares
issued
in
reinvestment
of
distributions
..........
35,330,547
80,079,184
1,259,495
6,416,241
Shares
redeemed
...............................
(139,602,997)
(315,494,928)
(12,294,254)
(62,787,461)
Net
increase
(decrease)
..........................
217,986,338
$491,347,753
1,803,954
$8,774,608
Advisor
Class
Advisor
Class
Shares:
Year
ended
September
30,
2024
Shares
sold
...................................
1,116,282,538
$2,547,389,010
11,637,393
$58,704,481
Shares
issued
in
reinvestment
of
distributions
..........
323,285,841
733,871,342
1,535,297
7,727,882
Shares
redeemed
...............................
(1,373,831,348)
(3,120,971,739)
(18,044,125)
(91,112,171)
Net
increase
(decrease)
..........................
65,737,031
$160,288,613
(4,871,435)
$(24,679,808)
Year
ended
September
30,
2023
Shares
sold
...................................
1,459,603,354
$3,293,204,682
15,353,248
$78,738,231
Shares
issued
in
reinvestment
of
distributions
..........
316,588,066
714,220,227
1,584,307
8,062,313
Shares
redeemed
...............................
(1,301,500,962)
(2,925,474,063)
(22,516,109)
(114,885,083)
Net
increase
(decrease)
..........................
474,690,458
$1,081,950,846
(5,578,554)
$(28,084,539)
Franklin
Utilities
Fund
Shares
Amount
Class
A
Class
A
Shares:
Year
ended
September
30,
2024
Shares
sold
a
...................................
10,336,313
$213,412,790
Shares
issued
in
reinvestment
of
distributions
..........
3,182,719
62,334,936
Shares
redeemed
...............................
(17,235,021)
(349,210,335)
Net
increase
(decrease)
..........................
(3,715,989)
$(73,462,609)
Year
ended
September
30,
2023
Shares
sold
a
...................................
13,072,954
$271,677,836
Shares
issued
in
reinvestment
of
distributions
..........
1,986,664
42,069,637
Shares
redeemed
...............................
(14,408,448)
(299,448,551)
Net
increase
(decrease)
..........................
651,170
$14,298,922
Class
A1
2.
Shares
of
Beneficial
Interest
(continued)
Franklin
Custodian
Funds
Notes
to
Financial
Statements
Franklin
Utilities
Fund
Shares
Amount
Class
A1
Shares:
Year
ended
September
30,
2024
Shares
sold
...................................
4,090,487
$84,381,109
Shares
issued
in
reinvestment
of
distributions
..........
8,286,967
162,390,657
Shares
redeemed
...............................
(23,320,953)
(472,138,551)
Net
increase
(decrease)
..........................
(10,943,499)
$(225,366,785)
Year
ended
September
30,
2023
Shares
sold
...................................
5,639,347
$116,568,550
Shares
issued
in
reinvestment
of
distributions
..........
5,353,956
113,432,565
Shares
redeemed
...............................
(22,742,906)
(471,582,946)
Net
increase
(decrease)
..........................
(11,749,603)
$(241,581,831)
Class
C
Class
C
Shares:
Year
ended
September
30,
2024
Shares
sold
...................................
933,552
$19,051,482
Shares
issued
in
reinvestment
of
distributions
..........
605,981
11,698,798
Shares
redeemed
a
..............................
(4,552,107)
(91,884,473)
Net
increase
(decrease)
..........................
(3,012,574)
$(61,134,193)
Year
ended
September
30,
2023
Shares
sold
...................................
1,302,789
$27,051,481
Shares
issued
in
reinvestment
of
distributions
..........
439,989
9,300,965
Shares
redeemed
a
..............................
(5,010,140)
(103,489,997)
Net
increase
(decrease)
..........................
(3,267,362)
$(67,137,551)
Class
R
Class
R
Shares:
Year
ended
September
30,
2024
Shares
sold
...................................
789,729
$16,254,215
Shares
issued
in
reinvestment
of
distributions
..........
267,885
5,206,585
Shares
redeemed
...............................
(1,547,130)
(30,892,711)
Net
increase
(decrease)
..........................
(489,516)
$(9,431,911)
Year
ended
September
30,
2023
Shares
sold
...................................
1,136,867
$23,573,767
Shares
issued
in
reinvestment
of
distributions
..........
178,708
3,775,361
Shares
redeemed
...............................
(1,649,313)
(34,112,489)
Net
increase
(decrease)
..........................
(333,738)
$(6,763,361)
Class
R6
2.
Shares
of
Beneficial
Interest
(continued)
Franklin
Custodian
Funds
Notes
to
Financial
Statements
3.
Transactions
with
Affiliates
Franklin
Resources,
Inc.
is
the
holding
company
for
various
subsidiaries
that
together
are
referred
to
as
Franklin
Templeton.
Certain
officers
and
trustees
of
the Trust are
also
officers
and/or
directors
of
the
following
subsidiaries:
Franklin
Utilities
Fund
Shares
Amount
Class
R6
Shares:
Year
ended
September
30,
2024
Shares
sold
...................................
3,872,115
$80,683,727
Shares
issued
in
reinvestment
of
distributions
..........
626,051
12,481,125
Shares
redeemed
...............................
(3,564,289)
(73,112,001)
Net
increase
(decrease)
..........................
933,877
$20,052,851
Year
ended
September
30,
2023
Shares
sold
...................................
3,653,507
$76,827,234
Shares
issued
in
reinvestment
of
distributions
..........
421,790
9,015,064
Shares
redeemed
...............................
(5,046,545)
(106,145,046)
Net
increase
(decrease)
..........................
(971,248)
$(20,302,748)
Advisor
Class
Advisor
Class
Shares:
Year
ended
September
30,
2024
Shares
sold
...................................
10,492,073
$221,066,535
Shares
issued
in
reinvestment
of
distributions
..........
3,442,832
68,273,041
Shares
redeemed
...............................
(19,411,319)
(391,483,446)
Net
increase
(decrease)
..........................
(5,476,414)
$(102,143,870)
Year
ended
September
30,
2023
Shares
sold
...................................
11,834,588
$249,807,250
Shares
issued
in
reinvestment
of
distributions
..........
2,401,364
51,373,895
Shares
redeemed
...............................
(21,605,799)
(455,199,286)
Net
increase
(decrease)
..........................
(7,369,847)
$(154,018,141)
a
May
include
a
portion
of
Class
C
shares
that
were
automatically
converted
to
Class
A.
Subsidiary
Affiliation
Franklin
Advisers,
Inc.
(Advisers)
Investment
manager
Franklin
Templeton
Services,
LLC
(FT
Services)
Administrative
manager
Franklin
Distributors,
LLC
(Distributors)
Principal
underwriter
Franklin
Templeton
Investor
Services,
LLC
(Investor
Services)
Transfer
agent
2.
Shares
of
Beneficial
Interest
(continued)
Franklin
Custodian
Funds
Notes
to
Financial
Statements
a.
Management
Fees
Franklin
Income
Fund
and
Franklin
Utilities
Fund pay
an
investment
management
fee,
calculated
daily
and
paid
monthly,
to
Advisers
based
on
the
month-end
net
assets
of
each
of the
Funds
as
follows:
Franklin
DynaTech
Fund,
Franklin
Growth
Fund
and
Franklin
U.S.
Government
Securities
Fund pay
an
investment
management
fee,
calculated
daily
and
paid
monthly,
to
Advisers
based
on
the
month-end
net
assets
of
each
of the
Funds
as
follows:
For
the
year
ended
September
30,
2024,
each
Fund's
gross
effective
investment
management
fee
rate
based
on
average
daily
net
assets
was
as
follows:
Annualized
Fee
Rate
Net
Assets
0.625%
Up
to
and
including
$100
million
0.500%
Over
$100
million,
up
to
and
including
$250
million
0.450%
Over
$250
million,
up
to
and
including
$7.5
billion
0.440%
Over
$7.5
billion,
up
to
and
including
$10
billion
0.430%
Over
$10
billion,
up
to
and
including
$12.5
billion
0.420%
Over
$12.5
billion,
up
to
and
including
$15
billion
0.400%
Over
$15
billion,
up
to
and
including
$17.5
billion
0.380%
Over
$17.5
billion,
up
to
and
including
$20
billion
0.360%
Over
$20
billion,
up
to
and
including
$35
billion
0.355%
Over
$35
billion,
up
to
and
including
$50
billion
0.350%
Over
$50
billion,
up
to
and
including
$65
billion
0.345%
Over
$65
billion,
up
to
and
including
$80
billion
0.340%
In
excess
of
$80
billion
Annualized
Fee
Rate
Net
Assets
0.625%
Up
to
and
including
$100
million
0.500%
Over
$100
million,
up
to
and
including
$250
million
0.450%
Over
$250
million,
up
to
and
including
$7.5
billion
0.440%
Over
$7.5
billion,
up
to
and
including
$10
billion
0.430%
Over
$10
billion,
up
to
and
including
$12.5
billion
0.420%
Over
$12.5
billion,
up
to
and
including
$15
billion
0.400%
Over
$15
billion,
up
to
and
including
$17.5
billion
0.380%
Over
$17.5
billion,
up
to
and
including
$20
billion
0.360%
Over
$20
billion,
up
to
and
including
$35
billion
0.355%
Over
$35
billion,
up
to
and
including
$50
billion
0.350%
In
excess
of
$50
billion
Franklin
DynaTech
Fund
Franklin
Growth
Fund
Franklin
Income
Fund
Gross
effective
investment
management
fee
rate
........
0.419%
0.435%
0.376%
3.
Transactions
with
Affiliates
(continued)
Franklin
Custodian
Funds
Notes
to
Financial
Statements
b.
Administrative
Fees
Under
an
agreement
with
Advisers,
FT
Services
provides
administrative
services
to
the
Funds.
The
fee
is
paid
by
Advisers
based
on
each
of the
Funds'
average
daily
net
assets,
and
is
not
an
additional
expense
of
the
Funds.
c.
Distribution
Fees
The
Board
has
adopted
distribution
plans
for
each
share
class,
with
the
exception
of
Class
R6
and
Advisor
Class
shares,
pursuant
to
Rule
12b-1
under
the
1940
Act.
Under
the
Funds’
Class
A
and
A1
reimbursement
distribution
plans,
the
Funds
reimburse
Distributors
for
costs
incurred
in
connection
with
the
servicing,
sale
and
distribution
of
each
Fund's
shares
up
to
the
maximum
annual
plan
rate
for
each
class.
Under
the
Class
A
and
A1
reimbursement
distribution
plans,
costs
exceeding
the
maximum
for
the
current
plan
year
cannot
be
reimbursed
in
subsequent
periods.
In
addition,
under
the
Funds’
Class
C
and
R
compensation
distribution
plans,
the
Funds
pay
Distributors
for
costs
incurred
in
connection
with
the
servicing,
sale
and
distribution
of
each
Fund's
shares
up
to
the
maximum
annual
plan
rate
for
each
class.
The
plan
year,
for
purposes
of
monitoring
compliance
with
the
maximum
annual
plan
rates,
is
February
1
through
January
31
for
each
Fund.
The
maximum
annual
plan
rates,
based
on
the
average
daily
net
assets,
for
each
class,
are
as
follows:
d.
Sales
Charges/Underwriting
Agreements
Front-end
sales
charges
and
contingent
deferred
sales
charges
(CDSC)
do
not
represent
expenses
of
the
Funds.
These
charges
are
deducted
from
the
proceeds
of
sales
of
fund
shares
prior
to
investment
or
from
redemption
proceeds
prior
to
remittance,
as
applicable.
Distributors
has
advised
the
Funds
of
the
following
commission
transactions
related
to
the
sales
and
redemptions
of
the
Funds'
shares
for
the
year:
Franklin
U.S.
Government
Securities
Fund
Franklin
Utilities
Fund
Gross
effective
investment
management
fee
rate
........
0.458%
0.456%
Franklin
DynaTech
Fund
Franklin
Growth
Fund
Franklin
Income
Fund
Class
A
...............................
0.25%
0.25%
0.25%
Class
A1
..............................
—%
—%
0.15%
Class
C
...............................
1.00%
1.00%
0.65%
Class
R
...............................
0.50%
0.50%
0.50%
Franklin
U.S.
Government
Securities
Fund
Franklin
Utilities
Fund
Class
A
...............................
0.25%
0.25%
Class
A1
..............................
0.15%
0.15%
Class
C
...............................
0.65%
0.65%
Class
R
...............................
0.50%
0.50%
3.
Transactions
with
Affiliates
(continued)
a.
Management
Fees
(continued)
Franklin
Custodian
Funds
Notes
to
Financial
Statements
e.
Transfer
Agent
Fees
Each
class
of
shares pays
transfer
agent
fees,
calculated
monthly
and
paid
monthly, to
Investor
Services
for
its
performance
of
shareholder
servicing
obligations. Effective
October
1,
2023,
the
fees
are based
on
a
fixed
margin
earned
by
Investor
Services
and
are allocated
to
the Funds
based
upon
relative
assets
and
relative
transactions.
Prior
to
October
1,
2023,
the
fees
were
based
on
an
annualized
asset
based
fee
of
0.016%
plus
a
transaction
based
fee. In
addition,
each
class reimburses
Investor
Services
for
out
of
pocket
expenses
incurred
and,
except
for
Class
R6, reimburses
shareholder
servicing
fees
paid
to
third
parties.
These
fees
paid
to
third
parties
are
accrued
and
allocated
daily
based
upon
their
relative
proportion
of
such
classes'
aggregate
net
assets.
Class
R6
pays
Investor
Services
transfer
agent
fees
allocated
specifically
to
that
class
based
upon
its
relative
assets
and
relative
transactions.
For
the
year
ended
September
30,
2024,
the Funds
paid
transfer
agent
fees
as
noted
in
the
Statements of
Operations
of
which
the
following
amounts
were
retained
by
Investor
Services:
f.
Investments
in
Affiliated
Management
Investment
Companies
Certain
or
all
Funds
invest
in
one
or
more
affiliated
management
investment
companies.
As
defined
in
the
1940
Act,
an
investment
is
deemed
to
be
a
“Controlled
Affiliate”
of
a
fund
when
a
fund
owns,
either
directly
or
indirectly,
25%
or
more
of
the
affiliated
fund’s
outstanding
shares
or
has
the
power
to
exercise
control
over
management
or
policies
of
such
fund.
The
Funds
do
not
invest
for
purposes
of
exercising
a
controlling
influence
over
the
management
or
policies.
Management
fees
paid
by
the
Funds
are
waived
on
assets
invested
in
the
affiliated
management
investment
companies,
as
noted
in
the
Statements
of
Operations,
in
an
amount
not
to
exceed
the
management
and
administrative
fees
paid
directly
or
indirectly
by
each
affiliate.
During
the
year
ended
September
30,
2024,
investments
in
affiliated
management
investment
companies
were
as
follows:
Franklin
DynaTech
Fund
Franklin
Growth
Fund
Franklin
Income
Fund
Sales
charges
retained
net
of
commissions
paid
to
unaffiliated
brokers/dealers
..................
$2,470,245
$1,183,661
$1,980,079
CDSC
retained
...........................
$121,794
$47,712
$1,163,838
Franklin
U.S.
Government
Securities
Fund
Franklin
Utilities
Fund
Sales
charges
retained
net
of
commissions
paid
to
unaffiliated
brokers/dealers
..................
$18,209
$66,014
CDSC
retained
...........................
$17,403
$48,871
Franklin
DynaTech
Fund
Franklin
Growth
Fund
Franklin
Income
Fund
Transfer
agent
fees
........................
$4,941,784
$4,745,720
$16,197,199
Franklin
U.S.
Government
Securities
Fund
Franklin
Utilities
Fund
Transfer
agent
fees
........................
$1,177,327
$1,686,320
3.
Transactions
with
Affiliates
(continued)
d.
Sales
Charges/Underwriting
Agreements
(continued)
Franklin
Custodian
Funds
Notes
to
Financial
Statements
aa
Value
at
Beginning
of
Year
Purchases
Sales
Realized
Gain
(Loss)
Net
Change
in
Unrealized
Appreciation
(Depreciation)
Value
at
End
of
Year
Number
of
Shares
Held
at
End
of
Year
Investment
Income
a
a
a
a
a
a
a
a
Franklin
DynaTech
Fund
Non-Controlled
Affiliates
Dividends
Institutional
Fiduciary
Trust
-
Money
Market
Portfolio,
4.74%
.
$93,924,605
$2,498,738,207
$(2,372,055,190)
$—
$—
$220,607,622
220,607,622
$5,963,047
Non-Controlled
Affiliates
Income
from
securities
loaned
Institutional
Fiduciary
Trust
-
Money
Market
Portfolio,
4.74%
.
$—
$120,146,000
$(100,659,000)
$—
$—
$19,487,000
19,487,000
$269,974
Total
Affiliated
Securities
...
$93,924,605
$2,618,884,207
$(2,472,714,190)
$—
$—
$240,094,622
$6,233,021
Franklin
Growth
Fund
Non-Controlled
Affiliates
Dividends
Institutional
Fiduciary
Trust
-
Money
Market
Portfolio,
4.74%
.
$69,954,846
$1,590,133,226
$(1,527,706,212)
$—
$—
$132,381,860
132,381,860
$6,665,898
Non-Controlled
Affiliates
Income
from
securities
loaned
Institutional
Fiduciary
Trust
-
Money
Market
Portfolio,
4.74%
.
$—
$318,485,000
$(315,400,000)
$—
$—
$3,085,000
3,085,000
$209,630
Total
Affiliated
Securities
...
$69,954,846
$1,908,618,226
$(1,843,106,212)
$—
$—
$135,466,860
$6,875,528
Franklin
Income
Fund
Non-Controlled
Affiliates
Dividends
Clarion
Partners
Real
Estate
Income
Fund,
Inc.,
Class
I
....
$94,020,602
$—
$—
$—
$(2,045,637)
$91,974,965
7,867,833
$6,325,738
Franklin
BSP
Real
Estate
Credit
BDC
..................
—
261,158,594
—
—
4,223,337
265,381,931
10,254,325
—
Institutional
Fiduciary
Trust
-
Money
Market
Portfolio,
4.74%
.
645,794,493
18,136,005,929
(18,483,630,147)
—
—
298,170,275
298,170,275
59,646,919
Total
Non-Controlled
Affiliates
$739,815,095
$18,397,164,523
$(18,483,630,147)
$—
$2,177,700
$655,527,171
$65,972,657
Non-Controlled
Affiliates
Income
from
securities
loaned
Institutional
Fiduciary
Trust
-
Money
Market
Portfolio,
4.74%
.
$—
$493,619,000
$(316,358,000)
$—
$—
$177,261,000
177,261,000
$2,361,873
Total
Affiliated
Securities
...
$739,815,095
$18,890,783,523
$(18,799,988,147)
$—
$2,177,700
$832,788,171
$68,334,530
3.
Transactions
with
Affiliates
(continued)
f.
Investments
in
Affiliated
Management
Investment
Companies
(continued)
Franklin
Custodian
Funds
Notes
to
Financial
Statements
g.
Waiver
and
Expense
Reimbursements
Transfer
agent
fees
on
Class
R6
shares
of
the
Funds have
been
capped
so
that
transfer
agent
fees
for
that
class
do
not
exceed
0.03%
based
on
the
average
net
assets
of
the
class
until January
31,
2025.
4.
Income
Taxes
For
tax
purposes,
capital
losses
may
be
carried
over
to
offset
future
capital
gains.
At
September
30,
2024,
the
capital
loss
carryforwards
were
as
follows:
During
the
year
ended September
30,
2024,
the
utilized
capital
loss
carryforwards
were
as
follows:
aa
Value
at
Beginning
of
Year
Purchases
Sales
Realized
Gain
(Loss)
Net
Change
in
Unrealized
Appreciation
(Depreciation)
Value
at
End
of
Year
Number
of
Shares
Held
at
End
of
Year
Investment
Income
Franklin
U.S.
Government
Securities
Fund
Non-Controlled
Affiliates
Dividends
Institutional
Fiduciary
Trust
-
Money
Market
Portfolio,
4.74%
.
$67,238,754
$468,266,690
$(498,880,840)
$—
$—
$36,624,604
36,624,604
$2,104,455
Total
Affiliated
Securities
...
$67,238,754
$468,266,690
$(498,880,840)
$—
$—
$36,624,604
$2,104,455
Franklin
Utilities
Fund
Non-Controlled
Affiliates
Dividends
Institutional
Fiduciary
Trust
-
Money
Market
Portfolio,
4.74%
.
$20,399,531
$674,176,212
$(663,486,857)
$—
$—
$31,088,886
31,088,886
$998,420
Total
Affiliated
Securities
...
$20,399,531
$674,176,212
$(663,486,857)
$—
$—
$31,088,886
$998,420
Franklin
DynaTech
Fund
Franklin
Income
Fund
Franklin
U.S.
Government
Securities
Fund
1
1
1
1
Capital
loss
carryforwards
not
subject
to
expiration:
Short
term
.............................
$
373,948,999
$
146,492,650
$
349,830,677
Long
term
.............................
—
559,879,235
538,228,641
Total
capital
loss
carryforwards
............
$373,948,999
$706,371,885
$888,059,318
Franklin
DynaTech
Fund
Franklin
Income
Fund
Capital
loss
utilized
carryforwards
....
$1,120,787,472
$508,832,805
3.
Transactions
with
Affiliates
(continued)
f.
Investments
in
Affiliated
Management
Investment
Companies
(continued)
Franklin
Custodian
Funds
Notes
to
Financial
Statements
The
tax
character
of
distributions
paid
during
the
years
ended
September
30,
2024
and
2023,
was
as
follows:
At
September
30,
2024,
the
cost
of
investments,
net
unrealized
appreciation
(depreciation),
undistributed
ordinary
income
and
undistributed
long
term
capital
gains for
income
tax
purposes
were
as
follows:
Franklin
Growth
Fund
Franklin
Income
Fund
2024
2023
2024
2023
Distributions
paid
from:
Ordinary
income
........................
$43,048,616
$9,174,871
$4,053,972,088
$4,087,589,263
Long
term
capital
gain
....................
1,002,814,603
1,434,875,819
—
—
$1,045,863,219
$1,444,050,690
$4,053,972,088
$4,087,589,263
Franklin
U.S.
Government
Securities
Fund
Franklin
Utilities
Fund
2024
2023
2024
2023
Distributions
paid
from:
Ordinary
income
........................
$80,047,012
$83,593,762
$139,816,446
$151,418,612
Long
term
capital
gain
....................
—
—
208,894,291
96,781,242
$80,047,012
$83,593,762
$348,710,737
$248,199,854
Franklin
DynaTech
Fund
Franklin
Growth
Fund
Franklin
Income
Fund
a
a
a
a
Cost
of
investments
.......................
$9,804,055,792
$4,939,253,798
$71,019,004,803
Unrealized
appreciation
.....................
$15,630,293,135
$14,587,892,495
$5,627,291,242
Unrealized
depreciation
.....................
(6,928,668)
(142,358,126)
(1,503,948,087)
Net
unrealized
appreciation
(depreciation)
.......
$15,623,364,467
$14,445,534,369
$4,123,343,155
Distributable
earnings:
Undistributed
ordinary
income
................
$—
$16,508,568
$26,826,626
Undistributed
long
term
capital
gains
...........
—
1,296,997,459
—
Total
distributable
earnings
..................
$—
$1,313,506,027
$26,826,626
Franklin
U.S.
Government
Securities
Fund
Franklin
Utilities
Fund
a
a
a
Cost
of
investments
.......................
$2,571,149,448
$2,826,457,859
Unrealized
appreciation
.....................
$12,528,231
$3,889,116,612
Unrealized
depreciation
.....................
(203,946,869)
(5,287,647)
Net
unrealized
appreciation
(depreciation)
.......
$(191,418,638)
$3,883,828,965
Distributable
earnings:
Undistributed
ordinary
income
................
$544,135
$24,414,681
Undistributed
long
term
capital
gains
...........
—
371,880,274
Total
distributable
earnings
..................
$544,135
$396,294,955
Franklin
Custodian
Funds
Notes
to
Financial
Statements
Differences
between
income
and/or
capital
gains
as
determined
on
a
book
basis
and
a
tax
basis
are
primarily
due
to
differing
treatments
of
wash
sales,
paydown
losses,
bond
discounts
and
premiums,
corporate
actions,
equity-linked
securities
and
net
operating
losses.
5.
Investment
Transactions
Purchases
and
sales
of
investments
(excluding
short
term
securities)
for
the
year
ended
September
30,
2024,
were
as
follows:
At
September
30,
2024,
in
connection
with
securities
lending
transactions,
certain
or
all
Funds
loaned
investments
and
received
cash
collateral
as
follows:
6.
Credit
Risk
At
September
30,
2024,
Franklin
Income
Fund had 22.8%
of
its
portfolio
invested
in
high
yield
or
other
securities
rated
below
investment
grade
and
unrated
securities.
These
securities
may
be
more
sensitive
to
economic
conditions
causing
greater
price
volatility
and
are
potentially
subject
to
a
greater
risk
of
loss
due
to
default
than
higher
rated
securities.
7.
Restricted
Securities
Certain
or
all
Funds
invest
in
securities
that
are
restricted
under
the
Securities
Act
of
1933
(1933
Act).
Restricted
securities
are
often
purchased
in
private
placement
transactions,
and
cannot
be
sold
without
prior
registration
unless
the
sale
is
pursuant
to
an
exemption
under
the
1933
Act.
Disposal
of
these
securities
may
require
greater
effort
and
expense,
and
prompt
sale
at
an
acceptable
price
may
be
difficult.
The
Funds
may
have
registration
rights
for
restricted
securities.
The
issuer
generally
incurs
all
registration
costs.
Franklin
DynaTech
Fund
Franklin
Growth
Fund
Franklin
Income
Fund
Purchases
..............................
$2,756,299,137
$1,311,741,101
$34,881,267,198
Sales
..................................
$5,202,591,422
$2,844,828,863
$36,055,015,883
Franklin
U.S.
Government
Securities
Fund
Franklin
Utilities
Fund
Purchases
..............................
$743,511,500
$392,079,664
Sales
..................................
$1,005,805,511
$1,038,783,850
Franklin
DynaTech
Fund
Franklin
Growth
Fund
Franklin
Income
Fund
Securities
lending
transactions
a
:
Equity
investments
b
........................
$19,487,000
$3,085,000
$177,261,000
a
The
agreements
can
be
terminated
at
any
time.
b
The
gross
amount
of
recognized
liability
for
such
transactions
is
included
in
payable
upon
return
of
securities
loaned
in
the
Statements
of
Assets
and
Liabilities.
Franklin
Custodian
Funds
Notes
to
Financial
Statements
At
September
30,
2024,
investments
in
restricted
securities,
excluding
securities
exempt
from
registration
under
the
1933
Act,
were
as
follows:
8.
Unfunded
Capital
Commitments
Certain
or
all
Funds
enter into
certain
capital
commitments
and
may
be
obligated
to
perform
on
such
agreements
at
a
future
date.
The
Fund
monitors
these
commitments
and
assesses
the
probability
of
required
performance.
For
any
agreements
whose
probability
of
performance
is
determined
to
be
greater
than
remote,
the
Fund
assesses
the
fair
value
of
the
commitment.
In
instances
where
the
probability
of
performance
is
greater
than
remote
and
the
performance
under
the
commitment
would
result
in
a
material
unrealized
loss,
the
Fund
recognizes
such
losses
in
the Statements
of
Assets
and
Liabilities
and
the Statements
of
Operations.
At
September
30,
2024, Franklin
Income
Fund
had
an
unfunded
capital
commitment
with
a
maximum
amount
of $238,841,406,
for
which
no
depreciation
has
been
recognized.
9.
Other
Derivative
Information
At
September
30,
2024,
investments
in
derivative
contracts
are
reflected
in
the
Statements
of
Assets
and
Liabilities
as
follows:
Shares
Issuer
Acquisition
Date
Cost
Value
Franklin
Growth
Fund
1,150,134
Anduril
Industries,
Inc.,
F
......................
7/17/24
$
25,000,003
$
25,000,003
2,353
Canva,
Inc.,
A
..............................
11/08/21
4,011,298
2,884,066
94
Canva,
Inc.,
A-3
.............................
11/08/21
160,247
115,216
8
Canva,
Inc.,
A-4
.............................
11/08/21
13,638
9,806
5
Canva,
Inc.,
A-5
.............................
11/08/21
8,524
6,128
25,413
Canva,
Inc.,
B
..............................
11/08/21
43,323,040
31,148,647
96,603
Checkout
Payments
Group
Ltd.,
B
...............
1/11/22
30,000,062
8,855,741
822,494
Gusto,
Inc.,
E
...............................
7/13/21
24,999,977
26,007,722
849,894
OneTrust
LLC,
C
............................
4/01/21
16,666,676
14,987,106
540,043
Stripe,
Inc.,
B
...............................
5/18/21
21,671,052
14,879,583
1,759,545
Stripe,
Inc.,
I
...............................
3/15/23
-
5/08/23
35,426,925
48,480,020
Total
Restricted
Securities
(Value
is
0.9%
of
Net
Assets)
..............
$201,281,442
$172,374,038
Asset
Derivatives
Liability
Derivatives
Derivative
Contracts
Not
Accounted
for
as
Hedging
Instruments
Statement
of
Assets
and
Liabilities
Location
Fair
Value
Statement
of
Assets
and
Liabilities
Location
Fair
Value
Franklin
Income
Fund
Equity
contracts
...........
Investments
in
securities,
at
value
$
—
Options
written,
at
value
$
57,067,500
Total
....................
$—
$57,067,500
7.
Restricted
Securities
(continued)
Franklin
Custodian
Funds
Notes
to
Financial
Statements
For
the
year
ended
September
30,
2024,
the
effect
of
derivative
contracts
in
the
Statements
of
Operations
was
as
follows:
For
the
year
ended
September
30,
2024,
the
average
month
end
notional
amount
of
futures
contracts
and
options
represented
$3,753,551,683
and
$50,113,962,
respectively.
See
Note
1(c) regarding
derivative
financial
instruments.
10.
Holdings
of
5%
Voting
Securities
of
Portfolio
Companies
The
1940
Act
defines
"affiliated
companies"
to
include
investments
in
portfolio
companies
in
which
a
fund
owns
5%
or
more
of
the
outstanding
voting
securities.
Additionally,
as
defined
in
the
1940
Act,
an
investment
is
deemed
to
be
a
“Controlled
Affiliate”
of
a
fund
when
a
fund
owns,
either
directly
or
indirectly,
25%
or
more
of
the
affiliated
companies’
outstanding
shares
or
has
the
power
to
exercise
control
over
management
or
policies
of
such
company.
During
the
year
ended
September
30,
2024,
investments
in
“affiliated
companies”
were
as
follows:
Derivative
Contracts
Not
Accounted
for
as
Hedging
Instruments
Statement
of
Operations
Location
Net
Realized
Gain
(Loss)
for
the
Year
Statement
of
Operations
Location
Net
Change
in
Unrealized
Appreciation
(Depreciation)
for
the
Year
Franklin
Income
Fund
Net
realized
gain
(loss)
from:
Net
change
in
unrealized
appreciation
(depreciation)
on:
Interest
rate
contracts
..........
Futures
contracts
$(7,577,477)
Futures
contracts
$165,417,574
Equity
contracts
..............
Written
options
328,998,601
Written
options
(23,558,500)
Total
.......................
$321,421,124
$141,859,074
Value
at
Beginning
of
Year
Purchases
Sales
Realized
Gain
(Loss)
Net
Change
in
Unrealized
Appreciation
(Depreciation)
Value
at
End
of
Year
Number
of
Shares
Held
at
End
of
Year
Investment
Income
Franklin
Growth
Fund
Non-Controlled
Affiliates
Dividends
OneTrust
LLC,
C
.....
$
12,730,065
$
—
$
—
$
—
$
—
a
$
—
a
—
a
$
—
Total
Affiliated
Securities
(Value
is
—%
of
Net
Assets)
..........
$12,730,065
$—
$—
$—
$—
$—
$—
Franklin
Income
Fund
Non-Controlled
Affiliates
Dividends
Endo,
Inc.
..........
—
78,869,792
b
—
—
35,390,733
114,260,525
4,484,322
—
Endo,
Inc.,
Escrow
Account
.........
—
—
(3,757,016)
3,757,016
—
—
307,256,000
—
Total
Affiliated
Securities
(Value
is
0.2%
of
Net
Assets)
..........
$—
$78,869,792
$(3,757,016)
$3,757,016
$35,390,733
$114,260,525
$—
9.
Other
Derivative
Information
(continued)
Franklin
Custodian
Funds
Notes
to
Financial
Statements
11.
Credit
Facility
The
Funds,
together
with
other
U.S.
registered
and
foreign
investment
funds
(collectively,
Borrowers),
managed
by
Franklin
Templeton,
are
borrowers
in
a
joint
syndicated
senior
unsecured
credit
facility
totaling
$2.675
billion
(Global
Credit
Facility)
which
matures
on
January
31,
2025.
This
Global
Credit
Facility
provides
a
source
of
funds
to
the
Borrowers
for
temporary
and
emergency
purposes,
including
the
ability
to
meet
future
unanticipated
or
unusually
large
redemption
requests.
Under
the
terms
of
the
Global
Credit
Facility,
the
Funds
shall,
in
addition
to
interest
charged
on
any
borrowings
made
by
the
Funds
and
other
costs
incurred
by
the
Funds,
pay
their
share
of
fees
and
expenses
incurred
in
connection
with
the
implementation
and
maintenance
of
the
Global
Credit
Facility,
based
upon
their
relative
share
of
the
aggregate
net
assets
of
all
of
the
Borrowers,
including
an
annual
commitment
fee
of
0.15%
based
upon
the
unused
portion
of
the
Global
Credit
Facility.
These
fees
are
reflected
in
other
expenses
in
the
Statements
of
Operations.
During
the
year ended
September
30,
2024,
the
Funds
did
not
use
the
Global
Credit
Facility.
12.
Fair
Value
Measurements
The Funds
follow
a
fair
value
hierarchy
that
distinguishes
between
market
data
obtained
from
independent
sources
(observable
inputs)
and
the Funds'
own
market
assumptions
(unobservable
inputs).
These
inputs
are
used
in
determining
the
value
of
the Funds' financial
instruments
and
are
summarized
in
the
following
fair
value
hierarchy:
Level
1
–
quoted
prices
in
active
markets
for
identical
financial
instruments
Level
2
–
other
significant
observable
inputs
(including
quoted
prices
for
similar
financial
instruments,
interest
rates,
prepayment
speed,
credit
risk,
etc.)
Level
3
–
significant
unobservable
inputs
(including
the Funds'
own
assumptions
in
determining
the
fair
value
of
financial
instruments)
The
input
levels
are
not
necessarily
an
indication
of
the
risk
or
liquidity
associated
with
financial
instruments
at
that
level.
A
summary
of
inputs
used
as
of
September
30,
2024,
in
valuing
the
Funds'
assets
and
liabilities carried
at
fair
value,
is
as
follows:
a
As
of
September
30,
2024,
no
longer
an
affiliate.
b
May
include
accretion,
amortization,
and/or
other
cost
basis
adjustments.
Level
1
Level
2
Level
3
Total
Franklin
DynaTech
Fund
Assets:
Investments
in
Securities:
Common
Stocks
:
Aerospace
&
Defense
...................
$
369,630,000
$
—
$
—
$
369,630,000
Automobiles
..........................
353,200,500
—
—
353,200,500
Banks
...............................
6,825,000
—
—
6,825,000
Biotechnology
.........................
264,034,250
54,073,875
—
318,108,125
Broadline
Retail
.......................
2,273,692,000
—
—
2,273,692,000
Capital
Markets
........................
362,248,250
—
—
362,248,250
Communications
Equipment
..............
107,469,600
—
—
107,469,600
Construction
&
Engineering
...............
208,705,000
—
—
208,705,000
Diversified
Consumer
Services
............
28,202,000
—
—
28,202,000
Electrical
Equipment
....................
9,949,000
—
—
9,949,000
10.
Holdings
of
5%
Voting
Securities
of
Portfolio
Companies
(continued)
Franklin
Custodian
Funds
Notes
to
Financial
Statements
Level
1
Level
2
Level
3
Total
Franklin
DynaTech
Fund
(continued)
Assets:
(continued)
Investments
in
Securities:
Common
Stocks:
Electronic
Equipment,
Instruments
&
Components
........................
$
90,972,000
$
47,922,883
$
—
$
138,894,883
Energy
Equipment
&
Services
.............
93,807,500
—
—
93,807,500
Entertainment
.........................
53,890,000
—
—
53,890,000
Financial
Services
......................
1,114,410,000
—
—
1,114,410,000
Ground
Transportation
..................
225,480,000
—
—
225,480,000
Health
Care
Equipment
&
Supplies
.........
882,839,500
—
—
882,839,500
Health
Care
Providers
&
Services
..........
157,861,000
—
—
157,861,000
Health
Care
Technology
.................
10,493,500
49,240,948
—
59,734,448
Hotels,
Restaurants
&
Leisure
.............
305,575,800
—
—
305,575,800
Interactive
Media
&
Services
..............
2,305,830,000
—
—
2,305,830,000
IT
Services
...........................
452,099,249
—
—
452,099,249
Life
Sciences
Tools
&
Services
............
830,750,920
—
—
830,750,920
Media
...............................
10,965,000
—
—
10,965,000
Pharmaceuticals
.......................
758,224,750
—
—
758,224,750
Professional
Services
...................
26,796,000
—
—
26,796,000
Semiconductors
&
Semiconductor
Equipment
.
6,495,015,000
131,963,826
—
6,626,978,826
Software
.............................
6,508,374,286
—
—
6,508,374,286
Technology
Hardware,
Storage
&
Peripherals
.
582,500,000
—
—
582,500,000
Trading
Companies
&
Distributors
..........
14,284,000
—
—
14,284,000
Warrants
...............................
—
—
—
a
—
Short
Term
Investments
...................
240,094,622
—
—
240,094,622
Total
Investments
in
Securities
...........
$25,144,218,727
$283,201,532
b
$—
$25,427,420,259
Franklin
Growth
Fund
Assets:
Investments
in
Securities:
Common
Stocks
:
Aerospace
&
Defense
...................
824,633,477
—
—
824,633,477
Beverages
...........................
458,991,793
—
—
458,991,793
Biotechnology
.........................
347,740,545
—
—
347,740,545
Broadline
Retail
.......................
845,774,975
—
—
845,774,975
Building
Products
......................
384,791,776
—
—
384,791,776
Capital
Markets
........................
913,837,960
—
—
913,837,960
Chemicals
...........................
608,983,203
—
—
608,983,203
Commercial
Services
&
Supplies
...........
123,877,911
—
—
123,877,911
Construction
Materials
..................
179,989,185
—
—
179,989,185
Consumer
Staples
Distribution
&
Retail
......
224,687,608
—
—
224,687,608
Electric
Utilities
........................
216,011,850
—
—
216,011,850
Electrical
Equipment
....................
261,057,372
—
—
261,057,372
Electronic
Equipment,
Instruments
&
Components
........................
321,410,171
—
—
321,410,171
Financial
Services
......................
754,191,073
—
—
754,191,073
Ground
Transportation
..................
586,471,718
—
—
586,471,718
Health
Care
Equipment
&
Supplies
.........
720,234,196
—
—
720,234,196
Health
Care
Providers
&
Services
..........
258,729,670
—
—
258,729,670
Health
Care
Technology
.................
85,797,584
—
—
85,797,584
Hotels,
Restaurants
&
Leisure
.............
333,949,108
—
—
333,949,108
Industrial
REITs
.......................
106,188,852
—
—
106,188,852
Interactive
Media
&
Services
..............
742,647,503
—
—
742,647,503
IT
Services
...........................
350,714,507
—
31,148,647
381,863,154
Life
Sciences
Tools
&
Services
............
1,029,655,694
—
—
1,029,655,694
Machinery
............................
703,157,040
—
—
703,157,040
Pharmaceuticals
.......................
568,735,770
—
—
568,735,770
12.
Fair
Value
Measurements
(continued)
Franklin
Custodian
Funds
Notes
to
Financial
Statements
Level
1
Level
2
Level
3
Total
Franklin
Growth
Fund
(continued)
Assets:
(continued)
Investments
in
Securities:
Common
Stocks:
Professional
Services
...................
$
76,876,120
$
—
$
—
$
76,876,120
Semiconductors
&
Semiconductor
Equipment
.
2,477,493,771
—
—
2,477,493,771
Software
.............................
3,246,300,723
—
23,735,324
3,270,036,047
Technology
Hardware,
Storage
&
Peripherals
.
764,191,769
—
—
764,191,769
Textiles,
Apparel
&
Luxury
Goods
..........
155,366,182
—
—
155,366,182
Trading
Companies
&
Distributors
..........
186,071,454
—
—
186,071,454
Water
Utilities
.........................
84,814,374
—
—
84,814,374
Convertible
Preferred
Stocks
................
—
—
117,490,067
117,490,067
Preferred
Stocks
.........................
—
133,572,335
—
133,572,335
Short
Term
Investments
...................
135,466,860
—
—
135,466,860
Total
Investments
in
Securities
...........
$19,078,841,794
$133,572,335
c
$172,374,038
$19,384,788,167
Franklin
Income
Fund
Assets:
Investments
in
Securities:
Common
Stocks
:
Aerospace
&
Defense
...................
997,842,000
—
—
997,842,000
Air
Freight
&
Logistics
...................
204,510,000
—
—
204,510,000
Banks
...............................
1,395,910,209
—
—
1,395,910,209
Beverages
...........................
1,065,830,000
—
—
1,065,830,000
Biotechnology
.........................
161,105,000
—
—
161,105,000
Chemicals
...........................
555,480,000
—
—
555,480,000
Communications
Equipment
..............
393,561,900
—
—
393,561,900
Containers
&
Packaging
.................
48,850,000
—
—
48,850,000
Diversified
Telecommunication
Services
.....
224,550,000
—
—
224,550,000
Electric
Utilities
........................
2,196,748,417
—
—
2,196,748,417
Energy
Equipment
&
Services
.............
101,675,000
—
—
101,675,000
Ground
Transportation
..................
431,340,000
—
—
431,340,000
Health
Care
Equipment
&
Supplies
.........
237,065,000
—
—
237,065,000
Health
Care
Providers
&
Services
..........
314,400,000
—
—
314,400,000
Household
Products
....................
866,000,000
—
—
866,000,000
Industrial
Conglomerates
................
310,065,000
—
—
310,065,000
IT
Services
...........................
165,810,000
—
—
165,810,000
Machinery
............................
78,621,000
—
—
78,621,000
Media
...............................
167,080,000
—
—
167,080,000
Metals
&
Mining
.......................
249,095,000
70,533,101
—
319,628,101
Multi-Utilities
..........................
539,840,000
—
—
539,840,000
Oil,
Gas
&
Consumable
Fuels
.............
2,908,631,460
—
—
2,908,631,460
Pharmaceuticals
.......................
2,081,620,525
—
—
2,081,620,525
Semiconductors
&
Semiconductor
Equipment
.
144,791,500
—
—
144,791,500
Specialty
Retail
........................
603,059,160
—
—
603,059,160
Technology
Hardware,
Storage
&
Peripherals
.
877,196
—
—
877,196
Tobacco
.............................
364,200,000
—
—
364,200,000
Management
Investment
Companies
:
Capital
Markets
........................
91,974,965
—
265,381,931
357,356,896
Equity-Linked
Securities
...................
—
14,569,948,433
—
14,569,948,433
Convertible
Preferred
Stocks
:
Chemicals
...........................
247,500,000
—
—
247,500,000
Electric
Utilities
........................
138,625,000
—
—
138,625,000
12.
Fair
Value
Measurements
(continued)
Franklin
Custodian
Funds
Notes
to
Financial
Statements
A
reconciliation
in
which
Level
3
inputs
are
used
in
determining
fair
value
is
presented
when
there
are
significant
Level
3
assets
and/or
liabilities
at
the
beginning
and/or
end
of
the year.
Level
1
Level
2
Level
3
Total
Franklin
Income
Fund
(continued)
Assets:
(continued)
Investments
in
Securities:
Convertible
Preferred
Stocks:
Financial
Services
......................
$
—
$
52,152,000
$
—
$
52,152,000
Preferred
Stocks
.........................
17,120,000
—
—
17,120,000
Convertible
Bonds
.......................
—
52,325,000
—
52,325,000
Corporate
Bonds
........................
—
34,288,448,565
—
34,288,448,565
Senior
Floating
Rate
Interests
...............
—
34,971,825
—
34,971,825
U.S.
Government
and
Agency
Securities
.......
—
7,012,569,337
—
7,012,569,337
Asset-Backed
Securities
...................
—
102,870,820
—
102,870,820
Mortgage-Backed
Securities
................
—
971,004,839
—
971,004,839
Escrows
and
Litigation
Trusts
...............
—
—
—
a
—
Short
Term
Investments
...................
475,431,275
—
—
475,431,275
Total
Investments
in
Securities
...........
$17,779,209,607
$57,154,823,920
d
$265,381,931
$75,199,415,458
Liabilities:
Other
Financial
Instruments:
Options
Written
..........................
$57,067,500
$—
$—
$57,067,500
Total
Other
Financial
Instruments
.........
$57,067,500
$—
$—
$57,067,500
Franklin
U.S.
Government
Securities
Fund
Assets:
Investments
in
Securities:
e
U.S.
Government
and
Agency
Securities
.......
—
82,355,645
—
82,355,645
Mortgage-Backed
Securities
................
—
2,260,750,561
—
2,260,750,561
Short
Term
Investments
...................
36,624,604
—
—
36,624,604
Total
Investments
in
Securities
...........
$36,624,604
$2,343,106,206
$—
$2,379,730,810
Franklin
Utilities
Fund
Assets:
Investments
in
Securities:
Common
Stocks
:
Construction
&
Engineering
...............
2,942,820
—
—
2,942,820
Electric
Utilities
........................
3,897,821,905
—
—
3,897,821,905
Gas
Utilities
..........................
97,894,203
—
—
97,894,203
Independent
Power
and
Renewable
Electricity
Producers
..........................
361,894,000
94,714,290
—
456,608,290
Multi-Utilities
..........................
1,669,130,166
237,143,816
—
1,906,273,982
Oil,
Gas
&
Consumable
Fuels
.............
254,901,000
—
—
254,901,000
Water
Utilities
.........................
34,713,000
28,042,738
—
62,755,738
Short
Term
Investments
...................
31,088,886
—
—
31,088,886
Total
Investments
in
Securities
...........
$6,350,385,980
$359,900,844
f
$—
$6,710,286,824
a
Includes
financial
instruments
determined
to
have
no
value.
b
Includes
foreign
securities
valued
at
$283,201,532,
which
were
categorized
as
Level
2
as
a
result
of
the
application
of
market
level
fair
value
procedures.
See
the
Financial
Instrument
Valuation
note
for
more
information.
c
Includes
foreign
securities
valued
at
$133,572,335,
which
were
categorized
as
Level
2
as
a
result
of
the
application
of
market
level
fair
value
procedures.
See
the
Financial
Instrument
Valuation
note
for
more
information.
d
Includes
foreign
securities
valued
at
$70,533,101,
which
were
categorized
as
Level
2
as
a
result
of
the
application
of
market
level
fair
value
procedures.
See
the
Financial
Instrument
Valuation
note
for
more
information.
e
For
detailed
categories,
see
the
accompanying
Schedule
of
Investments.
f
Includes
foreign
securities
valued
at
$359,900,844,
which
were
categorized
as
Level
2
as
a
result
of
the
application
of
market
level
fair
value
procedures.
See
the
Financial
Instrument
Valuation
note
for
more
information.
12.
Fair
Value
Measurements
(continued)
Franklin
Custodian
Funds
Notes
to
Financial
Statements
13.
Subsequent
Events
The
Funds
have
evaluated
subsequent
events
through
the
issuance
of
the
financial
statements
and
determined
that
no
events
have
occurred
that
require
disclosure.
Abbreviations
Selected
Portfolio
ADR
American
Depositary
Receipt
BDC
Business
Development
Company
CME
Chicago
Mercantile
Exchange
FHLMC
Federal
Home
Loan
Mortgage
Corp.
FNMA
Federal
National
Mortgage
Association
FRN
Floating
Rate
Note
GNMA
Government
National
Mortgage
Association
PIK
Payment-In-Kind
REIT
Real
Estate
Investment
Trust
SOFR
Secured
Overnight
Financing
Rate
Report
of
Independent
Registered
Public
Accounting
Firm
To
the
Board
of
Trustees
of
Franklin
Custodian
Funds
and
Shareholders
of
Franklin
DynaTech
Fund,
Franklin
Growth
Fund,
Franklin
Income
Fund,
Franklin
U.S.
Government
Securities
Fund
and
Franklin
Utilities
Fund
Opinions
on
the
Financial
Statements
We
have
audited
the
accompanying
statements
of
assets
and
liabilities,
including
the
schedules
of
investments,
of
Franklin
DynaTech
Fund,
Franklin
Growth
Fund,
Franklin
Income
Fund,
Franklin
U.S.
Government
Securities
Fund
and
Franklin
Utilities
Fund
(constituting
Franklin
Custodian
Funds,
hereafter
collectively
referred
to
as
the
"Funds")
as
of
September
30,
2024,
the
related
statements
of
operations
for
the
year
ended
September
30,
2024,
the
statements
of
changes
in
net
assets
for
each
of
the
two
years
in
the
period
ended
September
30,
2024,
including
the
related
notes,
and
the
financial
highlights
for
each
of
the
five
years
in
the
period
ended
September
30,
2024
(collectively
referred
to
as
the
“financial
statements”).
In
our
opinion,
the
financial
statements
present
fairly,
in
all
material
respects,
the
financial
position
of
each
of
the
Funds
as
of
September
30,
2024,
the
results
of
each
of
their
operations
for
the
year
then
ended,
the
changes
in
each
of
their
net
assets
for
each
of
the
two
years
in
the
period
ended
September
30,
2024
and
each
of
the
financial
highlights
for
each
of
the
five
years
in
the
period
ended
September
30,2024
in
conformity
with
accounting
principles
generally
accepted
in
the
United
States
of
America.
Basis
for
Opinions
These
financial
statements
are
the
responsibility
of
the
Funds’
management.
Our
responsibility
is
to
express
an
opinion
on
the
Funds’
financial
statements
based
on
our
audits.
We
are
a
public
accounting
firm
registered
with
the
Public
Company
Accounting
Oversight
Board
(United
States)
(PCAOB)
and
are
required
to
be
independent
with
respect
to
the
Funds
in
accordance
with
the
U.S.
federal
securities
laws
and
the
applicable
rules
and
regulations
of
the
Securities
and
Exchange
Commission
and
the
PCAOB.
We
conducted
our
audits
of
these
financial
statements
in
accordance
with
the
standards
of
the
PCAOB.
Those
standards
require
that
we
plan
and
perform
the
audit
to
obtain
reasonable
assurance
about
whether
the
financial
statements
are
free
of
material
misstatement,
whether
due
to
error
or
fraud.
Our
audits
included
performing
procedures
to
assess
the
risks
of
material
misstatement
of
the
financial
statements,
whether
due
to
error
or
fraud,
and
performing
procedures
that
respond
to
those
risks.
Such
procedures
included
examining,
on
a
test
basis,
evidence
regarding
the
amounts
and
disclosures
in
the
financial
statements.
Our
audits
also
included
evaluating
the
accounting
principles
used
and
significant
estimates
made
by
management,
as
well
as
evaluating
the
overall
presentation
of
the
financial
statements.
Our
procedures
included
confirmation
of
securities
owned
as
of
September
30,
2024,
by
correspondence
with
the
custodian,
transfer
agent
and
brokers;
when
replies
were
not
received
from
brokers,
we
performed
other
auditing
procedures.
We
believe
that
our
audits
provide
a
reasonable
basis
for
our
opinions.
/s/PricewaterhouseCoopers
LLP
San
Francisco,
California
November
18,
2024
We
have
served
as
the
auditor
of
one
or
more
investment
companies
in
the
Franklin
Templeton
Group
of
Funds
since
1948.
Tax
Information
(unaudited)
By
mid-February,
tax
information
related
to
a
shareholder's
proportionate
share
of
distributions
paid
during
the
preceding
calendar
year
will
be
received,
if
applicable.
Please
also
refer
to
www.franklintempleton.com
for
per
share
tax
information
related
to
any
distributions
paid
during
the
preceding
calendar
year.
Shareholders
are
advised
to
consult
with
their
tax
advisors
for
further
information
on
the
treatment
of
these
amounts
on
their
tax
returns.
The
following
tax
information
for
the
Funds
is
required
to
be
furnished
to
shareholders
with
respect
to
income
earned
and
distributions
paid
during
its
fiscal
year.
The
Funds
below
hereby
report
the
following
amounts,
or
if
subsequently
determined
to
be
different,
the
maximum
allowable
amounts,
for
the
fiscal
year
ended
September
30,
2024:
Note
(1)
-
The
Law
varies
in
each
state
as
to
whether
and
what
percentage
of
dividend
income
attributable
to
Federal
obligations
is
exempt
from
state
income
tax.
Shareholders
are
advised
to
consult
with
their
tax
advisors
to
determine
if
any
portion
of
the
dividends
received
is
exempt
from
state
income
taxes.
Pursuant
to:
Franklin
DynaTech
Fund
Franklin
Growth
Fund
Franklin
Income
Fund
Long-Term
Capital
Gain
Dividends
Distributed
§852(b)(3)(C)
—
$1,078,333,464
—
Income
Eligible
for
Dividends
Received
Deduction
(DRD)
§854(b)(1)(A)
$69,118,408
$126,741,754
$477,312,301
Qualified
Dividend
Income
Earned
(QDI)
§854(b)(1)(B)
$78,937,949
$144,676,665
$532,267,511
Qualified
Net
Interest
Income
(QII)
§871(k)(1)(C)
—
—
$2,179,170,594
Short-Term
Capital
Gain
Dividends
Distributed
§871(k)(2)(C)
—
$970,566
—
Qualified
Business
Income
Dividends
Earned
§199A
—
$779,631
—
Section
163(j)
Interest
Dividends
Earned
§163(j)
—
—
$2,499,701,498
Interest
Earned
from
Federal
Obligations
Note
(1)
—
—
$342,730,867
Pursuant
to:
Franklin
U.S.
Government
Securities
Fund
Franklin
Utilities
Fund
Long-Term
Capital
Gain
Dividends
Distributed
§852(b)(3)(C)
—
$234,658,907
Income
Eligible
for
Dividends
Received
Deduction
(DRD)
§854(b)(1)(A)
—
$186,967,714
Qualified
Dividend
Income
Earned
(QDI)
§854(b)(1)(B)
—
$200,895,696
Qualified
Net
Interest
Income
(QII)
§871(k)(1)(C)
$80,578,089
—
Section
163(j)
Interest
Dividends
Earned
§163(j)
$80,578,089
—
Interest
Earned
from
Federal
Obligations
Note
(1)
$1,710,101
—
FRANKLIN
CUSTODIAN
FUNDS
Franklin
DynaTech
Fund
Franklin
Growth
Fund
Franklin
Income
Fund
Franklin
U.S.
Government
Securities
Fund
Franklin
Utilities
Fund
(each
a
Fund)
At
an
in-person
meeting
held
on
April
16,
2024
(Meeting),
the
Board
of
Trustees
(Board)
of
Franklin
Custodian
Funds
(Trust),
including
a
majority
of
the
trustees
who
are
not
“interested
persons”
as
defined
in
the
Investment
Company
Act
of
1940
(Independent
Trustees),
reviewed
and
approved
the
continuance
of
the
investment
management
agreement
between
Franklin
Advisers,
Inc.
(Manager)
and
the
Trust,
on
behalf
of
each
Fund
(each
a
Management
Agreement)
for
an
additional
one-year
period.
The
Independent
Trustees
received
advice
from
and
met
separately
with
Independent
Trustee
counsel
in
considering
whether
to
approve
the
continuation
of
each
Management
Agreement.
Although
the
Management
Agreements
for
the
Funds
were
considered
at
the
same
Board
meeting,
the
Board
considered
the
information
provided
to
it
about
the
Funds
together
and
with
respect
to
each
Fund
separately
as
the
Board
deemed
appropriate.
In
considering
the
continuation
of
each
Management
Agreement,
the
Board
reviewed
and
considered
information
provided
by
the
Manager
at
the
Meeting
and
throughout
the
year
at
meetings
of
the
Board
and
its
committees.
The
Board
also
reviewed
and
considered
information
provided
in
response
to
a
detailed
set
of
requests
for
information
submitted
to
the
Manager
by
Independent
Trustee
counsel
on
behalf
of
the
Independent
Trustees
in
connection
with
the
annual
contract
renewal
process.
In
addition,
prior
to
the
Meeting,
the
Independent
Trustees
held
a
virtual
contract
renewal
meeting
at
which
the
Independent
Trustees
first
conferred
amongst
themselves
and
Independent
Trustee
counsel
about
contract
renewal
matters,
and
then
met
with
management
to
request
additional
information
that
the
Independent
Trustees
reviewed
and
considered
prior
to
and
at
the
Meeting.
The
Board
reviewed
and
considered
all
of
the
factors
it
deemed
relevant
in
approving
the
continuance
Changes
In
and
Disagreements
with
Accountants
For
the
period
covered
by
this
report
Not
applicable.
Results
of
Meeting(s)
of
Shareholders
For
the
period
covered
by
this
report
Not
applicable.
Remuneration
Paid
to
Directors,
Officers
and
Others
For
the
period
covered
by
this
report
Refer
to
the
financial
statements
included
herein.
Board
Approval
of
Management
and
Subadvisory
Agreements
For
the
period
covered
by
this
report
of
each
Management
Agreement,
including,
but
not
limited
to:
(i)
the
nature,
extent
and
quality
of
the
services
provided
by
the
Manager;
(ii)
the
investment
performance
of
each
Fund;
(iii)
the
costs
of
the
services
provided
and
profits
realized
by
the
Manager
and
its
affiliates
from
the
relationship
with
each
Fund;
(iv)
the
extent
to
which
economies
of
scale
are
realized
as
each
Fund
grows;
and
(v)
whether
fee
levels
reflect
these
economies
of
scale
for
the
benefit
of
Fund
investors.
In
approving
the
continuance
of
each
Management
Agreement,
the
Board,
including
a
majority
of
the
Independent
Trustees,
determined,
through
the
exercise
of
its
business
judgment,
that
the
terms
of
the
Management
Agreement
are
fair
and
reasonable
and
that
the
continuance
of
the
Management
Agreement
is
in
the
best
interests
of
the
applicable
Fund
and
its
shareholders.
While
attention
was
given
to
all
information
furnished,
the
following
discusses
some
primary
factors
relevant
to
the
Board’s
determination.
Nature,
Extent
and
Quality
of
Services
The
Board
reviewed
and
considered
information
regarding
the
nature,
extent
and
quality
of
investment
management
services
provided
by
the
Manager
and
its
affiliates
to
the
Funds
and
their
shareholders.
This
information
included,
among
other
things,
the
qualifications,
background
and
experience
of
the
senior
management
and
investment
personnel
of
the
Manager,
as
well
as
information
on
succession
planning
where
appropriate;
the
structure
of
investment
personnel
compensation;
oversight
of
third-
party
service
providers;
investment
performance
reports
and
related
financial
information
for
each
Fund;
reports
on
expenses
and
shareholder
services;
legal
and
compliance
matters;
risk
controls;
pricing
and
other
services
provided
by
the
Manager
and
its
affiliates;
and
management
fees
charged
by
the
Manager
and
its
affiliates
to
US
funds
and
other
accounts,
including
management’s
explanation
of
differences
among
accounts
where
relevant.
The
Board
also
reviewed
and
considered
an
annual
report
on
payments
made
by
Franklin
Templeton
(FT)
or
the
Funds
to
financial
intermediaries,
as
well
as
a
memorandum
relating
to
third-party
servicing
arrangements.
The
Board
acknowledged
the
ongoing
integration
of
the
Putnam
family
of
funds
into
the
FT
family
of
funds
and
management’s
continued
development
of
strategies
to
address
areas
of
heightened
concern
in
the
mutual
fund
industry,
including
various
regulatory
initiatives
and
continuing
geopolitical
concerns.
The
Board
also
reviewed
and
considered
the
benefits
provided
to
Fund
shareholders
of
investing
in
a
fund
that
is
part
of
the
FT
family
of
funds.
The
Board
noted
the
financial
position
of
Franklin
Resources,
Inc.
(FRI),
the
Manager’s
parent,
and
its
commitment
to
the
mutual
fund
business
as
evidenced
by
its
continued
reassessment
of
the
fund
offerings
in
response
to
FT
acquisitions
and
the
market
environment,
as
well
as
project
initiatives
and
capital
investments
relating
to
the
services
provided
to
the
Funds
by
the
FT
organization.
The
Board
specifically
noted
FT’s
commitment
to
technological
innovation
and
advancement,
including
its
initiative
to
create
a
new
enterprise-wide
artificial
intelligence
platform.
Following
consideration
of
such
information,
the
Board
was
satisfied
with
the
nature,
extent
and
quality
of
services
provided
by
the
Manager
and
its
affiliates
to
the
Funds
and
their
shareholders.
Fund
Performance
The
Board
reviewed
and
considered
the
performance
results
of
each
Fund
over
various
time
periods
ended
December
31,
2023.
The
Board
considered
the
performance
returns
for
each
Fund
in
comparison
to
the
performance
returns
of
mutual
funds
deemed
comparable
to
the
Fund
included
in
a
universe
(Performance
Universe)
selected
by
Broadridge
Financial
Solutions,
Inc.
(Broadridge),
an
independent
provider
of
investment
company
data.
The
Board
received
a
description
of
the
methodology
used
by
Broadridge
to
select
the
mutual
funds
included
in
a
Performance
Universe.
The
Board
further
reviewed
and
considered
Fund
performance
reports
provided
and
discussions
that
occurred
with
portfolio
managers
at
Board
meetings
throughout
the
year.
A
summary
of
each
Fund’s
performance
results
is
below.
Franklin
DynaTech
Fund
-
The
Performance
Universe
for
the
Fund
included
the
Fund
and
all
retail
and
institutional
multi-
cap
growth
funds.
The
Board
noted
that
the
Fund’s
annualized
total
return
for
the
one-,
five-
and
10-year
periods
was
above
the
median
and
in
the
first
(best)
and
second
quintiles
of
its
Performance
Universe,
but
for
the
three-year
period
was
below
the
median
of
its
Performance
Universe.
The
Board
concluded
that
the
Fund’s
performance
was
satisfactory.
Franklin
Growth
Fund
-
The
Performance
Universe
for
the
Fund
included
the
Fund
and
all
retail
and
institutional
multi-
cap
growth
funds.
The
Board
noted
that
the
Fund’s
annualized
total
return
for
the
three-,
five-
and
10-year
periods
was
above
the
median
of
its
Performance
Universe,
but
for
the
one-year
period
was
below
the
median
of
its
Performance
Universe.
The
Board
further
noted
that
the
annualized
total
return
for
the
one-year
period
was
27.66%.
The
Board
concluded
that
the
Fund’s
performance
was
satisfactory.
Franklin
Income
Fund
and
Franklin
Utilities
Fund
-
The
Performance
Universe
for
the
Franklin
Income
Fund
included
the
Fund
and
all
retail
and
institutional
flexible
portfolio
funds.
The
Performance
Universe
for
the
Franklin
Utilities
Fund
included
the
Fund
and
all
retail
and
institutional
utility
funds.
The
Board
noted
that
each
Fund’s
annualized
income
return
for
the
one-,
three-,
five-
and
10-year
periods
was
above
the
median
of
its
respective
Performance
Universe
and,
for
the
Franklin
Income
Fund,
in
the
first
quintile
(best).
The
Board
also
noted
that
each
Fund’s
annualized
total
return
for
the
three-,
five-
and
10-year
periods
was
above
the
median
of
its
respective
Performance
Universe,
but
for
the
one-year
period
was
below
the
median
of
its
respective
Performance
Universe.
The
Board
further
noted
management’s
view
regarding
the
income-related
attributes
of
each
Fund
(e.g.,
a
fund’s
investment
objective)
as
set
forth
in
each
Fund’s
registration
statement
and
that
the
evaluation
of
each
Fund’s
performance
relative
to
its
peers
on
an
income
return
basis
was
appropriate
given
these
attributes.
The
Board
concluded
that
each
Fund’s
performance
was
satisfactory.
Franklin
U.S.
Government
Securities
Fund
-
The
Performance
Universe
for
the
Fund
included
the
Fund
and
all
retail
and
institutional
Government
National
Mortgage
Association
(Ginnie
Mae)
funds.
The
Board
noted
that
the
Fund’s
annualized
income
return
for
the
three-,
five-
and
10-year
periods
was
above
the
median
of
its
Performance
Universe,
but
for
the
one-year
period
was
below
the
median
of
its
Performance
Universe.
The
Board
further
noted
that
the
Fund’s
annualized
total
return
for
the
three-year
period
was
above
the
median
of
its
Performance
Universe,
but
for
the
one-,
five-
and
10-year
periods
was
below
the
median
of
its
Performance
Universe.
The
Board
also
noted
the
Fund’s
conservative
policy
of
investing
substantially
all
of
its
assets
in
Ginnie
Mae
obligations
and
that,
although
below
the
median,
the
Fund
had
a
positive
annualized
income
return
of
3.15%
and
a
positive
annualized
total
return
of
4.37%
for
the
one-year
period.
The
Board
further
noted
management’s
view
regarding
the
income-related
attributes
of
the
Fund
(e.g.,
a
fund’s
investment
objective)
as
set
forth
in
the
Fund’s
registration
statement
and
that
the
evaluation
of
the
Fund’s
performance
relative
to
its
peers
on
an
income
return
basis
was
appropriate
given
these
attributes.
The
Board
concluded
that
the
Fund’s
performance
was
satisfactory.
Comparative
Fees
and
Expenses
The
Board
reviewed
and
considered
information
regarding
each
Fund’s
actual
total
expense
ratio
and
its
various
components,
including,
as
applicable,
management
fees;
transfer
agent
expenses;
underlying
fund
expenses;
Rule
12b-1
and
non-Rule
12b-1
service
fees;
and
other
non-management
fees.
The
Board
also
noted
the
quarterly
and
annual
reports
it
receives
on
all
marketing
support
payments
made
by
FT
to
financial
intermediaries.
The
Board
considered
the
actual
total
expense
ratio
and,
separately,
the
contractual
management
fee
rate,
without
the
effect
of
fee
waivers,
if
any
(Management
Rate)
of
each
Fund
in
comparison
to
the
median
expense
ratio
and
median
Management
Rate,
respectively,
of
other
mutual
funds
deemed
comparable
to
and
with
a
similar
expense
structure
to
the
Fund
selected
by
Broadridge
(Expense
Group).
Broadridge
fee
and
expense
data
is
based
upon
information
taken
from
each
fund’s
most
recent
annual
or
semi-annual
report,
which
reflects
historical
asset
levels
that
may
be
quite
different
from
those
currently
existing,
particularly
in
a
period
of
market
volatility.
While
recognizing
such
inherent
limitation
and
the
fact
that
expense
ratios
and
Management
Rates
generally
increase
as
assets
decline
and
decrease
as
assets
grow,
the
Board
believed
the
independent
analysis
conducted
by
Broadridge
to
be
an
appropriate
measure
of
comparative
fees
and
expenses.
The
Broadridge
Management
Rate
includes
administrative
charges,
and
the
actual
total
expense
ratio,
for
comparative
consistency,
was
shown
for
Class
A
shares
for
the
Franklin
DynaTech
Fund
and
Franklin
Growth
Fund
and
for
each
other
fund
in
the
applicable
Expense
Group.
The
actual
expense
ratio
was
shown
for
Class
A1
shares
for
the
Franklin
Income
Fund
and
for
Class
A
shares
and
Class
M
shares
for
the
other
funds
in
the
Fund’s
Expense
Group.
The
actual
total
expense
ratio
was
shown
for
Class
A1
shares
for
the
Franklin
U.S.
Government
Securities
Fund
and
Franklin
Utilities
Fund
and
for
Class
A
shares
for
each
other
fund
in
the
applicable
Expense
Group.
The
Board
received
a
description
of
the
methodology
used
by
Broadridge
to
select
the
mutual
funds
included
in
an
Expense
Group.
Franklin
DynaTech
Fund,
Franklin
Growth
Fund,
Franklin
Income
Fund
and
Franklin
Utilities
Fund
-
The
Expense
Group
for
the
Franklin
DynaTech
Fund
included
the
Fund
and
14
other
multi-cap
growth
funds.
The
Expense
Group
for
the
Franklin
Growth
Fund
included
the
Fund
and
12
other
multi-cap
growth
funds.
The
Expense
Group
for
the
Franklin
Income
Fund
included
the
Fund
and
12
other
flexible
portfolio
funds.
The
Expense
Group
for
the
Franklin
Utilities
Fund
included
the
Fund
and
six
other
utility
funds.
The
Board
noted
that
the
Management
Rates
and
actual
total
expense
ratios
for
the
Funds
were
below
the
medians
and
in
the
first
quintile
(least
expensive)
of
their
respective
Expense
Groups.
The
Board
concluded
that
the
Management
Rates
charged
to
the
Funds
are
reasonable.
Franklin
U.S.
Government
Securities
Fund
-
The
Expense
Group
for
the
Fund
included
the
Fund,
three
other
Ginnie
Mae
funds
and
four
US
mortgage
funds.
The
Board
noted
that
the
Management
Rate
for
the
Fund
was
essentially
equal
to
the
median
of
its
Expense
Group.
The
Board
also
noted
that
the
actual
total
expense
ratio
for
the
Fund
was
below
the
median
and
in
the
first
quintile
(least
expensive)
of
its
Expense
Group.
The
Board
concluded
that
the
Management
Rate
charged
to
the
Fund
is
reasonable.
Profitability
The
Board
reviewed
and
considered
information
regarding
the
profits
realized
by
the
Manager
and
its
affiliates
in
connection
with
the
operation
of
each
Fund.
In
this
respect,
the
Board
considered
the
Fund
profitability
analysis
provided
by
the
Manager
that
addresses
the
overall
profitability
of
FT’s
US
fund
business,
as
well
as
its
profits
in
providing
investment
management
and
other
services
to
each
of
the
individual
funds
during
the
12-month
period
ended
September
30,
2023,
being
the
most
recent
fiscal
year-end
for
FRI.
The
Board
noted
that
although
management
continually
makes
refinements
to
its
methodologies
used
in
calculating
profitability
in
response
to
organizational
and
product-related
changes,
the
overall
methodology
has
remained
consistent
with
that
used
in
the
Funds’
profitability
report
presentations
from
prior
years.
The
Board
also
noted
that
an
independent
registered
public
accounting
firm
has
been
engaged
by
the
Manager
to
periodically
review
and
assess
the
allocation
methodologies
to
be
used
solely
by
the
Funds’
Board
with
respect
to
the
profitability
analysis.
The
Board
noted
management’s
belief
that
costs
incurred
in
establishing
the
infrastructure
necessary
for
the
type
of
mutual
fund
operations
conducted
by
the
Manager
and
its
affiliates
may
not
be
fully
reflected
in
the
expenses
allocated
to
each
Fund
in
determining
its
profitability,
as
well
as
the
fact
that
the
level
of
profits,
to
a
certain
extent,
reflected
operational
cost
savings
and
efficiencies
initiated
by
management.
As
part
of
this
evaluation,
the
Board
considered
management’s
outsourcing
of
certain
operations,
which
effort
has
required
considerable
up-front
expenditures
by
the
Manager
but,
over
the
long
run
is
expected
to
result
in
greater
efficiencies.
The
Board
also
noted
management’s
expenditures
in
improving
shareholder
services
provided
to
the
Funds,
as
well
as
the
need
to
implement
systems
and
meet
additional
regulatory
and
compliance
requirements
resulting
from
recent
US
Securities
and
Exchange
Commission
and
other
regulatory
requirements.
The
Board
also
considered
the
extent
to
which
the
Manager
and
its
affiliates
might
derive
ancillary
benefits
from
fund
operations,
including
revenues
generated
from
transfer
agent
services,
potential
benefits
resulting
from
personnel
and
systems
enhancements
necessitated
by
fund
growth,
as
well
as
increased
leverage
with
service
providers
and
counterparties.
Based
upon
its
consideration
of
all
these
factors,
the
Board
concluded
that
the
level
of
profits
realized
by
the
Manager
and
its
affiliates
from
providing
services
to
each
Fund
was
not
excessive
in
view
of
the
nature,
extent
and
quality
of
services
provided
to
each
Fund.
Economies
of
Scale
The
Board
reviewed
and
considered
the
extent
to
which
the
Manager
may
realize
economies
of
scale,
if
any,
as
each
Fund
grows
larger
and
whether
each
Fund’s
management
fee
structure
reflects
any
economies
of
scale
for
the
benefit
of
shareholders.
With
respect
to
possible
economies
of
scale,
the
Board
noted
the
existence
of
management
fee
breakpoints,
which
operate
generally
to
share
any
economies
of
scale
with
a
Fund’s
shareholders
by
reducing
the
Fund’s
effective
management
fees
as
the
Fund
grows
in
size.
The
Board
considered
the
Manager’s
view
that
any
analyses
of
potential
economies
of
scale
in
managing
a
particular
fund
are
inherently
limited
in
light
of
the
joint
and
common
costs
and
investments
the
Manager
incurs
across
the
FT
family
of
funds
as
a
whole.
The
Board
further
noted
that
the
Franklin
DynaTech
Fund
and
Franklin
Growth
Fund
experienced
a
significant
decrease
in
assets
and
would
not
be
expected
to
demonstrate
additional
economies
of
scale
in
the
near
term.
The
Board
concluded
that
to
the
extent
economies
of
scale
may
be
realized
by
the
Manager
and
its
affiliates,
each
Fund’s
management
fee
structure
provided
a
sharing
of
benefits
with
the
Fund
and
its
shareholders
as
the
Fund
grows.
Conclusion
Based
on
its
review,
consideration
and
evaluation
of
all
factors
it
believed
relevant,
including
the
above-described
factors
and
conclusions,
the
Board
unanimously
approved
the
continuation
of
each
Management
Agreement
for
an
additional
one-year
period.
©
2024
Franklin
Templeton.
All
rights
reserved.
Item 8. Changes in and Disagreements with Accountants for Open-End Management Investment Companies.
The information is disclosed as part of the Financial Statements included in Item 7 of this Form N-CSR.
Item 9. Proxy Disclosures for Open-End Management Investment Companies.
The information is disclosed as part of the Financial Statements included in Item 7 of this Form N-CSR.
Item 10. Remuneration Paid to Directors, Officers, and Others of Open-End Management Investment Companies.
The information is disclosed as part of the Financial Statements included in Item 7 of this Form N-CSR.
Item 11. Statement Regarding Basis for Approval of Investment Advisory Contract.
The information is disclosed as part of the Financial Statements included in Item 7 of this Form N-CSR.
Item 12. Disclosure of Proxy Voting Policies and Procedures for Closed-End Management Investment Companies. N/A
Item 13. Portfolio Managers of Closed-End Management Investment Companies. N/A
Item 14. Purchases of Equity Securities by Closed-End Management Investment Company and Affiliated Purchasers. N/A
Item 15. Submission of Matters to a Vote of Security Holders.
There have been no changes to the procedures by which shareholders may recommend nominees to the Registrant's Board of Trustees that would require disclosure herein.
Item 16. Controls and Procedures.
(a) Evaluation of Disclosure Controls and Procedures. The Registrant maintains disclosure controls and procedures that are designed to provide reasonable assurance that information required to be disclosed in the Registrant’s filings under the Securities Exchange Act of 1934, as amended, and the Investment Company Act of 1940 is recorded, processed, summarized and reported within the periods specified in the rules and forms of the Securities and Exchange Commission. Such information is accumulated and communicated to the Registrant’s management, including its principal executive officer and principal financial officer, as appropriate, to allow timely decisions regarding required disclosure. The Registrant’s management, including the principal executive officer and the principal financial officer, recognizes that any set of controls and procedures, no matter how well designed and operated, can provide only reasonable assurance of achieving the desired control objectives.
Within 90 days prior to the filing date of this Shareholder Report on Form N-CSR, the Registrant had carried out an evaluation, under the supervision and with the participation of the Registrant’s management, including the Registrant’s principal executive officer and the Registrant’s principal financial officer, of the effectiveness of the design and operation of the Registrant’s disclosure controls and procedures. Based on such evaluation, the Registrant’s principal executive officer and principal financial officer concluded that the Registrant’s disclosure controls and procedures are effective.
(b) Changes in Internal Controls. There have been no changes in the Registrant’s internal control over financial reporting that occurred during the period covered by this report that has materially affected, or is reasonably likely to materially affect the internal control over financial reporting.
Item 17. Disclosure of Securities Lending Activities for Closed-End Management Investment Company. N/A
Item 18. Recovery of Erroneously Awarded Compensation.
(a) N/A
(b) N/A
Item 19. Exhibits.
(a)(1) Code of Ethics
(a)(2) Certifications pursuant to Section 302 of the Sarbanes-Oxley Act of 2002 of Christopher Kings, Chief Executive Officer - Finance and Administration, and Jeffrey White, Chief Financial Officer, Chief Accounting Officer and Treasurer
(b) Certifications pursuant to Section 906 of the Sarbanes-Oxley Act of 2002 of Christopher Kings, Chief Executive Officer - Finance and Administration, and Jeffrey White, Chief Financial Officer, Chief Accounting Officer and Treasurer
SIGNATURES
Pursuant to the requirements of the Securities Exchange Act of 1934 and the Investment Company Act of 1940, the registrant has duly caused this report to be signed on its behalf by the undersigned, thereunto duly authorized.
FRANKLIN CUSTODIAN FUNDS
| By | /s/ CHRISTOPHER KINGS | |
| | Christopher Kings | |
| | Chief Executive Officer - Finance and Administration | |
| | | |
| Date | November 27, 2024 | |
Pursuant to the requirements of the Securities Exchange Act of 1934 and the Investment Company Act of 1940, this report has been signed below by the following persons on behalf of the registrant and in the capacities and on the dates indicated.
| By | /s/ CHRISTOPHER KINGS | |
| | Christopher Kings | |
| | Chief Executive Officer - Finance and Administration | |
| | | |
| Date | November 27, 2024 | |
| By | /s/ JEFFREY WHITE | |
| | Jeffrey White | |
| | Chief Financial Officer, Chief Accounting Officer and Treasurer | |
| | | |
| Date | November 27, 2024 | |