UNITED STATES
SECURITIES AND EXCHANGE COMMISSION
Washington, DC 20549
FORMN-CSRS
CERTIFIED SHAREHOLDER REPORT OF REGISTERED
MANAGEMENT INVESTMENT COMPANIES
Investment Company Act file number811-00537
Franklin Custodian Funds
(Exact name of registrant as specified in charter)
One Franklin Parkway, San Mateo, CA 94403-1906
(Address of principal executive offices) (Zip code)
Craig S. Tyle, One Franklin Parkway, San Mateo, CA 94403-1906
(Name and address of agent for service)
Registrant’s telephone number, including area code: 650312-2000
Date of fiscal year end: 9/30
Date of reporting period: 3/31/19
| Item 1. | Reports to Stockholders. |
| Semiannual Report and Shareholder Letter
| |||
| March 31, 2019 |

Franklin Custodian Funds
|
|
Franklin DynaTech Fund
Franklin Growth Fund
Franklin Income Fund
Franklin U.S. Government Securities Fund
Franklin Utilities Fund

Sign up for electronic delivery at franklintempleton.com/edelivery
Internet Delivery of Fund Reports Unless You Request Paper Copies:Effective January 1, 2021, as permitted by the SEC, paper copies of the Fund’s shareholder reports will no longer be sent by mail, unless you specifically request them from the Fund or your financial intermediary. Instead, the reports will be made available on a website, and you will be notified by mail each time a report is posted and provided with a website link to access the report.
If you already elected to receive shareholder reports electronically, you will not be affected by this change and you need not take any action. If you have not signed up for electronic delivery, we would encourage you to join fellow shareholders who have. You may elect to receive shareholder reports and other communications electronically from the Fund by calling (800)632-2301 or by contacting your financial intermediary.
You may elect to continue to receive paper copies of all your future shareholder reports free of charge by contacting your financial intermediary or, if you invest directly with a Fund, calling (800)632-2301 to let the Fund know of your request. Your election to receive reports in paper will apply to all funds held in your account.
Franklin Templeton
Successful investing begins with ambition. And achievement only comes when you reach for it. That’s why we continually strive to deliver better outcomes for investors. No matter what your goals are, our deep, global investment expertise allows us to offer solutions that can help.
During our more than 70 years of experience, we’ve managed through all kinds of markets—up, down and those in between. We’re always preparing for what may come next. It’s because of this, combined with our strength as one of the world’s largest asset managers that we’ve earned the trust of millions of investors around the world.
Dear Shareholder:
During the six months ended March 31, 2019, the U.S. economy continued to grow, but at a more moderate pace due to concerns about trade, geopolitical stress and a partial government shutdown. The U.S. Federal Reserve (Fed) increased its federal funds rate by 0.25% at its December 2018 meeting, bringing the rate from 2.25% at the start of the period to 2.50% byperiod-end. In March, the Fed kept its key interest rate unchanged and signaled no rate hikes in 2019 based on a more modest economic outlook. The10-year U.S. Treasury yield began the period at 3.05% and decreased to 2.41% atperiod-end.
In this environment, the prices of U.S. stocks, as measured by the Standard & Poor’s 500® Index (S&P 500®), declined 2.73%, (the index declining from 2,913.98 to 2,834.40).1,2 Investment-grade bonds, as measured by the Bloomberg Barclays U.S. Aggregate Bond Index (Bloomberg Index), posted a +4.63% total return (an index increase from 2,013.67 to 2,106.83), which includes reinvestment of income and distributions.3
We are committed to our long-term perspective and disciplined investment approach as we conduct a rigorous, fundamental analysis of securities with a regular emphasis on investment risk management.
We believe active, professional investment management serves investors well. We also recognize the important role of financial advisors in today’s markets and encourage investors to continue to seek their advice. Amid changing markets and economic conditions, we are confident investors with a well-diversified portfolio and a patient, long-term outlook should be well positioned for the years ahead.
Franklin Custodian Funds’ semiannual report, covering Franklin DynaTech Fund, Franklin Growth Fund, Franklin Income Fund, Franklin U.S. Government Securities Fund and Franklin Utilities Fund, includes more detail about prevailing conditions and a discussion about investment decisions during the period. Please remember all securities markets fluctuate, as do mutual fund share prices.
1. Source: Copyright© 2019, S&P Dow Jones Indices LLC. All rights reserved.
2. Source: Morningstar. The changes in index prices shown for the S&P 500 do not include reinvestments of income and distributions, which are included in their total returns, which were: S&P 500-1.72% (index total return resulting in a decline from 5,763.42 to 5,664.46).
3. Sources: Morningstar and Bloomberg Barclays Indices. For the Bloomberg Index, only total return as shown is available, not price change without the inclusion of reinvested income and distributions.
See www.franklintempletondatasources.com for additional data provider information.
| Not FDIC Insured | May Lose Value | No Bank Guarantee
|
| franklintempleton.com | Not part of the semiannual report | 1 | ||
We thank you for investing with Franklin Templeton, welcome your questions and comments, and look forward to serving your future investment needs.
Sincerely,

Rupert H. Johnson, Jr.
Chairman
Franklin Custodian Funds
This letter reflects our analysis and opinions as of March 31, 2019, unless otherwise indicated. The information is not a complete analysis of every aspect of any market, country, industry, security or fund. Statements of fact are from sources considered reliable.
| Semiannual Report |
| |||
| 3 | ||||
| 4 | ||||
| 10 | ||||
| 16 | ||||
| 23 | ||||
| 28 | ||||
| 34 | ||||
| 91 | ||||
| 102 | ||||
| 123 | ||||
Visitfranklintempleton.comfor fund updates, to access your account, or to find helpful financial planning tools.
| 2 | Not part of the semiannual report | franklintempleton.com | ||
Semiannual Report
The U.S. economy grew during thesix-month period. The
economy expanded at a faster rate in 2019’s first quarter after
moderating in the previous two quarters. Growth in consumer
spending, business investment, exports, government spending
and inventory investment was partly offset by a decrease in
housing investment. The manufacturing and services sectors
expanded during the period. The unemployment rate increased
from 3.7% in September 2018 to 3.8% atperiod-end. The
annual inflation rate, as measured by the Consumer Price
Index, decreased from 2.3% in September to 1.9% at
period-end.1
The U.S. Federal Reserve (Fed) raised its target range for the
federal funds rate by 0.25% once during the period, to
2.25%–2.50%, and continued reducing its balance sheet as part
of its plan to normalize monetary policy. At its March 2019
meeting, the Fed held its target range for the federal funds rate
unchanged and signaled no rate hikes in 2019. The Fed also
lowered its forecasts for economic growth in 2019 and 2020.
Furthermore, the Fed mentioned it would end its balance sheet
normalization by the end of September 2019.
U.S. equity markets overall declined during the period amid
concerns about the Fed’s interest-rate path, U.S. political
uncertainties, U.S. trade disputes with China and other trading
partners, and their impact on global growth and corporate
earnings. These concerns were partially alleviated by certain
upbeat economic data, encouraging U.S. corporate earnings, as
well as easing trade tensions and optimism about a potential
U.S.-China trade deal. Markets also benefited from the results
of the Fed’s indications of a patient approach to its monetary
policy decisions. After reaching a newall-time high in
September 2018, the broad U.S. stock market, as measured by
the Standard & Poor’s® 500 Index (S&P 500®), sold off sharply
during 2018’s fourth quarter but rallied in 2019’s first quarter.
Overall, the S&P 500 posted a-1.72% total return for the
six-month period.2
1. Source: U.S. Bureau of Labor Statistics.
2. Source: Morningstar.
See www.franklintempletondatasources.com for additional data provider information.
| franklintempleton.com | Semiannual Report | 3 | ||
This semiannual report for Franklin DynaTech Fund covers the period ended March 31, 2019.
Your Fund’s Goal and Main Investments
The Fund seeks capital appreciation by investing primarily in equity securities of companies that emphasize innovation and new technologies, have superior management and that benefit from new industry conditions in the dynamically changing global economy.
Performance Overview
The Fund’s Class A shares posted a +0.93% cumulative total return for the six months under review. In comparison, the Russell 1000® Growth Index, which measures performance of the largest companies in the Russell 3000® Index with higherprice-to-book ratios and higher forecasted growth values, posted a total return of-2.34%.1 Also for comparison, the broad U.S. stock market as measured by the Standard & Poor’s 500 Index (S&P 500®), posted a-1.72% return.1 You can find the Fund’s long-term performance data in the Performance Summary beginning on page 7.
Performance data represent past performance, which does not guarantee future results. Investment return and principal value will fluctuate, and you may have a gain or loss when you sell your shares. Current performance may differ from figures shown. For most recentmonth-end performance, go tofranklintempleton.comor call(800)342-5236.
Investment Strategy
We use fundamental,bottom-up research to seek companies meeting our criteria of growth potential, quality and valuation. In seeking sustainable growth characteristics, we look for companies we believe can produce sustainable earnings and cash flow growth, evaluating the long-term market opportunity and competitive structure of an industry to target leaders and emerging leaders. We define quality companies as those with strong and improving competitive positions in attractive markets. We also believe important attributes of quality are experienced and talented management teams as well as financial strength reflected in the capital structure, gross and operating margins, free cash flow generation and returns on
Portfolio Composition
Based on Total Net Assets as of 3/31/19
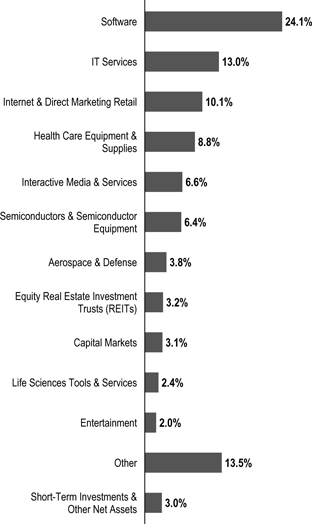
capital employed. Our valuation analysis includes a range of potential outcomes based on an assessment of multiple scenarios. In assessing value, we consider whether security prices fully reflect the balance of the sustainable growth opportunities relative to business and financial risks.
We may invest in companies in any economic sector or of any market capitalization and may invest in companies both inside and outside of the U.S. Although we search for investments across a large number of sectors, we expect to have significant
1. Source: Morningstar.
The indexes are unmanaged and include reinvestment of any income or distributions. They do not reflect any fees, expenses or sales charges. One cannot invest directly in an index, and an index is not representative of the Fund’s portfolio.
Frank Russell Company is the source and owner of the trademarks, service marks and copyrights related to the Russell Indexes. Russell® is a trademark of Frank Russell Company.
The dollar value, number of shares or principal amount, and names of all portfolio holdings are listed in the Fund’s Statement of Investments (SOI).
The SOI begins on page 39.
| 4 | Semiannual Report | franklintempleton.com | ||
FRANKLIN DYNATECH FUND
positions in particular sectors including, for example, technology and health care.
Manager’s Discussion
During the reporting period, the investment sectors that most notably contributed to performance were information technology (IT) and real estate.2 Within IT, programmable logic solutions provider Xilinx delivered strong fiscal third-quarter 2019 earnings that exceeded market expectations. The company reported growth in allend-market segments, and management noted strength inpre-production and early production of 4.5G/5G wireless base stations. The company also benefited from a competitor’s manufacturing struggles, enabling it to continue gaining market share.
ServiceNow, a provider of proprietary cloud-based platforms and applications that help automate enterprise IT operations (such as digital workflow and business processes), benefited results as the company continued to gather momentum. The firm delivered an impressive quarterly earnings report in January 2019, exceeding market expectations helped in part by a lower-than-expected tax rate. A majority of ServiceNow customers are Fortune 500 companies and platform adoption appears strong as the company continued to expand its customer base during the first quarter 2019. Software company MongoDB, which operates as a general-purpose database platform worldwide, generated better-than-expected fiscal third- and fourth-quarter 2019 earnings, driven by strength in its cloud database Atlas“as-a-service” offering and sustained growth in more traditional software subscription model. The company also announced a new licensing model aimed at keeping cloud providers from taking MongoDB’s software and running it as a service without paying the company.
Within the real estate sector, wireless communications operator American Tower was a major contributor to Fund’s results. Wireless communications infrastructure company SBA Communications also contributed.
Other contributors included online commerce company MercadoLibre and precision oncology company Guardant Health.
In contrast, the communication services, consumer discretionary and health care sectors detracted from the Fund’s performance.3 Within communication services, Activision Blizzard’s shares, which reached anall-time high in October, declined after disappointment that the company did not announce Diabolo 4’s launch at its annual gaming convention and due to the negative response to its Diabolo mobile expansion. However, the company has a good portfolio of wholly owned intellectual properties, plans to release promising new products in 2019 and could benefit from the shift to digital entertainment, extension to mobile and expanding player base (no longer held atperiod-end).
Top 10 Holdings
3/31/19
Company Sector/Industry | % of Total Net Assets | |
Amazon.com Inc. Internet & Direct Marketing Retail |
6.3% | |
Alphabet Inc. Interactive Media & Services |
4.1% | |
Microsoft Corp. Software |
3.9% | |
Mastercard Inc. IT Services |
3.1% | |
Visa Inc. IT Services |
2.5% | |
ServiceNow Inc. Software |
2.2% | |
Salesforce.com Inc. Software |
2.1% | |
Adobe Inc. Software |
1.8% | |
Xilinx Inc. Semiconductors & Semiconductor Equipment |
1.7% | |
Workday Inc. Software |
1.5% |
The consumer discretionary sector also detracted from the Fund’s performance. Online marketplace Amazon.com delivered a mixed third quarter with growing revenue that exceeded company guidance but was lower than investors expected, due to slower international retail revenue growth and weak results from acquired businesses. Amazon’s fourth quarter revenue and earnings exceeded all expectations, but guidance indicating slower first-quarter revenue growth
2. The information technology sector comprises IT services, semiconductors and semiconductor equipment and software in the SOI. The real estate sector comprises equity real estate investment trusts (REITS) in the SOI.
3. The communication services sector comprises entertainment, interactive media and services and media in the SOI. The consumer discretionary sector comprises automobiles; diversified consumer services; internet and direct marketing retail; and textiles, apparel and luxury goods in the SOI. The health care sector comprises biotechnology, health care equipment and supplies, health care providers and services, health care technology, life sciences tools and services, and pharmaceuticals in the SOI. See www.franklintempletondatasources.com for additional data provider information.
| franklintempleton.com | Semiannual Report | 5 | ||
FRANKLIN DYNATECH FUND
hindered the stock. Online and mobile platform company Grubhub also detracted (no longer held atperiod-end).
Within the health care sector, research, development and medical device company ABIOMED also detracted from Fund results.
Individual holdings that detracted from the Fund’s performance included semiconductor company NVIDIA after it lowered its fiscal fourth-quarter 2019 revenue guideline due to a decline in gaming revenues, the launch delay of the Turing next-generation graphic cards and a decline in the company’s datacenter segment due to hyperscale capital expenditure deceleration. Software and equipment company Apple and payment andpoint-of-sale solutions provider Square also detracted.
Thank you for your continued participation in Franklin Dynatech Fund. We look forward to serving your future investment needs.
 |
Matthew J. Moberg, CPA |

 |
Rupert H. Johnson, Jr. | |
| Portfolio Management Team | ||

The foregoing information reflects our analysis, opinions and portfolio holdings as of March 31, 2019, the end of the reporting period. The way we implement our main investment strategies and the resulting portfolio holdings may change depending on factors such as market and economic conditions. These opinions may not be relied upon as investment advice or an offer for a particular security. The information is not a complete analysis of every aspect of any market, country, industry, security or the Fund. Statements of fact are from sources considered reliable, but the investment manager makes no representation or warranty as to their completeness or accuracy. Although historical performance is no guarantee of future results, these insights may help you understand our investment management philosophy.
| 6 | Semiannual Report | franklintempleton.com | ||
FRANKLIN DYNATECH FUND
Performance Summary as of March 31, 2019
The performance table does not reflect any taxes that a shareholder would pay on Fund dividends, capital gain distributions, if any, or any realized gains on the sale of Fund shares. Total return reflects reinvestment of the Fund’s dividends and capital gain distributions, if any, and any unrealized gains or losses. Your dividend income will vary depending on dividends or interest paid by securities in the Fund’s portfolio, adjusted for operating expenses of each class. Capital gain distributions are net profits realized from the sale of portfolio securities.
Performance as of 3/31/191
Cumulative total return excludes sales charges. Average annual total return includes maximum sales charges. Sales charges will vary depending on the size of the investment and the class of share purchased. The maximum is 5.50% and the minimum is 0%.Class A:5.50% maximum initial sales charge;Advisor Class:no sales charges. For other share classes, visitfranklintempleton.com.
| Share Class | Cumulative Total Return2 |
| Average Annual Total Return3 | |||
A4 | ||||||
6-Month | +0.93% | -4.61% | ||||
1-Year | +17.18% | +10.73% | ||||
5-Year | +108.03% | +14.48% | ||||
10-Year | +464.32% | +18.22% | ||||
Advisor | ||||||
6-Month | +1.06% | +1.06% | ||||
1-Year | +17.47% | +17.47% | ||||
5-Year | +110.65% | +16.07% | ||||
10-Year | +478.59% | +19.19% | ||||
Performance data represent past performance, which does not guarantee future results. Investment return and principal value will fluctuate, and you may have a gain or loss when you sell your shares. Current performance may differ from figures shown. For most recentmonth-end performance, go tofranklintempleton.comor call(800)342-5236.
See page 8 for Performance Summary footnotes.
| franklintempleton.com | Semiannual Report | 7 | ||
FRANKLIN DYNATECH FUND
PERFORMANCE SUMMARY
Distributions(10/1/18–3/31/19)
| Share Class | Long-Term Capital Gain | |||
A | $1.9118 | |||
C | $1.9118 | |||
R | $1.9118 | |||
R6 | $1.9118 | |||
Advisor | $1.9118 | |||
Total Annual Operating Expenses5
| Share Class | With Fee Waiver | Without Fee Waiver | ||||||||||
A | 0.87% | 0.87% | ||||||||||
Advisor | 0.62% | 0.62% | ||||||||||
Each class of shares is available to certain eligible investors and has different annual fees and expenses, as described in the prospectus.
All investments involve risks, including possible loss of principal. Stocks historically have outperformed other asset classes over the long term, but tend to fluctuate more dramatically over the short term. Investments in fast-growing industries, like the technology and health care sectors (which have historically been volatile) could result in increased price fluctuation, especially over the short term, due to the rapid pace of product change and development and changes in government regulation of companies emphasizing scientific or technological advancement or regulatory approval for new drugs and medical instruments. The Fund may also invest in small- andmid-capitalization companies, which can be particularly sensitive to changing economic conditions, and their prospects for growth are less certain than those of larger, more established companies. The Fund is actively managed but there is no guarantee that the manager’s investment decisions will produce the desired results. The Fund’s prospectus also includes a description of the main investment risks.
1. The Fund has a fee waiver associated with any investment it makes in a Franklin Templeton money fund and/or other Franklin Templeton fund, contractually guaranteed through 1/31/20. Fund investment results reflect the fee waiver; without this waiver, the results would have been lower.
2. Cumulative total return represents the change in value of an investment over the periods indicated.
3. Average annual total return represents the average annual change in value of an investment over the periods indicated. Return for less than one year, if any, has not been annualized.
4. Prior to 9/10/18, these shares were offered at a higher initial sales charge of 5.75%, thus actual returns would have differed. Total returns with sales charges have been restated to reflect the current maximum initial sales charge of 5.50%.
5. Figures are as stated in the Fund’s current prospectus and may differ from the expense ratios disclosed in the Your Fund’s Expenses and Financial Highlights sections in this report. In periods of market volatility, assets may decline significantly, causing total annual Fund operating expenses to become higher than the figures shown.
| 8 | Semiannual Report | franklintempleton.com | ||
FRANKLIN DYNATECH FUND
Your Fund’s Expenses
As a Fund shareholder, you can incur two types of costs: (1) transaction costs, including sales charges (loads) on Fund purchases and redemptions; and (2) ongoing Fund costs, including management fees, distribution and service(12b-1) fees, and other Fund expenses. All mutual funds have ongoing costs, sometimes referred to as operating expenses. The table below shows ongoing costs of investing in the Fund and can help you understand these costs and compare them with those of other mutual funds. The table assumes a $1,000 investment held for the six months indicated.
Actual Fund Expenses
The table below provides information about actual account values and actual expenses in the columns under the heading “Actual.” In these columns the Fund’s actual return, which includes the effect of Fund expenses, is used to calculate the “Ending Account Value” for each class of shares. You can estimate the expenses you paid during the period by following these steps (of course, youraccount value and expenses will differ from those in this illustration): Divide your account value by $1,000 (if your account had an$8,600 value, then $8,600÷ $1,000 = 8.6). Then multiply the result by the number in the row for your class of shares under the headings “Actual” and “Expenses Paid During Period” (if Actual Expenses Paid During Period were $7.50, then 8.6 x $7.50 =$64.50). In this illustration, the actual expenses paid this period are $64.50.
Hypothetical Example for Comparison with Other Funds
Under the heading “Hypothetical” in the table, information is provided about hypothetical account values and hypothetical expenses based on the Fund’s actual expense ratio and an assumed rate of return of 5% per year before expenses, which is not the Fund’s actual return. This information may not be used to estimate the actual ending account balance or expenses you paid for the period, but it can help you compare ongoing costs of investing in the Fund with those of other funds. To do so, compare this 5% hypothetical example for the class of shares you hold with the 5% hypothetical examples that appear in the shareholder reports of other funds.
Please note that expenses shown in the table are meant to highlight ongoing costs and do not reflect any transactional costs. Therefore, information under the heading “Hypothetical” is useful in comparing ongoing costs only, and will not help you compare total costs of owning different funds. In addition, if transactional costs were included, your total costs would have been higher.
Actual (actual return after expenses) | Hypothetical (5% annual return before expenses) | |||||||||||||||||||||||||||||||||||||||
| Share Class | Beginning Account Value 10/1/18 | Ending Account Value 3/31/19 | Expenses Paid During 10/1/18–3/31/191,2 | Ending Account Value 3/31/19 | Expenses Paid During Period | Net Annualized Expense Ratio2 | ||||||||||||||||||||||||||||||||||
A | $ | 1,000 | $ | 1,009.30 | $ | 4.16 | $ | 1,020.79 | $ | 4.18 | 0.83% | |||||||||||||||||||||||||||||
C | $ | 1,000 | $ | 1,005.30 | $ | 7.90 | $ | 1,017.05 | $ | 7.95 | 1.58% | |||||||||||||||||||||||||||||
R | $ | 1,000 | $ | 1,008.10 | $ | 5.41 | $ | 1,019.55 | $ | 5.44 | 1.08% | |||||||||||||||||||||||||||||
R6 | $ | 1,000 | $ | 1,011.20 | $ | 2.46 | $ | 1,022.49 | $ | 2.47 | 0.49% | |||||||||||||||||||||||||||||
Advisor | $ | 1,000 | $ | 1,010.60 | $ | 2.91 | $ | 1,022.04 | $ | 2.92 | 0.58% | |||||||||||||||||||||||||||||
1. Expenses are equal to the annualized expense ratio for thesix-month period as indicated above—in the far right column—multiplied by the simple average account value over the period indicated, and then multiplied by 182/365 to reflect theone-half year period.
2. Reflects expenses after fee waivers and expense reimbursements. Does not include acquired fund fees and expenses.
| franklintempleton.com | Semiannual Report | 9 | ||
This semiannual report for Franklin Growth Fund covers the period ended March 31, 2019.
Your Fund’s Goal and Main Investments
The Fund seeks capital appreciation by investing substantially in equity securities of companies that are leaders in their industries.
Performance Overview
The Fund’s Class A shares posted a-2.23% cumulative total return for the six months under review. In comparison, the Standard & Poor’s 500 Index (S&P 500), which is a broad measure of U.S. stock performance, posted a-1.72% total return.1 You can find the Fund’s long-term performance data in the Performance Summary beginning on page 13.
Performance data represent past performance, which does not guarantee future results. Investment return will fluctuate. Current performance may differ from figures shown. For most recentmonth-end performance, go tofranklintempleton.comor call(800)342-5236.
Investment Strategy
We use fundamental,bottom-up research to seek companies meeting our criteria of growth potential, quality and valuation. In seeking sustainable growth characteristics, we look for companies we believe can produce sustainable earnings and cash flow growth, evaluating the long-term market opportunity and competitive structure of an industry to target leaders and emerging leaders. We define quality companies as those with strong and improving competitive positions in attractive markets. We also believe important attributes of quality are experienced and talented management teams as well as financial strength reflected in the capital structure, gross and operating margins, free cash flow generation and returns on capital employed. Our valuation analysis includes a range of potential outcomes based on an assessment of multiple scenarios. In assessing value, we consider whether security prices fully reflect the balance of the sustainable growth opportunities relative to business and financial risks.
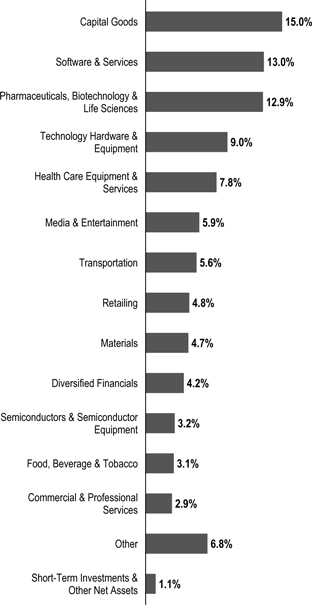
Portfolio Composition
Based on Total Net Assets as of 3/31/19
Manager’s Discussion
Franklin Growth Fund owned shares of 131 companies atperiod-end. We continue to invest in a broad array of companies of all sizes and in varied industries.
During the period under review, the real estate, utilities and information technology (IT) sectors notably contributed to
1. Source: Morningstar.
The index is unmanaged and includes reinvestment of any income or distributions. It does not reflect any fees, expenses or sales charges. One cannot invest directly in an index, and an index is not representative of the Fund’s portfolio.
The dollar value, number of shares or principal amount, and names of all portfolio holdings are listed in the Fund’s Statement of Investments (SOI).
The SOI begins on page 49.
| 10 | Semiannual Report | franklintempleton.com | ||
FRANKLIN GROWTH FUND
Top 10 Holdings
3/31/19
| Company Sector/Industry | % of Total Net Assets | |
Apple Inc. Technology Hardware & Equipment | 4.9% | |
Amazon.com Inc. Retailing | 3.9% | |
The Boeing Co. Capital Goods | 2.7% | |
Microsoft Corp. Software & Services | 2.5% | |
Alphabet Inc. Media & Entertainment | 2.4% | |
Union Pacific Corp. Transportation | 2.1% | |
Mastercard Inc. Software & Services | 2.1% | |
Mettler-Toledo International Inc. Pharmaceuticals, Biotechnology & Life Sciences | 1.9% | |
Northrop Grumman Corp. Capital Goods | 1.9% | |
Intuit Inc. Software & Services | 1.7% | |
performance.2 In real estate, American Tower benefited from better-than-expected growth from its U.S. business, with organic tenant billings growth continuing to accelerate in the fourth quarter of 2018. The U.S. tower business has continued to benefit from industry-wide tailwinds, such as the substantial investment by national wireless operators in their networks to support significant annual growth rates in domestic mobile data usage. The demand profile is also supported by the early stages of deployment of spectrum assets for 5G technology. Outside the U.S., American Tower has also seen an acceleration in its growth trajectory, notably in Brazil, Mexico and South Africa.
Within the utilities sector, electric power and energy infrastructure company NextEra boosted Fund results. In the IT sector, ServiceNow, a provider of proprietary cloud-based platforms and applications that help automate enterprise IT operations (such as digital workflow and business processes), continued to gather momentum. The firm delivered an impressive quarterly earnings report in January 2019, exceeding market expectations helped in part by a
lower-than-expected tax rate. A majority of ServiceNow customers are Fortune 500 companies and platform adoption appears strong as the company continued to expand its customer base during the first quarter of 2019. Other contributors in the sector included business and financial software company Intuit.
Individual contributors included Mettler-Toledo International, a manufacturer of precision instruments and services for use in laboratories, which reported a solid fourth-quarter 2018 earnings results, as productivity and profit margins overcame the negative effects of tariffs and unfavorable currency exchange rates. Mettler has been a dominant industry player due to its product breadth, service offerings and competitive leadership. With improvements to operations through a new enterprise resource planning program and a continuous improvement program, we believe it is better positioned to potentially improve market share, profit margin, and revenue and operating income growth. Analytical, manufacturing and laboratory company Waters also contributed to Fund results.
In contrast, the consumer discretionary, industrials and health care sectors detracted from Fund performance.3 Within consumer discretionary, online marketplace Amazon.com delivered a mixed third quarter with growing revenue that exceeded company guidance but was lower than investors expected, due to slower international retail revenue growth and weak results from acquired businesses. Amazon’s fourth-quarter revenue and earnings exceeded all expectations, but guidance indicating slower first-quarter revenue growth hindered the stock.
In industrials, global security company Northrup Grumman also detracted due to investor concerns about geopolitical tensions and possible U.S. defense spending cuts. In addition, Textron, an aircraft manufacturer and aviation systems and products company, also detracted from Fund results (no longer held atperiod-end).
Within the health care sector, biotechnology company Biogen hindered performance.
Other detractors included software and equipment company Apple, which reported first-quarter 2019 revenue that was in line with market expectations but lower than the prior-year
2. The real estate sector comprises real estate in the SOI. The utilities sector comprises utilities in the SOI. The IT sector comprises software and services, semiconductors and semiconductor equipment, and technology hardware and equipment in the SOI.
3. The consumer discretionary sector comprises automobile and components, consumer durables and apparel, media and entertainment, and retailing in the SOI. The industrials sector comprises capital goods, commercial and professional services, and transportation in the SOI. The health care sector comprises health care equipment and services and pharmaceuticals, biotechnology and life sciences in the SOI.
See www.franklintempletondatasources.com for additional data provider information.
| franklintempleton.com | Semiannual Report | 11 | ||
FRANKLIN GROWTH FUND
period as a result of lower iPhone sales. The company continued to expand its services offerings, notably with the announcement of the Apple TV+ launch in the fall of 2019. Another detractor was DXC Technology, an IT services and solutions provider.
Thank you for your continued participation in Franklin Growth Fund. We look forward to serving your future investment needs.
 |
| |
| Serena Perin Vinton, CFA | ||
| John Anderson | ||
| Robert Rendler, CFA | ||
| Portfolio Management Team | ||

The foregoing information reflects our analysis, opinions and portfolio holdings as of March 31, 2019, the end of the reporting period. The way we implement our main investment strategies and the resulting portfolio holdings may change depending on factors such as market and economic conditions. These opinions may not be relied upon as investment advice or an offer for a particular security. The information is not a complete analysis of every aspect of any market, country, industry, security or the Fund. Statements of fact are from sources considered reliable, but the investment manager makes no representation or warranty as to their completeness or accuracy. Although historical performance is no guarantee of future results, these insights may help you understand our investment management philosophy.
CFA® is a trademark owned by CFA Institute.
| 12 | Semiannual Report | franklintempleton.com | ||
FRANKLIN GROWTH FUND
Performance Summary as of March 31, 2019
The performance table does not reflect any taxes that a shareholder would pay on Fund dividends, capital gain distributions, if any, or any realized gains on the sale of Fund shares. Total return reflects reinvestment of the Fund’s dividends and capital gain distributions, if any, and any unrealized gains or losses. Your dividend income will vary depending on dividends or interest paid by securities in the Fund’s portfolio, adjusted for operating expenses of each class. Capital gain distributions are net profits realized from the sale of portfolio securities.
Performance as of 3/31/191
Cumulative total return excludes sales charges. Average annual total return includes maximum sales charges. Sales charges will vary depending on the size of the investment and the class of share purchased. The maximum is 5.50% and the minimum is 0%.Class A:5.50% maximum initial sales charge;Advisor Class:no sales charges. For other share classes, visitfranklintempleton.com.
| Share Class | Cumulative Total Return2 | Average Annual Total Return3 | ||
A4 | ||||
6-Month | -2.23% | -7.60% | ||
1-Year | +9.24% | �� | +3.24% | |
5-Year | +75.17% | +10.61% | ||
10-Year | +348.27% | +15.53% | ||
Advisor | ||||
6-Month | -2.11% | -2.11% | ||
1-Year | +9.52% | +9.52% | ||
5-Year | +77.36% | +12.14% | ||
10-Year | +359.58% | +16.48% | ||
Performance data represent past performance, which does not guarantee future results. Investment return and principal value will fluctuate, and you may have a gain or loss when you sell your shares. Current performance may differ from figures shown. For most recentmonth-end performance, go tofranklintempleton.comor call(800)342-5236.
See page 14 for Performance Summary footnotes.
| franklintempleton.com | Semiannual Report | 13 | ||
FRANKLIN GROWTH FUND
PERFORMANCE SUMMARY
Distributions(10/1/18–3/31/19)
Share Class
| Net Investment
| Long-Term
| Total
| |||||||||
A | $0.4377 | $1.0435 | $1.4812 | |||||||||
C | $ — | $1.0435 | $1.0435 | |||||||||
R | $0.1413 | $1.0435 | $1.1848 | |||||||||
R6 | $0.7873 | $1.0435 | $1.8308 | |||||||||
Advisor | $0.6908 | $1.0435 | $1.7343 | |||||||||
Total Annual Operating Expenses5
Share Class
| With Fee
| Without Fee
| ||||||
A | 0.84% | 0.84% | ||||||
Advisor | 0.59% | 0.59% | ||||||
Each class of shares is available to certain eligible investors and has different annual fees and expenses, as described in the prospectus.
All investments involve risks, including possible loss of principal. Historically, the Fund has focused on larger companies. The Fund may also invest in small, relatively new and/or unseasoned companies, which involves additional risks, as the price of these securities can be volatile, particularly over the short term. The Fund may focus on particular sectors of the market from time to time, which can carry greater risks of adverse developments in such sectors. In addition,the Fund may invest up to 40% of its net assets in stocks of foreign companies, which involve special risks, including currency fluctuations and economic as well as political uncertainty. The Fund is actively managed but there is no guarantee that the manager’s investment decisions will produce the desired results. The Fund’s prospectus also includes a description of the main investment risks.
1. The Fund has a fee waiver associated with any investment it makes in a Franklin Templeton money fund and/or other Franklin Templeton fund, contractually guaranteed through 1/31/20. Fund investment results reflect the fee waiver; without this waiver, the results would have been lower.
2. Cumulative total return represents the change in value of an investment over the periods indicated.
3. Average annual total return represents the average annual change in value of an investment over the periods indicated. Return for less than one year, if any, has not been annualized.
4. Prior to 9/10/18, these shares were offered at a higher initial sales charge of 5.75%, thus actual returns would have differed. Total returns with sales charges have been restated to reflect the current maximum initial sales charge of 5.50%.
5. Figures are as stated in the Fund’s current prospectus and may differ from the expense ratios disclosed in the Your Fund’s Expenses and Financial Highlights sections in this report. In periods of market volatility, assets may decline significantly, causing total annual Fund operating expenses to become higher than the figures shown.
| 14 | Semiannual Report | franklintempleton.com | ||
FRANKLIN GROWTH FUND
Your Fund’s Expenses
As a Fund shareholder, you can incur two types of costs: (1) transaction costs, including sales charges (loads) on Fund purchases and redemptions; and (2) ongoing Fund costs, including management fees, distribution and service(12b-1) fees, and other Fund expenses. All mutual funds have ongoing costs, sometimes referred to as operating expenses. The table below shows ongoing costs of investing in the Fund and can help you understand these costs and compare them with those of other mutual funds. The table assumes a $1,000 investment held for the six months indicated.
Actual Fund Expenses
The table below provides information about actual account values and actual expenses in the columns under the heading “Actual.” In these columns the Fund’s actual return, which includes the effect of Fund expenses, is used to calculate the “Ending Account Value” for each class of shares. You can estimate the expenses you paid during the period by following these steps (of course, your account value and expenses will differ from those in this illustration): Divide your account value by $1,000 (if your account had an $8,600 value, then $8,600÷ $1,000 = 8.6). Then multiply the result by the number in the row for your class of shares under the headings “Actual” and “Expenses Paid During Period” (if Actual Expenses Paid During Period were $7.50, then 8.6 x $7.50 =$64.50). In this illustration, the actual expenses paid this period are $64.50.
Hypothetical Example for Comparison with Other Funds
Under the heading “Hypothetical” in the table, information is provided about hypothetical account values and hypothetical expenses based on the Fund’s actual expense ratio and an assumed rate of return of 5% per year before expenses, which is not the Fund’s actual return. This information may not be used to estimate the actual ending account balance or expenses you paid for the period, but it can help you compare ongoing costs of investing in the Fund with those of other funds. To do so, compare this 5% hypothetical example for the class of shares you hold with the 5% hypothetical examples that appear in the shareholder reports of other funds.
Please note that expenses shown in the table are meant to highlight ongoing costs and do not reflect any transactional costs. Therefore, information under the heading “Hypothetical” is useful in comparing ongoing costs only, and will not help you compare total costs of owning different funds. In addition, if transactional costs were included, your total costs would have been higher.
| Actual (actual return after expenses) | Hypothetical (5% annual return before expenses) | |||||||||||||||||
| Share Class | Beginning Account Value 10/1/18 | Ending Account Value 3/31/19 | Expenses Paid During Period 10/1/18–3/31/191,2 | Ending Account Value 3/31/19 | Expenses Paid During Period 10/1/18–3/31/191,2 | Net Annualized Expense Ratio2 | ||||||||||||
| A | $1,000 | $977.70 | $4.04 | $1,020.84 | $4.13 | 0.82% | ||||||||||||
| C | $1,000 | $974.20 | $7.73 | $1,017.10 | $7.90 | 1.57% | ||||||||||||
| R | $1,000 | $976.60 | $5.27 | $1,019.60 | $5.39 | 1.07% | ||||||||||||
| R6 | $1,000 | $979.40 | $2.37 | $1,022.54 | $2.42 | 0.48% | ||||||||||||
| Advisor | $1,000 | $978.90 | $2.81 | $1,022.09 | $2.87 | 0.57% | ||||||||||||
1. Expenses are equal to the annualized expense ratio for thesix-month period as indicated above—in the far right column—multiplied by the simple average account value over the period indicated, and then multiplied by 182/365 to reflect theone-half year period.
2. Reflects expenses after fee waivers and expense reimbursements. Does not include acquired fund fees and expenses.
| franklintempleton.com | Semiannual Report | 15 | ||
This semiannual report for Franklin Income Fund covers the period ended March 31, 2019.
Your Fund’s Goal and Main Investments
The Fund seeks to maximize income, while maintaining prospects for capital appreciation by investing, under normal market conditions, in a diversified portfolio of debt and equity securities.
Performance Overview
The Fund’s Class A shares posted a cumulative total return of +2.20% for the six months under review. In comparison, the Fund’s equity benchmark, the Standard & Poor’s 500 Index (S&P 500), which is a broad measure of U.S. stock performance, posted a-1.72% total return.1 The Fund’s new secondary benchmark, the blended 50% MSCI USD High Dividend Yield Index + 25% Bloomberg Barclays High Yield Very Liquid Index + 25% Bloomberg Barclays U.S. Aggregate Index (Blended Benchmark Index), which is a combination of leading stock and bond indexes that better reflect the asset allocation of the Fund’s portfolio, posted a +2.79% total return.1 The Fund’s prior fixed income benchmark, the Bloomberg Barclays U.S. Aggregate Bond Index, which tracks the U.S. investment-grade, taxable bond market, posted a +4.63% total return.1 The Fund’s peers, as measured by the Lipper Mixed-Asset Target Allocation Moderate Funds Classification Average, which consists of funds chosen by Lipper that, by practice, maintain a mix of 40% to 60% equity securities, with the remainder in bonds and cash, posted a-0.03% total return.2 You can find the Fund’s long-term performance data in the Performance Summary beginning on page 19.
Performance data represent past performance, which does not guarantee future results. Investment return will fluctuate. Current performance may differ from figures shown. For most recentmonth-end performance, go tofranklintempleton.comor call (800) 342-5236.
Dividend Distributions*
10/1/18–3/31/19
| Dividend per Share (cents) |
| ||||||||||||||||||||||
Month | | Class A | | | Class A1 | | | Class C | | | Class R | | | Class R6 | | | Advisor Class | | ||||||
October | 0.98 | 1.00 | 0.90 | 0.93 | 1.03 | 1.02 | ||||||||||||||||||
November | 0.98 | 1.00 | 0.90 | 0.93 | 1.03 | 1.02 | ||||||||||||||||||
December | 0.98 | 1.00 | 0.90 | 0.93 | 1.03 | 1.02 | ||||||||||||||||||
January | 0.98 | 1.00 | 0.90 | 0.93 | 1.03 | 1.02 | ||||||||||||||||||
February | 0.98 | 1.00 | 0.90 | 0.93 | 1.03 | 1.02 | ||||||||||||||||||
March | 0.98 | 1.00 | 0.90 | 0.93 | 1.03 | 1.02 | ||||||||||||||||||
Total | 5.88 | 6.00 | 5.40 | 5.58 | 6.18 | 6.12 | ||||||||||||||||||
*The distribution amount is the sum of all estimatedtax-basis net investment income distributions for the period shown. A portion or all of the distribution may be reclassified as return of capital or short-term or long-term capital gains once final tax designations are known. All Fund distributions will vary depending upon current market conditions, and past distributions are not indicative of future trends.
Investment Strategy
Through our independent analysis of debt, convertible and equity securities, we search for undervalued orout-of-favor securities we believe offer opportunities for income today and significant growth tomorrow. We consider such factors as a company’s experience and managerial strength; cash flow potential and profitability; competitive positioning and advantages; responsiveness to changes in interest rates and business conditions; debt maturity schedules and borrowing requirements; changing financial condition and market recognition of the change; and a security’s relative value based on such factors as anticipated cash flow, interest or dividend coverage, asset coverage and earnings.
Manager’s Discussion
During the period under review, our equity weighting decreased from 50.0% to 46.4%, and our fixed income weighting increased from 47.9% to 49.8%. The Fund’s cash position increased from 2.1% to 3.8% of total net assets.
The Fund continued to incrementally reduce portfolio risk, while taking advantage of idiosyncratic opportunities where the markets appeared to have overreacted to the downside. Higher long-term rates afforded us the ability to improve the credit quality within fixed income through a higher weighting in both
1. Source: Morningstar.
2. Source: Lipper, a Thomson Reuters Company. For the six month period ended 3/31/19, this category consisted of 598 funds. Lipper calculations do not include sales charges or expense subsidization by a fund’s manager. The Fund’s performance relative to the average may have differed if these and other factors had been considered.
The indexes are unmanaged and include reinvestment of any income or distributions. They do not reflect any fees, expenses or sales charges. One cannot invest directly in an index, and an index is not representative of the Fund’s portfolio.
See www.franklintempletondatasources.com for additional data provider information.
The dollar value, number of shares or principal amount, and names of all portfolio holdings are listed in the Fund’s Statement of Investments (SOI).
The SOI begins on page 59.
| 16 | Semiannual Report | franklintempleton.com | ||
FRANKLIN INCOME FUND
U.S. government bonds and investment-grade debt, while not giving up much with regard to yield.
Within equities, our holdings in the utilities sector were the strongest driver of returns, while holdings in information technology and communication services also helped. Utilities benefited from a pickup in earnings growth and a decline in benchmark Treasury yields, given their perceived defensive nature by investors. Within the utilities sector, the top contributor to performance was The Southern Company, a holding company with segments in electricity, power and gas, as uncertainties around delays in construction of its Vogtle nuclear power plant subsided, while core operations in several business units performed well. Our utility holdings in Dominion and Sempra also performed well.
Shares of semiconductor manufacturer, Intel performed well amid a broader rally in semiconductors as its capital allocation continued to favor shareholders through share repurchases and an increase in its dividend, while also maintaining financial flexibility during the appointment of a new chief executive officer. Other major contributors included mining company Rio Tinto and pharmaceutical company Merck. Rio Tinto benefited from sharply rising iron ore prices, assets sales, and a strong balance sheet, while also distributing a couple meaningful dividends to its shareholder base at the end of the period. Merck performed well due to continued solid operating results over the last several quarters, benefiting from its leading drug, Keytruda, which continued to gain more approvals for various stages of therapy. The company also continued to execute well on their key categories of oncology and vaccines.
Within equities, the energy, materials, and financials sectors detracted from performance. Large conglomerates BASF and DowDuPont within the materials sector underperformed during the period as spread compression in their commodity chemical segments and continued weak China auto production affected the broader industry. Our holdings within the financials sector, particularly large banks, were negatively impacted by investors’ view that their profit margins could be affected by higher deposit costs and mortgage rates for the consumer. Wells Fargo was hurt by its declining loan portfolio amid legal and regulatory scrutiny.
During the period, the Fund’s fixed income positioning displayed our continued preference for theshort-end of the yield curve, while our overall weighting increased due to our view that the fundamental backdrop for corporate credit remained supportive. Performance was relatively good across fixed income sectors, with energy the only detractor. Our
Portfolio Composition
3/31/19
| | % of Total Net Assets | | ||
Equity* |
|
46.4% |
| |
Financials | 7.7% | |||
Information Technology | 7.0% | |||
Utilities | 6.1% | |||
Energy | 6.0% | |||
Consumer Discretionary | 4.4% | |||
Health Care | 4.2% | |||
Materials | 3.7% | |||
Communication Services | 2.9% | |||
Consumer Staples | 2.1% | |||
Industrials | 1.8% | |||
Real Estate | 0.5% | |||
Fixed Income** | 49.8% | |||
Financials | 14.3% | |||
Health Care | 13.2% | |||
Energy | 7.4% | |||
Communication Services | 6.0% | |||
Consumer Discretionary | 2.9% | |||
Utilities | 1.6% | |||
Materials | 1.4% | |||
Industrials | 1.0% | |||
Consumer Staples | 1.0% | |||
Information Technology | 0.5% | |||
Real Estate | 0.5% | |||
Short-Term Investments & Other Net Assets | 3.8% |
*Includes convertible bonds.
**Includes senior floating rate interests and index-linked notes.
holdings in the health care sector led returns, while holdings in communication services and utilities also helped.
Health care led returns helped by some of our larger positions in hospitals and pharmaceuticals. Our exposure to shorter-duration U.S. Treasuries meaningfully outperformed as U.S. rates across the curve declined significantly, fueled first by risk aversion and followed by a shift in monetary policy during the period, as the10-year yield declined. Our exposure to higher quality investment-grade debt also performed well due to the strong performance of U.S. government debt, helping to mitigate some of the volatility within corporate credit in the first half of the period.
Our exposure to Community Health Systems performed well as its near-term unsecured debt maturing in 2022 rallied during the period, amidst a number of successful corporate initiatives
franklintempleton.com |
Semiannual Report |
17 |
FRANKLIN INCOME FUND
Top Five Equity Holdings*
3/31/19
Company Sector/Industry | | % of Total Net Assets | | |
Wells Fargo & Co. Financials |
|
1.9% |
| |
The Southern Co. Utilities |
|
1.7% |
| |
Dominion Energy Inc. Utilities |
|
1.5% |
| |
Sempra Energy Utilities |
|
1.5% |
| |
Bank of America Corp. Financials |
|
1.2% |
|
*Includes convertible bonds.
such as the sale ofnon-core assets and accessing the capital markets to refinance secured debt. Large holdings such as Bausch and Tenet also performed well from solid operating results and earnings guidance.
In fixed income, our holdings within energy underperformed as U.S. crude oil spot prices meaningfully declined during the first half of the period (although oil prices began to recover much of their declines within the second half). However, our exposure in Chesapeake Energy helped to offset some of the declines as our bonds benefited from solid operating results, a successful debt exchange, and upgrades from the rating agencies.
Thank you for your continued participation in Franklin Income Fund. We look forward to serving your future investment needs.
 |
Edward Perks, CFA Lead Portfolio Manager | |
Matthew Quinlan Richard S. Hsu, CFA Todd Brighton, CFA Brendan Circle, CFA | ||
| Portfolio Management Team | ||

Top Five Fixed Income Holdings*
3/31/19
Company Sector/Industry | | % of Total Net Assets | | |
U.S. Treasury Note Financials |
|
8.5% |
| |
CHS/Community Health Systems Inc. Health Care |
|
4.3% |
| |
Tenet Healthcare Corp. Health Care |
|
3.0% |
| |
Chesapeake Energy Corp. Energy |
|
2.8% |
| |
Weatherford International Ltd. Energy |
|
1.6% |
|
*Includes senior floating rate interests and index-linked notes.
The foregoing information reflects our analysis, opinions and portfolio holdings as of March 31, 2019, the end of the reporting period. The way we implement our main investment strategies and the resulting portfolio holdings may change depending on factors such as market and economic conditions. These opinions may not be relied upon as investment advice or an offer for a particular security. The information is not a complete analysis of every aspect of any market, country, industry, security or the Fund. Statements of fact are from sources considered reliable, but the investment manager makes no representation or warranty as to their completeness or accuracy. Although historical performance is no guarantee of future results, these insights may help you understand our investment management philosophy.
| 18 | Semiannual Report | franklintempleton.com | ||
FRANKLIN INCOME FUND
Performance Summary as of March 31, 2019
The performance tables do not reflect any taxes that a shareholder would pay on Fund dividends, capital gain distributions, if any, or any realized gains on the sale of Fund shares. Total return reflects reinvestment of the Fund’s dividends and capital gain distributions, if any, and any unrealized gains or losses. Your dividend income will vary depending on dividends or interest paid by securities in the Fund’s portfolio, adjusted for operating expenses of each class. Capital gain distributions are net profits realized from the sale of portfolio securities.
Performance as of 3/31/191
Cumulative total return excludes sales charges. Average annual total return includes maximum sales charges. Sales charges will vary depending on the size of the investment and the class of share purchased. The maximum is 3.75% and the minimum is 0%.Class A:3.75% maximum initial sales charge;Advisor Class:no sales charges. For other share classes, visitfranklintempleton.com.
| Share Class | Cumulative Total Return2 | Average Annual Total Return3 | ||
A4,5 | ||||
6-Month | +2.20% | -1.63% | ||
1-Year | +6.27% | +2.29% | ||
5-Year | +20.22% | +2.96% | ||
10-Year | +168.13% | +9.94% | ||
Advisor | ||||
6-Month | +2.78% | +2.78% | ||
1-Year | +6.97% | +6.97% | ||
5-Year | +21.83% | +4.03% | ||
10-Year | +174.03% | +10.61% | ||
| Distribution | 30-Day Standardized Yield7 | |||||||||||
| Share Class | Rate6 | (with fee waiver) | (without fee waiver) | |||||||||
A | 4.90% | 4.00% | 4.00% | |||||||||
Advisor | 5.32% | 4.42% | 4.40% | |||||||||
Performance data represent past performance, which does not guarantee future results. Investment return and principal value will fluctuate, and you may have a gain or loss when you sell your shares. Current performance may differ from figures shown. For most recentmonth-end performance, go tofranklintempleton.comor call(800)342-5236.
See page 21 for Performance Summary footnotes.
| franklintempleton.com | Semiannual Report | 19 | ||
FRANKLIN INCOME FUND
PERFORMANCE SUMMARY
Net Asset Value
| Share Class(Symbol) | 3/31/19 | 9/30/18 | Change | |||
| A (FKIQX) | $2.31 | $2.32 | -$0.01 | |||
| A1(FKINX) | $2.32 | $2.32 | $0.00 | |||
| C (FCISX) | $2.35 | $2.35 | $0.00 | |||
| R (FISRX) | $2.28 | $2.28 | $0.00 | |||
| R6(FNCFX) | $2.30 | $2.30 | $0.00 | |||
| Advisor(FRIAX) | $2.30 | $2.30 | $0.00 | |||
Distributions(10/1/18–3/31/19)
| Share Class | Net Investment Income | |||
| A | $0.0588 | |||
| A1 | $0.0600 | |||
| C | $0.0540 | |||
| R | $0.0558 | |||
| R6 | $0.0618 | |||
| Advisor | $0.0612 | |||
Total Annual Operating Expenses8
| Share Class | | With Fee Waiver | | | Without Fee Waiver | | ||
| A | 0.72% | 0.72% | ||||||
| Advisor | 0.47% | 0.47% | ||||||
See page 21 for Performance Summary footnotes.
| 20 | Semiannual Report | franklintempleton.com | ||
FRANKLIN INCOME FUND
PERFORMANCE SUMMARY
Each class of shares is available to certain investors and has different annual fees and expenses, as described in the prospectus.
All investments involve risks, including possible loss of principal. The Fund’s share price and yield will be affected by interest rate movements. Bond prices generally move in the opposite direction of interest rates. Thus, as prices of bonds in the Fund adjust to a rise in interest rates, the Fund’s share price may decline. Changes in the financial strength of a bond issuer or in a bond’s credit rating may affect its value. The Fund’s portfolio includes a substantial portion of higher yielding, lower rated corporate bonds because of the relatively higher yields they offer. Floating-rate loans are lower rated, higher yielding instruments, which are subject to increased risk of default and can potentially result in loss of principal. These securities carry a greater degree of credit risk relative to investment-grade securities. Stock prices fluctuate, sometimes rapidly and dramatically, due to factors affecting individual companies, particular industries or sectors, or general market conditions. The Fund is actively managed but there is no guarantee that the manager’s investment decisions will produce the desired results. The Fund’s prospectus also includes a description of the main investment risks.
1. The Fund has a fee waiver associated with any investment it makes in a Franklin Templeton money fund and/or other Franklin Templeton fund, contractually guaranteed through 1/31/20. Fund investment results reflect the fee waiver; without this waiver, the results would have been lower.
2. Cumulative total return represents the change in value of an investment over the periods indicated.
3. Average annual total return represents the average annual change in value of an investment over the periods indicated. Return for less than one year, if any, has not been annualized.
4. Effective 9/10/18, Class A shares closed to new investors, were renamed Class A1 shares, and a new Class A share with a different expense structure became available. Class A performance shown has been calculated as follows: (a) for periods prior to 9/10/18, a restated figure is used based on the Fund’s Class A1 performance that includes any Rule12b-1 rate differential that exists between Class A1 and Class A; and (b) for periods after 9/10/18, actual Class A performance is used, reflecting all charges and fees applicable to that class.
5. Prior to 3/1/19, these shares were offered at a higher initial sales charge of 4.25%, thus actual returns would have differed. Total returns with sales charges have been restated to reflect the current maximum initial sales charge of 3.75%.
6. Distribution rate is based on an annualization of the respective class’s March dividend and the maximum offering price (NAV for Advisor Class) per share on 3/31/19.
7. The Fund’s30-day standardized yield is calculated over a trailing30-day period using the yield to maturity on bonds and/or the dividends accrued on stocks. It may not equal the Fund’s actual income distribution rate, which reflects the Fund’s past dividends paid to shareholders.
8. Figures are as stated in the Fund’s current prospectus and may differ from the expense ratios disclosed in the Your Fund’s Expenses and Financial Highlights sections in this report. In periods of market volatility, assets may decline significantly, causing total annual Fund operating expenses to become higher than the figures shown.
| franklintempleton.com | Semiannual Report | 21 | ||
FRANKLIN INCOME FUND
Your Fund’s Expenses
As a Fund shareholder, you can incur two types of costs: (1) transaction costs, including sales charges (loads) on Fund purchases and redemptions; and (2) ongoing Fund costs, including management fees, distribution and service(12b-1) fees, and other Fund expenses. All mutual funds have ongoing costs, sometimes referred to as operating expenses. The table below shows ongoing costs of investing in the Fund and can help you understand these costs and compare them with those of other mutual funds. The table assumes a $1,000 investment held for the six months indicated.
Actual Fund Expenses
The table below provides information about actual account values and actual expenses in the columns under the heading “Actual.” In these columns the Fund’s actual return, which includes the effect of Fund expenses, is used to calculate the “Ending Account Value” for each class of shares. You can estimate the expenses you paid during the period by following these steps (of course, your account value and expenses will differ from those in this illustration): Divide your account value by $1,000 (if your account had an $8,600 value, then $8,600÷ $1,000 = 8.6). Then multiply the result by the number in the row for your class of shares under the headings “Actual” and “Expenses Paid During Period” (if Actual Expenses Paid During Period were $7.50, then 8.6 x $7.50 =$64.50). In this illustration, the actual expenses paid this period are $64.50.
Hypothetical Example for Comparison with Other Funds
Under the heading “Hypothetical” in the table, information is provided about hypothetical account values and hypothetical expenses based on the Fund’s actual expense ratio and an assumed rate of return of 5% per year before expenses, which is not the Fund’s actual return. This information may not be used to estimate the actual ending account balance or expenses you paid for the period, but it can help you compare ongoing costs of investing in the Fund with those of other funds. To do so, compare this 5% hypothetical example for the class of shares you hold with the 5% hypothetical examples that appear in the shareholder reports of other funds.
Please note that expenses shown in the table are meant to highlight ongoing costs and do not reflect any transactional costs. Therefore, information under the heading “Hypothetical” is useful in comparing ongoing costs only, and will not help you compare total costs of owning different funds. In addition, if transactional costs were included, your total costs would have been higher.
Actual (actual return after expenses) | Hypothetical (5% annual return before expenses) | |||||||||||||||||||||||||||||||||||||||
Share Class | Beginning Account Value 10/1/18 | Ending Account Value 3/31/19 | Expenses Paid During | Ending Account Value 3/31/19 | Expenses Paid During 10/1/18–3/31/191,2 | Net Annualized Expense Ratio2 | ||||||||||||||||||||||||||||||||||
A | $ | 1,000 | $ | 1,022.00 | $ | 3.63 | $ | 1,021.34 | $ | 3.63 | 0.72% | |||||||||||||||||||||||||||||
A1 | $ | 1,000 | $ | 1,027.00 | $ | 3.13 | $ | 1,021.84 | $ | 3.13 | 0.62% | |||||||||||||||||||||||||||||
C | $ | 1,000 | $ | 1,023.90 | $ | 5.65 | $ | 1,019.35 | $ | 5.64 | 1.12% | |||||||||||||||||||||||||||||
R | $ | 1,000 | $ | 1,025.50 | $ | 4.90 | $ | 1,020.09 | $ | 4.89 | 0.97% | |||||||||||||||||||||||||||||
R6 | $ | 1,000 | $ | 1,028.00 | $ | 1.97 | $ | 1,022.99 | $ | 1.97 | 0.39% | |||||||||||||||||||||||||||||
Advisor | $ | 1,000 | $ | 1,027.80 | $ | 2.38 | $ | 1,022.59 | $ | 2.37 | 0.47% | |||||||||||||||||||||||||||||
1. Expenses are equal to the annualized expense ratio for thesix-month period as indicated above—in the far right column—multiplied by the simple average account value over the period indicated, and then multiplied by 182/365 to reflect theone-half year period.
2. Reflects expenses after fee waivers and expense reimbursements. Does not include acquired fund fees and expenses.
| 22 | Semiannual Report | franklintempleton.com | ||
Franklin U.S. Government Securities Fund
This semiannual report for Franklin U.S. Government Securities Fund covers the period ended March 31, 2019.
Your Fund’s Goal and Main Investments
The Fund seeks income by investing at least 80% of its net assets in U.S. government securities. The Fund presently invests substantially all of its assets in Government National Mortgage Association obligations (Ginnie Maes).
Since 1983, the Fund has invested substantially in Ginnie Mae securities, which carry a guarantee backed by the full faith and credit of the U.S. government as to the timely payment of interest and principal.1 Issued by the Government National Mortgage Association (GNMA), Ginnie Maes have been among the highest yielding U.S. government obligations available.
Portfolio Composition
Based on Total Net Assets as of 3/31/19
GNMA | 93.4 | % | ||
U.S. Government and Agency Securities | 1.7 | % | ||
Short-Term Investments & Other Net Assets | 4.9 | % |
Performance Overview
The Fund’s Class A shares posted a +3.28% cumulative total return for the six months under review. In comparison, the Bloomberg Barclays U.S. Government Intermediate Index, the intermediate component of the Bloomberg Barclays U.S. Government Index, posted a +3.84% total return.2 The Fund’s peers, as measured by the Lipper GNMA Funds Classification Average, which consists of funds chosen by Lipper that invest primarily in GNMAs, posted a +3.52% total return for the same period.3 You can find the Fund’s long-term performance data in the Performance Summary beginning on page 25.
Performance data represent past performance, which does not guarantee future results. Investment return and principal value will fluctuate, and you may have a gain or loss when you sell your shares. Current performance may differ from figures shown. For most recentmonth-end performance, go tofranklintempleton.comor call(800)342-5236.
Investment Strategy
We currently invest the Fund’s assets substantially in GNMA obligations. We analyze securities using proprietary models to help us identify attractive investment opportunities.
Dividend Distributions*
10/1/18–3/31/19
| Dividend per Share (cents) | ||||||||||||||||||||||||
| Class | Class | Class | Class | Class | Advisor | |||||||||||||||||||
| Month | A | A1 | C | R | R6 | Class | ||||||||||||||||||
October | 1.62 | 1.54 | 1.25 | 1.37 | 1.67 | 1.62 | ||||||||||||||||||
November | 1.49 | 1.54 | 1.31 | 1.38 | 1.68 | 1.62 | ||||||||||||||||||
December | 1.50 | 1.53 | 1.28 | 1.36 | 1.66 | 1.60 | ||||||||||||||||||
January | 1.50 | 1.54 | 1.29 | 1.37 | 1.68 | 1.62 | ||||||||||||||||||
February | 1.51 | 1.55 | 1.32 | 1.39 | 1.68 | 1.61 | ||||||||||||||||||
March | 1.43 | 1.47 | 1.22 | 1.30 | 1.61 | 1.55 | ||||||||||||||||||
Total | 9.05 | 9.17 | 7.67 | 8.17 | 9.98 | 9.62 | ||||||||||||||||||
*The distribution amount is the sum of all estimatedtax-basis net investment income distributions for the period shown. A portion or all of the distribution may be reclassified as return of capital or short-term or long-term capital gains once final tax designations are known. All Fund distributions will vary depending upon current market conditions, and past distributions are not indicative of future trends.
Manager’s Discussion
During the period, GNMA mortgage backed securities (MBS) produced positive total returns, but underperformed Treasuries.
MBS conditions remain supportive and the prepayment outlook fairly benign. With this backdrop, despite tight overall valuations, we are constructive on MBS fundamentals. The continued wind down of the Federal Reserve’s (Fed’s) System Open Market Account stands to be a key influence on the market as we move into the later part of the year. Despite relatively constant net supply, the Fed’s balance sheet runoff and an investor base that is mainly even-weighted could pressure the sector.
Within the agency mortgage pass-through sector, GNMAs underperformed their Freddie Mac and Fannie Mae counterparts. On an excess return basis, GNMA II and GNMA I 3.0% coupons were the best performers, while GNMA II 5.0% and GNMA I 4.5% coupons generally lagged.
1. Securities owned by the Fund, but not shares of the Fund, are guaranteed by the U.S. government, its agencies or instrumentalities as to the timely payment of principal and interest. The Fund’s yield and share price are not guaranteed and will vary with market conditions.
2. Source: Morningstar.
3. Source: Lipper, a Thomson Reuters Company. For thesix-month period ended 3/31/19, there were 52 funds in this category. Lipper calculations do not include sales charges or expense subsidization by a fund’s manager. The Fund’s performance relative to the average may have differed if these and other factors had been considered.
The indexes are unmanaged and include reinvestment of any income or distributions. They do not reflect any fees, expenses or sales charges. One cannot invest directly in an index, and an index is not representative of the Fund’s portfolio.
See www.franklintempletondatasources.com for additional data provider information.
The dollar value, number of shares or principal amount, and names of all portfolio holdings are listed in the Fund’s Statement of Investments (SOI).
The SOI begins on page 80.
| franklintempleton.com | Semiannual Report | 23 | ||
FRANKLIN U .S. GOVERNMENT SECURITIES FUND
The Fund maintains a conservative, disciplined investment strategy and invests primarily in GNMA mortgage pass-throughs, which remain the only MBS that are backed by the full faith and credit of the U.S. government—the same guarantee applicable to U.S. Treasuries.1 We believe our collateral-intensive research approach can allow us to uncover dislocations across the GNMA markets and associated misvaluation of prepayment risk. We continue to focus on specified pools where we believe our experience and continual investment in new technologies help us uncover these discrepancies.
During the period, we were more weighted toward GNMA IIs (pools of mortgages from multiple issuers) than GNMA Is (pools of mortgages from single issuers). Over the period, we added to GNMA II 3.0% and 4.0% coupons, while reducing exposure to 3.5% and 4.5% coupons. Our heaviest allocation was in 3.5% and 4.0% coupons atperiod-end. The Fund’s position in 4.0% and 5.0% coupon GNMA securities benefited performance, while our allocation to 3.5%, 4.5% and 3.0% coupon GNMAs detracted from performance.
Thank you for your continued participation in Franklin U.S. Government Securities Fund. We welcome your comments and questions and look forward to serving your investment needs in the years ahead.
 |
Roger A. Bayston, CFA | |
 |
Paul Varunok | |
| Portfolio Management Team | ||


The foregoing information reflects our analysis, opinions and portfolio holdings as of March 31, 2019, the end of the reporting period. The way we implement our main investment strategies and the resulting portfolio holdings may change depending on factors such as market and economic conditions. These opinions may not be relied upon as investment advice or an offer for a particular security. The information is not a complete analysis of every aspect of any market, country, industry, security or the Fund. Statements of fact are from sources considered reliable, but the investment manager makes no representation or warranty as to their completeness or accuracy. Although historical performance is no guarantee of future results, these insights may help you understand our investment management philosophy.
| 24 | Semiannual Report | franklintempleton.com | ||
FRANKLIN U.S. GOVERNMENT SECURITIES FUND
Performance Summary as of March 31, 2019
The performance tables do not reflect any taxes that a shareholder would pay on Fund dividends, capital gain distributions, if any, or any realized gains on the sale of Fund shares. Total return reflects reinvestment of the Fund’s dividends and capital gain distributions, if any, and any unrealized gains or losses. Your dividend income will vary depending on dividends or interest paid by securities in the Fund’s portfolio, adjusted for operating expenses of each class. Capital gain distributions are net profits realized from the sale of portfolio securities.
Performance as of 3/31/191
Cumulative total return excludes sales charges. Average annual total return includes maximum sales charges. Sales charges will vary depending on the size of the investment and the class of share purchased. The maximum is 3.75% and the minimum is 0%.Class A:3.75% maximum initial sales charge;Advisor Class:no sales charges. For other share classes, visitfranklintempleton.com.
| Share Class | Cumulative Total Return2 | Average Annual Total Return3 | ||
A4,5 | ||||
| 6-Month | +3.28% | -0.59% | ||
| 1-Year | +3.34% | -0.54% | ||
| 5-Year | +7.69% | +0.72% | ||
| 10-Year | +26.67% | +2.00% | ||
Advisor | ||||
| 6-Month | +3.55% | +3.55% | ||
| 1-Year | +3.49% | +3.49% | ||
| 5-Year | +8.50% | +1.65% | ||
| 10-Year | +28.75% | +2.56% | ||
Distribution Rate6 | 30-Day Standardized Yield7 | |||||
| Share Class | (with fee waiver) | (without fee waiver) | ||||
A | 2.77% | 2.38% | 2.37% | |||
Advisor | 3.11% | 2.73% | 2.72% | |||
Performance data represent past performance, which does not guarantee future results. Investment return and principal value will fluctuate, and you may have a gain or loss when you sell your shares. Current performance may differ from figures shown. For most recentmonth-end performance, go tofranklintempleton.comor call(800)342-5236.
See page 26 for Performance Summary footnotes.
franklintempleton.com |
Semiannual Report |
25 |
FRANKLIN U.S. GOVERNMENT SECURITIES FUND
PERFORMANCE SUMMARY
Distributions(10/1/18–3/31/19)
| Share Class | Net Investment Income | |||
A | $0.0905 | |||
A1 | $0.0917 | |||
C | $0.0767 | |||
R | $0.0817 | |||
R6 | $0.0998 | |||
Advisor | $0.0962 | |||
Total Annual Operating Expenses8
| Share Class | With Fee Waiver | Without Fee Waiver | ||||||
A | 0.87% | 0.87% | ||||||
Advisor | 0.62% | 0.62% | ||||||
Each class of shares is available to certain eligible investors and has different annual fees and expenses, as described in the prospectus.
All investments involve risks, including possible loss of principal. The Fund’s share price and yield will be affected by interest rate movements and mortgage prepayments. Bond prices generally move in the opposite direction of interest rates. Thus, as prices of bonds in the Fund adjust to a rise in interest rates, the Fund’s share price may decline. Changes in the financial strength of a bond issuer or in a bond’s credit rating may affect its value. The Fund is actively managed but there is no guarantee that the manager’s investment decisions will produce the desired results. The Fund’s prospectus also includes a description of the main investment risks.
1. The Fund has a fee waiver associated with any investment it makes in a Franklin Templeton money fund and/or other Franklin Templeton fund, contractually guaranteed through 1/31/20. Fund investment results reflect the fee waiver; without this waiver, the results would have been lower.
2. Cumulative total return represents the change in value of an investment over the periods indicated.
3. Average annual total return represents the average annual change in value of an investment over the periods indicated. Return for less than one year, if any, has not been annualized.
4. Effective 9/10/18, Class A shares closed to new investors, were renamed Class A1 shares, and a new Class A share with a different expense structure became available.
Class A performance shown has been calculated as follows: (a) for periods prior to 9/10/18, a restated figure is used based on the Fund’s Class A1 performance that includes any Rule12b-1 rate differential that exists between Class A1 and Class A; and (b) for periods after 9/10/18, actual Class A performance is used, reflecting all charges and fees applicable to that class.
5. Prior to 3/1/19, these shares were offered at a higher initial sales charge of 4.25%, thus actual returns would have differed. Total returns with sales charges have been restated to reflect the current maximum initial sales charge of 3.75%.
6. Distribution rate is based on an annualization of the respective class’s March dividend and the maximum offering price (NAV for Advisor Class) per share on 3/31/19.
7. The Fund’s30-day standardized yield is calculated over a trailing30-day period using the yield to maturity on bonds and/or the dividends accrued on stocks. It may not equal the Fund’s actual income distribution rate, which reflects the Fund’s past dividends paid to shareholders.
8. Figures are as stated in the Fund’s current prospectus and may differ from the expense ratios disclosed in the Your Fund’s Expenses and Financial Highlights sections in this report. In periods of market volatility, assets may decline significantly, causing total annual Fund operating expenses to become higher than the figures shown.
| 26 | Semiannual Report | franklintempleton.com | ||
FRANKLIN U.S. GOVERNMENT SECURITIES FUND
Your Fund’s Expenses
As a Fund shareholder, you can incur two types of costs: (1) transaction costs, including sales charges (loads) on Fund purchases and redemptions; and (2) ongoing Fund costs, including management fees, distribution and service(12b-1) fees, and other Fund expenses. All mutual funds have ongoing costs, sometimes referred to as operating expenses. The table below shows ongoing costs of investing in the Fund and can help you understand these costs and compare them with those of other mutual funds. The table assumes a $1,000 investment held for the six months indicated.
Actual Fund Expenses
The table below provides information about actual account values and actual expenses in the columns under the heading “Actual.” In these columns the Fund’s actual return, which includes the effect of Fund expenses, is used to calculate the “Ending Account Value” for each class of shares. You can estimate the expenses you paid during the period by following these steps (of course, your account value and expenses will differ from those in this illustration): Divide your account value by $1,000 (if your account had an $8,600 value, then $8,600÷ $1,000 = 8.6). Then multiply the result by the number in the row for your class of shares under the headings “Actual” and “Expenses Paid During Period” (if Actual Expenses Paid During Period were $7.50, then 8.6 x $7.50 =$64.50). In this illustration, the actual expenses paid this period are $64.50.
Hypothetical Example for Comparison with Other Funds
Under the heading “Hypothetical” in the table, information is provided about hypothetical account values and hypothetical expenses based on the Fund’s actual expense ratio and an assumed rate of return of 5% per year before expenses, which is not the Fund’s actual return. This information may not be used to estimate the actual ending account balance or expenses you paid for the period, but it can help you compare ongoing costs of investing in the Fund with those of other funds. To do so, compare this 5% hypothetical example for the class of shares you hold with the 5% hypothetical examples that appear in the shareholder reports of other funds.
Please note that expenses shown in the table are meant to highlight ongoing costs and do not reflect any transactional costs. Therefore, information under the heading “Hypothetical” is useful in comparing ongoing costs only, and will not help you compare total costs of owning different funds. In addition, if transactional costs were included, your total costs would have been higher.
| Actual (actual return after expenses) | Hypothetical (5% annual return before expenses) | |||||||||||||||||
| Share Class | Beginning Account Value 10/1/18 | Ending Account Value 3/31/19 | Expenses Paid During Period 10/1/18–3/31/191,2 | Ending Account Value 3/31/19 | Expenses Paid During Period 10/1/18–3/31/191,2 | Net Annualized Expense Ratio2 | ||||||||||||
| A | $1,000 | $1,032.80 | $4.41 | $1,020.59 | $4.38 | 0.87% | ||||||||||||
| A1 | $1,000 | $1,034.80 | $3.91 | $1,021.09 | $3.88 | 0.77% | ||||||||||||
| C | $1,000 | $1,032.40 | $6.44 | $1,018.60 | $6.39 | 1.27% | ||||||||||||
| R | $1,000 | $1,033.00 | $5.63 | $1,019.40 | $5.59 | 1.11% | ||||||||||||
| R6 | $1,000 | $1,036.10 | $2.54 | $1,022.44 | $2.52 | 0.50% | ||||||||||||
| Advisor | $1,000 | $1,035.50 | $3.15 | $1,021.84 | $3.13 | 0.62% | ||||||||||||
1. Expenses are equal to the annualized expense ratio for thesix-month period as indicated above—in the far right column—multiplied by the simple average account value over the period indicated, and then multiplied by 182/365 to reflect theone-half year period.
2. Reflects expenses after fee waivers and expense reimbursements. Does not include acquired fund fees and expenses.
| franklintempleton.com | Semiannual Report | 27 |
This semiannual report for Franklin Utilities Fund covers the period ended March 31, 2019.
Your Fund’s Goal and Main Investments
The Fund seeks both capital appreciation and current income by investing at least 80% of its net assets in the securities of public utility companies. These are companies that provide electricity, natural gas, water, and communications services to the public and companies that provide services to public utilities companies. The Fund concentrates (invests more than 25% of its total assets) in companies operating in the utilities industry. The Fund invests primarily in equity securities, which consist mainly of common stocks.
Performance Overview
The Fund’s Class A shares posted a +13.47% cumulative total return for the six months under review. In comparison, the Standard & Poor’s 500 Index (S&P 500), which is a broad measure of U.S. stock performance, posted a-1.72% total return, and the S&P 500 Utilities Index, which measures the performance of all utilities stocks in the S&P 500, posted a +12.35% total return.1 You can find the Fund’s long-term performance data in the Performance Summary beginning on page 30.
Performance data represent past performance, which does not guarantee future results. Investment return will fluctuate. Current performance may differ from figures shown. For most recentmonth-end performance, go tofranklintempleton.comor call(800)342-5236.
Investment Strategy
We search for the best return opportunities available in the global utilities arena with a specific focus on the U.S. electricity and gas sector. Generally, we seek to invest in companies producing a high percentage of earnings from their regulated operations.
Manager’s Discussion
During the six months under review, overall the utilities and energy sectors contributed to the Fund’s performance.2 Notable contributors with utilities include NextEra Energy, American
Portfolio Composition
Based on Total Net Assets as of 3/31/19
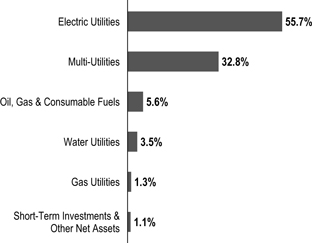
Electric Power and Exelon. A clean energy company with interests in generating and distributing electricity, NextEra Energy delivered strong quarterly earnings, driven by solid contribution from both Florida Power Light Company and NextEra Energy Resources segments. NextEra Energy also raised its earnings guidance due to U.S. tax reform. American Electric Power, a public utility, has a strong balance sheet and stable, sustainable growth trajectory. The company ended 2018 with strong growth from U.S. tax reform and a more robust job market tempered later by tariffs and a stronger dollar. The company reaffirmed its prior earnings guidance in line with expectations. Shares of Exelon, a utility services holding company, enjoyed substantial rallies that outpaced most of its industry peers. Exelon’s share price was also helped by strong cash flow support from merchant operations, higher-than-expected 2018 earnings guidance, healthy earnings growth and increased annual dividend growth that reflected better cash flow due to U.S. tax reform.
Within the energy sector, Kinder Morgan, an energy infrastructure company, also contributed to the Fund’s performance.
In contrast, key individual detractors included utility companies PG&E and Edison International. Shares of utility company PG&E were heavily impacted by the 2017–2018 Northern
1. Source: Morningstar.
The indexes are unmanaged and include reinvestment of any income or distributions. They do not reflect any fees, expenses or sales charges. One cannot invest directly in an index, and an index is not representative of the Fund’s portfolio.
2. The utilities sector comprises electric utilities, gas utilities, multi-utilities and water utilities in the SOI. The energy sector comprises oil, gas and consumable fuels in the SOI.
See www.franklintempletondatasources.com for additional data provider information.
The dollar value, number of shares or principal amount, and names of all portfolio holdings are listed in the Fund’s Statement of Investments (SOI).
The SOI begins on page 89.
| 28 | Semiannual Report | franklintempleton.com | ||
FRANKLIN UTILITIES FUND
California fires. Although the company was absolved of responsibility for the 2017 Tubbs fire, it continues to face potential liabilities and years of litigation. As a result, the company filed for bankruptcy in January 2019. Electric utility company Edison International reported lower-than-expected fourth-quarter 2018 earnings due to increased operating costs as a result of the Southern California wildfires.
Top 10 Holdings
3/31/19
Company Sector/Industry | % of Total Net Assets | |||
NextEra Energy Inc. Electric Utilities | 8.5% | |||
Dominion Energy Inc. Multi-Utilities | 5.3% | |||
Exelon Corp. Electric Utilities | 5.3% | |||
American Electric Power Co. Inc. Electric Utilities | 5.1% | |||
CMS Energy Corp. Multi-Utilities | 4.5% | |||
Sempra Energy Multi-Utilities | 4.4% | |||
Duke Energy Corp. Electric Utilities | 4.4% | |||
Xcel Energy Inc. Electric Utilities | 4.0% | |||
Evergy Inc. Electric Utilities | 3.9% | |||
Entergy Corp. Electric Utilities | 3.2% | |||
Thank you for your continued participation in Franklin Utilities Fund. We look forward to serving your future investment needs.
|
| |
| John C. Kohli, CFA | ||
|
| |
| J. Blair Schmicker, CFA | ||
| Portfolio Management Team | ||


The foregoing information reflects our analysis, opinions and portfolio holdings as of March 31, 2019, the end of the reporting period. The way we implement our main investment strategies and the resulting portfolio holdings may change depending on factors such as market and economic conditions. These opinions may not be relied upon as investment advice or an offer for a particular security. The information is not a complete analysis of every aspect of any market, country, industry, security or the Fund. Statements of fact are from sources considered reliable, but the investment manager makes no representation or warranty as to their completeness or accuracy. Although historical performance is no guarantee of future results, these insights may help you understand our investment management philosophy.
| franklintempleton.com | Semiannual Report | 29 | ||
FRANKLIN UTILITIES FUND
Performance Summary as of March 31, 2019
The performance tables do not reflect any taxes that a shareholder would pay on Fund dividends, capital gain distributions, if any, or any realized gains on the sale of Fund shares. Total return reflects reinvestment of the Fund’s dividends and capital gain distributions, if any, and any unrealized gains or losses. Your dividend income will vary depending on dividends or interest paid by securities in the Fund’s portfolio, adjusted for operating expenses of each class. Capital gain distributions are net profits realized from the sale of portfolio securities.
Performance as of 3/31/191
Cumulative total return excludes sales charges. Average annual total return includes maximum sales charges. Sales charges will vary depending on the size of the investment and the class of share purchased. The maximum is 3.75% and the minimum is 0%.Class A:3.75% maximum initial sales charge;Advisor Class:no sales charges. For other share classes, visitfranklintempleton.com.
| Share Class | Cumulative Total Return2 | Average Annual Total Return3 | ||||||
A4,5 | ||||||||
6-Month | +13.47% | +9.22% | ||||||
1-Year | +20.18% | +15.67% | ||||||
5-Year | +60.50% | +9.09% | ||||||
10-Year | +240.48% | +12.60% | ||||||
Advisor | ||||||||
6-Month | +13.61% | +13.61% | ||||||
1-Year | +20.49% | +20.49% | ||||||
5-Year | +61.88% | +10.11% | ||||||
10-Year | +245.94% | +13.21% | ||||||
| Distribution | 30-Day Standardized Yield7 | |||||||||||||
| Share Class | Rate6 | (with fee waiver) | (without fee waiver) | |||||||||||
A | 2.19% | 2.49% | 2.49% | |||||||||||
Advisor | 2.49% | 2.86% | 2.86% | |||||||||||
Performance data represent past performance, which does not guarantee future results. Investment return and principal value will fluctuate, and you may have a gain or loss when you sell your shares. Current performance may differ from figures shown. For most recentmonth-end performance, go tofranklintempleton.comor call(800)342-5236.
See page 32 for Performance Summary footnotes.
| 30 | Semiannual Report | franklintempleton.com | ||
FRANKLIN UTILITIES FUND
PERFORMANCE SUMMARY
Net Asset Value
| Share Class(Symbol) | 3/31/19 | 9/30/18 | Change | |||||||
| A (FKUQX) | $20.28 | $18.66 | +$1.62 | |||||||
| A1(FKUTX) | $20.28 | $18.66 | +$1.62 | |||||||
| C (FRUSX) | $20.17 | $18.57 | +$1.60 | |||||||
| R (FRURX) | $20.20 | $18.59 | +$1.61 | |||||||
| R6(FUFRX) | $20.44 | $18.81 | +$1.63 | |||||||
| Advisor(FRUAX) | $20.45 | $18.81 | +$1.64 | |||||||
Distributions(10/1/18–3/31/19)
| Share Class | Net Investment Income | Short-Term Capital Gain | Long-Term Capital Gain | Total | ||||||||||||
| A | $0.2647 | $0.0112 | $0.5657 | $0.8416 | ||||||||||||
| A1 | $0.2743 | $0.0112 | $0.5657 | $0.8512 | ||||||||||||
| C | $0.2270 | $0.0112 | $0.5657 | $0.8039 | ||||||||||||
| R | $0.2411 | $0.0112 | $0.5657 | $0.8180 | ||||||||||||
| R6 | $0.2971 | $0.0112 | $0.5657 | $0.8740 | ||||||||||||
| Advisor | $0.2884 | $0.0112 | $0.5657 | $0.8653 | ||||||||||||
Total Annual Operating Expenses8
| With Fee | Without Fee | |||||||
| Share Class | Waiver | Waiver | ||||||
| A | 0.84% | 0.84% | ||||||
| Advisor | 0.59% | 0.59% |
See page 32 for Performance Summary footnotes.
| franklintempleton.com | Semiannual Report | 31 | ||
FRANKLIN UTILITIES FUND
PERFORMANCE SUMMARY
Each class of shares is available to certain eligible investors and has different annual fees and expenses, as described in the prospectus.
All investments involve risks, including possible loss of principal. Investing in a fund concentrating in the utilities sector involves special risks, including increased susceptibility to adverse economic and regulatory developments affecting the sector. Stocks historically have outperformed other asset classes over the long term, but tend to fluctuate more dramatically over the short term. Securities issued by utility companies have been historically sensitive to interest rate changes. When interest rates fall, utility securities prices, and thus a utilities fund’s share price, tend to rise; when interest rates rise, their prices generally fall. The Fund is actively managed but there is no guarantee that the manager’s investment decisions will produce the desired results. The Fund’s prospectus also includes a description of the main investment risks.
1. The Fund has a fee waiver associated with any investment it makes in a Franklin Templeton money fund and/or other Franklin Templeton fund, contractually guaranteed through 1/31/20. Fund investment results reflect the fee waiver; without this waiver, the results would have been lower.
2. Cumulative total return represents the change in value of an investment over the periods indicated.
3. Average annual total return represents the average annual change in value of an investment over the periods indicated. Return for less than one year, if any, has not been annualized.
4. Effective 9/10/18, Class A shares closed to new investors, were renamed Class A1 shares, and a new Class A share with a different expense structure became available. Class A performance shown has been calculated as follows: (a) for periods prior to 9/10/18, a restated figure is used based on the Fund’s Class A1 performance that includes any Rule12b-1 rate differential that exists between Class A1 and Class A; and (b) for periods after 9/10/18, actual Class A performance is used, reflecting all charges and fees applicable to that class.
5. Prior to 3/1/19, these shares were offered at a higher initial sales charge of 4.25%, thus actual returns would have differed. Total returns with sales charges have been restated to reflect the current maximum initial sales charge of 3.75%.
6. Distribution rate is based on an annualization of the respective class’s current quarterly dividend and the maximum offering price (NAV for Advisor Class) per share on 3/31/19.
7. The Fund’s30-day standardized yield is calculated over a trailing30-day period using the yield to maturity on bonds and/or the dividends accrued on stocks. It may not equal the Fund’s actual income distribution rate, which reflects the Fund’s past dividends paid to shareholders.
8. Figures are as stated in the Fund’s current prospectus and may differ from the expense ratios disclosed in the Your Fund’s Expenses and Financial Highlights sections in this report. In periods of market volatility, assets may decline significantly, causing total annual Fund operating expenses to become higher than the figures shown.
| 32 | Semiannual Report | franklintempleton.com | ||
FRANKLIN UTILITIES FUND
Your Fund’s Expenses
As a Fund shareholder, you can incur two types of costs: (1) transaction costs, including sales charges (loads) on Fund purchases and redemptions; and (2) ongoing Fund costs, including management fees, distribution and service(12b-1) fees, and other Fund expenses. All mutual funds have ongoing costs, sometimes referred to as operating expenses. The table below shows ongoing costs of investing in the Fund and can help you understand these costs and compare them with those of other mutual funds. The table assumes a $1,000 investment held for the six months indicated.
Actual Fund Expenses
The table below provides information about actual account values and actual expenses in the columns under the heading “Actual.” In these columns the Fund’s actual return, which includes the effect of Fund expenses, is used to calculate the “Ending Account Value” for each class of shares. You can estimate the expenses you paid during the period by following these steps (of course, your account value and expenses will differ from those in this illustration): Divide your account value by $1,000 (if your account had an $8,600 value, then $8,600÷ $1,000 = 8.6). Then multiply the result by the number in the row for your class of shares under the headings “Actual” and “Expenses Paid During Period” (if Actual Expenses Paid During Period were $7.50, then 8.6 x $7.50 =$64.50). In this illustration, the actual expenses paid this period are $64.50.
Hypothetical Example for Comparison with Other Funds
Under the heading “Hypothetical” in the table, information is provided about hypothetical account values and hypothetical expenses based on the Fund’s actual expense ratio and an assumed rate of return of 5% per year before expenses, which is not the Fund’s actual return. This information may not be used to estimate the actual ending account balance or expenses you paid for the period, but it can help you compare ongoing costs of investing in the Fund with those of other funds. To do so, compare this 5% hypothetical example for the class of shares you hold with the 5% hypothetical examples that appear in the shareholder reports of other funds.
Please note that expenses shown in the table are meant to highlight ongoing costs and do not reflect any transactional costs. Therefore, information under the heading “Hypothetical” is useful in comparing ongoing costs only, and will not help you compare total costs of owning different funds. In addition, if transactional costs were included, your total costs would have been higher.
Actual (actual return after expenses) | Hypothetical (5% annual return before expenses) | |||||||||||||||||
| Share Class | Beginning Account Value 10/1/18 | Ending Account Value 3/31/19 | Expenses Paid During | Ending Account Value 3/31/19 | Expenses Paid During | Net Annualized Expense Ratio2 | ||||||||||||
A | $1,000 | $1,134.70 | $4.42 | $1,020.79 | $4.18 | 0.83% | ||||||||||||
A1 | $1,000 | $1,135.30 | $3.89 | $1,021.29 | $3.68 | 0.73% | ||||||||||||
C | $1,000 | $1,132.10 | $6.54 | $1,018.80 | $6.19 | 1.23% | ||||||||||||
R | $1,000 | $1,133.30 | $5.74 | $1,019.55 | $5.44 | 1.08% | ||||||||||||
R6 | $1,000 | $1,136.00 | $2.66 | $1,022.44 | $2.52 | 0.50% | ||||||||||||
Advisor | $1,000 | $1,136.10 | $3.09 | $1,022.04 | $2.92 | 0.58% | ||||||||||||
1. Expenses are equal to the annualized expense ratio for thesix-month period as indicated above—in the far right column—multiplied by the simple average account value over the period indicated, and then multiplied by 182/365 to reflect theone-half year period.
2. Reflects expenses after fee waivers and expense reimbursements. Does not include acquired fund fees and expenses.
| franklintempleton.com | Semiannual Report | 33 | ||
FRANKLIN CUSTODIAN FUNDS
Financial Highlights
Franklin DynaTech Fund
| Six Months Ended March 31, 2019 | Year Ended September 30, | |||||||||||||||||||||||
| (unaudited) | 2018 | 2017 | 2016 | 2015 | 2014 | |||||||||||||||||||
Class A | ||||||||||||||||||||||||
Per share operating performance | ||||||||||||||||||||||||
(for a share outstanding throughout the period) | ||||||||||||||||||||||||
Net asset value, beginning of period | $81.16 | $63.10 | $52.05 | $46.04 | $46.08 | $42.13 | ||||||||||||||||||
Income from investment operationsa: | ||||||||||||||||||||||||
Net investment income (loss)b | (0.08 | ) | (0.23 | ) | (0.18 | ) | (0.14 | ) | (0.21 | ) | (0.18 | ) | ||||||||||||
Net realized and unrealized gains (losses) | 0.64 | 19.45 | 12.92 | 7.35 | 1.78 | 5.94 | ||||||||||||||||||
Total from investment operations | 0.56 | 19.22 | 12.74 | 7.21 | 1.57 | 5.76 | ||||||||||||||||||
Less distributions from net realized gains | (1.91 | ) | (1.16 | ) | (1.69 | ) | (1.20 | ) | (1.61 | ) | (1.81 | ) | ||||||||||||
Net asset value, end of period | $79.81 | $81.16 | $63.10 | $52.05 | $46.04 | $46.08 | ||||||||||||||||||
Total returnc | 0.93% | 30.88% | 25.67% | 15.73% | 3.40% | 13.98% | ||||||||||||||||||
Ratios to average net assetsd | ||||||||||||||||||||||||
Expenses before waiver and payments by affiliates | 0.84% | 0.86% | 0.92% | 0.91% | 0.89% | 0.89% | ||||||||||||||||||
Expenses net of waiver and payments by affiliates | 0.83% | e | 0.86% | e,f | 0.91% | e | 0.90% | 0.89% | f | 0.89% | e,f | |||||||||||||
Net investment income (loss) | (0.21)% | (0.32)% | (0.33)% | (0.30)% | (0.44)% | (0.41)% | ||||||||||||||||||
Supplemental data | ||||||||||||||||||||||||
Net assets, end of period (000’s) | $4,039,753 | $3,741,562 | $2,498,393 | $2,123,082 | $1,857,570 | $1,504,338 | ||||||||||||||||||
Portfolio turnover rate | 9.62% | 17.22% | 19.85% | 22.42% | 31.02% | 26.43% | ||||||||||||||||||
aThe amount shown for a share outstanding throughout the period may not correlate with the Statement of Operations for the period due to the timing of sales and repurchases of the Fund’s shares in relation to income earned and/or fluctuating fair value of the investments of the Fund.
bBased on average daily shares outstanding.
cTotal return does not reflect sales commissions or contingent deferred sales charges, if applicable, and is not annualized for periods less than one year.
dRatios are annualized for periods less than one year.
eBenefit of expense reduction rounds to less than 0.01%.
fBenefit of waiver and payments by affiliates rounds to less than 0.01%.
| 34 | Semiannual Report | The accompanying notes are an integral part of these financial statements. | franklintempleton.com | ||
FRANKLIN CUSTODIAN FUNDS
FINANCIAL HIGHLIGHTS
Franklin DynaTech Fund(continued)
| Six Months Ended March 31, 2019 | Year Ended September 30, | |||||||||||||||||||||||
| (unaudited) | 2018 | 2017 | 2016 | 2015 | 2014 | |||||||||||||||||||
Class C | ||||||||||||||||||||||||
Per share operating performance | ||||||||||||||||||||||||
(for a share outstanding throughout the period) | ||||||||||||||||||||||||
Net asset value, beginning of period | $68.07 | $53.49 | $44.71 | $40.00 | $40.53 | $37.53 | ||||||||||||||||||
Income from investment operationsa: | ||||||||||||||||||||||||
Net investment income (loss)b | (0.29 | ) | (0.65 | ) | (0.50 | ) | (0.43 | ) | (0.50 | ) | (0.46 | ) | ||||||||||||
Net realized and unrealized gains (losses) | 0.47 | 16.39 | 10.97 | 6.34 | 1.58 | 5.27 | ||||||||||||||||||
Total from investment operations | 0.18 | 15.74 | 10.47 | 5.91 | 1.08 | 4.81 | ||||||||||||||||||
Less distributions from net realized gains | (1.91 | ) | (1.16 | ) | (1.69 | ) | (1.20 | ) | (1.61 | ) | (1.81 | ) | ||||||||||||
Net asset value, end of period | $66.34 | $68.07 | $53.49 | $44.71 | $40.00 | $40.53 | ||||||||||||||||||
Total returnc | 0.53% | 29.93% | 24.72% | 14.86% | 2.63% | 13.13% | ||||||||||||||||||
Ratios to average net assetsd | ||||||||||||||||||||||||
Expenses before waiver and payments by affiliates | 1.59% | 1.61% | 1.67% | 1.66% | 1.64% | 1.64% | ||||||||||||||||||
Expenses net of waiver and payments by affiliates | 1.58% | e | 1.61% | e,f | 1.66% | e | 1.65% | 1.64% | f | 1.64% | e,f | |||||||||||||
Net investment income (loss) | (0.96)% | (1.07)% | (1.08)% | (1.05)% | (1.19)% | (1.16)% | ||||||||||||||||||
Supplemental data | ||||||||||||||||||||||||
Net assets, end of period (000’s) | $549,154 | $611,221 | $374,502 | $318,896 | $270,961 | $212,961 | ||||||||||||||||||
Portfolio turnover rate | 9.62% | 17.22% | 19.85% | 22.42% | 31.02% | 26.43% | ||||||||||||||||||
aThe amount shown for a share outstanding throughout the period may not correlate with the Statement of Operations for the period due to the timing of sales and repurchases of the Fund’s shares in relation to income earned and/or fluctuating fair value of the investments of the Fund.
bBased on average daily shares outstanding.
cTotal return does not reflect sales commissions or contingent deferred sales charges, if applicable, and is not annualized for periods less than one year.
dRatios are annualized for periods less than one year.
eBenefit of expense reduction rounds to less than 0.01%.
fBenefit of waiver and payments by affiliates rounds to less than 0.01%.
| franklintempleton.com | The accompanying notes are an integral part of these financial statements. | Semiannual Report | 35 | ||||
FRANKLIN CUSTODIAN FUNDS
FINANCIAL HIGHLIGHTS
Franklin DynaTech Fund(continued)
Six Months Ended March 31, 2019 | Year Ended September 30, | |||||||||||||||||||||||
| (unaudited) | 2018 | 2017 | 2016 | 2015 | 2014 | |||||||||||||||||||
Class R | ||||||||||||||||||||||||
Per share operating performance | ||||||||||||||||||||||||
(for a share outstanding throughout the period) | ||||||||||||||||||||||||
Net asset value, beginning of period | $78.88 | $61.51 | $50.90 | $45.16 | $45.35 | $41.58 | ||||||||||||||||||
Income from investment operationsa: | ||||||||||||||||||||||||
Net investment income (loss)b | (0.16 | ) | (0.40 | ) | (0.31 | ) | (0.26 | ) | (0.32 | ) | (0.29 | ) | ||||||||||||
Net realized and unrealized gains (losses) | 0.61 | 18.93 | 12.61 | 7.20 | 1.74 | 5.87 | ||||||||||||||||||
Total from investment operations | 0.45 | 18.53 | 12.30 | 6.94 | 1.42 | 5.58 | ||||||||||||||||||
Less distributions from net realized gains | (1.91 | ) | (1.16 | ) | (1.69 | ) | (1.20 | ) | (1.61 | ) | (1.81 | ) | ||||||||||||
Net asset value, end of period | $77.42 | $78.88 | $61.51 | $50.90 | $45.16 | $45.35 | ||||||||||||||||||
Total returnc | 0.81% | 30.57% | 25.36% | 15.43% | 3.11% | 13.72% | ||||||||||||||||||
Ratios to average net assetsd | ||||||||||||||||||||||||
Expenses before waiver and payments by affiliates | 1.09% | 1.11% | 1.17% | 1.16% | 1.14% | 1.14% | ||||||||||||||||||
Expenses net of waiver and payments by affiliates | 1.08% | e | 1.11% | e,f | 1.16% | e | 1.15% | 1.14% | f | 1.14% | e,f | |||||||||||||
Net investment income (loss) | (0.46)% | (0.57)% | (0.58)% | (0.55)% | (0.69)% | (0.66)% | ||||||||||||||||||
Supplemental data | ||||||||||||||||||||||||
Net assets, end of period (000’s) | $107,741 | $95,925 | $47,860 | $38,862 | $43,001 | $45,230 | ||||||||||||||||||
Portfolio turnover rate | 9.62% | 17.22% | 19.85% | 22.42% | 31.02% | 26.43% | ||||||||||||||||||
aThe amount shown for a share outstanding throughout the period may not correlate with the Statement of Operations for the period due to the timing of sales and repurchases of the Fund’s shares in relation to income earned and/or fluctuating fair value of the investments of the Fund.
bBased on average daily shares outstanding.
cTotal return is not annualized for periods less than one year.
dRatios are annualized for periods less than one year.
eBenefit of expense reduction rounds to less than 0.01%.
fBenefit of waiver and payments by affiliates rounds to less than 0.01%.
| 36 | Semiannual Report | The accompanying notes are an integral part of these financial statements. | franklintempleton.com | ||
FRANKLIN CUSTODIAN FUNDS
FINANCIAL HIGHLIGHTS
Franklin DynaTech Fund(continued)
| Six Months Ended March 31, 2019 | Year Ended September 30, | |||||||||||||||||||||||
| (unaudited) | 2018 | 2017 | 2016 | 2015 | 2014 | |||||||||||||||||||
Class R6 | ||||||||||||||||||||||||
Per share operating performance | ||||||||||||||||||||||||
(for a share outstanding throughout the period) | ||||||||||||||||||||||||
Net asset value, beginning of period | $84.31 | $65.28 | $53.56 | $47.15 | $46.97 | $42.74 | ||||||||||||||||||
Income from investment operationsa: | ||||||||||||||||||||||||
Net investment income (loss)b | 0.05 | 0.04 | 0.06 | 0.06 | (0.01 | ) | (0.01 | ) | ||||||||||||||||
Net realized and unrealized gains (losses) | 0.70 | 20.15 | 13.35 | 7.55 | 1.80 | 6.05 | ||||||||||||||||||
Total from investment operations | 0.75 | 20.19 | 13.41 | 7.61 | 1.79 | 6.04 | ||||||||||||||||||
Less distributions from net realized gains | (1.91 | ) | (1.16 | ) | (1.69 | ) | (1.20 | ) | (1.61 | ) | (1.81 | ) | ||||||||||||
Net asset value, end of period | $83.15 | $84.31 | $65.28 | $53.56 | $47.15 | $46.97 | ||||||||||||||||||
Total returnc | 1.12% | 31.38% | 26.17% | 16.21% | 3.81% | 14.45% | ||||||||||||||||||
Ratios to average net assetsd | ||||||||||||||||||||||||
Expenses before waiver and payments by affiliates | 0.50% | 0.50% | 0.49% | 0.49% | 0.48% | 0.49% | ||||||||||||||||||
Expenses net of waiver and payments by affiliates | 0.49% | e | 0.50% | e,f | 0.48% | e | 0.48% | 0.48% | f | 0.49% | e,f | |||||||||||||
Net investment income (loss) | 0.13% | 0.04% | 0.10% | 0.12% | (0.03)% | (0.01)% | ||||||||||||||||||
Supplemental data | ||||||||||||||||||||||||
Net assets, end of period (000’s) | $1,990,361 | $1,688,595 | $457,846 | $359,505 | $362,627 | $342,466 | ||||||||||||||||||
Portfolio turnover rate | 9.62% | 17.22% | 19.85% | 22.42% | 31.02% | 26.43% | ||||||||||||||||||
aThe amount shown for a share outstanding throughout the period may not correlate with the Statement of Operations for the period due to the timing of sales and repurchases of the Fund’s shares in relation to income earned and/or fluctuating fair value of the investments of the Fund.
bBased on average daily shares outstanding.
cTotal return is not annualized for periods less than one year.
dRatios are annualized for periods less than one year.
eBenefit of expense reduction rounds to less than 0.01%.
fBenefit of waiver and payments by affiliates rounds to less than 0.01%.
| franklintempleton.com | The accompanying notes are an integral part of these financial statements. | Semiannual Report | 37 | ||||
FRANKLIN CUSTODIAN FUNDS
FINANCIAL HIGHLIGHTS
Franklin DynaTech Fund(continued)
| Six Months Ended March 31, 2019 | Year Ended September 30, | |||||||||||||||||||||||
| (unaudited) | 2018 | 2017 | 2016 | 2015 | 2014 | |||||||||||||||||||
Advisor Class | ||||||||||||||||||||||||
Per share operating performance | ||||||||||||||||||||||||
(for a share outstanding throughout the period) | ||||||||||||||||||||||||
Net asset value, beginning of period | $83.56 | $64.78 | $53.25 | $46.96 | $46.87 | $42.71 | ||||||||||||||||||
Income from investment operationsa: | ||||||||||||||||||||||||
Net investment income (loss)b | 0.01 | (0.06 | ) | (0.04 | ) | (0.03 | ) | (0.09 | ) | (0.07 | ) | |||||||||||||
Net realized and unrealized gains (losses) | 0.68 | 20.00 | 13.26 | 7.52 | 1.79 | 6.04 | ||||||||||||||||||
Total from investment operations | 0.69 | 19.94 | 13.22 | 7.49 | 1.70 | 5.97 | ||||||||||||||||||
Less distributions from net realized gains | (1.91 | ) | (1.16 | ) | (1.69 | ) | (1.20 | ) | (1.61 | ) | (1.81 | ) | ||||||||||||
Net asset value, end of period | $82.34 | $83.56 | $64.78 | $53.25 | $46.96 | $46.87 | ||||||||||||||||||
Total returnc | 1.06% | 31.21% | 25.98% | 16.02% | 3.62% | 14.29% | ||||||||||||||||||
Ratios to average net assetsd | ||||||||||||||||||||||||
Expenses before waiver and payments by affiliates | 0.59% | 0.61% | 0.67% | 0.66% | 0.64% | 0.64% | ||||||||||||||||||
Expenses net of waiver and payments by affiliates | 0.58% | e | 0.61% | e,f | 0.66% | e | 0.65% | 0.64% | f | 0.64% | e,f | |||||||||||||
Net investment income (loss) | 0.04% | (0.07)% | (0.08)% | (0.05)% | (0.19)% | (0.16)% | ||||||||||||||||||
Supplemental data | ||||||||||||||||||||||||
Net assets, end of period (000’s) | $847,583 | $680,066 | $712,762 | $203,443 | $176,090 | $159,180 | ||||||||||||||||||
Portfolio turnover rate | 9.62% | 17.22% | 19.85% | 22.42% | 31.02% | 26.43% | ||||||||||||||||||
aThe amount shown for a share outstanding throughout the period may not correlate with the Statement of Operations for the period due to the timing of sales and repurchases of the Fund’s shares in relation to income earned and/or fluctuating fair value of the investments of the Fund.
bBased on average daily shares outstanding.
cTotal return is not annualized for periods less than one year.
dRatios are annualized for periods less than one year.
eBenefit of expense reduction rounds to less than 0.01%.
fBenefit of waiver and payments by affiliates rounds to less than 0.01%.
| 38 | Semiannual Report | The accompanying notes are an integral part of these financial statements. | franklintempleton.com | ||
FRANKLIN CUSTODIAN FUNDS
Statement of Investments, March 31, 2019 (unaudited)
Franklin DynaTech Fund
| Country | Shares | Value | ||||||||||
Common Stocks 97.0% | ||||||||||||
Aerospace & Defense 3.8% | ||||||||||||
The Boeing Co. | United States | 300,000 | $ | 114,426,000 | ||||||||
Heico Corp. | United States | 860,000 | 81,588,200 | |||||||||
Raytheon Co. | United States | 500,000 | 91,040,000 | |||||||||
| 287,054,200 | ||||||||||||
Automobiles 0.0%† | ||||||||||||
a Tesla Inc. | United States | 10,000 | 2,798,600 | |||||||||
Biotechnology 1.9% | ||||||||||||
Amgen Inc. | United States | 225,000 | 42,745,500 | |||||||||
a Array BioPharma Inc. | United States | 25,000 | 609,500 | |||||||||
a Genomic Health Inc. | United States | 400,000 | 28,020,000 | |||||||||
a Homology Medicines Inc. | United States | 110,000 | 3,050,300 | |||||||||
a Invitae Corp. | United States | 25,000 | 585,500 | |||||||||
a Neurocrine Biosciences Inc. | United States | 300,000 | 26,430,000 | |||||||||
a Precision BioSciences Inc. | United States | 553,700 | 9,938,915 | |||||||||
a REGENXBIO Inc. | United States | 25,000 | 1,432,750 | |||||||||
a Sarepta Therapeutics Inc. | United States | 250,000 | 29,797,500 | |||||||||
a uniQure NV | Netherlands | 60,000 | 3,579,000 | |||||||||
a Veracyte Inc. | United States | 25,000 | 625,500 | |||||||||
| 146,814,465 | ||||||||||||
Capital Markets 3.1% | ||||||||||||
CME Group Inc. | United States | 105,000 | 17,280,900 | |||||||||
Intercontinental Exchange Inc. | United States | 850,000 | 64,719,000 | |||||||||
Moody’s Corp. | United States | 325,000 | 58,854,250 | |||||||||
MSCI Inc. | United States | 450,000 | 89,478,000 | |||||||||
| 230,332,150 | ||||||||||||
Diversified Consumer Services 0.5% | ||||||||||||
a Bright Horizons Family Solutions Inc. | United States | 300,000 | 38,133,000 | |||||||||
Electrical Equipment 0.1% | ||||||||||||
Nidec Corp. | Japan | 50,000 | 6,328,115 | |||||||||
Electronic Equipment, Instruments & Components 1.6% | ||||||||||||
Amphenol Corp., A | United States | 800,000 | 75,552,000 | |||||||||
Keyence Corp. | Japan | 65,000 | 40,455,263 | |||||||||
a Keysight Technologies Inc. | United States | 60,000 | 5,232,000 | |||||||||
| 121,239,263 | ||||||||||||
Entertainment 2.0% | ||||||||||||
a Electronic Arts Inc. | United States | 500,000 | 50,815,000 | |||||||||
a Netflix Inc. | United States | 250,000 | 89,140,000 | |||||||||
a Sea Ltd., ADR | Thailand | 60,000 | 1,411,200 | |||||||||
a Tencent Music Entertainment Group, ADR | China | 325,000 | 5,882,500 | |||||||||
| 147,248,700 | ||||||||||||
Equity Real Estate Investment Trusts (REITs) 3.2% | ||||||||||||
American Tower Corp. | United States | 500,000 | 98,530,000 | |||||||||
Equinix Inc. | United States | 100,000 | 45,316,000 | |||||||||
a SBA Communications Corp., A | United States | 500,000 | 99,830,000 | |||||||||
| 243,676,000 |
| franklintempleton.com | Semiannual Report | 39 |
FRANKLIN CUSTODIAN FUNDS
STATEMENT OF INVESTMENTS (UNAUDITED)
Franklin DynaTech Fund(continued)
| Country | Shares | Value | ||||||||||
| Common Stocks(continued) | ||||||||||||
Health Care Equipment & Supplies 8.8% | ||||||||||||
Abbott Laboratories | United States | 1,250,000 | $ | 99,925,000 | ||||||||
aABIOMED Inc. | United States | 90,000 | 25,703,100 | |||||||||
a Align Technology Inc. | United States | 25,000 | 7,108,250 | |||||||||
Becton, Dickinson and Co. | United States | 250,000 | 62,432,500 | |||||||||
Danaher Corp. | United States | 500,000 | 66,010,000 | |||||||||
aEdwards Lifesciences Corp. | United States | 375,000 | 71,748,750 | |||||||||
aIDEXX Laboratories Inc. | United States | 450,000 | 100,620,000 | |||||||||
a Intuitive Surgical Inc. | United States | 165,000 | 94,145,700 | |||||||||
aiRhythm Technologies Inc. | United States | 340,000 | 25,486,400 | |||||||||
ResMed Inc. | United States | 145,000 | 15,075,650 | |||||||||
Siemens Healthineers AG | Germany | 425,000 | 17,714,188 | |||||||||
Stryker Corp. | United States | 400,000 | 79,008,000 | |||||||||
| 664,977,538 | ||||||||||||
Health Care Providers & Services 1.6% | ||||||||||||
aGuardant Health Inc. | United States | 450,000 | 34,515,000 | |||||||||
UnitedHealth Group Inc. | United States | 350,000 | 86,541,000 | |||||||||
| 121,056,000 | ||||||||||||
Health Care Technology 1.7% | ||||||||||||
a Inspire Medical Systems Inc. | United States | 500,000 | 28,390,000 | |||||||||
aVeeva Systems Inc. | United States | 775,000 | 98,316,500 | |||||||||
| 126,706,500 | ||||||||||||
Industrial Conglomerates 0.5% | ||||||||||||
Roper Technologies Inc. | United States | 120,000 | 41,036,400 | |||||||||
Interactive Media & Services 6.6% | ||||||||||||
a Alphabet Inc., A | United States | 200,000 | 235,378,000 | |||||||||
a Alphabet Inc., C | United States | 62,170 | 72,944,683 | |||||||||
aCarGurus Inc. | United States | 300,000 | 12,018,000 | |||||||||
aFacebook Inc., A | United States | 250,000 | 41,672,500 | |||||||||
Match Group Inc. | United States | 500,000 | 28,305,000 | |||||||||
Tencent Holdings Ltd. | China | 2,250,000 | 103,471,996 | |||||||||
| 493,790,179 | ||||||||||||
Internet & Direct Marketing Retail 10.1% | ||||||||||||
aAlibaba Group Holding Ltd., ADR | China | 500,000 | 91,225,000 | |||||||||
aAmazon.com Inc. | United States | 265,000 | 471,898,750 | |||||||||
aBooking Holdings Inc. | United States | 20,000 | 34,898,200 | |||||||||
aDelivery Hero SE | Germany | 300,000 | 10,838,037 | |||||||||
aEtsy Inc. | United States | 750,000 | 50,415,000 | |||||||||
aMercadoLibre Inc. | Argentina | 200,000 | 101,546,000 | |||||||||
| 760,820,987 | ||||||||||||
IT Services 13.0% | ||||||||||||
aAdyen NV | Netherlands | 65,000 | 50,902,872 | |||||||||
aFiserv Inc. | United States | 500,000 | 44,140,000 | |||||||||
aGoDaddy Inc., A | United States | 500,000 | 37,595,000 | |||||||||
aI3 Verticals Inc., A | United States | 300,000 | 7,206,000 | |||||||||
aInterXion Holding NV | Netherlands | 500,000 | 33,365,000 | |||||||||
Mastercard Inc., A | United States | 1,000,000 | 235,450,000 | |||||||||
aMongoDB Inc. | United States | 540,000 | 79,390,800 | |||||||||
a Okta Inc., A | United States | 225,000 | 18,614,250 | |||||||||
aPayPal Holdings Inc. | United States | 1,050,000 | 109,032,000 |
| 40 | Semiannual Report | franklintempleton.com | ||
FRANKLIN CUSTODIAN FUNDS
STATEMENT OF INVESTMENTS (UNAUDITED)
Franklin DynaTech Fund(continued)
| Country | Shares | Value | ||||||||||
| Common Stocks(continued) | ||||||||||||
IT Services(continued) | ||||||||||||
aShopify Inc., A | Canada | 400,000 | $ | 82,598,997 | ||||||||
aSquare Inc., A | United States | 675,000 | 50,571,000 | |||||||||
aTwilio Inc., A | United States | 300,000 | 38,754,000 | |||||||||
Visa Inc., A | United States | 1,200,000 | 187,428,000 | |||||||||
aWix.com Ltd. | Israel | 55,000 | 6,645,650 | |||||||||
| 981,693,569 | ||||||||||||
Life Sciences Tools & Services 2.4% | ||||||||||||
aIllumina Inc. | United States | 270,000 | 83,886,300 | |||||||||
aIQVIA Holdings Inc. | United States | 10,000 | 1,438,500 | |||||||||
aNanoString Technologies Inc. | United States | 25,000 | 598,250 | |||||||||
aQIAGEN NV | Netherlands | 10,000 | 406,800 | |||||||||
Thermo Fisher Scientific Inc. | United States | 250,000 | 68,430,000 | |||||||||
aWaters Corp. | United States | 100,000 | 25,171,000 | |||||||||
| 179,930,850 | ||||||||||||
Machinery 1.1% | ||||||||||||
Fortive Corp. | United States | 1,000,000 | 83,890,000 | |||||||||
Media 0.6% | ||||||||||||
aLiberty Broadband Corp., A | United States | 500,000 | 45,820,000 | |||||||||
Pharmaceuticals 1.4% | ||||||||||||
AstraZeneca PLC | United Kingdom | 335,000 | 26,774,443 | |||||||||
aElanco Animal Health Inc. | United States | 1,200,000 | 38,484,000 | |||||||||
aGW Pharmaceuticals PLC, ADR | United Kingdom | 10,000 | 1,685,700 | |||||||||
Merck KGaA | Germany | 325,000 | 37,065,022 | |||||||||
| 104,009,165 | ||||||||||||
Professional Services 1.1% | ||||||||||||
aCoStar Group Inc. | United States | 150,000 | 69,963,000 | |||||||||
TransUnion | United States | 150,000 | 10,026,000 | |||||||||
aUpwork Inc. | United States | 115,000 | 2,201,100 | |||||||||
| 82,190,100 | ||||||||||||
Road & Rail 0.2% | ||||||||||||
aLyft Inc., A | United States | 145,600 | 11,399,024 | |||||||||
Semiconductors & Semiconductor Equipment 6.4% | ||||||||||||
Analog Devices Inc. | United States | 500,000 | 52,635,000 | |||||||||
ASML Holding NV, N.Y. shs | Netherlands | 200,000 | 37,610,000 | |||||||||
Intel Corp. | United States | 1,000,000 | 53,700,000 | |||||||||
KLA-Tencor Corp. | United States | 225,000 | 26,867,250 | |||||||||
Lam Research Corp. | United States | 350,000 | 62,653,500 | |||||||||
Monolithic Power Systems | United States | 350,000 | 47,421,500 | |||||||||
NVIDIA Corp. | United States | 400,000 | 71,824,000 | |||||||||
Xilinx Inc. | United States | 1,000,000 | 126,790,000 | |||||||||
| 479,501,250 | ||||||||||||
Software 24.1% | ||||||||||||
a2U Inc. | United States | 200,000 | 14,170,000 | |||||||||
a Adobe Inc. | United States | 500,000 | 133,245,000 | |||||||||
aAltair Engineering Inc. | United States | 500,000 | 18,405,000 | |||||||||
aAlteryx Inc. | United States | 500,000 | 41,935,000 | |||||||||
aAnaplan Inc. | United States | 225,000 | 8,856,000 | |||||||||
aANSYS Inc. | United States | 200,000 | 36,542,000 | |||||||||
a Aspen Technology Inc. | United States | 500,000 | 52,130,000 |
| franklintempleton.com | Semiannual Report | 41 |
FRANKLIN CUSTODIAN FUNDS
STATEMENT OF INVESTMENTS (UNAUDITED)
Franklin DynaTech Fund(continued)
| Country | Shares | Value | ||||||||||
| Common Stocks(continued) | ||||||||||||
Software(continued) | ||||||||||||
aAtlassian Corp. PLC | United States | 500,000 | $ | 56,195,000 | ||||||||
aAutodesk Inc. | United States | 450,000 | 70,119,000 | |||||||||
aBlackline Inc. | United States | 400,000 | 18,528,000 | |||||||||
aCadence Design Systems Inc. | United States | 325,000 | 20,640,750 | |||||||||
Constellation Software Inc. | Canada | 25,007 | 21,199,512 | |||||||||
aCoupa Software Inc. | United States | 300,000 | 27,294,000 | |||||||||
aCyberArk Software Ltd. | Israel | 10,000 | 1,190,500 | |||||||||
aDocuSign Inc. | United States | 450,000 | 23,328,000 | |||||||||
aDropbox Inc., A | United States | 100,000 | 2,180,000 | |||||||||
a Elastic NV | United States | 300,000 | 23,961,000 | |||||||||
aGuidewire Software Inc. | United States | 500,000 | 48,580,000 | |||||||||
aHubspot Inc. | United States | 500,000 | 83,105,000 | |||||||||
Intuit Inc. | United States | 325,000 | 84,958,250 | |||||||||
aLightspeed POS Inc. | Canada | 145,000 | 2,237,031 | |||||||||
Microsoft Corp. | United States | 2,500,000 | 294,850,000 | |||||||||
aPluralsight Inc., A | United States | 350,000 | 11,109,000 | |||||||||
aPTC Inc. | United States | 25,000 | 2,304,500 | |||||||||
aQ2 Holdings Inc. | United States | 500,000 | 34,630,000 | |||||||||
aRealPage Inc. | United States | 95,000 | 5,765,550 | |||||||||
aSalesforce.com Inc. | United States | 1,000,000 | 158,370,000 | |||||||||
aServiceNow Inc. | United States | 675,000 | 166,380,750 | |||||||||
a Smartsheet Inc. A | United States | 225,000 | 9,177,750 | |||||||||
aSplunk Inc. | United States | 300,000 | 37,380,000 | |||||||||
aSynopsys Inc. | United States | 325,000 | 37,423,750 | |||||||||
aTyler Technologies Inc. | United States | 100,000 | 20,440,000 | |||||||||
VMware Inc., A | United States | 300,000 | 54,153,000 | |||||||||
aWorkday Inc., A | United States | 600,000 | 115,710,000 | |||||||||
aZendesk Inc. | United States | 650,000 | 55,250,000 | |||||||||
aZscaler Inc. | United States | 300,000 | 21,279,000 | |||||||||
| 1,813,022,343 | ||||||||||||
Technology Hardware, Storage & Peripherals 1.0% | ||||||||||||
Apple Inc. | United States | 400,000 | 75,980,000 | |||||||||
Textiles, Apparel & Luxury Goods 0.2% | ||||||||||||
NIKE Inc., B | United States | 200,000 | 16,842,000 | |||||||||
Total Common Stocks (Cost $3,913,912,166) | 7,306,290,398 | |||||||||||
Short Term Investments (Cost $231,269,009) 3.0% | ||||||||||||
Money Market Funds 3.0% | ||||||||||||
b,c Institutional Fiduciary Trust Money Market Portfolio, 2.10% | United States | 231,269,009 | 231,269,009 | |||||||||
Total Investments (Cost $4,145,181,175) 100.0% | 7,537,559,407 | |||||||||||
Other Assets, less Liabilities (0.0)%† | (2,967,975 | ) | ||||||||||
Net Assets 100.0% | $ | 7,534,591,432 | ||||||||||
| 42 | Semiannual Report | franklintempleton.com | ||
FRANKLIN CUSTODIAN FUNDS
STATEMENT OF INVESTMENTS (UNAUDITED)
Franklin DynaTech Fund(continued)
See Abbreviations on page 122.
†Rounds to less than 0.1% of net assets.
aNon-income producing.
bSee Note 3(f) regarding investments in affiliated management investment companies.
cThe rate shown is the annualized seven-day effective yield at period end.
| franklintempleton.com | The accompanying notes are an integral part of these financial statements. | Semiannual Report | 43 | ||||
FRANKLIN CUSTODIAN FUNDS
Financial Highlights
Franklin Growth Fund
| Six Months Ended March 31, 2019 | Year Ended September 30, | |||||||||||||||||||||
| (unaudited | ) | 2018 | 2017 | 2016 | 2015 | 2014 | ||||||||||||||||
Class A | ||||||||||||||||||||||
Per share operating performance (for a share outstanding throughout the period) | ||||||||||||||||||||||
Net asset value, beginning of period | $107.59 | $91.61 | $78.54 | $72.40 | $70.51 | $59.49 | ||||||||||||||||
Income from investment operationsa: | ||||||||||||||||||||||
Net investment incomeb | 0.24 | 0.41 | 0.40 | 0.47 | c | 0.29 | 0.26 | |||||||||||||||
Net realized and unrealized gains (losses) | (2.68 | ) | 18.18 | 15.56 | 8.51 | 1.79 | 11.06 | |||||||||||||||
Total from investment operations | (2.44 | ) | 18.59 | 15.96 | 8.98 | 2.08 | 11.32 | |||||||||||||||
Less distributions from: | ||||||||||||||||||||||
Net investment income | (0.44 | ) | (0.36 | ) | (0.39) | (0.47 | ) | (0.19 | ) | (0.30 | ) | |||||||||||
Net realized gains | (1.04 | ) | (2.25 | ) | (2.50) | (2.37 | ) | — | — | |||||||||||||
Total distributions | (1.48 | ) | (2.61 | ) | (2.89) | (2.84 | ) | (0.19 | ) | (0.30 | ) | |||||||||||
Net asset value, end of period | $103.67 | $107.59 | $91.61 | $78.54 | $72.40 | $70.51 | ||||||||||||||||
Total returnd | (2.23)% | 20.72% | 21.12% | 12.57% | 2.94% | 19.08% | ||||||||||||||||
Ratios to average net assetse | ||||||||||||||||||||||
Expenses before waiver and payments by affiliates | 0.82% | 0.83% | 0.88% | 0.88% | 0.88% | 0.90% | ||||||||||||||||
Expenses net of waiver and payments by affiliatesf | 0.82% | g | 0.83% | g | 0.87% | 0.86% | 0.88% | g | 0.90% | g | ||||||||||||
Net investment income | 0.49% | 0.41% | 0.47% | 0.63% | c | 0.38% | 0.40% | |||||||||||||||
Supplemental data | ||||||||||||||||||||||
Net assets, end of period (000’s) | $8,897,210 | $9,044,834 | $8,051,641 | $7,628,523 | $7,185,665 | $6,611,073 | ||||||||||||||||
Portfolio turnover rate | 2.50% | h | 6.05% | h | 5.60% | 7.53% | 5.05% | 1.50% | ||||||||||||||
aThe amount shown for a share outstanding throughout the period may not correlate with the Statement of Operations for the period due to the timing of sales and repurchases of the Fund’s shares in relation to income earned and/or fluctuating fair value of the investments of the Fund.
bBased on average daily shares outstanding.
cNet investment income per share includes approximately $0.10 per share related to income received in the form of special dividends in connection with certain Fund holdings. Excluding this amount, the ratio of net investment income to average net assets would have been 0.50%.
dTotal return does not reflect sales commissions or contingent deferred sales charges, if applicable, and is not annualized for periods less than one year.
eRatios are annualized for periods less than one year.
fBenefit of expense reduction rounds to less than 0.01%.
gBenefit of waiver and payments by affiliates rounds to less than 0.01%.
hExcludes the value of portfolio securities delivered as a result of a redemption in-kind. See Note 11.
| 44 | Semiannual Report | The accompanying notes are an integral part of these financial statements. | franklintempleton.com | ||
FRANKLIN CUSTODIAN FUNDS
FINANCIAL HIGHLIGHTS
Franklin Growth Fund(continued)
| Six Months Ended March 31, 2019 | Year Ended September 30, | |||||||||||||||||||||||
| (unaudited | ) | 2018 | 2017 | 2016 | 2015 | 2014 | ||||||||||||||||||
Class C | ||||||||||||||||||||||||
Per share operating performance (for a share outstanding throughout the period) | ||||||||||||||||||||||||
Net asset value, beginning of period | $98.38 | $84.25 | $72.60 | $67.17 | $65.75 | $55.64 | ||||||||||||||||||
Income from investment operationsa: | ||||||||||||||||||||||||
Net investment income (loss)b | (0.13 | ) | (0.30 | ) | (0.21 | ) | (0.08 | )c | (0.26 | ) | (0.22 | ) | ||||||||||||
Net realized and unrealized gains (losses) | (2.44 | ) | 16.68 | 14.36 | 7.88 | 1.68 | 10.33 | |||||||||||||||||
Total from investment operations | (2.57 | ) | 16.38 | 14.15 | 7.80 | 1.42 | 10.11 | |||||||||||||||||
Less distributions from net realized gains | (1.04 | ) | (2.25 | ) | (2.50 | ) | (2.37 | ) | — | — | ||||||||||||||
Net asset value, end of period | $94.77 | $98.38 | $84.25 | $72.60 | $67.17 | $65.75 | ||||||||||||||||||
Total returnd | (2.58)% | 19.82% | 20.21% | 11.74% | 2.16% | 18.17% | ||||||||||||||||||
Ratios to average net assetse | ||||||||||||||||||||||||
Expenses before waiver and payments by affiliates | 1.57% | 1.58% | 1.63% | 1.63% | 1.63% | 1.65% | ||||||||||||||||||
Expenses net of waiver and payments by affiliatesf | 1.57% | g | 1.58% | g | 1.62% | 1.61% | 1.63% | g | 1.65% | g | ||||||||||||||
Net investment income (loss) | (0.26)% | (0.34)% | (0.28)% | (0.12)% | c | (0.37)% | (0.35)% | |||||||||||||||||
Supplemental data | ||||||||||||||||||||||||
Net assets, end of period (000’s) | $726,451 | $1,060,258 | $930,751 | $846,965 | $777,570 | $662,548 | ||||||||||||||||||
Portfolio turnover rate | 2.50% | h | 6.05% | h | 5.60% | 7.53% | 5.05% | 1.50% | ||||||||||||||||
aThe amount shown for a share outstanding throughout the period may not correlate with the Statement of Operations for the period due to the timing of sales and repurchases of the Fund’s shares in relation to income earned and/or fluctuating fair value of the investments of the Fund.
bBased on average daily shares outstanding.
cNet investment income per share includes approximately $0.10 per share related to income received in the form of special dividends in connection with certain Fund holdings. Excluding this amount, the ratio of net investment income to average net assets would have been (0.25)%.
dTotal return does not reflect sales commissions or contingent deferred sales charges, if applicable, and is not annualized for periods less than one year.
eRatios are annualized for periods less than one year.
fBenefit of expense reduction rounds to less than 0.01%.
gBenefit of waiver and payments by affiliates rounds to less than 0.01%.
hExcludes the value of portfolio securities delivered as a result of a redemption in-kind. See Note 11.
| franklintempleton.com | The accompanying notes are an integral part of these financial statements. | Semiannual Report | 45 | ||||
FRANKLIN CUSTODIAN FUNDS
FINANCIAL HIGHLIGHTS
Franklin Growth Fund(continued)
| Six Months Ended March 31, 2019 | Year Ended September 30, | |||||||||||||||||||||
| (unaudited | ) | 2018 | 2017 | 2016 | 2015 | 2014 | ||||||||||||||||
Class R | ||||||||||||||||||||||
Per share operating performance (for a share outstanding throughout the period) | ||||||||||||||||||||||
Net asset value, beginning of period | $107.00 | $91.13 | $78.14 | $71.93 | $70.05 | $59.07 | ||||||||||||||||
Income from investment operationsa: | ||||||||||||||||||||||
Net investment incomeb | 0.12 | 0.16 | 0.19 | 0.29 | c | 0.10 | 0.10 | |||||||||||||||
Net realized and unrealized gains (losses) | (2.66 | ) | 18.09 | 15.51 | 8.45 | 1.78 | 10.98 | |||||||||||||||
Total from investment operations | (2.54 | ) | 18.25 | 15.70 | 8.74 | 1.88 | 11.08 | |||||||||||||||
Less distributions from: | ||||||||||||||||||||||
Net investment income | (0.14 | ) | (0.13 | ) | (0.21) | (0.16 | ) | — | (0.10 | ) | ||||||||||||
Net realized gains | (1.04 | ) | (2.25 | ) | (2.50) | (2.37 | ) | — | — | |||||||||||||
Total distributions | (1.18 | ) | (2.38 | ) | (2.71) | (2.53 | ) | — | (0.10 | ) | ||||||||||||
Net asset value, end of period | $103.28 | $107.00 | $91.13 | $78.14 | $71.93 | $70.05 | ||||||||||||||||
Total returnd | (2.34)% | 20.42% | 20.81% | 12.29% | 2.68% | 18.77% | ||||||||||||||||
Ratios to average net assetse | ||||||||||||||||||||||
Expenses before waiver and payments by affiliates | 1.07% | 1.08% | 1.13% | 1.13% | 1.13% | 1.15% | ||||||||||||||||
Expenses net of waiver and payments by affiliatesf | 1.07% | g | 1.08% | g | 1.12% | 1.11% | 1.13% | g | 1.15% | g | ||||||||||||
Net investment income | 0.24% | 0.16% | 0.22% | 0.38% | c | 0.13% | 0.15% | |||||||||||||||
Supplemental data | ||||||||||||||||||||||
Net assets, end of period (000’s) | $457,858 | $524,960 | $510,317 | $477,221 | $501,813 | $565,634 | ||||||||||||||||
Portfolio turnover rate | 2.50% | h | 6.05% | h | 5.60% | 7.53% | 5.05% | 1.50% | ||||||||||||||
aThe amount shown for a share outstanding throughout the period may not correlate with the Statement of Operations for the period due to the timing of sales and repurchases of the Fund’s shares in relation to income earned and/or fluctuating fair value of the investments of the Fund.
bBased on average daily shares outstanding.
cNet investment income per share includes approximately $0.10 per share related to income received in the form of special dividends in connection with certain Fund holdings. Excluding this amount, the ratio of net investment income to average net assets would have been 0.25%.
dTotal return is not annualized for periods less than one year.
eRatios are annualized for periods less than one year.
fBenefit of expense reduction rounds to less than 0.01%.
gBenefit of waiver and payments by affiliates rounds to less than 0.01%.
hExcludes the value of portfolio securities delivered as a result of a redemption in-kind. See Note 11.
| 46 | Semiannual Report | The accompanying notes are an integral part of these financial statements. | franklintempleton.com | ||
FRANKLIN CUSTODIAN FUNDS
FINANCIAL HIGHLIGHTS
Franklin Growth Fund(continued)
| Six Months Ended March 31, 2019 | Year Ended September 30, | |||||||||||||||||||||||
| (unaudited | ) | 2018 | 2017 | 2016 | 2015 | 2014 | ||||||||||||||||||
Class R6 | ||||||||||||||||||||||||
Per share operating performance (for a share outstanding throughout the period) | ||||||||||||||||||||||||
Net asset value, beginning of period | $107.90 | $91.90 | $78.79 | $72.69 | $70.76 | $59.71 | ||||||||||||||||||
Income from investment operationsa: | ||||||||||||||||||||||||
Net investment incomeb | 0.41 | 0.77 | 0.74 | 0.78 | c | 0.61 | 0.55 | |||||||||||||||||
Net realized and unrealized gains (losses) | (2.69 | ) | 18.22 | 15.59 | 8.56 | 1.79 | 11.08 | |||||||||||||||||
Total from investment operations | (2.28 | ) | 18.99 | 16.33 | 9.34 | 2.40 | 11.63 | |||||||||||||||||
Less distributions from: | ||||||||||||||||||||||||
Net investment income | (0.79 | ) | (0.74 | ) | (0.72 | ) | (0.87 | ) | (0.47 | ) | (0.58 | ) | ||||||||||||
Net realized gains | (1.04 | ) | (2.25 | ) | (2.50 | ) | (2.37 | ) | — | — | ||||||||||||||
Total distributions | (1.83 | ) | (2.99 | ) | (3.22 | ) | (3.24 | ) | (0.47 | ) | (0.58 | ) | ||||||||||||
Net asset value, end of period | $103.79 | $107.90 | $91.90 | $78.79 | $72.69 | $70.76 | ||||||||||||||||||
Total returnd | (2.06)% | 21.17% | 21.61% | 13.05% | 3.37% | 19.59% | ||||||||||||||||||
Ratios to average net assetse | ||||||||||||||||||||||||
Expenses before waiver and payments by affiliates | 0.48% | 0.47% | 0.46% | 0.46% | 0.46% | 0.47% | ||||||||||||||||||
Expenses net of waiver and payments by affiliatesf | 0.48% | g | 0.46% | 0.45% | 0.44% | 0.46% | g | 0.47% | g | |||||||||||||||
Net investment income | 0.83% | 0.78% | 0.89% | 1.05% | c | 0.80% | 0.83% | |||||||||||||||||
Supplemental data | ||||||||||||||||||||||||
Net assets, end of period (000’s) | $2,464,095 | $2,634,455 | $1,700,993 | $1,247,825 | $1,163,362 | $1,107,887 | ||||||||||||||||||
Portfolio turnover rate | 2.50% | h | 6.05% | h | 5.60% | 7.53% | 5.05% | 1.50% | ||||||||||||||||
aThe amount shown for a share outstanding throughout the period may not correlate with the Statement of Operations for the period due to the timing of sales and repurchases of the Fund’s shares in relation to income earned and/or fluctuating fair value of the investments of the Fund.
bBased on average daily shares outstanding.
cNet investment income per share includes approximately $0.10 per share related to income received in the form of special dividends in connection with certain Fund holdings. Excluding this amount, the ratio of net investment income to average net assets would have been 0.92%.
dTotal return is not annualized for periods less than one year.
eRatios are annualized for periods less than one year.
fBenefit of expense reduction rounds to less than 0.01%.
gBenefit of waiver and payments by affiliates rounds to less than 0.01%.
hExcludes the value of portfolio securities delivered as a result of a redemption in-kind. See Note 11.
| franklintempleton.com | The accompanying notes are an integral part of these financial statements. | Semiannual Report | 47 | ||||
FRANKLIN CUSTODIAN FUNDS
FINANCIAL HIGHLIGHTS
Franklin Growth Fund(continued)
| Six Months Ended March 31, 2019 | Year Ended September 30, | |||||||||||||||||||||||
| (unaudited) | 2018 | 2017 | 2016 | 2015 | 2014 | |||||||||||||||||||
Advisor Class | ||||||||||||||||||||||||
Per share operating performance | ||||||||||||||||||||||||
(for a share outstanding throughout the period) | ||||||||||||||||||||||||
Net asset value, beginning of period | $107.95 | $91.90 | $78.80 | $72.67 | $70.75 | $59.66 | ||||||||||||||||||
Income from investment operationsa: | ||||||||||||||||||||||||
Net investment incomeb | 0.36 | 0.66 | 0.60 | 0.65 | c | 0.48 | 0.43 | |||||||||||||||||
Net realized and unrealized gains (losses) | (2.69 | ) | 18.23 | 15.61 | 8.56 | 1.79 | 11.08 | |||||||||||||||||
Total from investment operations | (2.33 | ) | 18.89 | 16.21 | 9.21 | 2.27 | 11.51 | |||||||||||||||||
Less distributions from: | ||||||||||||||||||||||||
Net investment income | (0.69 | ) | (0.59 | ) | (0.61 | ) | (0.71 | ) | (0.35 | ) | (0.42 | ) | ||||||||||||
Net realized gains | (1.04 | ) | (2.25 | ) | (2.50 | ) | (2.37 | ) | — | — | ||||||||||||||
Total distributions | (1.73 | ) | (2.84 | ) | (3.11 | ) | (3.08 | ) | (0.35 | ) | (0.42 | ) | ||||||||||||
Net asset value, end of period | $103.89 | $107.95 | $91.90 | $78.80 | $72.67 | $70.75 | ||||||||||||||||||
Total returnd | (2.11)% | 21.02% | 21.43% | 12.85% | 3.20% | 19.37% | ||||||||||||||||||
Ratios to average net assetse | ||||||||||||||||||||||||
Expenses before waiver and payments by affiliates | 0.57% | 0.58% | 0.63% | 0.63% | 0.63% | 0.65% | ||||||||||||||||||
Expenses net of waiver and payments by affiliatesf | 0.57% | g | 0.58% | g | 0.62% | 0.61% | 0.63% | g | 0.65% | g | ||||||||||||||
Net investment income | 0.74% | 0.66% | 0.72% | 0.88% | c | 0.63% | 0.65% | |||||||||||||||||
Supplemental data | ||||||||||||||||||||||||
Net assets, end of period (000’s) | $3,072,453 | $3,139,208 | $2,801,153 | $1,998,483 | $1,514,492 | $1,414,980 | ||||||||||||||||||
Portfolio turnover rate | 2.50% | h | 6.05% | h | 5.60% | 7.53% | 5.05% | 1.50% | ||||||||||||||||
aThe amount shown for a share outstanding throughout the period may not correlate with the Statement of Operations for the period due to the timing of sales and repurchases of the Fund’s shares in relation to income earned and/or fluctuating fair value of the investments of the Fund.
bBased on average daily shares outstanding.
cNet investment income per share includes approximately $0.10 per share related to income received in the form of special dividends in connection with certain Fund holdings. Excluding this amount, the ratio of net investment income to average net assets would have been 0.75%.
dTotal return is not annualized for periods less than one year.
eRatios are annualized for periods less than one year.
fBenefit of expense reduction rounds to less than 0.01%.
gBenefit of waiver and payments by affiliates rounds to less than 0.01%.
hExcludes the value of portfolio securities delivered as a result of a redemption in-kind. See Note 11.
| 48 | Semiannual Report | The accompanying notes are an integral part of these financial statements. | franklintempleton.com | ||
FRANKLIN CUSTODIAN FUNDS
Statement of Investments, March 31, 2019 (unaudited)
Franklin Growth Fund
| Country | Shares | Value | ||||||||||
Common Stocks 98.1% | ||||||||||||
Automobiles & Components 0.4% | ||||||||||||
BorgWarner Inc. | United States | 1,633,318 | $ | 62,735,744 | ||||||||
Banks 0.2% | ||||||||||||
Wells Fargo & Co. | United States | 742,417 | 35,873,591 | |||||||||
Capital Goods 15.0% | ||||||||||||
3M Co. | United States | 846,356 | 175,855,850 | |||||||||
Allegion PLC | United States | 692,923 | 62,855,045 | |||||||||
AMETEK Inc. | United States | 692,923 | 57,491,821 | |||||||||
The Boeing Co. | United States | 1,088,879 | 415,320,228 | |||||||||
BWX Technologies Inc. | United States | 1,689,412 | 83,761,047 | |||||||||
Caterpillar Inc. | United States | 544,440 | 73,766,176 | |||||||||
Deere & Co. | United States | 494,945 | 79,112,009 | |||||||||
Emerson Electric Co. | United States | 1,088,879 | 74,555,545 | |||||||||
Fortive Corp. | United States | 519,692 | 43,596,962 | |||||||||
General Dynamics Corp. | United States | 989,889 | 167,568,410 | |||||||||
Huntington Ingalls Industries Inc. | United States | 296,967 | 61,531,562 | |||||||||
Illinois Tool Works Inc. | United States | 989,889 | 142,078,768 | |||||||||
Ingersoll-Rand PLC | United States | 1,088,879 | 117,544,488 | |||||||||
Lockheed Martin Corp. | United States | 494,945 | 148,562,691 | |||||||||
Northrop Grumman Corp. | United States | 1,088,879 | 293,561,779 | |||||||||
Raytheon Co. | United States | 593,934 | 108,143,503 | |||||||||
Stanley Black & Decker Inc. | United States | 745,329 | 101,491,450 | |||||||||
United Technologies Corp. | United States | 1,050,607 | 135,412,736 | |||||||||
| 2,342,210,070 | ||||||||||||
Commercial & Professional Services 2.9% | ||||||||||||
Equifax Inc. | United States | 544,440 | 64,516,140 | |||||||||
aIHS Markit Ltd. | United States | 3,520,639 | 191,452,349 | |||||||||
Verisk Analytics Inc. | United States | 1,484,834 | 197,482,922 | |||||||||
| 453,451,411 | ||||||||||||
Consumer Durables & Apparel 1.0% | ||||||||||||
NIKE Inc., B | United States | 1,860,992 | 156,714,136 | |||||||||
Consumer Services 0.9% | ||||||||||||
Carnival Corp. | United States | 1,187,867 | 60,248,614 | |||||||||
Graham Holdings Co., B | United States | 79,192 | 54,102,391 | |||||||||
Marriott International Inc., A | United States | 197,979 | 24,765,193 | |||||||||
| 139,116,198 | ||||||||||||
Diversified Financials 3.4% | ||||||||||||
American Express Co. | United States | 593,934 | 64,916,986 | |||||||||
aBerkshire Hathaway Inc., A | United States | 183 | 55,122,345 | |||||||||
BlackRock Inc. | United States | 222,726 | 95,186,411 | |||||||||
The Charles Schwab Corp. | United States | 2,969,667 | 126,982,961 | |||||||||
Intercontinental Exchange Inc. | United States | 1,385,845 | 105,518,238 | |||||||||
T. Rowe Price Group Inc. | United States | 890,901 | 89,197,008 | |||||||||
| 536,923,949 | ||||||||||||
Energy 1.0% | ||||||||||||
Cabot Oil & Gas Corp., A | United States | 3,365,622 | 87,842,734 | |||||||||
Concho Resources Inc. | United States | 593,934 | 65,902,917 | |||||||||
| 153,745,651 |
| franklintempleton.com | Semiannual Report | 49 |
FRANKLIN CUSTODIAN FUNDS
STATEMENT OF INVESTMENTS (UNAUDITED)
Franklin Growth Fund(continued)
| Country | Shares | Value | ||||||||||
| Common Stocks(continued) | ||||||||||||
Food, Beverage & Tobacco 3.1% | ||||||||||||
Brown-Forman Corp., B | United States | 1,608,570 | $ | 84,900,325 | ||||||||
Constellation Brands Inc., A | United States | 544,440 | 95,456,665 | |||||||||
Mondelez International Inc., A | United States | 1,484,834 | 74,122,913 | |||||||||
aMonster Beverage Corp. | United States | 2,672,700 | 145,875,966 | |||||||||
PepsiCo Inc. | United States | 643,429 | 78,852,224 | |||||||||
| 479,208,093 | ||||||||||||
Health Care Equipment & Services 7.8% | ||||||||||||
Abbott Laboratories | United States | 1,336,351 | 106,827,899 | |||||||||
aABIOMED Inc. | United States | 197,979 | 56,540,823 | |||||||||
Baxter International Inc. | United States | 395,957 | 32,195,264 | |||||||||
Becton, Dickinson and Co. | United States | 76,915 | 19,207,983 | |||||||||
aCentene Corp. | United States | 533,856 | 28,347,753 | |||||||||
Danaher Corp. | United States | 1,039,384 | 137,219,476 | |||||||||
aEdwards Lifesciences Corp. | United States | 395,957 | 75,758,453 | |||||||||
aHaemonetics Corp. | United States | 989,889 | 86,595,490 | |||||||||
a Intuitive Surgical Inc. | United States | 445,451 | 254,165,431 | |||||||||
aLaboratory Corp. of America Holdings | United States | 494,945 | 75,716,686 | |||||||||
Quest Diagnostics Inc. | United States | 890,901 | 80,109,818 | |||||||||
Stryker Corp. | United States | 395,957 | 78,209,427 | |||||||||
Teleflex Inc. | United States | 494,945 | 149,552,581 | |||||||||
aVarian Medical Systems Inc. | United States | 296,967 | 42,086,163 | |||||||||
| 1,222,533,247 | ||||||||||||
Insurance 0.4% | ||||||||||||
Aflac Inc. | United States | 1,187,867 | 59,393,350 | |||||||||
Materials 4.7% | ||||||||||||
Air Products and Chemicals Inc. | United States | 494,945 | 94,514,697 | |||||||||
Albemarle Corp. | United States | 544,440 | 44,633,191 | |||||||||
aAxalta Coating Systems Ltd. | United States | 3,365,622 | 84,847,331 | |||||||||
Celanese Corp. | United States | 1,237,362 | 122,016,267 | |||||||||
Ecolab Inc. | United States | 910,699 | 160,774,802 | |||||||||
International Flavors & Fragrances Inc. | United States | 400,000 | 51,516,000 | |||||||||
Linde PLC | United Kingdom | 569,187 | 100,137,069 | |||||||||
Martin Marietta Materials Inc. | United States | 395,957 | 79,658,629 | |||||||||
| 738,097,986 | ||||||||||||
Media & Entertainment 5.9% | ||||||||||||
a Alphabet Inc., A | United States | 163,333 | 192,224,974 | |||||||||
a Alphabet Inc., C | United States | 156,831 | 184,011,381 | |||||||||
Cable One Inc. | United States | 79,192 | 77,717,445 | |||||||||
Comcast Corp., A | United States | 795,018 | 31,784,820 | |||||||||
a Electronic Arts Inc. | United States | 593,934 | 60,361,512 | |||||||||
aFacebook Inc., A | United States | 750,000 | 125,017,500 | |||||||||
aIAC/InterActiveCorp | United States | 296,967 | 62,395,736 | |||||||||
The Walt Disney Co. | United States | 1,706,856 | 189,512,222 | |||||||||
| 923,025,590 | ||||||||||||
Pharmaceuticals, Biotechnology & Life Sciences 12.9% | ||||||||||||
AbbVie Inc. | United States | 455,350 | 36,696,657 | |||||||||
Agilent Technologies Inc. | United States | 1,286,856 | 103,437,485 | |||||||||
Amgen Inc. | United States | 989,889 | 188,059,112 | |||||||||
AstraZeneca PLC, ADR | United Kingdom | 1,979,778 | 80,042,425 | |||||||||
aBiogen Inc. | United States | 494,945 | 116,995,099 |
| 50 | Semiannual Report | franklintempleton.com | ||
FRANKLIN CUSTODIAN FUNDS
STATEMENT OF INVESTMENTS (UNAUDITED)
Franklin Growth Fund(continued)
| Country | Shares | Value | ||||||||||
| Common Stocks(continued) | ||||||||||||
Pharmaceuticals, Biotechnology & Life Sciences(continued) | ||||||||||||
a Catalent Inc. | United States | 3,365,622 | $ | 136,610,597 | ||||||||
aCelgene Corp. | United States | 840,000 | 79,245,600 | |||||||||
aElanco Animal Health Inc. | United States | 1,487,105 | 47,691,457 | |||||||||
Eli Lilly & Co. | United States | 1,240,175 | 160,925,108 | |||||||||
Gilead Sciences Inc. | United States | 643,429 | 41,829,319 | |||||||||
aIllumina Inc. | United States | 519,692 | 161,463,108 | |||||||||
Johnson & Johnson | United States | 1,187,967 | 166,065,907 | |||||||||
Merck & Co. Inc. | United States | 989,889 | 82,329,068 | |||||||||
aMettler-Toledo International Inc. | United States | 420,704 | 304,168,992 | |||||||||
aNeurocrine Biosciences Inc. | United States | 494,945 | 43,604,655 | |||||||||
Pfizer Inc. | United States | 2,733,084 | 116,074,077 | |||||||||
aWaters Corp. | United States | 618,682 | 155,728,446 | |||||||||
| 2,020,967,112 | ||||||||||||
Real Estate 1.8% | ||||||||||||
American Tower Corp. | United States | 993,772 | 195,832,710 | |||||||||
Equinix Inc. | United States | 198,755 | 90,067,816 | |||||||||
| 285,900,526 | ||||||||||||
Retailing 4.8% | ||||||||||||
a Alibaba Group Holding Ltd., ADR | China | 475,544 | 86,763,003 | |||||||||
aAmazon.com Inc. | United States | 346,462 | 616,962,206 | |||||||||
Expedia Group Inc. | United States | 346,462 | 41,228,978 | |||||||||
| 744,954,187 | ||||||||||||
Semiconductors & Semiconductor Equipment 3.2% | ||||||||||||
ASML Holding NV, N.Y. shs | Netherlands | 643,429 | 120,996,824 | |||||||||
Intel Corp. | United States | 1,088,879 | 58,472,802 | |||||||||
Lam Research Corp. | United States | 29,697 | 5,316,060 | |||||||||
Monolithic Power Systems | United States | 445,451 | 60,354,156 | |||||||||
NVIDIA Corp. | United States | 500,000 | 89,780,000 | |||||||||
Texas Instruments Inc. | United States | 1,385,845 | 146,996,579 | |||||||||
Versum Materials Inc. | United States | 247,473 | 12,450,367 | |||||||||
| 494,366,788 | ||||||||||||
Software & Services 13.0% | ||||||||||||
a Adobe Inc. | United States | 150,000 | 39,973,500 | |||||||||
aAdyen NV | Netherlands | 59,592 | 46,667,753 | |||||||||
aAutodesk Inc. | United States | 791,912 | 123,395,728 | |||||||||
Automatic Data Processing Inc. | United States | 692,923 | 110,687,520 | |||||||||
DXC Technology Co. | United States | 1,385,845 | 89,123,692 | |||||||||
Intuit Inc. | United States | 989,889 | 258,766,883 | |||||||||
Mastercard Inc., A | United States | 1,385,845 | 326,297,205 | |||||||||
Microsoft Corp. | United States | 3,365,622 | 396,941,459 | |||||||||
aSalesforce.com Inc. | United States | 544,440 | 86,222,963 | |||||||||
aServiceNow Inc. | United States | 989,889 | 243,997,740 | |||||||||
aTwilio Inc., A | United States | 397,509 | 51,350,213 | |||||||||
aTyler Technologies Inc. | United States | 173,232 | 35,408,621 | |||||||||
Visa Inc., A | United States | 1,385,845 | 216,455,130 | |||||||||
| 2,025,288,407 | ||||||||||||
Technology Hardware & Equipment 9.0% | ||||||||||||
Amphenol Corp., A | United States | 894,395 | 84,466,664 | |||||||||
Apple Inc. | United States | 4,044,686 | 768,288,106 | |||||||||
Cisco Systems Inc. | United States | 2,915,223 | 157,392,890 |
| franklintempleton.com | Semiannual Report | 51 |
FRANKLIN CUSTODIAN FUNDS
STATEMENT OF INVESTMENTS (UNAUDITED)
Franklin Growth Fund(continued)
| Country | Shares | Value | ||||||||||
| Common Stocks(continued) | ||||||||||||
Technology Hardware & Equipment(continued) | ||||||||||||
Cognex Corp. | United States | 841,406 | $ | 42,793,909 | ||||||||
aKeysight Technologies Inc. | United States | 643,429 | 56,107,009 | |||||||||
TE Connectivity Ltd. | United States | 1,633,318 | 131,890,428 | |||||||||
aTrimble Inc. | United States | 2,672,700 | 107,977,080 | |||||||||
aViaSat Inc. | United States | 692,923 | 53,701,532 | |||||||||
| 1,402,617,618 | ||||||||||||
Transportation 5.6% | ||||||||||||
Alaska Air Group Inc. | United States | 3,167,645 | 177,768,237 | |||||||||
Canadian National Railway Co. | Canada | 989,889 | 88,575,268 | |||||||||
Canadian Pacific Railway Ltd. | Canada | 494,945 | 101,973,518 | |||||||||
J.B. Hunt Transport Services Inc. | United States | 494,945 | 50,132,979 | |||||||||
Kansas City Southern | United States | 742,417 | 86,105,524 | |||||||||
aLyft Inc., A | United States | 301,800 | 23,627,922 | |||||||||
aRyanair Holdings PLC, ADR | Ireland | 230,863 | 17,300,873 | |||||||||
Union Pacific Corp. | United States | 2,009,475 | 335,984,220 | |||||||||
| 881,468,541 | ||||||||||||
Utilities 1.1% | ||||||||||||
American Water Works Co. Inc. | United States | 692,923 | 72,244,152 | |||||||||
NextEra Energy Inc. | United States | 494,945 | 95,682,767 | |||||||||
| 167,926,919 | ||||||||||||
Total Common Stocks (Cost $5,244,022,280) | 15,326,519,114 | |||||||||||
Management Investment Companies (Cost $10,045,554) 0.8% | ||||||||||||
Diversified Financials 0.8% | ||||||||||||
aAltaba Inc. | United States | 1,682,811 | 124,729,951 | |||||||||
Total Investments before Short Term Investments (Cost $5,254,067,834) | 15,451,249,065 | |||||||||||
Short Term Investments (Cost $199,173,181) 1.3% | ||||||||||||
Money Market Funds 1.3% | ||||||||||||
b,c Institutional Fiduciary Trust Money Market Portfolio, 2.10% | United States | 199,173,181 | 199,173,181 | |||||||||
Total Investments (Cost $5,453,241,015) 100.2% | 15,650,422,246 | |||||||||||
Other Assets, less Liabilities (0.2)% | (32,355,955 | ) | ||||||||||
Net Assets 100.0% | $ | 15,618,066,291 | ||||||||||
See Abbreviations on page 122.
aNon-income producing.
bSee Note 3(f) regarding investments in affiliated management investment companies.
cThe rate shown is the annualized seven-day effective yield at period end.
| 52 | Semiannual Report | The accompanying notes are an integral part of these financial statements. | franklintempleton.com | ||
FRANKLIN CUSTODIAN FUNDS
Financial Highlights
Franklin Income Fund
| Six Months Ended March 31, 2019 (unaudited) | Year Ended September 30, 2018a | |||||||
Class A | ||||||||
| Per share operating performance (for a share outstanding throughout the period) | ||||||||
Net asset value, beginning of period | $2.32 | $2.31 | ||||||
Income from investment operationsb: | ||||||||
Net investment income (loss)c | 0.04 | (0.04 | ) | |||||
Net realized and unrealized gains (losses) | 0.01 | 0.05 | ||||||
Total from investment operations | 0.05 | 0.01 | ||||||
Less distributions from net investment income | (0.06 | ) | — | |||||
Net asset value, end of period | $2.31 | $2.32 | ||||||
Total returnd | 2.20% | 0.43% | ||||||
Ratios to average net assetse | ||||||||
Expensesf | 0.72% | 0.71% | ||||||
Net investment income | 4.04% | 3.89% | ||||||
Supplemental data | ||||||||
Net assets, end of period (000’s) | $5,144,250 | $107,057 | ||||||
Portfolio turnover rate | 21.39% | 49.95% | ||||||
aFor the period September 10, 2018 (effective date) to September 30, 2018.
bThe amount shown for a share outstanding throughout the period may not correlate with the Statement of Operations for the period due to the timing of sales and repurchases of the Fund’s shares in relation to income earned and/or fluctuating fair value of the investments of the Fund.
cBased on average daily shares outstanding.
dTotal return does not reflect sales commissions or contingent deferred sales charges, if applicable, and is not annualized for periods less than one year.
eRatios are annualized for periods less than one year.
fBenefit of waiver and payments by affiliates and expense reduction rounds to less than 0.01%.
| franklintempleton.com | The accompanying notes are an integral part of these financial statements. | Semiannual Report | 53 | ||||
FRANKLIN CUSTODIAN FUNDS
FINANCIAL HIGHLIGHTS
Franklin Income Fund(continued)
| Six Months Ended March 31, 2019 | Year Ended September 30, | |||||||||||||||||||||||
| (unaudited) | 2018 | 2017 | 2016 | 2015 | 2014 | |||||||||||||||||||
Class A1 | ||||||||||||||||||||||||
Per share operating performance (for a share outstanding throughout the period) | ||||||||||||||||||||||||
Net asset value, beginning of period | $2.32 | $2.39 | $2.25 | $2.10 | $2.48 | $2.33 | ||||||||||||||||||
Income from investment operationsa: | ||||||||||||||||||||||||
Net investment incomeb | 0.05 | 0.09 | 0.10 | 0.10 | 0.10 | 0.11 | ||||||||||||||||||
Net realized and unrealized gains (losses) | 0.01 | (0.04 | ) | 0.16 | 0.17 | (0.36 | ) | 0.16 | ||||||||||||||||
Total from investment operations | 0.06 | 0.05 | 0.26 | 0.27 | (0.26 | ) | 0.27 | |||||||||||||||||
Less distributions from net investment income | (0.06 | ) | (0.12 | ) | (0.12 | ) | (0.12 | ) | (0.12 | ) | (0.12 | ) | ||||||||||||
Net asset value, end of period | $2.32 | $2.32 | $2.39 | $2.25 | $2.10 | $2.48 | ||||||||||||||||||
Total returnc | 2.70% | 2.18% | 11.86% | 13.31% | (10.93)% | 11.86% | ||||||||||||||||||
Ratios to average net assetsd | ||||||||||||||||||||||||
Expenses before waiver and payments by affiliates | 0.62% | 0.61% | 0.62% | 0.61% | 0.61% | 0.61% | ||||||||||||||||||
Expenses net of waiver and payments by affiliatese | 0.62% | f | 0.61% | f | 0.61% | 0.61% | f | 0.61% | f | 0.61% | f | |||||||||||||
Net investment income | 4.14% | 3.99% | 4.22% | 4.57% | 4.43% | 4.28% | ||||||||||||||||||
Supplemental data | ||||||||||||||||||||||||
Net assets, end of period (000’s) | $41,201,270 | $42,929,573 | $46,505,632 | $45,515,127 | $44,886,127 | $53,823,921 | ||||||||||||||||||
Portfolio turnover rate | 21.39% | 49.95% | 34.12% | 61.26% | 44.81% | 36.03% | ||||||||||||||||||
aThe amount shown for a share outstanding throughout the period may not correlate with the Statement of Operations for the period due to the timing of sales and repurchases of the Fund’s shares in relation to income earned and/or fluctuating fair value of the investments of the Fund.
bBased on average daily shares outstanding.
cTotal return does not reflect sales commissions or contingent deferred sales charges, if applicable, and is not annualized for periods less than one year.
dRatios are annualized for periods less than one year.
eBenefit of expense reduction rounds to less than 0.01%.
fBenefit of waiver and payments by affiliates rounds to less than 0.01%.
| 54 | Semiannual Report | The accompanying notes are an integral part of these financial statements. | franklintempleton.com | ||
FRANKLIN CUSTODIAN FUNDS
FINANCIAL HIGHLIGHTS
Franklin Income Fund(continued)
| Six Months Ended March 31, 2019 | Year Ended September 30, | |||||||||||||||||||||||
| (unaudited) | 2018 | 2017 | 2016 | 2015 | 2014 | |||||||||||||||||||
Class C | ||||||||||||||||||||||||
Per share operating performance | ||||||||||||||||||||||||
(for a share outstanding throughout the period) | ||||||||||||||||||||||||
Net asset value, beginning of period | $2.35 | $2.42 | $2.27 | $2.13 | $2.50 | $2.35 | ||||||||||||||||||
Income from investment operationsa: | ||||||||||||||||||||||||
Net investment incomeb | 0.04 | 0.08 | 0.09 | 0.09 | 0.09 | 0.09 | ||||||||||||||||||
Net realized and unrealized gains (losses) | 0.01 | (0.04 | ) | 0.17 | 0.16 | (0.35 | ) | 0.17 | ||||||||||||||||
Total from investment operations | 0.05 | 0.04 | 0.26 | 0.25 | (0.26 | ) | 0.26 | |||||||||||||||||
Less distributions from net investment income | (0.05 | ) | (0.11 | ) | (0.11 | ) | (0.11 | ) | (0.11 | ) | (0.11 | ) | ||||||||||||
Net asset value, end of period | $2.35 | $2.35 | $2.42 | $2.27 | $2.13 | $2.50 | ||||||||||||||||||
Total returnc | 2.39% | 1.61% | 11.63% | 12.07% | (10.89)% | 11.19% | ||||||||||||||||||
Ratios to average net assetsd | ||||||||||||||||||||||||
Expenses before waiver and payments by affiliates | 1.12% | 1.11% | 1.12% | 1.11% | 1.11% | 1.11% | ||||||||||||||||||
Expenses net of waiver and payments by affiliatese | 1.12%f | 1.11%f | 1.11% | 1.11%f | 1.11%f | 1.11%f | ||||||||||||||||||
Net investment income | 3.64% | 3.49% | 3.72% | 4.07% | 3.93% | 3.78% | ||||||||||||||||||
Supplemental data | ||||||||||||||||||||||||
Net assets, end of period (000’s) | $15,051,863 | $19,895,441 | $23,036,875 | $23,841,466 | $24,091,638 | $28,802,209 | ||||||||||||||||||
Portfolio turnover rate | 21.39% | 49.95% | 34.12% | 61.26% | 44.81% | 36.03% | ||||||||||||||||||
aThe amount shown for a share outstanding throughout the period may not correlate with the Statement of Operations for the period due to the timing of sales and repurchases of the Fund’s shares in relation to income earned and/or fluctuating fair value of the investments of the Fund.
bBased on average daily shares outstanding.
cTotal return does not reflect sales commissions or contingent deferred sales charges, if applicable, and is not annualized for periods less than one year.
dRatios are annualized for periods less than one year.
eBenefit of expense reduction rounds to less than 0.01%.
fBenefit of waiver and payments by affiliates rounds to less than 0.01%.
| franklintempleton.com | The accompanying notes are an integral part of these financial statements. | Semiannual Report | 55 | ||||
FRANKLIN CUSTODIAN FUNDS
FINANCIAL HIGHLIGHTS
Franklin Income Fund(continued)
| Six Months Ended March 31, 2019 | Year Ended September 30, | |||||||||||||||||||||||
| (unaudited) | 2018 | 2017 | 2016 | 2015 | 2014 | |||||||||||||||||||
Class R | ||||||||||||||||||||||||
Per share operating performance | ||||||||||||||||||||||||
(for a share outstanding throughout the period) | ||||||||||||||||||||||||
Net asset value, beginning of period | $2.28 | $2.35 | $2.21 | $2.07 | $2.44 | $2.29 | ||||||||||||||||||
Income from investment operationsa: | ||||||||||||||||||||||||
Net investment incomeb | 0.04 | 0.08 | 0.09 | 0.09 | 0.10 | 0.10 | ||||||||||||||||||
Net realized and unrealized gains (losses) | 0.02 | (0.04 | ) | 0.16 | 0.16 | (0.36 | ) | 0.16 | ||||||||||||||||
Total from investment operations | 0.06 | 0.04 | 0.25 | 0.25 | (0.26 | ) | 0.26 | |||||||||||||||||
Less distributions from net investment income | (0.06 | ) | (0.11 | ) | (0.11 | ) | (0.11 | ) | (0.11 | ) | (0.11 | ) | ||||||||||||
Net asset value, end of period | $2.28 | $2.28 | $2.35 | $2.21 | $2.07 | $2.44 | ||||||||||||||||||
Total returnc | 2.55% | 1.86% | 11.67% | 12.62% | (10.99)% | 11.66% | ||||||||||||||||||
Ratios to average net assetsd | ||||||||||||||||||||||||
Expenses before waiver and payments by affiliates | 0.97% | 0.96% | 0.97% | 0.96% | 0.96% | 0.96% | ||||||||||||||||||
Expenses net of waiver and payments by affiliatese | 0.97%f | 0.96%f | 0.96% | 0.96%f | 0.96%f | 0.96%f | ||||||||||||||||||
Net investment income | 3.79% | 3.64% | 3.87% | 4.22% | 4.08% | 3.93% | ||||||||||||||||||
Supplemental data | ||||||||||||||||||||||||
Net assets, end of period (000’s) | $278,372 | $296,098 | $361,603 | $396,107 | $416,653 | $514,892 | ||||||||||||||||||
Portfolio turnover rate | 21.39% | 49.95% | 34.12% | 61.26% | 44.81% | 36.03% | ||||||||||||||||||
aThe amount shown for a share outstanding throughout the period may not correlate with the Statement of Operations for the period due to the timing of sales and repurchases of the Fund’s shares in relation to income earned and/or fluctuating fair value of the investments of the Fund.
bBased on average daily shares outstanding.
cTotal return is not annualized for periods less than one year.
dRatios are annualized for periods less than one year.
eBenefit of expense reduction rounds to less than 0.01%.
fBenefit of waiver and payments by affiliates rounds to less than 0.01%.
| 56 | Semiannual Report | The accompanying notes are an integral part of these financial statements. | franklintempleton.com | ||
FRANKLIN CUSTODIAN FUNDS
FINANCIAL HIGHLIGHTS
Franklin Income Fund(continued)
| Six Months Ended March 31, 2019 | Year Ended September 30, | |||||||||||||||||||||
| (unaudited) | 2018 | 2017 | 2016 | 2015 | 2014 | |||||||||||||||||
Class R6 | ||||||||||||||||||||||
Per share operating performance (for a share outstanding throughout the period) | ||||||||||||||||||||||
Net asset value, beginning of period | $2.30 | $2.37 | $2.23 | $2.09 | $2.46 | $2.31 | ||||||||||||||||
Income from investment operationsa: | ||||||||||||||||||||||
Net investment incomeb | 0.05 | 0.10 | 0.11 | 0.10 | 0.11 | 0.11 | ||||||||||||||||
Net realized and unrealized gains (losses) | 0.01 | (0.05 | ) | 0.15 | 0.16 | (0.35 | ) | 0.17 | ||||||||||||||
Total from investment operations | 0.06 | 0.05 | 0.26 | 0.26 | (0.24 | ) | 0.28 | |||||||||||||||
Less distributions from net investment income | (0.06 | ) | (0.12 | ) | (0.12) | (0.12 | ) | (0.13 | ) | (0.13 | ) | |||||||||||
Net asset value, end of period | $2.30 | $2.30 | $2.37 | $2.23 | $2.09 | $2.46 | ||||||||||||||||
Total returnc | 2.80% | 2.40% | 12.15% | 13.15% | (10.39)% | 12.19% | ||||||||||||||||
Ratios to average net assetsd | ||||||||||||||||||||||
Expenses before waiver and payments by affiliates | 0.40% | 0.39% | 0.39% | 0.38% | 0.38% | 0.38% | ||||||||||||||||
Expenses net of waiver and payments by affiliatese | 0.39% | 0.39% | f | 0.38% | 0.38% | f | 0.38% | f | 0.38% | f | ||||||||||||
Net investment income | 4.37% | 4.21% | 4.45% | 4.80% | 4.66% | 4.50% | ||||||||||||||||
Supplemental data | ||||||||||||||||||||||
Net assets, end of period (000’s) | $1,954,178 | $2,062,334 | $1,815,977 | $1,737,577 | $1,744,718 | $2,108,076 | ||||||||||||||||
Portfolio turnover rate | 21.39% | 49.95% | 34.12% | 61.26% | 44.81% | 36.03% | ||||||||||||||||
aThe amount shown for a share outstanding throughout the period may not correlate with the Statement of Operations for the period due to the timing of sales and repurchases of the Fund’s shares in relation to income earned and/or fluctuating fair value of the investments of the Fund.
bBased on average daily shares outstanding.
cTotal return is not annualized for periods less than one year.
dRatios are annualized for periods less than one year.
eBenefit of expense reduction rounds to less than 0.01%.
fBenefit of waiver and payments by affiliates rounds to less than 0.01%.
| franklintempleton.com | The accompanying notes are an integral part of these financial statements. | Semiannual Report | 57 | ||||
FRANKLIN CUSTODIAN FUNDS
FINANCIAL HIGHLIGHTS
Franklin Income Fund(continued)
| Six Months Ended March 31, 2019 | Year Ended September 30, | |||||||||||||||||||||
| (unaudited) | 2018 | 2017 | 2016 | 2015 | 2014 | |||||||||||||||||
Advisor Class | ||||||||||||||||||||||
Per share operating performance (for a share outstanding throughout the period) | ||||||||||||||||||||||
Net asset value, beginning of period | $2.30 | $2.37 | $2.23 | $2.09 | $2.46 | $2.31 | ||||||||||||||||
Income from investment operationsa: | ||||||||||||||||||||||
Net investment incomeb | 0.05 | 0.10 | 0.10 | 0.10 | 0.11 | 0.11 | ||||||||||||||||
Net realized and unrealized gains (losses) | 0.01 | (0.05 | ) | 0.16 | 0.16 | (0.36 | ) | 0.17 | ||||||||||||||
Total from investment operations | 0.06 | 0.05 | 0.26 | 0.26 | (0.25 | ) | 0.28 | |||||||||||||||
Less distributions from net investment income | (0.06 | ) | (0.12 | ) | (0.12) | (0.12 | ) | (0.12 | ) | (0.13 | ) | |||||||||||
Net asset value, end of period | $2.30 | $2.30 | $2.37 | $2.23 | $2.09 | $2.46 | ||||||||||||||||
Total returnc | 2.78% | 2.34% | 12.09% | 13.06% | (10.46 | )% | 12.12% | |||||||||||||||
Ratios to average net assetsd | ||||||||||||||||||||||
Expenses before waiver and payments by affiliates | 0.47% | 0.46% | 0.47% | 0.46% | 0.46% | 0.46% | ||||||||||||||||
Expenses net of waiver and payments by affiliatese | 0.47% | f | 0.46% | f | 0.46% | 0.46% | f | 0.46% | f | 0.46% | f | |||||||||||
Net investment income | 4.29% | 4.14% | 4.37% | 4.72% | 4.58% | 4.43% | ||||||||||||||||
Supplemental data | ||||||||||||||||||||||
Net assets, end of period (000’s) | $11,402,689 | $11,328,761 | $11,671,173 | $8,143,479 | $7,754,475 | $9,096,269 | ||||||||||||||||
Portfolio turnover rate | 21.39% | 49.95% | 34.12% | 61.26% | 44.81% | 36.03% | ||||||||||||||||
aThe amount shown for a share outstanding throughout the period may not correlate with the Statement of Operations for the period due to the timing of sales and repurchases of the Fund’s shares in relation to income earned and/or fluctuating fair value of the investments of the Fund.
bBased on average daily shares outstanding.
cTotal return is not annualized for periods less than one year.
dRatios are annualized for periods less than one year.
eBenefit of expense reduction rounds to less than 0.01%.
fBenefit of waiver and payments by affiliates rounds to less than 0.01%.
| 58 | Semiannual Report | The accompanying notes are an integral part of these financial statements. | franklintempleton.com | ||
FRANKLIN CUSTODIAN FUNDS
Statement of Investments, March 31, 2019 (unaudited)
Franklin Income Fund
|
| Country
|
|
| Shares
|
|
| Value
|
| ||||||||||||||
Common Stocks 31.6% | ||||||||||||||||||||||
Communication Services 1.8% | ||||||||||||||||||||||
a,b | Alphabet Inc., A | United States | 182,000 | $ | 214,193,980 | |||||||||||||||||
| BCE Inc. | Canada | 5,500,000 | 244,307,209 | |||||||||||||||||||
Comcast Corp., A | United States | 2,254,000 | 90,114,920 | |||||||||||||||||||
Verizon Communications Inc. | United States | 14,000,000 | 827,820,000 | |||||||||||||||||||
|
1,376,436,109 |
| ||||||||||||||||||||
Consumer Discretionary 2.8% | ||||||||||||||||||||||
Daimler AG | Germany | 5,000,000 | 293,109,443 | |||||||||||||||||||
b | Ford Motor Co. | United States | 68,170,000 | 598,532,600 | ||||||||||||||||||
b | General Motors Co. | United States | 14,680,000 | 544,628,000 | ||||||||||||||||||
b | Target Corp. | United States | 7,913,732 | 635,156,130 | ||||||||||||||||||
|
2,071,426,173 |
| ||||||||||||||||||||
Consumer Staples 2.1% | ||||||||||||||||||||||
Anheuser-Busch InBev SA/NV, ADR | Belgium | 3,500,000 | 293,895,000 | |||||||||||||||||||
The Coca-Cola Co. | United States | 2,500,000 | 117,150,000 | |||||||||||||||||||
b | PepsiCo Inc. | United States | 4,500,000 | 551,475,000 | ||||||||||||||||||
b | Philip Morris International Inc. | United States | 2,501,700 | 221,125,263 | ||||||||||||||||||
b | The Procter & Gamble Co. | United States | 4,000,000 | 416,200,000 | ||||||||||||||||||
|
1,599,845,263 |
| ||||||||||||||||||||
Energy 4.6% | ||||||||||||||||||||||
Baker Hughes a GE Co., A | United States | 11,000,000 | 304,920,000 | |||||||||||||||||||
b | BP PLC, ADR | United Kingdom | 3,000,000 | 131,160,000 | ||||||||||||||||||
b | Chevron Corp. | United States | 3,000,000 | 369,540,000 | ||||||||||||||||||
Exxon Mobil Corp. | United States | 6,500,000 | 525,200,000 | |||||||||||||||||||
Halliburton Co. | United States | 9,347,018 | 273,867,628 | |||||||||||||||||||
Occidental Petroleum Corp. | United States | 4,000,000 | 264,800,000 | |||||||||||||||||||
Royal Dutch Shell PLC, A, ADR | United Kingdom | 13,500,000 | 844,965,000 | |||||||||||||||||||
Schlumberger Ltd. | United States | 5,000,000 | 217,850,000 | |||||||||||||||||||
a | Talos Energy Inc. | United States | 2,615,781 | 69,475,143 | ||||||||||||||||||
TransCanada Corp. | Canada | 4,500,000 | 202,230,000 | |||||||||||||||||||
The Williams Cos. Inc. | United States | 8,000,000 | 229,760,000 | |||||||||||||||||||
|
3,433,767,771 |
| ||||||||||||||||||||
Financials 4.6% | ||||||||||||||||||||||
AXA SA | France | 15,000,000 | 377,480,085 | |||||||||||||||||||
b | Bank of America Corp. | United States | 10,740,000 | 296,316,600 | ||||||||||||||||||
Barclays PLC | United Kingdom | 150,000,000 | 302,264,049 | |||||||||||||||||||
JPMorgan Chase & Co. | United States | 6,108,000 | 618,312,840 | |||||||||||||||||||
MetLife Inc. | United States | 5,145,000 | 219,022,650 | |||||||||||||||||||
Morgan Stanley | United States | 5,000,000 | 211,000,000 | |||||||||||||||||||
b | Wells Fargo & Co. | United States | 30,000,000 | 1,449,600,000 | ||||||||||||||||||
|
3,473,996,224 |
| ||||||||||||||||||||
Health Care 3.7% | ||||||||||||||||||||||
AstraZeneca PLC | United Kingdom | 7,500,000 | 599,427,832 | |||||||||||||||||||
Bristol-Myers Squibb Co. | United States | 4,000,000 | 190,840,000 | |||||||||||||||||||
CVS Health Corp. | United States | 2,000,000 | 107,860,000 | |||||||||||||||||||
Johnson & Johnson | United States | 3,000,000 | 419,370,000 | |||||||||||||||||||
b | Merck & Co. Inc. | United States | 10,000,000 | 831,700,000 | ||||||||||||||||||
b | Pfizer Inc. | United States | 15,000,000 | 637,050,000 | ||||||||||||||||||
|
2,786,247,832 |
| ||||||||||||||||||||
| franklintempleton.com | Semiannual Report | 59 | ||
FRANKLIN CUSTODIAN FUNDS
STATEMENT OF INVESTMENTS (UNAUDITED)
Franklin Income Fund(continued)
|
| Country
|
|
| Shares
|
|
| Value
|
| ||||||||||||
Common Stocks(continued) | ||||||||||||||||||||
Industrials 1.4% | ||||||||||||||||||||
b | 3M Co. | United States | 1,500,000 | $ | 311,670,000 | |||||||||||||||
a | CEVA Logistics AG | Switzerland | 1,963,608 | 59,067,001 | ||||||||||||||||
b | Cummins Inc. | United States | 2,764,744 | 436,470,209 | ||||||||||||||||
General Electric Co. | United States | 22,853,833 | 228,309,792 | |||||||||||||||||
Wabtec Corp. | United States | 90,521 | 6,673,208 | |||||||||||||||||
|
1,042,190,210 |
| ||||||||||||||||||
Information Technology 1.4% | ||||||||||||||||||||
b | Apple Inc. | United States | 2,000,309 | 379,958,695 | ||||||||||||||||
b | Intel Corp. | United States | 4,750,000 | 255,075,000 | ||||||||||||||||
b | Texas Instruments Inc. | United States | 4,000,000 | 424,280,000 | ||||||||||||||||
|
1,059,313,695 |
| ||||||||||||||||||
Materials 2.8% | ||||||||||||||||||||
BASF SE | Germany | 11,000,000 | 808,735,234 | |||||||||||||||||
BHP Group PLC | United Kingdom | 5,000,000 | 120,413,180 | |||||||||||||||||
DowDuPont Inc. | United States | 8,000,000 | 426,480,000 | |||||||||||||||||
Newmont Mining Corp. | United States | 3,629,200 | 129,816,484 | |||||||||||||||||
b | Rio Tinto PLC, ADR | Australia | 9,971,530 | 586,824,540 | ||||||||||||||||
|
2,072,269,438 |
| ||||||||||||||||||
Real Estate 0.5% | ||||||||||||||||||||
Host Hotels & Resorts Inc. | United States | 20,000,000 | 378,000,000 | |||||||||||||||||
Utilities 5.9% | ||||||||||||||||||||
Dominion Energy Inc. | United States | 15,000,000 | 1,149,900,000 | |||||||||||||||||
b | Duke Energy Corp. | United States | 7,500,000 | 675,000,000 | ||||||||||||||||
b | Sempra Energy | United States | 8,148,800 | 1,025,607,968 | ||||||||||||||||
b | The Southern Co. | United States | 25,000,000 | 1,292,000,000 | ||||||||||||||||
Xcel Energy Inc. | United States | 5,000,000 | 281,050,000 | |||||||||||||||||
|
4,423,557,968 |
| ||||||||||||||||||
Total Common Stocks (Cost $20,705,760,688) |
|
23,717,050,683 |
| |||||||||||||||||
c | Equity-Linked Securities 12.1% | |||||||||||||||||||
Communication Services 1.1% | ||||||||||||||||||||
d | Goldman Sachs International into Alphabet Inc., 7.00%, A, 144A | United States | 285,000 | 328,246,617 | ||||||||||||||||
d | Goldman Sachs International into Comcast Corp., 7.00%, A, 144A | United States | 5,970,000 | 230,368,742 | ||||||||||||||||
d | Morgan Stanley BV into Comcast Corp., 7.00%, A, 144A | United States | 6,475,000 | 253,850,277 | ||||||||||||||||
d | Royal Bank of Canada into Alphabet Inc., 6.00%, A, 144A | Belgium | 24,100 | 28,850,342 | ||||||||||||||||
|
841,315,978 |
| ||||||||||||||||||
Consumer Discretionary 1.6% | ||||||||||||||||||||
d | Citigroup Global Markets Holdings Inc. into Amazon.com Inc., 9.00%, 144A | United States | 277,000 | 497,032,221 | ||||||||||||||||
d | Citigroup Global Markets Holdings Inc. into General Motors Co., 9.00%, 144A | United States | 8,350,000 | 314,509,530 | ||||||||||||||||
d | JP Morgan Chase Financial Co. LLC into Amazon.com Inc., 9.00%, 144A | United States | 171,000 | 300,074,361 | ||||||||||||||||
d | Wells Fargo Bank National Assn. into Ford Motor Co., 8.50%, 144A | United States | 12,500,000 | 112,408,400 | ||||||||||||||||
|
1,224,024,512 |
| ||||||||||||||||||
Energy 0.6% | ||||||||||||||||||||
d | JP Morgan Chase Financial Co. LLC into Schlumberger Ltd., 7.50%, 144A | United States | 4,170,000 | 186,714,323 | ||||||||||||||||
d | Wells Fargo Bank National Assn. into Anadarko Petroleum Corp., 9.00%, 144A | United States | 5,685,000 | 253,917,250 | ||||||||||||||||
|
440,631,573 |
| ||||||||||||||||||
| 60 | Semiannual Report | franklintempleton.com | ||
FRANKLIN CUSTODIAN FUNDS
STATEMENT OF INVESTMENTS (UNAUDITED)
Franklin Income Fund(continued)
|
| Country
|
|
| Shares
|
|
| Value
|
| ||||||||||||||||
| cEquity-Linked Securities(continued) | ||||||||||||||||||||||||
| Financials 1.6% | ||||||||||||||||||||||||
| dBarclays Bank PLC into Wells Fargo & Co., 6.50%, 144A | United States | 4,355,000 | $ | 213,896,335 | ||||||||||||||||||||
| dBarclays Bank PLC into MetLife Inc., 7.00%, 144A | United States | 5,339,000 | 229,790,224 | |||||||||||||||||||||
| dCitigroup Global Markets Holdings Inc. into MetLife Inc., 7.50%, 144A | United States | 5,575,000 | 234,195,486 | |||||||||||||||||||||
| dCredit Suisse AG into Bank of America Corp., 7.00%, 144A | United States | 10,400,000 | 291,104,757 | |||||||||||||||||||||
| dSociete Generale SA into JPMorgan Chase & Co., 7.00%, 144A | United States | 2,175,000 | 226,356,987 | |||||||||||||||||||||
|
1,195,343,789 |
| ||||||||||||||||||||||
| Health Care 0.3% | ||||||||||||||||||||||||
| dBarclays Bank PLC into Mylan NV, 7.50%, 144A | United States | 2,421,000 | 71,067,605 | |||||||||||||||||||||
| dCitigroup Global Markets Holdings Inc. into Medtronic PLC, 6.00%, 144A | United States | 1,882,000 | 165,446,788 | |||||||||||||||||||||
|
236,514,393 |
| ||||||||||||||||||||||
| Industrials 0.4% | ||||||||||||||||||||||||
| dMerrill Lynch International & Co. CV into Deere & Co., 9.00%, 144A | United States | 2,100,000 | 324,678,692 | |||||||||||||||||||||
| Information Technology 5.6% | ||||||||||||||||||||||||
| dBarclays Bank PLC into Analog Devices Inc., 7.00%, 144A | United States | 2,635,000 | 266,392,582 | |||||||||||||||||||||
| dCitigroup Global Markets Holdings Inc. into Texas Instruments Inc., 7.00%, 144A | United States | 1,600,000 | 171,333,538 | |||||||||||||||||||||
| dCredit Suisse AG into International Business Machines Corp., 9.50%, 144A | United States | 1,430,000 | 193,539,476 | |||||||||||||||||||||
| dGoldman Sachs International into Microsoft Corp., 6.50%, 144A | United States | 4,750,000 | 545,565,553 | |||||||||||||||||||||
dGoldman Sachs International into Texas Instruments Inc., 7.00%, 144A | United States | 2,312,000 | 250,851,494 | |||||||||||||||||||||
dJP Morgan Chase Financial Co. LLC into Broadcom Inc., 10.00%, 144A | United States | 1,120,000 | 307,564,580 | |||||||||||||||||||||
d,eMerrill Lynch International & Co. CV into Apple Inc., 7.50%, 144A | United States | 1,475,000 | 281,518,420 | |||||||||||||||||||||
dMerrill Lynch International & Co. CV into Apple Inc., 8.50%, 144A | United States | 1,725,000 | 319,642,596 | |||||||||||||||||||||
dMerrill Lynch International & Co. CV into Applied Materials Inc., 8.50%, 144A | United States | 6,750,000 | 260,456,749 | |||||||||||||||||||||
dMorgan Stanley BV into Lam Research Corp., 9.00%, 144A | United States | 1,530,000 | 259,143,742 | |||||||||||||||||||||
dMorgan Stanley BV into Microchip Technology Inc., 9.00%, 144A | United States | 3,325,000 | 260,994,961 | |||||||||||||||||||||
dMorgan Stanley BV into Microsoft Corp., 7.00%, 144A | United States | 3,521,000 | 383,672,258 | |||||||||||||||||||||
dRoyal Bank of Canada into Analog Devices Inc., 8.00%, 144A | United States | 2,230,000 | 218,828,433 | |||||||||||||||||||||
dUBS AG London into Microsoft Corp., 6.50%, 144A | United States | 550,000 | 63,115,587 | |||||||||||||||||||||
dWells Fargo Bank National Assn. into Intel Corp., 8.00%, 144A | United States | 2,880,000 | 155,710,659 | |||||||||||||||||||||
dWells Fargo Bank National Assn. into Intel Corp., 8.00%, 144A | United States | 5,200,000 | 269,103,291 | |||||||||||||||||||||
|
4,207,433,919 |
| ||||||||||||||||||||||
Materials 0.9% | ||||||||||||||||||||||||
| dBarclays Bank PLC into International Paper Co., 8.00%, 144A | United States | 3,125,000 | 147,784,334 | |||||||||||||||||||||
| d,eCredit Suisse AG into Rio Tinto PLC., 10.00%, 144A | Australia | 5,180,000 | 302,755,180 | |||||||||||||||||||||
| dMerrill Lynch International & Co. CV into DowDuPont Inc., 7.00%, 144A | United States | 3,560,000 | 195,711,264 | |||||||||||||||||||||
|
646,250,778 |
| ||||||||||||||||||||||
| Total Equity-Linked Securities (Cost $9,081,450,454) |
|
9,116,193,634 |
| |||||||||||||||||||||
| Convertible Preferred Stocks 1.2% | ||||||||||||||||||||||||
| Energy 0.1% | ||||||||||||||||||||||||
| Chesapeake Energy Corp., 5.75%, cvt. pfd. | United States | 112,980 | 64,629,728 | |||||||||||||||||||||
Financials 0.9% | ||||||||||||||||||||||||
| Bank of America Corp., 7.25%, cvt. pfd., L | United States | 435,218 | 566,597,258 | |||||||||||||||||||||
| aFNMA, 5.375%, cvt. pfd. | United States | 4,250 | 129,625,000 | |||||||||||||||||||||
|
696,222,258 |
| ||||||||||||||||||||||
Industrials 0.0%† | ||||||||||||||||||||||||
Fortive Corp., 5.00%, cvt. pfd., A | United States | 31,266 | 32,799,597 | |||||||||||||||||||||
| franklintempleton.com | Semiannual Report | 61 | ||
FRANKLIN CUSTODIAN FUNDS
STATEMENT OF INVESTMENTS (UNAUDITED)
Franklin Income Fund(continued)
|
| Country
|
|
| Shares
|
|
| Value
|
| ||||||||||
Convertible Preferred Stocks(continued) | ||||||||||||||||||
Utilities 0.2% | ||||||||||||||||||
Sempra Energy, 6.00%, cvt. pfd., A | United States | 400,000 | $ | 42,280,000 | ||||||||||||||
Sempra Energy, 6.75%, cvt. pfd., B | United States | 739,000 | 78,452,240 | |||||||||||||||
|
120,732,240 |
| ||||||||||||||||
Total Convertible Preferred Stocks (Cost $907,590,057) | 914,383,823 | |||||||||||||||||
| Preferred Stocks 0.3% | ||||||||||||||||||
Financials 0.3% | ||||||||||||||||||
a | FHLMC, 8.375%, pfd., Z | United States | 7,632,009 | 76,625,370 | ||||||||||||||
a | FNMA, 8.25%, pfd., S | United States | 5,500,000 | 56,815,000 | ||||||||||||||
a | JPMorgan Chase & Co., 6.00%, pfd., EE | United States | 3,000,000 | 79,410,000 | ||||||||||||||
Total Preferred Stocks (Cost $391,153,851) |
|
212,850,370 |
| |||||||||||||||
Units
| ||||||||||||||||||
f | Index-Linked Notes (Cost $100,105,450) 0.1% | |||||||||||||||||
Financials 0.1% | ||||||||||||||||||
d,g | Morgan Stanley Finance LLC, senior note, 144A, 4.90%, 10/03/19 | United States | 755,000 | 100,180,950 | ||||||||||||||
|
| Principal Amount
| *
| ||||||||||||||||
| Convertible Bonds 0.9% | ||||||||||||||||||
Energy 0.7% | ||||||||||||||||||
| Chesapeake Energy Corp., cvt., senior note, 5.50%, 9/15/26 | United States | 122,500,000 | 113,814,036 | |||||||||||||||
Weatherford International Ltd., cvt., senior note, 5.875%, 7/01/21 | United States | 505,000,000 | 410,300,152 | |||||||||||||||
|
524,114,188 |
| ||||||||||||||||
Health Care 0.2% | ||||||||||||||||||
d | Bayer Capital Corp. BV, cvt., junior sub. note, 144A, 5.625%, 11/22/19 | Germany | 150,000,000 | EUR | 120,316,518 | |||||||||||||
Total Convertible Bonds (Cost $721,116,346) | 644,430,706 | |||||||||||||||||
| Corporate Bonds 38.6% | ||||||||||||||||||
Communication Services 5.3% | ||||||||||||||||||
d | Altice Financing SA, secured bond, 144A, 7.50%, 5/15/26 | Luxembourg | 7,000,000 | 6,930,000 | ||||||||||||||
| AMC Entertainment Holdings Inc., | ||||||||||||||||||
senior sub. bond, 5.75%, 6/15/25 | United States | 37,325,000 | 35,031,379 | |||||||||||||||
senior sub. note, 5.875%, 11/15/26 | United States | 41,300,000 | 37,376,500 | |||||||||||||||
| AT&T Inc., | ||||||||||||||||||
senior bond, 4.125%, 2/17/26 | United States | 100,000,000 | 102,337,093 | |||||||||||||||
senior note, 3.00%, 6/30/22 | United States | 100,000,000 | 100,517,040 | |||||||||||||||
| CCO Holdings LLC/CCO Holdings Capital Corp., | ||||||||||||||||||
senior bond, 5.125%, 2/15/23 | United States | 105,000,000 | 107,100,000 | |||||||||||||||
senior bond, 5.75%, 9/01/23 | United States | 67,000,000 | 68,507,500 | |||||||||||||||
senior bond, 5.75%, 1/15/24 | United States | 105,000,000 | 108,018,750 | |||||||||||||||
dsenior bond, 144A, 5.50%, 5/01/26 | United States | 60,000,000 | 62,100,000 | |||||||||||||||
d senior bond, 144A, 5.125%, 5/01/27 | United States | 70,000,000 | 70,612,500 | |||||||||||||||
d senior bond, 144A, 5.00%, 2/01/28 | United States | 33,000,000 | 32,711,250 | |||||||||||||||
Comcast Corp., senior note, 3.95%, 10/15/25 | United States | 50,000,000 | 52,360,187 | |||||||||||||||
| DISH DBS Corp., | ||||||||||||||||||
senior bond, 5.875%, 7/15/22 | United States | 391,500,000 | 380,361,825 | |||||||||||||||
senior bond, 5.00%, 3/15/23 | United States | 300,000,000 | 271,125,000 | |||||||||||||||
senior note, 5.875%, 11/15/24 | United States | 128,200,000 | 108,168,750 | |||||||||||||||
| 62 | Semiannual Report | franklintempleton.com | ||
FRANKLIN CUSTODIAN FUNDS
STATEMENT OF INVESTMENTS (UNAUDITED)
Franklin Income Fund(continued)
|
| Country
|
|
| Principal Amount
| *
|
| Value
|
| ||||||||||||||
| Corporate Bonds(continued) | ||||||||||||||||||||||
| Communication Services(continued) | ||||||||||||||||||||||
Netflix Inc., | ||||||||||||||||||||||
senior bond, 4.375%, 11/15/26 | United States | 105,000,000 | $ | 103,162,500 | ||||||||||||||||||
senior bond, 4.875%, 4/15/28 | United States | 84,300,000 | 83,667,750 | |||||||||||||||||||
d senior bond, 144A, 5.875%, 11/15/28 | United States | 60,000,000 | 63,525,000 | |||||||||||||||||||
d senior bond, 144A, 6.375%, 5/15/29 | United States | 50,000,000 | 54,187,500 | |||||||||||||||||||
d | Sirius XM Radio Inc., | |||||||||||||||||||||
senior bond, 144A, 6.00%, 7/15/24 | United States | 24,500,000 | 25,480,000 | |||||||||||||||||||
senior note, 144A, 4.625%, 5/15/23 | United States | 88,400,000 | 89,836,500 | |||||||||||||||||||
Sprint Capital Corp., senior note, 6.90%, 5/01/19 | United States | 100,000,000 | 100,500,000 | |||||||||||||||||||
| Sprint Communications Inc., | ||||||||||||||||||||||
senior bond, 11.50%, 11/15/21 | United States | 200,000,000 | 232,500,000 | |||||||||||||||||||
senior note, 7.00%, 8/15/20 | United States | 102,500,000 | 106,087,500 | |||||||||||||||||||
senior note, 6.00%, 11/15/22 | United States | 367,700,000 | 371,487,310 | |||||||||||||||||||
| Sprint Corp., | ||||||||||||||||||||||
senior bond, 7.875%, 9/15/23 | United States | 187,350,000 | 197,185,875 | |||||||||||||||||||
senior bond, 7.125%, 6/15/24 | United States | 190,650,000 | 193,986,375 | |||||||||||||||||||
senior note, 7.625%, 3/01/26 | United States | 96,300,000 | 97,985,250 | |||||||||||||||||||
d | Sprint Spectrum Co. LLC, senior secured bond, first lien, 144A, 5.152%, 9/20/29 | United States | 220,000,000 | 224,417,182 | ||||||||||||||||||
d | Univision Communications Inc., | |||||||||||||||||||||
senior secured note, first lien, 144A, 5.125%, 5/15/23 | United States | 175,000,000 | 167,125,000 | |||||||||||||||||||
senior secured note, first lien, 144A, 5.125%, 2/15/25 | United States | 160,020,000 | 149,618,700 | |||||||||||||||||||
| Verizon Communications Inc., | ||||||||||||||||||||||
senior bond, 3.50%, 11/01/24 | United States | 50,000,000 | 51,254,446 | |||||||||||||||||||
senior bond, 2.625%, 8/15/26 | United States | 25,000,000 | 23,884,356 | |||||||||||||||||||
senior bond, 4.522%, 9/15/48 | United States | 5,000,000 | 5,146,189 | |||||||||||||||||||
d | Virgin Media Secured Finance PLC, senior secured bond, first lien, 144A, 5.50%, 1/15/25 | United Kingdom | 60,000,000 | 61,575,000 | ||||||||||||||||||
| Zayo Group LLC/Zayo Capital Inc., senior note, 6.00%, 4/01/23 | United States | 38,700,000 | 39,377,250 | |||||||||||||||||||
|
3,985,247,457 |
| ||||||||||||||||||||
| Consumer Discretionary 2.2% | ||||||||||||||||||||||
d | 24 Hour Holdings III LLC, senior note, 144A, 8.00%, 6/01/22 | United States | 150,959,000 | 151,713,795 | ||||||||||||||||||
| Alibaba Group Holding Ltd., senior note, 3.40%, 12/06/27 | China | 50,000,000 | 49,192,750 | |||||||||||||||||||
d | Allison Transmission Inc., senior bond, 144A, 5.875%, 6/01/29 | United States | 45,000,000 | 45,618,750 | ||||||||||||||||||
Ford Motor Co., | ||||||||||||||||||||||
senior bond, 4.75%, 1/15/43 | United States | 67,500,000 | 53,100,608 | |||||||||||||||||||
senior note, 4.346%, 12/08/26 | United States | 125,000,000 | 116,231,710 | |||||||||||||||||||
Ford Motor Credit Co. LLC, | ||||||||||||||||||||||
senior note, 3.336%, 3/18/21 | United States | 48,000,000 | 47,294,449 | |||||||||||||||||||
senior note, 4.134%, 8/04/25 | United States | 125,000,000 | 115,606,876 | |||||||||||||||||||
| General Motors Co., senior bond, 5.15%, 4/01/38 | United States | 165,000,000 | 151,236,284 | |||||||||||||||||||
| General Motors Financial Co. Inc., senior note, 4.15%, 6/19/23 | United States | 75,000,000 | 75,779,735 | |||||||||||||||||||
d | Golden Nugget Inc., senior note, 144A, 6.75%, 10/15/24 | United States | 60,000,000 | 60,450,000 | ||||||||||||||||||
d | Hanesbrands Inc., | |||||||||||||||||||||
senior bond, 144A, 4.875%, 5/15/26 | United States | 54,000,000 | 53,546,400 | |||||||||||||||||||
senior note, 144A, 4.625%, 5/15/24 | United States | 38,000,000 | 38,292,600 | |||||||||||||||||||
h | MGM Resorts International, senior note, 5.50%, 4/15/27 | United States | 75,000,000 | 76,312,500 | ||||||||||||||||||
d | Shea Homes LP/Shea Homes Funding Corp., | |||||||||||||||||||||
senior bond, 144A, 6.125%, 4/01/25 | United States | 105,500,000 | 101,016,250 | |||||||||||||||||||
senior note, 144A, 5.875%, 4/01/23 | United States | 100,975,000 | 99,965,250 |
| franklintempleton.com | Semiannual Report | 63 | ||
FRANKLIN CUSTODIAN FUNDS
STATEMENT OF INVESTMENTS (UNAUDITED)
Franklin Income Fund(continued)
| Country | | Principal Amount | * | Value | ||||||||||||||||||
Corporate Bonds(continued) | ||||||||||||||||||||||
| Consumer Discretionary(continued) | ||||||||||||||||||||||
d | Tesla Inc., senior note, 144A, 5.30%, 8/15/25 | United States | 60,000,000 | $ | 52,200,000 | |||||||||||||||||
d | Wynn Las Vegas LLC/Wynn Las Vegas Capital Corp., | |||||||||||||||||||||
senior bond, 144A, 4.25%, 5/30/23 | United States | 84,000,000 | 82,845,000 | |||||||||||||||||||
senior bond, 144A, 5.50%, 3/01/25 | United States | 147,500,000 | 146,025,000 | |||||||||||||||||||
senior bond, 144A, 5.25%, 5/15/27 | United States | 99,827,000 | 94,586,083 | |||||||||||||||||||
| 1,611,014,040 | ||||||||||||||||||||||
Consumer Staples 0.9% | ||||||||||||||||||||||
d | Anheuser-Busch Cos. LLC/Anheuser-Busch InBev Worldwide Inc., senior bond, 144A, 4.90%, 2/01/46 | Belgium | 25,000,000 | 25,161,691 | ||||||||||||||||||
| Anheuser-Busch InBev Worldwide Inc., senior bond, 4.00%, 4/13/28 | Belgium | 25,000,000 | 25,431,532 | |||||||||||||||||||
| BAT Capital Corp., | ||||||||||||||||||||||
senior note, 3.222%, 8/15/24 | United Kingdom | 88,500,000 | 86,634,320 | |||||||||||||||||||
senior note, 3.557%, 8/15/27 | United Kingdom | 170,000,000 | 161,263,452 | |||||||||||||||||||
Kraft Heinz Foods Co., | ||||||||||||||||||||||
senior bond, 3.95%, 7/15/25 | United States | 60,000,000 | 60,527,822 | |||||||||||||||||||
senior bond, 4.625%, 1/30/29 | United States | 50,000,000 | 51,528,793 | |||||||||||||||||||
d | Post Holdings Inc., | |||||||||||||||||||||
senior bond, 144A, 5.00%, 8/15/26 | United States | 87,000,000 | 84,933,750 | |||||||||||||||||||
senior bond, 144A, 5.625%, 1/15/28 | United States | 65,000,000 | 64,756,250 | |||||||||||||||||||
| Walmart Inc., | ||||||||||||||||||||||
senior note, 3.40%, 6/26/23 | United States | 50,000,000 | 51,597,468 | |||||||||||||||||||
senior note, 3.55%, 6/26/25 | United States | 50,000,000 | 51,979,807 | |||||||||||||||||||
| 663,814,885 | ||||||||||||||||||||||
| Energy 7.3% | ||||||||||||||||||||||
d | Ascent Resources Utica Holdings LLC/ARU Finance Corp., senior note, 144A, 10.00%, 4/01/22 | United States | 97,508,000 | 107,288,052 | ||||||||||||||||||
| Calumet Specialty Products Partners LP/Calumet Finance Corp., | ||||||||||||||||||||||
senior note, 6.50%, 4/15/21 | United States | 446,754,000 | 440,052,690 | |||||||||||||||||||
senior note, 7.625%, 1/15/22 | United States | 140,000,000 | 129,850,000 | |||||||||||||||||||
senior note, 7.75%, 4/15/23 | United States | 99,100,000 | 88,694,500 | |||||||||||||||||||
| Canadian Natural Resources Ltd., senior bond, 3.85%, 6/01/27 | Canada | 35,000,000 | 35,094,780 | |||||||||||||||||||
| Chesapeake Energy Corp., | ||||||||||||||||||||||
senior bond, 6.875%, 11/15/20 | United States | 95,000,000 | 98,087,500 | |||||||||||||||||||
senior bond, 6.125%, 2/15/21 | United States | 231,500,000 | 239,602,500 | |||||||||||||||||||
senior bond, 8.00%, 6/15/27 | United States | 269,500,000 | 266,805,000 | |||||||||||||||||||
senior note, 6.625%, 8/15/20 | United States | 157,800,000 | 162,731,250 | |||||||||||||||||||
senior note, 5.375%, 6/15/21 | United States | 108,523,000 | 108,523,000 | |||||||||||||||||||
senior note, 4.875%, 4/15/22 | United States | 107,710,000 | 106,632,900 | |||||||||||||||||||
senior note, 5.75%, 3/15/23 | United States | 124,251,000 | 121,455,352 | |||||||||||||||||||
senior note, 7.00%, 10/01/24 | United States | 271,143,000 | 271,481,929 | |||||||||||||||||||
senior note, 8.00%, 1/15/25 | United States | 549,500,000 | 563,237,500 | |||||||||||||||||||
senior note, 7.50%, 10/01/26 | United States | 129,200,000 | 127,559,160 | |||||||||||||||||||
i senior note, FRN, 6.037%,(3-month USD LIBOR + 3.25%), 4/15/19 | United States | 72,800,000 | 72,818,200 | |||||||||||||||||||
Chevron Corp., senior note, 2.895%, 3/03/24 | United States | 30,000,000 | 30,396,849 | |||||||||||||||||||
| Energy Transfer Operating LP, | ||||||||||||||||||||||
senior bond, 5.25%, 4/15/29 | United States | 40,000,000 | 42,999,292 | |||||||||||||||||||
senior note, 5.50%, 6/01/27 | United States | 74,000,000 | 80,428,808 | |||||||||||||||||||
| Ensco PLC, | ||||||||||||||||||||||
senior bond, 5.75%, 10/01/44 | United States | 50,000,000 | 32,375,000 | |||||||||||||||||||
senior note, 7.75%, 2/01/26 | United States | 30,000,000 | 25,462,500 | |||||||||||||||||||
| 64 | Semiannual Report | franklintempleton.com | ||
FRANKLIN CUSTODIAN FUNDS
STATEMENT OF INVESTMENTS (UNAUDITED)
Franklin Income Fund(continued)
| Country | | Principal Amount* | | Value | ||||||||||||||||||
Corporate Bonds(continued) | ||||||||||||||||||||||
| Energy(continued) | ||||||||||||||||||||||
| Gulfport Energy Corp., | ||||||||||||||||||||||
senior note, 6.375%, 5/15/25 | United States | 20,000,000 | $ | 18,175,000 | ||||||||||||||||||
senior note, 6.375%, 1/15/26 | United States | 30,000,000 | 26,850,000 | |||||||||||||||||||
| HighPoint Operating Corp., | ||||||||||||||||||||||
senior bond, 7.00%, 10/15/22 | United States | 205,783,000 | 194,464,935 | |||||||||||||||||||
senior note, 8.75%, 6/15/25 | United States | 163,955,000 | 156,577,025 | |||||||||||||||||||
| Kinder Morgan Inc., | ||||||||||||||||||||||
senior bond, 7.75%, 1/15/32 | United States | 118,000,000 | 154,270,737 | |||||||||||||||||||
dsenior secured bond, first lien, 144A, 5.625%, 11/15/23 | United States | 86,200,000 | 94,542,698 | |||||||||||||||||||
| Matador Resources Co., senior note, 5.875%, 9/15/26 | United States | 89,000,000 | 89,222,500 | |||||||||||||||||||
| Sunoco LP/Sunoco Finance Corp., senior note, 5.50%, 2/15/26 | United States | 74,775,000 | 74,214,188 | |||||||||||||||||||
| Talos Production LLC/Talos Production Finance Inc., second lien, 11.00%, 4/03/22 | United States | 65,000,000 | 68,575,000 | |||||||||||||||||||
d | Transocean Inc., senior note, 144A, 7.25%, 11/01/25 | United States | 50,000,000 | 49,562,500 | ||||||||||||||||||
| Weatherford International LLC, senior note, 9.875%, 3/01/25 | United States | 93,000,000 | 66,030,000 | |||||||||||||||||||
| Weatherford International Ltd., | ||||||||||||||||||||||
senior note, 5.125%, 9/15/20 | United States | 131,343,000 | 115,910,197 | |||||||||||||||||||
senior note, 7.75%, 6/15/21 | United States | 605,829,000 | 545,246,100 | |||||||||||||||||||
senior note, 4.50%, 4/15/22 | United States | 317,600,000 | 223,908,000 | |||||||||||||||||||
senior note, 8.25%, 6/15/23 | United States | 286,600,000 | 204,202,500 | |||||||||||||||||||
senior note, 9.875%, 2/15/24 | United States | 240,200,000 | 174,145,000 | |||||||||||||||||||
| The Williams Cos. Inc., | ||||||||||||||||||||||
senior bond, 5.10%, 9/15/45 | United States | 3,000,000 | 3,092,772 | |||||||||||||||||||
senior note, 4.55%, 6/24/24 | United States | 46,858,000 | 49,515,292 | |||||||||||||||||||
|
5,460,081,206 |
| ||||||||||||||||||||
| Financials 5.4% | ||||||||||||||||||||||
d | Ashtead Capital Inc., secured bond, second lien, 144A, 4.375%, 8/15/27 | United Kingdom | 42,500,000 | 41,178,038 | ||||||||||||||||||
| Bank of America Corp., | ||||||||||||||||||||||
jjunior sub. bond, AA, 6.10% to 3/17/25, FRN thereafter, Perpetual | United States | 80,000,000 | 84,724,400 | |||||||||||||||||||
jjunior sub. bond, U, 5.20% to 6/01/23, FRN thereafter, Perpetual | United States | 75,000,000 | 75,424,875 | |||||||||||||||||||
jjunior sub. bond, X, 6.25% to 9/05/24, FRN thereafter, Perpetual | United States | 85,000,000 | 90,418,750 | |||||||||||||||||||
senior bond, 3.419% to 12/20/27, FRN thereafter, 12/20/28 | United States | 135,000,000 | 132,249,885 | |||||||||||||||||||
senior note, 3.004% to 12/20/22, FRN thereafter, 12/20/23 | United States | 100,000,000 | 99,784,915 | |||||||||||||||||||
| Barclays PLC, | ||||||||||||||||||||||
senior note, 3.65%, 3/16/25 | United Kingdom | 50,000,000 | 48,961,000 | |||||||||||||||||||
senior note, 4.375%, 1/12/26 | United Kingdom | 125,000,000 | 126,072,500 | |||||||||||||||||||
senior note, 4.61% to 2/14/22, FRN thereafter, 2/15/23 | United Kingdom | 50,000,000 | 51,064,750 | |||||||||||||||||||
| Capital One Financial Corp., | ||||||||||||||||||||||
senior sub. note, 4.20%, 10/29/25 | United States | 123,000,000 | 125,276,060 | |||||||||||||||||||
sub. note, 3.75%, 7/28/26 | United States | 110,200,000 | 107,525,375 | |||||||||||||||||||
| Citigroup Inc., | ||||||||||||||||||||||
jjunior sub. bond, 5.35% to 5/15/23, FRN thereafter, Perpetual | United States | 179,195,000 | 176,547,394 | |||||||||||||||||||
jjunior sub. bond, 5.90% to 2/15/23, FRN thereafter, Perpetual | United States | 47,000,000 | 47,908,745 | |||||||||||||||||||
jjunior sub. bond, 5.95% to 1/30/23, FRN thereafter, Perpetual | United States | 230,000,000 | 234,312,500 | |||||||||||||||||||
jjunior sub. bond, M, 6.30% to 5/15/24, FRN thereafter, Perpetual | United States | 247,500,000 | 251,976,037 | |||||||||||||||||||
jjunior sub. bond, O, 5.875% to 3/27/20, FRN thereafter, Perpetual | United States | 177,000,000 | 178,831,065 | |||||||||||||||||||
jjunior sub. bond, Q, 5.95% to 8/15/20, FRN thereafter, Perpetual | United States | 120,000,000 | 121,224,600 | |||||||||||||||||||
sub. bond, 4.125%, 7/25/28 | United States | 165,000,000 | 166,232,618 | |||||||||||||||||||
sub. note, 3.50%, 5/15/23 | United States | 45,000,000 | 45,672,593 |
| franklintempleton.com | Semiannual Report | 65 | ||
FRANKLIN CUSTODIAN FUNDS
STATEMENT OF INVESTMENTS (UNAUDITED)
Franklin Income Fund(continued)
| Country | | Principal Amount* | | Value | ||||||||||||||||||
| Corporate Bonds(continued) | ||||||||||||||||||||||
| Financials(continued) | ||||||||||||||||||||||
j | Fifth Third Bancorp, junior sub. bond, 5.10% to 6/30/23, FRN thereafter, Perpetual | United States | 54,000,000 | $ | 51,784,650 | |||||||||||||||||
| The Goldman Sachs Group Inc., | ||||||||||||||||||||||
senior note, 3.50%, 11/16/26 | United States | 65,000,000 | 64,246,506 | |||||||||||||||||||
senior note, 2.876% to 10/31/21, FRN thereafter, 10/31/22 | United States | 125,000,000 | 124,025,011 | |||||||||||||||||||
senior note, 3.272% to 9/29/24, FRN thereafter, 9/29/25 | United States | 100,000,000 | 98,806,703 | |||||||||||||||||||
| HSBC Holdings PLC, | ||||||||||||||||||||||
senior note, 3.40%, 3/08/21 | United Kingdom | 25,000,000 | 25,222,375 | |||||||||||||||||||
senior note, 4.292% to 9/12/25, FRN thereafter, 9/12/26 | United Kingdom | 125,000,000 | 128,565,000 | |||||||||||||||||||
j | JPMorgan Chase & Co., | |||||||||||||||||||||
junior sub. bond, 6.125% to 4/30/24, FRN thereafter, Perpetual | United States | 60,000,000 | 63,000,000 | |||||||||||||||||||
junior sub. bond, 6.75% to 2/01/24, FRN thereafter, Perpetual | United States | 100,000,000 | 109,691,500 | |||||||||||||||||||
ijunior sub. bond, FRN, 6.221%,(3-month USD LIBOR + 3.47%), Perpetual | United States | 419,616,000 | 422,333,014 | |||||||||||||||||||
junior sub. bond, Q, 5.15% to 5/01/23, FRN thereafter, Perpetual | United States | 100,000,000 | 100,842,500 | |||||||||||||||||||
junior sub. bond, R, 6.00% to 8/01/23, FRN thereafter, Perpetual | United States | 105,000,000 | 109,532,325 | |||||||||||||||||||
junior sub. bond, V, 5.00% to 7/30/19, FRN thereafter, Perpetual | United States | 200,000,000 | 199,150,000 | |||||||||||||||||||
junior sub. bond, X, 6.10% to 10/01/24, FRN thereafter, Perpetual | United States | 80,000,000 | 84,273,200 | |||||||||||||||||||
j | Morgan Stanley, junior sub. bond, 5.55% to 7/15/20, FRN thereafter, Perpetual | United States | 58,000,000 | 59,032,690 | ||||||||||||||||||
Prudential Financial Inc., junior sub. bond, 5.70% to 9/15/28, FRN thereafter, 9/15/48 | United States | 100,000,000 | 101,352,500 | |||||||||||||||||||
j | Wells Fargo & Co., junior sub. bond, S, 5.90% to 6/15/24, FRN thereafter, Perpetual | United States | 111,700,000 | 114,328,859 | ||||||||||||||||||
|
4,061,572,933 |
| ||||||||||||||||||||
| Health Care 12.9% | ||||||||||||||||||||||
| AbbVie Inc., | ||||||||||||||||||||||
senior bond, 3.20%, 5/14/26 | United States | 35,000,000 | 34,089,678 | |||||||||||||||||||
senior note, 2.90%, 11/06/22 | United States | 35,000,000 | 34,943,522 | |||||||||||||||||||
| Allergan Funding SCS, senior bond, 3.80%, 3/15/25 | United States | 100,000,000 | 101,159,250 | |||||||||||||||||||
| AstraZeneca PLC, | ||||||||||||||||||||||
senior bond, 4.375%, 8/17/48 | United Kingdom | 10,500,000 | 10,829,070 | |||||||||||||||||||
senior note, 2.375%, 11/16/20 | United Kingdom | 25,000,000 | 24,859,625 | |||||||||||||||||||
senior note, 2.375%, 6/12/22 | United Kingdom | 31,500,000 | 31,113,968 | |||||||||||||||||||
d | Bausch Health Americas Inc., senior note, 144A, 9.25%, 4/01/26 | United States | 200,000,000 | 219,360,000 | ||||||||||||||||||
d | Bausch Health Cos. Inc., | |||||||||||||||||||||
senior bond, 144A, 6.125%, 4/15/25 | United States | 122,400,000 | 121,482,000 | |||||||||||||||||||
senior note, 144A, 5.50%, 3/01/23 | United States | 70,526,000 | 71,131,113 | |||||||||||||||||||
senior note, 144A, 5.875%, 5/15/23 | United States | 407,700,000 | 413,305,875 | |||||||||||||||||||
senior note, 144A, 9.00%, 12/15/25 | United States | 105,000,000 | 114,455,250 | |||||||||||||||||||
senior note, 144A, 8.50%, 1/31/27 | United States | 50,000,000 | 53,125,000 | |||||||||||||||||||
senior note, first lien, 144A, 7.00%, 3/15/24 | United States | 77,300,000 | 81,976,650 | |||||||||||||||||||
senior secured note, first lien, 144A, 6.50%, 3/15/22 | United States | 50,500,000 | 52,330,625 | |||||||||||||||||||
senior secured note, first lien, 144A, 5.50%, 11/01/25 | United States | 91,000,000 | 93,275,000 | |||||||||||||||||||
d | Bayer U.S. Finance II LLC, senior note, 144A, 4.25%, 12/15/25 | Germany | 75,000,000 | 75,872,093 | ||||||||||||||||||
| CHS/Community Health Systems Inc., | ||||||||||||||||||||||
senior note, 7.125%, 7/15/20 | United States | 27,341,000 | 26,315,713 | |||||||||||||||||||
senior note, 6.875%, 2/01/22 | United States | 1,691,250,000 | 1,133,137,500 | |||||||||||||||||||
dsenior note, 144A, 8.125%, 6/30/24 | United States | 731,006,000 | 548,254,500 | |||||||||||||||||||
dsenior note, 144A, 11.00% to 6/22/19, 9.875% thereafter, 6/30/23 | United States | 1,430,000,000 | 1,173,500,900 | |||||||||||||||||||
dsenior secured note, 144A, 8.00%, 3/15/26 | United States | 85,000,000 | 81,540,500 | |||||||||||||||||||
| 66 | Semiannual Report | franklintempleton.com | ||
FRANKLIN CUSTODIAN FUNDS
STATEMENT OF INVESTMENTS (UNAUDITED)
Franklin Income Fund(continued)
| Country | | Principal Amount* | | Value | ||||||||||||||||||
| Corporate Bonds(continued) | ||||||||||||||||||||||
| Health Care(continued) | ||||||||||||||||||||||
| CHS/Community Health Systems Inc., (continued) | ||||||||||||||||||||||
senior secured note, first lien, 6.25%, 3/31/23 | United States | 355,000,000 | $ | 334,587,500 | ||||||||||||||||||
d | Cigna Corp., | |||||||||||||||||||||
senior bond, 144A, 4.90%, 12/15/48 | United States | 11,500,000 | 11,919,071 | |||||||||||||||||||
senior secured note, 144A, 3.75%, 7/15/23 | United States | 60,000,000 | 61,580,801 | |||||||||||||||||||
senior secured note, 144A, 4.125%, 11/15/25 | United States | 60,000,000 | 62,175,822 | |||||||||||||||||||
| CVS Health Corp., | ||||||||||||||||||||||
senior bond, 4.30%, 3/25/28 | United States | 125,000,000 | 126,889,226 | |||||||||||||||||||
senior bond, 5.05%, 3/25/48 | United States | 66,800,000 | 67,431,589 | |||||||||||||||||||
senior note, 4.10%, 3/25/25 | United States | 75,000,000 | 77,114,446 | |||||||||||||||||||
| DaVita Inc., | ||||||||||||||||||||||
senior bond, 5.125%, 7/15/24 | United States | 180,700,000 | 178,893,000 | |||||||||||||||||||
senior bond, 5.00%, 5/01/25 | United States | 129,500,000 | 124,579,000 | |||||||||||||||||||
d | Endo DAC/Endo Finance LLC/Endo Finco Inc., | |||||||||||||||||||||
senior bond, 144A, 6.00%, 2/01/25 | United States | 106,600,000 | 77,818,000 | |||||||||||||||||||
senior note, 144A, 6.00%, 7/15/23 | United States | 185,525,000 | 143,781,875 | |||||||||||||||||||
| HCA Inc., | ||||||||||||||||||||||
senior bond, 5.875%, 5/01/23 | United States | 110,000,000 | 117,562,500 | |||||||||||||||||||
senior bond, 5.625%, 9/01/28 | United States | 127,500,000 | 135,150,000 | |||||||||||||||||||
senior note, 7.50%, 2/15/22 | United States | 70,000,000 | 77,371,000 | |||||||||||||||||||
senior secured note, first lien, 5.00%, 3/15/24 | United States | 124,800,000 | 132,294,587 | |||||||||||||||||||
| Horizon Pharma USA Inc., senior note, 6.625%, 5/01/23 | United States | 105,963,000 | 109,450,295 | |||||||||||||||||||
| Mallinckrodt International Finance SA, senior bond, 4.75%, 4/15/23 | United States | 66,000,000 | 52,140,000 | |||||||||||||||||||
d | Mallinckrodt International Finance SA/Mallinckrodt CB LLC, | |||||||||||||||||||||
senior note, 144A, 4.875%, 4/15/20 | United States | 262,252,000 | 262,252,000 | |||||||||||||||||||
senior note, 144A, 5.75%, 8/01/22 | United States | 300,000,000 | 285,000,000 | |||||||||||||||||||
senior note, 144A, 5.625%, 10/15/23 | United States | 285,350,000 | 237,910,562 | |||||||||||||||||||
senior note, 144A, 5.50%, 4/15/25 | United States | 137,500,000 | 107,937,500 | |||||||||||||||||||
| Mylan NV, senior note, 3.95%, 6/15/26 | United States | 141,000,000 | 135,156,255 | |||||||||||||||||||
d | Par Pharmaceutical Inc., senior secured note, 144A, 7.50%, 4/01/27 | United States | 100,000,000 | 101,625,000 | ||||||||||||||||||
| Tenet Healthcare Corp., | ||||||||||||||||||||||
secured note, second lien, 5.125%, 5/01/25 | United States | 133,300,000 | 134,306,415 | |||||||||||||||||||
senior note, 8.125%, 4/01/22 | United States | 899,900,000 | 971,532,040 | |||||||||||||||||||
senior note, 6.75%, 6/15/23 | United States | 565,000,000 | 584,068,750 | |||||||||||||||||||
senior note, 7.00%, 8/01/25 | United States | 140,000,000 | 141,937,600 | |||||||||||||||||||
senior note, 6.875%, 11/15/31 | United States | 48,840,000 | 46,153,800 | |||||||||||||||||||
d senior note, second lien, 144A, 6.25%, 2/01/27 | United States | 50,000,000 | 51,937,500 | |||||||||||||||||||
senior secured note, first lien, 4.375%, 10/01/21 | United States | 130,000,000 | 132,912,000 | |||||||||||||||||||
senior secured note, first lien, 4.625%, 7/15/24 | United States | 95,200,000 | 95,914,000 | |||||||||||||||||||
|
| 9,675,439,966
|
| ||||||||||||||||||||
| Industrials 0.7% | ||||||||||||||||||||||
d | TransDigm Inc., senior secured note, 144A, 6.25%, 3/15/26 | United States | 75,000,000 | 78,000,000 | ||||||||||||||||||
| United Rentals North America Inc., | ||||||||||||||||||||||
senior bond, 5.75%, 11/15/24 | United States | 56,050,000 | 57,801,563 | |||||||||||||||||||
senior bond, 4.875%, 1/15/28 | United States | 116,000,000 | 113,123,200 | |||||||||||||||||||
senior note, 6.50%, 12/15/26 | United States | 40,000,000 | 42,200,000 | |||||||||||||||||||
| United Technologies Corp., | ||||||||||||||||||||||
senior bond, 4.50%, 6/01/42 | United States | 55,000,000 | 56,972,930 | |||||||||||||||||||
senior note, 3.95%, 8/16/25 | United States | 25,000,000 | 26,004,873 | |||||||||||||||||||
senior note, 3.125%, 5/04/27 | United States | 40,000,000 | 39,156,575 | |||||||||||||||||||
| franklintempleton.com | Semiannual Report | 67 | ||
FRANKLIN CUSTODIAN FUNDS
STATEMENT OF INVESTMENTS (UNAUDITED)
Franklin Income Fund(continued)
| Country | | Principal Amount* | | Value | ||||||||||||||||||
| Corporate Bonds(continued) | ||||||||||||||||||||||
| Industrials(continued) | ||||||||||||||||||||||
d | West Corp., senior note, 144A, 8.50%, 10/15/25 | United States | 16,800,000 | $ | 14,532,000 | |||||||||||||||||
d | XPO Logistics Inc., senior note, 144A, 6.50%, 6/15/22 | United States | 88,789,000 | 91,075,317 | ||||||||||||||||||
|
518,866,458 |
| ||||||||||||||||||||
| Information Technology 0.5% | ||||||||||||||||||||||
d | CommScope Inc., senior bond, 144A, 5.50%, 6/15/24 | United States | 80,000,000 | 78,628,000 | ||||||||||||||||||
d | Dell International LLC/EMC Corp., | |||||||||||||||||||||
senior secured note, first lien, 144A, 5.45%, 6/15/23 | United States | 69,750,000 | 74,371,284 | |||||||||||||||||||
senior secured note, first lien, 144A, 4.90%, 10/01/26 | United States | 75,000,000 | 76,492,577 | |||||||||||||||||||
d | Microchip Technology Inc., senior secured note, first lien, 144A, 4.333%, 6/01/23 | United States | 79,000,000 | 80,791,644 | ||||||||||||||||||
| NCR Corp., | ||||||||||||||||||||||
senior note, 5.00%, 7/15/22 | United States | 40,000,000 | 40,100,000 | |||||||||||||||||||
senior note, 6.375%, 12/15/23 | United States | 35,000,000 | 36,073,800 | |||||||||||||||||||
|
386,457,305 |
| ||||||||||||||||||||
| Materials 1.4% | ||||||||||||||||||||||
| Ball Corp., senior bond, 4.00%, 11/15/23 | United States | 60,000,000 | 60,600,000 | |||||||||||||||||||
d | BWAY Holding Co., | |||||||||||||||||||||
secured note, 144A, 5.50%, 4/15/24 | United States | 75,000,000 | 74,741,250 | |||||||||||||||||||
senior note, 144A, 7.25%, 4/15/25 | United States | 189,500,000 | 183,458,740 | |||||||||||||||||||
d | Cemex Finance LLC, senior secured note, first lien, 144A, 6.00%, 4/01/24 | Mexico | 88,400,000 | 91,129,350 | ||||||||||||||||||
d | Cemex SAB de CV, | |||||||||||||||||||||
senior secured bond, 144A, 7.75%, 4/16/26 | Mexico | 55,100,000 | 60,131,181 | |||||||||||||||||||
senior secured bond, first lien, 144A, 5.70%, 1/11/25 | Mexico | 70,000,000 | 71,933,750 | |||||||||||||||||||
| Crown Americas LLC/Crown Americas Capital Corp. IV, senior bond, 4.50%, 1/15/23 | United States | 75,000,000 | 75,937,500 | |||||||||||||||||||
| DowDuPont Inc., senior note, 4.493%, 11/15/25 | United States | 50,000,000 | 53,347,859 | |||||||||||||||||||
d | FMG Resources (August 2006) Pty. Ltd., | |||||||||||||||||||||
senior note, 144A, 4.75%, 5/15/22 | Australia | 40,200,000 | 40,401,000 | |||||||||||||||||||
senior note, 144A, 5.125%, 3/15/23 | Australia | 25,000,000 | 25,131,993 | |||||||||||||||||||
senior note, 144A, 5.125%, 5/15/24 | Australia | 60,540,000 | 60,540,000 | |||||||||||||||||||
| Freeport-McMoRan Inc., senior bond, 3.875%, 3/15/23 | United States | 50,000,000 | 49,405,500 | |||||||||||||||||||
| International Paper Co., | ||||||||||||||||||||||
senior bond, 3.00%, 2/15/27 | United States | 50,000,000 | 48,221,764 | |||||||||||||||||||
senior bond, 4.40%, 8/15/47 | United States | 50,000,000 | 46,990,494 | |||||||||||||||||||
| LYB International Finance II BV, senior note, 3.50%, 3/02/27 | United States | 50,000,000 | 48,168,930 | |||||||||||||||||||
d | Syngenta Finance NV, | |||||||||||||||||||||
senior note, 144A, 4.441%, 4/24/23 | Switzerland | 25,000,000 | 25,468,875 | |||||||||||||||||||
senior note, 144A, 5.182%, 4/24/28 | Switzerland | 50,000,000 | 50,676,800 | |||||||||||||||||||
|
1,066,284,986 |
| ||||||||||||||||||||
| Real Estate 0.5% | ||||||||||||||||||||||
| American Tower Corp., senior bond, 3.375%, 10/15/26 | United States | 50,000,000 | 48,817,341 | |||||||||||||||||||
| Equinix Inc., senior bond, 5.375%, 5/15/27 | United States | 90,000,000 | 94,500,000 | |||||||||||||||||||
| Iron Mountain Inc., | ||||||||||||||||||||||
d senior note, 144A, 4.875%, 9/15/27 | United States | 135,610,000 | 130,863,650 | |||||||||||||||||||
senior sub. bond, 5.75%, 8/15/24 | United States | 129,254,000 | 130,869,675 | |||||||||||||||||||
|
405,050,666 |
| ||||||||||||||||||||
| 68 | Semiannual Report | franklintempleton.com | ||
FRANKLIN CUSTODIAN FUNDS
STATEMENT OF INVESTMENTS (UNAUDITED)
Franklin Income Fund(continued)
| Country | | Principal Amount* | | Value | ||||||||||||||||||
| Corporate Bonds(continued) | ||||||||||||||||||||||
| Utilities 1.5% | ||||||||||||||||||||||
The AES Corp., senior bond, 4.875%, 5/15/23 | United States | 50,000,000 | $ | 50,812,500 | ||||||||||||||||||
Calpine Corp., | ||||||||||||||||||||||
senior bond, 5.75%, 1/15/25 | United States | 70,000,000 | 69,825,000 | |||||||||||||||||||
senior note, 5.375%, 1/15/23 | United States | 300,000,000 | 301,125,000 | |||||||||||||||||||
senior note, 5.50%, 2/01/24 | United States | 186,500,000 | 186,033,750 | |||||||||||||||||||
Ferrellgas LP/Ferrellgas Finance Corp., | ||||||||||||||||||||||
senior note, 6.50%, 5/01/21 | United States | 79,295,000 | 69,878,719 | |||||||||||||||||||
senior note, 6.75%, 1/15/22 | United States | 112,500,000 | 98,718,750 | |||||||||||||||||||
senior note, 6.75%, 6/15/23 | United States | 88,500,000 | 77,658,750 | |||||||||||||||||||
Ferrellgas Partners LP/Ferrellgas Partners Finance Corp., senior note, 8.625%, 6/15/20 | United States | 49,900,000 | 37,924,000 | |||||||||||||||||||
Sempra Energy, senior bond, 3.40%, 2/01/28 | United States | 50,000,000 | 48,317,471 | |||||||||||||||||||
The Southern Co., junior sub. bond, 5.50% to 3/14/22, FRN thereafter, 3/15/57 | United States | 46,857,000 | 47,760,798 | |||||||||||||||||||
Vistra Energy Corp., senior note, 5.875%, 6/01/23 | United States | 130,000,000 | 133,412,500 | |||||||||||||||||||
| 1,121,467,238 | ||||||||||||||||||||||
| Total Corporate Bonds (Cost $29,087,999,325) | 28,955,297,140 | |||||||||||||||||||||
i,k | Senior Floating Rate Interests 2.4% | |||||||||||||||||||||
| Communication Services 0.7% | ||||||||||||||||||||||
Digicert Holdings Inc., First Lien Term Loan, 6.499%,(1-month USD LIBOR + 4.00%), 10/01/24 | United States | 44,663,062 | 44,011,741 | |||||||||||||||||||
Global Eagle Entertainment Inc., Initial Term Loans, 10.011%,(6-month USD LIBOR + 7.50%), 1/06/23 | United States | 98,578,644 | 97,099,964 | |||||||||||||||||||
l | iHeartCommunications Inc., Tranche D Term Loan, 8.443%,(3-month USD LIBOR + 6.75%), 1/30/19 | United States | 200,000,000 | 143,250,000 | ||||||||||||||||||
MH Sub I LLC & Micro Holding Corp., Amendment No. 2 Initial Term Loan, 6.236%,(1-month USD LIBOR + 3.75%), 9/15/24 | United States | 39,400,000 | 38,929,367 | |||||||||||||||||||
Securus Technologies Holdings Inc., | ||||||||||||||||||||||
Initial Term Loan, 6.999%,(1-month USD LIBOR + 4.50%), 11/01/24 | United States | 44,437,500 | 44,229,177 | |||||||||||||||||||
Second Lien Initial Loan, 10.749%,(1-month USD LIBOR + 8.25%), 11/01/25 | United States | 30,000,000 | 29,550,000 | |||||||||||||||||||
Sprint Communications Inc., 2018 Incremental Term Loans, 5.50%,(1-month USD LIBOR + 3.00%), 2/03/24 | United States | 99,750,000 | 98,190,209 | |||||||||||||||||||
Univision Communications Inc., Term Loan, 5.249%,(1-month USD LIBOR + 2.75%), 3/15/24 | United States | 62,809,206 | 59,335,103 | |||||||||||||||||||
| 554,595,561 | ||||||||||||||||||||||
Consumer Discretionary 0.7% | ||||||||||||||||||||||
24 Hour Fitness Worldwide Inc., Term Loan, 5.999%,(1-month USD LIBOR + 3.50%), 5/30/25 | United States | 109,199,875 | 109,158,925 | |||||||||||||||||||
Academy Ltd., Initial Term Loan, 6.489% - 6.49%,(1-month USD LIBOR + 4.00%), 7/02/22 | United States | 58,429,384 | 42,251,166 | |||||||||||||||||||
Belk Inc., Closing Date Term Loan, 7.447%,(3-month USD LIBOR + 4.75%), 12/12/22. | United States | 176,946,643 | 143,253,348 | |||||||||||||||||||
LTI Holdings Inc., Initial Term Loans, 5.999%,(1-month USD LIBOR + 3.50%), 9/06/25 | United States | 29,850,000 | 28,805,250 | |||||||||||||||||||
PetSmart Inc., TrancheB-2 Loans, 5.49%,(1-month USD LIBOR + 3.00%), 3/11/22 | United States | 62,609,826 | 56,317,852 | |||||||||||||||||||
Stars Group Holdings BV, Stars Group (US), USD Term Loan, 6.101%,(3-month USD LIBOR + 3.50%), 7/10/25 | United States | 106,206,858 | 106,194,645 | |||||||||||||||||||
| franklintempleton.com | Semiannual Report | 69 | ||
FRANKLIN CUSTODIAN FUNDS
STATEMENT OF INVESTMENTS (UNAUDITED)
Franklin Income Fund(continued)
| Country | | Principal Amount* | | Value | ||||||||||||||||||
i,k | Senior Floating Rate Interests(continued) | |||||||||||||||||||||
| Consumer Discretionary(continued) | ||||||||||||||||||||||
Tenneco Inc., Tranche B Term Loan, 5.249%,(1-month USD LIBOR + 2.75%), 10/01/25 | United States | 49,875,000 | $ | 47,786,484 | ||||||||||||||||||
| 533,767,670 | ||||||||||||||||||||||
| Consumer Staples 0.1% | ||||||||||||||||||||||
Almonde Inc., Tahoe Canada Bidco Inc. and Misys Europe SA, Dollar Term Loan, 6.101%,(3-month USD LIBOR + 3.50%), 6/13/24 | United States | 41,202,737 | 39,783,179 | |||||||||||||||||||
Energy 0.1% | ||||||||||||||||||||||
NorthRiver Midstream Finance LP, Initial Term B Loan, 6.047%,(3-month USD LIBOR + 3.25%), 10/01/25 | United States | 39,800,000 | 39,750,250 | |||||||||||||||||||
Financials 0.1% | ||||||||||||||||||||||
Russell Investments US Institutional Holdco Inc., Initial Term Loan, 5.851%,(3-month USD LIBOR + 3.25%), 6/01/23 | United States | 58,131,116 | 57,313,676 | |||||||||||||||||||
| Health Care 0.3% | ||||||||||||||||||||||
Amneal Pharmaceuticals LLC, Initial Term Loans, 6.00%,(1-month USD LIBOR + 3.50%), 5/04/25 | United States | 59,536,134 | 59,486,421 | |||||||||||||||||||
Endo Luxembourg Finance Co. I S.A.R.L. and Endo LLC, Initial Term Loans, 6.75%,(1-month USD LIBOR + 4.25%), 4/29/24 | United States | 78,600,000 | 77,396,477 | |||||||||||||||||||
Horizon Pharma Inc., Fourth Amendment Refinancing Term Loans, 5.50%,(1-month USD LIBOR + 3.00%), 3/29/24 | United States | 20,044,222 | 20,077,956 | |||||||||||||||||||
Mallinckrodt International Finance SA & Mallinckrodt CB LLC, | ||||||||||||||||||||||
2017 Term B Loans, 5.351%,(3-month USD LIBOR + 2.75%), 9/24/24 | Luxembourg | 27,174,234 | 25,407,909 | |||||||||||||||||||
2018 Incremental Term Loans, 5.693%,(3-month USD LIBOR + 3.00%), 2/24/25 | Luxembourg | 33,802,911 | 31,943,751 | |||||||||||||||||||
Valeant Pharmaceuticals International, First Incremental Term Loan, 5.231%,(1-month USD LIBOR + 2.75%), 11/27/25 | United States | 47,500,000 | 47,030,937 | |||||||||||||||||||
| 261,343,451 | ||||||||||||||||||||||
| Industrials 0.3% | ||||||||||||||||||||||
Commercial Barge Line Co., Initial Term Loan, 11.249%,(1-month USD LIBOR + 8.75%), 11/12/20 | United States | 52,489,828 | 37,070,941 | |||||||||||||||||||
Vertiv Group Corp., Term B Loans, 6.629%,(3-month USD LIBOR + 4.00%), 11/30/23 | United States | 114,327,586 | 107,753,750 | |||||||||||||||||||
West Corp., Term B Loans, 6.629%,(3-month USD LIBOR + 4.00%), 10/10/24 | United States | 60,960,193 | 57,302,582 | |||||||||||||||||||
| 202,127,273 | ||||||||||||||||||||||
| Information Technology 0.0%† | ||||||||||||||||||||||
Microchip Technology Inc., Initial Term Loan, 4.50%,(1-month USD LIBOR + 2.00%), 5/29/25 | United States | 33,474,043 | 33,144,525 | |||||||||||||||||||
Materials 0.0%† | ||||||||||||||||||||||
BWAY Holding Co. Inc., Term Loan B, 6.033%,(3-month USD LIBOR + 3.25%), 4/03/24 | United States | 28,347,790 | 27,724,138 | |||||||||||||||||||
Utilities 0.1% | ||||||||||||||||||||||
Talen Energy Supply LLC, TermB-1 Loans, 6.50%,(1-month USD LIBOR + 4.00%), 7/15/23 | United States | 51,590,987 | 51,255,646 | |||||||||||||||||||
Total Senior Floating Rate Interests | 1,800,805,369 | |||||||||||||||||||||
| 70 | Semiannual Report | franklintempleton.com | ||
FRANKLIN CUSTODIAN FUNDS
STATEMENT OF INVESTMENTS (UNAUDITED)
Franklin Income Fund(continued)
| Country | | Principal Amount | * | Value | ||||||||||||||||||
| U.S. Government and Agency Securities 8.7% | ||||||||||||||||||||||
| U.S. Treasury Bond, 3.00%, 2/15/49 | United States | 250,000,000 | $ | 259,589,845 | ||||||||||||||||||
| U.S. Treasury Note, | ||||||||||||||||||||||
1.00%, 6/30/19 | United States | 500,000,000 | 498,164,060 | |||||||||||||||||||
1.875%, 12/31/19 | United States | 500,000,000 | 497,928,200 | |||||||||||||||||||
2.25%, 3/31/20 | United States | 750,000,000 | 748,930,665 | |||||||||||||||||||
2.50%, 5/31/20 | United States | 750,000,000 | 751,113,285 | |||||||||||||||||||
2.50%, 6/30/20 | United States | 500,000,000 | 500,761,720 | |||||||||||||||||||
2.875%, 10/31/20 | United States | 150,000,000 | 151,253,907 | |||||||||||||||||||
2.50%, 2/28/21 | �� | United States | 250,000,000 | 251,040,040 | ||||||||||||||||||
2.375%, 3/15/21 | United States | 750,000,000 | 751,494,142 | |||||||||||||||||||
2.625%, 6/15/21 | United States | 500,000,000 | 504,111,330 | |||||||||||||||||||
2.75%, 8/15/21 | United States | 350,000,000 | 354,026,369 | |||||||||||||||||||
2.75%, 4/30/23 | United States | 500,000,000 | 510,136,720 | |||||||||||||||||||
2.75%, 5/31/23 | United States | 500,000,000 | 510,380,860 | |||||||||||||||||||
2.875%, 5/31/25 | United States | 250,000,000 | 258,315,430 | |||||||||||||||||||
Total U.S. Government and Agency Securities | 6,547,246,573 | |||||||||||||||||||||
| Shares | ||||||||||||||||||||||
| Escrows and Litigation Trusts 0.0% | ||||||||||||||||||||||
a,m | Motors Liquidation Co., Escrow Account | United States | 400,000,000 | — | ||||||||||||||||||
a,m | Motors Liquidation Co., Escrow Account, cvt. pfd., C | United States | 11,000,000 | — | ||||||||||||||||||
Total Escrows and Litigation Trusts | — | |||||||||||||||||||||
| | Number of Contracts | | | Notional Amount | * | |||||||||||||||||
| Options Purchased 0.3% | ||||||||||||||||||||||
Puts - Exchange-Traded | ||||||||||||||||||||||
S&P 500 Index, December Strike Price $2,650, Expires 12/20/19 | 5,000 | 500,000 | 41,100,000 | |||||||||||||||||||
S&P 500 Index, December Strike Price $2,700, Expires 12/18/20 | 5,000 | 500,000 | 88,500,000 | |||||||||||||||||||
S&P 500 Index, June Strike Price $2,700, Expires 6/19/20 | 5,000 | 500,000 | 68,500,000 | |||||||||||||||||||
Total Options Purchased | 198,100,000 | |||||||||||||||||||||
Total Investments before Short Term Investments | 72,206,539,248 | |||||||||||||||||||||
| Country | | Principal Amount | * | |||||||||||||||||||
| Short Term Investments 3.4% | ||||||||||||||||||||||
Corporate Bonds (Cost $12,071,863) 0.0%† | ||||||||||||||||||||||
CHS/Community Health Systems Inc., senior note, 8.00%, 11/15/19 | United States | 12,337,000 | 12,213,630 | |||||||||||||||||||
| franklintempleton.com | Semiannual Report | 71 | ||
FRANKLIN CUSTODIAN FUNDS
STATEMENT OF INVESTMENTS (UNAUDITED)
Franklin Income Fund(continued)
| Country | | Principal Amount | | Value | ||||||||||||||||||
U.S. Government and Agency Securities (Cost $496,946,028) 0.7% | ||||||||||||||||||||||
n |
U.S. Treasury Bill, 5/14/19 - 8/15/19 | United States | 500,000,000 | $ | 497,042,750 | |||||||||||||||||
Total Investments before Money Market Funds | 72,715,795,628 | |||||||||||||||||||||
| Shares | ||||||||||||||||||||||
Money Market Funds (Cost $2,018,865,765) 2.7% | ||||||||||||||||||||||
o,p |
Institutional Fiduciary Trust Money Market Portfolio, 2.10% | United States | 2,018,865,765 | 2,018,865,765 | ||||||||||||||||||
Total Investments (Cost $72,199,307,127) 99.6% | 74,734,661,393 | |||||||||||||||||||||
Options Written (0.1)% | (67,461,259 | ) | ||||||||||||||||||||
Other Assets, less Liabilities 0.5% | 365,422,071 | |||||||||||||||||||||
Net Assets 100.0% | $ | 75,032,622,205 | ||||||||||||||||||||
| | Number of Contracts | | | Notional Amount | * | |||||||||||||||||
q | Options Written (0.1)% | |||||||||||||||||||||
Calls - Exchange-Traded | ||||||||||||||||||||||
3M Co., April Strike Price $220, Expires 4/18/19 | 10,000 | 1,000,000 | (110,000 | ) | ||||||||||||||||||
Alphabet Inc., April Strike Price $1,225, Expires 4/18/19 | 1,820 | 182,000 | (819,000 | ) | ||||||||||||||||||
Apple Inc., April Strike Price $185, Expires 4/18/19 | 9,996 | 999,600 | (6,897,240 | ) | ||||||||||||||||||
Apple Inc., April Strike Price $190, Expires 4/18/19 | 10,000 | 1,000,000 | (3,750,000 | ) | ||||||||||||||||||
Bank of America Corp., April Strike Price $32, Expires 4/18/19 | 20,000 | 2,000,000 | (20,000 | ) | ||||||||||||||||||
BP PLC, April Strike Price $44, Expires 4/18/19 | 15,000 | 1,500,000 | (795,000 | ) | ||||||||||||||||||
Chevron Corp., June Strike Price $130, Expires 6/21/19 | 10,000 | 1,000,000 | (1,140,000 | ) | ||||||||||||||||||
Cummins Inc., April Strike Price $165, Expires 4/18/19 | 15,000 | 1,500,000 | (615,000 | ) | ||||||||||||||||||
Duke Energy Corp., April Strike Price $90, Expires 4/18/19 | 30,000 | 3,000,000 | (3,420,000 | ) | ||||||||||||||||||
Ford Motor Co., April Strike Price $9, Expires 4/18/19 | 100,000 | 10,000,000 | (1,000,000 | ) | ||||||||||||||||||
Ford Motor Co., June Strike Price $10, Expires 6/21/19 | 50,000 | 5,000,000 | (400,000 | ) | ||||||||||||||||||
General Motors Co., April Strike Price $39, Expires 4/18/19 | 50,000 | 5,000,000 | (850,000 | ) | ||||||||||||||||||
Intel Corp., April Strike Price $55, Expires 4/18/19 | 10,000 | 1,000,000 | (420,000 | ) | ||||||||||||||||||
Merck & Co. Inc., April Strike Price $80, Expires 4/18/19 | 10,000 | 1,000,000 | (3,650,000 | ) | ||||||||||||||||||
Merck & Co. Inc., June Strike Price $82.50, Expires 6/21/19 | 20,000 | 2,000,000 | (5,940,000 | ) | ||||||||||||||||||
PepsiCo. Inc., April Strike Price $120, Expires 4/18/19 | 10,000 | 1,000,000 | (3,530,000 | ) | ||||||||||||||||||
Pfizer Inc., April Strike Price $44, Expires 4/18/19 | 25,000 | 2,500,000 | (250,000 | ) | ||||||||||||||||||
Philip Morris International Inc., April Strike Price $85, Expires 4/18/19 | 17 | 1,700 | (6,579 | ) | ||||||||||||||||||
Philip Morris International Inc., April Strike Price $90, Expires 4/18/19 | 10,000 | 1,000,000 | (1,120,000 | ) | ||||||||||||||||||
Philip Morris International Inc., May Strike Price $95, Expires 5/17/19 | 15,000 | 1,500,000 | (915,000 | ) | ||||||||||||||||||
The Procter & Gamble Co., June Strike Price $105, Expires 6/21/19 | 20,000 | 2,000,000 | (4,540,000 | ) | ||||||||||||||||||
Rio Tinto PLC, April Strike Price $60, Expires 4/18/19 | 30,000 | 3,000,000 | (5,700,000 | ) | ||||||||||||||||||
Sempra Energy, April Strike Price $120, Expires 4/18/19 | 8,188 | 818,800 | (5,158,440 | ) | ||||||||||||||||||
The Southern Co., April Strike Price $49, Expires 4/18/19 | 10,000 | 1,000,000 | (2,805,000 | ) | ||||||||||||||||||
Target Corp., April Strike Price $80, Expires 4/18/19 | 20,000 | 2,000,000 | (3,320,000 | ) | ||||||||||||||||||
Target Corp., May Strike Price $82.50, Expires 5/17/19 | 10,000 | 1,000,000 | (1,420,000 | ) | ||||||||||||||||||
Texas Instruments Inc., April Strike Price $110, Expires 4/18/19 | 10,000 | 1,000,000 | (620,000 | ) | ||||||||||||||||||
Texas Instruments Inc., May Strike Price $115, Expires 5/17/19 | 20,000 | 2,000,000 | (1,460,000 | ) | ||||||||||||||||||
Wells Fargo & Co., April Strike Price $52.50, Expires 4/18/19 | 50,000 | 5,000,000 | (300,000 | ) | ||||||||||||||||||
| (60,971,259 | ) | |||||||||||||||||||||
| 72 | Semiannual Report | franklintempleton.com | ||
FRANKLIN CUSTODIAN FUNDS
STATEMENT OF INVESTMENTS (UNAUDITED)
Franklin Income Fund(continued)
| | Number of Contracts | | | Notional Amount | * | Value | ||||||||||||||||
qOptions Written(continued) | ||||||||||||||||||||||
Puts - Exchange-Traded | ||||||||||||||||||||||
3M Co., April Strike Price $195, Expires 4/18/19 | 10,000 | 1,000,000 | $ | (560,000 | ) | |||||||||||||||||
Bank of America Corp., May Strike Price $26, Expires 5/17/19 | 10,000 | 1,000,000 | (390,000 | ) | ||||||||||||||||||
Bristol-Myers Squibb Co., April Strike Price $45, Expires 4/18/19 | 40,000 | 4,000,000 | (1,280,000 | ) | ||||||||||||||||||
The Coca-Cola Co., April Strike Price $44, Expires 4/18/19 | 50,000 | 5,000,000 | (200,000 | ) | ||||||||||||||||||
The Coca-Cola Co., June Strike Price $42, Expires 6/21/19 | 50,000 | 5,000,000 | (1,000,000 | ) | ||||||||||||||||||
CVS Health Corp., April Strike Price $50, Expires 4/18/19 | 25,000 | 2,500,000 | (650,000 | ) | ||||||||||||||||||
Schlumberger Ltd., April Strike Price $40, Expires 4/18/19 | 25,000 | 2,500,000 | (500,000 | ) | ||||||||||||||||||
United Rentals Inc., May Strike Price $100, Expires 5/17/19 | 10,000 | 1,000,000 | (1,910,000 | ) | ||||||||||||||||||
| (6,490,000 | ) | |||||||||||||||||||||
Total Options Written (Premiums received $59,613,423) | $ | (67,461,259 | ) | |||||||||||||||||||
See Abbreviations on page 122.
†Rounds to less than 0.1% of net assets.
*The principal/notional amount is stated in U.S. dollars unless otherwise indicated.
aNon-income producing.
bA portion or all of the security is held in connection with written option contracts open at period end.
cSee Note 1(f) regarding equity-linked securities.
dSecurity was purchased pursuant to Rule 144A under the Securities Act of 1933 and may be sold in transactions exempt from registration only to qualified institutional buyers or in a public offering registered under the Securities Act of 1933. These securities have been deemed liquid under guidelines approved by the Trust’s Board of Trustees. At March 31, 2019, the aggregate value of these securities was $17,550,648,489, representing 23.4% of net assets.
eSecurity purchased on a delayed delivery basis. See Note 1(c).
fSee Note 1(e) regarding index-linked notes.
gSecurity pays a fixed 2.00% coupon rate and a variable coupon based on the distribution of the Morgan Stanley Custom Enhanced SPX B DT Index 20 Delta. The coupon rate shown represents the combined rate at period end. Cash payment at maturity or upon early redemption is based on the performance of the Morgan Stanley Custom Enhanced SPX B Index 20 Delta.
hSecurity purchased on a when-issued basis. See Note 1(c).
iThe coupon rate shown represents the rate at period end.
jPerpetual security with no stated maturity date.
kSee Note 1(i) regarding senior floating rate interests.
lSee Note 7 regarding defaulted securities.
mFair valued using significant unobservable inputs. See Note 12 regarding fair value measurements.
nThe security was issued on a discount basis with no stated coupon rate.
oSee Note 3(f) regarding investments in affiliated management investment companies.
pThe rate shown is the annualizedseven-day effective yield at period end.
qSee Note 1(d) regarding written options.
| franklintempleton.com | The accompanying notes are an integral part of these financial statements. | Semiannual Report | 73 | ||||
FRANKLIN CUSTODIAN FUNDS
Financial Highlights
Franklin U.S. Government Securities Fund
| Six Months Ended March 31, 2019 (unaudited) | Year Ended September 30, 2018a | |||||||
Class A | ||||||||
| Per share operating performance (for a share outstanding throughout the period) | ||||||||
Net asset value, beginning of period | $ 5.86 | $ 5.89 | ||||||
Income from investment operationsb: | ||||||||
Net investment incomec | 0.08 | 0.01 | ||||||
Net realized and unrealized gains (losses) | 0.11 | (0.02 | ) | |||||
Total from investment operations | 0.19 | (0.01 | ) | |||||
Less distributions from net investment income | (0.09 | ) | (0.02 | ) | ||||
Net asset value, end of period | $ 5.96 | $ 5.86 | ||||||
Total returnd | 3.28% | (0.23)% | ||||||
Ratios to average net assetse | ||||||||
Expensesf,g | 0.87% | 0.86% | ||||||
Net investment income | 2.54% | 2.40% | ||||||
Supplemental data | ||||||||
Net assets, end of period (000’s) | $180,330 | $4,472 | ||||||
Portfolio turnover rate | 13.88% | 44.67% | ||||||
Portfolio turnover rate excluding mortgage dollar rollsh | 13.88% | 44.67% | ||||||
aFor the period September 10, 2018 (effective date) to September 30, 2018.
bThe amount shown for a share outstanding throughout the period may not correlate with the Statement of Operations for the period due to the timing of sales and repurchases of the Fund’s shares in relation to income earned and/or fluctuating fair value of the investments of the Fund.
cBased on average daily shares outstanding.
dTotal return does not reflect sales commissions or contingent deferred sales charges, if applicable, and is not annualized for periods less than one year.
eRatios are annualized for periods less than one year.
fBenefit of expense reduction rounds to less than 0.01%.
gBenefit of waiver and payments by affiliates rounds to less than 0.01%.
hSee Note 1(h) regarding mortgage dollar rolls.
74 |
Semiannual Report | The accompanying notes are an integral part of these financial statements. |
franklintempleton.com | ||
FRANKLIN CUSTODIAN FUNDS
FINANCIAL HIGHLIGHTS
Franklin U.S. Government Securities Fund(continued)
| Six Months Ended | ||||||||||||||||||||||||
| March 31, 2019 | Year Ended September 30, | |||||||||||||||||||||||
| (unaudited) | 2018 | 2017 | 2016 | 2015 | 2014 | |||||||||||||||||||
Class A1 | ||||||||||||||||||||||||
Per share operating performance (for a share outstanding throughout the period) | ||||||||||||||||||||||||
Net asset value, beginning of period |
| $ 5.85 |
|
| $ 6.13 |
|
| $ 6.35 |
|
| $ 6.40 |
|
| $ 6.48 |
|
| $ 6.53 |
| ||||||
Income from investment operationsa: | ||||||||||||||||||||||||
Net investment incomeb | 0.08 | 0.15 | 0.13 | 0.14 | 0.15 | 0.17 | ||||||||||||||||||
Net realized and unrealized gains (losses) | 0.12 | (0.25 | ) | (0.16 | ) | 0.01 | (0.02 | ) | 0.01 | |||||||||||||||
Total from investment operations | 0.20 | (0.10 | ) | (0.03 | ) | 0.15 | 0.13 | 0.18 | ||||||||||||||||
Less distributions from net investment income | (0.09 | ) | (0.18 | ) | (0.19 | ) | (0.20 | ) | (0.21 | ) | (0.23 | ) | ||||||||||||
Net asset value, end of period | $ 5.96 | $ 5.85 | $ 6.13 | $ 6.35 | $ 6.40 | $ 6.48 | ||||||||||||||||||
Total returnc | 3.48% | (1.60)% | (0.45)% | 2.35% | 2.07% | 2.80% | ||||||||||||||||||
Ratios to average net assetsd | ||||||||||||||||||||||||
Expensese,f | 0.77% | 0.76% | 0.79% | 0.76% | 0.76% | 0.75% | ||||||||||||||||||
Net investment income | 2.64% | 2.50% | 2.17% | 2.21% | 2.28% | 2.62% | ||||||||||||||||||
Supplemental data | ||||||||||||||||||||||||
Net assets, end of period (000’s) | $2,940,656 | $3,099,373 | $3,581,769 | $4,235,819 | $4,167,639 | $4,323,990 | ||||||||||||||||||
Portfolio turnover rate | 13.88% | 44.67% | 86.72% | 92.18% | 69.10% | 69.73% | ||||||||||||||||||
Portfolio turnover rate excluding mortgage dollar rollsg | 13.88% | 44.67% | 86.72% | 92.18% | 58.70% | 38.79% | ||||||||||||||||||
aThe amount shown for a share outstanding throughout the period may not correlate with the Statement of Operations for the period due to the timing of sales and repurchases of the Fund’s shares in relation to income earned and/or fluctuating fair value of the investments of the Fund.
bBased on average daily shares outstanding.
cTotal return does not reflect sales commissions or contingent deferred sales charges, if applicable, and is not annualized for periods less than one year.
dRatios are annualized for periods less than one year.
eBenefit of expense reduction rounds to less than 0.01%.
fBenefit of waiver and payments by affiliates rounds to less than 0.01%.
gSee Note 1(h) regarding mortgage dollar rolls.
franklintempleton.com |
The accompanying notes are an integral part of these financial statements. | Semiannual Report |
|
75 |
| ||
FRANKLIN CUSTODIAN FUNDS
FINANCIAL HIGHLIGHTS
Franklin U.S. Government Securities Fund(continued)
| Six Months Ended | ||||||||||||||||||||||||
| March 31, 2019 | Year Ended September 30, | |||||||||||||||||||||||
| (unaudited) | 2018 | 2017 | 2016 | 2015 | 2014 | |||||||||||||||||||
Class C | ||||||||||||||||||||||||
Per share operating performance (for a share outstanding throughout the period) | ||||||||||||||||||||||||
Net asset value, beginning of period | $ 5.81 | $ 6.08 | $ 6.30 | $ 6.36 | $ 6.44 | $ 6.49 | ||||||||||||||||||
Income from investment operationsa: | ||||||||||||||||||||||||
Net investment incomeb | 0.06 | 0.12 | 0.10 | 0.11 | 0.11 | 0.14 | ||||||||||||||||||
Net realized and unrealized gains (losses) | 0.13 | (0.24 | ) | (0.16 | ) | — | c | (0.01 | ) | 0.01 | ||||||||||||||
Total from investment operations | 0.19 | (0.12 | ) | (0.06 | ) | 0.11 | 0.10 | 0.15 | ||||||||||||||||
Less distributions from net investment income | (0.08 | ) | (0.15 | ) | (0.16 | ) | (0.17 | ) | (0.18 | ) | (0.20 | ) | ||||||||||||
Net asset value, end of period | $ 5.92 | $ 5.81 | $ 6.08 | $ 6.30 | $ 6.36 | $ 6.44 | ||||||||||||||||||
Total returnd | 3.24% | (1.94)% | (0.96)% | 1.70% | 1.57% | 2.30% | ||||||||||||||||||
Ratios to average net assetse | ||||||||||||||||||||||||
Expensesf,g | 1.27% | 1.26% | 1.29% | 1.26% | 1.26% | 1.25% | ||||||||||||||||||
Net investment income | 2.14% | 2.00% | 1.67% | 1.71% | 1.78% | 2.12% | ||||||||||||||||||
Supplemental data | ||||||||||||||||||||||||
Net assets, end of period (000’s) | $434,389 | $571,525 | $797,394 | $1,034,410 | $1,040,294 | $1,190,720 | ||||||||||||||||||
Portfolio turnover rate | 13.88% | 44.67% | �� | 86.72% | 92.18% | 69.10% | 69.73% | |||||||||||||||||
Portfolio turnover rate excluding mortgage dollar rollsh | 13.88% | 44.67% | 86.72% | 92.18% | 58.70% | 38.79% | ||||||||||||||||||
aThe amount shown for a share outstanding throughout the period may not correlate with the Statement of Operations for the period due to the timing of sales and repurchases of the Fund’s shares in relation to income earned and/or fluctuating fair value of the investments of the Fund.
bBased on average daily shares outstanding.
cAmount rounds to less than $0.01 per share.
dTotal return does not reflect sales commissions or contingent deferred sales charges, if applicable, and is not annualized for periods less than one year.
eRatios are annualized for periods less than one year.
fBenefit of expense reduction rounds to less than 0.01%.
gBenefit of waiver and payments by affiliates rounds to less than 0.01%.
hSee Note 1(h) regarding mortgage dollar rolls.
76 |
Semiannual Report | The accompanying notes are an integral part of these financial statements. |
franklintempleton.com | ||
FRANKLIN CUSTODIAN FUNDS
FINANCIAL HIGHLIGHTS
Franklin U.S. Government Securities Fund(continued)
| Six Months Ended | ||||||||||||||||||||||||
| March 31, 2019 | Year Ended September 30, | |||||||||||||||||||||||
| (unaudited) | 2018 | 2017 | 2016 | 2015 | 2014 | |||||||||||||||||||
Class R | ||||||||||||||||||||||||
Per share operating performance (for a share outstanding throughout the period) | ||||||||||||||||||||||||
Net asset value, beginning of period | $ 5.85 | $ 6.12 | $ 6.34 | $ 6.40 | $ 6.48 | $ 6.53 | ||||||||||||||||||
Income from investment operationsa: | ||||||||||||||||||||||||
Net investment incomeb | 0.07 | 0.13 | 0.11 | 0.12 | 0.13 | 0.15 | ||||||||||||||||||
Net realized and unrealized gains (losses) | 0.12 | (0.24 | ) | (0.16 | ) | — | c | (0.02 | ) | 0.01 | ||||||||||||||
Total from investment operations | 0.19 | (0.11 | ) | (0.05 | ) | 0.12 | 0.11 | 0.16 | ||||||||||||||||
Less distributions from net investment income | (0.08 | ) | (0.16 | ) | (0.17 | ) | (0.18 | ) | (0.19 | ) | (0.21) | |||||||||||||
Net asset value, end of period | $ 5.96 | $ 5.85 | $ 6.12 | $ 6.34 | $ 6.40 | $ 6.48 | ||||||||||||||||||
Total returnd | 3.30% | (1.78)% | (0.81)% | 1.84% | 1.71% | 2.44% | ||||||||||||||||||
Ratios to average net assetse | ||||||||||||||||||||||||
Expensesf,g | 1.11% | 1.11% | 1.13% | 1.11% | 1.11% | 1.10% | ||||||||||||||||||
Net investment income | 2.30% | 2.15% | 1.83% | 1.86% | 1.93% | 2.27% | ||||||||||||||||||
Supplemental data | ||||||||||||||||||||||||
Net assets, end of period (000’s) | $30,693 | $31,144 | $38,363 | $59,785 | $64,689 | $74,442 | ||||||||||||||||||
Portfolio turnover rate | 13.88% | 44.67% | 86.72% | 92.18% | 69.10% | 69.73% | ||||||||||||||||||
Portfolio turnover rate excluding mortgage dollar rollsh | 13.88% | 44.67% | 86.72% | 92.18% | 58.70% | 38.79% | ||||||||||||||||||
aThe amount shown for a share outstanding throughout the period may not correlate with the Statement of Operations for the period due to the timing of sales and repurchases of the Fund’s shares in relation to income earned and/or fluctuating fair value of the investments of the Fund.
bBased on average daily shares outstanding.
cAmount rounds to less than $0.01 per share.
dTotal return is not annualized for periods less than one year.
eRatios are annualized for periods less than one year.
fBenefit of expense reduction rounds to less than 0.01%.
gBenefit of waiver and payments by affiliates rounds to less than 0.01%.
hSee Note 1(h) regarding mortgage dollar rolls.
franklintempleton.com |
The accompanying notes are an integral part of these financial statements. | Semiannual Report |
|
77 |
| ||
FRANKLIN CUSTODIAN FUNDS
FINANCIAL HIGHLIGHTS
Franklin U.S. Government Securities Fund(continued)
| Six Months Ended | ||||||||||||||||||||||||
| March 31, 2019 | Year Ended September 30, | |||||||||||||||||||||||
| (unaudited) | 2018 | 2017 | 2016 | 2015 | 2014 | |||||||||||||||||||
Class R6 | ||||||||||||||||||||||||
Per share operating performance (for a share outstanding throughout the period) | ||||||||||||||||||||||||
Net asset value, beginning of period | $ 5.87 | $ 6.15 | $ 6.37 | $ 6.42 | $ 6.50 | $ 6.55 | ||||||||||||||||||
Income from investment operationsa: | ||||||||||||||||||||||||
Net investment incomeb | 0.09 | 0.17 | 0.15 | 0.16 | 0.17 | 0.19 | ||||||||||||||||||
Net realized and unrealized gains (losses) | 0.12 | (0.25 | ) | (0.16 | ) | 0.01 | (0.02 | ) | 0.01 | |||||||||||||||
Total from investment operations | 0.21 | (0.08 | ) | (0.01 | ) | 0.17 | 0.15 | 0.20 | ||||||||||||||||
Less distributions from net investment income | (0.10 | ) | (0.20 | ) | (0.21 | ) | (0.22 | ) | (0.23 | ) | (0.25) | |||||||||||||
Net asset value, end of period | $ 5.98 | $ 5.87 | $ 6.15 | $ 6.37 | $ 6.42 | $ 6.50 | ||||||||||||||||||
Total returnc | 3.61% | (1.33)% | (0.16)% | 2.63% | 2.35% | 3.08% | ||||||||||||||||||
Ratios to average net assetsd | ||||||||||||||||||||||||
Expenses before waiver and payments by affiliates and expense reduction | 0.50% | 0.49% | 0.48% | 0.48% | 0.47% | 0.47% | ||||||||||||||||||
Expenses net of waiver and payments by affiliates and expense reductione | 0.50%f | 0.48% | 0.48%f | 0.48%f | 0.47%f | 0.47%f | ||||||||||||||||||
Net investment income | 2.91% | 2.78% | 2.48% | 2.49% | 2.57% | 2.90% | ||||||||||||||||||
Supplemental data | ||||||||||||||||||||||||
Net assets, end of period (000’s) | $793,247 | $694,813 | $446,174 | $624,619 | $375,644 | $497,246 | ||||||||||||||||||
Portfolio turnover rate | 13.88% | 44.67% | 86.72% | 92.18% | 69.10% | 69.73% | ||||||||||||||||||
Portfolio turnover rate excluding mortgage dollar rollsg | 13.88% | 44.67% | 86.72% | 92.18% | 58.70% | 38.79% | ||||||||||||||||||
aThe amount shown for a share outstanding throughout the period may not correlate with the Statement of Operations for the period due to the timing of sales and repurchases of the Fund’s shares in relation to income earned and/or fluctuating fair value of the investments of the Fund.
bBased on average daily shares outstanding.
cTotal return is not annualized for periods less than one year.
dRatios are annualized for periods less than one year.
eBenefit of expense reduction rounds to less than 0.01%.
fBenefit of waiver and payments by affiliates rounds to less than 0.01%.
gSee Note 1(h) regarding mortgage dollar rolls.
| 78 | Semiannual Report | The accompanying notes are an integral part of these financial statements. | franklintempleton.com | ||
FRANKLIN CUSTODIAN FUNDS
FINANCIAL HIGHLIGHTS
Franklin U.S. Government Securities Fund(continued)
| | Six Months Ended March 31, 2019 (unaudited) |
| ||||||||||||||||||||||
| Year Ended September 30, | ||||||||||||||||||||||||
|
2018 |
|
|
2017 |
|
|
2016 |
|
|
2015 |
|
|
2014 |
| ||||||||||
Advisor Class | ||||||||||||||||||||||||
| Per share operating performance (for a share outstanding throughout the period) | ||||||||||||||||||||||||
Net asset value, beginning of period | $5.87 | $6.15 | $6.37 | $6.42 | $6.50 | $6.55 | ||||||||||||||||||
Income from investment operationsa: | ||||||||||||||||||||||||
Net investment incomeb | 0.08 | 0.16 | 0.15 | 0.15 | 0.16 | 0.18 | ||||||||||||||||||
Net realized and unrealized gains (losses) | 0.13 | (0.25 | ) | (0.17 | ) | 0.01 | (0.02 | ) | 0.01 | |||||||||||||||
Total from investment operations | 0.21 | (0.09 | ) | (0.02 | ) | 0.16 | 0.14 | 0.19 | ||||||||||||||||
Less distributions from net investment income | (0.10 | ) | (0.19 | ) | (0.20 | ) | (0.21 | ) | (0.22 | ) | (0.24) | |||||||||||||
Net asset value, end of period | $5.98 | $5.87 | $6.15 | $6.37 | $6.42 | $6.50 | ||||||||||||||||||
Total returnc | 3.55% | (1.45)% | (0.30)% | 2.49% | 2.21% | 2.94% | ||||||||||||||||||
Ratios to average net assetsd | ||||||||||||||||||||||||
Expensese,f | 0.62% | 0.61% | 0.64% | 0.61% | 0.61% | 0.60% | ||||||||||||||||||
Net investment income | 2.79% | 2.65% | 2.32% | 2.36% | 2.43% | 2.77% | ||||||||||||||||||
Supplemental data | ||||||||||||||||||||||||
Net assets, end of period (000’s) | $877,978 | $720,281 | $854,640 | $718,975 | $622,339 | $652,737 | ||||||||||||||||||
Portfolio turnover rate | 13.88% | 44.67% | 86.72% | 92.18% | 69.10% | 69.73% | ||||||||||||||||||
Portfolio turnover rate excluding mortgage dollar rollsg | 13.88% | 44.67% | 86.72% | 92.18% | 58.70% | 38.79% | ||||||||||||||||||
aThe amount shown for a share outstanding throughout the period may not correlate with the Statement of Operations for the period due to the timing of sales and repurchases of the Fund’s shares in relation to income earned and/or fluctuating fair value of the investments of the Fund.
bBased on average daily shares outstanding.
cTotal return is not annualized for periods less than one year.
dRatios are annualized for periods less than one year.
eBenefit of expense reduction rounds to less than 0.01%.
fBenefit of waiver and payments by affiliates rounds to less than 0.01%.
gSee Note 1(h) regarding mortgage dollar rolls.
| franklintempleton.com | The accompanying notes are an integral part of these financial statements. | Semiannual Report | 79 | ||||
FRANKLIN CUSTODIAN FUNDS
Statement of Investments, March 31, 2019 (unaudited)
Franklin U.S. Government Securities Fund
|
| Principal Amount
|
|
| Value
|
| |||||
Mortgage-Backed Securities 93.4% | ||||||||||
| Government National Mortgage Association (GNMA) Fixed Rate 93.4% | ||||||||||
| GNMA I SF 30 Year, 3.50%, 4/15/43 - 5/15/43 | $ | 25,824,245 | $ | 26,527,132 | ||||||
| GNMA I SF 30 Year, 4.00%, 10/15/40 - 2/15/45 | 50,147,863 | 52,128,154 | ||||||||
| GNMA I SF 30 Year, 4.00%, 8/15/44 | 16,212,288 | 16,847,678 | ||||||||
| GNMA I SF 30 Year, 4.00%, 2/15/45 - 8/15/46 | 35,169,789 | 36,543,420 | ||||||||
| GNMA I SF 30 Year, 4.50%, 2/15/39 - 1/15/40 | 48,083,897 | 50,734,569 | ||||||||
| GNMA I SF 30 Year, 4.50%, 3/15/39 | 15,029,545 | 15,824,494 | ||||||||
| GNMA I SF 30 Year, 4.50%, 1/15/40 - 6/15/40 | 44,852,032 | 47,253,759 | ||||||||
| GNMA I SF 30 Year, 4.50%, 6/15/40 | 12,182,888 | 12,866,364 | ||||||||
| GNMA I SF 30 Year, 4.50%, 6/15/40 - 8/15/40 | 43,810,554 | 46,139,747 | ||||||||
| GNMA I SF 30 Year, 4.50%, 8/15/40 - 6/15/41 | 32,851,750 | 34,682,004 | ||||||||
| GNMA I SF 30 Year, 5.00%, 2/15/33 - 11/15/33 | 47,226,745 | 50,555,882 | ||||||||
| GNMA I SF 30 Year, 5.00%, 11/15/33 - 8/15/39 | 48,340,429 | 51,733,583 | ||||||||
| GNMA I SF 30 Year, 5.00%, 8/15/39 | 18,599,144 | 19,983,687 | ||||||||
| GNMA I SF 30 Year, 5.00%, 8/15/39 - 12/15/39 | 47,800,080 | 51,291,074 | ||||||||
| GNMA I SF 30 Year, 5.00%, 10/15/39 | 12,567,551 | 13,501,007 | ||||||||
| GNMA I SF 30 Year, 5.00%, 10/15/39 | 16,747,995 | 17,995,020 | ||||||||
| GNMA I SF 30 Year, 5.00%, 11/15/39 | 22,383,460 | 24,052,894 | ||||||||
| GNMA I SF 30 Year, 5.00%, 12/15/39 - 5/15/40 | 45,847,360 | 48,972,456 | ||||||||
| GNMA I SF 30 Year, 5.00%, 2/15/40 | 11,930,319 | 12,814,930 | ||||||||
| GNMA I SF 30 Year, 5.00%, 3/15/40 | 13,974,043 | 15,015,836 | ||||||||
| GNMA I SF 30 Year, 5.00%, 5/15/40 - 6/15/40 | 27,930,921 | 29,769,160 | ||||||||
| GNMA I SF 30 Year, 5.00%, 9/15/40 | 18,602,498 | 19,984,154 | ||||||||
| GNMA I SF 30 Year, 5.50%, 5/15/28 - 6/15/33 | 47,747,933 | 52,070,752 | ||||||||
| GNMA I SF 30 Year, 5.50%, 6/15/33 - 8/15/37 | 47,976,565 | 52,335,571 | ||||||||
| GNMA I SF 30 Year, 5.50%, 2/15/38 - 2/15/40 | 42,231,720 | 46,242,345 | ||||||||
| GNMA I SF 30 Year, 6.00%, 10/15/23 - 9/15/34 | 47,181,790 | 51,708,574 | ||||||||
| GNMA I SF 30 Year, 6.00%, 9/15/34 - 1/15/38 | 47,617,244 | 52,497,191 | ||||||||
| GNMA I SF 30 Year, 6.00%, 1/15/38 - 12/15/39 | 25,960,363 | 28,711,425 | ||||||||
| GNMA I SF 30 Year, 6.50%, 5/15/23 - 8/15/37 | 37,466,086 | 41,473,004 | ||||||||
| GNMA I SF 30 Year, 7.00%, 3/15/22 - 9/15/32 | 25,654,894 | 27,954,938 | ||||||||
| GNMA I SF 30 Year, 7.25%, 12/15/25 - 1/15/26 | 75,433 | 76,546 | ||||||||
| GNMA I SF 30 Year, 7.50%, 6/15/21 - 8/15/33 | 6,859,352 | 7,334,621 | ||||||||
| GNMA I SF 30 Year, 7.70%, 1/15/21 - 10/15/21 | 17,212 | 17,238 | ||||||||
| GNMA I SF 30 Year, 8.00%, 2/15/20 - 9/15/30 | 2,411,697 | 2,464,639 | ||||||||
| GNMA I SF 30 Year, 8.50%, 9/15/19 - 5/15/25 | 367,169 | 374,222 | ||||||||
| GNMA I SF 30 Year, 9.00%, 10/15/19 - 7/15/23 | 276,263 | 280,292 | ||||||||
| GNMA I SF 30 Year, 9.50%, 8/15/19 - 8/15/22 | 240,367 | 241,582 | ||||||||
| GNMA I SF 30 Year, 10.00%, 9/15/19 - 3/15/25 | 92,526 | 92,977 | ||||||||
| GNMA I SF 30 Year, 10.50%, 6/15/19 - 10/15/21 | 17,818 | 17,865 | ||||||||
| GNMA I SF 30 Year, 11.00%, 7/15/19 - 4/15/21 | 364 | 363 | ||||||||
| GNMA II SF 30 Year, 3.00%, 2/20/45 | 7,992,642 | 8,077,836 | ||||||||
| GNMA II SF 30 Year, 3.00%, 3/20/46 | 135,583,619 | 136,526,032 | ||||||||
| GNMA II SF 30 Year, 3.00%, 4/20/46 | 77,207,356 | 77,744,183 | ||||||||
| GNMA II SF 30 Year, 3.00%, 7/20/47 | 230,303,604 | 231,697,100 | ||||||||
| GNMA II SF 30 Year, 3.50%, 10/20/40 - 5/20/43 | 31,434,042 | 32,246,385 | ||||||||
| GNMA II SF 30 Year, 3.50%, 7/20/42 | 46,933,805 | 48,142,738 | ||||||||
| GNMA II SF 30 Year, 3.50%, 8/20/42 | 16,281,083 | 16,700,580 | ||||||||
| GNMA II SF 30 Year, 3.50%, 9/20/42 | 108,432,846 | 111,225,763 | ||||||||
| GNMA II SF 30 Year, 3.50%, 10/20/42 | 22,311,187 | 22,886,151 | ||||||||
| GNMA II SF 30 Year, 3.50%, 11/20/42 | 18,706,604 | 19,188,758 | ||||||||
| GNMA II SF 30 Year, 3.50%, 4/20/43 | 22,740,494 | 23,325,697 |
| 80 | Semiannual Report | franklintempleton.com | ||
FRANKLIN CUSTODIAN FUNDS
STATEMENT OF INVESTMENTS (UNAUDITED)
Franklin U.S. Government Securities Fund(continued)
|
| Principal Amount
|
|
| Value
|
| |||||||
Mortgage-Backed Securities(continued) | ||||||||||||
| Government National Mortgage Association (GNMA) Fixed Rate(continued) | ||||||||||||
| GNMA II SF 30 Year, 3.50%, 5/20/43 | $ | 30,950,646 | $ | 31,747,899 | ||||||||
| GNMA II SF 30 Year, 3.50%, 6/20/43 | 35,565,249 | 36,481,164 | ||||||||||
| GNMA II SF 30 Year, 3.50%, 8/20/43 | 25,354,863 | 26,007,927 | ||||||||||
| GNMA II SF 30 Year, 3.50%, 9/20/47 | 684,270,409 | 700,107,122 | ||||||||||
| GNMA II SF 30 Year, 3.50%, 11/20/47 | 674,740,765 | 690,224,399 | ||||||||||
| GNMA II SF 30 Year, 3.50%, 2/20/48 | 283,161,048 | 289,609,737 | ||||||||||
| GNMA II SF 30 Year, 4.00%, 5/20/40 - 10/20/48 | 30,211,566 | 31,346,876 | ||||||||||
| GNMA II SF 30 Year, 4.00%, 11/20/40 | 30,898,567 | 32,200,542 | ||||||||||
| GNMA II SF 30 Year, 4.00%, 12/20/40 | 18,240,218 | 19,008,182 | ||||||||||
| GNMA II SF 30 Year, 4.00%, 1/20/41 | 20,084,387 | 20,929,628 | ||||||||||
| GNMA II SF 30 Year, 4.00%, 7/20/41 | 24,539,546 | 25,572,057 | ||||||||||
| GNMA II SF 30 Year, 4.00%, 9/20/41 | 29,083,241 | 30,307,127 | ||||||||||
| GNMA II SF 30 Year, 4.00%, 10/20/41 | 35,738,287 | 37,241,334 | ||||||||||
| GNMA II SF 30 Year, 4.00%, 11/20/41 | 33,004,708 | 34,393,942 | ||||||||||
| GNMA II SF 30 Year, 4.00%, 2/20/44 | 20,279,607 | 21,016,341 | ||||||||||
| GNMA II SF 30 Year, 4.00%, 4/20/48 | 94,378,748 | 97,562,035 | ||||||||||
| GNMA II SF 30 Year, 4.00%, 6/20/48 | 80,603,519 | 83,322,183 | ||||||||||
| GNMA II SF 30 Year, 4.00%, 9/20/48 | 248,369,464 | 256,746,681 | ||||||||||
| GNMA II SF 30 Year, 4.00%, 11/20/48 | 98,916,893 | 102,253,246 | ||||||||||
| GNMA II SF 30 Year, 4.50%, 5/20/33 - 6/20/41 | 45,776,042 | 48,202,746 | ||||||||||
| GNMA II SF 30 Year, 4.50%, 12/20/39 | 20,626,284 | 21,728,009 | ||||||||||
| GNMA II SF 30 Year, 4.50%, 5/20/41 | 26,966,779 | 28,407,781 | ||||||||||
| GNMA II SF 30 Year, 4.50%, 6/20/41 | 32,542,570 | 34,278,136 | ||||||||||
| GNMA II SF 30 Year, 4.50%, 7/20/41 | 35,252,576 | 37,130,439 | ||||||||||
| GNMA II SF 30 Year, 4.50%, 8/20/41 - 8/20/42 | 6,217,935 | 6,549,132 | ||||||||||
| GNMA II SF 30 Year, 4.50%, 9/20/41 | 47,596,979 | 50,128,410 | ||||||||||
| GNMA II SF 30 Year, 4.50%, 10/20/41 | 35,408,266 | 37,293,706 | ||||||||||
| GNMA II SF 30 Year, 4.50%, 2/20/44 | 19,113,994 | 20,120,789 | ||||||||||
| GNMA II SF 30 Year, 5.00%, 7/20/33 - 9/20/41 | 44,496,416 | 47,669,408 | ||||||||||
| GNMA II SF 30 Year, 5.00%, 9/20/33 | 20,001,765 | 21,408,424 | ||||||||||
| GNMA II SF 30 Year, 5.00%, 7/20/39 | 11,539,393 | 12,351,012 | ||||||||||
| GNMA II SF 30 Year, 5.00%, 6/20/40 | 13,872,007 | 15,015,278 | ||||||||||
| GNMA II SF 30 Year, 5.50%, 6/20/34 - 1/20/36 | 46,173,464 | 50,668,915 | ||||||||||
| GNMA II SF 30 Year, 5.50%, 12/20/34 | 12,860,075 | 14,102,271 | ||||||||||
| GNMA II SF 30 Year, 5.50%, 2/20/36 - 4/20/40 | 17,201,542 | 18,700,047 | ||||||||||
| GNMA II SF 30 Year, 6.00%, 10/20/23 - 12/20/37 | 44,459,137 | 49,848,532 | ||||||||||
| GNMA II SF 30 Year, 6.00%, 1/20/38 - 7/20/39 | 12,857,107 | 14,259,074 | ||||||||||
| GNMA II SF 30 Year, 6.50%, 6/20/24 - 1/20/39 | 19,193,539 | 21,801,661 | ||||||||||
| GNMA II SF 30 Year, 7.00%, 2/20/28 - 7/20/33 | 4,921,114 | 5,715,860 | ||||||||||
| GNMA II SF 30 Year, 7.50%, 10/20/22 - 4/20/32 | 955,446 | 1,056,645 | ||||||||||
| GNMA II SF 30 Year, 8.00%, 5/20/24 - 6/20/30 | 477,298 | 541,629 | ||||||||||
| GNMA II SF 30 Year, 8.50%, 5/20/19 - 6/20/25 | 75,314 | 77,186 | ||||||||||
| GNMA II SF 30 Year, 9.00%, 10/20/21 - 11/20/21 | 18,237 | 18,690 | ||||||||||
| GNMA II SF 30 Year, 9.50%, 1/20/20 - 4/20/25 | 25,425 | 25,635 | ||||||||||
| GNMA II SF 30 Year, 10.00%, 6/20/19 - 3/20/21 | 22,543 | 22,784 | ||||||||||
| GNMA II SF 30 Year, 10.50%, 4/20/19 - 1/20/21 | 12,485 | 12,515 | ||||||||||
| GNMA II SF 30 Year, 11.00%, 1/20/21 | 2,177 | 2,183 | ||||||||||
| Total Mortgage-Backed Securities (Cost $4,896,170,598) |
|
4,910,087,691 |
|
| franklintempleton.com | Semiannual Report | 81 | ||
FRANKLIN CUSTODIAN FUNDS
STATEMENT OF INVESTMENTS (UNAUDITED)
Franklin U.S. Government Securities Fund(continued)
| | Principal Amount | | Value | |||||
U.S. Government and Agency Securities (Cost $89,492,706) 1.7% | ||||||||
U.S. Treasury Bond, 4.75%, 2/15/37 | $ 67,500,000 | $ | 88,730,859 | |||||
Total Investments before Short Term Investments | 4,998,818,550 | |||||||
| Shares | ||||||||
Short Term Investments (Cost $247,733,929) 4.7% | ||||||||
Money Market Funds 4.7% | ||||||||
a,bInstitutional Fiduciary Trust Money Market Portfolio, 2.10% | 247,733,929 | 247,733,929 | ||||||
Total Investments (Cost $5,233,397,233) 99.8% | 5,246,552,479 | |||||||
Other Assets, less Liabilities 0.2% | 10,740,342 | |||||||
Net Assets 100.0% | $ | 5,257,292,821 | ||||||
See Abbreviations on page 122.
aSee Note 3(f) regarding investments in affiliated management investment companies.
bThe rate shown is the annualizedseven-day effective yield at period end.
| 82 | Semiannual Report | The accompanying notes are an integral part of these financial statements. | franklintempleton.com | ||
FRANKLIN CUSTODIAN FUNDS
Financial Highlights
Franklin Utilities Fund
| Six Months Ended March 31, 2019 (unaudited) | Year Ended September 30, 2018a | |||||||
Class A | ||||||||
Per share operating performance (for a share outstanding throughout the period) | ||||||||
Net asset value, beginning of period | $18.66 | $19.16 | ||||||
Income from investment operationsb: | ||||||||
Net investment incomec | 0.28 | 0.02 | ||||||
Net realized and unrealized gains (losses) | 2.18 | (0.52 | ) | |||||
Total from investment operations | 2.46 | (0.50 | ) | |||||
Less distributions from: | ||||||||
Net investment income | (0.26 | ) | — | |||||
Net realized gains | (0.58 | ) | — | |||||
Total distributions | (0.84 | ) | — | |||||
Net asset value, end of period | $20.28 | $18.66 | ||||||
Total returnd | 13.47% | (2.61)% | ||||||
Ratios to average net assetse | ||||||||
Expensesf,g | 0.83% | 0.84% | ||||||
Net investment income | 2.62% | 2.62% | ||||||
Supplemental data | ||||||||
Net assets, end of period (000’s) | $282,536 | $3,536 | ||||||
Portfolio turnover rate | 2.63% | 4.58% | ||||||
aFor the period September 10, 2018 (effective date) to September 30, 2018.
bThe amount shown for a share outstanding throughout the period may not correlate with the Statement of Operations for the period due to the timing of sales and repurchases of the Fund’s shares in relation to income earned and/or fluctuating fair value of the investments of the Fund.
cBased on average daily shares outstanding.
dTotal return does not reflect sales commissions or contingent deferred sales charges, if applicable, and is not annualized for periods less than one year.
eRatios are annualized for periods less than one year.
fBenefit of expense reduction rounds to less than 0.01%.
gBenefit of waiver and payments by affiliates rounds to less than 0.01%.
| franklintempleton.com | The accompanying notes are an integral part of these financial statements. | Semiannual Report | 83 | ||||
FRANKLIN CUSTODIAN FUNDS
FINANCIAL HIGHLIGHTS
Franklin Utilities Fund(continued)
| Six Months Ended | ||||||||||||||||||||||||
| March 31, 2019 | Year Ended September 30, | |||||||||||||||||||||||
| (unaudited) | 2018 | 2017 | 2016 | 2015 | 2014 | |||||||||||||||||||
Class A1 | ||||||||||||||||||||||||
Per share operating performance (for a share outstanding throughout the period) | ||||||||||||||||||||||||
Net asset value, beginning of period | $18.66 | $19.18 | $17.85 | $16.08 | $16.58 | $14.62 | ||||||||||||||||||
Income from investment operationsa: | ||||||||||||||||||||||||
Net investment incomeb | 0.26 | 0.50 | 0.53 | 0.48 | 0.49 | 0.49 | ||||||||||||||||||
Net realized and unrealized gains (losses) | 2.21 | (0.17 | ) | 1.30 | 2.31 | (0.09 | ) | 2.00 | ||||||||||||||||
Total from investment operations | 2.47 | 0.33 | 1.83 | 2.79 | 0.40 | 2.49 | ||||||||||||||||||
Less distributions from: | ||||||||||||||||||||||||
Net investment income | (0.27 | ) | (0.54 | ) | (0.49 | ) | (0.50 | ) | (0.48 | ) | (0.49 | ) | ||||||||||||
Net realized gains | (0.58 | ) | (0.31 | ) | (0.01 | ) | (0.52 | ) | (0.42 | ) | (0.04 | ) | ||||||||||||
Total distributions | (0.85 | ) | (0.85 | ) | (0.50 | ) | (1.02 | ) | (0.90 | ) | (0.53 | ) | ||||||||||||
Net asset value, end of period | $20.28 | $18.66 | $19.18 | $17.85 | $16.08 | $16.58 | ||||||||||||||||||
Total returnc | 13.53% | 1.68% | 10.38% | 18.23% | 2.19% | 17.24% | ||||||||||||||||||
Ratios to average net assetsd | ||||||||||||||||||||||||
Expensese | 0.73% | f | 0.74%f | 0.75%f | 0.73% | f | 0.73% | 0.75% | f | |||||||||||||||
Net investment income | 2.72% | 2.72% | 2.86% | 2.81% | 2.88% | 3.05% | ||||||||||||||||||
Supplemental data | ||||||||||||||||||||||||
Net assets, end of period (000’s) | $3,893,222 | $3,654,795 | $4,182,780 | $4,180,124 | $3,524,835 | $3,717,397 | ||||||||||||||||||
Portfolio turnover rate | 2.63% | 4.58% | 0.89% | 7.17% | 9.55% | 8.10% | ||||||||||||||||||
aThe amount shown for a share outstanding throughout the period may not correlate with the Statement of Operations for the period due to the timing of sales and repurchases of the Fund’s shares in relation to income earned and/or fluctuating fair value of the investments of the Fund.
bBased on average daily shares outstanding.
cTotal return does not reflect sales commissions or contingent deferred sales charges, if applicable, and is not annualized for periods less than one year.
dRatios are annualized for periods less than one year.
eBenefit of waiver and payments by affiliates rounds to less than 0.01%.
fBenefit of expense reduction rounds to less than 0.01%.
| 84 | Semiannual Report | The accompanying notes are an integral part of these financial statements. | franklintempleton.com | ||
FRANKLIN CUSTODIAN FUNDS
FINANCIAL HIGHLIGHTS
Franklin Utilities Fund(continued)
Six Months Ended March 31, 2019 (unaudited) | ||||||||||||||||||||||||
| Year Ended September 30, | ||||||||||||||||||||||||
2018 |
2017 |
2016 |
2015 |
2014 | ||||||||||||||||||||
Class C | ||||||||||||||||||||||||
Per share operating performance (for a share outstanding throughout the period) | ||||||||||||||||||||||||
Net asset value, beginning of period | $18.57 | $19.09 | $17.76 | $16.01 | $16.50 | $14.56 | ||||||||||||||||||
Income from investment operationsa: | ||||||||||||||||||||||||
Net investment incomeb | 0.20 | 0.41 | 0.43 | 0.39 | 0.40 | 0.41 | ||||||||||||||||||
Net realized and unrealized gains (losses) | 2.21 | (0.18 | ) | 1.30 | 2.30 | (0.08 | ) | 1.98 | ||||||||||||||||
Total from investment operations | 2.41 | 0.23 | 1.73 | 2.69 | 0.32 | 2.39 | ||||||||||||||||||
Less distributions from: | ||||||||||||||||||||||||
Net investment income | (0.23 | ) | (0.44 | ) | (0.39 | ) | (0.42 | ) | (0.39 | ) | (0.41 | ) | ||||||||||||
Net realized gains | (0.58 | ) | (0.31 | ) | (0.01 | ) | (0.52 | ) | (0.42 | ) | (0.04 | ) | ||||||||||||
Total distributions | (0.81 | ) | (0.75 | ) | (0.40 | ) | (0.94 | ) | (0.81 | ) | (0.45 | ) | ||||||||||||
Net asset value, end of period | $20.17 | $18.57 | $19.09 | $17.76 | $16.01 | $16.50 | ||||||||||||||||||
Total returnc | 13.21% | 1.18% | 9.88% | 17.59% | 1.74% | 16.61% | ||||||||||||||||||
Ratios to average net assetsd | ||||||||||||||||||||||||
Expensese | 1.23% | f | 1.24% | f | 1.25% | f | 1.23% | f | 1.23% | 1.25% | f | |||||||||||||
Net investment income | 2.22% | 2.22% | 2.36% | 2.31% | 2.38% | 2.55% | ||||||||||||||||||
Supplemental data | ||||||||||||||||||||||||
Net assets, end of period (000’s) | $743,805 | $834,070 | $981,515 | $1,064,065 | $931,800 | $986,318 | ||||||||||||||||||
Portfolio turnover rate | 2.63% | 4.58% | 0.89% | 7.17% | 9.55% | 8.10% | ||||||||||||||||||
aThe amount shown for a share outstanding throughout the period may not correlate with the Statement of Operations for the period due to the timing of sales and repurchases of the Fund’s shares in relation to income earned and/or fluctuating fair value of the investments of the Fund.
bBased on average daily shares outstanding.
cTotal return does not reflect sales commissions or contingent deferred sales charges, if applicable, and is not annualized for periods less than one year.
dRatios are annualized for periods less than one year.
eBenefit of waiver and payments by affiliates rounds to less than 0.01%.
fBenefit of expense reduction rounds to less than 0.01%.
| franklintempleton.com | The accompanying notes are an integral part of these financial statements. | Semiannual Report | 85 | ||||
FRANKLIN CUSTODIAN FUNDS
FINANCIAL HIGHLIGHTS
Franklin Utilities Fund(continued)
Six Months Ended March 31, 2019 (unaudited) | Year Ended September 30, | |||||||||||||||||||||||
| 2018 | 2017 | 2016 | 2015 | 2014 | ||||||||||||||||||||
Class R | ||||||||||||||||||||||||
| Per share operating performance (for a share outstanding throughout the period) | ||||||||||||||||||||||||
Net asset value, beginning of period | $18.59 | $19.11 | $17.78 | $16.02 | $16.52 | $14.58 | ||||||||||||||||||
Income from investment operationsa: | ||||||||||||||||||||||||
Net investment incomeb | 0.23 | 0.44 | 0.46 | 0.42 | 0.42 | 0.43 | ||||||||||||||||||
Net realized and unrealized gains (losses) | 2.20 | (0.18 | ) | 1.30 | 2.30 | (0.09 | ) | 1.99 | ||||||||||||||||
Total from investment operations | 2.43 | 0.26 | 1.76 | 2.72 | 0.33 | 2.42 | ||||||||||||||||||
Less distributions from: | ||||||||||||||||||||||||
Net investment income | (0.24 | ) | (0.47 | ) | (0.42 | ) | (0.44 | ) | (0.41 | ) | (0.44) | |||||||||||||
Net realized gains | (0.58 | ) | (0.31 | ) | (0.01 | ) | (0.52 | ) | (0.42 | ) | (0.04) | |||||||||||||
Total distributions | (0.82 | ) | (0.78 | ) | (0.43 | ) | (0.96 | ) | (0.83 | ) | (0.48) | |||||||||||||
Net asset value, end of period | $20.20 | $18.59 | $19.11 | $17.78 | $16.02 | $16.52 | ||||||||||||||||||
Total returnc | 13.33% | 1.33% | 10.04% | 17.81% | 1.83% | 16.75% | ||||||||||||||||||
Ratios to average net assetsd | ||||||||||||||||||||||||
Expensese | 1.08% | f | 1.09% | f | 1.10% | f | 1.08% | f | 1.08% | 1.10%f | ||||||||||||||
Net investment income | 2.37% | 2.37% | 2.51% | 2.46% | 2.53% | 2.70% | ||||||||||||||||||
Supplemental data | ||||||||||||||||||||||||
Net assets, end of period (000’s) | $84,299 | $72,927 | $94,465 | $103,247 | $83,271 | $95,498 | ||||||||||||||||||
Portfolio turnover rate | 2.63% | 4.58% | 0.89% | 7.17% | 9.55% | 8.10% | ||||||||||||||||||
aThe amount shown for a share outstanding throughout the period may not correlate with the Statement of Operations for the period due to the timing of sales and repurchases of the Fund’s shares in relation to income earned and/or fluctuating fair value of the investments of the Fund.
bBased on average daily shares outstanding.
cTotal return is not annualized for periods less than one year.
dRatios are annualized for periods less than one year.
eBenefit of waiver and payments by affiliates rounds to less than 0.01%.
fBenefit of expense reduction rounds to less than 0.01%.
| 86 | Semiannual Report | The accompanying notes are an integral part of these financial statements. | franklintempleton.com | ||
FRANKLIN CUSTODIAN FUNDS
FINANCIAL HIGHLIGHTS
Franklin Utilities Fund(continued)
Six Months Ended March 31, 2019 (unaudited) | Year Ended September 30, | |||||||||||||||||||||
| 2018 | 2017 | 2016 | 2015 | 2014 | ||||||||||||||||||
Class R6 | ||||||||||||||||||||||
| Per share operating performance (for a share outstanding throughout the period) | ||||||||||||||||||||||
Net asset value, beginning of period | $18.81 | $19.32 | $17.97 | $16.18 | $16.68 | $14.71 | ||||||||||||||||
Income from investment operationsa: | ||||||||||||||||||||||
Net investment incomeb | 0.28 | 0.55 | 0.58 | 0.53 | 0.53 | 0.53 | ||||||||||||||||
Net realized and unrealized gains (losses) | 2.23 | (0.17 | ) | 1.31 | 2.32 | (0.09 | ) | 2.01 | ||||||||||||||
Total from investment operations | 2.51 | 0.38 | 1.89 | 2.85 | 0.44 | 2.54 | ||||||||||||||||
Less distributions from: | ||||||||||||||||||||||
Net investment income | (0.30 | ) | (0.58 | ) | (0.53 | ) | (0.54 | ) | (0.52 | ) | (0.53) | |||||||||||
Net realized gains | (0.58 | ) | (0.31 | ) | (0.01 | ) | (0.52 | ) | (0.42 | ) | (0.04) | |||||||||||
Total distributions | (0.88 | ) | (0.89 | ) | (0.54 | ) | (1.06 | ) | (0.94 | ) | (0.57) | |||||||||||
Net asset value, end of period | $20.44 | $18.81 | $19.32 | $17.97 | $16.18 | $16.68 | ||||||||||||||||
Total returnc | 13.60% | 1.97% | 10.70% | 18.55% | 2.45% | 17.51% | ||||||||||||||||
Ratios to average net assetsd | ||||||||||||||||||||||
Expenses before waiver and payments by affiliates | 0.53% | 0.52% | 0.48% | 0.47% | 0.47% | 0.48% | ||||||||||||||||
Expenses net of waiver and payments by affiliates | 0.50% | e | 0.48% | e | 0.48% | e,f | 0.47% | e,f | 0.47% | f | 0.48%e,f | |||||||||||
Net investment income | 2.95% | 2.98% | 3.13% | 3.07% | 3.14% | 3.32% | ||||||||||||||||
Supplemental data | ||||||||||||||||||||||
Net assets, end of period (000’s) | $236,745 | $ | 230,393 | $ | 241,455 | $ | 219,587 | $ | 201,225 | $236,437 | ||||||||||||
Portfolio turnover rate | 2.63% | 4.58% | 0.89% | 7.17% | 9.55% | 8.10% | ||||||||||||||||
aThe amount shown for a share outstanding throughout the period may not correlate with the Statement of Operations for the period due to the timing of sales and repurchases of the Fund’s shares in relation to income earned and/or fluctuating fair value of the investments of the Fund.
bBased on average daily shares outstanding.
cTotal return is not annualized for periods less than one year.
dRatios are annualized for periods less than one year.
eBenefit of expense reduction rounds to less than 0.01%.
fBenefit of waiver and payments by affiliates rounds to less than 0.01%.
| franklintempleton.com | The accompanying notes are an integral part of these financial statements. | Semiannual Report | 87 | ||||
FRANKLIN CUSTODIAN FUNDS
FINANCIAL HIGHLIGHTS
Franklin Utilities Fund(continued)
Six Months Ended (unaudited) | Year Ended September 30, | |||||||||||||||||||||||
| 2018 | 2017 | 2016 | 2015 | 2014 | ||||||||||||||||||||
Advisor Class | ||||||||||||||||||||||||
| Per share operating performance (for a share outstanding throughout the period) | ||||||||||||||||||||||||
Net asset value, beginning of period | $18.81 | $19.32 | $17.97 | $16.19 | $16.68 | $14.71 | ||||||||||||||||||
Income from investment operationsa: | ||||||||||||||||||||||||
Net investment incomeb | 0.28 | 0.54 | 0.57 | 0.51 | 0.52 | 0.52 | ||||||||||||||||||
Net realized and unrealized gains (losses) | 2.23 | (0.18 | ) | 1.30 | 2.32 | (0.09 | ) | 2.00 | ||||||||||||||||
Total from investment operations | 2.51 | 0.36 | 1.87 | 2.83 | 0.43 | 2.52 | ||||||||||||||||||
Less distributions from: | ||||||||||||||||||||||||
Net investment income | (0.29 | ) | (0.56 | ) | (0.51 | ) | (0.53 | ) | (0.50 | ) | (0.51) | |||||||||||||
Net realized gains | (0.58 | ) | (0.31 | ) | (0.01 | ) | (0.52 | ) | (0.42 | ) | (0.04) | |||||||||||||
Total distributions | (0.87 | ) | (0.87 | ) | (0.52 | ) | (1.05 | ) | (0.92 | ) | (0.55) | |||||||||||||
Net asset value, end of period | $20.45 | $18.81 | $19.32 | $17.97 | $16.19 | $16.68 | ||||||||||||||||||
Total returnc | 13.61% | 1.82% | 10.64% | 18.34% | 2.40% | 17.37% | ||||||||||||||||||
Ratios to average net assetsd | ||||||||||||||||||||||||
Expensese | 0.58% | f | 0.59% | f | 0.60% | f | 0.58% | f | 0.58% | 0.60%f | ||||||||||||||
Net investment income | 2.87% | 2.87% | 3.01% | 2.96% | 3.03% | 3.20% | ||||||||||||||||||
Supplemental data | ||||||||||||||||||||||||
Net assets, end of period (000’s) | $1,006,926 | $ | 927,845 | $ | 963,228 | $ | 755,484 | $ | 549,371 | $ | 562,202 | |||||||||||||
Portfolio turnover rate | 2.63% | 4.58% | 0.89% | 7.17% | 9.55% | 8.10% | ||||||||||||||||||
aThe amount shown for a share outstanding throughout the period may not correlate with the Statement of Operations for the period due to the timing of sales and repurchases of the Fund’s shares in relation to income earned and/or fluctuating fair value of the investments of the Fund.
bBased on average daily shares outstanding.
cTotal return is not annualized for periods less than one year.
dRatios are annualized for periods less than one year.
eBenefit of waiver and payments by affiliates rounds to less than 0.01%.
fBenefit of expense reduction rounds to less than 0.01%.
| 88 | Semiannual Report | The accompanying notes are an integral part of these financial statements. | franklintempleton.com | ||
FRANKLIN CUSTODIAN FUNDS
Statement of Investments, March 31, 2019 (unaudited)
Franklin Utilities Fund
| Country | Shares | Value | ||||||||||||||
Common Stocks 98.8% | ||||||||||||||||
Electric Utilities 55.7% | ||||||||||||||||
Alliant Energy Corp. | United States | 3,800,000 | $ | 179,094,000 | ||||||||||||
American Electric Power Co. Inc. | United States | 3,800,000 | 318,250,000 | |||||||||||||
Duke Energy Corp. | United States | 3,050,000 | 274,500,000 | |||||||||||||
Edison International | United States | 2,800,000 | 173,376,000 | |||||||||||||
Emera Inc. | Canada | 2,000,000 | 74,810,989 | |||||||||||||
Entergy Corp. | United States | 2,100,000 | 200,823,000 | |||||||||||||
Evergy Inc. | United States | 4,200,000 | 243,810,000 | |||||||||||||
Eversource Energy | United States | 2,300,000 | 163,185,000 | |||||||||||||
Exelon Corp. | United States | 6,600,000 | 330,858,000 | |||||||||||||
FirstEnergy Corp. | United States | 4,500,000 | 187,245,000 | |||||||||||||
NextEra Energy Inc. | United States | 2,750,000 | 531,630,000 | |||||||||||||
OGE Energy Corp. | United States | 1,400,000 | 60,368,000 | |||||||||||||
a | PG&E Corp. | United States | 400,000 | 7,120,000 | ||||||||||||
Pinnacle West Capital Corp. | United States | 1,350,000 | 129,033,000 | |||||||||||||
PNM Resources Inc. | United States | 2,000,070 | 94,683,314 | |||||||||||||
PPL Corp. | United States | 2,200,000 | 69,828,000 | |||||||||||||
The Southern Co. | United States | 3,800,000 | 196,384,000 | |||||||||||||
| Xcel Energy Inc. | United States | 4,400,000 | 247,324,000 | |||||||||||||
| 3,482,322,303 | ||||||||||||||||
Gas Utilities 1.3% | ||||||||||||||||
Atmos Energy Corp. | United States | 250,000 | 25,732,500 | |||||||||||||
| Spire Inc. | United States | 700,000 | 57,603,000 | |||||||||||||
| 83,335,500 | ||||||||||||||||
Multi-Utilities 32.7% | ||||||||||||||||
Ameren Corp. | United States | 1,200,000 | 88,260,000 | |||||||||||||
Black Hills Corp. | United States | 500,000 | 37,035,000 | |||||||||||||
CenterPoint Energy Inc. | United States | 5,000,000 | 153,500,000 | |||||||||||||
CMS Energy Corp. | United States | 5,000,000 | 277,700,000 | |||||||||||||
Consolidated Edison Inc. | United States | 1,500,000 | 127,215,000 | |||||||||||||
Dominion Energy Inc. | United States | 4,350,000 | 333,471,000 | |||||||||||||
DTE Energy Co. | United States | 1,500,000 | 187,110,000 | |||||||||||||
E.ON SE | Germany | 2,000,000 | 22,241,537 | |||||||||||||
National Grid PLC | United Kingdom | 5,999,933 | 66,502,038 | |||||||||||||
NiSource Inc. | United States | 3,600,000 | 103,176,000 | |||||||||||||
NorthWestern Corp. | United States | 596,800 | 42,020,688 | |||||||||||||
Public Service Enterprise Group Inc. | United States | 2,800,000 | 166,348,000 | |||||||||||||
Sempra Energy | United States | 2,200,000 | 276,892,000 | |||||||||||||
| WEC Energy Group Inc. | United States | 2,000,000 | 158,160,000 | |||||||||||||
| 2,039,631,263 | ||||||||||||||||
Oil, Gas & Consumable Fuels 5.6% | ||||||||||||||||
Enbridge Inc. | Canada | 700,000 | 25,382,000 | |||||||||||||
Kinder Morgan Inc. | United States | 4,800,000 | 96,048,000 | |||||||||||||
ONEOK Inc. | United States | 568,200 | 39,683,088 | |||||||||||||
Targa Resources Corp. | United States | 900,000 | 37,395,000 | |||||||||||||
TransCanada Corp. | Canada | 800,000 | 35,942,810 | |||||||||||||
| The Williams Cos. Inc. | United States | 4,000,000 | 114,880,000 | |||||||||||||
| 349,330,898 | ||||||||||||||||
| franklintempleton.com | Semiannual Report | 89 | ||
FRANKLIN CUSTODIAN FUNDS
STATEMENT OF INVESTMENTS (UNAUDITED)
Franklin Utilities Fund(continued)
| Country | Shares | Value | ||||||||||||
Common Stocks(continued) | ||||||||||||||
Water Utilities 3.5% | ||||||||||||||
American Water Works Co. Inc. | United States | 1,500,000 | $ | 156,390,000 | ||||||||||
United Utilities Group PLC | United Kingdom | 6,000,000 | 63,657,575 | |||||||||||
|
| |||||||||||||
| 220,047,575 | ||||||||||||||
|
| |||||||||||||
Total Common Stocks (Cost $3,012,282,377) | 6,174,667,539 | |||||||||||||
|
| |||||||||||||
| Principal Amount | ||||||||||||||
Corporate Bonds (Cost $6,088,634) 0.1% | ||||||||||||||
Multi-Utilities 0.1% | ||||||||||||||
Aquila Inc., senior note, 8.27%, 11/15/21 | United States | $ | 6,100,000 | 6,859,155 | ||||||||||
|
| |||||||||||||
Total Investments before Short Term Investments (Cost $3,018,371,011) | 6,181,526,694 | |||||||||||||
|
| |||||||||||||
| Shares | ||||||||||||||
Short Term Investments (Cost $62,743,460) 1.0% | ||||||||||||||
Money Market Funds 1.0% | ||||||||||||||
b,cInstitutional Fiduciary Trust Money Market Portfolio, 2.10% | United States | 62,743,460 | 62,743,460 | |||||||||||
|
| |||||||||||||
Total Investments (Cost $3,081,114,471) 99.9% | 6,244,270,154 | |||||||||||||
Other Assets, less Liabilities 0.1% | 3,262,833 | |||||||||||||
|
| |||||||||||||
Net Assets 100.0% | $ | 6,247,532,987 | ||||||||||||
|
| |||||||||||||
aNon-income producing.
bSee Note 3(f) regarding investments in affiliated management investment companies.
cThe rate shown is the annualizedseven-day effective yield at period end.
| 90 | Semiannual Report | The accompanying notes are an integral part of these financial statements. | franklintempleton.com | ||
FRANKLIN CUSTODIAN FUNDS
Statements of Assets and Liabilities
March 31, 2019 (unaudited)
| | Franklin DynaTech Fund | | | Franklin Growth Fund | | | Franklin Income Fund | | ||||
Assets: | ||||||||||||
Investments in securities: | ||||||||||||
Cost - Unaffiliated issuers | $3,913,912,166 | $ | 5,254,067,834 | $ | 70,180,441,362 | |||||||
Cost -Non-controlled affiliates (Note 3f and 9) | 231,269,009 | 199,173,181 | 2,018,865,765 | |||||||||
|
| |||||||||||
Value - Unaffiliated issuers | $7,306,290,398 | $ | 15,451,249,065 | $ | 72,715,795,628 | |||||||
Value -Non-controlled affiliates (Note 3f and 9) | 231,269,009 | 199,173,181 | 2,018,865,765 | |||||||||
Cash | — | 1,102,275 | 28,501,435 | |||||||||
Receivables: | ||||||||||||
Investment securities sold | — | — | 515,007,702 | |||||||||
Capital shares sold | 29,667,144 | 21,241,147 | 64,365,044 | |||||||||
Dividends and interest | 1,639,202 | 7,756,760 | 704,283,476 | |||||||||
Other assets | 6,669 | 14,875 | 103,543 | |||||||||
|
| |||||||||||
Total assets | 7,568,872,422 | 15,680,537,303 | 76,046,922,593 | |||||||||
|
| |||||||||||
Liabilities: | ||||||||||||
Payables: | ||||||||||||
Investment securities purchased | 19,342,400 | 21,729,600 | 796,823,119 | |||||||||
Capital shares redeemed | 9,236,559 | 27,613,581 | 86,975,475 | |||||||||
Management fees | 2,801,825 | 5,671,193 | 23,004,101 | |||||||||
Distribution fees | 2,486,806 | 5,065,018 | 27,935,626 | |||||||||
Transfer agent fees | 341,540 | 1,989,868 | 8,906,302 | |||||||||
Options written, at value (premiums received $—, $— and $59,613,423, respectively) | — | — | 67,461,259 | |||||||||
Accrued expenses and other liabilities | 71,860 | 401,752 | 3,194,506 | |||||||||
|
| |||||||||||
Total liabilities | 34,280,990 | 62,471,012 | 1,014,300,388 | |||||||||
|
| |||||||||||
Net assets, at value | $7,534,591,432 | $ | 15,618,066,291 | $ | 75,032,622,205 | |||||||
|
| |||||||||||
Net assets consist of: | ||||||||||||
Paid-in capital | $4,179,578,641 | $ | 5,180,430,711 | $ | 74,979,221,170 | |||||||
Total distributable earnings (loss) | 3,355,012,791 | 10,437,635,580 | 53,401,035 | |||||||||
|
| |||||||||||
Net assets, at value | $7,534,591,432 | $ | 15,618,066,291 | $ | 75,032,622,205 | |||||||
|
| |||||||||||
| franklintempleton.com | The accompanying notes are an integral part of these financial statements. | Semiannual Report | 91 | ||||
FRANKLIN CUSTODIAN FUNDS
FINANCIAL STATEMENTS
Statements of Assets and Liabilities(continued)
March 31, 2019 (unaudited)
| | Franklin DynaTech Fund | | | Franklin Growth Fund | | | Franklin Income Fund | | ||||
Class A: | ||||||||||||
Net assets, at value | $4,039,753,006 | $8,897,209,834 | $5,144,250,188 | |||||||||
|
| |||||||||||
Shares outstanding | 50,614,280 | 85,823,472 | 2,222,814,830 | |||||||||
|
| |||||||||||
Net asset value per sharea | $79.81 | $103.67 | $2.31 | |||||||||
|
| |||||||||||
Maximum offering price per share (net asset value per share ÷ 94.50%, 94.50% and 96.25%, respectively) | $84.46 | $109.70 | $2.40 | |||||||||
|
| |||||||||||
Class A1: | ||||||||||||
Net assets, at value | $41,201,270,096 | |||||||||||
|
| |||||||||||
Shares outstanding | 17,762,207,097 | |||||||||||
|
| |||||||||||
Net asset value and maximum offering price per sharea | $2.32 | |||||||||||
|
| |||||||||||
Maximum offering price per share (net asset value per share ÷ 96.25%) | $2.41 | |||||||||||
|
| |||||||||||
Class C: | ||||||||||||
Net assets, at value | $ 549,153,851 | $ 726,451,121 | $15,051,862,931 | |||||||||
|
| |||||||||||
Shares outstanding | 8,277,570 | 7,665,689 | 6,400,651,441 | |||||||||
|
| |||||||||||
Net asset value and maximum offering price per sharea | $66.34 | $94.77 | $2.35 | |||||||||
|
| |||||||||||
Class R: | ||||||||||||
Net assets, at value | $ 107,740,616 | $ 457,857,728 | $ 278,371,961 | |||||||||
|
| |||||||||||
Shares outstanding | 1,391,658 | 4,433,124 | 122,338,847 | |||||||||
|
| |||||||||||
Net asset value and maximum offering price per share | $77.42 | $103.28 | $2.28 | |||||||||
|
| |||||||||||
Class R6: | ||||||||||||
Net assets, at value | $1,990,361,216 | $2,464,094,776 | $ 1,954,178,237 | |||||||||
|
| |||||||||||
Shares outstanding | 23,937,978 | 23,741,087 | 849,029,459 | |||||||||
|
| |||||||||||
Net asset value and maximum offering price per share | $83.15 | $103.79 | $2.30 | |||||||||
|
| |||||||||||
Advisor Class: | ||||||||||||
Net assets, at value | $ 847,582,743 | $3,072,452,832 | $11,402,688,792 | |||||||||
|
| |||||||||||
Shares outstanding | 10,293,097 | 29,573,826 | 4,957,880,275 | |||||||||
|
| |||||||||||
Net asset value and maximum offering price per share | $82.34 | $103.89 | $2.30 | |||||||||
|
| |||||||||||
aRedemption price is equal to net asset value less contingent deferred sales charges, if applicable.
| 92 | Semiannual Report | The accompanying notes are an integral part of these financial statements. | franklintempleton.com | ||
FRANKLIN CUSTODIAN FUNDS
FINANCIAL STATEMENTS
Statements of Assets and Liabilities(continued)
March 31, 2019 (unaudited)
| | Franklin U.S. Government Securities Fund | | Franklin Utilities Fund | | ||||
Assets: | ||||||||
Investments in securities: | ||||||||
Cost - Unaffiliated issuers | $4,985,663,304 | $3,018,371,011 | ||||||
Cost -Non-controlled affiliates (Note 3f and 9) | 247,733,929 | 62,743,460 | ||||||
|
| |||||||
Value - Unaffiliated issuers | $4,998,818,550 | $6,181,526,694 | ||||||
Value -Non-controlled affiliates (Note 3f and 9) | 247,733,929 | 62,743,460 | ||||||
Receivables: | ||||||||
Capital shares sold | 6,839,863 | 6,057,594 | ||||||
Dividends and interest | 15,727,183 | 8,977,442 | ||||||
Other assets | 5,040 | 5,971 | ||||||
|
| |||||||
Total assets | 5,269,124,565 | 6,259,311,161 | ||||||
|
| |||||||
Liabilities: | ||||||||
Payables: | ||||||||
Capital shares redeemed | 6,103,172 | 6,532,493 | ||||||
Management fees | 1,934,051 | 2,347,910 | ||||||
Distribution fees. | 1,255,596 | 1,871,129 | ||||||
Transfer agent fees | 803,636 | 747,399 | ||||||
Distributions to shareholders | 1,529,533 | — | ||||||
Accrued expenses and other liabilities | 205,756 | 279,243 | ||||||
|
| |||||||
Total liabilities | 11,831,744 | 11,778,174 | ||||||
|
| |||||||
Net assets, at value | $5,257,292,821 | $6,247,532,987 | ||||||
|
| |||||||
Net assets consist of: | ||||||||
Paid-in capital | $5,816,830,837 | $3,008,722,357 | ||||||
Total distributable earnings (loss) | (559,538,016 | ) | 3,238,810,630 | |||||
|
| |||||||
Net assets, at value | $5,257,292,821 | $6,247,532,987 | ||||||
|
| |||||||
| franklintempleton.com | The accompanying notes are an integral part of these financial statements. | Semiannual Report | 93 | ||||
FRANKLIN CUSTODIAN FUNDS
FINANCIAL STATEMENTS
Statements of Assets and Liabilities(continued)
March 31, 2019 (unaudited)
| | Franklin U.S. Government Securities Fund | | Franklin Utilities Fund | |||||
Class A: | ||||||||
Net assets, at value | $ 180,329,563 | $ 282,536,321 | ||||||
|
| |||||||
Shares outstanding | 30,260,843 | 13,933,737 | ||||||
|
| |||||||
Net asset value per sharea | $5.96 | $20.28 | ||||||
|
| |||||||
Maximum offering price per share (net asset value per share ÷ 96.25%) | $6.19 | $21.07 | ||||||
|
| |||||||
Class A1: | ||||||||
Net assets, at value | $2,940,656,215 | $3,893,221,690 | ||||||
|
| |||||||
Shares outstanding | 493,406,802 | 191,946,375 | ||||||
|
| |||||||
Net asset value and maximum offering price per sharea | $5.96 | $20.28 | ||||||
|
| |||||||
Maximum offering price per share (net asset value per share ÷ 96.25%) | $6.19 | $21.07 | ||||||
|
| |||||||
Class C: | ||||||||
Net assets, at value | $ 434,389,281 | $ 743,805,036 | ||||||
|
| |||||||
Shares outstanding | 73,428,139 | 36,874,164 | ||||||
|
| |||||||
Net asset value and maximum offering price per sharea | $5.92 | $20.17 | ||||||
|
| |||||||
Class R: | ||||||||
Net assets, at value | $ 30,693,251 | $ 84,299,277 | ||||||
|
| |||||||
Shares outstanding | 5,152,937 | 4,173,165 | ||||||
|
| |||||||
Net asset value and maximum offering price per share. | $5.96 | $20.20 | ||||||
|
| |||||||
Class R6: | ||||||||
Net assets, at value | $ 793,246,558 | $ 236,744,523 | ||||||
|
| |||||||
Shares outstanding | 132,645,999 | 11,579,687 | ||||||
|
| |||||||
Net asset value and maximum offering price per share. | $5.98 | $20.44 | ||||||
|
| |||||||
Advisor Class: | ||||||||
Net assets, at value | $ 877,977,953 | $1,006,926,140 | ||||||
|
| |||||||
Shares outstanding | 146,814,787 | 49,248,453 | ||||||
|
| |||||||
Net asset value and maximum offering price per share. | $5.98 | $20.45 | ||||||
|
| |||||||
aRedemption price is equal to net asset value less contingent deferred sales charges, if applicable.
| 94 | Semiannual Report | The accompanying notes are an integral part of these financial statements. | franklintempleton.com | ||
FRANKLIN CUSTODIAN FUNDS
FINANCIAL STATEMENTS
Statements of Operations
for the six months ended March 31, 2019 (unaudited)
| | Franklin DynaTech Fund | | | Franklin Growth Fund | | | Franklin Income Fund | |||||
Investment income: | ||||||||||||
Dividends: (net of foreign taxes)* | ||||||||||||
Unaffiliated issuers | $ 18,485,328 | $ 94,974,893 | $ 477,714,752 | |||||||||
Non-controlled affiliates (Note 3f and 9) | 1,878,621 | 2,590,866 | 6,192,789 | |||||||||
Interest: | ||||||||||||
Unaffiliated issuers | 14,061 | — | 1,252,828,591 | |||||||||
Income from securities loaned: | ||||||||||||
Unaffiliated issuers (net of fees and rebates) | — | — | 86,821 | |||||||||
Non-controlled affiliates (Note 3f) | — | — | 45,327 | |||||||||
|
| |||||||||||
Total investment income | 20,378,010 | 97,565,759 | 1,736,868,280 | |||||||||
|
| |||||||||||
Expenses: | ||||||||||||
Management fees (Note 3a) | 15,097,085 | 33,112,882 | 136,962,143 | |||||||||
Distribution fees: (Note 3c) | ||||||||||||
Class A | 4,414,613 | 10,518,111 | 4,682,997 | |||||||||
Class A1 | — | — | 30,447,979 | |||||||||
Class C | 2,455,049 | 3,650,468 | 50,552,151 | |||||||||
Class R | 228,186 | 1,137,565 | 683,165 | |||||||||
Transfer agent fees: (Note 3e) | ||||||||||||
Class A | 2,025,376 | 5,026,855 | 1,662,913 | |||||||||
Class A1 | — | — | 18,036,562 | |||||||||
Class C | 281,608 | 437,975 | 6,911,676 | |||||||||
Class R | 52,525 | 273,180 | 122,585 | |||||||||
Class R6 | 209,850 | 321,720 | 241,193 | |||||||||
Advisor Class | 390,197 | 1,704,434 | 4,836,703 | |||||||||
Custodian fees (Note 4) | 50,125 | 69,141 | 518,998 | |||||||||
Reports to shareholders | 279,759 | 447,854 | 2,087,406 | |||||||||
Registration and filing fees | 178,100 | 112,540 | 382,113 | |||||||||
Professional fees | 40,328 | 92,975 | 382,496 | |||||||||
Trustees’ fees and expenses | 12,497 | 36,488 | 198,210 | |||||||||
Other | 41,426 | 115,282 | 571,240 | |||||||||
|
| |||||||||||
Total expenses | 25,756,724 | 57,057,470 | 259,280,530 | |||||||||
Expense reductions (Note 4) | (14 | ) | (4,607 | ) | (729,692 | ) | ||||||
Expenses waived/paid by affiliates (Note 3f and 3g) | (346,804 | ) | (500,494 | ) | (1,174,282 | ) | ||||||
|
| |||||||||||
Net expenses | 25,409,906 | 56,552,369 | 257,376,556 | |||||||||
|
| |||||||||||
Net investment income (loss) | (5,031,896 | ) | 41,013,390 | 1,479,491,724 | ||||||||
|
| |||||||||||
Realized and unrealized gains (losses): | ||||||||||||
Net realized gain (loss) from: | ||||||||||||
Investments:+ | ||||||||||||
Unaffiliated issuers | (19,024,213 | ) | 228,812,503 | 132,136,112 | ||||||||
Non-controlled affiliates (Note 3f and 9) | — | — | (48,815,709 | ) | ||||||||
Written options | — | — | 66,232,650 | |||||||||
Foreign currency transactions | (146,821 | ) | (1,526 | ) | (408,897 | ) | ||||||
Swap contracts. | — | — | 1,944,731 | |||||||||
|
| |||||||||||
Net realized gain (loss) | (19,171,034 | ) | 228,810,977 | 151,088,887 | ||||||||
|
| |||||||||||
Net change in unrealized appreciation (depreciation) on: | ||||||||||||
Investments: | ||||||||||||
Unaffiliated issuers | 149,184,780 | (653,227,070 | ) | 157,337,810 | ||||||||
Translation of other assets and liabilities denominated in foreign currencies | 534 | — | (301,326 | ) | ||||||||
Written options | — | — | (11,658,265 | ) | ||||||||
|
| |||||||||||
Net change in unrealized appreciation (depreciation) | 149,185,314 | (653,227,070 | ) | 145,378,219 | ||||||||
|
| |||||||||||
| franklintempleton.com | The accompanying notes are an integral part of these financial statements. | Semiannual Report | 95 | ||||
FRANKLIN CUSTODIAN FUNDS
FINANCIAL STATEMENTS
Statements of Operations(continued)
for the six months ended March 31, 2019 (unaudited)
| | Franklin DynaTech Fund | | | Franklin Growth Fund | | | Franklin Income Fund | | ||||
Net realized and unrealized gain (loss) | $130,014,280 | $ | (424,416,093 | ) | $ | 296,467,106 | ||||||
|
| |||||||||||
Net increase (decrease) in net assets resulting from operations | $124,982,384 | $ | (383,402,703 | ) | $ | 1,775,958,830 | ||||||
|
| |||||||||||
*Foreign taxes withheld on dividends | $ | 104,421 | $ | 221,409 | $ | 6,966,156 | ||||||
+Includes gains from a redemptionin-kind (Note 11) | $ | — | $ | 52,349,028 | $ | — |
| 96 | Semiannual Report | The accompanying notes are an integral part of these financial statements. | franklintempleton.com | ||
FRANKLIN CUSTODIAN FUNDS
FINANCIAL STATEMENTS
Statements of Operations(continued)
for the six months ended March 31, 2019 (unaudited)
| | Franklin U.S. Government Securities Fund | | Franklin Utilities Fund | | ||||
Investment income: | ||||||||
Dividends: (net of foreign taxes)* | ||||||||
Unaffiliated issuers | $ — | $101,857,581 | ||||||
Non-controlled affiliates (Note 3f and 9) | 1,119,518 | 370,046 | ||||||
Interest: | ||||||||
Unaffiliated issuers: | ||||||||
Paydown gain (loss) | (11,418,881 | ) | — | |||||
Paid in cash | 96,257,293 | 253,042 | ||||||
Income from securities loaned: | ||||||||
Non-controlled affiliates (Note 3f) | — | 10,285 | ||||||
|
| |||||||
Total investment income. | 85,957,930 | 102,490,954 | ||||||
|
| |||||||
Expenses: | ||||||||
Management fees (Note 3a) | 11,491,463 | 13,631,922 | ||||||
Distribution fees: (Note 3c) | ||||||||
Class A | 148,277 | 226,932 | ||||||
Class A1 | 2,194,309 | 2,816,667 | ||||||
Class C | 1,518,902 | 2,358,854 | ||||||
Class R | 75,154 | 191,441 | ||||||
Transfer agent fees: (Note 3e) | ||||||||
Class A | 86,265 | 99,982 | ||||||
Class A1 | 2,171,945 | 2,070,136 | ||||||
Class C | 340,507 | 400,124 | ||||||
Class R | 22,168 | 42,369 | ||||||
Class R6 | 94,168 | 66,999 | ||||||
Advisor Class | 535,373 | 535,957 | ||||||
Custodian fees (Note 4) | 21,041 | 34,062 | ||||||
Reports to shareholders | 198,733 | 210,934 | ||||||
Registration and filing fees | 81,737 | 77,336 | ||||||
Professional fees | 42,577 | 45,530 | ||||||
Trustees’ fees and expenses | 13,488 | 15,137 | ||||||
Other. | 281,792 | 39,410 | ||||||
|
| |||||||
Total expenses | 19,317,899 | 22,863,792 | ||||||
Expense reductions (Note 4) | (848 | ) | (5,210 | ) | ||||
Expenses waived/paid by affiliates (Note 3f and 3g) | (203,611 | ) | (106,509 | ) | ||||
|
| |||||||
Net expenses | 19,113,440 | 22,752,073 | ||||||
|
| |||||||
Net investment income | 66,844,490 | 79,738,881 | ||||||
|
| |||||||
Realized and unrealized gains (losses): | ||||||||
Net realized gain (loss) from: | ||||||||
Investments: | ||||||||
Unaffiliated issuers | (4,921,387 | ) | 86,603,257 | |||||
Foreign currency transactions | — | 38,911 | ||||||
|
| |||||||
Net realized gain (loss) | (4,921,387 | ) | 86,642,168 | |||||
|
| |||||||
Net change in unrealized appreciation (depreciation) on: | ||||||||
Investments: | ||||||||
Unaffiliated issuers | 110,493,292 | 595,255,849 | ||||||
Translation of other assets and liabilities denominated in foreign currencies | — | (1,797 | ) | |||||
|
| |||||||
Net change in unrealized appreciation (depreciation) | 110,493,292 | 595,254,052 | ||||||
|
| |||||||
Net realized and unrealized gain (loss) | 105,571,905 | 681,896,220 | ||||||
|
| |||||||
| franklintempleton.com | The accompanying notes are an integral part of these financial statements. | Semiannual Report | 97 | ||||
FRANKLIN CUSTODIAN FUNDS
FINANCIAL STATEMENTS
Statements of Operations(continued)
for the six months ended March 31, 2019 (unaudited)
| | Franklin U.S. Government Securities Fund | | Franklin Utilities Fund | | ||||
Net increase (decrease) in net assets resulting from operations | $172,416,395 | $ | 761,635,101 | |||||
|
| |||||||
*Foreign taxes withheld on dividends. | $ | — | $ | 530,814 |
| 98 | Semiannual Report | The accompanying notes are an integral part of these financial statements. | franklintempleton.com | ||
FRANKLIN CUSTODIAN FUNDS
FINANCIAL STATEMENTS
Statements of Changes in Net Assets
| Franklin DynaTech Fund | Franklin Growth Fund | |||||||||||||||
| | Six Months Ended March 31, 2019 (unaudited) | | | Year Ended September 30, 2018 | | | Six Months Ended March 31, 2019 (unaudited) | | | Year Ended September 30, 2018 | | |||||
Increase (decrease) in net assets: | ||||||||||||||||
Operations: | ||||||||||||||||
Net investment income (loss) | $ (5,031,896 | ) | $ (15,041,017 | ) | $ 41,013,390 | $ 69,469,770 | ||||||||||
Net realized gain (loss) | (19,171,034 | ) | 176,786,945 | 228,810,977 | 307,934,328 | |||||||||||
Net change in unrealized appreciation (depreciation) | 149,185,314 | 1,253,016,993 | (653,227,070 | ) | 2,488,154,018 | |||||||||||
|
| |||||||||||||||
Net increase (decrease) in net assets resulting from operations | 124,982,384 | 1,414,762,921 | (383,402,703 | ) | 2,865,558,116 | |||||||||||
|
| |||||||||||||||
Distributions to shareholders: | ||||||||||||||||
Class A | (92,155,265 | ) | (46,020,971 | ) | (127,214,618 | ) | (226,847,781 | ) | ||||||||
Class C | (14,892,606 | ) | (8,263,863 | ) | (8,201,337 | ) | (24,694,013 | ) | ||||||||
Class R | (2,378,516 | ) | (916,852 | ) | (5,605,930 | ) | (13,125,428 | ) | ||||||||
Class R6 | (41,995,760 | ) | (16,654,639 | ) | (45,185,076 | ) | (66,654,737 | ) | ||||||||
Advisor Class | (16,868,688 | ) | (5,793,931 | ) | (50,860,743 | ) | (76,869,802 | ) | ||||||||
|
| |||||||||||||||
Total distributions to shareholders | (168,290,835 | ) | (77,650,256 | ) | (237,067,704 | ) | (408,191,761 | ) | ||||||||
|
| |||||||||||||||
Capital share transactions: (Note 2) | ||||||||||||||||
Class A | 334,129,889 | 479,666,303 | 180,505,657 | (384,147,638 | ) | |||||||||||
Class C | (42,339,032 | ) | 121,107,638 | (284,522,338 | ) | (26,004,014 | ) | |||||||||
Class R | 12,237,357 | 32,046,631 | (46,189,106 | ) | (68,853,353 | ) | ||||||||||
Class R6 | 290,321,032 | 912,918,385 | (71,129,381 | ) | 556,753,865 | |||||||||||
Advisor Class | 166,181,249 | (156,845,531 | ) | 56,156,547 | (126,254,992 | ) | ||||||||||
|
| |||||||||||||||
Total capital share transactions | 760,530,495 | 1,388,893,426 | (165,178,621 | ) | (48,506,132 | ) | ||||||||||
|
| |||||||||||||||
Net increase (decrease) in net assets | 717,222,044 | 2,726,006,091 | (785,649,028 | ) | 2,408,860,223 | |||||||||||
Net assets: | ||||||||||||||||
Beginning of period | 6,817,369,388 | 4,091,363,297 | 16,403,715,319 | 13,994,855,096 | ||||||||||||
|
| |||||||||||||||
End of period | $7,534,591,432 | $6,817,369,388 | $15,618,066,291 | $16,403,715,319 | ||||||||||||
|
| |||||||||||||||
| franklintempleton.com | The accompanying notes are an integral part of these financial statements. | Semiannual Report | 99 | ||||
FRANKLIN CUSTODIAN FUNDS
FINANCIAL STATEMENTS
Statements of Changes in Net Assets(continued)
| Franklin Income Fund | Franklin U.S. Government Securities Fund | |||||||||||||||
| | Six Months Ended March 31, 2019 (unaudited) | | | Year Ended September 30, 2018 | | | Six Months Ended March 31, 2019 (unaudited) | | | Year Ended September 30, 2018 | | |||||
Increase (decrease) in net assets: | ||||||||||||||||
Operations: | ||||||||||||||||
Net investment income | $1,479,491,724 | $3,098,037,753 | $ 66,844,490 | $ 135,106,995 | ||||||||||||
Net realized gain (loss) | 151,088,887 | 2,139,515,312 | (4,921,387 | ) | (17,091,870 | ) | ||||||||||
Net change in unrealized appreciation (depreciation) | 145,378,219 | (3,644,189,158 | ) | 110,493,292 | (204,522,890 | ) | ||||||||||
|
| |||||||||||||||
Net increase (decrease) in net assets resulting from operations | 1,775,958,830 | 1,593,363,907 | 172,416,395 | (86,507,765 | ) | |||||||||||
|
| |||||||||||||||
Distributions to shareholders: | ||||||||||||||||
Class A | (90,795,740 | ) | — | (2,068,842 | ) | (12,054 | ) | |||||||||
Class A1 | (1,088,758,398 | ) | (2,288,960,635 | ) | (46,411,735 | ) | (102,662,505 | ) | ||||||||
Class M | — | (106 | ) | — | (67 | ) | ||||||||||
Class C | (375,778,388 | ) | (972,575,550 | ) | (5,981,366 | ) | (17,064,880 | ) | ||||||||
Class R | (6,997,128 | ) | (15,730,910 | ) | (423,989 | ) | (917,007 | ) | ||||||||
Class R6 | (53,720,650 | ) | (112,761,533 | ) | (12,092,124 | ) | (20,832,132 | ) | ||||||||
Advisor Class | (299,114,822 | ) | (597,750,735 | ) | (12,012,539 | ) | (23,153,769 | ) | ||||||||
|
| |||||||||||||||
Total distributions to shareholders | (1,915,165,126 | ) | (3,987,779,469 | ) | (78,990,595 | ) | (164,642,414 | ) | ||||||||
|
| |||||||||||||||
Capital share transactions: (Note 2) | ||||||||||||||||
Class A | 4,927,965,655 | 107,124,173 | 172,315,528 | 4,483,084 | ||||||||||||
Class A1 | (1,622,404,594 | ) | (2,231,639,649 | ) | (213,013,820 | ) | (326,093,441 | ) | ||||||||
Class M | — | 229 | — | 108 | ||||||||||||
Class C | (4,724,339,937 | ) | (2,505,402,882 | ) | (144,503,793 | ) | (194,350,252 | ) | ||||||||
Class R | (16,514,940 | ) | (55,588,036 | ) | (1,009,092 | ) | (5,634,672 | ) | ||||||||
Class R6 | (101,987,498 | ) | 309,451,485 | 85,214,272 | 276,619,775 | |||||||||||
Advisor Class | 89,845,328 | (1,525,738 | ) | 143,255,901 | (100,605,572 | ) | ||||||||||
|
| |||||||||||||||
Total capital share transactions | (1,447,435,986 | ) | (4,377,580,418 | ) | 42,258,996 | (345,580,970 | ) | |||||||||
|
| |||||||||||||||
Net increase (decrease) in net assets | (1,586,642,282 | ) | (6,771,995,980 | ) | 135,684,796 | (596,731,149 | ) | |||||||||
Net assets: | ||||||||||||||||
Beginning of period | 76,619,264,487 | 83,391,260,467 | 5,121,608,025 | 5,718,339,174 | ||||||||||||
|
| |||||||||||||||
End of period | $75,032,622,205 | $76,619,264,487 | $5,257,292,821 | $5,121,608,025 | ||||||||||||
|
| |||||||||||||||
| 100 | Semiannual Report | The accompanying notes are an integral part of these financial statements. | franklintempleton.com | ||
FRANKLIN CUSTODIAN FUNDS
FINANCIAL STATEMENTS
Statements of Changes in Net Assets(continued)
| Franklin Utilities Fund | ||||||||
| Six Months Ended March 31, 2019 (unaudited) | Year Ended September 30, 2018 | |||||||
Increase (decrease) in net assets: | ||||||||
Operations: | ||||||||
Net investment income | $ 79,738,881 | $ 160,329,904 | ||||||
Net realized gain (loss) | 86,642,168 | 202,141,838 | ||||||
Net change in unrealized appreciation (depreciation) | 595,254,052 | (290,378,391 | ) | |||||
Net increase (decrease) in net assets resulting from operations | 761,635,101 | 72,093,351 | ||||||
Distributions to shareholders: | ||||||||
Class A | (7,818,058 | ) | — | |||||
Class A1 | (165,888,377 | ) | (177,065,549 | ) | ||||
Class M | — | (70 | ) | |||||
Class C | (29,625,190 | ) | (37,179,447 | ) | ||||
Class R | (3,219,489 | ) | (3,557,682 | ) | ||||
Class R6 | (10,349,802 | ) | (10,987,844 | ) | ||||
Advisor Class | (43,496,329 | ) | (43,572,165 | ) | ||||
Total distributions to shareholders | (260,397,245 | ) | (272,362,757 | ) | ||||
Capital share transactions: (Note 2) | ||||||||
Class A | 264,636,315 | 3,570,602 | ||||||
Class A1 | (76,525,254 | ) | (400,697,038 | ) | ||||
Class M | — | 262 | ||||||
Class C | (154,535,280 | ) | (115,788,847 | ) | ||||
Class R | 4,830,758 | (18,460,504 | ) | |||||
Class R6 | (13,087,892 | ) | (4,300,346 | ) | ||||
Advisor Class | (2,590,061 | ) | (3,930,299 | ) | ||||
Total capital share transactions | 22,728,586 | (539,606,170 | ) | |||||
Net increase (decrease) in net assets | 523,966,442 | (739,875,576 | ) | |||||
Net assets: | ||||||||
Beginning of period | 5,723,566,545 | 6,463,442,121 | ||||||
End of period | $6,247,532,987 | $5,723,566,545 | ||||||
| franklintempleton.com | The accompanying notes are an integral part of these financial statements. | Semiannual Report | 101 | ||||
FRANKLIN CUSTODIAN FUNDS
Notes to Financial Statements (unaudited)
1. Organization and Significant Accounting Policies
Franklin Custodian Funds (Trust) is registered under the Investment Company Act of 1940 (1940 Act) as anopen-end management investment company, consisting of six separate funds, five of which are included in this report (Funds) and applies the specialized accounting and reporting guidance in U.S. Generally Accepted Accounting Principles (U.S. GAAP). The classes of shares offered within each of the Funds are indicated below. Beginning on October 19, 2018, Class C shares automatically convert to Class A shares after they have been held for 10 years. Each class of shares may differ by its initial sales load, contingent deferred sales charges, voting rights on matters affecting a single class, its exchange privilege and fees due to differing arrangements for distribution and transfer agent fees.
Class A, Class C, Class R, Class R6 & Advisor Class
Franklin DynaTech Fund
Franklin Growth Fund
Class A, Class A1, Class C, Class R, Class R6 & Advisor Class
Franklin Income Fund
Franklin U.S. Government Securities Fund
Franklin Utilities Fund
The following summarizes the Funds’ significant accounting policies.
a. Financial Instrument Valuation
The Funds’ investments in financial instruments are carried at fair value daily. Fair value is the price that would be received to sell an asset or paid to transfer a liability in an orderly transaction between market participants on the measurement date. The Funds calculate the net asset value (NAV) per share each business day as of 4 p.m. Eastern time or the regularly scheduled close of the New York Stock Exchange (NYSE), whichever is earlier. Under compliance policies and procedures approved by the Trust’s Board of Trustees (the Board), the Funds’ administrator has responsibility for oversight of valuation, including leading the cross-functional Valuation Committee (VC). The Funds may utilize independent pricing services, quotations from securities and financial instrument dealers, and other market sources to determine fair value.
Equity securities and derivative financial instruments listed on an exchange or on the NASDAQ National Market System are valued at the last quoted sale price or the official closing price of the day, respectively. Foreign equity securities are valued as of the close of trading on the foreign stock exchange on which the security is primarily traded, or as of 4 p.m. Eastern time. The value is then converted into its U.S. dollar equivalent at the foreign exchange rate in effect at 4 p.m. Eastern time on the day that the value of the security is determined.Over-the-counter (OTC) securities are valued within the range of the most recent quoted bid and ask prices. Securities that trade in multiple markets or on multiple exchanges are valued according to the broadest and most representative market. Certain equity securities are valued based upon fundamental characteristics or relationships to similar securities.
Debt securities generally trade in the OTC market rather than on a securities exchange. The Funds’ pricing services use multiple valuation techniques to determine fair value. In instances where sufficient market activity exists, the pricing services may utilize a market-based approach through which quotes from market makers are used to determine fair value. In instances where sufficient market activity may not exist or is limited, the pricing services also utilize proprietary valuation models which may consider market characteristics such as benchmark yield curves, credit spreads, estimated default rates, anticipated market interest rate volatility, coupon rates, anticipated timing of principal repayments, underlying collateral, and other unique security features in order to estimate the relevant cash flows, which are then discounted to calculate the fair value. Securities denominated in a foreign currency are converted into their U.S. dollar equivalent at the foreign exchange rate in effect at 4 p.m. Eastern time on the date that the values of the foreign debt securities are determined.
Investments inopen-end mutual funds are valued at the closing NAV.
The Funds have procedures to determine the fair value of financial instruments for which market prices are not reliable or readily available. Under these procedures, the Funds primarily employ a market-based approach which may use related or comparable assets or liabilities, recent transactions, market multiples, book values, and other relevant information for the investment to determine the fair value of the investment. An income-based valuation approach may also be used in which the anticipated future cash flows of the investment are discounted to calculate fair value. Discounts may also be applied due to the
| 102 | Semiannual Report | franklintempleton.com | ||
FRANKLIN CUSTODIAN FUNDS
NOTES TO FINANCIAL STATEMENTS (UNAUDITED)
nature or duration of any restrictions on the disposition of the investments. Due to the inherent uncertainty of valuations of such investments, the fair values may differ significantly from the values that would have been used had an active market existed.
Trading in securities on foreign securities stock exchanges and OTC markets may be completed before 4 p.m. Eastern time. In addition, trading in certain foreign markets may not take place on every Funds’ business day. Occasionally, events occur between the time at which trading in a foreign security is completed and 4 p.m. Eastern time that might call into question the reliability of the value of a portfolio security held by the Fund. As a result, differences may arise between the value of the Funds’ portfolio securities as determined at the foreign market close and the latest indications of value at 4 p.m. Eastern time. In order to minimize the potential for these differences, the VC monitors price movements following the close of trading in foreign stock markets through a series of country specific market proxies (such as baskets of American Depositary Receipts, futures contracts and exchange traded funds). These price movements are measured against established trigger thresholds for each specific market proxy to assist in determining if an event has occurred that may call into question the reliability of the values of the foreign securities held by the Funds. If such an event occurs, the securities may be valued using fair value procedures, which may include the use of independent pricing services.
When the last day of the reporting period is anon-business day, certain foreign markets may be open on those days that the Funds’ NAV is not calculated, which could result in differences between the value of the Funds’ portfolio securities on the last business day and the last calendar day of the reporting period. Any significant security valuation changes due to an open foreign market are adjusted and reflected by the Funds for financial reporting purposes.
b. Foreign Currency Translation
Portfolio securities and other assets and liabilities denominated in foreign currencies are translated into U.S. dollars based on the exchange rate of such currencies against U.S. dollars on the date of valuation. The Funds may enter into foreign currency exchange contracts to facilitate transactions denominated in a foreign currency. Purchases and sales of securities, income and expense items denominated in foreign currencies are translated into U.S. dollars at the exchange rate in effect on the transaction
date. Portfolio securities and assets and liabilities denominated in foreign currencies contain risks that those currencies will decline in value relative to the U.S. dollar. Occasionally, events may impact the availability or reliability of foreign exchange rates used to convert the U.S. dollar equivalent value. If such an event occurs, the foreign exchange rate will be valued at fair value using procedures established and approved by the Board.
The Funds do not separately report the effect of changes in foreign exchange rates from changes in market prices on securities held. Such changes are included in net realized and unrealized gain or loss from investments in the Statements of Operations.
Realized foreign exchange gains or losses arise from sales of foreign currencies, currency gains or losses realized between the trade and settlement dates on securities transactions and the difference between the recorded amounts of dividends, interest, and foreign withholding taxes and the U.S. dollar equivalent of the amounts actually received or paid. Net unrealized foreign exchange gains and losses arise from changes in foreign exchange rates on foreign denominated assets and liabilities other than investments in securities held at the end of the reporting period.
c. Securities Purchased on a When-Issued or Delayed Delivery Basis
Certain or all Funds purchase securities on a when-issued or delayed delivery basis, with payment and delivery scheduled for a future date. These transactions are subject to market fluctuations and are subject to the risk that the value at delivery may be more or less than the trade date purchase price. Although the Funds will generally purchase these securities with the intention of holding the securities, they may sell the securities before the settlement date. Sufficient assets have been segregated for these securities.
d. Derivative Financial Instruments
Certain or all Funds invested in derivative financial instruments in order to manage risk or gain exposure to various other investments or markets. Derivatives are financial contracts based on an underlying or notional amount, require no initial investment or an initial net investment that is smaller than would normally be required to have a similar response to changes in market factors, and require or permit net settlement. Derivatives contain various risks including the potential inability of the counterparty to fulfill their obligations under the
| franklintempleton.com | Semiannual Report | 103 |
FRANKLIN CUSTODIAN FUNDS
NOTES TO FINANCIAL STATEMENTS (UNAUDITED)
1. Organization and Significant Accounting
Policies(continued)
d. Derivative Financial Instruments(continued)
terms of the contract, the potential for an illiquid secondary market, and/or the potential for market movements which expose the Fund to gains or losses in excess of the amounts shown in the Statements of Assets and Liabilities. Realized gain and loss and unrealized appreciation and depreciation on these contracts for the period are included in the Statements of Operations.
Collateral requirements differ by type of derivative. Collateral or initial margin requirements are set by the broker or exchange clearing house for exchange traded and centrally cleared derivatives. Initial margin deposited is held at the exchange and can be in the form of cash and/or securities.
Certain or all Funds entered into credit default swap contracts primarily to manage exposure to credit risk. A credit default swap is an agreement between the Fund and a counterparty whereby the buyer of the contract receives credit protection and the seller of the contract guarantees the credit worthiness of a referenced debt obligation. These agreements may be privately negotiated in theover-the-counter market (OTC credit default swaps) or may be executed in a multilateral trade facility platform, such as a registered exchange (centrally cleared credit default swaps). The underlying referenced debt obligation may be a single issuer of corporate or sovereign debt, a credit index, a basket of issuers or indices, or a tranche of a credit index or basket of issuers or indices. In the event of a default of the underlying referenced debt obligation, the buyer is entitled to receive the notional amount of the credit default swap contract from the seller in exchange for the referenced debt obligation, a net settlement amount equal to the notional amount of the credit default swap less the recovery value of the referenced debt obligation, or other agreed upon amount. For centrally cleared credit default swaps, required initial margins are pledged by the Fund, and the daily change in fair value is accounted for as a variation margin payable or receivable in the Statements of Assets and Liabilities. Over the term of the contract, the buyer pays the seller a periodic stream of payments, provided that no event of default has occurred. Such periodic payments are accrued daily as an unrealized appreciation or depreciation until the payments are made, at which time they are realized. Upfront payments and receipts are reflected in the Statements of Assets and Liabilities and represent compensating factors between
stated terms of the credit default swap agreement and prevailing market conditions (credit spreads and other relevant factors). These upfront payments and receipts are amortized over the term of the contract as a realized gain or loss in the Statements of Operations.
Certain or all Funds purchased or wrote exchange traded option contracts primarily to manage exposure to equity price risk. An option is a contract entitling the holder to purchase or sell a specific amount of shares or units of an asset or notional amount of a swap (swaption), at a specified price. When an option is purchased or written, an amount equal to the premium paid or received is recorded as an asset or liability, respectively. Upon exercise of an option, the acquisition cost or sales proceeds of the underlying investment is adjusted by any premium received or paid. Upon expiration of an option, any premium received or paid is recorded as a realized gain or loss. Upon closing an option other than through expiration or exercise, the difference between the premium received or paid and the cost to close the position is recorded as a realized gain or loss.
See Note 8 regarding other derivative information.
e. Index-Linked Notes
Certain or all Funds invest in index-linked notes. Index-linked notes are senior, unsecured, subordinated debt securities issued by a financial institution, and the value is based on the price movements of the underlying index. Index-linked notes are designed to provide investors access to the returns of various market benchmarks and intended to replicate the economic effects that would apply had the Fund directly purchased the underlying referenced asset or basket of assets. The risks of investing in index-linked notes include unfavorable price movements in the underlying index and the credit risk of the issuing financial institution. There may be no guarantee of a return of principal with index-linked notes and the appreciation potential may be limited. Index-linked notes may be more volatile and less liquid than other investments held by the Funds.
f. Equity-Linked Securities
Certain or all Funds invest in equity-linked securities. Equity-linked securities are hybrid financial instruments that generally combine both debt and equity characteristics into a single note form. Income received from equity-linked securities is recorded as realized gains in the Statements of Operations and may be based on the performance of an underlying equity
| 104 | Semiannual Report | franklintempleton.com | ||
FRANKLIN CUSTODIAN FUNDS
NOTES TO FINANCIAL STATEMENTS (UNAUDITED)
security, an equity index, or an option position. The risks of investing in equity-linked securities include unfavorable price movements in the underlying security and the credit risk of the issuing financial institution. There may be no guarantee of a return of principal with equity-linked securities and the appreciation potential may be limited. Equity-linked securities may be more volatile and less liquid than other investments held by the Funds.
g. Securities Lending
Certain or all Funds participate in an agency based securities lending program to earn additional income. The Fund receives cash collateral against the loaned securities in an amount equal to at least 102% of the fair value of the loaned securities. Collateral is maintained over the life of the loan in an amount not less than 100% of the fair value of loaned securities, as determined at the close of Fund business each day; any additional collateral required due to changes in security values is delivered to the Fund on the next business day. The collateral is deposited into a joint cash account with other funds and is used to invest in a money market fund managed by Franklin Advisers, Inc., an affiliate of the Funds, and/or a joint repurchase agreement. The Fund may receive income from the investment of cash collateral, in addition to lending fees and rebates paid by the borrower. Income from securities loaned, net of fees paid to the securities lending agent and/or third-party vendor, is reported separately in the Statements of Operations. The Fund bears the market risk with respect to the collateral investment, securities loaned, and the risk that the agent may default on its obligations to the Fund. If the borrower defaults on its obligation to return the securities loaned, the Fund has the right to repurchase the securities in the open market using the collateral received. The securities lending agent has agreed to indemnify the Fund in the event of default by a third party borrower. At March 31, 2019, the Franklin Utilities Fund and Franklin Income Fund had no securities on loan.
h. Mortgage Dollar Rolls
Certain or all Funds enter into mortgage dollar rolls, typically on a TBA basis. Mortgage dollar rolls are agreements between the Fund and a financial institution where the Fund sells (or buys) mortgage-backed securities for delivery on a specified date and simultaneously contracts to repurchase (or sell) substantially similar (same type, coupon, and maturity) securities at a future date and at a predetermined price. Gains or losses are realized on the initial sale, and the difference between
the repurchase price and the sale price is recorded as an unrealized gain or loss to the Fund upon entering into the mortgage dollar roll. In addition, the Fund may invest the cash proceeds that are received from the initial sale. During the period between the sale and repurchase, the Fund is not entitled to principal and interest paid on the mortgage backed securities. Transactions in mortgage dollar rolls are accounted for as purchases and sales and may result in an increase to the Fund’s portfolio turnover rate. The risks of mortgage dollar roll transactions include the potential inability of the counterparty to fulfill its obligations.
i. Senior Floating Rate Interests
Certain or all Funds invest in senior secured corporate loans that pay interest at rates which are periodically reset by reference to a base lending rate plus a spread. These base lending rates are generally the prime rate offered by a designated U.S. bank or the London InterBank Offered Rate (LIBOR). Senior secured corporate loans often require prepayment of principal from excess cash flows or at the discretion of the borrower. As a result, actual maturity may be substantially less than the stated maturity. Senior secured corporate loans in which the Funds invest are generally readily marketable, but may be subject to certain restrictions on resale.
j. Income and Deferred Taxes
It is each Fund’s policy to qualify as a regulated investment company under the Internal Revenue Code. Each Fund intends to distribute to shareholders substantially all of its taxable income and net realized gains to relieve it from federal income and excise taxes. As a result, no provision for U.S. federal income taxes is required.
The Funds may be subject to foreign taxation related to income received, capital gains on the sale of securities and certain foreign currency transactions in the foreign jurisdictions in which the Funds invest. Foreign taxes, if any, are recorded based on the tax regulations and rates that exist in the foreign markets in which the Funds invest. When a capital gain tax is determined to apply, certain or all Funds record an estimated deferred tax liability in an amount that would be payable if the securities were disposed of on the valuation date.
As a result of several court cases, in certain countries across the European Union, certain or all Funds filed additional tax reclaims for previously withheld taxes on dividends earned in those countries (EU reclaims). These additional filings are
| franklintempleton.com | Semiannual Report | 105 |
FRANKLIN CUSTODIAN FUNDS
NOTES TO FINANCIAL STATEMENTS (UNAUDITED)
1. Organization and Significant Accounting
Policies(continued)
j. Income and Deferred Taxes(continued)
subject to various administrative proceedings by the local jurisdictions’ tax authorities within the European Union, as well as a number of related judicial proceedings. Income recognized, if any, for EU reclaims is reflected as other income in the Statements of Operations and any related receivable, if any, is reflected as European Union tax reclaims in the Statements of Assets and Liabilities. When uncertainty exists as to the ultimate resolution of these proceedings, the likelihood of receipt of these EU reclaims, and the potential timing of payment, no amounts are reflected in the financial statements. For U.S. income tax purposes, EU reclaims received by the Funds, if any, reduce the amounts of foreign taxes Fund shareholders can use as tax credits in their individual income tax returns.
Each Fund may recognize an income tax liability related to its uncertain tax positions under U.S. GAAP when the uncertain tax position has a less than 50% probability that it will be sustained upon examination by the tax authorities based on its technical merits. As of March 31, 2019, each Fund has determined that no tax liability is required in its financial statements related to uncertain tax positions for any open tax years (or expected to be taken in future tax years). Open tax years are those that remain subject to examination and are based on the statute of limitations in each jurisdiction in which the Fund invests.
k. Security Transactions, Investment Income, Expenses and Distributions
Security transactions are accounted for on trade date. Realized gains and losses on security transactions are determined on a specific identification basis. Interest income and estimated expenses are accrued daily. Amortization of premium and accretion of discount on debt securities are included in interest income. Paydown gains and losses are recorded separately on the Statements of Operations. Facility fees are recognized as income over the expected term of the loan. Dividend income is recorded on theex-dividend date except for certain dividends from securities where the dividend rate is not available. In such cases, the dividend is recorded as soon as the information is
received by the Funds. Distributions to shareholders are recorded on theex-dividend date. Distributable earnings are determined according to income tax regulations (tax basis) and may differ from earnings recorded in accordance with U.S. GAAP. These differences may be permanent or temporary. Permanent differences are reclassified among capital accounts to reflect their tax character. These reclassifications have no impact on net assets or the results of operations. Temporary differences are not reclassified, as they may reverse in subsequent periods.
Common expenses incurred by the Trust are allocated among the Funds based on the ratio of net assets of each Fund to the combined net assets of the Trust or based on the ratio of number of shareholders of each Fund to the combined number of shareholders of the Trust. Fund specific expenses are charged directly to the Fund that incurred the expense.
Realized and unrealized gains and losses and net investment income, excluding class specific expenses, are allocated daily to each class of shares based upon the relative proportion of net assets of each class. Differences in per share distributions by class are generally due to differences in class specific expenses.
l. Accounting Estimates
The preparation of financial statements in accordance with U.S. GAAP requires management to make estimates and assumptions that affect the reported amounts of assets and liabilities at the date of the financial statements and the amounts of income and expenses during the reporting period. Actual results could differ from those estimates.
m. Guarantees and Indemnifications
Under the Trust’s organizational documents, its officers and trustees are indemnified by the Trust against certain liabilities arising out of the performance of their duties to the Trust. Additionally, in the normal course of business, the Trust, on behalf of the Funds, enters into contracts with service providers that contain general indemnification clauses. The Trust’s maximum exposure under these arrangements is unknown as this would involve future claims that may be made against the Trust that have not yet occurred. Currently, the Trust expects the risk of loss to be remote.
| 106 | Semiannual Report | franklintempleton.com | ||
FRANKLIN CUSTODIAN FUNDS
NOTES TO FINANCIAL STATEMENTS (UNAUDITED)
2. Shares of Beneficial Interest
At March 31, 2019, there were an unlimited number of shares authorized (without par value). Transactions in the Funds’ shares were as follows:
Franklin DynaTech Fund
| Franklin Growth Fund
| |||||||||||||||
| Shares | Amount | Shares | Amount | |||||||||||||
Class A Shares: | ||||||||||||||||
Six Months ended March 31, 2019 | ||||||||||||||||
Shares solda | 9,399,014 | $ | 680,197,375 | 8,292,271 | $ | 815,307,855 | ||||||||||
Shares issued in reinvestment of distributions | 1,181,938 | 85,513,191 | 1,182,061 | 118,489,775 | ||||||||||||
| Shares redeemed | (6,068,913 | ) | (431,580,677 | ) | (7,721,232 | ) | (753,291,973 | ) | ||||||||
Net increase (decrease) | 4,512,039 | $ | 334,129,889 | 1,753,100 | $ | 180,505,657 | ||||||||||
Year ended September 30, 2018 | ||||||||||||||||
Shares sold | 14,831,366 | $ | 1,079,518,288 | 11,280,920 | $ | 1,109,298,387 | ||||||||||
Shares issued in reinvestment of distributions | 649,398 | 42,412,146 | 2,241,557 | 209,293,239 | ||||||||||||
| Shares redeemed | (8,972,810 | ) | (642,264,131 | ) | (17,341,818 | ) | (1,702,739,264 | ) | ||||||||
Net increase (decrease) | 6,507,954 | $ | 479,666,303 | (3,819,341 | ) | $ | (384,147,638 | ) | ||||||||
Class C Shares: | ||||||||||||||||
Six Months ended March 31, 2019 | ||||||||||||||||
Shares sold | 1,550,669 | $ | 94,121,169 | 756,637 | $ | 67,693,401 | ||||||||||
Shares issued in reinvestment of distributions | 239,761 | 14,455,223 | 84,222 | 7,736,630 | ||||||||||||
| Shares redeemeda | (2,492,512 | ) | (150,915,424 | ) | (3,952,535 | ) | (359,952,369 | ) | ||||||||
Net increase (decrease) | (702,082 | ) | $ | (42,339,032 | ) | (3,111,676 | ) | $ | (284,522,338 | ) | ||||||
Year ended September 30, 2018 | ||||||||||||||||
Shares sold | 3,541,513 | $ | 216,395,204 | 2,015,126 | $ | 182,547,090 | ||||||||||
Shares issued in reinvestment of distributions | 145,521 | 8,019,671 | 273,473 | 23,494,117 | ||||||||||||
| Shares redeemed | (1,708,778 | ) | (103,307,237 | ) | (2,558,228 | ) | (232,045,221 | ) | ||||||||
Net increase (decrease) | 1,978,256 | $ | 121,107,638 | (269,629 | ) | $ | (26,004,014 | ) | ||||||||
Class R Shares: | ||||||||||||||||
Six Months ended March 31, 2019 | ||||||||||||||||
Shares sold | 329,445 | $ | 23,184,597 | 220,564 | $ | 21,234,855 | ||||||||||
Shares issued in reinvestment of distributions | 33,480 | 2,351,628 | 54,920 | 5,489,301 | ||||||||||||
| Shares redeemed | (187,388 | ) | (13,298,868 | ) | (748,379 | ) | (72,913,262 | ) | ||||||||
Net increase (decrease) | 175,537 | $ | 12,237,357 | (472,895 | ) | $ | (46,189,106 | ) | ||||||||
Year ended September 30, 2018 | ||||||||||||||||
Shares sold | 728,247 | $ | 52,135,875 | 646,523 | $ | 63,137,515 | ||||||||||
Shares issued in reinvestment of distributions | 14,081 | 895,541 | 137,299 | 12,777,077 | ||||||||||||
| Shares redeemed | (304,303 | ) | (20,984,785 | ) | (1,477,753 | ) | (144,767,945 | ) | ||||||||
Net increase (decrease) | 438,025 | $ | 32,046,631 | (693,931 | ) | $ | (68,853,353 | ) | ||||||||
| franklintempleton.com | Semiannual Report | 107 |
FRANKLIN CUSTODIAN FUNDS
NOTES TO FINANCIAL STATEMENTS (UNAUDITED)
2. Shares of Beneficial Interest(continued)
Franklin DynaTech Fund | Franklin Growth Fund | |||||||||||||||||||
| Shares | Amount | Shares | Amount | |||||||||||||||||
Class R6 Shares: | ||||||||||||||||||||
Six Months ended March 31, 2019 | ||||||||||||||||||||
Shares sold | 6,565,198 | $ | 494,181,530 | 3,185,813 | $ | 310,963,976 | ||||||||||||||
Shares issued in reinvestment of distributions | 557,220 | 41,953,068 | 416,642 | 41,768,390 | ||||||||||||||||
Shares redeemed | (3,211,664 | ) | (245,813,566 | ) | (4,277,205 | ) | (423,861,747 | ) | ||||||||||||
Net increase (decrease) | 3,910,754 | $ | 290,321,032 | (674,750 | ) | $ | (71,129,381 | ) | ||||||||||||
Year ended September 30, 2018 | ||||||||||||||||||||
Shares sold | 17,913,232 | $ | 1,294,331,619 | 11,217,056 | $ | 1,090,829,917 | ||||||||||||||
Shares issued in reinvestment of distributions | 246,188 | 16,654,639 | 664,503 | 62,044,590 | ||||||||||||||||
Shares redeemedin-kind (Note 11) | — | — | (596,870 | ) | (64,204,995 | ) | ||||||||||||||
Shares redeemed | (5,146,068 | ) | (398,067,873 | ) | (5,377,348 | ) | (531,915,647 | ) | ||||||||||||
Net increase (decrease) | 13,013,352 | $ | 912,918,385 | 5,907,341 | $ | 556,753,865 | ||||||||||||||
Advisor Class Shares: | ||||||||||||||||||||
Six Months ended March 31, 2019 | ||||||||||||||||||||
Shares sold | 3,854,959 | $ | 289,558,263 | 5,514,140 | $ | 545,634,630 | ||||||||||||||
Shares issued in reinvestment of distributions | 208,740 | 15,569,915 | 463,663 | 46,542,484 | ||||||||||||||||
Shares redeemedin-kind (Note 11) | — | �� | — | (956,267 | ) | (87,335,163 | ) | |||||||||||||
Shares redeemed | (1,909,321 | ) | (138,946,929 | ) | (4,527,615 | ) | (448,685,404 | ) | ||||||||||||
Net increase (decrease) | 2,154,378 | $ | 166,181,249 | 493,921 | $ | 56,156,547 | ||||||||||||||
Year ended September 30, 2018 | ||||||||||||||||||||
Shares sold | 5,333,633 | $ | 398,259,942 | 7,218,349 | $ | 715,181,948 | ||||||||||||||
Shares issued in reinvestment of distributions | 79,332 | 5,323,142 | 772,474 | 72,226,322 | ||||||||||||||||
Shares redeemed | (8,277,537 | ) | (560,428,615 | ) | (9,391,141 | ) | (913,663,262 | ) | ||||||||||||
Net increase (decrease) | (2,864,572 | ) | $ | (156,845,531 | ) | (1,400,318 | ) | $ | (126,254,992 | ) | ||||||||||
| aMay include a portion of Class C shares that were automatically converted to Class A. |
| |||||||||||||||||||
Franklin Income Fund | Franklin U.S. Government Securities | |||||||||||||||||||
| Shares | Amount | Shares | Amount | |||||||||||||||||
Class A Shares: | ||||||||||||||||||||
Six Months ended March 31, 2019 | ||||||||||||||||||||
Shares solda | 2,355,291,188 | $ | 5,326,390,083 | 33,709,768 | $ | 197,112,503 | ||||||||||||||
Shares issued in reinvestment of distributions | 39,232,508 | 87,641,826 | 339,299 | 1,997,645 | ||||||||||||||||
Shares redeemed | (217,818,992 | ) | (486,066,254 | ) | (4,551,936 | ) | (26,794,620 | ) | ||||||||||||
Net increase (decrease) | 2,176,704,704 | $ | 4,927,965,655 | 29,497,131 | $ | 172,315,528 | ||||||||||||||
Year ended September 30, 2018b | ||||||||||||||||||||
Shares sold | 47,757,868 | $ | 110,955,834 | 854,097 | $ | 5,012,817 | ||||||||||||||
Shares issued in reinvestment of distributions | — | — | 1,534 | 8,990 | ||||||||||||||||
Shares redeemed | (1,647,742 | ) | (3,831,661 | ) | (91,919 | ) | (538,723 | ) | ||||||||||||
Net increase (decrease) | 46,110,126 | $ | 107,124,173 | 763,712 | $ | 4,483,084 | ||||||||||||||
| 108 | Semiannual Report | franklintempleton.com | ||
FRANKLIN CUSTODIAN FUNDS
NOTES TO FINANCIAL STATEMENTS (UNAUDITED)
| Franklin Income Fund | Franklin U.S. Government Securities Fund | |||||||||||||||||||
| Shares | Amount | Shares | Amount | |||||||||||||||||
Class A1 Shares: | ||||||||||||||||||||
Six Months ended March 31, 2019 | ||||||||||||||||||||
Shares sold | 408,776,905 | $ | 918,334,142 | 15,627,463 | $ | 91,738,820 | ||||||||||||||
Shares issued in reinvestment of distributions | 442,602,297 | 995,871,245 | 6,486,054 | 38,112,323 | ||||||||||||||||
| Shares redeemed | (1,578,765,611 | ) | (3,536,609,981 | ) | (58,440,807 | ) | (342,864,963 | ) | ||||||||||||
| Net increase (decrease) | (727,386,409 | ) | $ | (1,622,404,594 | ) | (36,327,290 | ) | $ | (213,013,820 | ) | ||||||||||
Year ended September 30, 2018 | ||||||||||||||||||||
Shares sold | 1,654,073,714 | $ | 3,876,349,005 | 91,619,493 | $ | 551,601,916 | ||||||||||||||
Shares issued in reinvestment of distributions | 897,284,705 | 2,093,922,360 | 14,259,224 | 84,951,032 | ||||||||||||||||
| Shares redeemed | (3,507,769,889 | ) | (8,201,911,014 | ) | (160,829,797 | ) | (962,646,389 | ) | ||||||||||||
| Net increase (decrease) | (956,411,470 | ) | $ | (2,231,639,649 | ) | (54,951,080 | ) | $ | (326,093,441 | ) | ||||||||||
Class M Shares:c | ||||||||||||||||||||
Year ended September 30, 2018d | ||||||||||||||||||||
Shares sold | 2,058 | $ | 5,000 | 829 | $ | 5,000 | ||||||||||||||
| Shares redeemed | (2,058 | ) | (4,771 | ) | (829 | ) | (4,892 | ) | ||||||||||||
| Net increase (decrease) | — | $ | 229 | — | $ | 108 | ||||||||||||||
Class C Shares: | ||||||||||||||||||||
Six Months ended March 31, 2019 | ||||||||||||||||||||
Shares sold | 301,961,176 | $ | 688,123,441 | 4,422,607 | $ | 25,825,796 | ||||||||||||||
Shares issued in reinvestment of distributions | 150,379,579 | 343,295,647 | 923,946 | 5,391,771 | ||||||||||||||||
| Shares redeemeda | (2,505,287,140 | ) | (5,755,759,025 | ) | (30,310,203 | ) | (175,721,360 | ) | ||||||||||||
| Net increase (decrease) | (2,052,946,385 | ) | $ | (4,724,339,937 | ) | (24,963,650 | ) | $ | (144,503,793 | ) | ||||||||||
Year ended September 30, 2018 | ||||||||||||||||||||
Shares sold | 582,283,439 | $ | 1,382,849,638 | 7,433,473 | $ | 44,268,648 | ||||||||||||||
Shares issued in reinvestment of distributions | 377,996,060 | 893,922,732 | 2,628,467 | 15,553,873 | ||||||||||||||||
| Shares redeemed | (2,018,663,790 | ) | (4,782,175,252 | ) | (42,755,854 | ) | (254,172,773 | ) | ||||||||||||
| Net increase (decrease) | (1,058,384,291 | ) | $ | (2,505,402,882 | ) | (32,693,914 | ) | $ | (194,350,252 | ) | ||||||||||
Class R Shares: | ||||||||||||||||||||
Six Months ended March 31, 2019 | ||||||||||||||||||||
Shares sold | 9,377,623 | $ | 20,707,687 | 549,320 | $ | 3,233,472 | ||||||||||||||
Shares issued in reinvestment of distributions | 3,003,741 | 6,634,210 | 68,151 | 400,471 | ||||||||||||||||
| Shares redeemed | (20,002,140 | ) | (43,856,837 | ) | (790,375 | ) | (4,643,035 | ) | ||||||||||||
| Net increase (decrease) | (7,620,776 | ) | $ | (16,514,940 | ) | (172,904 | ) | $ | (1,009,092 | ) | ||||||||||
Year ended September 30, 2018 | ||||||||||||||||||||
Shares sold | 22,303,807 | $ | 51,304,961 | 1,311,996 | $ | 7,841,271 | ||||||||||||||
Shares issued in reinvestment of distributions | 6,461,113 | 14,805,328 | 144,887 | 862,596 | ||||||||||||||||
| Shares redeemed | (52,753,780 | ) | (121,698,325 | ) | (2,397,338 | ) | (14,338,539 | ) | ||||||||||||
| Net increase (decrease) | (23,988,860 | ) | $ | (55,588,036 | ) | (940,455 | ) | $ | (5,634,672 | ) | ||||||||||
| franklintempleton.com | Semiannual Report | 109 |
FRANKLIN CUSTODIAN FUNDS
NOTES TO FINANCIAL STATEMENTS (UNAUDITED)
2. Shares of Beneficial Interest(continued)
Franklin Income Fund | Franklin U.S. Government | |||||||||||||||
| Shares | Amount | Shares | Amount | |||||||||||||
Class R6 Shares: | ||||||||||||||||
Six Months ended March 31, 2019 | ||||||||||||||||
Shares sold | 41,365,646 | $ | 92,178,456 | 32,439,694 | $ | 191,768,295 | ||||||||||
Shares issued in reinvestment of distributions | 22,684,484 | 50,597,117 | 2,043,920 | 12,058,952 | ||||||||||||
| Shares redeemed | (110,194,607 | ) | (244,763,071 | ) | (20,195,568 | ) | (118,612,975 | ) | ||||||||
| Net increase (decrease) | (46,144,477 | ) | $ | (101,987,498 | ) | 14,288,046 | $ | 85,214,272 | ||||||||
Year ended September 30, 2018 | ||||||||||||||||
Shares sold | 241,446,374 | $ | 566,628,288 | 61,412,244 | $ | 370,212,496 | ||||||||||
Shares issued in reinvestment of distributions | 46,333,019 | 107,151,115 | 3,488,682 | 20,828,159 | ||||||||||||
| Shares redeemed | (157,691,667 | ) | (364,327,918 | ) | (19,140,378 | ) | (114,420,880 | ) | ||||||||
| Net increase (decrease) | 130,087,726 | $ | 309,451,485 | 45,760,548 | $ | 276,619,775 | ||||||||||
Advisor Class Shares: | ||||||||||||||||
Six Months ended March 31, 2019 | ||||||||||||||||
Shares sold | 602,921,408 | $ | 1,342,952,920 | 65,185,151 | $ | 386,583,933 | ||||||||||
Shares issued in reinvestment of distributions | 119,574,590 | 266,665,724 | 1,911,890 | 11,285,879 | ||||||||||||
| Shares redeemed | (685,337,586 | ) | (1,519,773,316 | ) | (42,961,018 | ) | (254,613,911 | ) | ||||||||
| Net increase (decrease) | 37,158,412 | $ | 89,845,328 | 24,136,023 | $ | 143,255,901 | ||||||||||
Year ended September 30, 2018 | ||||||||||||||||
Shares sold | 1,216,256,316 | $ | 2,822,041,342 | 40,864,155 | $ | 245,204,402 | ||||||||||
Shares issued in reinvestment of distributions | 227,374,647 | 525,980,680 | 3,544,600 | 21,175,930 | ||||||||||||
| Shares redeemed | (1,442,679,003 | ) | (3,349,547,760 | ) | (60,767,806 | ) | (366,985,904 | ) | ||||||||
| Net increase (decrease) | 951,960 | $ | (1,525,738 | ) | (16,359,051 | ) | $ | (100,605,572 | ) | |||||||
aMay include a portion of Class C shares that were automatically converted to Class A. bFor the period September 10, 2018 (effective date) to September 30, 2018. cClass M was closed to investors on June 8, 2018. dFor the period January 25, 2018 (effective date) to June 8, 2018. |
| |||||||||||||||
Franklin Utilities Fund | ||||||||||||||||
| Shares | Amount | |||||||||||||||
Class A Shares: | ||||||||||||||||
Six Months ended March 31, 2019 | ||||||||||||||||
Shares solda | 15,324,837 | $ | 294,742,711 | |||||||||||||
Shares issued in reinvestment of distributions | 397,983 | 7,646,783 | ||||||||||||||
| Shares redeemed. | (1,978,587 | ) | (37,753,179 | ) | ||||||||||||
| Net increase (decrease) | 13,744,233 | $ | 264,636,315 | |||||||||||||
Year ended September 30, 2018b | ||||||||||||||||
Shares sold | 192,333 | $ | 3,622,735 | |||||||||||||
| Shares redeemed. | (2,829 | ) | (52,133 | ) | ||||||||||||
| Net increase (decrease) | 189,504 | $ | 3,570,602 | |||||||||||||
| 110 | Semiannual Report | franklintempleton.com | ||
FRANKLIN CUSTODIAN FUNDS
NOTES TO FINANCIAL STATEMENTS (UNAUDITED)
Franklin Utilities Fund | ||||||||
| Shares | Amount | |||||||
Class A1 Shares: | ||||||||
Six Months ended March 31, 2019 | ||||||||
Shares sold | 8,272,850 | $ | 157,462,567 | |||||
Shares issued in reinvestment of distributions | 7,811,488 | 149,956,531 | ||||||
| Shares redeemed. | (19,951,843 | ) | (383,944,352 | ) | ||||
| Net increase (decrease) | (3,867,505 | ) | $ | (76,525,254 | ) | |||
Year ended September 30, 2018 | ||||||||
Shares sold | 24,701,743 | $ | 456,163,799 | |||||
Shares issued in reinvestment of distributions | 8,528,408 | 161,849,791 | ||||||
| Shares redeemed. | (55,450,300 | ) | (1,018,710,628 | ) | ||||
| Net increase (decrease) | (22,220,149 | ) | $ | (400,697,038 | ) | |||
Class M Shares:c | ||||||||
Year ended September 30, 2018d | ||||||||
Shares sold | 276 | $ | 5,000 | |||||
| Shares redeemed. | (276 | ) | (4,738 | ) | ||||
| Net increase (decrease) | — | $ | 262 | |||||
Class C Shares: | ||||||||
Six Months ended March 31, 2019 | ||||||||
Shares sold | 2,367,812 | $ | 45,044,050 | |||||
Shares issued in reinvestment of distributions | 1,446,099 | 27,612,179 | ||||||
| Shares redeemeda | (11,860,373 | ) | (227,191,509 | ) | ||||
| Net increase (decrease) | (8,046,462 | ) | $ | (154,535,280 | ) | |||
Year ended September 30, 2018 | ||||||||
Shares sold | 3,577,672 | $ | 66,427,917 | |||||
Shares issued in reinvestment of distributions | 1,833,349 | 34,761,364 | ||||||
| Shares redeemed. | (11,911,335 | ) | (216,978,128 | ) | ||||
| Net increase (decrease) | (6,500,314 | ) | $ | (115,788,847 | ) | |||
Class R Shares: | ||||||||
Six Months ended March 31, 2019 | ||||||||
Shares sold | 906,062 | $ | 17,168,268 | |||||
Shares issued in reinvestment of distributions | 163,276 | 3,121,935 | ||||||
| Shares redeemed. | (818,449 | ) | (15,459,445 | ) | ||||
| Net increase (decrease) | 250,889 | $ | 4,830,758 | |||||
Year ended September 30, 2018 | ||||||||
Shares sold | 977,147 | $ | 17,937,233 | |||||
Shares issued in reinvestment of distributions | 181,427 | 3,446,022 | ||||||
| Shares redeemed. | (2,178,750 | ) | (39,843,759 | ) | ||||
| Net increase (decrease) | (1,020,176 | ) | $ | (18,460,504 | ) | |||
| franklintempleton.com | Semiannual Report | 111 |
FRANKLIN CUSTODIAN FUNDS
NOTES TO FINANCIAL STATEMENTS (UNAUDITED)
2. Shares of Beneficial Interest(continued)
Franklin Utilities Fund | ||||||||
| Shares | Amount | |||||||
Class R6 Shares: | ||||||||
Six Months ended March 31, 2019 | ||||||||
Shares sold | 1,624,307 | $ | 31,121,237 | |||||
Shares issued in reinvestment of distributions | 534,813 | 10,349,802 | ||||||
| Shares redeemed. | (2,830,023 | ) | (54,558,931 | ) | ||||
| Net increase (decrease) | (670,903 | ) | $ | (13,087,892 | ) | |||
Year ended September 30, 2018 | ||||||||
Shares sold | 2,535,167 | $ | 47,060,404 | |||||
Shares issued in reinvestment of distributions | 576,101 | 10,987,844 | ||||||
| Shares redeemed. | (3,356,319 | ) | (62,348,594 | ) | ||||
| Net increase (decrease) | (245,051 | ) | $ | (4,300,346 | ) | |||
Advisor Class Shares: | ||||||||
Six Months ended March 31, 2019 | ||||||||
Shares sold | 10,087,857 | $ | 195,194,099 | |||||
Shares issued in reinvestment of distributions | 2,080,504 | 40,266,447 | ||||||
| Shares redeemed. | (12,252,390 | ) | (238,050,607 | ) | ||||
| Net increase (decrease) | (84,029 | ) | $ | (2,590,061 | ) | |||
Year ended September 30, 2018 | ||||||||
Shares sold | 14,395,975 | $ | 268,529,702 | |||||
Shares issued in reinvestment of distributions | 2,102,341 | 40,138,480 | ||||||
| Shares redeemed. | (17,010,198 | ) | (312,598,481 | ) | ||||
| Net increase (decrease) | (511,882 | ) | $ | (3,930,299 | ) | |||
aMay include a portion of Class C shares that were automatically converted to Class A.
bFor the period September 10, 2018 (effective date) to September 30, 2018.
cClass M was closed to investors on June 8, 2018.
dFor the period January 25, 2018 (effective date) to June 8, 2018.
3. Transactions with Affiliates
Franklin Resources, Inc. is the holding company for various subsidiaries that together are referred to as Franklin Templeton. Certain officers and trustees of the Trust are also officers and/or directors of the following subsidiaries:
| Subsidiary | Affiliation | |||
Franklin Advisers, Inc. (Advisers) | Investment manager | |||
Franklin Templeton Services, LLC (FT Services) | Administrative manager | |||
Franklin Templeton Distributors, Inc. (Distributors) | Principal underwriter | |||
Franklin Templeton Investor Services, LLC (Investor Services) | Transfer agent |
| 112 | Semiannual Report | franklintempleton.com | ||
FRANKLIN CUSTODIAN FUNDS
NOTES TO FINANCIAL STATEMENTS (UNAUDITED)
a. Management Fees
Franklin Income Fund and Franklin Utilities Fund pay an investment management fee to Advisers based on themonth-end net assets of each of the Funds as follows:
| Annualized Fee Rate | Net Assets | |
0.625% | Up to and including $100 million | |
0.500% | Over $100 million, up to and including $250 million | |
0.450% | Over $250 million, up to and including $7.5 billion | |
0.440% | Over $7.5 billion, up to and including $10 billion | |
0.430% | Over $10 billion, up to and including $12.5 billion | |
0.420% | Over $12.5 billion, up to and including $15 billion | |
0.400% | Over $15 billion, up to and including $17.5 billion | |
0.380% | Over $17.5 billion, up to and including $20 billion | |
0.360% | Over $20 billion, up to and including $35 billion | |
0.355% | Over $35 billion, up to and including $50 billion | |
0.350% | Over $50 billion, up to and including $65 billion | |
0.345% | Over $65 billion, up to and including $80 billion | |
0.340% | In excess of $80 billion |
Franklin DynaTech Fund, Franklin Growth Fund and Franklin U.S. Government Securities Fund pay an investment management fee to Advisers based on themonth-end net assets of each of the Funds as follows:
| Annualized Fee Rate | Net Assets | |
0.625% | Up to and including $100 million | |
0.500% | Over $100 million, up to and including $250 million | |
0.450% | Over $250 million, up to and including $7.5 billion | |
0.440% | Over $7.5 billion, up to and including $10 billion | |
0.430% | Over $10 billion, up to and including $12.5 billion | |
0.420% | Over $12.5 billion, up to and including $15 billion | |
0.400% | Over $15 billion, up to and including $17.5 billion | |
0.380% | Over $17.5 billion, up to and including $20 billion | |
0.360% | Over $20 billion, up to and including $35 billion | |
0.355% | Over $35 billion, up to and including $50 billion | |
0.350% | In excess of $50 billion |
For the period ended March 31, 2019, each Fund’s annualized gross effective investment management fee rate based on average daily net assets was as follows:
Franklin DynaTech Fund | Franklin Growth Fund | Franklin Income Fund | Franklin U.S. Government | Franklin Utilities Fund | ||||||||||||
0.465% | 0.445% | 0.375% | 0.456% | 0.459% | ||||||||||||
b. Administrative Fees
Under an agreement with Advisers, FT Services provides administrative services to the Funds. The fee is paid by Advisers based on each of the Funds’ average daily net assets, and is not an additional expense of the Funds.
| franklintempleton.com | Semiannual Report | 113 |
FRANKLIN CUSTODIAN FUNDS
NOTES TO FINANCIAL STATEMENTS (UNAUDITED)
3. Transactions with Affiliates(continued)
c. Distribution Fees
The Board has adopted distribution plans for each share class, with the exception of Class R6 and Advisor Class shares, pursuant to Rule12b-1 under the 1940 Act. Under the Funds’ Class A and A1 reimbursement distribution plans, the Funds reimburse Distributors for costs incurred in connection with the servicing, sale and distribution of each Fund’s shares up to the maximum annual plan rate for each class. Under the Class A and A1 reimbursement distribution plans, costs exceeding the maximum for the current plan year cannot be reimbursed in subsequent periods. In addition, under the Funds’ Class C and R compensation distribution plans, the Funds pay Distributors for costs incurred in connection with the servicing, sale and distribution of each Fund’s shares up to the maximum annual plan rate for each class. The plan year, for purposes of monitoring compliance with the maximum annual plan rates, is February 1 through January 31 for each Fund.
The maximum annual plan rates, based on the average daily net assets, for each class, are as follows:
| Franklin DynaTech Fund | Franklin Growth Fund | Franklin Income Fund | Franklin U.S. Government Securities Fund | Franklin Utilities Fund | ||||||||||||||||
Reimbursement Plans: | ||||||||||||||||||||
Class A | 0.25% | 0.25% | 0.25% | 0.25% | 0.25% | |||||||||||||||
Class A1 | —% | —% | 0.15% | 0.15% | 0.15% | |||||||||||||||
Compensation Plans: | ||||||||||||||||||||
Class C | 1.00% | 1.00% | 0.65% | 0.65% | 0.65% | |||||||||||||||
Class R | 0.50% | 0.50% | 0.50% | 0.50% | 0.50% | |||||||||||||||
d. Sales Charges/Underwriting Agreements
|
| |||||||||||||||||||
| Front-end sales charges and contingent deferred sales charges (CDSC) do not represent expenses of the Funds. These charges are deducted from the proceeds of sales of fund shares prior to investment or from redemption proceeds prior to remittance, as applicable. Distributors has advised the Funds of the following commission transactions related to the sales and redemptions of the Funds’ shares for the period: |
| |||||||||||||||||||
Franklin | Franklin | Franklin | Franklin U.S. Government | Franklin | ||||||||||||||||
Sales charges retained net of commissions paid to unaffiliated brokers/dealers | $765,619 | $647,962 | $1,432,949 | $37,733 | $71,566 | |||||||||||||||
CDSC retained | $ 55,209 | $ 34,213 | $ 345,093 | $24,246 | $ 8,147 | |||||||||||||||
Effective March 1, 2019, certainfront-end sales charges on Class A and A1 shares were lowered. Further details are disclosed in the Funds’ Prospectus.
| 114 | Semiannual Report | franklintempleton.com | ||
FRANKLIN CUSTODIAN FUNDS
NOTES TO FINANCIAL STATEMENTS (UNAUDITED)
e. Transfer Agent Fees
Each class of shares pays transfer agent fees to Investor Services for its performance of shareholder servicing obligations. The fees are based on an annualized asset based fee of 0.02% plus a transaction based fee. In addition, each class reimburses Investor Services for out of pocket expenses incurred and, except for Class R6, reimburses shareholder servicing fees paid to third parties. These fees are allocated daily based upon their relative proportion of such classes’ aggregate net assets. Class R6 pays Investor Services transfer agent fees specific to that class.
For the period ended March 31, 2019, the Funds paid transfer agent fees as noted in the Statements of Operations of which the following amounts were retained by Investor Services:
| Franklin DynaTech Fund | Franklin Growth Fund | Franklin Income Fund | Franklin U.S. Government Securities Fund | Franklin Utilities Fund | ||||||||||||||||
Transfer agent fees | $1,575,848 | $3,503,729 | $13,708,609 | $1,666,026 | $1,629,699 | |||||||||||||||
f. Investments in Affiliated Management Investment Companies
Certain or all Funds invest in one or more affiliated management investment companies for purposes other than exercising a controlling influence over the management or policies. Management fees paid by the Funds are waived on assets invested in the affiliated management investment companies, as noted in the Statements of Operations, in an amount not to exceed the management and administrative fees paid directly or indirectly by each affiliate. During the period ended March 31, 2019, investments in affiliated management investment companies were as follows:
| Number of Shares Held at Beginning of Period | Gross Additions | Gross Reductions | Number of Shares Held at End of Period | Value of Period | Investment Income | Realized Gain (Loss) | Net Change in Unrealized Appreciation (Depreciation) | |||||||||||||||||||||||||
Franklin DynaTech Fund | ||||||||||||||||||||||||||||||||
Non-Controlled Affiliates | ||||||||||||||||||||||||||||||||
| Dividends | ||||||||||||||||||||||||||||||||
Institutional Fiduciary Trust Money Market Portfolio, | 125,141,525 | 804,988,023 | (698,860,539 | ) | 231,269,009 | $ | 231,269,009 | $1,878,621 | $ — | $ — | ||||||||||||||||||||||
Franklin Growth Fund | ||||||||||||||||||||||||||||||||
Non-Controlled Affiliates | ||||||||||||||||||||||||||||||||
| Dividends | ||||||||||||||||||||||||||||||||
Institutional Fiduciary Trust Money Market Portfolio, | 224,477,141 | 573,172,230 | (598,476,190 | ) | 199,173,181 | $ | 199,173,181 | $2,590,866 | $ — | $ — | ||||||||||||||||||||||
Franklin Income Fund | ||||||||||||||||||||||||||||||||
Non-Controlled Affiliates | ||||||||||||||||||||||||||||||||
| Dividends | ||||||||||||||||||||||||||||||||
Institutional Fiduciary Trust Money Market Portfolio, | 351,285,912 | 9,766,379,306 | (8,098,799,453 | ) | 2,018,865,765 | $ | 2,018,865,765 | $6,192,789 | $ — | $ — | ||||||||||||||||||||||
| | Income from securities loaned | | ||||||||||||||||||||||||||||||
Institutional Fiduciary Trust Money Market Portfolio, 2.10% | 12,623,000 | 35,488,000 | (48,111,000 | ) | — | — | $ 45,327 | — | — | |||||||||||||||||||||||
Total Affiliated Securities |
| $ | 2,018,865,765 | $6,238,116 | $ — | $ — | ||||||||||||||||||||||||||
| franklintempleton.com | Semiannual Report | 115 |
FRANKLIN CUSTODIAN FUNDS
NOTES TO FINANCIAL STATEMENTS (UNAUDITED)
3. Transactions with Affiliates(continued)
f. Investments in Affiliated Management Investment Companies(continued)
| Number of Shares Held at Beginning of Period | Gross Additions | Gross Reductions | Number of Shares Held at End of Period | Value at End | Investment Income | Realized Gain (Loss) | Net Change in Unrealized Appreciation (Depreciation) | |||||||||||||||||||||||||
Franklin U.S. Government Securities Fund |
| |||||||||||||||||||||||||||||||
Non-Controlled Affiliates |
| |||||||||||||||||||||||||||||||
| Dividends | ||||||||||||||||||||||||||||||||
Institutional Fiduciary Trust Money Market Portfolio, | 93,109,667 | 594,254,772 | (439,630,510 | ) | 247,733,929 | $ | 247,733,929 | $1,119,518 | $ — | $ — | ||||||||||||||||||||||
Franklin Utilities Fund |
| |||||||||||||||||||||||||||||||
Non-Controlled Affiliates |
| |||||||||||||||||||||||||||||||
| Dividends | ||||||||||||||||||||||||||||||||
Institutional Fiduciary Trust Money Market Portfolio, | 17,808,342 | 434,616,793 | (389,681,675 | ) | 62,743,460 | $ | 62,743,460 | $ 370,046 | $ — | $ — | ||||||||||||||||||||||
| | Income from securities loaned | | ||||||||||||||||||||||||||||||
Institutional Fiduciary Trust Money Market Portfolio, | — | 63,838,880 | (63,838,880 | ) | — | — | $ 10,285 | — | — | |||||||||||||||||||||||
Total Affiliated Securities |
| $ | 62,743,460 | $ 380,331 | $ — | $ — | ||||||||||||||||||||||||||
g. Waiver and Expense Reimbursements
For Franklin Income Fund, Investor Services has contractually agreed in advance to waive or limit its fees so that the Class R6 transfer agent fees do not exceed 0.02% based on the average net assets of the class until January 31, 2020. For Franklin DynaTech Fund, Franklin Growth Fund, Franklin U.S. Government Securities Fund and Franklin Utilities Fund, Investor Services has contractually agreed in advance to waive or limit its fees so that the Class R6 transfer agent fees do not exceed 0.03% based on the average net assets of the class until January 31, 2020.
Prior to February 1, 2019, expenses of Franklin Income Fund for Class R6 were limited to 0.01% based on the average net assets of the class.
Prior to February 1, 2019, expenses of Franklin DynaTech Fund, Franklin Growth Fund, Franklin U.S. Government Securities Fund and Franklin Utilities Fund for Class R6 were limited to 0.02% based on the average net assets of the class.
h. Other Affiliated Transactions
At March 31, 2019, one or more of the funds in Franklin Fund Allocator Series owned a percentage of the following Funds’ outstanding shares:
Franklin DynaTech Fund | Franklin Growth Fund | Franklin Income Fund | Franklin U.S. Government | Franklin Utilities Fund | ||||||||||||
3.5% | 5.3% | 1.8% | 9.8% | 1.9% | ||||||||||||
| 116 | Semiannual Report | franklintempleton.com | ||
FRANKLIN CUSTODIAN FUNDS
NOTES TO FINANCIAL STATEMENTS (UNAUDITED)
i. Interfund Transactions
Franklin Income Fund engaged in purchases and sales of investments with funds or other accounts that have common investment managers (or affiliated investment managers), directors, trustees or officers. During the period ended March 31, 2019, these purchase and sale transactions aggregated $31,420,250 and $0, respectively.
4. Expense Offset Arrangement
The Funds have entered into an arrangement with their custodian whereby credits realized as a result of uninvested cash balances are used to reduce a portion of the Funds’ custodian expenses. During the period ended March 31, 2019, the custodian fees were reduced as noted in the Statements of Operations.
5. Income Taxes
For tax purposes, capital losses may be carried over to offset future capital gains. Capital loss carryforwards with no expiration, if any, must be fully utilized before those losses with expiration dates.
At September 30, 2018, the capital loss carryforwards were as follows:
Franklin Income Fund | Franklin U.S. Government Securities Fund | |||||||||||
Capital loss carryforwards subject to expiration: | ||||||||||||
2019 | $ — | $ 4,445,156 | ||||||||||
Capital loss carryforwards not subject to expiration: | ||||||||||||
Short term | 1,410,836,852 | 227,313,517 | ||||||||||
Long term | 577,904,717 | 323,826,140 | ||||||||||
Total capital loss carryforwards | $1,988,741,569 | $ 555,584,813 | ||||||||||
For tax purposes, the Funds may elect to defer any portion of a late-year ordinary loss to the first day of the following fiscal year. At September 30, 2018, Franklin DynaTech Fund deferred late-year ordinary losses of $11,794,621.
At March 31, 2019, the cost of investments and net unrealized appreciation (depreciation) for income tax purposes were as follows: |
| |||||||||||
Franklin DynaTech Fund | Franklin Growth Fund | Franklin Income Fund | ||||||||||
Cost of investments | $4,146,050,646 | $ 5,458,309,949 | $72,272,410,029 | |||||||||
Unrealized appreciation | $3,407,073,807 | $10,284,936,569 | $ 5,941,596,652 | |||||||||
Unrealized depreciation | (15,565,046 | ) | (92,824,272 | ) | (3,546,806,547 | ) | ||||||
Net unrealized appreciation (depreciation) | $3,391,508,761 | $10,192,112,297 | $ 2,394,790,105 | |||||||||
Franklin U.S. Government Securities Fund | Franklin Utilities Fund | |||||||||||
Cost of investments | $ 5,234,609,064 | $3,079,814,909 | ||||||||||
Unrealized appreciation | $ 73,899,590 | $3,187,127,833 | ||||||||||
Unrealized depreciation | (61,956,175 | ) | (22,672,588 | ) | ||||||||
Net unrealized appreciation (depreciation) | $ 11,943,415 | $3,164,455,245 | ||||||||||
| franklintempleton.com | Semiannual Report | 117 |
FRANKLIN CUSTODIAN FUNDS
NOTES TO FINANCIAL STATEMENTS (UNAUDITED)
5. Income Taxes(continued)
Differences between income and/or capital gains as determined on a book basis and a tax basis are primarily due to differing treatments of paydown losses, bond discounts and premiums, corporate actions, equity-linked securities, wash sales and gains realized onin-kind shareholder redemptions.
6. Investment Transactions
Purchases and sales of investments (excluding short term securities andin-kind transactions) for the period ended March 31, 2019, were as follows:
| Franklin DynaTech Fund | Franklin Growth Fund | Franklin Income Fund | Franklin U.S. Government Securities Fund | Franklin Utilities Fund | ||||||||||||||||
Purchases | $ | 1,135,537,200 | $ | 372,667,028 | $ | 15,419,743,184 | $ | 686,139,380 | $ | 155,442,154 | ||||||||||
Sales | $ | 623,492,669 | $ | 465,872,802 | $ | 18,123,024,474 | $ | 802,667,330 | $ | 360,381,975 | ||||||||||
7. Credit Risk and Defaulted Securities
At March 31, 2019, Franklin Income Fund had 34.4% of its portfolio invested in high yield securities, senior secured floating rate loans, or other securities rated below investment grade and unrated securities, if any. These securities may be more sensitive to economic conditions causing greater price volatility and are potentially subject to a greater risk of loss due to default than higher rated securities.
Franklin Income Fund held a defaulted security and/or other securities for which the income has been deemed uncollectible. At March 31, 2019, the value of this security was $143,250,000, representing 0.2% of the Fund’s net assets. The Fund discontinues accruing income on securities for which income has been deemed uncollectible and provide an estimate for losses on interest receivable. The security has been identified in the accompanying Statement of Investments.
8. Other Derivative Information
At March 31, 2019, the investments in derivative contracts are reflected in the Statements of Assets and Liabilities as follows:
| Asset Derivatives | Liability Derivatives | |||||||||||||
Derivative Contracts Not Accounted for as Hedging Instruments | Statements of Assets and Liabilities Location | Fair Value | Statements of Assets and Liabilities Location | Fair Value | ||||||||||
Franklin Income Fund | ||||||||||||||
Equity contracts | Investments in securities, at value | $ | 198,100,000 | a | Options written, at value | $ | 67,461,259 | |||||||
aPurchased option contracts are included in investments in securities, at value in the Statements of Assets and Liabilities.
| 118 | Semiannual Report | franklintempleton.com | ||
FRANKLIN CUSTODIAN FUNDS
NOTES TO FINANCIAL STATEMENTS (UNAUDITED)
For the period ended March 31, 2019, the effect of derivative contracts in the Statements of Operations was as follows:
Derivative Contracts Not Accounted for as Hedging Instruments | Statements of Operations Location | Net Realized Gain (Loss) for the Period | Statements of Operations Location | Net Change in Appreciation (Depreciation) for the Period | ||||||||
| Net realized gain (loss) from: | Net change in unrealized appreciation (depreciation) on: | |||||||||||
Franklin Income Fund | ||||||||||||
Credit contracts | Swap contracts | $ | 1,944,731 | Swap contracts | $ | — | ||||||
Equity contracts | Investments | — | Investments | (49,890,362 | )a | |||||||
| Written options | 66,232,650 | Written options | (11,658,265 | ) | ||||||||
Totals | $ | 68,177,381 | $ | (61,548,627 | ) | |||||||
aPurchased option contracts are included in net realized gain (loss) from investments and net change in unrealized appreciation (depreciation) on investments in the Statements of Operations.
For the period ended March 31, 2019, the average month end notional amount of options and swap contracts represented 49,721,729 shares and $85,714,286, respectively.
See Note 1(d) regarding derivative financial instruments.
9. Holdings of 5% Voting Securities of Portfolio Companies
The 1940 Act defines “affiliated companies” to include investments in portfolio companies in which a fund owns 5% or more of the outstanding voting securities. During the period ended March 31, 2019, investments in “affiliated companies” were as follows:
| Name of Issuer | Number of Shares Held at Beginning of Period | Gross Additions | Gross Reductions | Number of Shares Held at End of Period | Value at End Period | Dividend Income | Realized Gain (Loss) | Net Change in Appreciation (Depreciation) | ||||||||||||||||||||||||
Franklin Income Fund | ||||||||||||||||||||||||||||||||
Non-Controlled Affiliates | ||||||||||||||||||||||||||||||||
Talos Energy Inc. | 5,517,437 | — | (2,901,656 | ) | 2,615,781 | $ | — | a | $ | — | $ | (48,815,709 | ) | $ | — | a | ||||||||||||||||
aAs of March 31, 2019, no longer an affiliate.
10. Credit Facility
The Funds, together with other U.S. registered and foreign investment funds (collectively, Borrowers), managed by Franklin Templeton, are borrowers in a joint syndicated senior unsecured credit facility totaling $2 billion (Global Credit Facility) which matures on February 7, 2020. This Global Credit Facility provides a source of funds to the Borrowers for temporary and emergency purposes, including the ability to meet future unanticipated or unusually large redemption requests.
Under the terms of the Global Credit Facility, the Funds shall, in addition to interest charged on any borrowings made by the Funds and other costs incurred by the Funds, pay their share of fees and expenses incurred in connection with the implementation and maintenance of the Global Credit Facility, based upon their relative share of the aggregate net assets of all of the Borrowers, including an annual commitment fee of 0.15% based upon the unused portion of the Global Credit Facility. These fees are reflected in other expenses in the Statements of Operations. During the period ended March 31, 2019, the Funds did not use the Global Credit Facility.
| franklintempleton.com | Semiannual Report | 119 |
FRANKLIN CUSTODIAN FUNDS
NOTES TO FINANCIAL STATEMENTS (UNAUDITED)
11. RedemptionsIn-Kind
During the period ended March 31, 2019 and year ended September 30, 2018, the Franklin Growth Fund realized $52,349,028 and $42,189,159, respectively, of net gains resulting from redemptionsin-kind in which a shareholder redeemed fund shares for cash and securities held by the Fund. Because such gains are not taxable to the Fund and are not distributed to remaining shareholders, they are reclassified from accumulated net realized gains topaid-in capital.
12. Fair Value Measurements
The Funds follow a fair value hierarchy that distinguishes between market data obtained from independent sources (observable inputs) and the Funds’ own market assumptions (unobservable inputs). These inputs are used in determining the value of the Funds’ financial instruments and are summarized in the following fair value hierarchy:
| • | Level 1 – quoted prices in active markets for identical financial instruments | |||
| • | Level 2 – other significant observable inputs (including quoted prices for similar financial instruments, interest rates, prepayment speed, credit risk, etc.) | |||
| • | Level 3 – significant unobservable inputs (including the Funds’ own assumptions in determining the fair value of financial instruments) | |||
The input levels are not necessarily an indication of the risk or liquidity associated with financial instruments at that level.
A summary of inputs used as of March 31, 2019, in valuing the Funds’ assets and liabilities carried at fair value, is as follows:
| Level 1 | Level 2 | Level 3 | Total | |||||||||||||
Franklin DynaTech Fund | ||||||||||||||||
Assets: | ||||||||||||||||
Investments in Securities:a | ||||||||||||||||
Equity Investments | $ | 7,306,290,398 | $ | — | $ | — | $ | 7,306,290,398 | ||||||||
Short Term Investments | 231,269,009 | — | — | 231,269,009 | ||||||||||||
Total Investments in Securities | $ | 7,537,559,407 | $ | — | $ | — | $ | 7,537,559,407 | ||||||||
Franklin Growth Fund | ||||||||||||||||
Assets: | ||||||||||||||||
Investments in Securities:a | ||||||||||||||||
Equity Investmentsb | $ | 15,451,249,065 | $ | — | $ | — | $ | 15,451,249,065 | ||||||||
Short Term Investments | 199,173,181 | — | — | 199,173,181 | ||||||||||||
Total Investments in Securities | $ | 15,650,422,246 | $ | — | $ | — | $ | 15,650,422,246 | ||||||||
| 120 | Semiannual Report | franklintempleton.com | ||
FRANKLIN CUSTODIAN FUNDS
NOTES TO FINANCIAL STATEMENTS (UNAUDITED)
| Level 1 | Level 2 | Level 3 | Total | |||||||||||||
Franklin Income Fund | ||||||||||||||||
Assets: | ||||||||||||||||
Investments in Securities:a | ||||||||||||||||
Equity Investments:b | ||||||||||||||||
Energy. | $ | 3,433,767,771 | $ | 64,629,728 | $ | — | $ | 3,498,397,499 | ||||||||
Financials | 4,253,443,852 | 129,625,000 | — | 4,383,068,852 | ||||||||||||
All Other Equity Investments | 16,962,818,525 | — | — | 16,962,818,525 | ||||||||||||
Equity-Linked Securities | — | 9,116,193,634 | — | 9,116,193,634 | ||||||||||||
Index-Linked Notes | — | 100,180,950 | — | 100,180,950 | ||||||||||||
Convertible Bonds | — | 644,430,706 | — | 644,430,706 | ||||||||||||
Corporate Bonds | — | 28,955,297,140 | — | 28,955,297,140 | ||||||||||||
Senior Floating Rate Interests | — | 1,800,805,369 | — | 1,800,805,369 | ||||||||||||
U.S. Government and Agency Securities | — | 6,547,246,573 | — | 6,547,246,573 | ||||||||||||
Escrows and Litigation Trusts | — | — | — | c | — | |||||||||||
Options Purchased | 198,100,000 | — | — | 198,100,000 | ||||||||||||
Short Term Investments | 2,515,908,515 | 12,213,630 | — | 2,528,122,145 | ||||||||||||
Total Investments in Securities | $ | 27,364,038,663 | $ | 47,370,622,730 | $ | — | $ | 74,734,661,393 | ||||||||
Liabilities: | ||||||||||||||||
Other Financial Instruments: | ||||||||||||||||
Options Written | $ | 67,461,259 | $ | — | $ | — | $ | 67,461,259 | ||||||||
Franklin U.S. Government Securities Fund | ||||||||||||||||
Assets: | ||||||||||||||||
Investments in Securities:a | ||||||||||||||||
Mortgage-Backed Securities | $ | — | $ | 4,910,087,691 | $ | — | $ | 4,910,087,691 | ||||||||
U.S. Government and Agency Securities | — | 88,730,859 | — | 88,730,859 | ||||||||||||
Short Term Investments | 247,733,929 | — | — | 247,733,929 | ||||||||||||
Total Investments in Securities | $ | 247,733,929 | $ | 4,998,818,550 | $ | — | $ | 5,246,552,479 | ||||||||
Franklin Utilities Fund | ||||||||||||||||
Assets: | ||||||||||||||||
Investments in Securities:a | ||||||||||||||||
Equity Investments | $ | 6,174,667,539 | $ | — | $ | — | $ | 6,174,667,539 | ||||||||
Corporate Bonds | — | 6,859,155 | — | 6,859,155 | ||||||||||||
Short Term Investments | 62,743,460 | — | — | 62,743,460 | ||||||||||||
Total Investments in Securities | $ | 6,237,410,999 | $ | 6,859,155 | $ | — | $ | 6,244,270,154 | ||||||||
aFor detailed categories, see the accompanying Statement of Investments.
bIncludes common, preferred and convertible preferred stocks and management investment companies.
cIncludes securities determined to have no value at March 31, 2019.
A reconciliation of assets in which Level 3 inputs are used in determining fair value is presented when there are significant Level 3 financial instruments at the beginning and/or end of the period.
13. Subsequent Events
The Funds have evaluated subsequent events through the issuance of the financial statements and determined that no events have occurred that require disclosure.
| franklintempleton.com | Semiannual Report | 121 |
FRANKLIN CUSTODIAN FUNDS
NOTES TO FINANCIAL STATEMENTS (UNAUDITED)
Abbreviations
| Currency | Selected Portfolio | |||||||
| EUR | Euro | ADR | American Depositary Receipt | |||||
| USD | United States Dollar | FHLMC | Federal Home Loan Mortgage Corp. | |||||
| FNMA | Federal National Mortgage Association | |||||||
| FRN | Floating Rate Note | |||||||
| LIBOR | London InterBank Offered Rate | |||||||
| SF | Single Family | |||||||
| SPX B | S&P 500 IndexBuy-Write | |||||||
| SPX B DT | S&P 500 IndexBuy-Write Distribution | |||||||
| 122 | Semiannual Report | franklintempleton.com | ||
FRANKLIN CUSTODIAN FUNDS
Board Approval of Investment Management Agreements
FRANKLIN CUSTODIAN FUNDS
Franklin Dynatech Fund
Franklin Growth Fund
Franklin Income Fund
Franklin U.S. Government Securities Fund
Franklin Utilities Fund
(each a Fund)
At anin-person meeting held on February 26, 2019 (Meeting), the Board of Trustees (Board) of Franklin Custodian Funds (Trust), including a majority of the trustees who are not “interested persons” as defined in the Investment Company Act of 1940 (Independent Trustees), reviewed and approved the continuance of the investment management agreement between Franklin Advisers, Inc. (Manager) and the Trust, on behalf of each Fund (each a Management Agreement) for an additionalone-year period. The Independent Trustees received advice from and met separately with Independent Trustee counsel in considering whether to approve the continuation of each Management Agreement. Although the Management Agreements for the Funds were considered at the same Board meeting, the Board considered the information provided to it about the Funds together and with respect to each Fund separately as the Board deemed appropriate.
In considering the continuation of each Management Agreement, the Board reviewed and considered information provided by the Manager at the Meeting and throughout the year at meetings of the Board and its committees. The Board also reviewed and considered information provided in response to a detailed set of requests for information submitted to the Manager by Independent Trustee counsel on behalf of the Independent Trustees in connection with the annual contract renewal process. In addition, prior to the Meeting, the Independent Trustees held a telephonic contract renewal meeting at which the Independent Trustees conferred amongst themselves and Independent Trustee counsel about contract renewal matters. The Board reviewed and considered all of the factors it deemed relevant in approving the continuance of each Management Agreement, including, but not limited to: (i) the nature, extent and quality of the services provided by the Manager; (ii) the investment performance of each Fund; (iii) the costs of the services provided and profits realized by the Manager and its affiliates from the relationship with each Fund; (iv) the extent to which economies of scale are realized as each
Fund grows; and (v) whether fee levels reflect these economies of scale for the benefit of Fund investors.
In approving the continuance of each Management Agreement, the Board, including a majority of the Independent Trustees, determined that the terms of the Management Agreement are fair and reasonable and that the continuance of such Management Agreement is in the interests of the applicable Fund and its shareholders. While attention was given to all information furnished, the following discusses some primary factors relevant to the Board’s determination.
Nature, Extent and Quality of Services
The Board reviewed and considered information regarding the nature, extent and quality of investment management services provided by the Manager and its affiliates to the Funds and their shareholders. This information included, among other things, the qualifications, background and experience of the senior management and investment personnel of the Manager; the structure of investment personnel compensation; oversight of third-party service providers; investment performance reports and related financial information for each Fund; reports on expenses, shareholder services, marketing support payments made to financial intermediaries and third party servicing arrangements; legal and compliance matters; risk controls; pricing and other services provided by the Manager and its affiliates; and management fees charged by the Manager and its affiliates to US funds and other accounts, including management’s explanation of differences among accounts where relevant. The Board also reviewed and considered an annual report on payments made by Franklin Templeton Investments (FTI) or the Funds to financial intermediaries, as well as a memorandum relating to third-party servicing arrangements in response to a guidance update in 2016 from the US Securities and Exchange Commission (SEC) relating to mutual fund distribution andsub-accounting fees. The Board noted management’s continuing efforts and expenditures in establishing effective business continuity plans and developing strategies to address areas of heightened concern in the mutual fund industry, such as cybersecurity and liquidity risk management. The Board also recognized management’s commitment to facilitating Board oversight of liquidity through the designation of a liquidity/risk administrator and the development of reports that highlight the amount of illiquid investments for each Fund.
The Board also reviewed and considered the benefits provided to Fund shareholders of investing in a fund that is part of the Franklin Templeton family of funds. The Board noted the
| franklintempleton.com | Semiannual Report | 123 |
FRANKLIN CUSTODIAN FUNDS
SHAREHOLDER INFORMATION
financial position of Franklin Resources, Inc. (FRI), the Manager’s parent, and its commitment to the mutual fund business as evidenced by its continued introduction of new funds, reassessment of the fund offerings in response to the market environment and project initiatives and capital investments relating to the services provided to the Funds by the FTI organization.
Following consideration of such information, the Board was satisfied with the nature, extent and quality of services provided by the Manager and its affiliates to the Funds and their shareholders.
Fund Performance
The Board reviewed and considered the performance results of each Fund over various time periods ended December 31, 2018. The Board considered the performance returns for each Fund in comparison to the performance returns of mutual funds deemed comparable to the Fund included in a universe (Performance Universe) selected by Broadridge Financial Solutions, Inc. (Broadridge), an independent provider of investment company data. The Board received a description of the methodology used by Broadridge to select the mutual funds included in a Performance Universe. The Board also considered the performance returns for the Franklin Income Fund in comparison to the performance returns of a customized peer group (Performance Customized Peer Group) selected by the Manager. The Board further reviewed and considered Fund performance reports provided and discussions that occurred with portfolio managers at Board meetings throughout the year. A summary of each Fund’s performance results is below.
Franklin DynaTech Fund – The Performance Universe for this Fund included the Fund and all retail and institutionalmulti-cap growth funds. The Board noted that the Fund’s annualized total return for theone-, three-, five- and10-year periods was above the median of its Performance Universe. The Board concluded that the Fund’s performance was satisfactory.
Franklin Growth Fund – The Performance Universe for this Fund included the Fund and all retail and institutionalmulti-cap growth funds. The Board noted that the Fund’s annualized total return for the10-year period was below the median of its Performance Universe, but for theone-, three-, and five-year periods was above the median of its Performance Universe. The Board concluded that the Fund’s performance was satisfactory.
Franklin Income Fund – The Performance Universe for this Fund included the Fund and all retail and institutional mixed-asset target allocation moderate funds. The Performance
Customized Peer Group for this Fund included funds sorted by trailing12-month yield and set to be top quartile (highest yield). The Board noted that the Fund’s annualized income returns for theone-, three-, five- and10-year periods were above the medians of its Performance Universe and Performance Customized Peer Group. The Board also noted that the Fund’s annualized total returns for the five-year period were below the medians of its Performance Universe and Performance Customized Peer Group, but for theone-,three-and10-year periods were above the medians of its Performance Universe and Performance Customized Peer Group. The Board concluded that the Fund’s performance was satisfactory.
Franklin U.S. Government Securities Fund – The Performance Universe for this Fund included the Fund and all retail and institutional Government National Mortgage Association (Ginnie Mae) funds. The Board noted that the Fund’s annualized income return for theone-, three-, five- and10-year periods was above the median of its Performance Universe. The Board also noted that the Fund’s annualized total return for theone-, three-, five- and10-year periods was below the median of its Performance Universe. Given the Fund’s income-oriented investment objective and conservative policy of investing substantially all of its assets in Ginnie Mae obligations, the Board concluded that the Fund’s performance was satisfactory.
Franklin Utilities Fund – The Performance Universe for this Fund included the Fund and all retail and institutional utility funds. The Board noted that the Fund’s annualized income return and annualized total return for theone-, three-, five- and10-year periods were above the medians of its Performance Universe. The Board concluded that the Fund’s performance was satisfactory.
Comparative Fees and Expenses
The Board reviewed and considered information regarding each Fund’s actual total expense ratio and its various components, including, as applicable, management fees; transfer agent expenses; underlying fund expenses; Rule12b-1 andnon-Rule12b-1 service fees; and othernon-management fees. The Board also noted the quarterly and annual reports it receives on all marketing support payments made by FTI to financial intermediaries. The Board considered the actual total expense ratio and, separately, the contractual management fee rate, without the effect of fee waivers, if any (Management Rate), if any, of each Fund in comparison to the median expense ratio and median Management Rate, respectively, of other mutual funds deemed comparable to and with a similar expense structure to the Fund selected by Broadridge (Expense
| 124 | Semiannual Report | franklintempleton.com | ||
FRANKLIN CUSTODIAN FUNDS
SHAREHOLDER INFORMATION
Group). Broadridge fee and expense data is based upon information taken from each fund’s most recent annual report, which reflects historical asset levels that may be quite different from those currently existing, particularly in a period of market volatility. While recognizing such inherent limitation and the fact that expense ratios and Management Rates generally increase as assets decline and decrease as assets grow, the Board believed the independent analysis conducted by Broadridge to be an appropriate measure of comparative fees and expenses. The Broadridge Management Rate includes administrative charges, and the actual total expense ratio, for comparative consistency, was shown for Class A1 shares for the Franklin Income Fund, Franklin U.S. Government Securities Fund and Franklin Utilities Fund and Class A shares for each other Fund and for each other fund in an Expense Group with multiple classes of shares. The Board received a description of the methodology used by Broadridge to select the mutual funds included in an Expense Group.
The Expense Group for the Franklin DynaTech Fund included the Fund and 12 othermulti-cap growth funds. The Expense Group for the Franklin Growth Fund included the Fund and nine othermulti-cap growth funds. The Expense Group for the Franklin Income Fund included the Fund and seven other mixed-asset target allocation moderate funds. The Expense Group for the Franklin U.S. Government Securities Fund included the Fund, six other Ginnie Mae funds and eight US mortgage funds. The Expense Group for the Franklin Utilities Fund included the Fund and six other utility funds. The Board noted that the Management Rates and actual total expense ratios for these Funds were below the medians of their respective Expense Groups. The Board concluded that the Management Rates charged to these Funds are reasonable.
Profitability
The Board reviewed and considered information regarding the profits realized by the Manager and its affiliates in connection with the operation of each Fund. In this respect, the Board considered the Fund profitability analysis provided by the Manager that addresses the overall profitability of FTI’s US fund business, as well as its profits in providing investment management and other services to each of the individual funds during the12-month period ended September 30, 2018, being the most recent fiscalyear-end for FRI. The Board noted that although management continually makes refinements to its methodologies used in calculating profitability in response to organizational and product-related changes, the overall methodology has remained consistent with that used in the Funds’ profitability report presentations from prior years.
Additionally, PricewaterhouseCoopers LLP, auditor to FRI and certain Franklin Templeton funds, has been engaged by the Manager to periodically review and assess the allocation methodologies to be used solely by the Funds’ Board with respect to the profitability analysis.
The Board noted management’s belief that costs incurred in establishing the infrastructure necessary for the type of mutual fund operations conducted by the Manager and its affiliates may not be fully reflected in the expenses allocated to each Fund in determining its profitability, as well as the fact that the level of profits, to a certain extent, reflected operational cost savings and efficiencies initiated by management. The Board also noted management’s expenditures in improving shareholder services provided to the Funds, as well as the need to implement systems and meet additional regulatory and compliance requirements resulting from recent SEC and other regulatory requirements.
The Board also considered the extent to which the Manager and its affiliates might derive ancillary benefits from fund operations, including revenues generated from transfer agent services, potential benefits resulting from personnel and systems enhancements necessitated by fund growth, as well as increased leverage with service providers and counterparties. Based upon its consideration of all these factors, the Board concluded that the level of profits realized by the Manager and its affiliates from providing services to each Fund was not excessive in view of the nature, extent and quality of services provided to each Fund.
Economies of Scale
The Board reviewed and considered the extent to which the Manager may realize economies of scale, if any, as each Fund grows larger and whether each Fund’s management fee structure reflects any economies of scale for the benefit of shareholders. With respect to possible economies of scale, the Board noted the existence of management fee breakpoints, which operate generally to share any economies of scale with a Fund’s shareholders by reducing the Fund’s effective management fees as the Fund grows in size. The Board considered the Manager’s view that any analyses of potential economies of scale in managing a particular fund are inherently limited in light of the joint and common costs and investments the Manager incurs across the Franklin Templeton family of funds as a whole. The Board noted that the Franklin U.S. Government Securities Fund had experienced a decrease in assets over the past three years and would not be expected to demonstrate additional economies of scale in the near term, but
| franklintempleton.com | Semiannual Report | 125 |
FRANKLIN CUSTODIAN FUNDS
SHAREHOLDER INFORMATION
concluded that to the extent economies of scale may be realized by the Manager and its affiliates, each Fund’s management fee structure provided a sharing of benefits with the Fund and its shareholders as the Fund grows.
Conclusion
Based on its review, consideration and evaluation of all factors it believed relevant, including the above-described factors and conclusions, the Board unanimously approved the continuation of each Management Agreement for an additionalone-year period.
Proxy Voting Policies and Procedures
The Trust’s investment manager has established Proxy Voting Policies and Procedures (Policies) that the Trust uses to determine how to vote proxies relating to portfolio securities. Shareholders may view the Trust’s complete Policies online at franklintempleton.com. Alternatively, shareholders may request copies of the Policies free of charge by calling the Proxy Group collect at (954)527-7678 or by sending a written request to: Franklin Templeton Companies, LLC, 300 S.E. 2nd Street, Fort Lauderdale, FL 33301, Attention: Proxy Group. Copies of the Trust’s proxy voting records are also made available online at franklintempleton.com and posted on the U.S. Securities and Exchange Commission’s website at sec.gov and reflect the most recent12-month period ended June 30.
Quarterly Statement of Investments
The Trust files a complete statement of investments with the U.S. Securities and Exchange Commission for the first and third quarters for each fiscal year as an exhibit to its report on FormN-PORT. Shareholders may view the filed FormN-PORT by visiting the Commission’s website at sec.gov. The filed form may also be viewed and copied at the Commission’s Public Reference Room in Washington, DC. Information regarding the operations of the Public Reference Room may be obtained by calling(800) SEC-0330.
| 126 | Semiannual Report | franklintempleton.com | ||
This page intentionally left blank.
This page intentionally left blank.

Semiannual Report and Shareholder Letter
Franklin Custodian Funds
Investment Manager
Franklin Advisers, Inc.
Distributor
Franklin Templeton Distributors, Inc.
(800) DIAL BEN®/342-5236
franklintempleton.com
Shareholder Services
(800)632-2301
Authorized for distribution only when accompanied or preceded by a summary prospectus and/or prospectus. Investors should carefully consider a fund’s investment goals, risks, charges and expenses before investing. A prospectus contains this and other information; please read it carefully before investing.
To help ensure we provide you with quality service, all calls to and from our service areas are monitored and/or recorded.
| © 2019 Franklin Templeton Investments. All rights reserved. | FCF S 05/19 |
Semiannual Report
and Shareholder Letter
March 31, 2019
Contents | ||||
| Semiannual Report | ||||
| 2 | ||||
| 5 | ||||
| 7 | ||||
| 8 | ||||
| 11 | ||||
| 14 | ||||
| 20 | ||||
|
| |||
| 1 | Semiannual Report | |||
This semiannual report for Franklin Focused Growth Fund covers the period ended March 31, 2019.
Your Fund’s Goal and Main Investments
The Fund seeks capital appreciation by investing in an equity securities portfolio of approximately 20–50 companies that the investment manager believes offer a compelling trade-off between growth opportunity, business and financial risk and valuation.
Performance Overview
For the period under review, the Fund’s Advisor Class shares posted a -0.87% cumulative total return. In comparison, the Russell 1000® Growth Index, which measures performance of those Russell 1000® Index companies with higher price-to-book ratios and higher forecasted growth values, posted a -2.34% total return.1 You can find more of the Fund’s performance data in the Performance Summary beginning on page 5.
Performance data represent past performance, which does not guarantee future results. Investment return and principal value will fluctuate, and you may have a gain or loss when you sell your shares. Current performance may differ from figures shown.
Economic and Market Overview
The U.S. economy grew during the six-month period. The economy expanded at a faster rate in 2019’s first quarter after moderating in the previous two quarters. Growth in consumer spending, business investment, exports, government spending and inventory investment was partly offset by a decrease in housing investment. The manufacturing and services sectors expanded during the period. The unemployment rate increased from 3.7% in September 2018 to 3.8% at period-end.2 The annual inflation rate, as measured by the Consumer Price Index, decreased from 2.3% in September 2018 to 1.9% at period-end.2
Portfolio Composition
Based on Total Net Assets as of 3/31/19
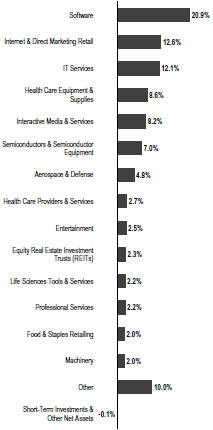
1. Source: Morningstar. Frank Russell Company is the source and owner of the trademarks, service marks and copyrights related to the Russell Indexes. Russell® is a trademark of Frank Russell Company.
The index is unmanaged and includes reinvestment of any income or distributions. It does not reflect any fees, expenses or sales charges. One cannot invest directly in an index, and an index is not representative of the Fund’s portfolio.
2. Source: Bureau of Labor Statistics.
The dollar value, number of shares or principal amount, and names of all portfolio holdings are listed in the Fund’s Statement of Investments (SOI).
The SOI begins on page 9.
Semiannual Report | 2 |
FRANKLIN FOCUSED GROWTH FUND
The U.S. Federal Reserve (Fed) raised its target range for the federal funds rate by 0.25% once during the period, to 2.25%–2.50%, and continued reducing its balance sheet as part of its plan to normalize monetary policy. At its March 2019 meeting, the Fed held its target range for the federal funds rate unchanged and signaled no rate hikes in 2019. The Fed also lowered its forecasts for economic growth in 2019 and 2020. Furthermore, the Fed mentioned it would end its balance sheet normalization by the end of September 2019.
U.S. equity markets overall declined during the period amid concerns about the Fed’s interest-rate path, U.S. political uncertainties, U.S. trade disputes with China and other trading partners, and their impact on global growth and corporate earnings. These concerns were partially alleviated by certain upbeat economic data, encouraging U.S. corporate earnings, as well as easing trade tensions and optimism about a potential U.S.-China trade deal. Markets also benefited from the results of the Fed’s indications of a patient approach to its monetary policy decisions. After reaching a new all-time high in September 2018, the broad U.S. stock market, as measured by the Standard & Poor’s® 500 Index (S&P 500®), sold off sharply during 2018’s fourth quarter but rallied in 2019’s first quarter. Overall, the S&P 500 posted a -1.72% total return for the six-month period.3
Investment Strategy
We are research-driven, bottom-up fundamental investors. Under normal market conditions, we invest predominantly in equity securities of companies that we believe offer compelling growth opportunities. The equity securities in which we invest are predominantly common stock. We may invest in companies of any size, including small and medium capitalization companies. In addition to our main investments, we may invest a portion (up to 25%) of net assets in foreign equity securities, including those located in emerging markets. We generally seek to maintain a portfolio consisting of securities of approximately 20–50 companies. Although we seek investments across a number of sectors, from time to time, based on economic conditions, we may have significant positions in particular sectors.
Manager’s Discussion
During the period under review, the information technology (IT), health care and real estate sectors contributed to the
Top 10 Holdings
3/31/19
Company Sector/Industry | % of Total Net Assets | |
Amazon.com Inc. | 9.2% | |
Internet & Direct Marketing Retail | ||
Microsoft Corp. | 7.6% | |
Software | ||
Alphabet Inc. | 5.5% | |
Interactive Media & Services | ||
Adobe Inc. | 4.7% | |
Software | ||
Salesforce.com Inc. | 4.5% | |
Software | ||
ServiceNow Inc. | 4.1% | |
Software | ||
Visa Inc. | 3.7% | |
IT Services | ||
Mastercard Inc. | 3.6% | |
IT Services | ||
Xilinx Inc. | 3.6% | |
Semiconductors & Semiconductor Equipment | ||
Tencent Holdings Ltd. | 2.7% | |
Interactive Media & Services | ||
Fund’s performance.4 In the IT sector, programmable logic solutions provider Xilinx, cloud solutions provider ServiceNow and payment technology company Mastercard benefited results. Xilinx delivered strong revenue and earnings in its fiscal third-quarter 2019 that exceeded market expectations. The company reported growth in all end-market segments, and management noted strength in pre-production and early production of 4.5G/5G wireless base stations. Xilinx also benefited from a competitor’s manufacturing struggles, enabling it to continue gaining market share. ServiceNow, a provider of proprietary cloud-based platforms and applications that help automate enterprise IT operations (such as digital workflow and business processes), continued to gather momentum. The firm delivered an impressive quarterly earnings report in January 2019, exceeding market expectations helped in part by a lower-than-expected tax rate. A majority of ServiceNow customers are Fortune 500 companies and platform adoption appears strong as the company continued to expand its customer base during 2019’s first quarter. Mastercard (a new Fund holding) performed well, meeting fourth-quarter expectations and announcing solid guidance in January despite trade tensions and rising rates. Mastercard has
3. Source: Morningstar.
4. The IT sector comprises IT services, semiconductors and semiconductor equipment, and software in the SOI. The real estate sector comprises equity real estate investment trusts in the SOI. The health care sector comprises health care equipment and supplies, health care providers and services, life sciences tools and services, and pharmaceuticals in the SOI.
| 3 | Semiannual Report | |||
FRANKLIN FOCUSED GROWTH FUND
launched several growth initiatives and partnerships to invest for the long term while delivering solid quarterly results, which we believe is supported by strong growth in Europe and total cross-border flows.
In the real estate and health care sectors, wireless communications operator American Tower and medical and commercial products manufacturer Danaher were key contributors. In other sectors, internet and mobile value-added services provider Tencent Holdings and internet infrastructure and e-commerce firm Alibaba Group Holding also aided performance.
In contrast, the communication services, consumer discretionary and financials sectors detracted from the Fund’s absolute performance.5 In communication services, interactive entertainment developer Activision Blizzard, music streaming service provider Spotify Technology and social networking website operator Facebook hurt results. The Fund did not hold these three stocks at period-end. After reaching an all-time high in October, Activision Blizzard’s share price declined after disappointment that the company did not announce Diabolo 4’s launch at its annual gaming convention and due to the negative response to its Diabolo mobile expansion.
In the consumer discretionary sector, online marketplace Amazon.com (not held at period-end) delivered a mixed third quarter with growing revenue that exceeded company guidance but was lower than investors expected, due to slower international retail revenue growth and weak results from acquired businesses. Amazon’s fourth quarter revenue and earnings exceeded all expectations, but guidance indicating slower first-quarter revenue growth hindered the stock.
In the financials sector, financial services company Charles Schwab (not held at period-end) hindered performance. In other sectors, semiconductor company Nvidia and Constellation Brands (not held at period-end) also detracted from results. Shares of Nvidia declined after the company lowered its fiscal fourth-quarter 2019 revenue guideline due to a decline in gaming revenues, the launch delay of the Turing next-generation graphic cards and a decline in the company’s
datacenter segment due to hyperscale capital expenditure deceleration.
 |
Matthew J. Moberg, CPA Portfolio Manager |

The foregoing information reflects our analysis, opinions and portfolio holdings as of March 31, 2019, the end of the reporting period. The way we implement our main investment strategies and the resulting portfolio holdings may change depending on factors such as market and economic conditions. These opinions may not be relied upon as investment advice or an offer for a particular security. The information is not a complete analysis of every aspect of any market, country, industry, security or the Fund. Statements of fact are from sources considered reliable, but the investment manager makes no representation or warranty as to their completeness or accuracy. Although historical performance is no guarantee of future results, these insights may help you understand our investment management philosophy.
5. The communication services sector comprises entertainment, interactive media and services, and media in the SOI. The consumer discretionary sector comprises hotels, restaurants and leisure; internet and direct marketing retail; and textiles, apparel and luxury goods in the SOI. The financials sector comprises capital markets in the SOI. See www.franklintempletondatasources.com for additional data provider information.
Semiannual Report | 4 |
FRANKLIN FOCUSED GROWTH FUND
Performance Summary as of March 31, 2019
The performance table does not reflect any taxes that a shareholder would pay on Fund dividends, capital gain distributions, if any, or any realized gains on the sale of Fund shares. Total return reflects reinvestment of the Fund’s dividends and capital gain distributions, if any, and any unrealized gains or losses. Your dividend income will vary depending on dividends or interest paid by securities in the Fund’s portfolio, adjusted for operating expenses. Capital gain distributions are net profits realized from the sale of portfolio securities.
Performance as of 3/31/191
Cumulative total return excludes sales charges. Average annual total return includes maximum sales charges. Sales charges will vary depending on the size of the investment and the class of share purchased. Advisor Class shares are offered without sales charges.
| Share Class | Cumulative Total Return2 | Average Annual Total Return3 | ||||||
Advisor | ||||||||
6-Month
|
| -0.87%
|
|
| -0.87%
|
| ||
1-Year
|
| +14.54%
|
|
| +14.54%
|
| ||
Since Inception (4/12/16)
|
| +71.50%
|
|
| +19.94%
|
| ||
Performance data represent past performance, which does not guarantee future results. Investment return and principal value will fluctuate, and you may have a gain or loss when you sell your shares. Current performance may differ from figures shown.
See page 6 for Performance Summary footnotes.
| 5 | Semiannual Report | |||
FRANKLIN FOCUSED GROWTH FUND
PERFORMANCE SUMMARY
Distributions(10/1/18–3/31/19)
| Share Class | Net Investment Income | Long-Term Capital Gain | Total | |||||||||
Advisor
|
| $0.01094
|
|
| $0.0731
|
|
| $0.0840
|
| |||
Total Annual Operating Expenses5
| Share Class | With Fee Waiver | Without Fee Waiver | ||||||
Advisor
|
| 1.01%
|
|
| 2.24%
|
| ||
All investments involve risks, including possible loss of principal. The market values of securities or other investments owned by the Fund will go up or down, sometimes rapidly or unpredictably. Growth stock prices reflect projections of future earnings or revenues, and can, therefore, fall dramatically if the company fails to meet those projections. To the extent the Fund focuses on particular countries, regions, industries, sectors or types of investment from time to time, it may be subject to greater risks of adverse developments in such areas of focus than a fund that invests in a wider variety of countries, regions, industries, sectors or investments. Foreign securities involve more risks than investing in U.S. securities, including currency fluctuations and economic and political uncertainties. From time to time, the trading market for a particular security or type of security or other investments in which the Fund invests may become less liquid or even illiquid. Reduced liquidity will have an adverse impact on the Fund’s ability to sell such securities or other investments when necessary to meet the Fund’s liquidity needs or in response to a specific economic event and will also generally lower the value of a security or other investments. The Fund may also invest in small- and mid-capitalization companies, which can be particularly sensitive to changing economic conditions, and their prospects for growth are less certain than those of larger, more established companies. The Fund is actively managed but there is no guarantee that the manager’s investment decisions will produce the desired results. The Fund’s prospectus also includes a description of the main investment risks.
1. The Fund has an expense reduction contractually guaranteed through 1/31/20. Fund investment results reflect the expense reduction; without this reduction the results would have been lower.
2. Cumulative total return represents the change in value of an investment over the periods indicated.
3. Average annual total return represents the average annual change in value of an investment over the periods indicated. Return for less than one year, if any, has not been annualized.
4. A portion or all of the distribution is likely to be deemed a tax return of capital at year-end.
5. Figures are as stated in the Fund’s current prospectus and may differ from the expense ratios disclosed in the Your Fund’s Expenses and Financial Highlights sections in this report. In periods of market volatility, assets may decline significantly, causing total annual Fund operating expenses to become higher than the figures shown.
Semiannual Report | 6 |
FRANKLIN FOCUSED GROWTH FUND
As a Fund shareholder, you can incur two types of costs: (1) transaction costs, including sales charges (loads) on Fund purchases and redemptions; and (2) ongoing Fund costs, including management fees, distribution and service (12b-1) fees, and other Fund expenses. All mutual funds have ongoing costs, sometimes referred to as operating expenses. The table below shows ongoing costs of investing in the Fund and can help you understand these costs and compare them with those of other mutual funds. The table assumes a $1,000 investment held for the six months indicated.
Actual Fund Expenses
The table below provides information about actual account values and actual expenses in the columns under the heading “Actual.” In these columns the Fund’s actual return, which includes the effect of Fund expenses, is used to calculate the “Ending Account Value.” You can estimate the expenses you paid during the period by following these steps (of course, your account value and expenses will differ from those in this illustration): Divide your account value by $1,000 (if your account had an $8,600 value, then $8,600 ÷ $1,000 = 8.6). Then multiply the result by the number in the row for your class of shares under the headings “Actual” and “Expenses Paid During Period” (if Actual Expenses Paid During Period were $7.50, then 8.6 x $7.50 = $64.50). In this illustration, the actual expenses paid this period are $64.50.
Hypothetical Example for Comparison with Other Funds
Under the heading “Hypothetical” in the table, information is provided about hypothetical account values and hypothetical expenses based on the Fund’s actual expense ratio and an assumed rate of return of 5% per year before expenses, which is not the Fund’s actual return. This information may not be used to estimate the actual ending account balance or expenses you paid for the period, but it can help you compare ongoing costs of investing in the Fund with those of other funds. To do so, compare this 5% hypothetical example for the class of shares you hold with the 5% hypothetical examples that appear in the shareholder reports of other funds.
Please note that expenses shown in the table are meant to highlight ongoing costs and do not reflect any transactional costs. Therefore, information under the heading “Hypothetical” is useful in comparing ongoing costs only, and will not help you compare total costs of owning different funds. In addition, if transactional costs were included, your total costs would have been higher.
| Actual (actual return after expenses) | Hypothetical (5% annual return before expenses) | |||||||||||||||||
| Share Class | Beginning Account Value 10/1/18 | Ending Account Value 3/31/19 | Expenses Paid During Period1,2 | Ending Account Value 3/31/19 | Expenses Paid During Period 10/1/18–3/31/191,2 | Net Annualized Expense Ratio2 | ||||||||||||
Advisor | $1,000 | $991.30 | $4.96 | $1,019.95 | $5.04 | 1.00% | ||||||||||||
1. Expenses are equal to the annualized expense ratio for the six-month period as indicated above—in the far right column—multiplied by the simple average account value over the period indicated, and then multiplied by 182/365 to reflect the one-half year period.
2. Reflects expenses after fee waivers and expense reimbursements. Does not include acquired fund fees and expenses.
| 7 | Semiannual Report | |||
FRANKLIN CUSTODIAN FUNDS
Franklin Focused Growth Fund
| Six Months Ended March 31, 2019 | Year Ended September 30, | |||||||||||||||
| (unaudited) | 2018 | 2017 | 2016a | |||||||||||||
Advisor Class | ||||||||||||||||
Per share operating performance | ||||||||||||||||
(for a share outstanding throughout the period) | ||||||||||||||||
Net asset value, beginning of period | $17.24 | $13.36 | $10.93 | $10.00 | ||||||||||||
Income from investment operationsb: | ||||||||||||||||
Net investment income (loss)c | (0.02 | ) | (0.05 | ) | (0.02 | ) | (0.01 | ) | ||||||||
Net realized and unrealized gains (losses) | (0.15 | ) | 3.93 | 2.49 | 0.94 | |||||||||||
Total from investment operations | (0.17 | ) | 3.88 | 2.47 | 0.93 | |||||||||||
Less distributions from: | ||||||||||||||||
Net investment income | (0.01 | )d | — | (0.01 | ) | — | ||||||||||
Net realized gains | (0.07 | ) | — | (0.03 | ) | — | ||||||||||
Total distributions | (0.08 | ) | — | (0.04 | ) | — | ||||||||||
Net asset value, end of period | $16.99 | $17.24 | $13.36 | $10.93 | ||||||||||||
Total returne | (0.87)% | 29.04 | % | 22.78 | % | 9.30 | % | |||||||||
Ratios to average net assetsf | ||||||||||||||||
Expenses before waiver and payments by affiliates | 2.24% | 2.23% | 2.31% | 4.76% | ||||||||||||
Expenses net of waiver and payments by affiliates | 1.00% | 1.00%g | 1.00%g | 1.00% | ||||||||||||
Net investment income (loss) | (0.31)% | (0.34)% | (0.20)% | (0.18)% | ||||||||||||
Supplemental data | ||||||||||||||||
Net assets, end of period (000’s) | $4,248 | $4,310 | $3,341 | $2,732 | ||||||||||||
Portfolio turnover rate | 22.06% | 14.47% | 28.48% | 7.46% | ||||||||||||
aFor the period April 12, 2016 (commencement of operations) to September 30, 2016.
bThe amount shown for a share outstanding throughout the period may not correlate with the Statement of Operations for the period due to the timing of sales and repurchases of the Fund’s shares in relation to income earned and/or fluctuating fair value of the investments of the Fund.
cBased on average daily shares outstanding.
dA portion or all of the distribution is likely to be deemed a tax return of capital at year end.
eTotal return is not annualized for periods less than one year.
fRatios are annualized for periods less than one year, except for non-recurring expenses, if any.
gBenefit of expense reduction rounds to less than 0.01%.
| The accompanying notes are an integral part of these financial statements. | Semiannual Report | 8 | |||||
FRANKLIN CUSTODIAN FUNDS
Statement of Investments, March 31, 2019 (unaudited)
Franklin Focused Growth Fund
|
| Country
|
|
| Shares
|
|
| Value
|
| ||||
Common Stocks 100.1% | ||||||||||||
Aerospace & Defense 4.8% | ||||||||||||
The Boeing Co. | United States | 300 | $ | 114,426 | ||||||||
Raytheon Co. | United States | 500 | 91,040 | |||||||||
| 205,466 | ||||||||||||
Biotechnology 0.2% | ||||||||||||
aPrecision BioSciences Inc. | United States | 400 | 7,180 | |||||||||
Capital Markets 1.5% | ||||||||||||
CME Group Inc. | United States | 400 | 65,832 | |||||||||
Entertainment 2.5% | ||||||||||||
aNetflix Inc. | United States | 300 | 106,968 | |||||||||
Equity Real Estate Investment Trusts (REITs) 2.3% | ||||||||||||
American Tower Corp. | United States | 500 | 98,530 | |||||||||
Food & Staples Retailing 2.0% | ||||||||||||
Costco Wholesale Corp. | United States | 350 | 84,749 | |||||||||
Health Care Equipment & Supplies 8.6% | ||||||||||||
Abbott Laboratories | United States | 1,000 | 79,940 | |||||||||
Danaher Corp. | United States | 700 | 92,414 | |||||||||
aIDEXX Laboratories Inc. | United States | 350 | 78,260 | |||||||||
aIntuitive Surgical Inc. | United States | 200 | 114,116 | |||||||||
| 364,730 | ||||||||||||
Health Care Providers & Services 2.7% | ||||||||||||
aGuardant Health Inc. | United States | 200 | 15,340 | |||||||||
UnitedHealth Group Inc. | United States | 400 | 98,904 | |||||||||
| 114,244 | ||||||||||||
Industrial Conglomerates 1.2% | ||||||||||||
Roper Technologies Inc. | United States | 150 | 51,296 | |||||||||
Interactive Media & Services 8.2% | ||||||||||||
aAlphabet Inc., A | United States | 200 | 235,378 | |||||||||
Tencent Holdings Ltd. | China | 2,500 | 114,969 | |||||||||
| 350,347 | ||||||||||||
Internet & Direct Marketing Retail 12.6% | ||||||||||||
aAlibaba Group Holding Ltd., ADR | China | 500 | 91,225 | |||||||||
aAmazon.com Inc. | United States | 220 | 391,765 | |||||||||
aMercadoLibre Inc. | Argentina | 100 | 50,773 | |||||||||
| 533,763 | ||||||||||||
IT Services 12.1% | ||||||||||||
aAdyen NV | Netherlands | 100 | 78,312 | |||||||||
Mastercard Inc., A | United States | 650 | 153,042 | |||||||||
aPayPal Holdings Inc. | United States | 800 | 83,072 | |||||||||
aShopify Inc., A | Canada | 200 | 41,300 | |||||||||
Visa Inc., A | United States | 1,000 | 156,190 | |||||||||
| 511,916 | ||||||||||||
Life Sciences Tools & Services 2.2% | ||||||||||||
aIllumina Inc. | United States | 300 | 93,207 | |||||||||
Machinery 2.0% | ||||||||||||
Fortive Corp. | United States | 1,000 | 83,890 | |||||||||
Media 1.6% | ||||||||||||
aCharter Communications Inc., A | United States | 200 | 69,382 | |||||||||
| 9 | Semiannual Report | |||
FRANKLIN CUSTODIAN FUNDS
STATEMENT OF INVESTMENTS (UNAUDITED)
Franklin Focused Growth Fund(continued)
| Country | Shares | Value | ||||||||||||||
Common Stocks(continued) | ||||||||||||||||
Personal Products 1.9% | ||||||||||||||||
Estee Lauder Cos. Inc., A | United States | 500 | $ | 82,774 | ||||||||||||
Pharmaceuticals 1.9% | ||||||||||||||||
aElanco Animal Health Inc. | United States | 2,500 | 80,175 | |||||||||||||
Professional Services 2.2% | ||||||||||||||||
Verisk Analytics Inc. | United States | 700 | 93,100 | |||||||||||||
Road & Rail 0.2% | ||||||||||||||||
aLyft Inc., A | United States | 100 | 7,829 | |||||||||||||
Semiconductors & Semiconductor Equipment 7.0% | ||||||||||||||||
Analog Devices Inc. | United States | 800 | 84,216 | |||||||||||||
NVIDIA Corp. | United States | 350 | 62,846 | |||||||||||||
Xilinx Inc. | United States | 1,200 | 152,148 | |||||||||||||
| 299,210 | ||||||||||||||||
Software 20.9% | ||||||||||||||||
aAdobe Inc. | United States | 750 | 199,867 | |||||||||||||
Microsoft Corp. | United States | 2,750 | 324,335 | |||||||||||||
aSalesforce.com Inc. | United States | 1,200 | 190,044 | |||||||||||||
aServiceNow Inc. | United States | 700 | 172,543 | |||||||||||||
| 886,789 | ||||||||||||||||
Textiles, Apparel & Luxury Goods 1.5% | ||||||||||||||||
NIKE Inc., B | United States | 750 | 63,158 | |||||||||||||
Total Common Stocks (Cost $2,577,541) | 4,254,535 | |||||||||||||||
Short Term Investments (Cost $19,513) 0.5% | ||||||||||||||||
Money Market Funds 0.5% | ||||||||||||||||
b,cInstitutional Fiduciary Trust Money Market Portfolio, 2.10% | United States | 19,513 | 19,513 | |||||||||||||
Total Investments (Cost $2,597,054) 100.6% | 4,274,048 | |||||||||||||||
Other Assets, less Liabilities (0.6)% | (25,757 | ) | ||||||||||||||
Net Assets 100.0% | $ | 4,248,291 | ||||||||||||||
See Abbreviations on page 19.
aNon-income producing.
bSee Note 3(e) regarding investments in affiliated management investment companies.
cThe rate shown is the annualized seven-day effective yield at period end.
| The accompanying notes are an integral part of these financial statements. | Semiannual Report | 10 | |||||
FRANKLIN CUSTODIAN FUNDS
Statement of Assets and Liabilities
March 31, 2019 (unaudited)
Franklin Focused Growth Fund
Assets: | ||||
Investments in securities: | ||||
Cost - Unaffiliated issuers | $2,577,541 | |||
Cost - Non-controlled affiliates (Note 3e) | 19,513 | |||
Value - Unaffiliated issuers | $4,254,535 | |||
Value - Non-controlled affiliates (Note 3e) | 19,513 | |||
Receivables: | ||||
Dividends | 284 | |||
Affiliates. | 7,556 | |||
Other assets | 4 | |||
Total assets | 4,281,892 | |||
Liabilities: | ||||
Payables: | ||||
Investment securities purchased | 13,600 | |||
Professional fees | 18,596 | |||
Accrued expenses and other liabilities | 1,405 | |||
Total liabilities | 33,601 | |||
Net assets, at value | $4,248,291 | |||
Net assets consist of: | ||||
Paid-in capital | $2,486,568 | |||
Total distributable earnings (loss) | 1,761,723 | |||
Net assets, at value | $4,248,291 | |||
Shares outstanding | 250,000 | |||
Net asset value and maximum offering price per share | $16.99 | |||
| 11 | Semiannual Report | | The accompanying notes are an integral part of these financial statements. | ||
FRANKLIN CUSTODIAN FUNDS
FINANCIAL STATEMENTS
Statement of Operations
for the six months ended March 31, 2019 (unaudited)
Franklin Focused Growth Fund
Investment income: | ||||
Dividends: | ||||
Unaffiliated issuers | $ | 12,581 | ||
Non-controlled affiliates (Note 3e) | 825 | |||
Total investment income | 13,406 | |||
Expenses: | ||||
Management fees (Note 3a) | 16,566 | |||
Transfer agent fees (Note 3d) | 390 | |||
Custodian fees (Note 4) | 37 | |||
Reports to shareholders | 2,725 | |||
Registration and filing fees | 64 | |||
Professional fees | 20,790 | |||
Other | 3,125 | |||
Total expenses | 43,697 | |||
Expenses waived/paid by affiliates (Note 3f) | (24,207 | ) | ||
Net expenses | 19,490 | |||
Net investment income (loss) | (6,084 | ) | ||
Realized and unrealized gains (losses): | ||||
Net realized gain (loss) from: | ||||
Investments: | ||||
Unaffiliated issuers | 104,097 | |||
Foreign currency transactions | 280 | |||
Net realized gain (loss) | 104,377 | |||
Net change in unrealized appreciation (depreciation) on: | ||||
Investments: | ||||
Unaffiliated issuers | (138,934 | ) | ||
Net realized and unrealized gain (loss) | (34,557 | ) | ||
Net increase (decrease) in net assets resulting from operations | $ | (40,641 | ) | |
| The accompanying notes are an integral part of these financial statements. | Semiannual Report | 12 | |||||
FRANKLIN CUSTODIAN FUNDS
FINANCIAL STATEMENTS
Statements of Changes in Net Assets
Franklin Focused Growth Fund
Six Months Ended | Year Ended | |||||||||||||||||||
Increase (decrease) in net assets: | ||||||||||||||||||||
Operations: | ||||||||||||||||||||
Net investment income (loss) | $ (6,084 | ) | $ (13,077 | ) | ||||||||||||||||
Net realized gain (loss) | 104,377 | 33,371 | ||||||||||||||||||
Net change in unrealized appreciation (depreciation) | (138,934 | ) | 949,113 | |||||||||||||||||
Net increase (decrease) in net assets resulting from operations | (40,641 | )a | 969,407 | |||||||||||||||||
Distributions to shareholders | (21,000 | ) | — | |||||||||||||||||
Net increase (decrease) in net assets | (61,641 | ) | 969,407 | |||||||||||||||||
Net assets: | ||||||||||||||||||||
Beginning of period | 4,309,932 | 3,340,525 | ||||||||||||||||||
End of period | $4,248,291 | $4,309,932 | ||||||||||||||||||
aA portion or all of the distribution is likely to be deemed a tax return of capital at year end.
| 13 | Semiannual Report | | The accompanying notes are an integral part of these financial statements. | ||
FRANKLIN CUSTODIAN FUNDS
Notes to Financial Statements (unaudited)
Franklin Focused Growth Fund
1. Organization and Significant Accounting Policies
Franklin Custodian Funds (Trust) is registered under the Investment Company Act of 1940 (1940 Act) as anopen-end management investment company, consisting of six separate funds and applies the specialized accounting and reporting guidance in U.S. Generally Accepted Accounting Principles (U.S. GAAP). Franklin Focused Growth Fund (Fund) is included in this report. The Fund has five classes of shares: Class A, Class C, Class R, Class R6, and Advisor Class. Beginning on October 19, 2018, Class C shares automatically convert to Class A shares after they have been held for 10 years. Each class of shares may differ by its initial sales load, contingent deferred sales charges, voting rights on matters affecting a single class, its exchange privilege and fees due to differing arrangements for distribution and transfer agent fees.
The Fund currently operates with one class of shares, Advisor Class.
The following summarizes the Fund’s significant accounting policies.
a. Financial Instrument Valuation
The Fund’s investments in financial instruments are carried at fair value daily. Fair value is the price that would be received to sell an asset or paid to transfer a liability in an orderly transaction between market participants on the measurement date. The Fund calculates the net asset value (NAV) per share each business day as of 4 p.m. Eastern time or the regularly scheduled close of the New York Stock Exchange (NYSE), whichever is earlier. Under compliance policies and procedures approved by the Trust’s Board of Trustees (the Board), the Fund’s administrator has responsibility for oversight of valuation, including leading the cross-functional Valuation Committee (VC). The Fund may utilize independent pricing services, quotations from securities and financial instrument dealers, and other market sources to determine fair value.
Equity securities listed on an exchange or on the NASDAQ National Market System are valued at the last quoted sale price or the official closing price of the day, respectively. Foreign equity securities are valued as of the close of trading on the foreign stock exchange on which the security is primarily traded, or as of 4 p.m. Eastern time. The value is then converted into its U.S. dollar equivalent at the foreign exchange rate in effect at 4 p.m. Eastern time on the day that the value of the
security is determined.Over-the-counter (OTC) securities are valued within the range of the most recent quoted bid and ask prices. Securities that trade in multiple markets or on multiple exchanges are valued according to the broadest and most representative market. Certain equity securities are valued based upon fundamental characteristics or relationships to similar securities.
Investments inopen-end mutual funds are valued at the closing NAV.
The Fund has procedures to determine the fair value of financial instruments for which market prices are not reliable or readily available. Under these procedures, the Fund primarily employs a market-based approach which may use related or comparable assets or liabilities, recent transactions, market multiples, book values, and other relevant information for the investment to determine the fair value of the investment. An income-based valuation approach may also be used in which the anticipated future cash flows of the investment are discounted to calculate fair value. Discounts may also be applied due to the nature or duration of any restrictions on the disposition of the investments. Due to the inherent uncertainty of valuations of such investments, the fair values may differ significantly from the values that would have been used had an active market existed.
Trading in securities on foreign securities stock exchanges and OTC markets may be completed before 4 p.m. Eastern time. In addition, trading in certain foreign markets may not take place on every Fund’s business day. Occasionally, events occur between the time at which trading in a foreign security is completed and 4 p.m. Eastern time that might call into question the reliability of the value of a portfolio security held by the Fund. As a result, differences may arise between the value of the Fund’s portfolio securities as determined at the foreign market close and the latest indications of value at 4 p.m. Eastern time. In order to minimize the potential for these differences, the VC monitors price movements following the close of trading in foreign stock markets through a series of country specific market proxies (such as baskets of American Depositary Receipts, futures contracts and exchange traded funds). These price movements are measured against established trigger thresholds for each specific market proxy to assist in determining if an event has occurred that may call into question the reliability of the values of the foreign securities
Semiannual Report | 14 |
FRANKLIN CUSTODIAN FUNDS
NOTES TO FINANCIAL STATEMENTS (UNAUDITED)
Franklin Focused Growth Fund(continued)
1. Organization and Significant Accounting Policies (continued)
a. Financial Instrument Valuation(continued)
held by the Fund. If such an event occurs, the securities may be valued using fair value procedures, which may include the use of independent pricing services.
When the last day of the reporting period is anon-business day, certain foreign markets may be open on those days that the Fund’s NAV is not calculated, which could result in differences between the value of the Fund’s portfolio securities on the last business day and the last calendar day of the reporting period. Any significant security valuation changes due to an open foreign market are adjusted and reflected by the Fund for financial reporting purposes.
b. Foreign Currency Translation
Portfolio securities and other assets and liabilities denominated in foreign currencies are translated into U.S. dollars based on the exchange rate of such currencies against U.S. dollars on the date of valuation. The Fund may enter into foreign currency exchange contracts to facilitate transactions denominated in a foreign currency. Purchases and sales of securities, income and expense items denominated in foreign currencies are translated into U.S. dollars at the exchange rate in effect on the transaction date. Portfolio securities and assets and liabilities denominated in foreign currencies contain risks that those currencies will decline in value relative to the U.S. dollar. Occasionally, events may impact the availability or reliability of foreign exchange rates used to convert the U.S. dollar equivalent value. If such an event occurs, the foreign exchange rate will be valued at fair value using procedures established and approved by the Board.
The Fund does not separately report the effect of changes in foreign exchange rates from changes in market prices on securities held. Such changes are included in net realized and unrealized gain or loss from investments in the Statement of Operations.
Realized foreign exchange gains or losses arise from sales of foreign currencies, currency gains or losses realized between the trade and settlement dates on securities transactions and the difference between the recorded amounts of dividends, interest, and foreign withholding taxes and the U.S. dollar equivalent of the amounts actually received or paid. Net unrealized foreign exchange gains and losses arise from changes in foreign
exchange rates on foreign denominated assets and liabilities other than investments in securities held at the end of the reporting period.
c. Income and Deferred Taxes
It is the Fund’s policy to qualify as a regulated investment company under the Internal Revenue Code. The Fund intends to distribute to shareholders substantially all of its taxable income and net realized gains to relieve it from federal income and excise taxes. As a result, no provision for U.S. federal income taxes is required. The tax basis of the Fund’s distributions, which is likely to have a portion or all deemed to be a return of capital, is not determined until fiscal year end.
The Fund may be subject to foreign taxation related to income received, capital gains on the sale of securities and certain foreign currency transactions in the foreign jurisdictions in which it invests. Foreign taxes, if any, are recorded based on the tax regulations and rates that exist in the foreign markets in which the Fund invests. When a capital gain tax is determined to apply, the Fund records an estimated deferred tax liability in an amount that would be payable if the securities were disposed of on the valuation date.
The Fund may recognize an income tax liability related to its uncertain tax positions under U.S. GAAP when the uncertain tax position has a less than 50% probability that it will be sustained upon examination by the tax authorities based on its technical merits. As of March 31, 2019, the Fund has determined that no tax liability is required in its financial statements related to uncertain tax positions for any open tax years (or expected to be taken in future tax years). Open tax years are those that remain subject to examination and are based on the statute of limitations in each jurisdiction in which the Fund invests.
d. Security Transactions, Investment Income, Expenses and Distributions
Security transactions are accounted for on trade date. Realized gains and losses on security transactions are determined on a specific identification basis. Estimated expenses are accrued daily. Dividend income is recorded on theex-dividend date except for certain dividends from securities where the dividend rate is not available. In such cases, the dividend is recorded as soon as the information is received by the Fund. Distributions to shareholders are recorded on theex-dividend date. Distributable earnings are determined according to income tax regulations
| 15 | Semiannual Report | |||
FRANKLIN CUSTODIAN FUNDS
NOTES TO FINANCIAL STATEMENTS (UNAUDITED)
Franklin Focused Growth Fund(continued)
(tax basis) and may differ from earnings recorded in accordance with U.S. GAAP. These differences may be permanent or temporary. Permanent differences are reclassified among capital accounts to reflect their tax character. These reclassifications have no impact on net assets or the results of operations. Temporary differences are not reclassified, as they may reverse in subsequent periods.
Common expenses incurred by the Trust are allocated among the Funds based on the ratio of net assets of each Fund to the combined net assets of the Trust or based on the ratio of number of shareholders of each Fund to the combined number of shareholders of the Trust. Fund specific expenses are charged directly to the Fund that incurred the expense.
Realized and unrealized gains and losses and net investment income, excluding class specific expenses, are allocated daily to each class of shares based upon the relative proportion of net assets of each class. Differences in per share distributions by class are generally due to differences in class specific expenses.
e. Accounting Estimates
The preparation of financial statements in accordance with U.S. GAAP requires management to make estimates and assumptions that affect the reported amounts of assets and
liabilities at the date of the financial statements and the amounts of income and expenses during the reporting period. Actual results could differ from those estimates.
f. Guarantees and Indemnifications
Under the Trust’s organizational documents, its officers and trustees are indemnified by the Trust against certain liabilities arising out of the performance of their duties to the Trust. Additionally, in the normal course of business, the Trust, on behalf of the Fund, enters into contracts with service providers that contain general indemnification clauses. The Trust’s maximum exposure under these arrangements is unknown as this would involve future claims that may be made against the Trust that have not yet occurred. Currently, the Trust expects the risk of loss to be remote.
2. Shares of Beneficial Interest
At March 31, 2019, there were an unlimited number of shares authorized (without par value). During the period ended March 31, 2019 and year ended September 30, 2018, there were no transactions of the Fund’s shares.
3. Transactions with Affiliates
Franklin Resources, Inc. is the holding company for various subsidiaries that together are referred to as Franklin Templeton. Certain officers and trustees of the Trust are also officers and/or directors of the following subsidiaries:
| Subsidiary | Affiliation | |
Franklin Advisers, Inc. (Advisers) | Investment manager | |
Franklin Templeton Services, LLC (FT Services) | Administrative manager | |
Franklin Templeton Distributors, Inc. (Distributors) | Principal underwriter | |
Franklin Templeton Investor Services, LLC (Investor Services) | Transfer agent | |
Semiannual Report | 16 |
FRANKLIN CUSTODIAN FUNDS
NOTES TO FINANCIAL STATEMENTS (UNAUDITED)
Franklin Focused Growth Fund(continued)
3. Transactions with Affiliates(continued)
a. Management Fees
The Fund pays an investment management fee to Advisers based on the average daily net assets of the Fund as follows:
| Annualized Fee Rate | Net Assets | |
0.850% | Up to and including $500 million | |
0.800% | Over $500 million, up to and including $1 billion | |
0.750% | Over $1 billion, up to and including $3 billion | |
0.730% | Over $3 billion, up to and including $5 billion | |
0.700% | In excess of $5 billion | |
b. Administrative Fees
Under an agreement with Advisers, FT Services provides administrative services to the Fund. The fee is paid by Advisers based on the Fund’s average daily net assets, and is not an additional expense of the Fund.
c. Distribution Fees
The Board has adopted distribution plans for each share class, with the exception of Class R6 and Advisor Class shares, pursuant to Rule12b-1 under the 1940 Act. Under the Fund’s Class A reimbursement distribution plan, the Fund reimburses Distributors for costs incurred in connection with the servicing, sale and distribution of the Fund’s shares up to the maximum annual plan rate. Under the Class A reimbursement distribution plan, costs exceeding the maximum for the current plan year cannot be reimbursed in subsequent periods. In addition, under the Fund’s Class C and R compensation distribution plans, the Fund pays Distributors for costs incurred in connection with the servicing, sale and distribution of the Fund’s shares up to the maximum annual plan rate for each class. The plan year, for purposes of monitoring compliance with the maximum annual plan rates, is February 1 through January 31.
The maximum annual plan rates, based on the average daily net assets, for each class, are as follows:
Class A | 0.25% | |
Class C | 1.00% | |
Class R | 0.50% |
d. Transfer Agent Fees
Each class of shares pays transfer agent fees to Investor Services for its performance of shareholder servicing obligations. The fees are based on an annualized asset based fee of 0.02% plus a transaction based fee. In addition, each class reimburses Investor Services for out of pocket expenses incurred and, except for Class R6, reimburses shareholder servicing fees paid to third parties. These fees are allocated daily based upon their relative proportion of such classes’ aggregate net assets. Class R6 pays Investor Services transfer agent fees specific to that class.
For the period ended March 31, 2019, the Fund paid transfer agent fees of $390, which were retained by Investor Services.
| 17 | Semiannual Report | |||
FRANKLIN CUSTODIAN FUNDS
NOTES TO FINANCIAL STATEMENTS (UNAUDITED)
Franklin Focused Growth Fund(continued)
e. Investments in Affiliated Management Investment Companies
The Fund invests in one or more affiliated management investment companies for purposes other than exercising a controlling influence over the management or policies. Management fees paid by the Fund are waived on assets invested in the affiliated management investment companies, as noted in the Statement of Operations, in an amount not to exceed the management and administrative fees paid directly or indirectly by each affiliate. During the period ended March 31, 2019, the Fund held investments in affiliated management investment companies as follows:
Number of Shares Held at Beginning of Period | Gross Additions | Gross Reductions | Number of Shares Held at End of Period | Value at End of Period | Dividend Income | Realized Gain (Loss) | Net Change in Unrealized Appreciation (Depreciation) | |||||||||||||||||||
Non-Controlled Affiliates | ||||||||||||||||||||||||||
Institutional Fiduciary Trust Money Market Portfolio, 2.10% | 89,859 | 263,547 | (333,893 | ) | 19,513 | $ | 19,513 | $825 | $ — | $ — | ||||||||||||||||
f. Waiver and Expense Reimbursements
Advisers has contractually agreed in advance to waive or limit its fees and to assume as its own expense certain expenses otherwise payable by the Fund so that the expenses (excluding distribution fees, acquired fund fees and expenses, and certainnon-routine expenses or costs, including those relating to litigation, indemnification, reorganizations, and liquidations) for each class of the Fund do not exceed 1.00% based on the average net assets of each class until January 31, 2020. Total expenses waived or paid are not subject to recapture subsequent to the Fund’s fiscal year end.
g. Other Affiliated Transactions
At March 31, 2019, Franklin Resources Inc. owned 100% of the Fund’s outstanding shares. Investment activities of this shareholder could have a material impact on the Fund.
4. Expense Offset Arrangement
The Fund has entered into an arrangement with its custodian whereby credits realized as a result of uninvested cash balances are used to reduce a portion of the Fund’s custodian expenses. During the period ended March 31, 2019, there were no credits earned.
5. Income Taxes
For tax purposes, capital losses may be carried over to offset future capital gains.
For tax purposes, the Fund may elect to defer any portion of a late-year ordinary loss to the first day of the following fiscal year. At September 30, 2018, the Fund deferred late-year ordinary losses of $9,695.
At March 31, 2019, the cost of investments and net unrealized appreciation (depreciation) for income tax purposes were as follows:
Cost of investments | $ | 2,597,054 |
| |
Unrealized appreciation | $ | 1,688,289 | ||
Unrealized depreciation |
| (11,295 | ) | |
Net unrealized appreciation (depreciation) | $ | 1,676,994 |
| |
Differences between income and/or capital gains as determined on a book basis and a tax basis are primarily due to differing treatment of passive foreign investment company shares.
Semiannual Report | 18 |
FRANKLIN CUSTODIAN FUNDS
NOTES TO FINANCIAL STATEMENTS (UNAUDITED)
Franklin Focused Growth Fund(continued)
6. Investment Transactions
Purchases and sales of investments (excluding short term securities) for the period ended March 31, 2019, aggregated $916,482 and $866,594, respectively.
7. Credit Facility
The Fund, together with other U.S. registered and foreign investment funds (collectively, Borrowers), managed by Franklin Templeton, are borrowers in a joint syndicated senior unsecured credit facility totaling $2 billion (Global Credit Facility) which matures on February 7, 2020. This Global Credit Facility provides a source of funds to the Borrowers for temporary and emergency purposes, including the ability to meet future unanticipated or unusually large redemption requests.
Under the terms of the Global Credit Facility, the Fund shall, in addition to interest charged on any borrowings made by the Fund and other costs incurred by the Fund, pay its share of fees and expenses incurred in connection with the implementation and maintenance of the Global Credit Facility, based upon its relative share of the aggregate net assets of all of the Borrowers, including an annual commitment fee of 0.15% based upon the unused portion of the Global Credit Facility. These fees are reflected in other expenses in the Statement of Operations. During the period ended March 31, 2019, the Fund did not use the Global Credit Facility.
8. Fair Value Measurements
The Fund follows a fair value hierarchy that distinguishes between market data obtained from independent sources (observable inputs) and the Fund’s own market assumptions (unobservable inputs). These inputs are used in determining the value of the Fund’s financial instruments and are summarized in the following fair value hierarchy:
| • | Level 1 – quoted prices in active markets for identical financial instruments |
| • | Level 2 – other significant observable inputs (including quoted prices for similar financial instruments, interest rates, prepayment speed, credit risk, etc.) |
| • | Level 3 – significant unobservable inputs (including the Fund’s own assumptions in determining the fair value of financial instruments) |
The input levels are not necessarily an indication of the risk or liquidity associated with financial instruments at that level.
At March 31, 2019, all of the Fund’s investments in financial instruments carried at fair value were valued using Level 1 inputs. For detailed categories, see the accompanying Statement of Investments.
9. Subsequent Events
The Fund has evaluated subsequent events through the issuance of the financial statements and determined that no events have occurred that require disclosure.
Abbreviations
| Selected Portfolio | ||||||||
| ADR | American Depository Receipt | |||||||
| 19 | Semiannual Report | |||
FRANKLIN CUSTODIAN FUNDS
FRANKLIN FOCUSED GROWTH FUND
Board Approval of Investment Management Agreements
FRANKLIN CUSTODIAN FUNDS
Franklin Focused Growth Fund
(Fund)
At anin-person meeting held on February 26, 2019 (Meeting), the Board of Trustees (Board) of Franklin Custodian Funds (Trust), including a majority of the trustees who are not “interested persons” as defined in the Investment Company Act of 1940 (Independent Trustees), reviewed and approved the continuance of the investment management agreement between Franklin Advisers, Inc. (Manager) and the Trust, on behalf of the Fund (Management Agreement) for an additionalone-year period. The Independent Trustees received advice from and met separately with Independent Trustee counsel in considering whether to approve the continuation of the Management Agreement.
In considering the continuation of the Management Agreement, the Board reviewed and considered information provided by the Manager at the Meeting and throughout the year at meetings of the Board and its committees. The Board also reviewed and considered information provided in response to a detailed set of requests for information submitted to the Manager by Independent Trustee counsel on behalf of the Independent Trustees in connection with the annual contract renewal process. In addition, prior to the Meeting, the Independent Trustees held a telephonic contract renewal meeting at which the Independent Trustees conferred amongst themselves and Independent Trustee counsel about contract renewal matters. The Board reviewed and considered all of the factors it deemed relevant in approving the continuance of the Management Agreement, including, but not limited to: (i) the nature, extent and quality of the services provided by the Manager; (ii) the investment performance of the Fund; (iii) the costs of the services provided and profits realized by the Manager and its affiliates from the relationship with the Fund; and (iv) the extent to which economies of scale are realized as the Fund grows. The Board noted that the Fund commenced operations on April 12, 2016, but is not currently available for public sale. The Board also noted that Franklin Resources, Inc. (FRI) owns 100% of the Fund’s outstanding shares.
In approving the continuance of the Management Agreement, the Board, including a majority of the Independent Trustees, determined that the terms of the Management Agreement are fair and reasonable and that the continuance of such Management Agreement is in the interests of the Fund and its
shareholder(s). While attention was given to all information furnished, the following discusses some primary factors relevant to the Board’s determination.
Nature, Extent and Quality of Services
The Board reviewed and considered information regarding the nature, extent and quality of investment management services provided by the Manager and its affiliates to the Fund and its shareholder(s). This information included, among other things, the qualifications, background and experience of the senior management and investment personnel of the Manager; the structure of investment personnel compensation; oversight of third-party service providers; investment performance reports and related financial information for the Fund; reports on expenses, shareholder services, and third party servicing arrangements; legal and compliance matters; risk controls; pricing and other services provided by the Manager and its affiliates; and management fees charged by the Manager and its affiliates to US funds and other accounts, including management’s explanation of differences among accounts where relevant. The Board also reviewed and considered an annual report on payments made by Franklin Templeton Investments (FTI) or the Fund to financial intermediaries, as well as a memorandum relating to third-party servicing arrangements in response to a guidance update in 2016 from the US Securities and Exchange Commission (SEC) relating to mutual fund distribution andsub-accounting fees. The Board noted management’s continuing efforts and expenditures in establishing effective business continuity plans and developing strategies to address areas of heightened concern in the mutual fund industry, such as cybersecurity and liquidity risk management. The Board also recognized management’s commitment to facilitating Board oversight of liquidity through the designation of a liquidity/risk administrator and the development of reports that highlight the amount of illiquid investments for the Fund.
The Board also reviewed and considered the benefits provided to Fund shareholder(s) of investing in a fund that is part of the Franklin Templeton family of funds. The Board noted the financial position of FRI, the Manager’s parent, and its commitment to the mutual fund business as evidenced by its continued introduction of new funds, reassessment of the fund offerings in response to the market environment and project initiatives and capital investments relating to the services provided to the Fund by the FTI organization.
Following consideration of such information, the Board was satisfied with the nature, extent and quality of services provided
Semiannual Report | 20 |
FRANKLIN CUSTODIAN FUNDS
FRANKLIN FOCUSED GROWTH FUND
SHAREHOLDER INFORMATION
by the Manager and its affiliates to the Fund and its shareholder(s).
Fund Performance
The Board reviewed and considered the performance results of the Fund over various time periods ended December 31, 2018. The Board considered the performance returns for the Fund in comparison to the performance returns of mutual funds deemed comparable to the Fund included in a universe (Performance Universe) selected by Broadridge Financial Solutions, Inc. (Broadridge), an independent provider of investment company data. The Board received a description of the methodology used by Broadridge to select the mutual funds included in a Performance Universe. The Board also reviewed and considered Fund performance reports provided and discussions that occurred with portfolio managers at Board meetings throughout the year. A summary of the Fund’s performance results is below.
The Performance Universe for the Fund included the Fund and all retail and institutionalmulti-cap growth funds. The Board noted that the Fund’s annualized total return for theone-year period was above the median of its Performance Universe. The Board concluded that the Fund’s performance was satisfactory.
Comparative Fees and Expenses
The Board reviewed and considered information regarding the Fund’s actual total expense ratio and its various components, including, as applicable, management fees; transfer agent expenses; underlying fund expenses; Rule12b-1 andnon-Rule12b-1 service fees; and othernon-management fees. The Board also noted the quarterly and annual reports it receives on all marketing support payments made by FTI to financial intermediaries. The Board considered the actual total expense ratio and, separately, the contractual management fee rate, without the effect of fee waivers, if any (Management Rate) of the Fund in comparison to the median expense ratio and median Management Rate, respectively, of other mutual funds deemed comparable to and with a similar expense structure to the Fund selected by Broadridge (Expense Group). Broadridge fee and expense data is based upon information taken from each fund’s most recent annual report, which reflects historical asset levels that may be quite different from those currently existing, particularly in a period of market volatility. While recognizing such inherent limitation and the fact that expense ratios and Management Rates generally increase as assets decline and decrease as assets grow, the Board believed the independent analysis conducted by Broadridge to be an appropriate measure of comparative fees
and expenses. The Broadridge Management Rate includes administrative charges, and the actual total expense ratio, for comparative consistency, was shown for Advisor Class shares for the Fund and for the Institutional Class, Class I or Class S shares for each other fund in the Expense Group with multiple classes of shares. The Board received a description of the methodology used by Broadridge to select the mutual funds included in an Expense Group.
The Expense Group for the Fund included the Fund and ten othermulti-cap growth funds. The Board noted that the Management Rate for the Fund was slightly above the median of its Expense Group, but its actual total expense ratio was equal to the median of its Expense Group. The Board concluded that the Management Rate charged to the Fund is reasonable. In doing so, the Board noted that the Fund’s actual total expense ratio reflected a fee waiver from management.
Profitability
The Board reviewed and considered information regarding the profits realized by the Manager and its affiliates in connection with the operation of the Fund, noting that the Fund incepted on April 12, 2016, but is not currently available for public sale. In this respect, the Board considered the Fund profitability analysis provided by the Manager that addresses the overall profitability of FTI’s US fund business, as well as its profits in providing investment management and other services to each of the individual funds during the12-month period ended September 30, 2018, being the most recent fiscalyear-end for FRI. The Board noted that although management continually makes refinements to its methodologies used in calculating profitability in response to organizational and product-related changes, the overall methodology has remained consistent with that used in the Fund’s profitability report presentations from prior years. Additionally, PricewaterhouseCoopers LLP, auditor to FRI and certain Franklin Templeton funds, has been engaged by the Manager to periodically review and assess the allocation methodologies to be used solely by the Fund’s Board with respect to the profitability analysis.
The Board noted management’s belief that costs incurred in establishing the infrastructure necessary for the type of mutual fund operations conducted by the Manager and its affiliates may not be fully reflected in the expenses allocated to the Fund in determining its profitability, as well as the fact that the level of profits, to a certain extent, reflected operational cost savings and efficiencies initiated by management. The Board also noted management’s need to implement systems and meet additional
| 21 | Semiannual Report | |||
FRANKLIN CUSTODIAN FUNDS
FRANKLIN FOCUSED GROWTH FUND
SHAREHOLDER INFORMATION
regulatory and compliance requirements resulting from recent SEC and other regulatory requirements.
The Board also considered the extent to which the Manager and its affiliates might derive ancillary benefits from fund operations, including revenues generated from transfer agent services, potential benefits resulting from personnel and systems enhancements necessitated by fund growth, as well as increased leverage with service providers and counterparties. Based upon its consideration of all these factors, the Board concluded that the level of profits realized/expected to be realized by the Manager and its affiliates from providing services to the Fund was not excessive in view of the nature, extent and quality of services provided to the Fund.
Economies of Scale
The Board reviewed and considered the extent to which the Manager may realize economies of scale, if any, as the Fund grows larger and whether the Fund’s management fee structure reflects any economies of scale for the benefit of share-holder(s). With respect to possible economies of scale, the Board noted the existence of management fee breakpoints, which operate generally to share any economies of scale with the Fund’s shareholder(s) by reducing the Fund’s effective management fees as the Fund grows in size. The Board considered the Manager’s view that any analyses of potential economies of scale in managing a particular fund are inherently limited in light of the joint and common costs and investments the Manager incurs across the Franklin Templeton family of funds as a whole. The Board noted that the Fund does not have an asset size that would likely enable the Fund to achieve economies of scale, but concluded that to the extent economies of scale may be realized by the Manager and its affiliates, the Fund’s management fee structure provided a sharing of benefits with the Fund and its shareholders as the Fund grows.
Conclusion
Based on its review, consideration and evaluation of all factors it believed relevant, including the above-described factors and conclusions, the Board unanimously approved the continuation of the Management Agreement for an additionalone-year period.
Proxy Voting Policies and Procedures
The Fund’s investment manager has established Proxy Voting Policies and Procedures (Policies) that the Fund uses to determine how to vote proxies relating to portfolio securities. Shareholders may view the Fund’s complete Policies online at franklintempleton.com. Alternatively, shareholders may request
copies of the Policies free of charge by calling the Proxy Group collect at (954)527-7678 or by sending a written request to: Franklin Templeton Companies, LLC, 300 S.E. 2nd Street, Fort Lauderdale, FL 33301, Attention: Proxy Group. Copies of the Fund’s proxy voting records are also made available online at franklintempleton.com and posted on the U.S. Securities and Exchange Commission’s website at sec.gov and reflect the most recent12-month period ended June 30.
Quarterly Statement of Investments
The Trust, on behalf of the Fund, files a complete statement of investments with the U.S. Securities and Exchange Commission for the first and third quarters for each fiscal year as an exhibit to its report on FormN-PORT. Shareholders may view the filed FormN-PORT by visiting the Commission’s website at sec.gov. The filed form may also be viewed and copied at the Commission’s Public Reference Room in Washington, DC. Information regarding the operations of the Public Reference Room may be obtained by calling(800) SEC-0330.
Semiannual Report | 22 |
Item 2. Code of Ethics.
(a) The Registrant has adopted a code of ethics that applies to its principal executive officers and principal financial and accounting officer.
(c) N/A
(d) N/A
(f) Pursuant to Item 12(a)(1), the Registrant is attaching as an exhibit a copy of its code of ethics that applies to its principal executive officers and principal financial and accounting officer.
Item 3. Audit Committee Financial Expert.
(a) (1) The Registrant has an audit committee financial expert serving on its audit committee.
(2) The audit committee financial expert is Mary C. Choksi and she is “independent” as defined under the relevant Securities and Exchange Commission Rules and Releases.
Item 4. Principal Accountant Fees and Services. N/A
Item 5. Audit Committee of Listed Registrants. N/A
Item 6. Schedule of Investments. N/A
Item 7. Disclosure of Proxy Voting Policies and Procedures forClosed-End Management Investment Companies. N/A
Item 8. Portfolio Managers ofClosed-End Management Investment Companies. N/A
Item 9. Purchases of Equity Securities byClosed-End Management Investment Company and Affiliated Purchasers. N/A
Item 10. Submission of Matters to a Vote of Security Holders.
There have been no changes to the procedures by which shareholders may recommend nominees to the Registrant’s Board of Trustees that would require disclosure herein.
Item 11. Controls and Procedures.
(a) Evaluation of Disclosure Controls and Procedures. The Registrant maintains disclosure controls and procedures that are designed to provide reasonable assurance that information required to be disclosed in the Registrant’s filings under the Securities Exchange Act of 1934,
as amended, and the Investment Company Act of 1940 is recorded, processed, summarized and reported within the periods specified in the rules and forms of the Securities and Exchange Commission. Such information is accumulated and communicated to the Registrant’s management, including its principal executive officer and principal financial officer, as appropriate, to allow timely decisions regarding required disclosure. The Registrant’s management, including the principal executive officer and the principal financial officer, recognizes that any set of controls and procedures, no matter how well designed and operated, can provide only reasonable assurance of achieving the desired control objectives.
Within 90 days prior to the filing date of this Shareholder Report onForm N-CSR, the Registrant had carried out an evaluation, under the supervision and with the participation of the Registrant’s management, including the Registrant’s principal executive officer and the Registrant’s principal financial officer, of the effectiveness of the design and operation of the Registrant’s disclosure controls and procedures. Based on such evaluation, the Registrant’s principal executive officer and principal financial officer concluded that the Registrant’s disclosure controls and procedures are effective.
(b) Changes in Internal Controls. There have been no changes in the Registrant’s internal control over financial reporting that occurred during the period covered by this report that has materially affected, or is reasonably likely to materially affect the internal control over financial reporting.
Item 12. Disclosure of Securities Lending Activities forClosed-End Management Investment Company. N/A
Item 13. Exhibits.
(a) (1) Code of Ethics
(a) (2) Certifications pursuant to Section 302 of the Sarbanes-Oxley Act of 2002 of Matthew T. Hinkle, Chief Executive Officer—Finance and Administration, and Gaston Gardey, Chief Financial Officer and Chief Accounting Officer
(b) Certifications pursuant to Section 906 of the Sarbanes-Oxley Act of 2002 of Matthew T. Hinkle, Chief Executive Officer—Finance and Administration, and Gaston Gardey, Chief Financial Officer and Chief Accounting Officer
SIGNATURES
Pursuant to the requirements of the Securities Exchange Act of 1934 and the Investment Company Act of 1940, the registrant has duly caused this report to be signed on its behalf by the undersigned, thereunto duly authorized.
FRANKLIN CUSTODIAN FUNDS
| By | /s/ MATTHEW T. HINKLE | |
| Matthew T. Hinkle | ||
| Chief Executive Officer – Finance and Administration |
| Date | May 24, 2019 |
Pursuant to the requirements of the Securities Exchange Act of 1934 and the Investment Company Act of 1940, this report has been signed below by the following persons on behalf of the registrant and in the capacities and on the dates indicated.
| By | /s/ MATTHEW T. HINKLE | |
| Matthew T. Hinkle | ||
| Chief Executive Officer – Finance and Administration |
| Date | May 24, 2019 |
| By | /s/ GASTON GARDEY | |
| Gaston Gardey | ||
| Chief Financial Officer and Chief Accounting Officer |
| Date | May 24, 2019 |