FRANKLIN RESOURCES, INC. Q3 2019 Executive Quarterly Earnings Commentary July 30, 2019 Exhibit 99.2 Highlights • Overall relative investment performance sustained recent momentum, with the majority of assets under management ranked in the top two quartiles across the 1-, 3-, and 10-year periods. Greg Johnson • Quarterly long-term net outflows improved to $5.4 billion and long- Chairman of the Board term sales increased again this quarter, due to higher institutional Chief Executive Officer sales. • As part of our proactive efforts to evolve our business to meet Matthew Nicholls client needs, we recently announced several senior-level additions Executive Vice President and organizational changes within our Templeton Global Equity Chief Financial Officer and Franklin Templeton Fixed Income teams. These changes are part of a broader vision to further our portfolio management, research, and data analytics capabilities This comes on the heels Jennifer Johnson of key hiring completed during 2018 to accelerate our progress President with important initiatives in multi-asset solutions, emerging markets Chief Operating Officer equity, and alternatives. • We remain on track with efforts to further optimize our cost structure and recognized additional one-time execution costs this quarter that led to a slight decrease in operating income. Contents Page(s) Investment Performance 2 Conference Call Details: Assets Under Management Chairman and CEO Greg Johnson, Executive Vice President and CFO 3-5 and Flows Matthew Nicholls, and President and COO Jennifer Johnson will lead a live teleconference at 11:00 a.m. Eastern Time to answer questions of a Flows by Investment material nature. Access to the teleconference will be available 6-8 Objective via investors.franklinresources.com or by dialing (877) 407-8293 in the U.S. and Canada or (201) 689-8349 internationally. A replay of the Financial Results 9 teleconference can also be accessed by calling (877) 660-6853 in the U.S. and Canada or (201) 612-7415 internationally using access code Operating Revenues and 13692308, after 2:00 p.m. Eastern Time on July 30, 2019 through 9-11 Expenses August 30, 2019. Analysts and investors are encouraged to review the Company’s recent Other Income and Taxes 12 filings with the U.S. Securities and Exchange Commission and to contact Investor Relations at (650) 312-4091 before the live Capital Management 13-15 teleconference for any clarifications or questions related to the earnings Appendix 16-17 release or written commentary.
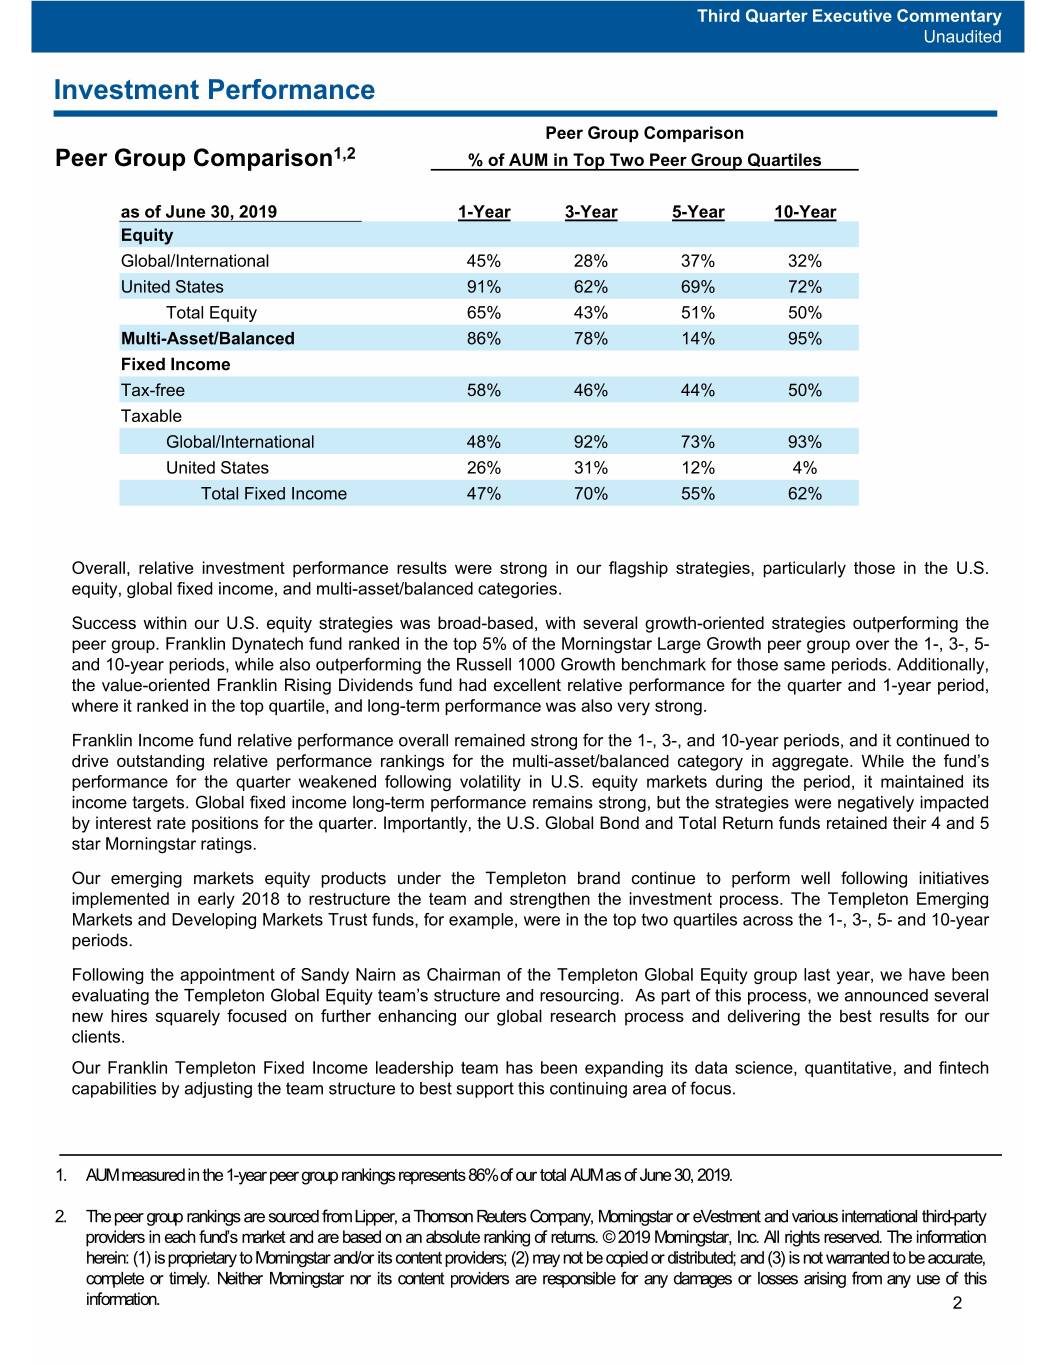
Third Quarter Executive Commentary Unaudited Investment Performance Peer Group Comparison Peer Group Comparison1,2 % of AUM in Top Two Peer Group Quartiles as of June 30, 2019 1-Year 3-Year 5-Year 10-Year Equity Global/International 45% 28% 37% 32% United States 91% 62% 69% 72% Total Equity 65% 43% 51% 50% Multi-Asset/Balanced 86% 78% 14% 95% Fixed Income Tax-free 58% 46% 44% 50% Taxable Global/International 48% 92% 73% 93% United States 26% 31% 12% 4% Total Fixed Income 47% 70% 55% 62% Overall, relative investment performance results were strong in our flagship strategies, particularly those in the U.S. equity, global fixed income, and multi-asset/balanced categories. Success within our U.S. equity strategies was broad-based, with several growth-oriented strategies outperforming the peer group. Franklin Dynatech fund ranked in the top 5% of the Morningstar Large Growth peer group over the 1-, 3-, 5- and 10-year periods, while also outperforming the Russell 1000 Growth benchmark for those same periods. Additionally, the value-oriented Franklin Rising Dividends fund had excellent relative performance for the quarter and 1-year period, where it ranked in the top quartile, and long-term performance was also very strong. Franklin Income fund relative performance overall remained strong for the 1-, 3-, and 10-year periods, and it continued to drive outstanding relative performance rankings for the multi-asset/balanced category in aggregate. While the fund’s performance for the quarter weakened following volatility in U.S. equity markets during the period, it maintained its income targets. Global fixed income long-term performance remains strong, but the strategies were negatively impacted by interest rate positions for the quarter. Importantly, the U.S. Global Bond and Total Return funds retained their 4 and 5 star Morningstar ratings. Our emerging markets equity products under the Templeton brand continue to perform well following initiatives implemented in early 2018 to restructure the team and strengthen the investment process. The Templeton Emerging Markets and Developing Markets Trust funds, for example, were in the top two quartiles across the 1-, 3-, 5- and 10-year periods. Following the appointment of Sandy Nairn as Chairman of the Templeton Global Equity group last year, we have been evaluating the Templeton Global Equity team’s structure and resourcing. As part of this process, we announced several new hires squarely focused on further enhancing our global research process and delivering the best results for our clients. Our Franklin Templeton Fixed Income leadership team has been expanding its data science, quantitative, and fintech capabilities by adjusting the team structure to best support this continuingareaoffocus. 1. AUM measured in the 1-year peer group rankings represents 86% of our total AUM as of June 30, 2019. 2. The peer group rankings are sourced from Lipper, a Thomson Reuters Company, Morningstar or eVestment and various international third-party providers in each fund’s market and are based on an absolute ranking of returns. © 2019 Morningstar, Inc. All rights reserved. The information herein: (1) is proprietary to Morningstar and/or its content providers; (2) may not be copied or distributed; and (3) is not warranted to be accurate, complete or timely. Neither Morningstar nor its content providers are responsible for any damages or losses arising from any use of this information. 2
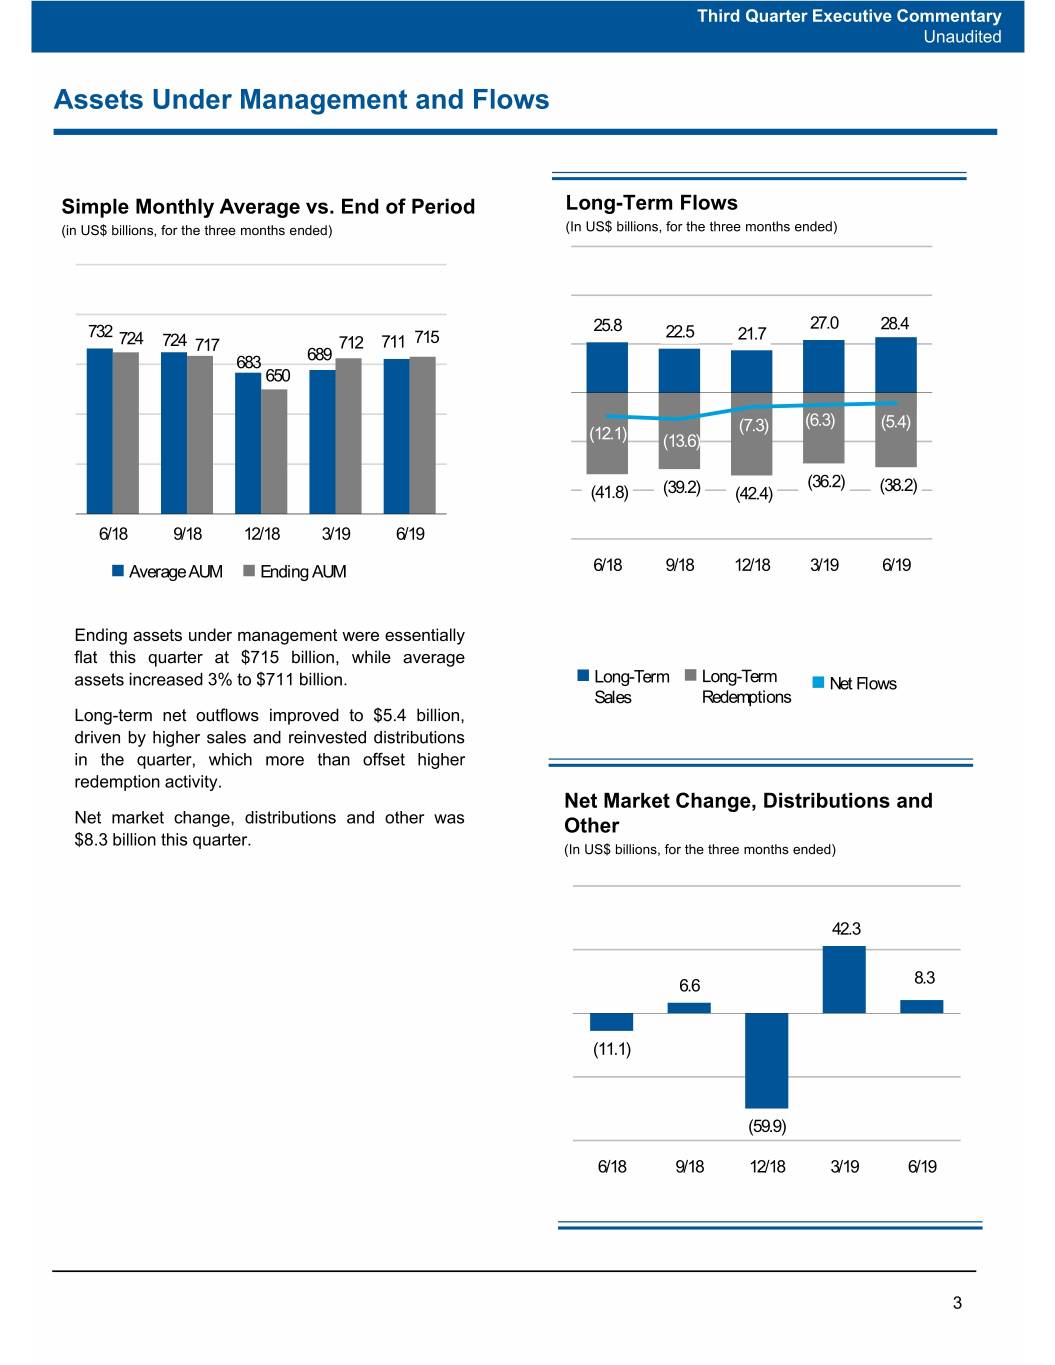
Third Quarter Executive Commentary Unaudited Assets Under Management and Flows Simple Monthly Average vs. End of Period Long-Term Flows (in US$ billions, for the three months ended) (In US$ billions, for the three months ended) 27.0 28.4 732 25.8 22.5 21.7 724 724 717 712 711 715 683 689 650 (7.3) (6.3) (5.4) (12.1) (13.6) (36.2) (41.8) (39.2) (42.4) (38.2) 6/18 9/18 12/18 3/19 6/19 Average AUM Ending AUM 6/18 9/18 12/18 3/19 6/19 Ending assets under management were essentially flat this quarter at $715 billion, while average assets increased 3% to $711 billion. Long-Term Long-Term Net Flows Sales Redemptions Long-term net outflows improved to $5.4 billion, driven by higher sales and reinvested distributions in the quarter, which more than offset higher redemption activity. Net Market Change, Distributions and Net market change, distributions and other was Other $8.3 billion this quarter. (In US$ billions, for the three months ended) 42.3 6.6 8.3 (11.1) (59.9) 6/18 9/18 12/18 3/19 6/19 3
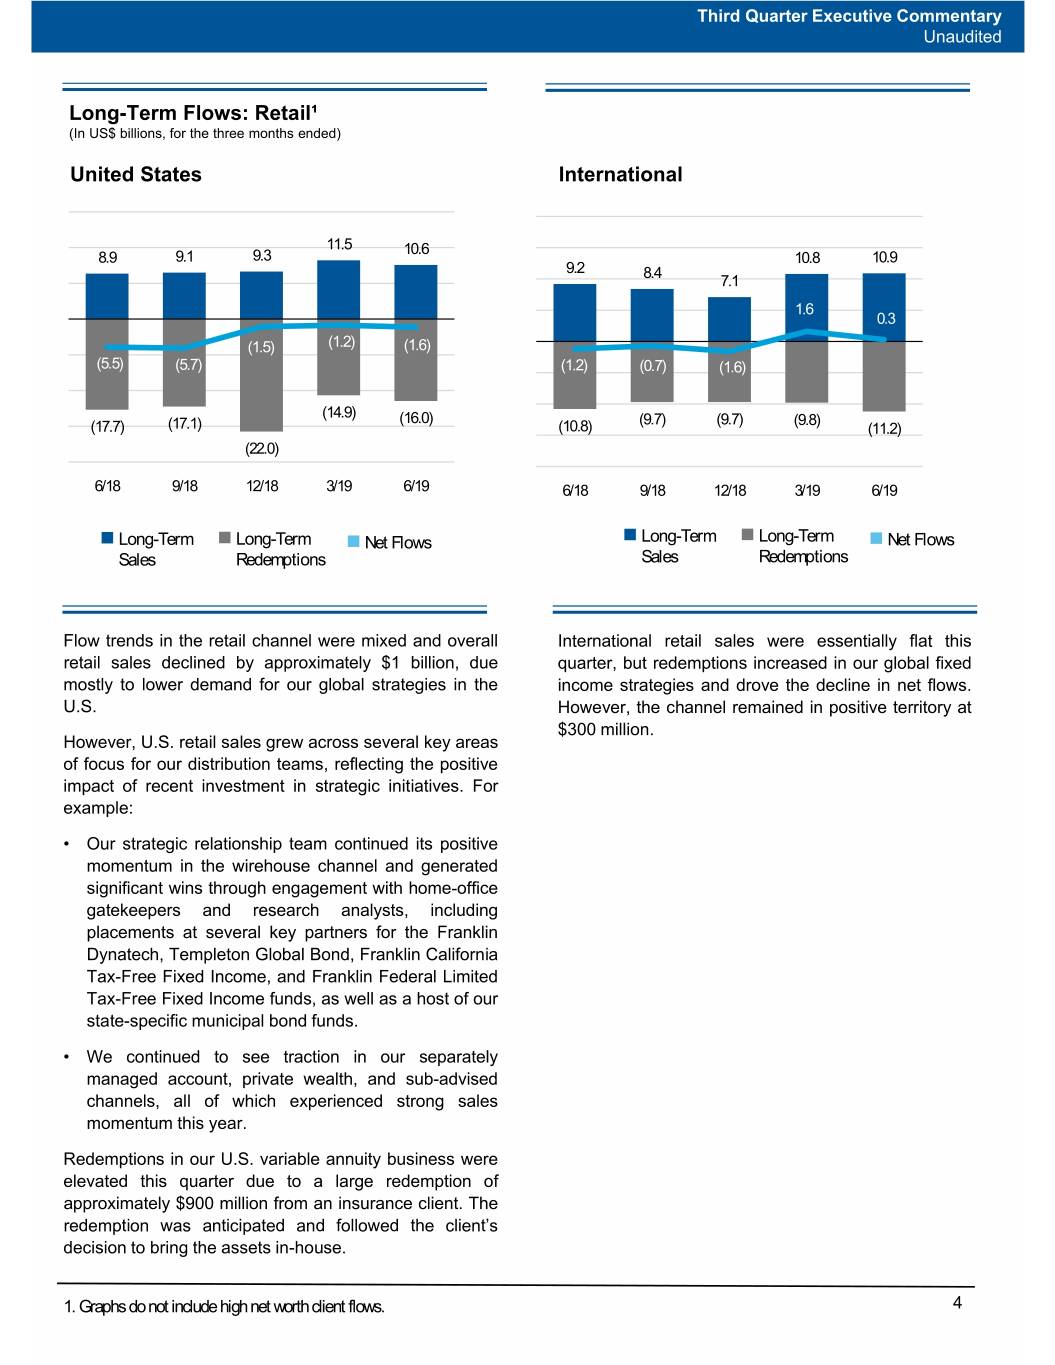
Third Quarter Executive Commentary Unaudited Long-Term Flows: Retail¹ (In US$ billions, for the three months ended) United States International 11.5 10.6 8.9 9.1 9.3 10.8 10.9 9.2 8.4 7.1 1.6 0.3 (1.5) (1.2) (1.6) (5.5) (5.7) (1.2) (0.7) (1.6) (14.9) (16.0) (9.7) (9.7) (9.8) (17.7) (17.1) (10.8) (11.2) (22.0) 6/18 9/18 12/18 3/19 6/19 6/18 9/18 12/18 3/19 6/19 Long-Term Long-Term Net Flows Long-Term Long-Term Net Flows Sales Redemptions Sales Redemptions Flow trends in the retail channel were mixed and overall International retail sales were essentially flat this retail sales declined by approximately $1 billion, due quarter, but redemptions increased in our global fixed mostly to lower demand for our global strategies in the income strategies and drove the decline in net flows. U.S. However, the channel remained in positive territory at $300 million. However, U.S. retail sales grew across several key areas of focus for our distribution teams, reflecting the positive impact of recent investment in strategic initiatives. For example: • Our strategic relationship team continued its positive momentum in the wirehouse channel and generated significant wins through engagement with home-office gatekeepers and research analysts, including placements at several key partners for the Franklin Dynatech, Templeton Global Bond, Franklin California Tax-Free Fixed Income, and Franklin Federal Limited Tax-Free Fixed Income funds, as well as a host of our state-specific municipal bond funds. • We continued to see traction in our separately managed account, private wealth, and sub-advised channels, all of which experienced strong sales momentum this year. Redemptions in our U.S. variable annuity business were elevated this quarter due to a large redemption of approximately $900 million from an insurance client. The redemption was anticipated and followed the client’s decision to bring the assets in-house. 1. Graphs do not include high net worth client flows. 4
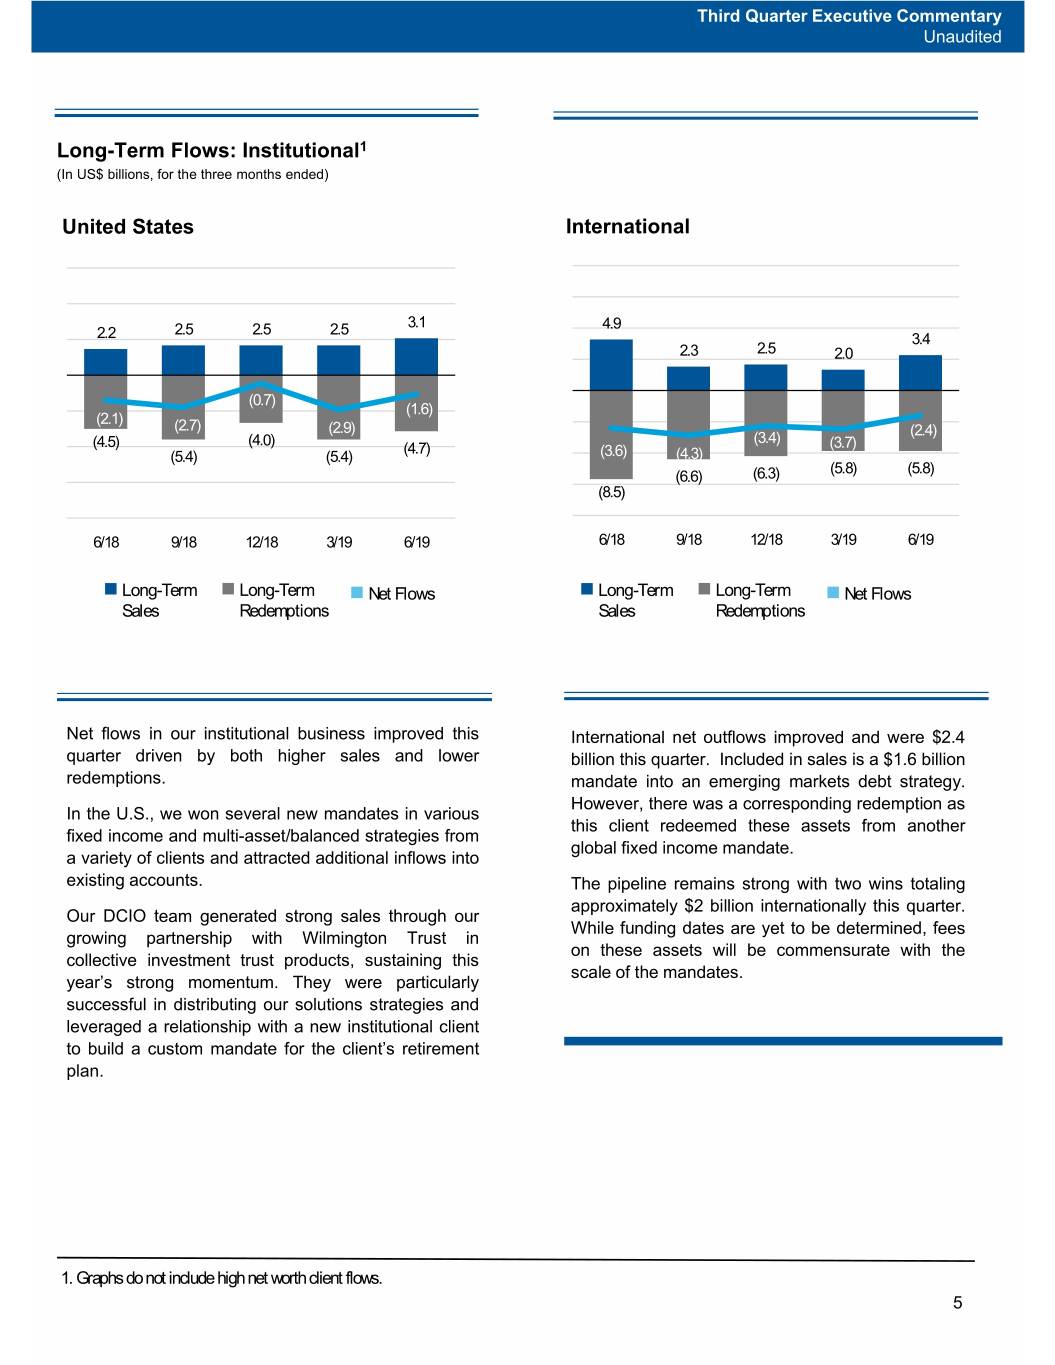
Third Quarter Executive Commentary Unaudited Long-Term Flows: Institutional1 (In US$ billions, for the three months ended) United States International 2.5 2.5 2.5 3.1 4.9 2.2 3.4 2.3 2.5 2.0 (0.7) (1.6) (2.1) (2.7) (2.9) (2.4) (4.0) (3.4) (4.5) (4.7) (3.7) (5.4) (5.4) (3.6) (4.3) (5.8) (5.8) (6.6) (6.3) (8.5) 6/18 9/18 12/18 3/19 6/19 6/18 9/18 12/18 3/19 6/19 Long-Term Long-Term Net Flows Long-Term Long-Term Net Flows Sales Redemptions Sales Redemptions Net flows in our institutional business improved this International net outflows improved and were $2.4 quarter driven by both higher sales and lower billion this quarter. Included in sales is a $1.6 billion redemptions. mandate into an emerging markets debt strategy. However, there was a corresponding redemption as In the U.S., we won several new mandates in various this client redeemed these assets from another fixed income and multi-asset/balanced strategies from global fixed income mandate. a variety of clients and attracted additional inflows into existing accounts. The pipeline remains strong with two wins totaling approximately $2 billion internationally this quarter. Our DCIO team generated strong sales through our While funding dates are yet to be determined, fees growing partnership with Wilmington Trust in on these assets will be commensurate with the collective investment trust products, sustaining this scale of the mandates. year’s strong momentum. They were particularly successful in distributing our solutions strategies and leveraged a relationship with a new institutional client to build a custom mandate for the client’s retirement plan. 1. Graphs do not include high net worth client flows. 5

Third Quarter Executive Commentary Unaudited Flows by Investment Objective Global/International Equity Global/International Fixed Income (in US$ billions, for the three months ended) (in US$ billions, for the three months ended) 11.1 12.1 8.3 6.0 7.2 7.4 4.3 4.3 5.1 4.4 3.6 1.3 (1.4) (1.9) (2.0) (6.3) (2.7) (7.3) (7.3) (7.0) (9.7) (8.6) (11.5) (10.1) (11.0) (10.0) (13.3) (12.0) (12.1) (12.0) 6/18 9/18 12/18 3/19 6/19 6/18 9/18 12/18 3/19 6/19 Long-Term Long-Term Net Flows Long-Term Long-Term Net Flows Sales Redemptions Sales Redemptions % of Beg. Prior 4 Quarters Current % of Beg. Prior 4 Quarters Current AUM1 Avg Quarter AUM1 Avg Quarter Sales 10% 10% Sales 22% 32% Redemptions 25% 23% Redemptions 27% 31% Global equity net outflows remain challenged overall, Although global fixed income experienced a higher but improved over the last quarter, as a decline in volume of redemptions this quarter, the strategy still redemptions more than offset lower sales. generated $1.3 billion of net inflows, and most large strategies within the category were among our top In July, we incurred an $800 million Canadian equity net flow generating products this quarter. redemption from a long-term client, which was acquired by a firm that took the assets in-house. This However, a $500 million platform-related client also redeemed $1.7 billion of Canadian fixed redemption occurred in the Templeton Global Bond income assets for the same reason this month. Fee fund in the retail channel. We expect another $400 rates on both Canadian mandates were highly million from this client to redeem over time (in competitive. addition to the $1.7 billion July redemption referenced earlier). An unrelated $715 million global equity redemption also occurred this month. 1. Sales and redemptions as a percentage of beginning assets under management are annualized. 6
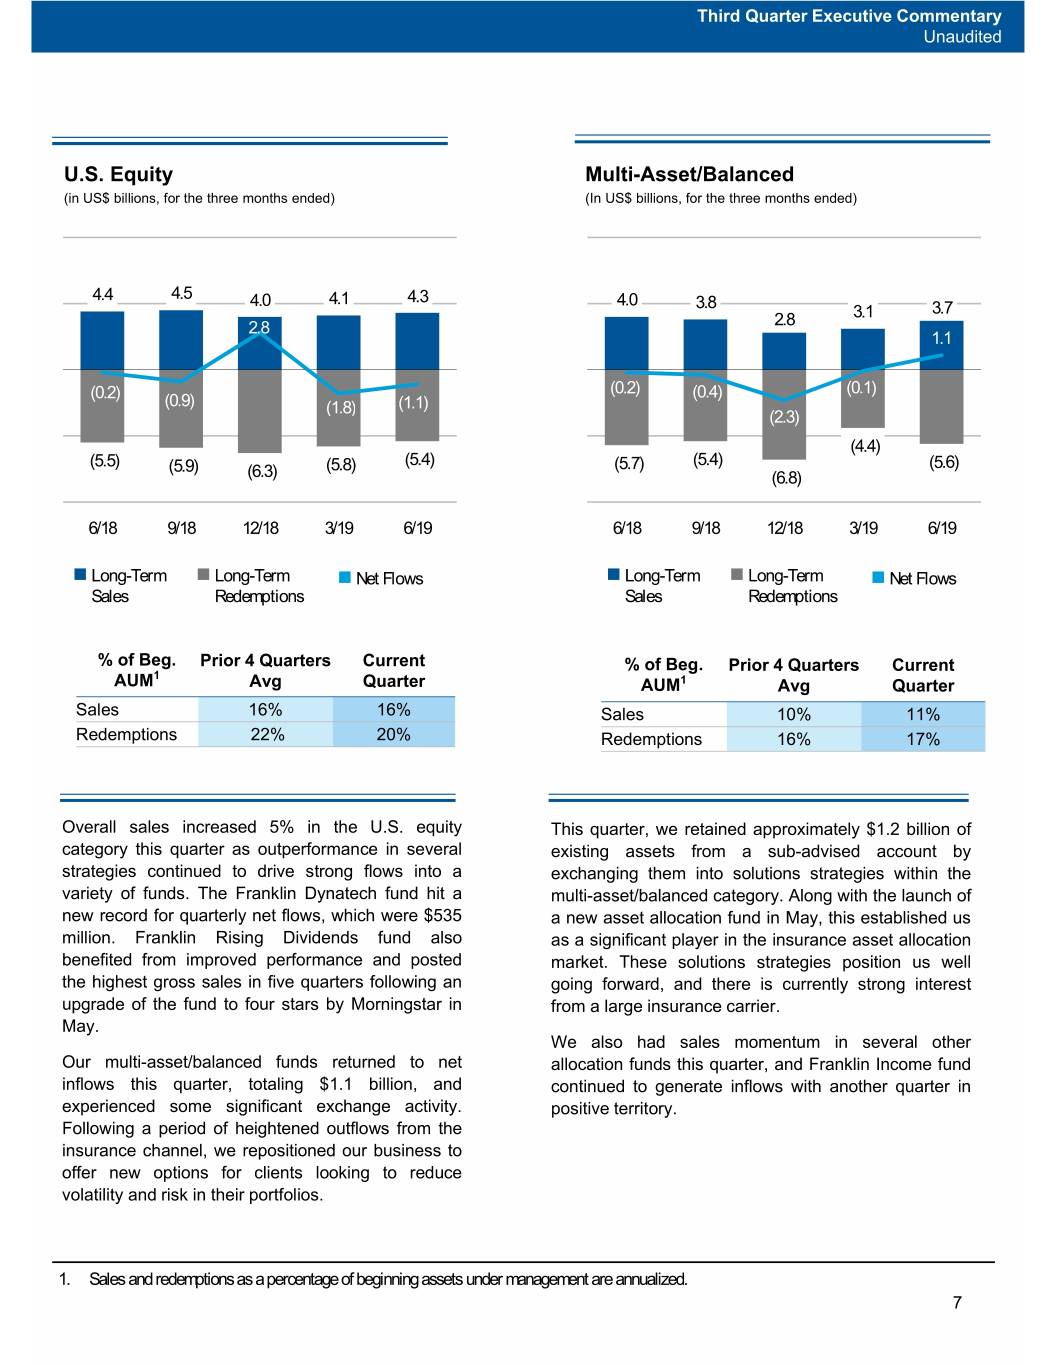
Third Quarter Executive Commentary Unaudited U.S. Equity Multi-Asset/Balanced (in US$ billions, for the three months ended) (In US$ billions, for the three months ended) 4.5 4.4 4.0 4.1 4.3 4.0 3.8 3.1 3.7 2.8 2.8 1.1 (0.2) (0.2) (0.4) (0.1) (0.9) (1.8) (1.1) (2.3) (4.4) (5.5) (5.9) (5.8) (5.4) (5.7) (5.4) (5.6) (6.3) (6.8) 6/18 9/18 12/18 3/19 6/19 6/18 9/18 12/18 3/19 6/19 Long-Term Long-Term Net Flows Long-Term Long-Term Net Flows Sales Redemptions Sales Redemptions % of Beg. Prior 4 Quarters Current % of Beg. Prior 4 Quarters Current 1 AUM Avg Quarter AUM1 Avg Quarter Sales 16% 16% Sales 10% 11% Redemptions 22% 20% Redemptions 16% 17% Overall sales increased 5% in the U.S. equity This quarter, we retained approximately $1.2 billion of category this quarter as outperformance in several existing assets from a sub-advised account by strategies continued to drive strong flows into a exchanging them into solutions strategies within the variety of funds. The Franklin Dynatech fund hit a multi-asset/balanced category. Along with the launch of new record for quarterly net flows, which were $535 a new asset allocation fund in May, this established us million. Franklin Rising Dividends fund also as a significant player in the insurance asset allocation benefited from improved performance and posted market. These solutions strategies position us well the highest gross sales in five quarters following an going forward, and there is currently strong interest upgrade of the fund to four stars by Morningstar in from a large insurance carrier. May. We also had sales momentum in several other Our multi-asset/balanced funds returned to net allocation funds this quarter, and Franklin Income fund inflows this quarter, totaling $1.1 billion, and continued to generate inflows with another quarter in experienced some significant exchange activity. positive territory. Following a period of heightened outflows from the insurance channel, we repositioned our business to offer new options for clients looking to reduce volatility and risk in their portfolios. 1. Sales and redemptions as a percentage of beginning assets under management are annualized. 7
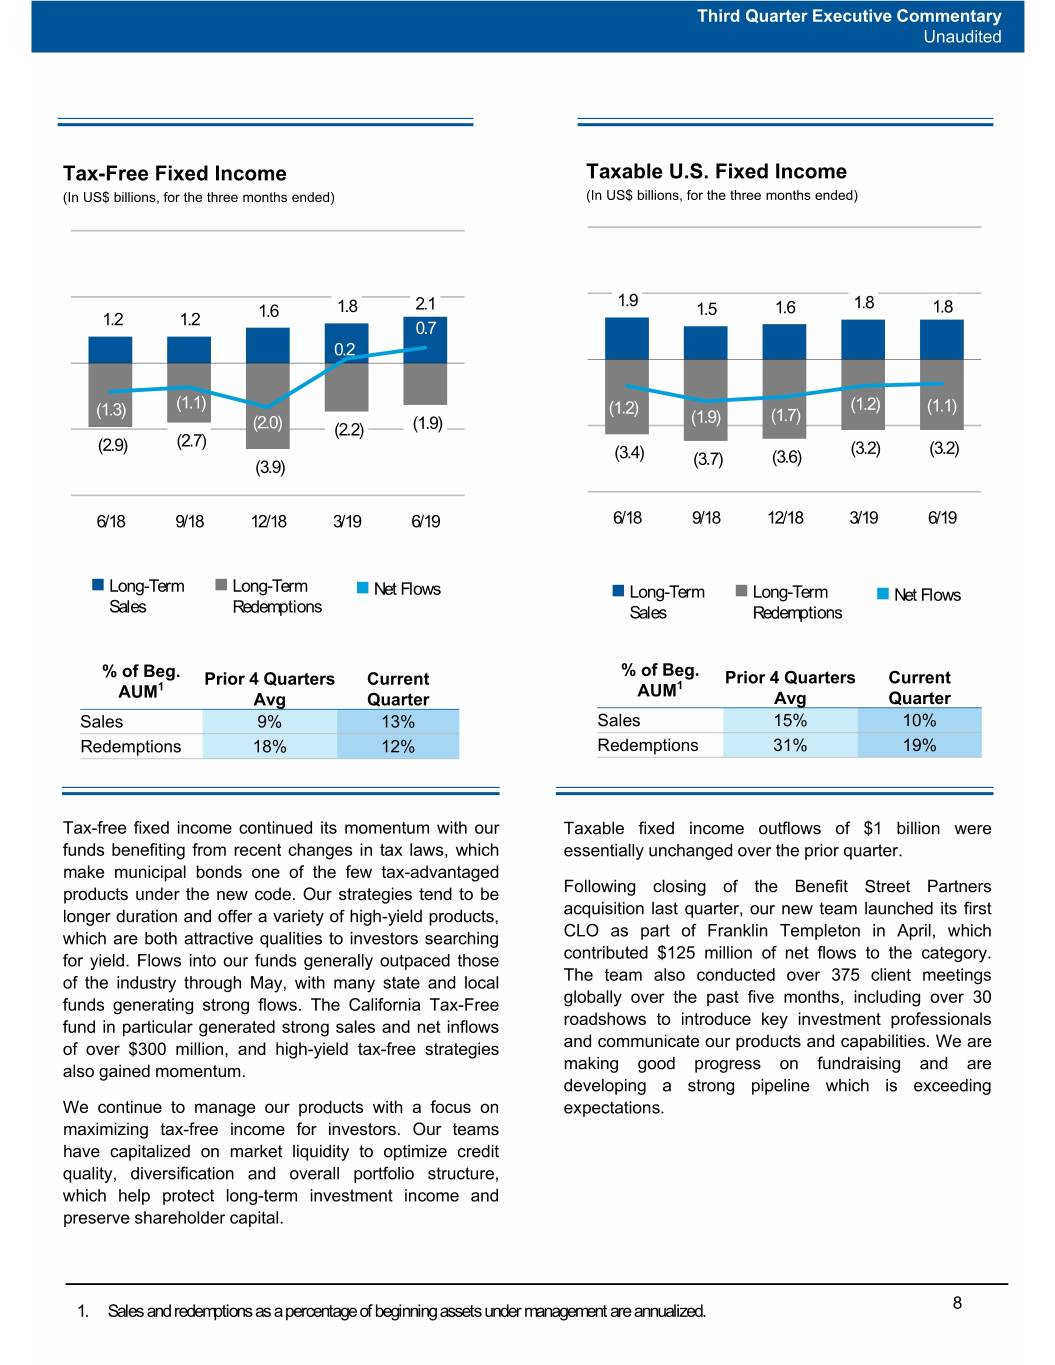
Third Quarter Executive Commentary Unaudited Tax-Free Fixed Income Taxable U.S. Fixed Income (In US$ billions, for the three months ended) (In US$ billions, for the three months ended) 1.9 1.8 2.1 1.5 1.6 1.8 1.8 1.2 1.2 1.6 0.7 0.2 (1.1) (1.2) (1.2) (1.1) (1.3) (1.9) (1.7) (2.0) (2.2) (1.9) (2.9) (2.7) (3.2) (3.2) (3.4) (3.6) (3.9) (3.7) 6/18 9/18 12/18 3/19 6/19 6/18 9/18 12/18 3/19 6/19 Long-Term Long-Term Net Flows Long-Term Long-Term Net Flows Sales Redemptions Sales Redemptions % of Beg. % of Beg. Prior 4 Quarters Current Prior 4 Quarters Current 1 AUM1 AUM Avg Quarter Avg Quarter Sales 9% 13% Sales 15% 10% Redemptions 18% 12% Redemptions 31% 19% Tax-free fixed income continued its momentum with our Taxable fixed income outflows of $1 billion were funds benefiting from recent changes in tax laws, which essentially unchanged over the prior quarter. make municipal bonds one of the few tax-advantaged products under the new code. Our strategies tend to be Following closing of the Benefit Street Partners longer duration and offer a variety of high-yield products, acquisition last quarter, our new team launched its first which are both attractive qualities to investors searching CLO as part of Franklin Templeton in April, which for yield. Flows into our funds generally outpaced those contributed $125 million of net flows to the category. of the industry through May, with many state and local The team also conducted over 375 client meetings funds generating strong flows. The California Tax-Free globally over the past five months, including over 30 fund in particular generated strong sales and net inflows roadshows to introduce key investment professionals of over $300 million, and high-yield tax-free strategies and communicate our products and capabilities. We are also gained momentum. making good progress on fundraising and are developing a strong pipeline which is exceeding We continue to manage our products with a focus on expectations. maximizing tax-free income for investors. Our teams have capitalized on market liquidity to optimize credit quality, diversification and overall portfolio structure, which help protect long-term investment income and preserve shareholder capital. 1. Sales and redemptions as a percentage of beginning assets under management are annualized. 8
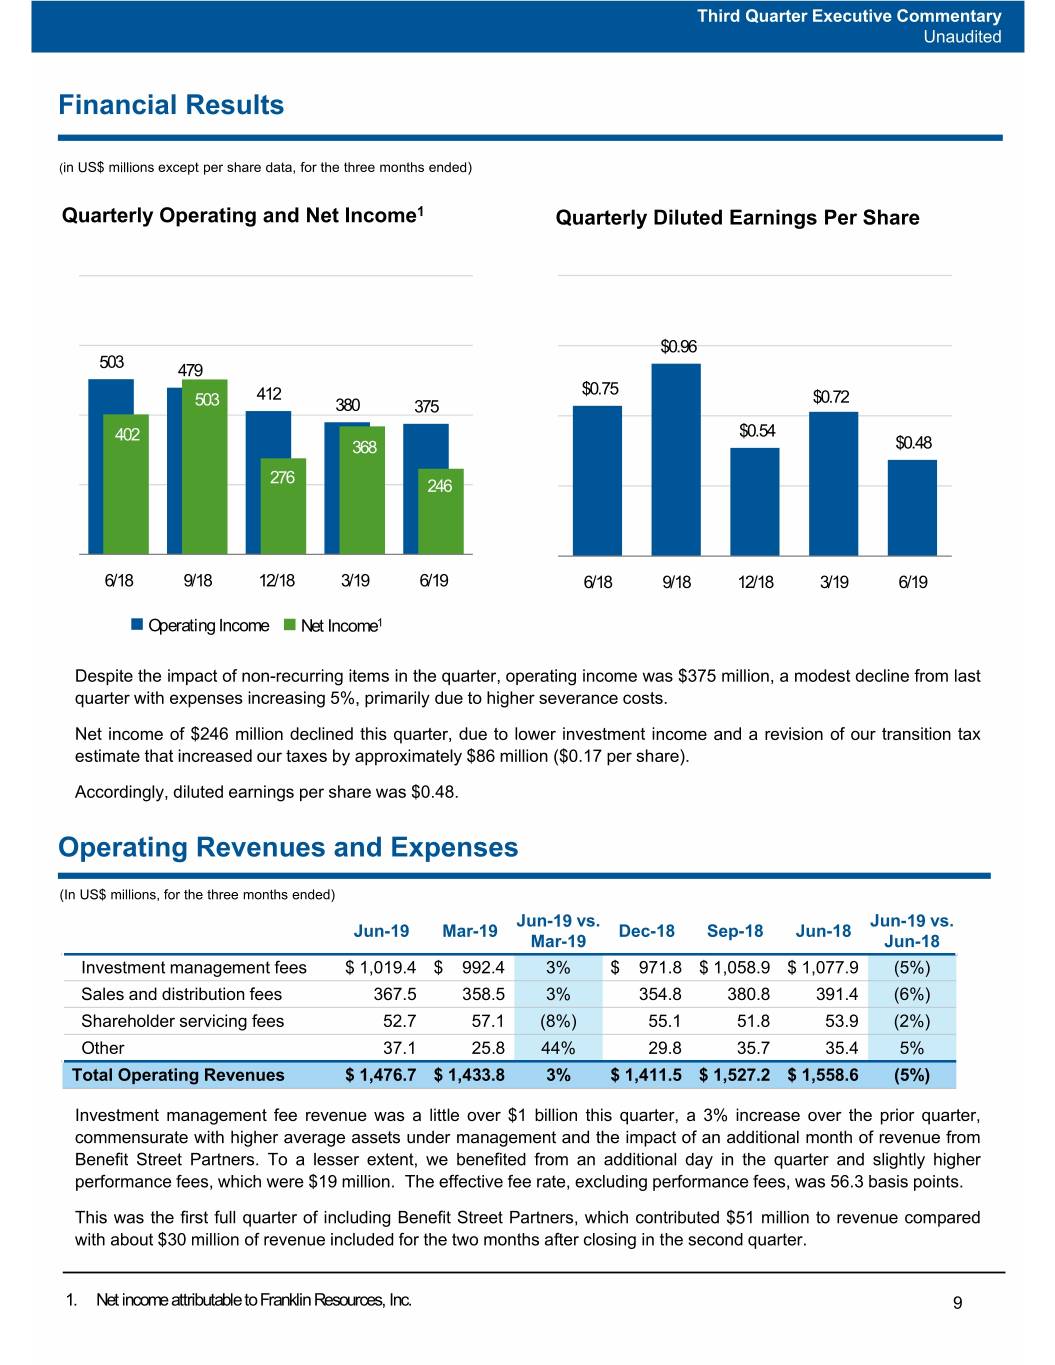
Third Quarter Executive Commentary Unaudited Financial Results (in US$ millions except per share data, for the three months ended) Quarterly Operating and Net Income1 Quarterly Diluted Earnings Per Share $0.96 503 479 412 $0.75 $0.72 503 380 375 402 $0.54 368 $0.48 276 246 6/18 9/18 12/18 3/19 6/19 6/18 9/18 12/18 3/19 6/19 Operating Income Net Income1 Despite the impact of non-recurring items in the quarter, operating income was $375 million, a modest decline from last quarter with expenses increasing 5%, primarily due to higher severance costs. Net income of $246 million declined this quarter, due to lower investment income and a revision of our transition tax estimate that increased our taxes by approximately $86 million ($0.17 per share). Accordingly, diluted earnings per share was $0.48. Operating Revenues and Expenses (In US$ millions, for the three months ended) Jun-19 vs. Jun-19 vs. Jun-19 Mar-19 Dec-18 Sep-18 Jun-18 Mar-19 Jun-18 Investment management fees $ 1,019.4 $ 992.4 3% $ 971.8 $ 1,058.9 $ 1,077.9 (5%) Sales and distribution fees 367.5 358.5 3% 354.8 380.8 391.4 (6%) Shareholder servicing fees 52.7 57.1 (8%) 55.1 51.8 53.9 (2%) Other 37.1 25.8 44% 29.8 35.7 35.4 5% Total Operating Revenues $ 1,476.7 $ 1,433.8 3% $ 1,411.5 $ 1,527.2 $ 1,558.6 (5%) Investment management fee revenue was a little over $1 billion this quarter, a 3% increase over the prior quarter, commensurate with higher average assets under management and the impact of an additional month of revenue from Benefit Street Partners. To a lesser extent, we benefited from an additional day in the quarter and slightly higher performance fees, which were $19 million. The effective fee rate, excluding performance fees, was 56.3 basis points. This was the first full quarter of including Benefit Street Partners, which contributed $51 million to revenue compared with about $30 million of revenue included for the two months after closing in the second quarter. 1. Net income attributable to Franklin Resources, Inc. 9
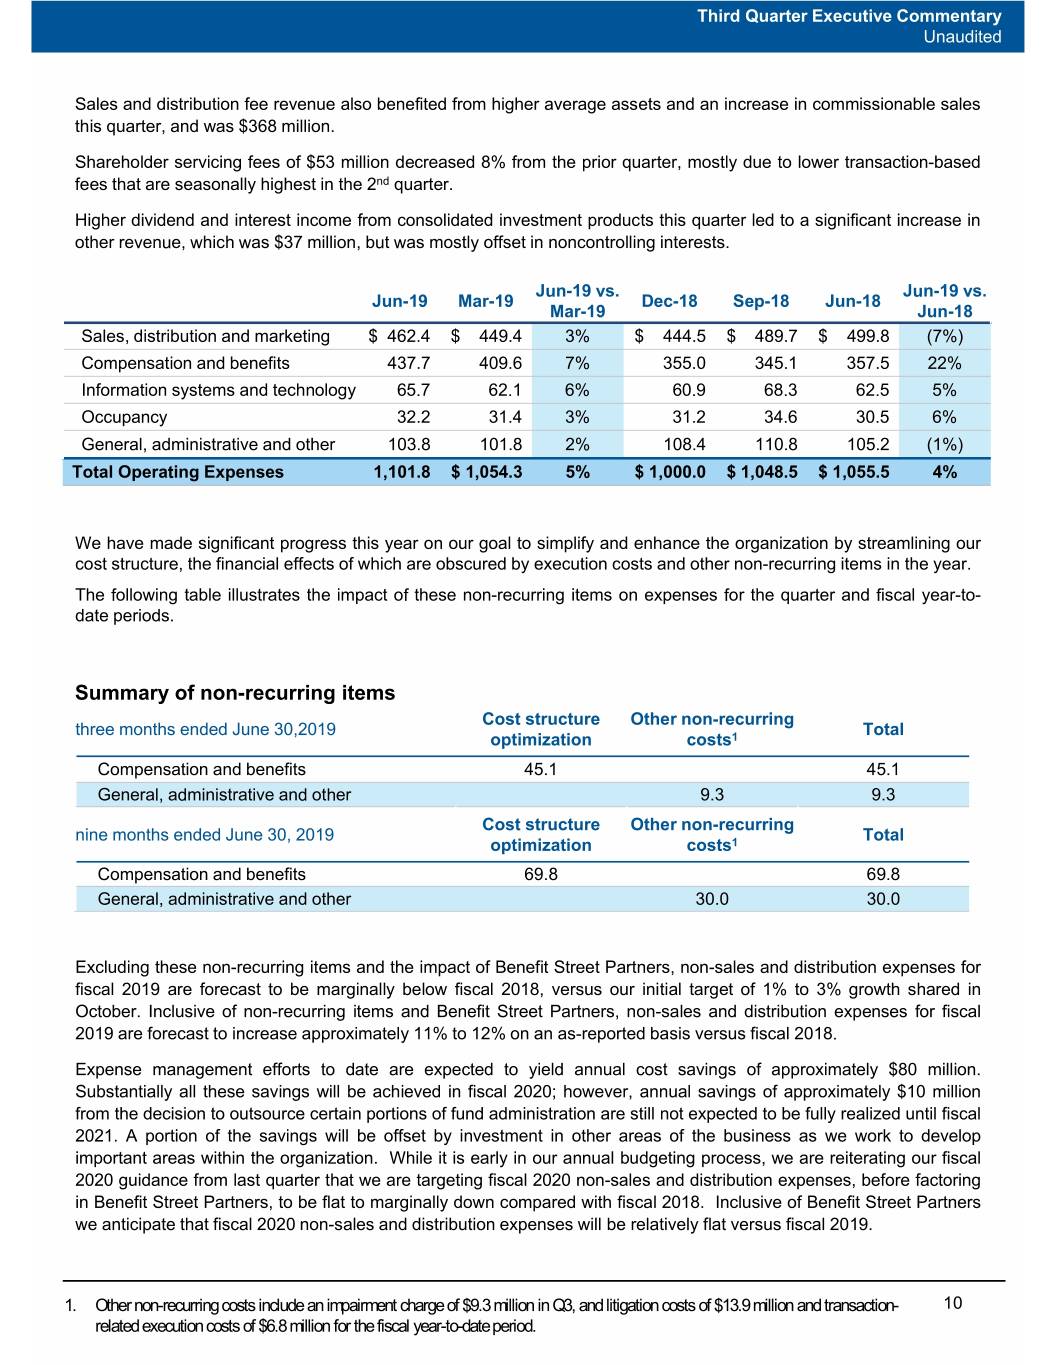
Third Quarter Executive Commentary Unaudited Sales and distribution fee revenue also benefited from higher average assets and an increase in commissionable sales this quarter, and was $368 million. Shareholder servicing fees of $53 million decreased 8% from the prior quarter, mostly due to lower transaction-based fees that are seasonally highest in the 2nd quarter. Higher dividend and interest income from consolidated investment products this quarter led to a significant increase in other revenue, which was $37 million, but was mostly offset in noncontrolling interests. Jun-19 vs. Jun-19 vs. Jun-19 Mar-19 Dec-18 Sep-18 Jun-18 Mar-19 Jun-18 Sales, distribution and marketing $ 462.4 $ 449.4 3% $ 444.5 $ 489.7 $ 499.8 (7%) Compensation and benefits 437.7 409.6 7% 355.0 345.1 357.5 22% Information systems and technology 65.7 62.1 6% 60.9 68.3 62.5 5% Occupancy 32.2 31.4 3% 31.2 34.6 30.5 6% General, administrative and other 103.8 101.8 2% 108.4 110.8 105.2 (1%) Total Operating Expenses 1,101.8 $ 1,054.3 5% $ 1,000.0 $ 1,048.5 $ 1,055.5 4% We have made significant progress this year on our goal to simplify and enhance the organization by streamlining our cost structure, the financial effects of which are obscured by execution costs and other non-recurring items in the year. The following table illustrates the impact of these non-recurring items on expenses for the quarter and fiscal year-to- date periods. Summary of non-recurring items Cost structure Other non-recurring three months ended June 30,2019 Total optimization costs1 Compensation and benefits 45.1 45.1 General, administrative and other 9.3 9.3 Cost structure Other non-recurring nine months ended June 30, 2019 Total optimization costs1 Compensation and benefits 69.8 69.8 General, administrative and other 30.0 30.0 Excluding these non-recurring items and the impact of Benefit Street Partners, non-sales and distribution expenses for fiscal 2019 are forecast to be marginally below fiscal 2018, versus our initial target of 1% to 3% growth shared in October. Inclusive of non-recurring items and Benefit Street Partners, non-sales and distribution expenses for fiscal 2019 are forecast to increase approximately 11% to 12% on an as-reported basis versus fiscal 2018. Expense management efforts to date are expected to yield annual cost savings of approximately $80 million. Substantially all these savings will be achieved in fiscal 2020; however, annual savings of approximately $10 million from the decision to outsource certain portions of fund administration are still not expected to be fully realized until fiscal 2021. A portion of the savings will be offset by investment in other areas of the business as we work to develop important areas within the organization. While it is early in our annual budgeting process, we are reiterating our fiscal 2020 guidance from last quarter that we are targeting fiscal 2020 non-sales and distribution expenses, before factoring in Benefit Street Partners, to be flat to marginally down compared with fiscal 2018. Inclusive of Benefit Street Partners we anticipate that fiscal 2020 non-sales and distribution expenses will be relatively flat versus fiscal 2019. 1. Other non-recurring costs include an impairment charge of $9.3 million in Q3, and litigation costs of $13.9 million and transaction- 10 related execution costs of $6.8 million for the fiscal year-to-date period.
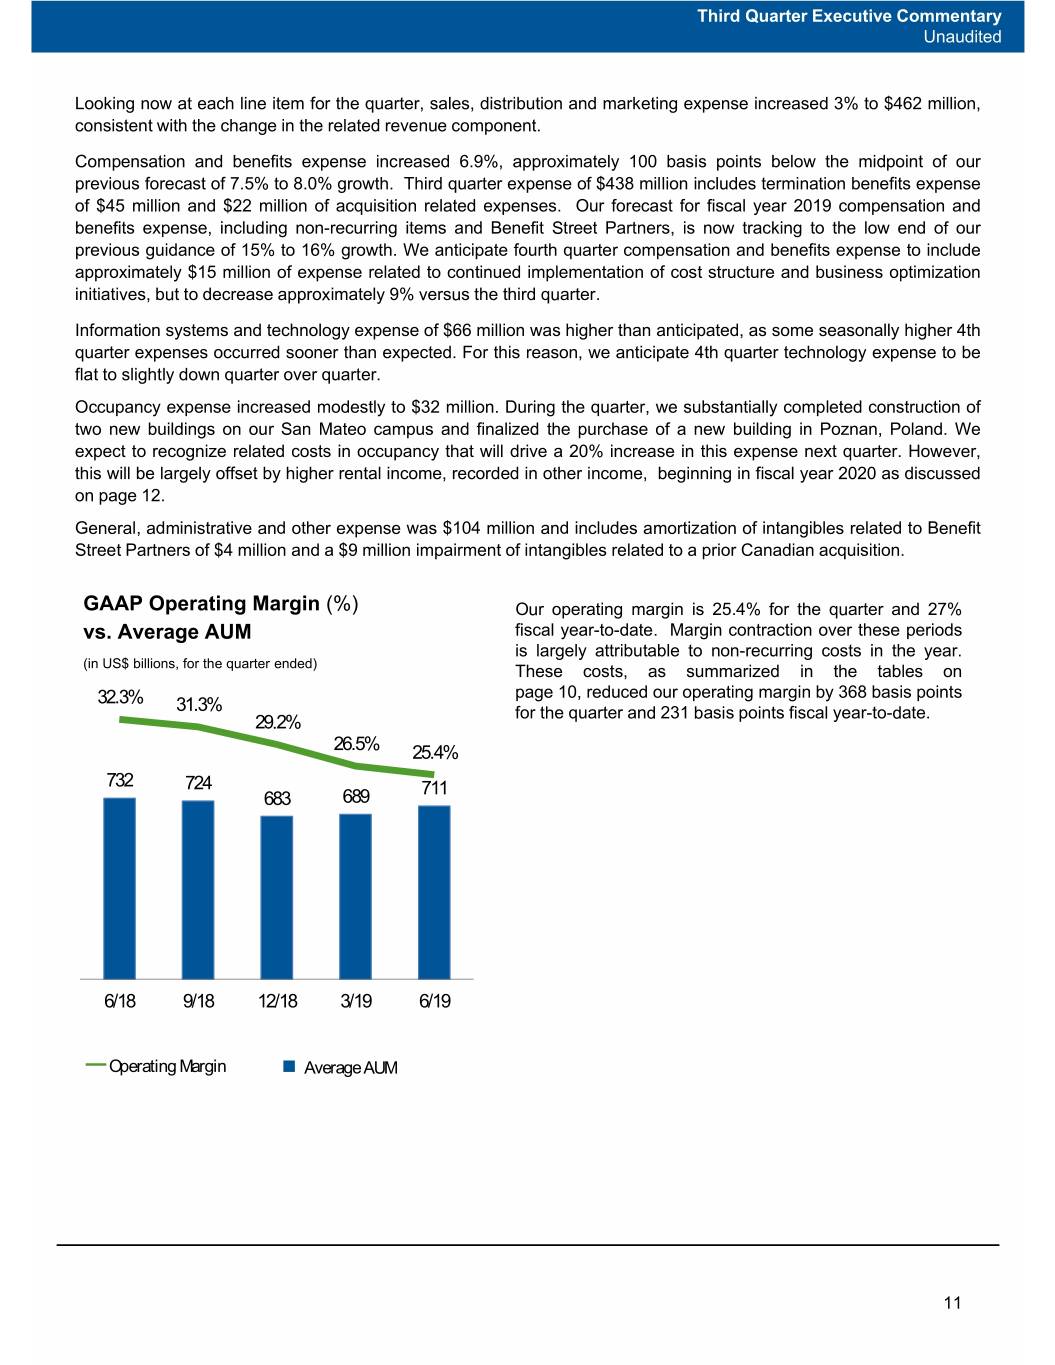
Third Quarter Executive Commentary Unaudited Looking now at each line item for the quarter, sales, distribution and marketing expense increased 3% to $462 million, consistent with the change in the related revenue component. Compensation and benefits expense increased 6.9%, approximately 100 basis points below the midpoint of our previous forecast of 7.5% to 8.0% growth. Third quarter expense of $438 million includes termination benefits expense of $45 million and $22 million of acquisition related expenses. Our forecast for fiscal year 2019 compensation and benefits expense, including non-recurring items and Benefit Street Partners, is now tracking to the low end of our previous guidance of 15% to 16% growth. We anticipate fourth quarter compensation and benefits expense to include approximately $15 million of expense related to continued implementation of cost structure and business optimization initiatives, but to decrease approximately 9% versus the third quarter. Information systems and technology expense of $66 million was higher than anticipated, as some seasonally higher 4th quarter expenses occurred sooner than expected. For this reason, we anticipate 4th quarter technology expense to be flat to slightly down quarter over quarter. Occupancy expense increased modestly to $32 million. During the quarter, we substantially completed construction of two new buildings on our San Mateo campus and finalized the purchase of a new building in Poznan, Poland. We expect to recognize related costs in occupancy that will drive a 20% increase in this expense next quarter. However, this will be largely offset by higher rental income, recorded in other income, beginning in fiscal year 2020 as discussed on page 12. General, administrative and other expense was $104 million and includes amortization of intangibles related to Benefit Street Partners of $4 million and a $9 million impairment of intangibles related to a prior Canadian acquisition. GAAP Operating Margin (%) Our operating margin is 25.4% for the quarter and 27% vs. Average AUM fiscal year-to-date. Margin contraction over these periods is largely attributable to non-recurring costs in the year. (in US$ billions, for the quarter ended) These costs, as summarized in the tables on 32.3% page 10, reduced our operating margin by 368 basis points 31.3% for the quarter and 231 basis points fiscal year-to-date. 29.2% 26.5% 25.4% 732 724 711 683 689 6/18 9/18 12/18 3/19 6/19 ━ Operating Margin Average AUM 11
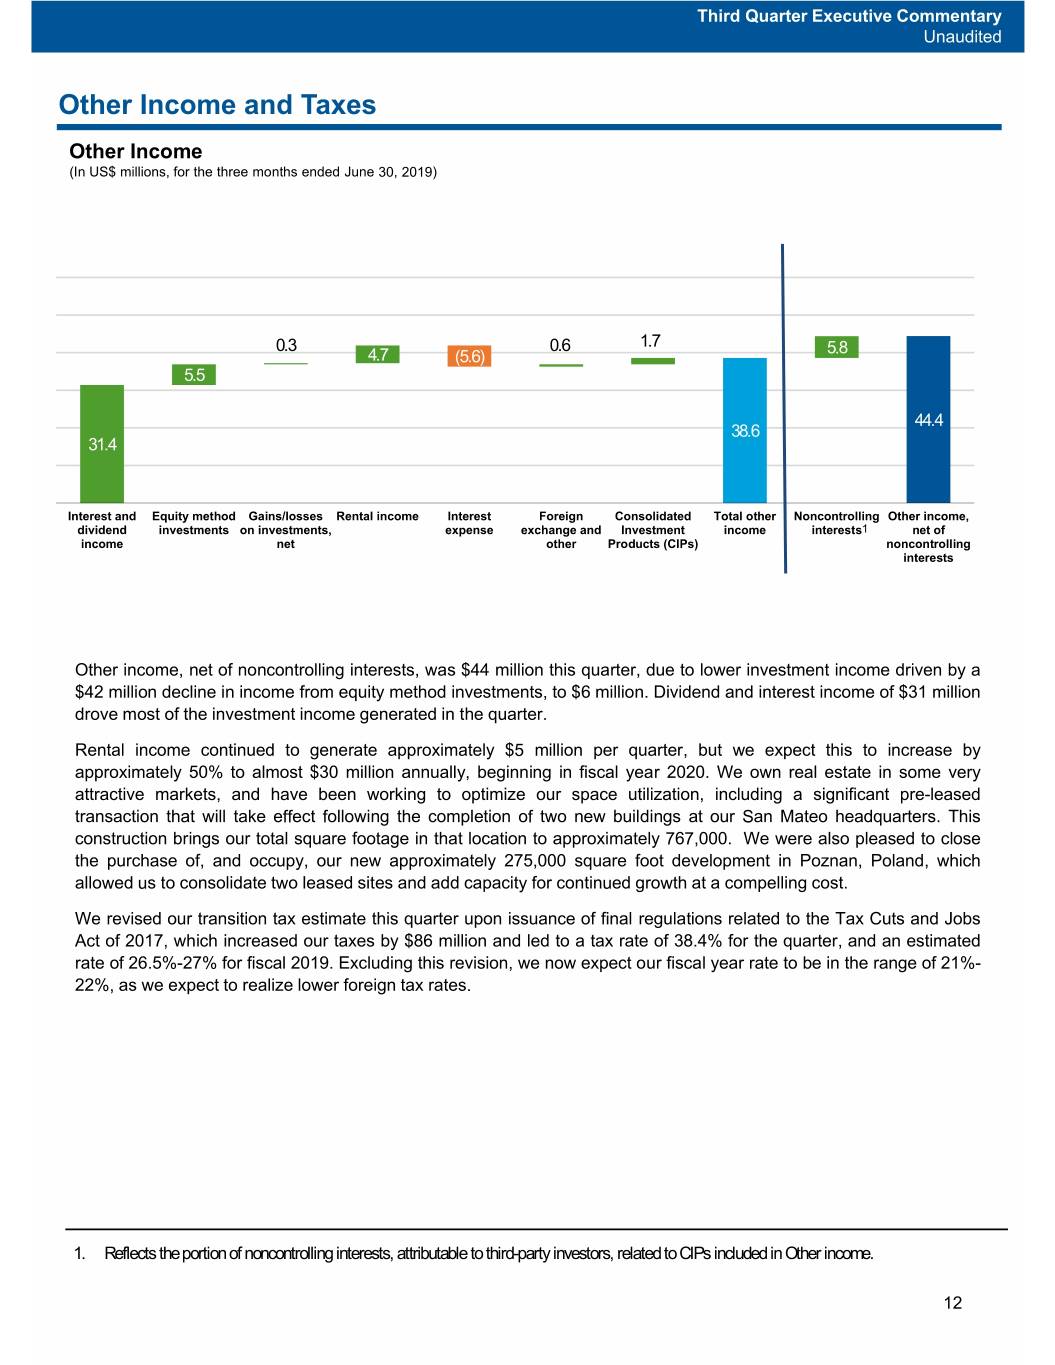
Third Quarter Executive Commentary Unaudited Other Income and Taxes Other Income (In US$ millions, for the three months ended June 30, 2019) 0.3 0.6 1.7 5.8 4.7 (5.6) 5.5 44.4 38.6 31.4 Interest and Equity method Gains/losses Rental income Interest Foreign Consolidated Total other Noncontrolling Other income, dividend investments on investments, expense exchange and Investment income interests1 net of income net other Products (CIPs) noncontrolling interests Other income, net of noncontrolling interests, was $44 million this quarter, due to lower investment income driven by a $42 million decline in income from equity method investments, to $6 million. Dividend and interest income of $31 million drove most of the investment income generated in the quarter. Rental income continued to generate approximately $5 million per quarter, but we expect this to increase by approximately 50% to almost $30 million annually, beginning in fiscal year 2020. We own real estate in some very attractive markets, and have been working to optimize our space utilization, including a significant pre-leased transaction that will take effect following the completion of two new buildings at our San Mateo headquarters. This construction brings our total square footage in that location to approximately 767,000. We were also pleased to close the purchase of, and occupy, our new approximately 275,000 square foot development in Poznan, Poland, which allowed us to consolidate two leased sites and add capacity for continued growth at a compelling cost. We revised our transition tax estimate this quarter upon issuance of final regulations related to the Tax Cuts and Jobs Act of 2017, which increased our taxes by $86 million and led to a tax rate of 38.4% for the quarter, and an estimated rate of 26.5%-27% for fiscal 2019. Excluding this revision, we now expect ourfiscalyearratetobeintherangeof21%- 22%, as we expect to realize lower foreign tax rates. 1. Reflects the portion of noncontrolling interests, attributable to third-party investors, related to CIPs included in Other income. 12
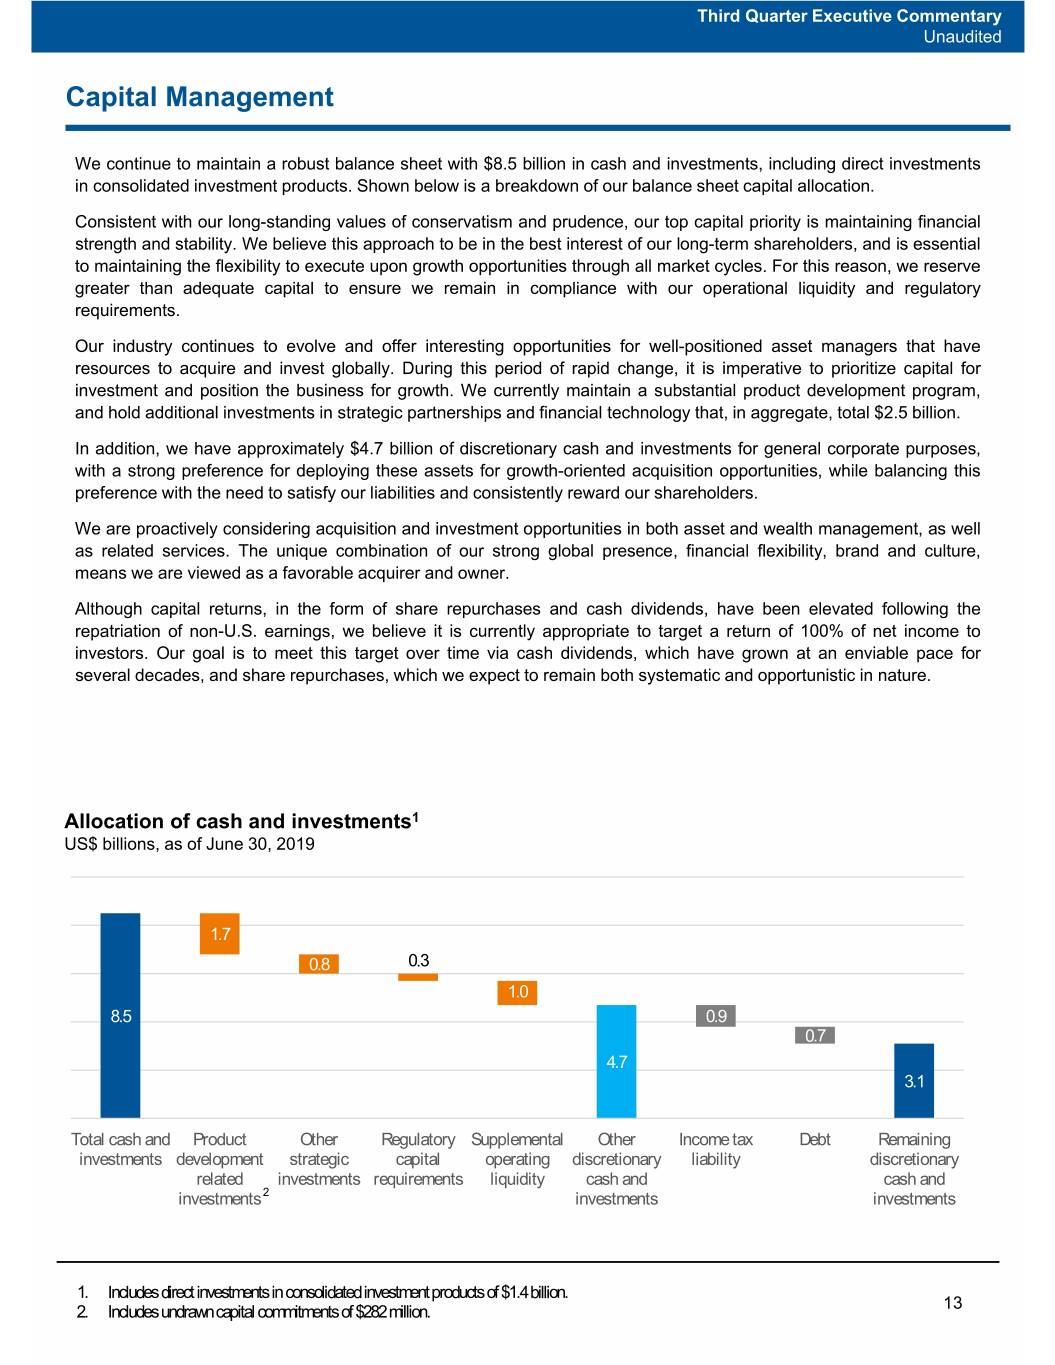
Third Quarter Executive Commentary Unaudited Capital Management We continue to maintain a robust balance sheet with $8.5 billion in cash and investments, including direct investments in consolidated investment products. Shown below is a breakdown of our balance sheet capital allocation. Consistent with our long-standing values of conservatism and prudence, our top capital priority is maintaining financial strength and stability. We believe this approach to be in the best interest of our long-term shareholders, and is essential to maintaining the flexibility to execute upon growth opportunities through all market cycles. For this reason, we reserve greater than adequate capital to ensure we remain in compliance with our operational liquidity and regulatory requirements. Our industry continues to evolve and offer interesting opportunities for well-positioned asset managers that have resources to acquire and invest globally. During this period of rapid change, it is imperative to prioritize capital for investment and position the business for growth. We currently maintain a substantial product development program, and hold additional investments in strategic partnerships and financial technology that, in aggregate, total $2.5 billion. In addition, we have approximately $4.7 billion of discretionary cash and investments for general corporate purposes, with a strong preference for deploying these assets for growth-oriented acquisition opportunities, while balancing this preference with the need to satisfy our liabilities and consistently reward our shareholders. We are proactively considering acquisition and investment opportunities in both asset and wealth management, as well as related services. The unique combination of our strong global presence, financial flexibility, brand and culture, means we are viewed as a favorable acquirer and owner. Although capital returns, in the form of share repurchases and cash dividends, have been elevated following the repatriation of non-U.S. earnings, we believe it is currently appropriate to target a return of 100% of net income to investors. Our goal is to meet this target over time via cash dividends, which have grown at an enviable pace for several decades, and share repurchases, which we expect to remain both systematic and opportunistic in nature. Allocation of cash and investments1 US$ billions, as of June 30, 2019 1.7 0.8 0.3 1.0 8.5 0.9 0.7 4.7 3.1 Total cash and Product Other Regulatory Supplemental Other Income tax Debt Remaining investments development strategic capital operating discretionary liability discretionary related investments requirements liquidity cash and cash and investments 2 investments investments 1. Includes direct investments in consolidated investment products of $1.4 billion. 13 2. Includes undrawn capital commitments of $282 million.
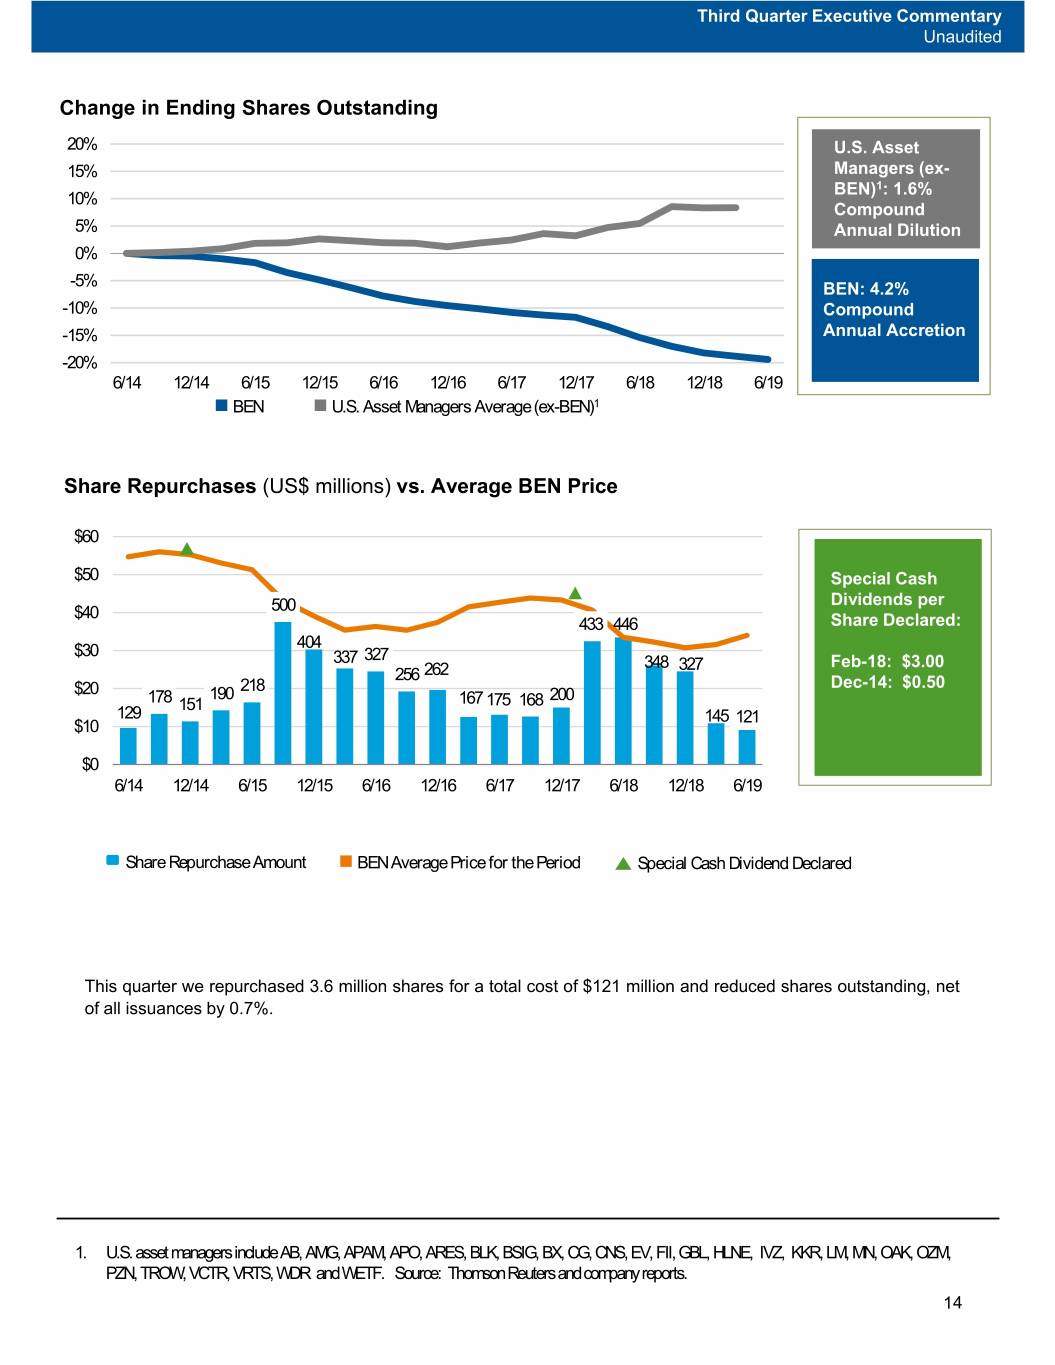
Third Quarter Executive Commentary Unaudited Change in Ending Shares Outstanding 20% U.S. Asset 15% Managers (ex- BEN)1: 1.6% 10% Compound 5% Annual Dilution 0% -5% BEN: 4.2% -10% Compound -15% Annual Accretion -20% 6/14 12/14 6/15 12/15 6/16 12/16 6/17 12/17 6/18 12/18 6/19 BEN U.S. Asset Managers Average (ex-BEN)1 Share Repurchases (US$ millions) vs. Average BEN Price $60 $50 Special Cash Dividends per $40 500 433 446 Share Declared: 404 $30 327 337 348 327 Feb-18: $3.00 256 262 218 Dec-14: $0.50 $20 190 200 178 151 167 175 168 129 145 121 $10 $0 6/14 12/14 6/15 12/15 6/16 12/16 6/17 12/17 6/18 12/18 6/19 Share Repurchase Amount BEN Average Price for the Period Special Cash Dividend Declared This quarter we repurchased 3.6 million shares for a total cost of $121 million and reduced shares outstanding, net of all issuances by 0.7%. 1. U.S. asset managers include AB, AMG, APAM, APO, ARES, BLK, BSIG, BX, CG, CNS, EV, FII, GBL, HLNE, IVZ, KKR, LM, MN, OAK, OZM, PZN, TROW, VCTR, VRTS, WDR and WETF. Source: Thomson Reuters and company reports. 14
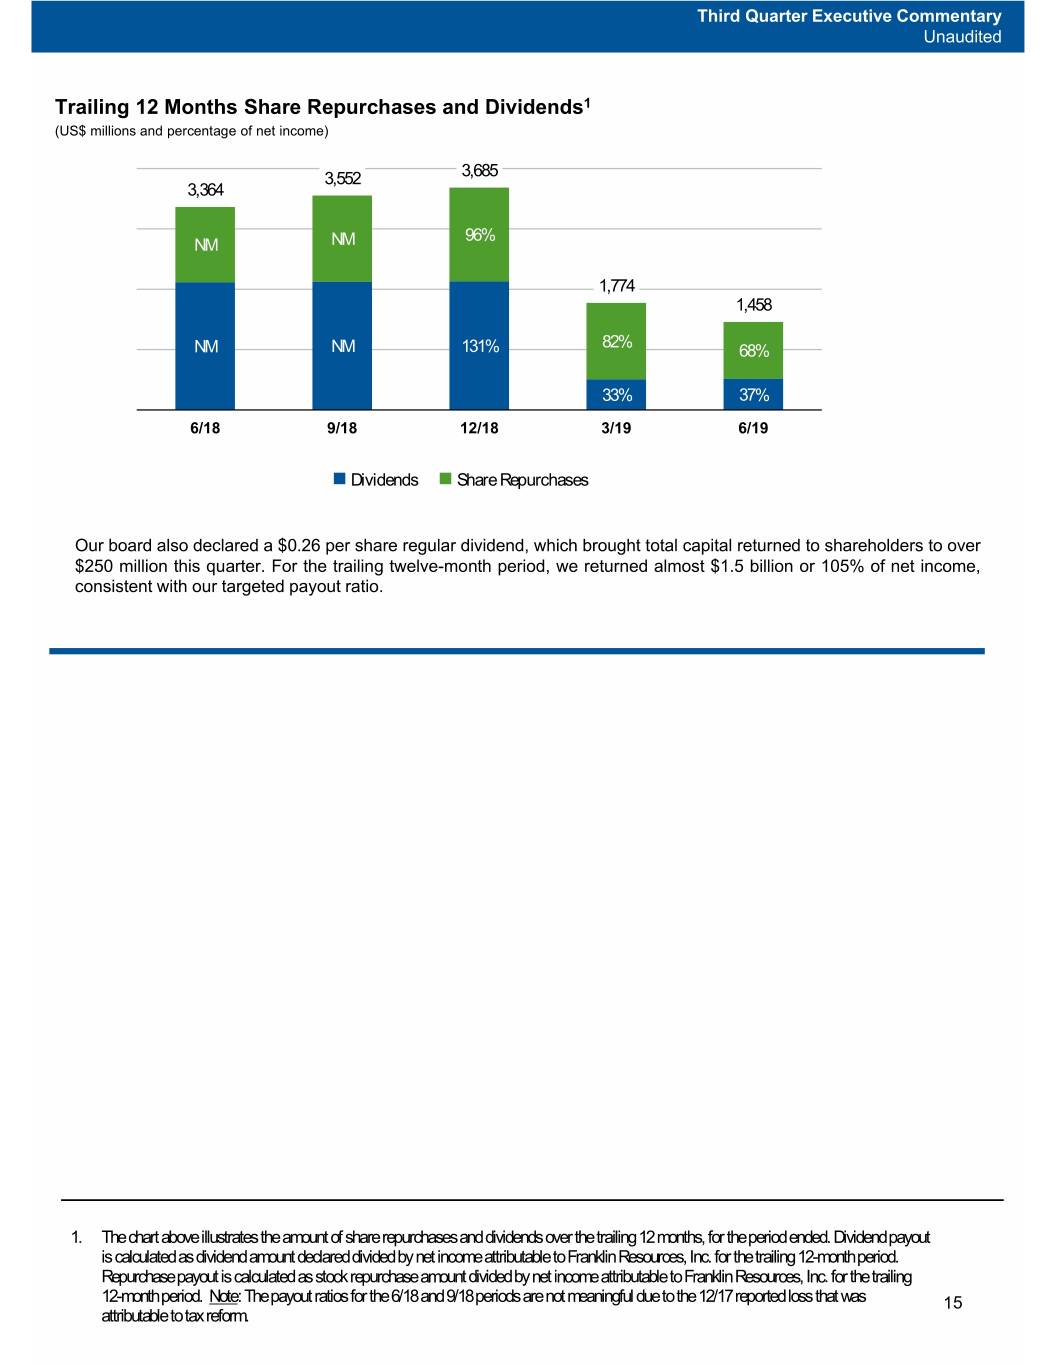
Third Quarter Executive Commentary Unaudited Trailing 12 Months Share Repurchases and Dividends1 (US$ millions and percentage of net income) 3,552 3,685 3,364 96% NM NM 1,774 1,458 82% NM NM 131% 68% 33% 37% 6/18 9/18 12/18 3/19 6/19 Dividends Share Repurchases Our board also declared a $0.26 per share regular dividend, which brought total capital returned to shareholders to over $250 million this quarter. For the trailing twelve-month period, we returned almost $1.5 billion or 105% of net income, consistent with our targeted payout ratio. 1. The chart above illustrates the amount of share repurchases and dividends over the trailing 12 months, for the period ended. Dividend payout is calculated as dividend amount declared divided by net income attributable to Franklin Resources, Inc. for the trailing 12-month period. Repurchase payout is calculated as stock repurchase amount divided by net income attributable to Franklin Resources, Inc. for the trailing 12-month period. Note: The payout ratios for the 6/18 and 9/18 periods are not meaningful due to the 12/17 reported loss that was 15 attributable to tax reform.
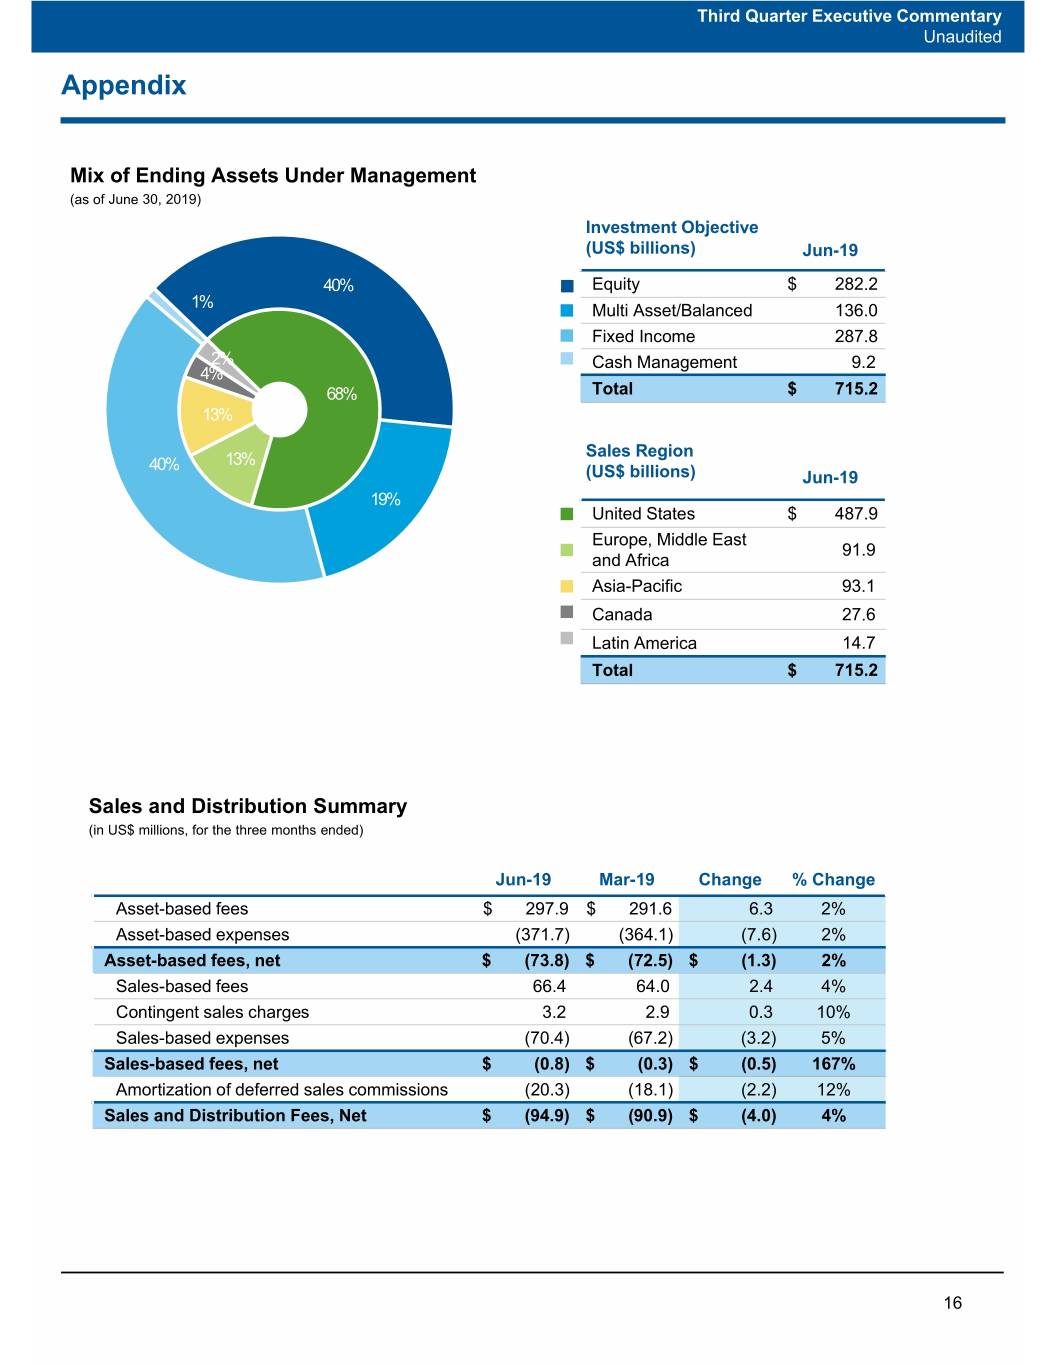
Third Quarter Executive Commentary Unaudited Appendix Mix of Ending Assets Under Management (as of June 30, 2019) Investment Objective (US$ billions) Jun-19 40% Equity $ 282.2 1% Multi Asset/Balanced 136.0 Fixed Income 287.8 2% Cash Management 9.2 4% 68% Total $ 715.2 13% Sales Region 40% 13% (US$ billions) Jun-19 19% United States $ 487.9 Europe, Middle East 91.9 and Africa Asia-Pacific 93.1 Canada 27.6 Latin America 14.7 Total $ 715.2 Sales and Distribution Summary (in US$ millions, for the three months ended) Jun-19 Mar-19 Change % Change Asset-based fees $ 297.9 $ 291.6 6.3 2% Asset-based expenses (371.7) (364.1) (7.6) 2% Asset-based fees, net $ (73.8) $ (72.5) $ (1.3)2% Sales-based fees 66.4 64.0 2.4 4% Contingent sales charges 3.2 2.9 0.3 10% Sales-based expenses (70.4) (67.2) (3.2) 5% Sales-based fees, net $ (0.8) $ (0.3) $ (0.5) 167% Amortization of deferred sales commissions (20.3) (18.1) (2.2) 12% Sales and Distribution Fees, Net $ (94.9) $ (90.9) $ (4.0) 4% 16
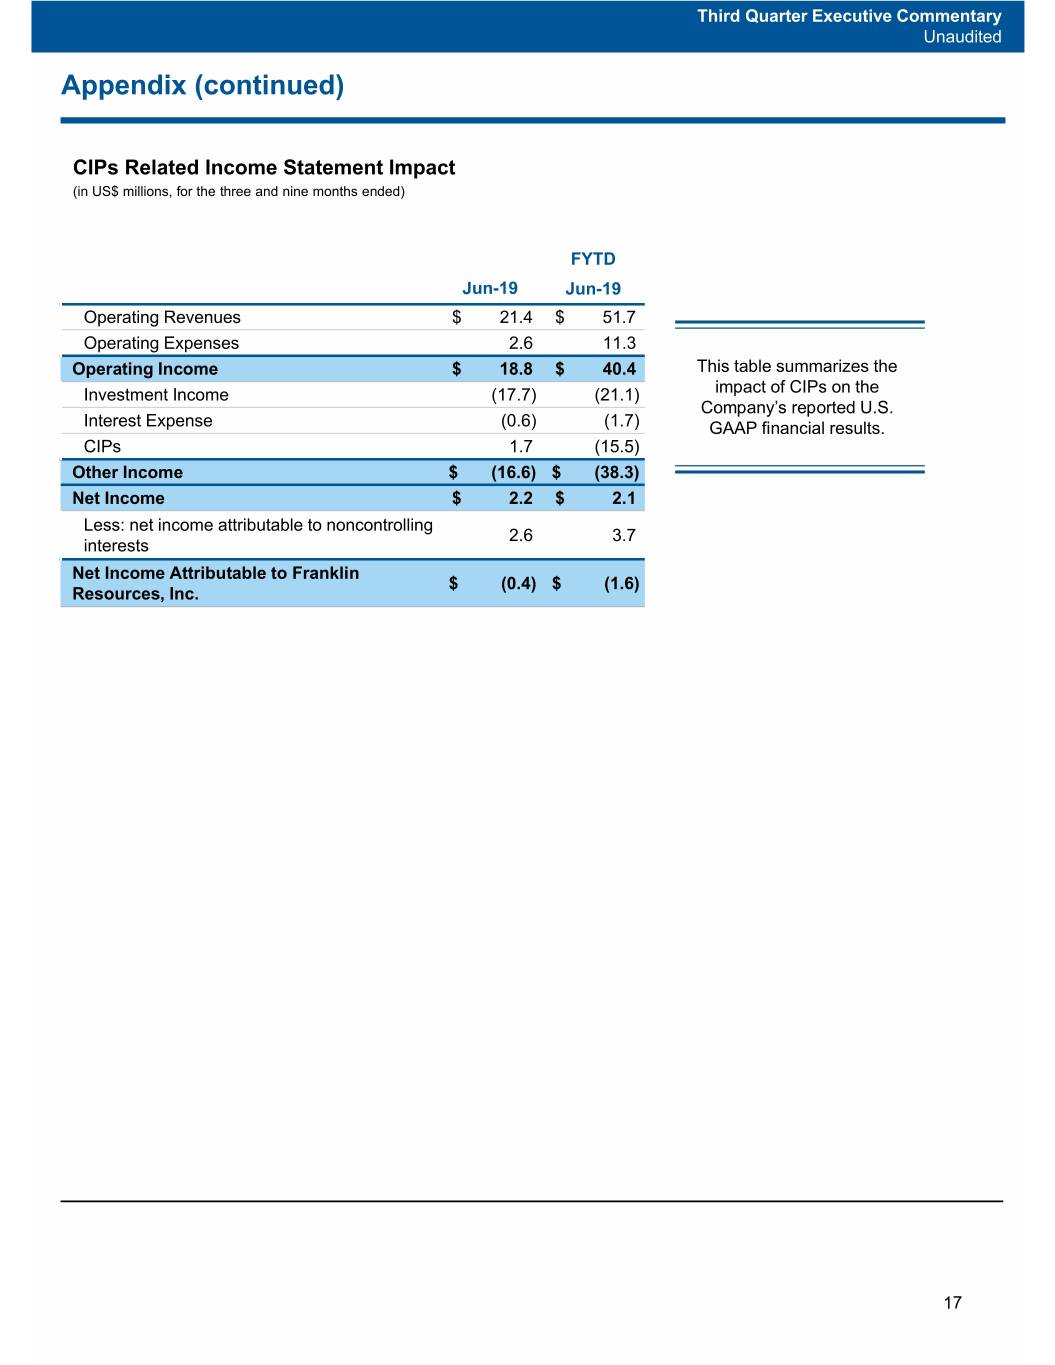
Third Quarter Executive Commentary Unaudited Appendix (continued) CIPs Related Income Statement Impact (in US$ millions, for the three and nine months ended) FYTD Jun-19 Jun-19 Operating Revenues $ 21.4 $ 51.7 Operating Expenses 2.6 11.3 Operating Income $ 18.8 $ 40.4 This table summarizes the Investment Income (17.7) (21.1) impact of CIPs on the Company’s reported U.S. Interest Expense (0.6) (1.7) GAAP financial results. CIPs 1.7 (15.5) Other Income $ (16.6) $ (38.3) Net Income $ 2.2 $ 2.1 Less: net income attributable to noncontrolling 2.6 3.7 interests Net Income Attributable to Franklin $ (0.4) $ (1.6) Resources, Inc. 17
Forward-Looking Statements Statements in this commentary regarding Franklin Resources, Inc. (“Franklin”) and its subsidiaries, which are not historical facts, are "forward-looking statements" within the meaning of the U.S. Private Securities Litigation Reform Act of 1995. When used in this commentary, words or phrases generally written in the future tense and/or preceded by words such as “will,” “may,” “could,” “expect,” “believe,” “anticipate,” “intend,” “plan,” “seek,” “estimate” or other similar words are forward-looking statements. Forward-looking statements involve a number of known and unknown risks, uncertainties and other important factors, some of which are listed below, that could cause actual results and outcomes to differ materially from any future results or outcomes expressed or implied by such forward-looking statements. While forward-looking statements are our best prediction at the time that they are made, you should not rely on them and are cautioned against doing so. Forward-looking statements are based on our current expectations and assumptions regarding our business, the economy and other future conditions. Because forward-looking statements relate to the future, they are subject to inherent uncertainties, risks and changes in circumstances that are difficult to predict. They are neither statements of historical fact nor guarantees or assurances of future performance. These and other risks, uncertainties and other important factors are described in more detail in Franklin’s recent filings with the U.S. Securities and Exchange Commission, including, without limitation, in Risk Factors and Management’s Discussion and Analysis of Financial Condition and Results of Operations in Franklin’s Annual Report on Form 10-K for the fiscal year ended September 30, 2018 and Franklin’s subsequent Quarterly Reports on Form 10-Q: • Volatility and disruption of the capital and credit markets, and adverse changes in the global economy, may significantly affect our results of operations and may put pressure on our financial results. • The amount and mix of our assets under management (“AUM”) are subject to significant fluctuations. • We are subject to extensive, complex, overlapping and frequently changing rules, regulations, policies, and legal interpretations. • Global regulatory and legislative actions and reforms have made the regulatory environment in which we operate more costly and future actions and reforms could adversely impact our financial condition and results of operations. • Failure to comply with the laws, rules or regulations in any of the jurisdictions in which we operate could result in substantial harm to our reputation and results of operations. • Changes in tax laws or exposure to additional income tax liabilities could have a material impact on our financial condition, results of operations and liquidity. • Any significant limitation, failure or security breach of our information and cyber security infrastructure, software applications, technology or other systems that are critical to our operations could disrupt our business and harm our operations and reputation. • Our contractual obligations may subject us to indemnification costs and liability to third parties. • Our business operations are complex and a failure to properly perform operational tasks or the misrepresentation of our services and products, or the termination of investment management agreements representing a significant portion of our AUM, could have an adverse effect on our revenues and income. • We face risks, and corresponding potential costs and expenses, associated with conducting operations and growing our business in numerous countries. • We depend on key personnel and our financial performance could be negatively affected by the loss of their services. • Strong competition from numerous and sometimes larger companies with competing offerings and products could limit or reduce sales of our products, potentially resulting in a decline in our market share, revenues and income. • Changes in the third-party distribution and sales channels on which we depend could reduce our income and hinder our growth. • Our increasing focus on international markets as a source of investments and sales of our products subjects us to increased exchange rate and market-specific political, economic or other risks that may adversely impact our revenues and income generated overseas. • Harm to our reputation or poor investment performance of our products could reduce the level of our AUM or affect our sales, and negatively impact our revenues and income. • Our future results are dependent upon maintaining an appropriate level of expenses, which is subject to fluctuation. • Our ability to successfully manage and grow our business can be impeded by systems and other technological limitations. • Our inability to successfully recover should we experience a disaster or other business continuity problem could cause material financial loss, loss of human capital, regulatory actions, reputational harm, or legal liability. 18
Forward-Looking Statements (continued) • Regulatory and governmental examinations and/or investigations, litigation and the legal risks associated with our business, could adversely impact our AUM, increase costs and negatively impact our profitability and/or our future financial results. • Our ability to meet cash needs depends upon certain factors, including the market value of our assets, operating cash flows and our perceived creditworthiness. • We are dependent on the earnings of our subsidiaries. Any forward-looking statement made by us in this commentary speaks only as of the date on which it is made. Factors or events that could cause our actual results to differ may emerge from time to time, and it is not possible for us to predict all of them. We undertake no obligation to publicly update any forward-looking statement, whether as a result of new information, future developments or otherwise, except as may be required by law. The information in this commentary is provided solely in connection with this commentary, and is not directed toward existing or potential investment advisory clients or fund shareholders. Investor Relations Contact 1 (650) 312‐4091 Lucy Nicholls 1 (916) 463‐4357 19