FRANKLIN RESOURCES, INC. Executive Earnings Commentary First Quarter Results January 30, 2020 Highlights Exhibit 99.2 Greg Johnson Firm-wide relative investment performance was little Chairman of the Board changed this quarter, though two large strategies Chief Executive Officer experienced challenges that weighed on category averages. U.S. fixed income funds sustained recent momentum with a Matthew Nicholls fourth consecutive quarter of net inflows into our tax-free Executive Vice President strategies, and sales into our taxable strategies continued to Chief Financial Officer improve, increasing 50% versus the same quarter a year ago. Financial results benefited from expense discipline and Jennifer Johnson investment gains as net income increased 14% to $351 President million, or $0.70 per share. Chief Operating Officer The company extended its 38-year track record of annual dividend growth by increasing the regular quarterly cash dividend by 4% to $0.27 per share in December. The company also repurchased 4.6 million shares in the quarter, more than offsetting issuance related to employee incentive plans. Fiduciary Trust Company International (“Fiduciary Trust”) Contents Page(s) announced pending acquisitions of Athena Capital Advisors Investment Performance 2 and Pennsylvania Trust, which will expand its assets under management by approximately 50%. Assets Under Management 3-5 and Flows Flows by Investment 6-8 Conference Call Details: Objective Chairman and CEO Greg Johnson, Executive Vice President and CFO Financial Results 9 Matthew Nicholls, and President and COO Jennifer Johnson will lead a live teleconference at 11:00 a.m. Eastern Time to answer questions of a Operating Revenues and material nature. Access to the teleconference will be available 9-11 Expenses via investors.franklinresources.com or by dialing (877) 407-8293 in the U.S. and Canada or (201) 689-8349 internationally. A replay of the Other Income and Taxes 11 teleconference can also be accessed by calling (877) 660-6853 in the U.S. and Canada or (201) 612-7415 internationally using access code Capital Management 12-14 13697876, after 2:00 p.m. Eastern Time on January 30, 2020 through March 1, 2020. Appendix 15-16 Analysts and investors are encouraged to review the Company’s recent filings with the U.S. Securities and Exchange Commission and to contact Investor Relations at (650) 312-4091 before the live teleconference for any clarifications or questions related to the earnings release or written commentary. 1. Source: Investment Company Institute
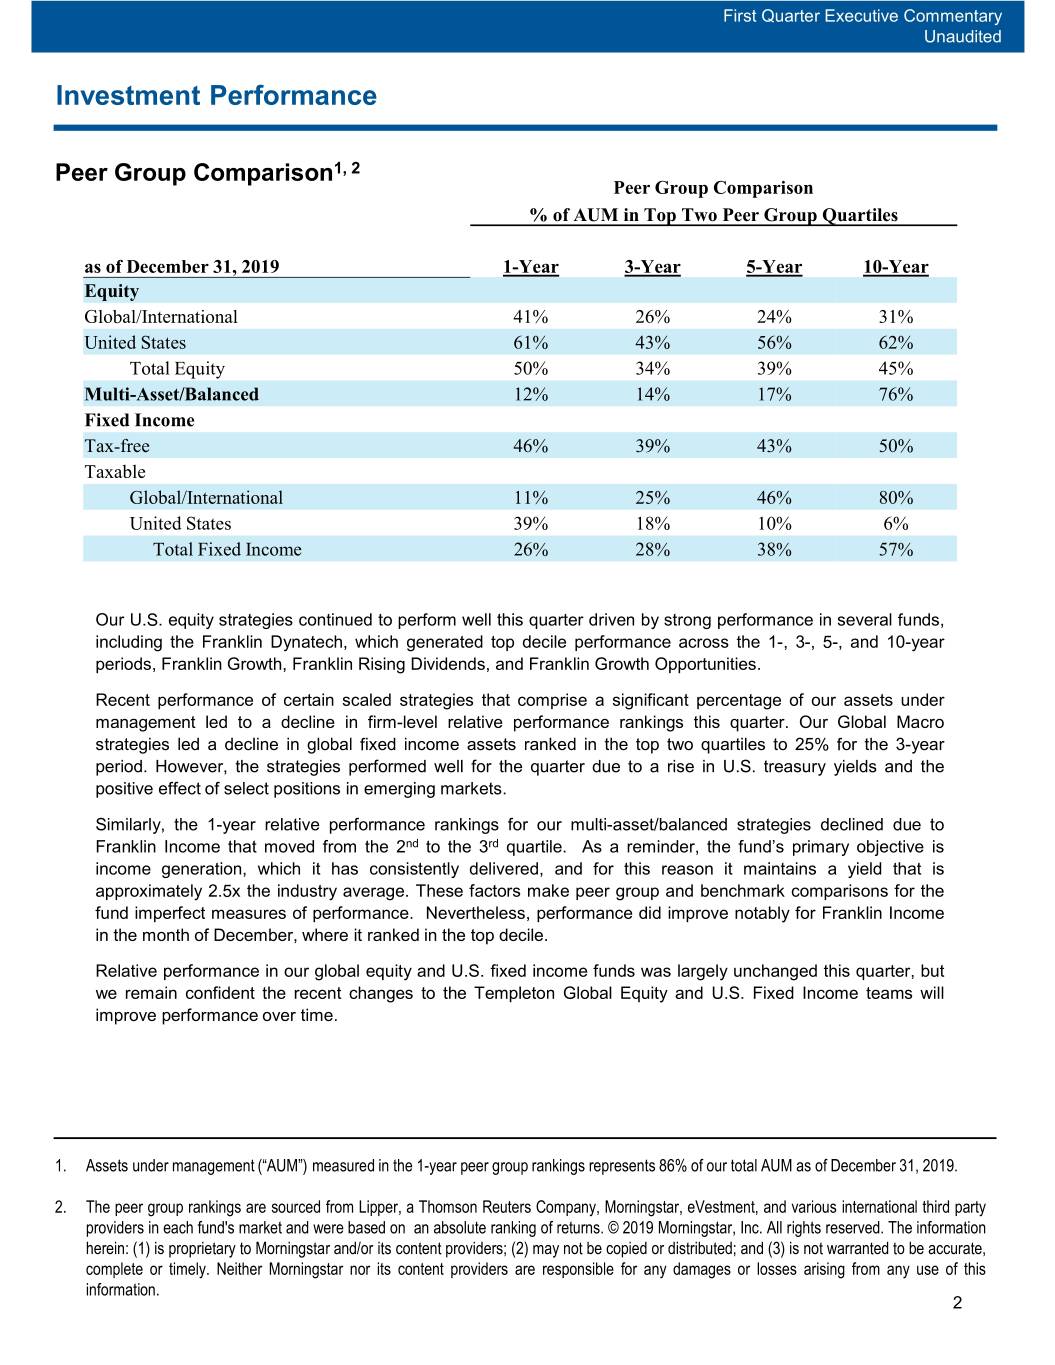
First Quarter Executive Commentary Unaudited Investment Performance Peer Group Comparison1, 2 Peer Group Comparison % of AUM in Top Two Peer Group Quartiles as of December 31, 2019 1-Year 3-Year 5-Year 10-Year Equity Global/International 41% 26% 24% 31% United States 61% 43% 56% 62% Total Equity 50% 34% 39% 45% Multi-Asset/Balanced 12% 14% 17% 76% Fixed Income Tax-free 46% 39% 43% 50% Taxable Global/International 11% 25% 46% 80% United States 39% 18% 10% 6% Total Fixed Income 26% 28% 38% 57% Our U.S. equity strategies continued to perform well this quarter driven by strong performance in several funds, including the Franklin Dynatech, which generated top decile performance across the 1-, 3-, 5-, and 10-year periods, Franklin Growth, Franklin Rising Dividends, and Franklin Growth Opportunities. Recent performance of certain scaled strategies that comprise a significant percentage of our assets under management led to a decline in firm-level relative performance rankings this quarter. Our Global Macro strategies led a decline in global fixed income assets ranked in the top two quartiles to 25% for the 3-year period. However, the strategies performed well for the quarter due to a rise in U.S. treasury yields and the positive effect of select positions in emerging markets. Similarly, the 1-year relative performance rankings for our multi-asset/balanced strategies declined due to Franklin Income that moved from the 2nd to the 3rd quartile. As a reminder, the fund’s primary objective is income generation, which it has consistently delivered, and for this reason it maintains a yield that is approximately 2.5x the industry average. These factors make peer group and benchmark comparisons for the fund imperfect measures of performance. Nevertheless, performance did improve notably for Franklin Income in the month of December, where it ranked in the top decile. Relative performance in our global equity and U.S. fixed income funds was largely unchanged this quarter, but we remain confident the recent changes to the Templeton Global Equity and U.S. Fixed Income teams will improve performance over time. 1. Assets under management(“AUM”) measured in the 1-year peer group rankings represents 86% of our total AUM as of December 31, 2019. 2. The peer group rankings are sourced from Lipper, a Thomson Reuters Company, Morningstar, eVestment, and various international third party providers in each fund's market and were based on an absolute ranking of returns. © 2019 Morningstar, Inc. All rights reserved. The information herein: (1) is proprietary to Morningstar and/or its content providers; (2) may not be copied or distributed; and (3) is not warranted to be accurate, complete or timely. Neither Morningstar nor its content providers are responsible for any damages or losses arising from any use of this information. 2
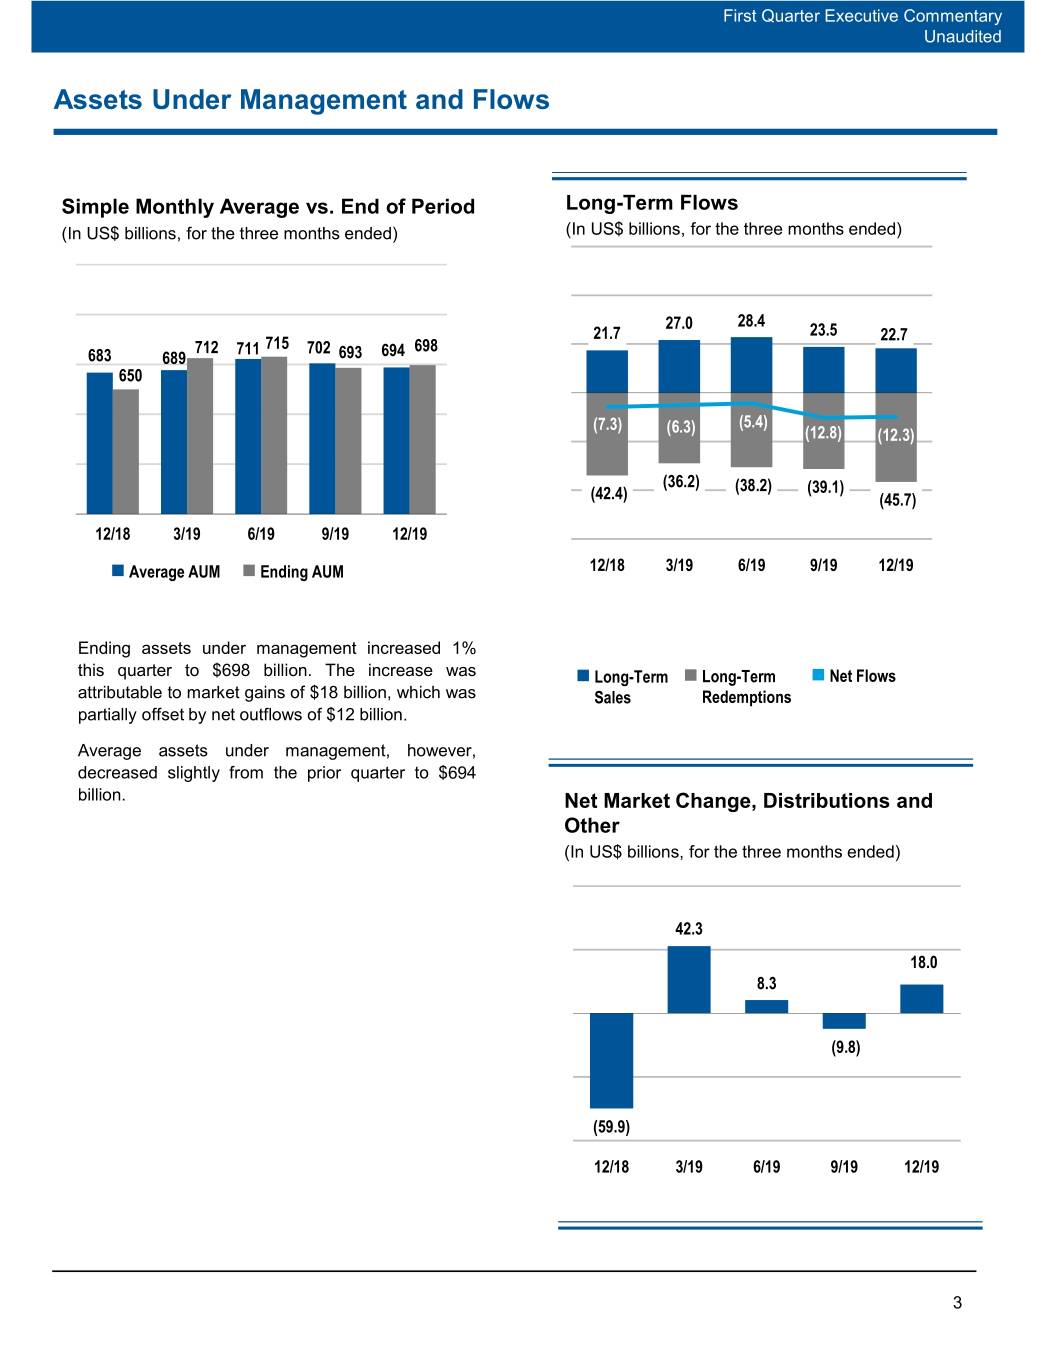
First Quarter Executive Commentary Unaudited Assets Under Management and Flows Simple Monthly Average vs. End of Period Long-Term Flows (In US$ billions, for the three months ended) (In US$ billions, for the three months ended) 27.0 28.4 21.7 23.5 22.7 712 711 715 702 698 683 689 693 694 650 (7.3) (5.4) (6.3) (12.8) (12.3) (36.2) (38.2) (39.1) (42.4) (45.7) 12/18 3/19 6/19 9/19 12/19 Average AUM Ending AUM 12/18 3/19 6/19 9/19 12/19 Ending assets under management increased 1% this quarter to $698 billion. The increase was Long-Term Long-Term Net Flows attributable to market gains of $18 billion, which was Sales Redemptions partially offset by net outflows of $12 billion. Average assets under management, however, decreased slightly from the prior quarter to $694 billion. Net Market Change, Distributions and Other (In US$ billions, for the three months ended) 42.3 18.0 8.3 (9.8) (59.9) 12/18 3/19 6/19 9/19 12/19 3
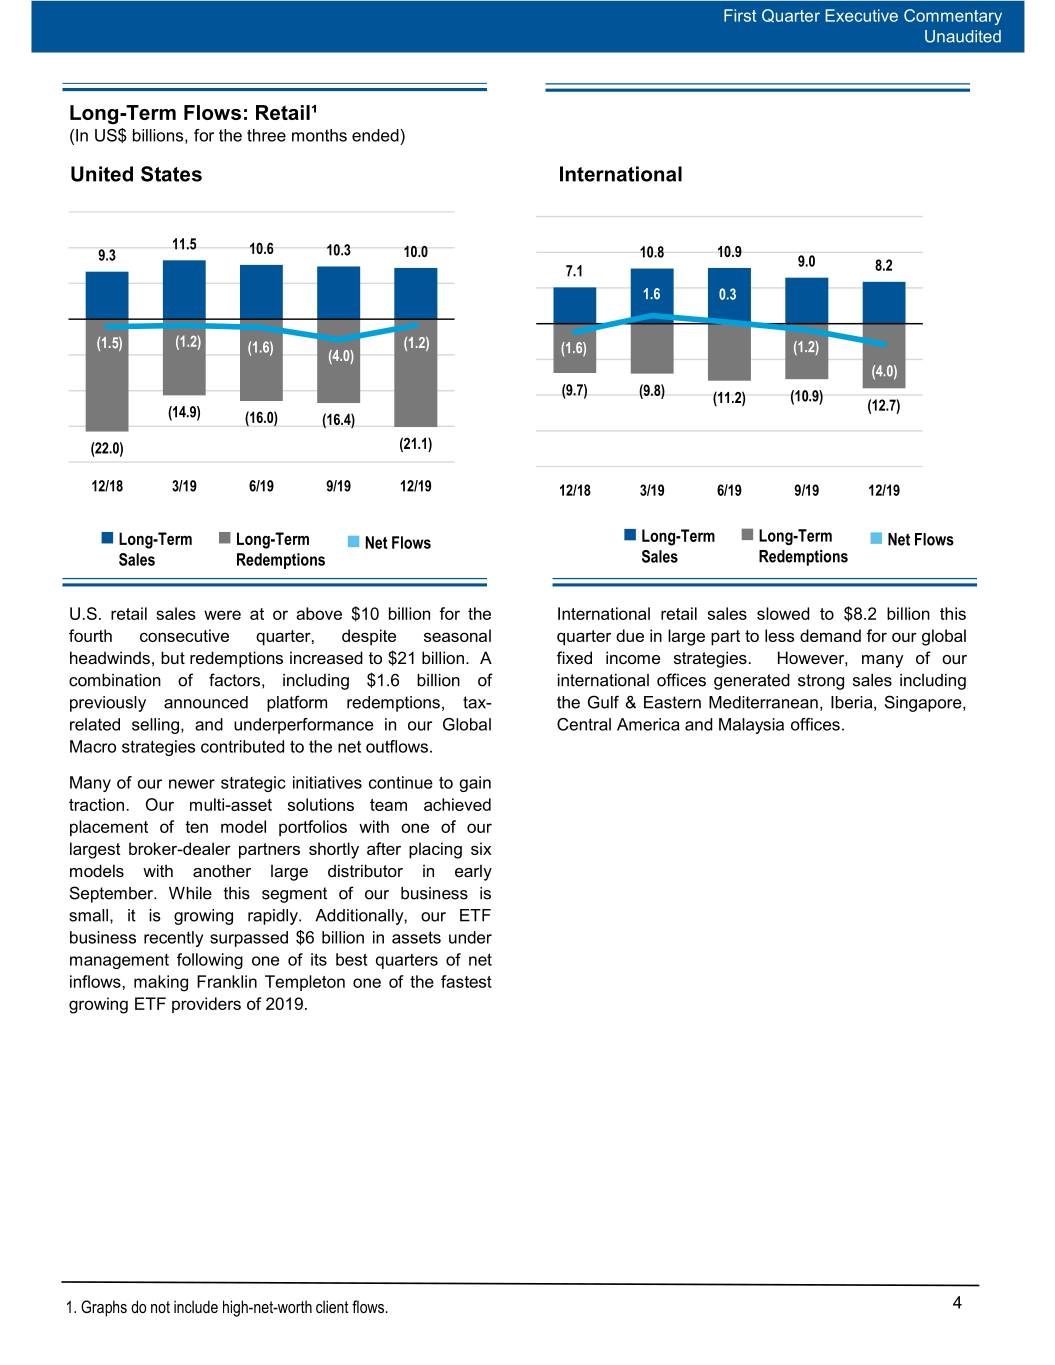
First Quarter Executive Commentary Unaudited Long-Term Flows: Retail¹ (In US$ billions, for the three months ended) United States International 11.5 10.6 10.3 10.0 10.8 10.9 9.3 9.0 7.1 8.2 1.6 0.3 (1.5) (1.2) (1.6) (1.2) (1.6) (1.2) (4.0) (4.0) (9.7) (9.8) (10.9) (11.2) (12.7) (14.9) (16.0) (16.4) (22.0) (21.1) 12/18 3/19 6/19 9/19 12/19 12/18 3/19 6/19 9/19 12/19 Long-Term Long-Term Net Flows Long-Term Long-Term Net Flows Sales Redemptions Sales Redemptions U.S. retail sales were at or above $10 billion for the International retail sales slowed to $8.2 billion this fourth consecutive quarter, despite seasonal quarter due in large part to less demand for our global headwinds, but redemptions increased to $21 billion. A fixed income strategies. However, many of our combination of factors, including $1.6 billion of international offices generated strong sales including previously announced platform redemptions, tax- the Gulf & Eastern Mediterranean, Iberia, Singapore, related selling, and underperformance in our Global Central America and Malaysia offices. Macro strategies contributed to the net outflows. Many of our newer strategic initiatives continue to gain traction. Our multi-asset solutions team achieved placement of ten model portfolios with one of our largest broker-dealer partners shortly after placing six models with another large distributor in early September. While this segment of our business is small, it is growing rapidly. Additionally, our ETF business recently surpassed $6 billion in assets under management following one of its best quarters of net inflows, making Franklin Templeton one of the fastest growing ETF providers of 2019. 1. Graphs do not include high-net-worth client flows. 4
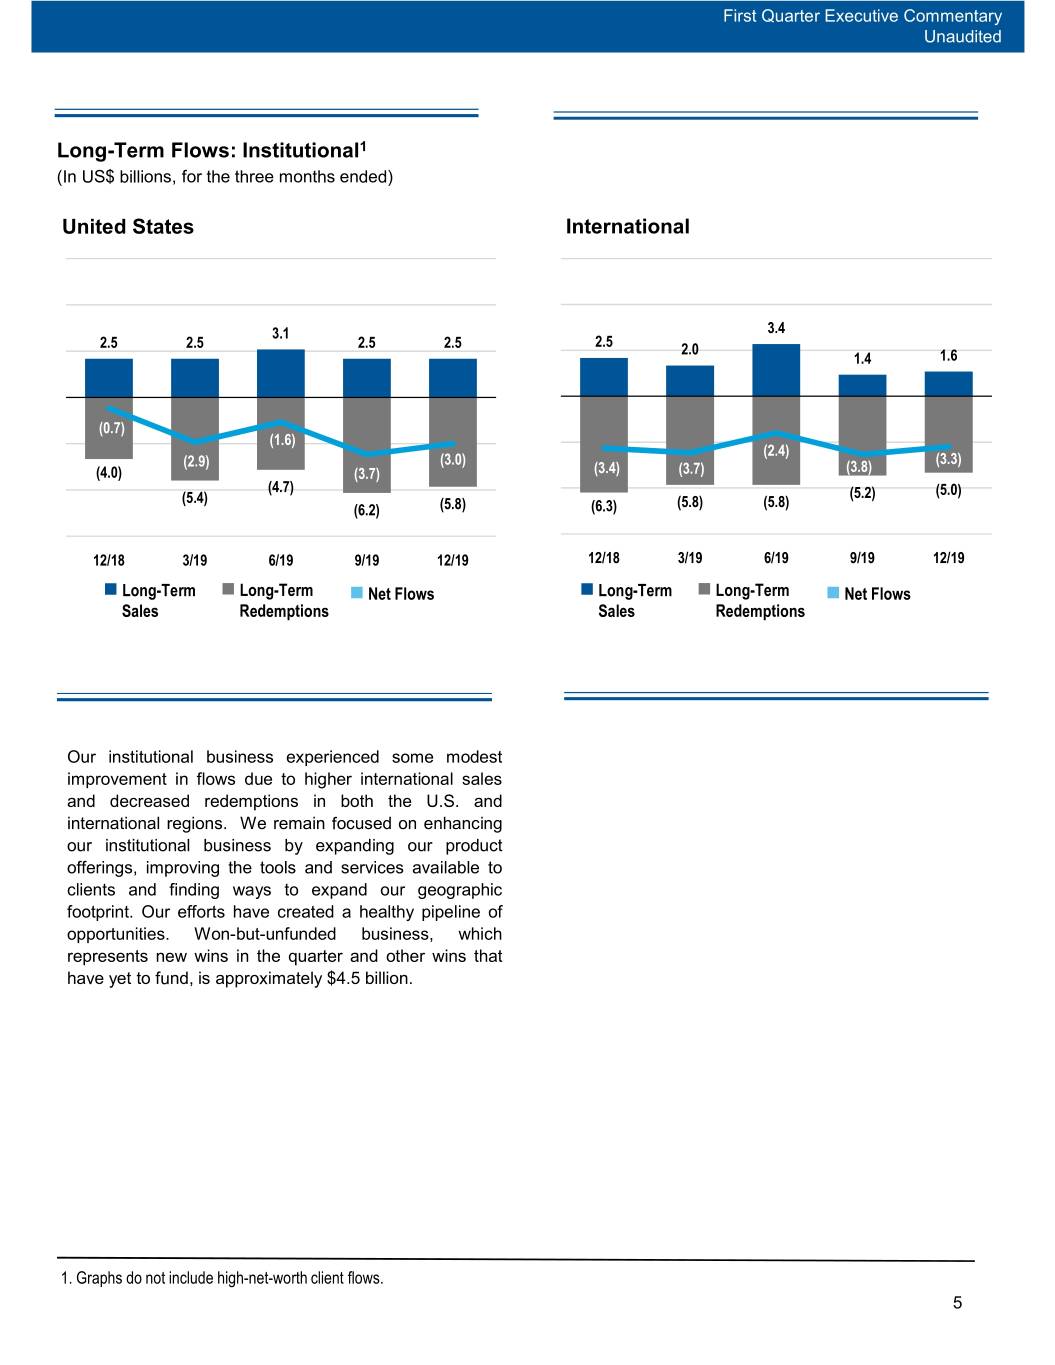
First Quarter Executive Commentary Unaudited Long-Term Flows: Institutional1 (In US$ billions, for the three months ended) United States International 3.1 3.4 2.5 2.5 2.5 2.5 2.5 2.0 1.4 1.6 (0.7) (1.6) (2.4) (2.9) (3.0) (3.3) (4.0) (3.7) (3.4) (3.7) (3.8) (4.7) (5.2) (5.0) (5.4) (5.8) (5.8) (6.2) (5.8) (6.3) 12/18 3/19 6/19 9/19 12/19 12/18 3/19 6/19 9/19 12/19 Long-Term Long-Term Net Flows Long-Term Long-Term Net Flows Sales Redemptions Sales Redemptions Our institutional business experienced some modest improvement in flows due to higher international sales and decreased redemptions in both the U.S. and international regions. We remain focused on enhancing our institutional business by expanding our product offerings, improving the tools and services available to clients and finding ways to expand our geographic footprint. Our efforts have created a healthy pipeline of opportunities. Won-but-unfunded business, which represents new wins in the quarter and other wins that have yet to fund, is approximately $4.5 billion. 1. Graphs do not include high-net-worth client flows. 5
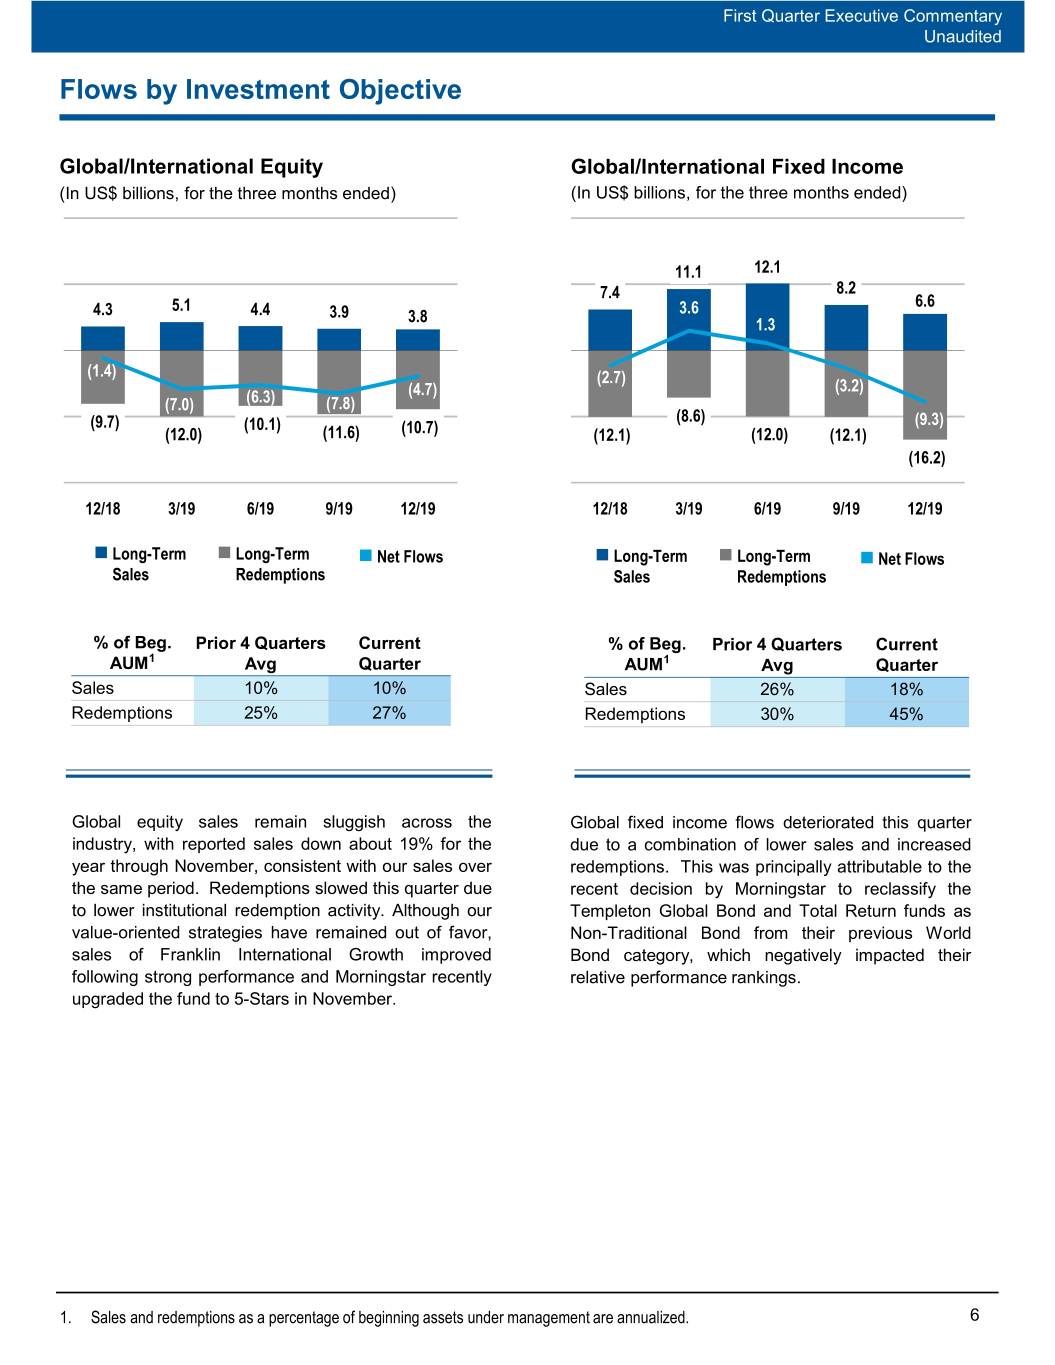
First Quarter Executive Commentary Unaudited Flows by Investment Objective Global/International Equity Global/International Fixed Income (In US$ billions, for the three months ended) (In US$ billions, for the three months ended) 11.1 12.1 8.2 7.4 6.6 4.3 5.1 4.4 3.9 3.6 3.8 1.3 (1.4) (2.7) (4.7) (3.2) (7.0) (6.3) (7.8) (9.7) (10.1) (8.6) (9.3) (12.0) (11.6) (10.7) (12.1) (12.0) (12.1) (16.2) 12/18 3/19 6/19 9/19 12/19 12/18 3/19 6/19 9/19 12/19 Long-Term Long-Term Net Flows Long-Term Long-Term Net Flows Sales Redemptions Sales Redemptions % of Beg. Prior 4 Quarters Current % of Beg. Prior 4 Quarters Current AUM1 Avg Quarter AUM1 Avg Quarter Sales 10% 10% Sales 26% 18% Redemptions 25% 27% Redemptions 30% 45% Global equity sales remain sluggish across the Global fixed income flows deteriorated this quarter industry, with reported sales down about 19% for the due to a combination of lower sales and increased year through November, consistent with our sales over redemptions. This was principally attributable to the the same period. Redemptions slowed this quarter due recent decision by Morningstar to reclassify the to lower institutional redemption activity. Although our Templeton Global Bond and Total Return funds as value-oriented strategies have remained out of favor, Non-Traditional Bond from their previous World sales of Franklin International Growth improved Bond category, which negatively impacted their following strong performance and Morningstar recently relative performance rankings. upgraded the fund to 5-Stars in November. 1. Sales and redemptions as a percentage of beginning assets under management are annualized. 6
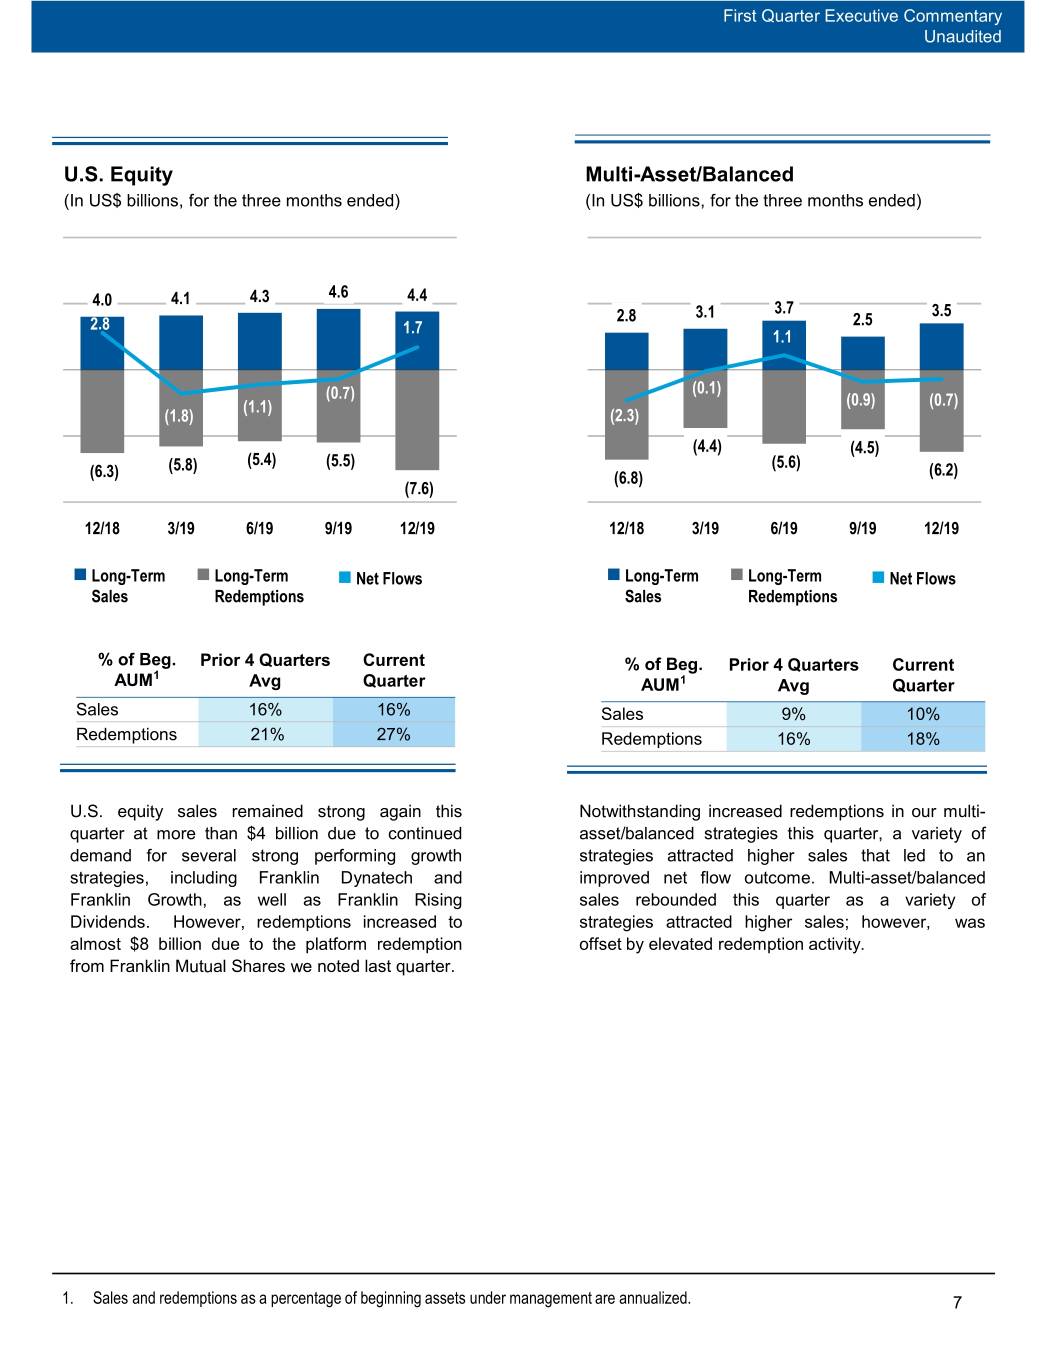
First Quarter Executive Commentary Unaudited U.S. Equity Multi-Asset/Balanced (In US$ billions, for the three months ended) (In US$ billions, for the three months ended) 4.0 4.1 4.3 4.6 4.4 2.8 3.1 3.7 3.5 2.8 1.7 2.5 1.1 (0.7) (0.1) (1.1) (0.9) (0.7) (1.8) (2.3) (4.4) (4.5) (5.8) (5.4) (5.5) (5.6) (6.3) (6.8) (6.2) (7.6) 12/18 3/19 6/19 9/19 12/19 12/18 3/19 6/19 9/19 12/19 Long-Term Long-Term Net Flows Long-Term Long-Term Net Flows Sales Redemptions Sales Redemptions % of Beg. Prior 4 Quarters Current % of Beg. Prior 4 Quarters Current 1 AUM Avg Quarter AUM1 Avg Quarter Sales 16% 16% Sales 9% 10% Redemptions 21% 27% Redemptions 16% 18% U.S. equity sales remained strong again this Notwithstanding increased redemptions in our multi- quarter at more than $4 billion due to continued asset/balanced strategies this quarter, a variety of demand for several strong performing growth strategies attracted higher sales that led to an strategies, including Franklin Dynatech and improved net flow outcome. Multi-asset/balanced Franklin Growth, as well as Franklin Rising sales rebounded this quarter as a variety of Dividends. However, redemptions increased to strategies attracted higher sales; however, was almost $8 billion due to the platform redemption offset by elevated redemption activity. from Franklin Mutual Shares we noted last quarter. 1. Sales and redemptions as a percentage of beginning assets under management are annualized. 7
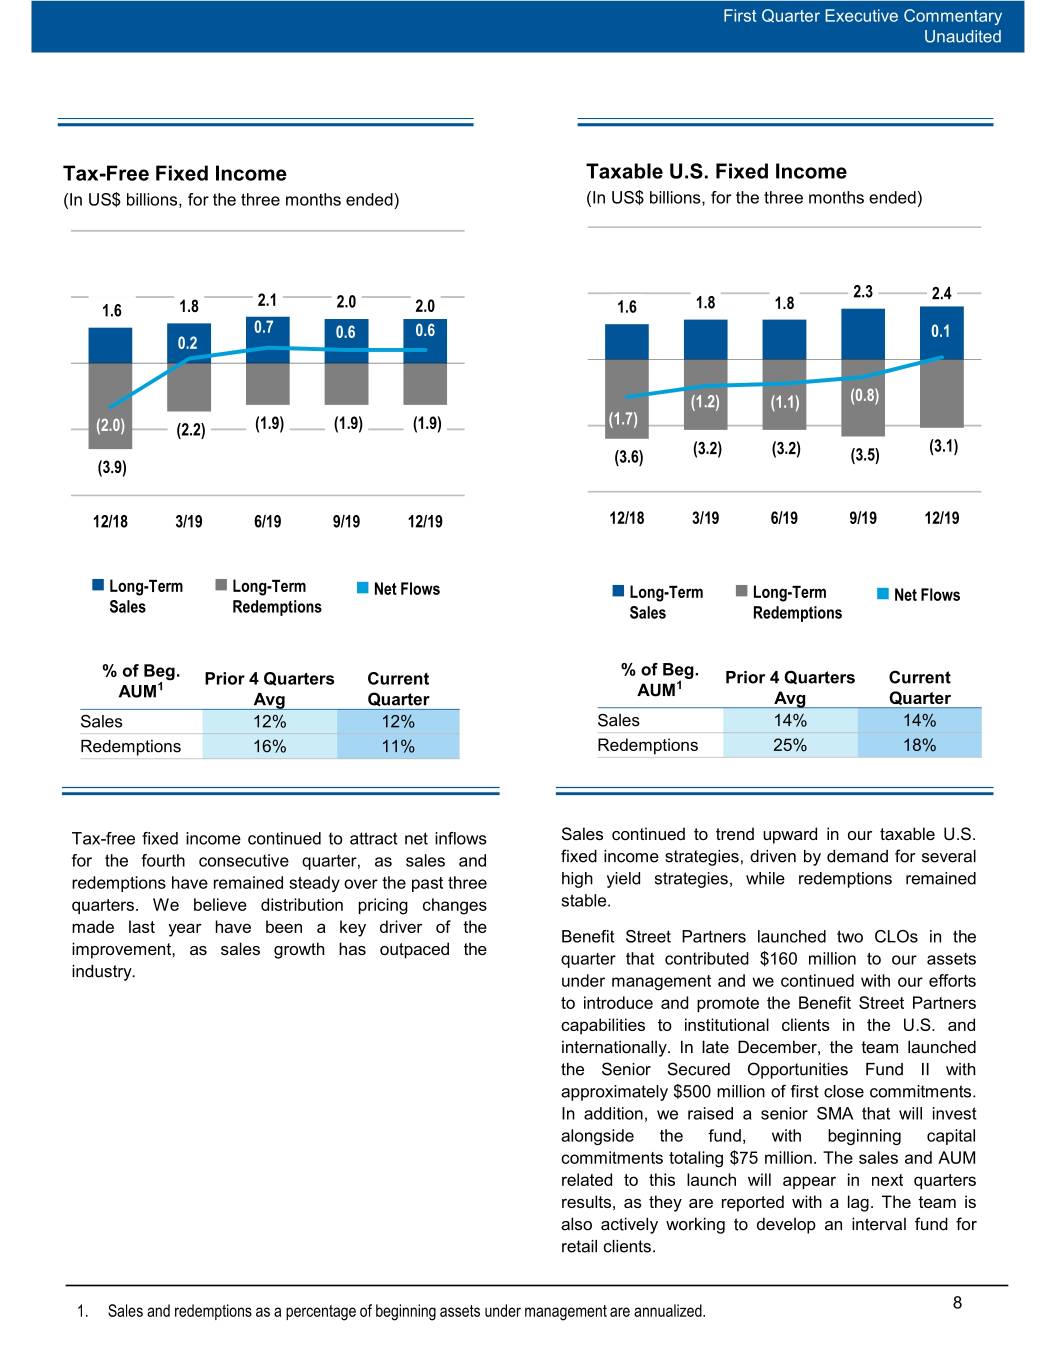
First Quarter Executive Commentary Unaudited Tax-Free Fixed Income Taxable U.S. Fixed Income (In US$ billions, for the three months ended) (In US$ billions, for the three months ended) 2.3 2.1 2.0 2.4 1.6 1.8 2.0 1.6 1.8 1.8 0.7 0.6 0.6 0.1 0.2 (1.2) (1.1) (0.8) (1.7) (2.0) (2.2) (1.9) (1.9) (1.9) (3.2) (3.2) (3.1) (3.6) (3.5) (3.9) 12/18 3/19 6/19 9/19 12/19 12/18 3/19 6/19 9/19 12/19 Long-Term Long-Term Net Flows Long-Term Long-Term Net Flows Sales Redemptions Sales Redemptions % of Beg. % of Beg. Prior 4 Quarters Current Prior 4 Quarters Current 1 AUM1 AUM Avg Quarter Avg Quarter Sales 12% 12% Sales 14% 14% Redemptions 16% 11% Redemptions 25% 18% Tax-free fixed income continued to attract net inflows Sales continued to trend upward in our taxable U.S. for the fourth consecutive quarter, as sales and fixed income strategies, driven by demand for several redemptions have remained steady over the past three high yield strategies, while redemptions remained quarters. We believe distribution pricing changes stable. made last year have been a key driver of the Benefit Street Partners launched two CLOs in the improvement, as sales growth has outpaced the quarter that contributed $160 million to our assets industry. under management and we continued with our efforts to introduce and promote the Benefit Street Partners capabilities to institutional clients in the U.S. and internationally. In late December, the team launched the Senior Secured Opportunities Fund II with approximately $500 million of first close commitments. In addition, we raised a senior SMA that will invest alongside the fund, with beginning capital commitments totaling $75 million. The sales and AUM related to this launch will appear in next quarters results, as they are reported with a lag. The team is also actively working to develop an interval fund for retail clients. 1. Sales and redemptions as a percentage of beginning assets under management are annualized. 8
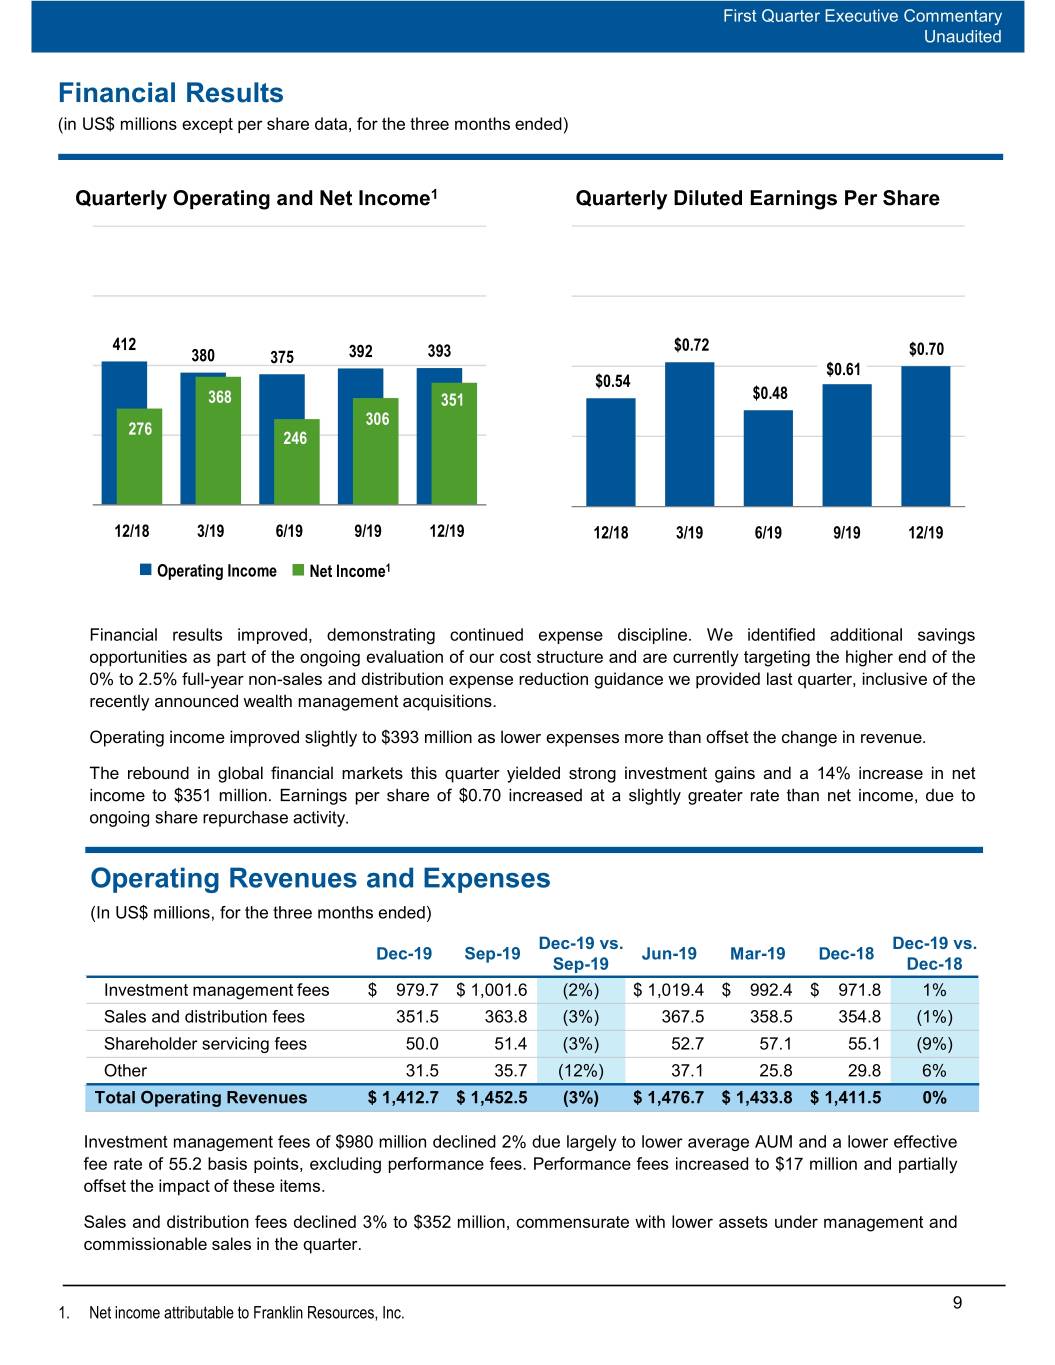
First Quarter Executive Commentary Unaudited Financial Results (in US$ millions except per share data, for the three months ended) Quarterly Operating and Net Income1 Quarterly Diluted Earnings Per Share 412 $0.72 380 375 392 393 $0.70 $0.61 $0.54 368 351 $0.48 306 276 246 12/18 3/19 6/19 9/19 12/19 12/18 3/19 6/19 9/19 12/19 Operating Income Net Income1 Financial results improved, demonstrating continued expense discipline. We identified additional savings opportunities as part of the ongoing evaluation of our cost structure and are currently targeting the higher end of the 0% to 2.5% full-year non-sales and distribution expense reduction guidance we provided last quarter, inclusive of the recently announced wealth management acquisitions. Operating income improved slightly to $393 million as lower expenses more than offset the change in revenue. The rebound in global financial markets this quarter yielded strong investment gains and a 14% increase in net income to $351 million. Earnings per share of $0.70 increased at a slightly greater rate than net income, due to ongoing share repurchase activity. Operating Revenues and Expenses (In US$ millions, for the three months ended) Dec-19 vs. Dec-19 vs. Dec-19 Sep-19 Jun-19 Mar-19 Dec-18 Sep-19 Dec-18 Investment management fees $ 979.7 $ 1,001.6 (2%) $ 1,019.4 $ 992.4 $ 971.8 1% Sales and distribution fees 351.5 363.8 (3%) 367.5 358.5 354.8 (1%) Shareholder servicing fees 50.0 51.4 (3%) 52.7 57.1 55.1 (9%) Other 31.5 35.7 (12%) 37.1 25.8 29.8 6% Total Operating Revenues $ 1,412.7 $ 1,452.5 (3%) $ 1,476.7 $ 1,433.8 $ 1,411.5 0% Investment management fees of $980 million declined 2% due largely to lower average AUM and a lower effective fee rate of 55.2 basis points, excluding performance fees. Performance fees increased to $17 million and partially offset the impact of these items. Sales and distribution fees declined 3% to $352 million, commensurate with lower assets under management and commissionable sales in the quarter. 9 1. Net income attributable to Franklin Resources, Inc.
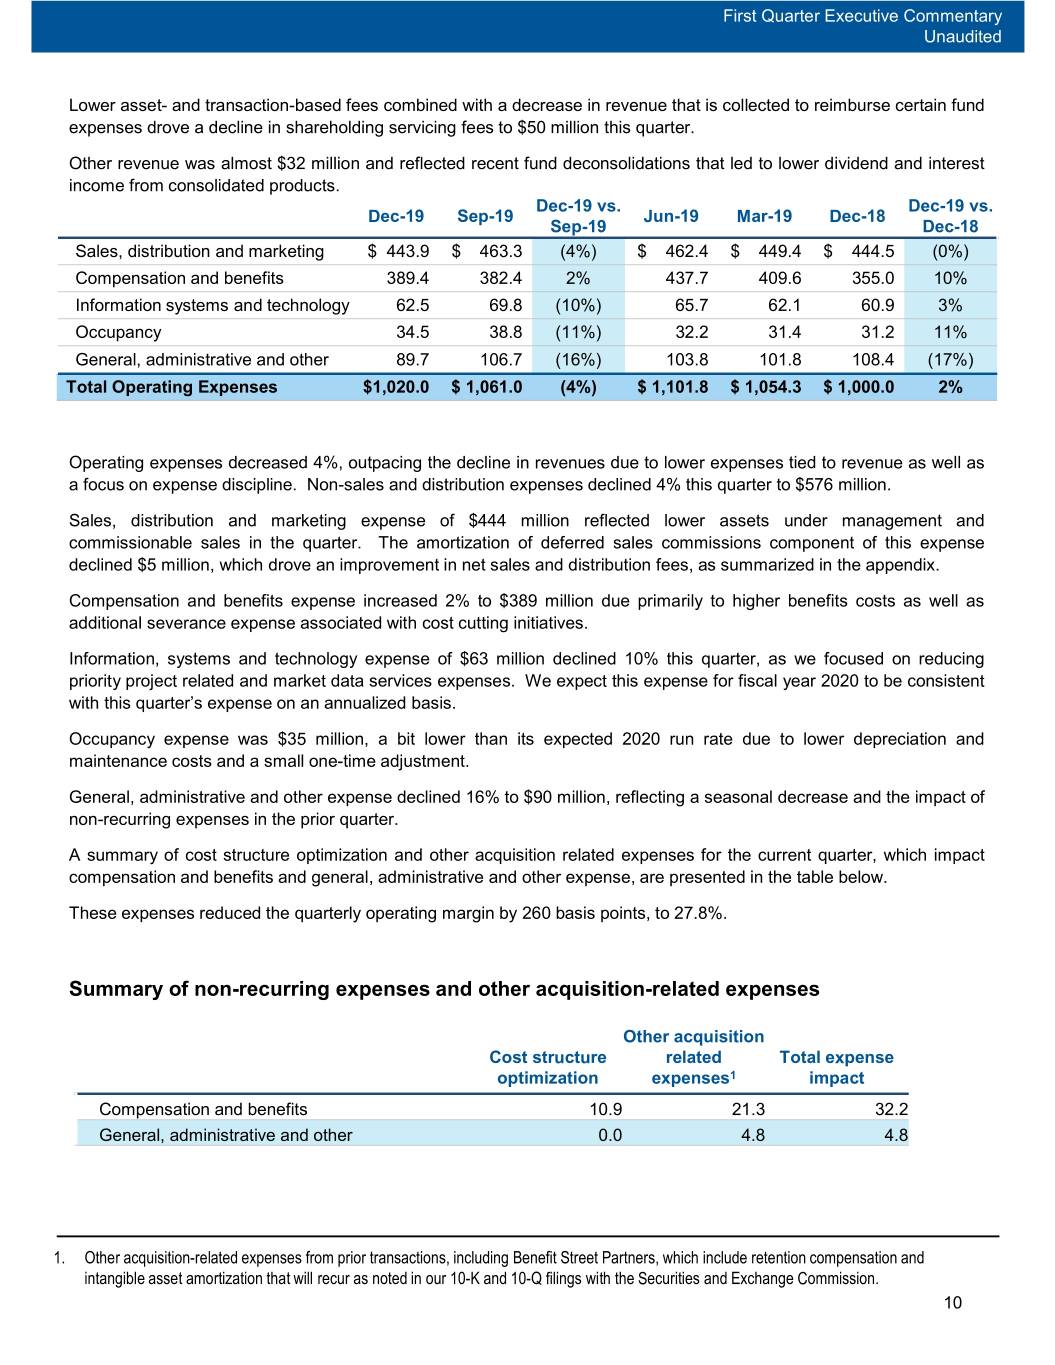
First Quarter Executive Commentary Unaudited Lower asset- and transaction-based fees combined with a decrease in revenue that is collected to reimburse certain fund expenses drove a decline in shareholding servicing fees to $50 million this quarter. Other revenue was almost $32 million and reflected recent fund deconsolidations that led to lower dividend and interest income from consolidated products. Dec-19 vs. Dec-19 vs. Dec-19 Sep-19 Jun-19 Mar-19 Dec-18 Sep-19 Dec-18 Sales, distribution and marketing $ 443.9 $ 463.3 (4%) $ 462.4 $ 449.4 $ 444.5 (0%) Compensation and benefits 389.4 382.4 2% 437.7 409.6 355.0 10% Information systems and technology 62.5 69.8 (10%) 65.7 62.1 60.9 3% Occupancy 34.5 38.8 (11%) 32.2 31.4 31.2 11% General, administrative and other 89.7 106.7 (16%) 103.8 101.8 108.4 (17%) Total Operating Expenses $1,020.0 $ 1,061.0 (4%) $ 1,101.8 $ 1,054.3 $ 1,000.0 2% Operating expenses decreased 4%, outpacing the decline in revenues due to lower expenses tied to revenue as well as a focus on expense discipline. Non-sales and distribution expenses declined 4% this quarter to $576 million. Sales, distribution and marketing expense of $444 million reflected lower assets under management and commissionable sales in the quarter. The amortization of deferred sales commissions component of this expense declined $5 million, which drove an improvement in net sales and distribution fees, as summarized in the appendix. Compensation and benefits expense increased 2% to $389 million due primarily to higher benefits costs as well as additional severance expense associated with cost cutting initiatives. Information, systems and technology expense of $63 million declined 10% this quarter, as we focused on reducing priority project related and market data services expenses. We expect this expense for fiscal year 2020 to be consistent with this quarter’s expense on an annualized basis. Occupancy expense was $35 million, a bit lower than its expected 2020 run rate due to lower depreciation and maintenance costs and a small one-time adjustment. General, administrative and other expense declined 16% to $90 million, reflecting a seasonal decrease and the impact of non-recurring expenses in the prior quarter. A summary of cost structure optimization and other acquisition related expenses for the current quarter, which impact compensation and benefits and general, administrative and other expense, are presented in the table below. These expenses reduced the quarterly operating margin by 260 basis points, to 27.8%. Summary of non-recurring expenses and other acquisition-related expenses Other acquisition Cost structure related Total expense optimization expenses1 impact Compensation and benefits 10.9 21.3 32.2 General, administrative and other 0.0 4.8 4.8 1. Other acquisition-related expenses from prior transactions, including Benefit Street Partners, which include retention compensation and intangible asset amortization that will recur as noted in our 10-K and 10-Q filings with the Securities and Exchange Commission. 10
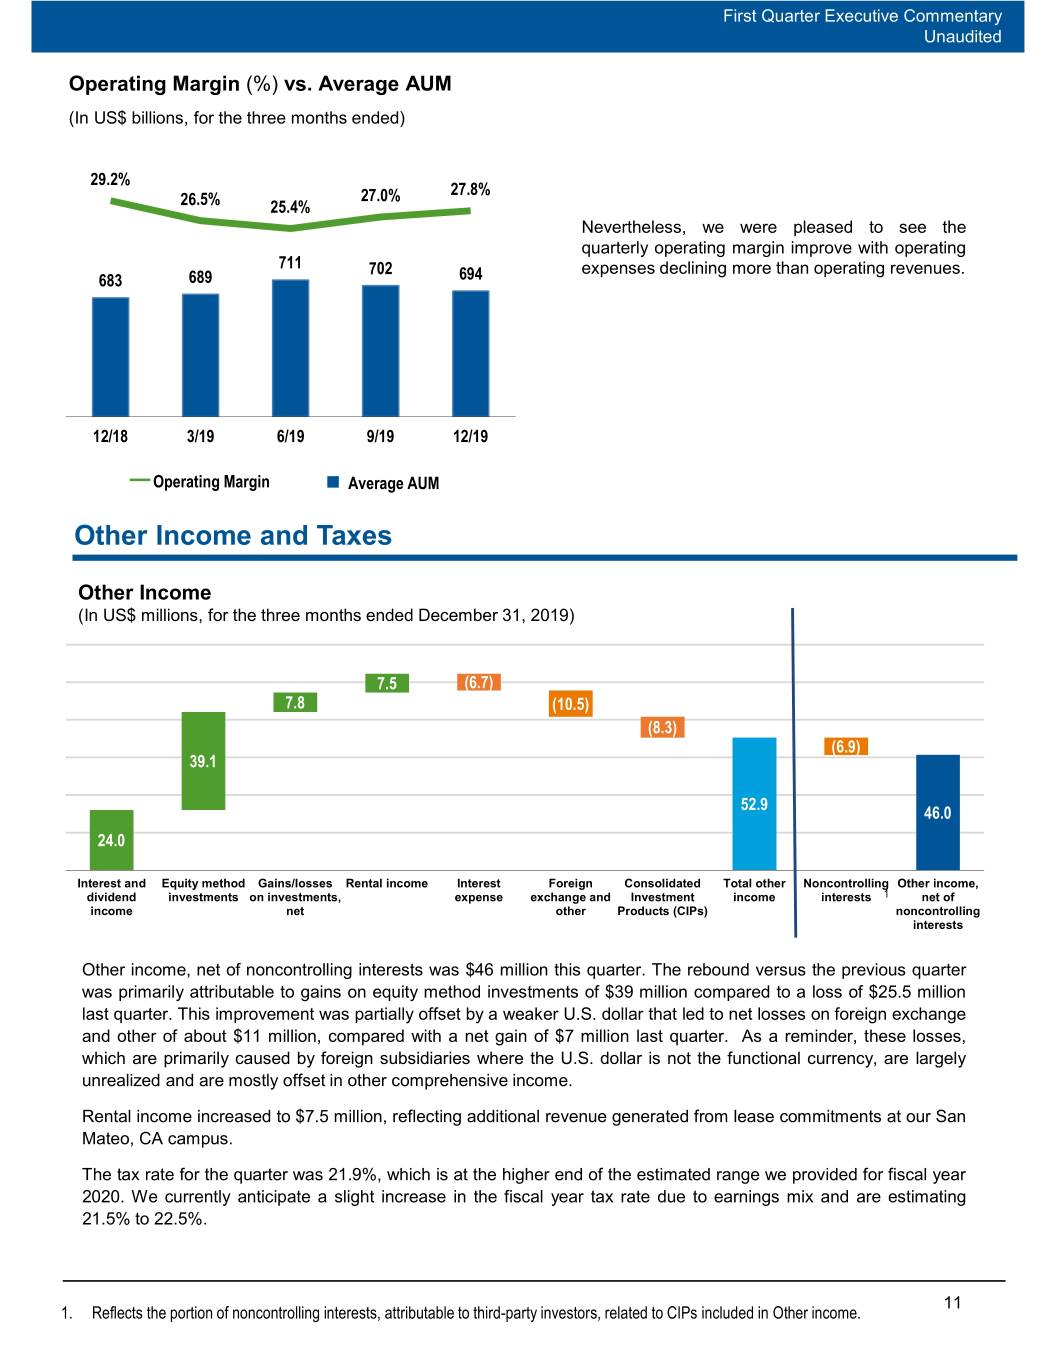
First Quarter Executive Commentary Unaudited Operating Margin (%) vs. Average AUM (In US$ billions, for the three months ended) 29.2% 27.0% 27.8% 26.5% 25.4% Nevertheless, we were pleased to see the quarterly operating margin improve with operating 711 702 expenses declining more than operating revenues. 683 689 694 12/18 3/19 6/19 9/19 12/19 ━ Operating Margin Average AUM Other Income and Taxes Other Income (In US$ millions, for the three months ended December 31, 2019) 7.5 (6.7) 7.8 (10.5) (8.3) (6.9) 39.1 52.9 46.0 24.0 Interest and Equity method Gains/losses Rental income Interest Foreign Consolidated Total other Noncontrolling Other income, dividend investments on investments, expense exchange and Investment income interests 1 net of income net other Products (CIPs) noncontrolling interests Other income, net of noncontrolling interests was $46 million this quarter. The rebound versus the previous quarter was primarily attributable to gains on equity method investments of $39 million compared to a loss of $25.5 million last quarter. This improvement was partially offset by a weaker U.S. dollar that led to net losses on foreign exchange and other of about $11 million, compared with a net gain of $7 million last quarter. As a reminder, these losses, which are primarily caused by foreign subsidiaries where the U.S. dollar is not the functional currency, are largely unrealized and are mostly offset in other comprehensive income. Rental income increased to $7.5 million, reflecting additional revenue generated from lease commitments at our San Mateo, CA campus. The tax rate for the quarter was 21.9%, which is at the higher end of the estimated range we provided for fiscal year 2020. We currently anticipate a slight increase in the fiscal year tax rate due to earnings mix and are estimating 21.5% to 22.5%. 11 1. Reflects the portion of noncontrolling interests, attributable to third-party investors, related to CIPs included in Other income.
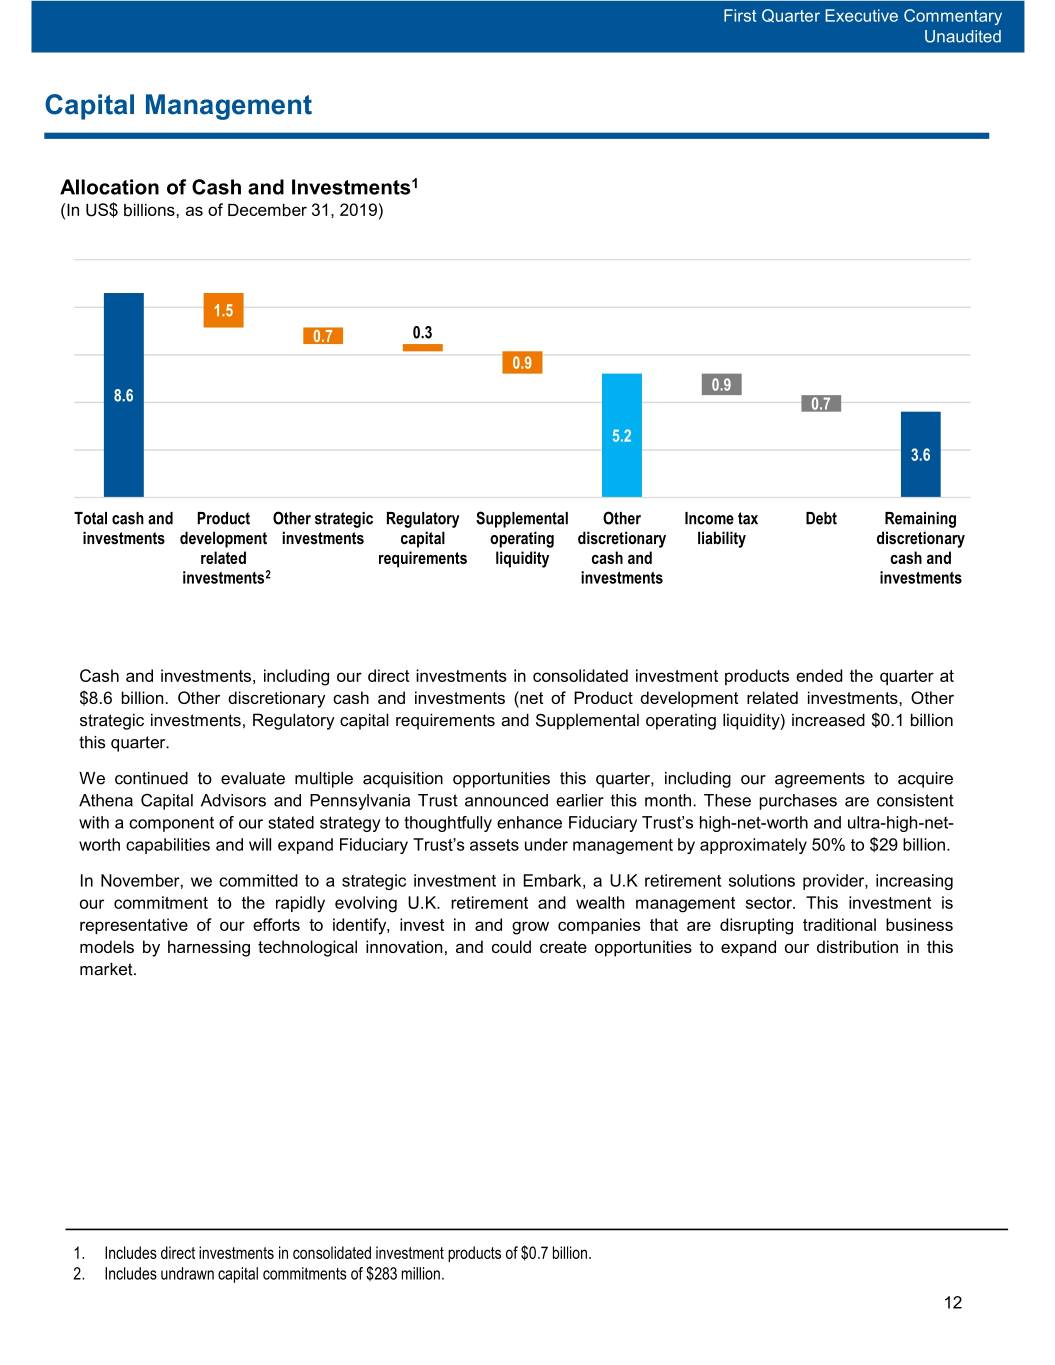
First Quarter Executive Commentary Unaudited Capital Management Allocation of Cash and Investments1 (In US$ billions, as of December 31, 2019) 1.5 0.7 0.3 0.9 0.9 8.6 0.7 5.2 3.6 Total cash and Product Other strategic Regulatory Supplemental Other Income tax Debt Remaining investments development investments capital operating discretionary liability discretionary related requirements liquidity cash and cash and investments2 investments investments Cash and investments, including our direct investments in consolidated investment products ended the quarter at $8.6 billion. Other discretionary cash and investments (net of Product development related investments, Other strategic investments, Regulatory capital requirements and Supplemental operating liquidity) increased $0.1 billion this quarter. We continued to evaluate multiple acquisition opportunities this quarter, including our agreements to acquire Athena Capital Advisors and Pennsylvania Trust announced earlier this month. These purchases are consistent with a component of our stated strategy to thoughtfully enhance Fiduciary Trust’s high-net-worth and ultra-high-net- worth capabilities and will expand Fiduciary Trust’s assets under management by approximately 50% to $29 billion. In November, we committed to a strategic investment in Embark, a U.K retirement solutions provider, increasing our commitment to the rapidly evolving U.K. retirement and wealth management sector. This investment is representative of our efforts to identify, invest in and grow companies that are disrupting traditional business models by harnessing technological innovation, and could create opportunities to expand our distribution in this market. 1. Includes direct investments in consolidated investment products of $0.7 billion. 2. Includes undrawn capital commitments of $283 million. 12
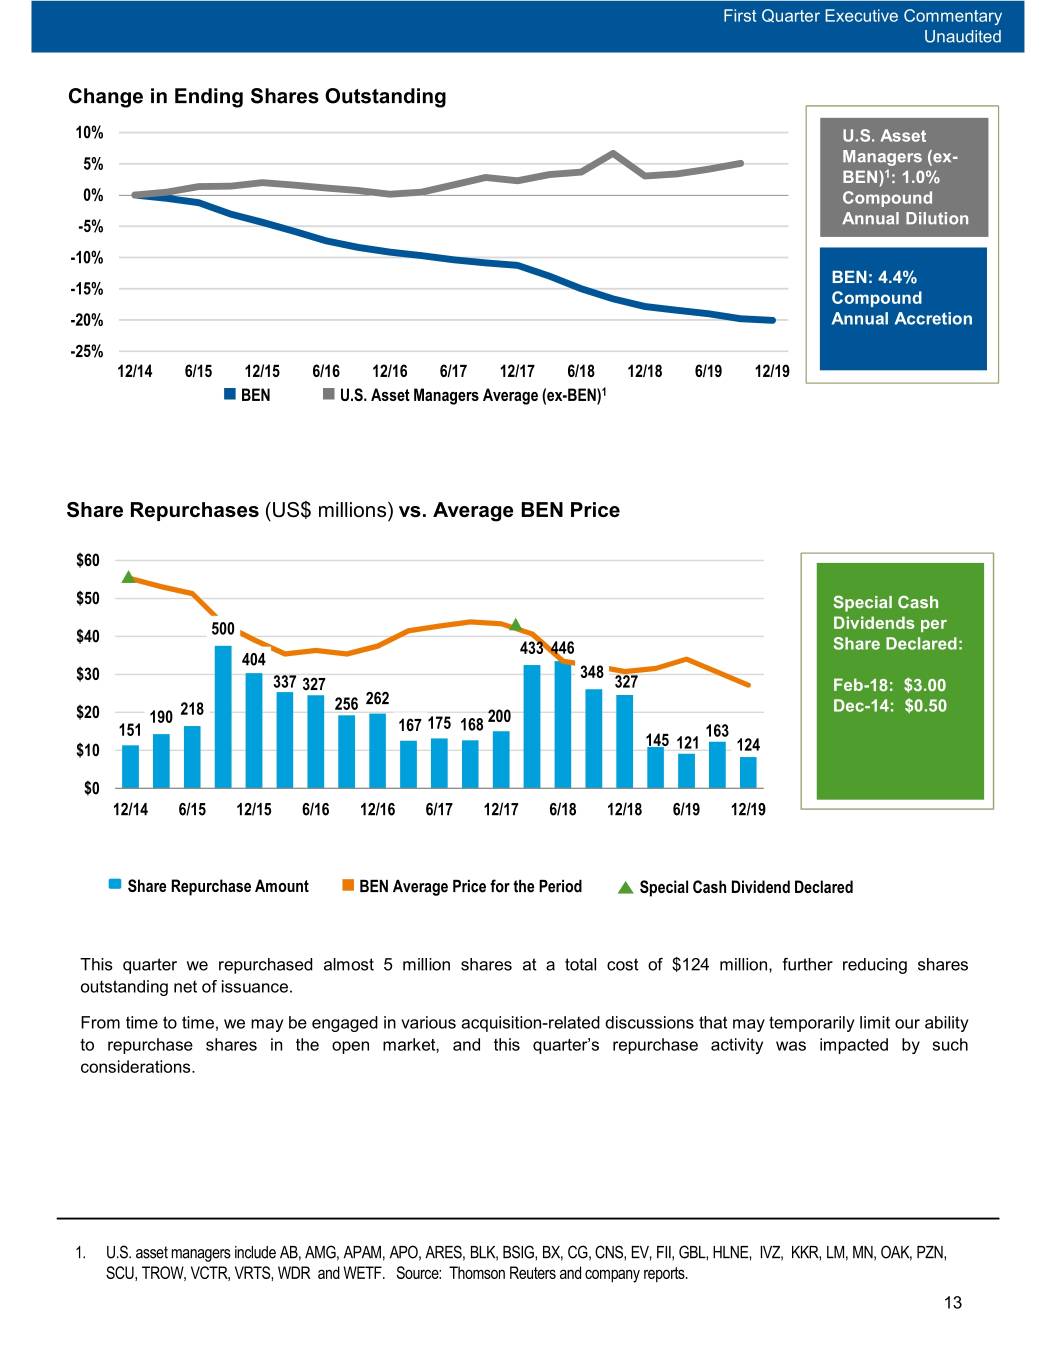
First Quarter Executive Commentary Unaudited Change in Ending Shares Outstanding 10% U.S. Asset 5% Managers (ex- BEN)1: 1.0% 0% Compound -5% Annual Dilution -10% BEN: 4.4% -15% Compound -20% Annual Accretion -25% 12/14 6/15 12/15 6/16 12/16 6/17 12/17 6/18 12/18 6/19 12/19 BEN U.S. Asset Managers Average (ex-BEN)1 Share Repurchases (US$ millions) vs. Average BEN Price $60 $50 Special Cash Dividends per $40 500 433 446 Share Declared: 404 $30 348 337 327 327 Feb-18: $3.00 256 262 Dec-14: $0.50 $20 190 218 200 151 167 175 168 163 145 $10 121 124 $0 12/14 6/15 12/15 6/16 12/16 6/17 12/17 6/18 12/18 6/19 12/19 Share Repurchase Amount BEN Average Price for the Period Special Cash Dividend Declared This quarter we repurchased almost 5 million shares at a total cost of $124 million, further reducing shares outstanding net of issuance. From time to time, we may be engaged in various acquisition-related discussions that may temporarily limit our ability to repurchase shares in the open market, and this quarter’s repurchase activity was impacted by such considerations. 1. U.S. asset managers include AB, AMG, APAM, APO, ARES, BLK, BSIG, BX, CG, CNS, EV, FII, GBL, HLNE, IVZ, KKR, LM, MN, OAK, PZN, SCU, TROW, VCTR, VRTS, WDR and WETF. Source: Thomson Reuters and company reports. 13
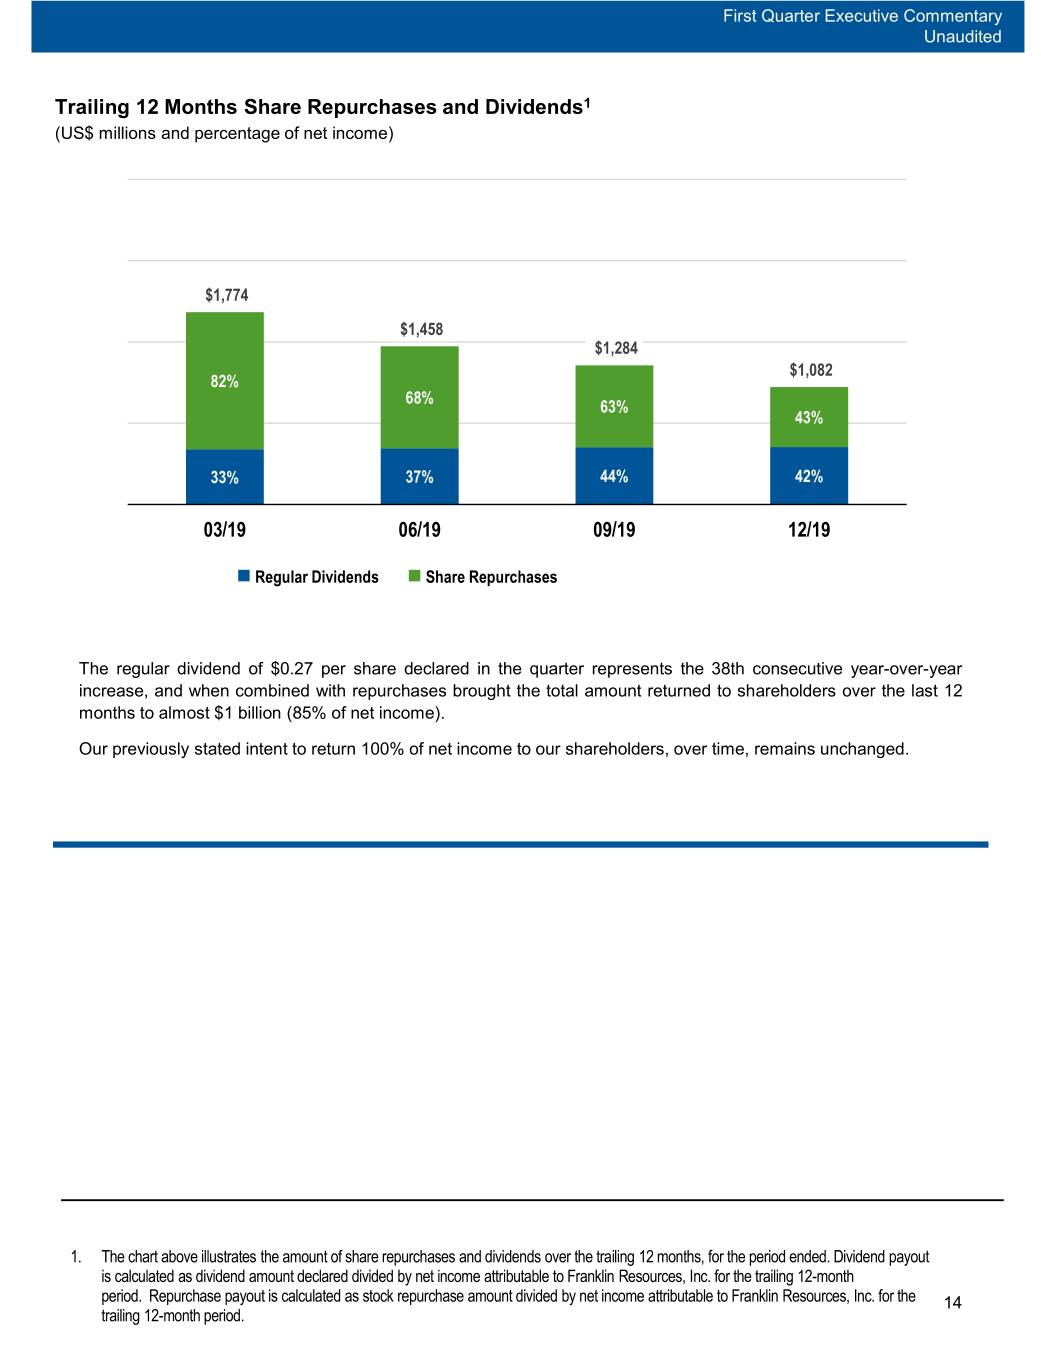
First Quarter Executive Commentary Unaudited Trailing 12 Months Share Repurchases and Dividends1 (US$ millions and percentage of net income) $1,774 $1,458 $1,284 $1,082 82% 68% 63% 43% 33% 37% 44% 42% 03/19 06/19 09/19 12/19 Regular Dividends Share Repurchases The regular dividend of $0.27 per share declared in the quarter represents the 38th consecutive year-over-year increase, and when combined with repurchases brought the total amount returned to shareholders over the last 12 months to almost $1 billion (85% of net income). Our previously stated intent to return 100% of net income to our shareholders, over time, remains unchanged. 1. The chart above illustrates the amount of share repurchases and dividends over the trailing 12 months, for the period ended. Dividend payout is calculated as dividend amount declared divided by net income attributable to Franklin Resources, Inc. for the trailing 12-month period. Repurchase payout is calculated as stock repurchase amount divided by net income attributable to Franklin Resources, Inc. for the 14 trailing 12-month period.
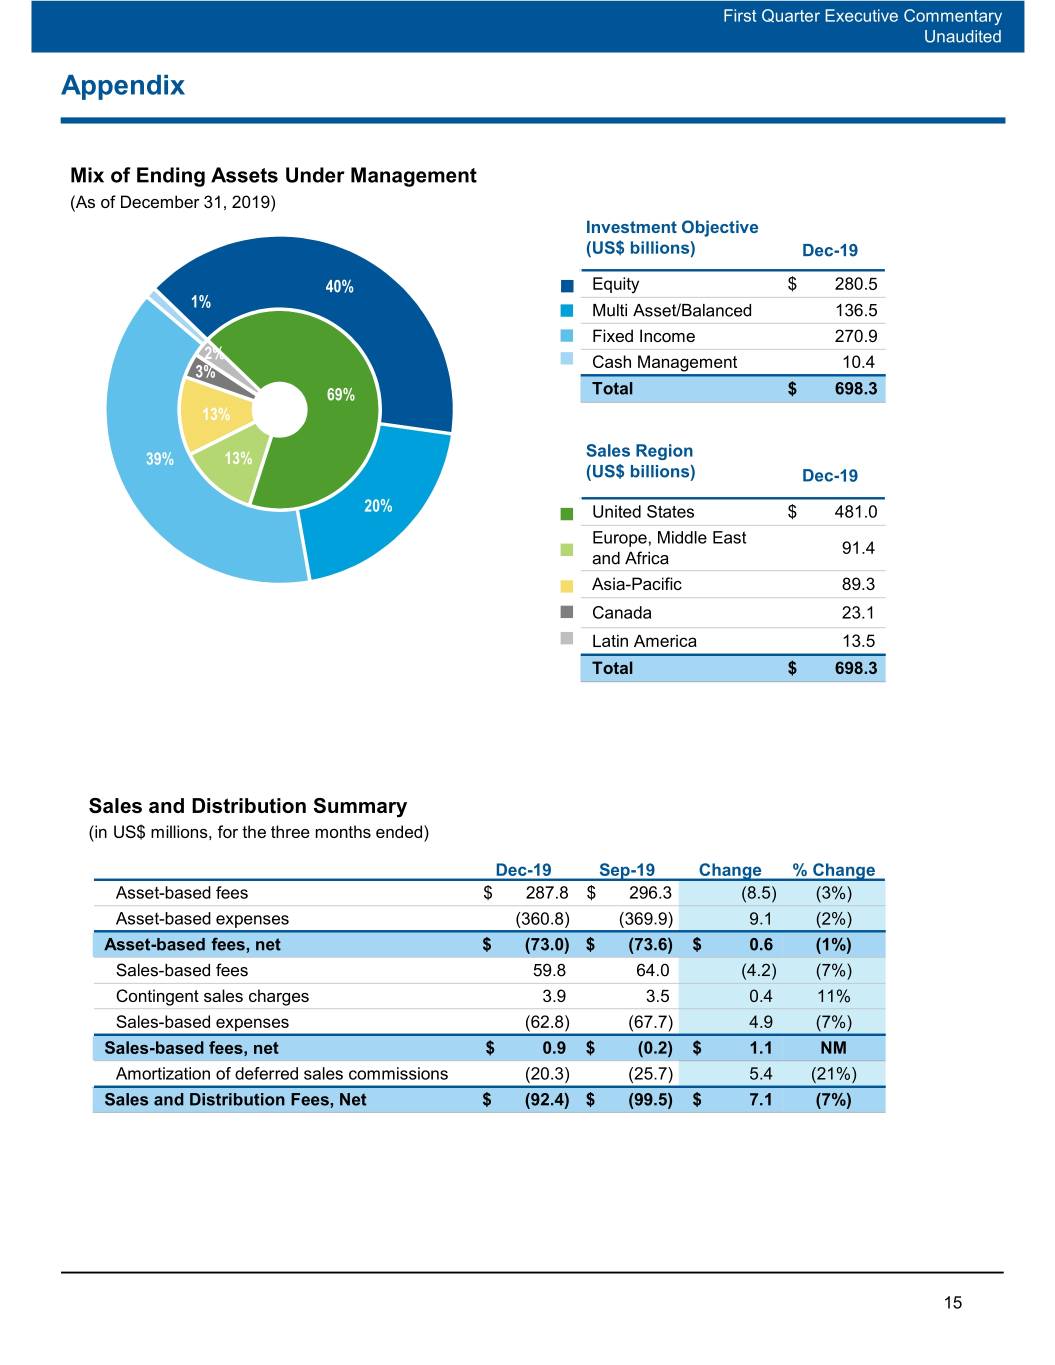
First Quarter Executive Commentary Unaudited Appendix Mix of Ending Assets Under Management (As of December 31, 2019) Investment Objective (US$ billions) Dec-19 40% Equity $ 280.5 1% Multi Asset/Balanced 136.5 Fixed Income 270.9 2% Cash Management 10.4 3% 69% Total $ 698.3 13% 39% 13% Sales Region (US$ billions) Dec-19 20% United States $ 481.0 Europe, Middle East 91.4 and Africa Asia-Pacific 89.3 Canada 23.1 Latin America 13.5 Total $ 698.3 Sales and Distribution Summary (in US$ millions, for the three months ended) Dec-19 Sep-19 Change % Change Asset-based fees $ 287.8 $ 296.3 (8.5) (3%) Asset-based expenses (360.8) (369.9) 9.1 (2%) Asset-based fees, net $ (73.0) $ (73.6) $ 0.6 (1%) Sales-based fees 59.8 64.0 (4.2) (7%) Contingent sales charges 3.9 3.5 0.4 11% Sales-based expenses (62.8) (67.7) 4.9 (7%) Sales-based fees, net $ 0.9 $ (0.2) $ 1.1 NM Amortization of deferred sales commissions (20.3) (25.7) 5.4 (21%) Sales and Distribution Fees, Net $ (92.4) $ (99.5) $ 7.1 (7%) 15
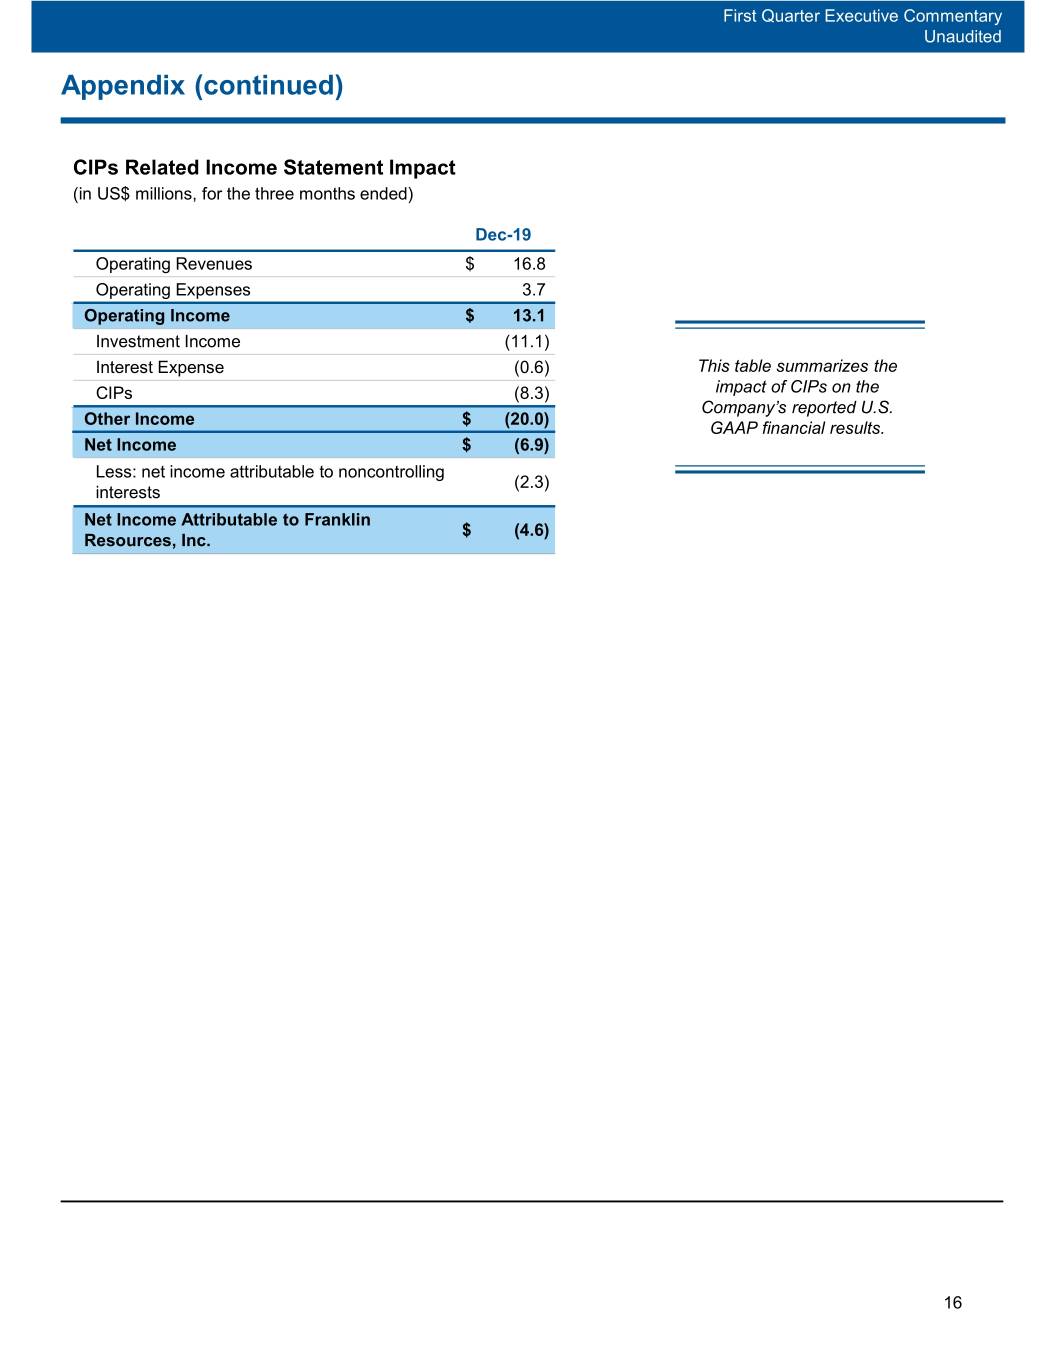
First Quarter Executive Commentary Unaudited Appendix (continued) CIPs Related Income Statement Impact (in US$ millions, for the three months ended) Dec-19 Operating Revenues $ 16.8 Operating Expenses 3.7 Operating Income $ 13.1 Investment Income (11.1) Interest Expense (0.6) This table summarizes the CIPs (8.3) impact of CIPs on the Company’s reported U.S. Other Income $ (20.0) GAAP financial results. Net Income $ (6.9) Less: net income attributable to noncontrolling (2.3) interests Net Income Attributable to Franklin $ (4.6) Resources, Inc. 16
Forward-Looking Statements Statements in this commentary regarding Franklin Resources, Inc. and its subsidiaries, which are not historical facts, are "forward-looking statements" within the meaning of the U.S. Private Securities Litigation Reform Act of 1995. When used in this commentary, words or phrases generally written in the future tense and/or preceded by words such as “will,” “may,” “could,” “expect,” “believe,” “anticipate,” “intend,” “plan,” “seek,” “estimate,” “preliminary” or other similar words are forward-looking statements. Forward-looking statements involve a number of known and unknown risks, uncertainties and other important factors, some of which are listed below, that could cause actual results and outcomes to differ materially from any future results or outcomes expressed or implied by such forward-looking statements. While forward- looking statements are our best prediction at the time that they are made, you should not rely on them and are cautioned against doing so. Forward-looking statements are based on our current expectations and assumptions regarding our business, the economy and other future conditions. Because forward-looking statements relate to the future, they are subject to inherent uncertainties, risks and changes in circumstances that are difficult to predict. They are neither statements of historical fact nor guarantees or assurances of future performance. These and other risks, uncertainties and other important factors are described in more detail in our recent filings with the U.S. Securities and Exchange Commission, including, without limitation, in Risk Factors and Management’s Discussion and Analysis of Financial Condition and Results of Operations in our Annual Report on Form 10-K for the fiscal year ended September 30, 2019 and our subsequent Quarterly Report on Form 10Q: Volatility and disruption of the capital and credit markets, and adverse changes in the global economy, may significantly affect our results of operations and may put pressure on our financial results. The amount and mix of our assets under management (“AUM”) are subject to significant fluctuations. We are subject to significant risk of asset volatility from changes in the global financial, equity, debt and commodity markets. Our funds may be subject to liquidity risks or an unanticipated large number of redemptions. A shift in our asset mix toward lower fee products may negatively impact our revenues. We may not effectively manage risks associated with the replacement of benchmark indices. Poor investment performance of our products could reduce the level of our AUM or affect our sales, and negatively impact our revenues and income. Harm to our reputation may negatively impact our revenues and income. Our business operations are complex and a failure to perform operational tasks properly or the misrepresentation of our services and products, resulting, without limitation, in the termination of investment management agreements representing a significant portion of our AUM, could have an adverse effect on our revenues and income. We face risks, and corresponding potential costs and expenses, associated with conducting operations and growing our business in numerous countries. Our increasing focus on international markets as a source of investments and sales of our products subjects us to increased exchange rate and market-specific political, economic or other risks that may adversely impact our revenues and income generated overseas. We may review and pursue strategic transactions that could pose risks to our business. Strong competition from numerous and sometimes larger companies with competing offerings and products could limit or reduce sales of our products, potentially resulting in a decline in our market share, revenues and income. Increasing competition and other changes in the third-party distribution and sales channels on which we depend could reduce our income and hinder our growth. Any failure of our third-party providers to fulfill their obligations, or our failure to maintain good relationships with our providers, could adversely impact our business. We may be adversely affected if any of our third-party providers is subject to a successful cyber or security attack. Our ability to manage and grow our business successfully can be impeded by systems and other technological limitations. Any significant limitation, failure or security breach of our information and cyber security infrastructure, software applications, technology or other systems that are critical to our operations could disrupt our business and harm our operations and reputation. 17

Forward-Looking Statements (continued) Our inability to recover successfully, should we experience a disaster or other business continuity problem, could cause material financial loss, regulatory actions, legal liability, and/or reputational harm. We depend on key personnel and our financial performance could be negatively affected by the loss of their services. Our future results are dependent upon maintaining an appropriate expense level. Our ability to meet cash needs depends upon certain factors, including the market value of our assets, our operating cash flows and our perceived creditworthiness. We are dependent on the earnings of our subsidiaries. We are subject to extensive, complex, overlapping and frequently changing rules, regulations, policies, and legal interpretations. We may be adversely affected as a result of new or revised legislation or regulations or by changes in the interpretation of existing laws and regulations. Global regulatory and legislative actions and reforms have made the regulatory environment in which we operate more costly and future actions and reforms could adversely impact our financial condition and results of operations. Failure to comply with the laws, rules or regulations in any of the jurisdictions in which we operate could result in substantial harm to our reputation and results of operations. Changes in tax laws or exposure to additional income tax liabilities could have a material impact on our financial condition, results of operations and liquidity. Our contractual obligations may subject us to indemnification costs and liability to third parties. Regulatory and governmental examinations and/or investigations, litigation and the legal risks associated with our business, could adversely impact our AUM, increase costs and negatively impact our profitability and/or our future financial results. Any forward-looking statement made by us in this press release speaks only as of the date on which it is made. Factors or events that could cause our actual results to differ may emerge from time to time, and it is not possible for us to predict all of them. We undertake no obligation to publicly update any forward-looking statement, whether as a result of new information, future developments or otherwise, except as may be required by law. The information in this commentary is provided solely in connection with this commentary, and is not directed toward existing or potential investment advisory clients or fund shareholders. Investor Relations Contacts 1 (650) 312-4091 Lucy Nicholls 1 (916) 463-4357 18


