UNITED STATES
SECURITIES AND EXCHANGE COMMISSION
Washington, D.C. 20549
FORM 10-K
| | |
| | x | ANNUAL REPORT PURSUANT TO SECTION 13 OR 15(d) OF THE SECURITIES EXCHANGE ACT OF 1934 |
For the Fiscal Year Ended December 31, 2007
OR
| | |
| | o | TRANSITION REPORT PURSUANT TO SECTION 13 OR 15(d) OF THE SECURITIES EXCHANGE ACT OF 1934 |
Commission File No. 0-22832
ALLIED CAPITAL CORPORATION
(Exact Name of Registrant as specified in its Charter)
| | | |
| Maryland | | 52-1081052 |
(State or Other Jurisdiction
of Incorporation) | | (I.R.S. Employer
Identification No.) |
| |
1919 Pennsylvania Avenue NW
Washington, D.C. | |
20006 |
| (Address of Principal Executive Office) | | (Zip Code) |
Registrant’s Telephone Number, Including Area Code: (202) 721-6100
Securities Registered Pursuant to Section 12(b) of the Act:
| | | |
| | | Name of Each Exchange |
| Title of Each Class | | On Which Registered |
| | | |
Common Stock, $0.0001 par value | | New York Stock Exchange
Nasdaq Global Select Market |
Securities Registered Pursuant to Section 12(g) of the Act:
NONE
Indicate by check mark if the registrant is a well-known seasoned issuer, as defined in Rule 405 of the Securities Act. YES o NO x
Indicate by check mark if the registrant is not required to file reports pursuant to Section 13 or Section 15(d) of the Act. YES o NO x
Indicate by check mark whether the registrant (1) has filed all reports required by Section 13 or 15(d) of the Securities Exchange Act of 1934 during the preceding 12 months (or for such shorter period that the registrant was required to file such reports), and (2) has been subject to such filing requirements for the past 90 days.
YES x NO o
Indicate by check mark if disclosure of delinquent filers pursuant to Item 405 of Regulation S-K is not contained herein, and will not be contained, to the best of registrant’s knowledge, in definitive proxy or information statements incorporated by reference in Part III of this Form 10-K or any amendment to this Form 10-K. o
Indicate by check mark whether the registrant is a large accelerated filer, an accelerated filer, a non-accelerated filer, or a smaller reporting company. See the definitions of “large accelerated filer,” “accelerated filer” and “smaller reporting company” in Rule 12b-2 of the Exchange Act. (Check one):
Large accelerated filer x Accelerated filer o Non-accelerated filer o Smaller reporting company o
(Do not check if a smaller reporting company)
Indicate by check mark whether the registrant is a shell company (as defined in Rule 12b-2 of the Exchange Act). YES o NO x
The aggregate market value of the registrant’s common stock held by non-affiliates of the registrant as of June 29, 2007, was approximately $4.4 billion based upon the last sale price for the registrant’s common stock on that date. As of February 28, 2008, there were 162,279,393 shares of the registrant’s common stock outstanding.
DOCUMENTS INCORPORATED BY REFERENCE
Portions of the registrant’s definitive Proxy Statement for the Annual Meeting of Stockholders to be held on April 25, 2008, are incorporated by reference into Part III of this Report.
TABLE OF CONTENTS
| | | | | | | |
| | | | | Page |
| | | | | |
| PART I |
| | Business | | | 1 | |
| | Risk Factors | | | 18 | |
| | Unresolved Staff Comments | | | 25 | |
| | Properties | | | 25 | |
| | Legal Proceedings | | | 25 | |
| | Submission of Matters to a Vote of Security Holders | | | 26 | |
| PART II |
| | Market for Registrant’s Common Equity, Related Stockholder Matters and Issuer Purchases of Equity Securities | | | 26 | |
| | Selected Financial Data | | | 30 | |
| | Management’s Discussion and Analysis of Financial Condition and Results of Operations | | | 32 | |
| | Quantitative and Qualitative Disclosures about Market Risk | | | 71 | |
| | Financial Statements and Supplementary Data | | | 72 | |
| | Changes in and Disagreements with Accountants on Accounting and Financial Disclosure | | | 139 | |
| | Controls and Procedures | | | 139 | |
| | Other Information | | | 139 | |
| PART III |
| | Directors, Executive Officers and Corporate Governance | | | 139 | |
| | Executive Compensation | | | 140 | |
| | Security Ownership of Certain Beneficial Owners and Management and Related Stockholder Matters | | | 140 | |
| | Certain Relationships and Related Transactions, and Director Independence | | | 140 | |
| | Principal Accountant Fees and Services | | | 140 | |
| PART IV |
| | Exhibits and Financial Statement Schedules | | | 140 | |
| Signatures | | | 145 | |
| EX-23 |
| EX-31.1 |
| EX-31.2 |
| EX-32.1 |
| EX-32.2 |
PART I
Item 1. Business.
General
We are a business development company, or BDC, in the private equity business and we are internally managed. Specifically, we provide long-term debt and equity capital to primarily private middle market companies in a variety of industries. We believe the private equity capital markets are important to the growth of small and middle market companies because such companies often have difficulty accessing the public debt and equity capital markets. We believe that we are well positioned to be a source of capital for such companies. We provide our investors the opportunity to participate in the U.S. private equity industry through an investment in our publicly traded stock.
We have participated in the private equity business since we were founded in 1958. Since then through December 31, 2007, we have invested more than $13 billion in thousands of companies nationwide. We primarily invest in the American entrepreneurial economy, helping to build middle market businesses and support American jobs. We generally invest in established companies with adequate cash flow for debt service and that are well positioned for growth. We are not venture capitalists, and we generally do not provide seed, or early stage, capital. At December 31, 2007, our private finance portfolio included investments in 120 companies that generate aggregate annual revenues of over $13 billion and employ more than 95,000 people.
Our investment objective is to achieve current income and capital gains. In order to achieve this objective, we primarily invest in debt and equity securities of private companies in a variety of industries. However, from time to time, we may invest in companies that are public but lack access to additional public capital.
We have also participated in commercial real estate finance over our history. Over the past few years, we have not actively participated in commercial real estate finance as we believed that the market for commercial real estate had become too aggressive and that investment opportunities were not priced appropriately. As a result, our commercial real estate finance portfolio totaled $121.2 million at value, or 2.3% of our total assets, at December 31, 2007, and contained primarily commercial mortgage loans. As the capital markets evolve and should commercial real estate investment opportunities improve, we may become more active investors in commercial real estate finance for our own portfolio or through a future managed fund. See “Managed Funds” below.
In addition to managing our own assets, we manage certain funds that also invest in the debt and equity securities of primarily private middle market companies in a variety of industries. We may invest in the equity of these funds, along with other third parties, from which we may earn a current return and/or a future incentive allocation. We may also manage the assets held by these funds, for which we may earn management or other fees for our services. See “Managed Funds” below.
We are internally managed, led by an experienced management team with our senior officers and managing directors possessing, on average, 22 years of experience. At December 31, 2007, we had 177 employees, who are focused on transaction sourcing, origination and execution, portfolio monitoring, accounting, valuation and other operational and administrative activities. We are headquartered in Washington, DC, with offices in New York, NY, Chicago, IL, and Los Angeles, CA and have centralized investment approval and portfolio management processes.
Private Equity Investing
As a private equity investor, we spend significant time and effort identifying, structuring, performing due diligence, monitoring, developing, valuing, and ultimately exiting our investments. We generally target companies in less cyclical industries with, among other things, high returns on invested capital, management teams with meaningful equity ownership, well-constructed balance sheets, and the ability to generate free cash flow. Each investment is subject to an extensive due diligence process. It is not
1
uncommon for a single investment to take from two months to a full year to complete, depending on the complexity of the transaction.
Our investment activity is primarily focused on making long-term investments in the debt and equity of primarily private middle market companies. These investments are generally long-term in nature and privately negotiated, and no readily available market exists for them. This makes our investments highly illiquid and, as a result, we cannot readily trade them. When we make an investment, we enter into a long-term arrangement where our ultimate exit from that investment may be three to ten years in the future.
We believe illiquid investments generally provide better investment returns on average over time than do more liquid investments, such as public equities and public debt instruments, because generally increased returns are associated with the liquidity risk in holding such investments. Investors in illiquid investments cannot manage risk through investment trading techniques. In order to manage our risk, we focus on careful investment selection, thorough due diligence, portfolio monitoring and portfolio diversification. Our investment management processes have been designed to incorporate these disciplines.
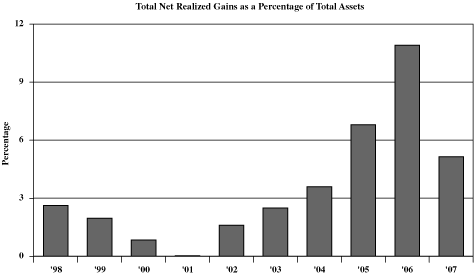
We have focused on investments in the debt and equity of primarily private middle market companies because they can be structured to provide recurring cash flow to us as the investor. In addition to earning interest income, we may earn income from management, consulting, diligence, structuring or other fees. We may also enhance our total return with capital gains realized from investments in equity instruments or from equity features, such as nominal cost warrants. For the years 1998 through 2007, we have realized $1.4 billion in cumulative net realized gains from our investment portfolio. Net realized gains for this period as a percentage of total assets are shown in the chart below.
One measure of the performance of a private equity investor is the internal rate of return generated by the investor’s portfolio. Since our merger on December 31, 1997, through December 31, 2007, our combined aggregate cash flow internal rate of return, or IRR, has been approximately 21% for private finance and real estate-related CMBS/CDO investments exited during this period. The IRR is calculated using the aggregate portfolio cash flow for all investments exited over this period. For investments exited during this period, we invested capital totaling $4.6 billion. The weighted average holding period of these investments was 38 months. Investments are considered to be exited when the original investment objective has been achieved through the receipt of cashand/or non-cash consideration upon the repayment of our debt investment or sale of an equity investment, or through the determination that no further consideration was collectible and, thus, a loss may have been realized. The aggregate cash flow IRR for private finance investments was approximately 21% and for CMBS/CDO investments was approximately 24% for the same period. The weighted average holding period of the private finance and
2
CMBS/CDO investments was 49 months and 22 months, respectively, for the same period. These IRR results represent historical results. Historical results are not necessarily indicative of future results.
We believe our business model is well suited for long-term investing in illiquid assets. Our balance sheet is capitalized with significant equity capital and we use only a modest level of debt capital, which allows us the ability to be patient and to manage through difficult market conditions with less risk of liquidity issues. Under the Investment Company Act of 1940 (the 1940 Act), we are restricted to a debt to equity ratio of approximately one-to-one. Thus, our capital structure, which includes a modest level of long-term leverage, is well suited for long-term illiquid investments.
In general, we compete for investments with a large number of private equity funds and mezzanine funds, other business development companies, hedge funds, investment banks, other equity and non-equity based investment funds, and other sources of financing, including specialty finance companies and traditional financial services companies such as commercial banks. However, we primarily compete with other providers of long-term debt and equity capital to middle market companies, including private equity funds and other business development companies.
Private Finance Portfolio. Our private finance portfolio is primarily composed of debt and equity investments. We generally invest in private companies though, from time to time, we may invest in companies that are public but lack access to additional public capital. These investments are also generally illiquid.
Our capital is generally used to fund:
| | | |
| • Buyouts | | • Recapitalizations |
| • Acquisitions | | • Note purchases |
| • Growth | | • Other types of financings |
When assessing a prospective private finance investment, we generally look for companies in less cyclical industries in the middle market (i.e., generally $50 million to $500 million in revenues) with certain target characteristics, which may or may not be present in the companies in which we invest. Our target investments generally are in companies with the following characteristics:
| | |
| | • | Management team with meaningful equity ownership |
| |
| | • | Dominant or defensible market position |
| |
| | • | High return on invested capital |
| |
| | • | Stable operating margins |
| |
| | • | Ability to generate free cash flow |
| |
| | • | Well-constructed balance sheet |
We generally target investments in companies in the following industries:
| | | |
| • Business Services | | • Financial Services |
| • Consumer Products | | • Consumer Services |
| • Industrial Products | | • Retail |
We intend to take a balanced approach to private equity investing that emphasizes a complementary mix of debt investments and buyout investments. The combination of these two types of investments
3
provides current interest and related portfolio income and the potential for future capital gains. Our strategy is to manage risk in these investments through the structure and terms of our debt and equity investments. It is our preference to structure our investments with a focus on current recurring interest and other income, which may include management, consulting or other fees. We generally target debt investments of $10 million to $150 million and buyout investments of up to $300 million of invested capital.
Debt investments may include senior loans, unitranche debt (generally in a first lien position), or subordinated debt (with or without equity features). The junior debt that we invest in that is lower in repayment priority than senior debt is also known as mezzanine debt. We may make equity investments for a minority equity stake in portfolio companies or may receive equity features, such as nominal cost warrants, in conjunction with our debt investments.
Senior loans may carry a fixed rate of interest or a floating rate of interest, usually set as a spread over LIBOR, and may require payments of both principal and interest throughout the life of the loan. Senior loans generally have contractual maturities of three to six years and interest is generally paid to us monthly or quarterly. Unitranche debt generally carries a fixed rate of interest. Unitranche debt generally requires payments of both principal and interest throughout the life of the loan. Unitranche debt generally has contractual maturities of five to six years and interest is generally paid to us quarterly. Subordinated debt generally carries a fixed rate of interest generally with contractual maturities of five to ten years and generally has interest-only payments in the early years and payments of both principal and interest in the later years, although maturities and principal amortization schedules may vary. Interest on subordinated debt is generally paid to us quarterly.
We may underwrite or arrange senior loans related to our portfolio investments or for other companies that are not in our portfolio. When we underwrite or arrange senior loans, we may earn a fee for such activities. Senior loans underwritten or arranged by us may or may not be funded by us at closing. When these senior loans are closed, we may fund all or a portion of the underwritten commitment pending sale of the loan to other investors, which may include loan sales to Callidus Capital Corporation (Callidus), a portfolio company controlled by us, or funds managed by Callidus or by us, including the Allied Capital Senior Debt Fund, L.P. After completion of the loan sales, we may or may not retain a position in these senior loans. We generally earn a fee on the senior loans we underwrite or arrange whether or not we fund the underwritten commitment. In addition, we may fund most or all of the debt and equity capital upon the closing of certain buyout transactions, which may include investments in lower-yielding senior debt. Subsequent to the closing, the portfolio company may refinance all or a portion of the lower-yielding senior debt, which would reduce our investment. Principal collections include repayments of senior debt funded by us that was subsequently sold by us or refinanced or repaid by the portfolio companies.
We may also invest in the bonds or preferred shares/income notes of collateralized loan obligations (CLOs) or collateralized debt obligations (CDOs), where the underlying collateral pool consists of senior loans. Certain of the CLOs and CDOs in which we invest may be managed by Callidus Capital Management, a subsidiary of Callidus.
In a buyout transaction, we generally invest in senior debt, subordinated debt and equity (preferred and/or voting or non-voting common) where our equity ownership represents a significant portion of the equity, but may or may not represent a controlling interest. If we invest in non-voting equity in a buyout investment, we generally have an option to acquire a controlling stake in the voting securities of the portfolio company at fair market value. We generally structure our buyout investments such that we seek to earn a blended current return on our total capital invested of approximately 10% through a combination of interest income on our loans and debt securities, dividends on our preferred and common equity, and management, consulting, or transaction services fees to compensate us for the managerial assistance that we may provide to the portfolio company. As a result of our significant equity investment in a buyout
4
investment there is potential to realize larger capital gains through buyout investing as compared to debt or mezzanine investing.
The structure of each debt and equity security is specifically negotiated to enable us to protect our investment, with a focus on preservation of capital, and maximize our returns. We include many terms governing interest rate, repayment terms, prepayment penalties, financial covenants, operating covenants, ownership parameters, dilution parameters, liquidation preferences, voting rights, and put or call rights. Our senior loans and unitranche debt are generally in a first lien position, however in a liquidation scenario, the collateral, if any, may not be sufficient to support our outstanding investment. Our junior or mezzanine loans are generally unsecured. Our investments may be subject to certain restrictions on resale and generally have no established trading market.
At December 31, 2007, 73.3% of the private finance portfolio at value consisted of loans and debt securities and 26.7% consisted of equity securities. At December 31, 2007, 86% of our private finance loans and debt securities carried a fixed rate of interest and 14% carried a floating rate of interest. The mix of fixed and variable rate loans and debt securities in the portfolio may vary depending on the level of floating rate senior loans or unitranche debt in the portfolio at a given time. The weighted average yield on our private finance loans and debt securities was 12.1% at December 31, 2007.
At December 31, 2007, 27.4% of the private finance investments at value were in companies more than 25% owned, 8.4% were in companies 5% to 25% owned, and 64.2% were in companies less than 5% owned.
5
Our ten largest investments at value at December 31, 2007, were as follows:
| | | | | | | | | | | | | | | | | | | |
| | | | | At December 31, 2007 | |
| ($ in millions) | | | | | |
| | | | | | | Unrealized | | | |
| Portfolio | | | | | | Appreciation | | | | | Percentage of | |
| Company | | Company Information | | Cost | | | (Depreciation) | | | Value | | | Total Assets | |
| | | | | | | | | | | | | | | |
| Norwesco, Inc. | | Designs, manufactures and markets a broad assortment of polyethylene tanks primarily to the agricultural and septic tank markets. | | $ | 121.0 | | | $ | 79.5 | | | $ | 200.5 | | | | 3.8% | |
| |
| EarthColor, Inc. | | Commercial printer focused on providing a one-stop printing solution of electronic pre-press, printing and finishing primarily for promotional products such as direct mail pieces, brochures, product information and free standing inserts. | | $ | 200.0 | | | $ | (10.9 | ) | | $ | 189.1 | | | | 3.6% | |
| |
| Advantage Sales & Marketing, Inc. | | Sales and marketing agency providing outsourced sales, merchandising, and marketing services to the consumer packaged goods industry. | | $ | 154.8 | | | $ | 11.0 | | | $ | 165.8 | | | | 3.2% | |
| |
| BenefitMall, Inc. | | Insurance general agency providing brokers with products, tools, and services that make selling employee benefits to small businesses more efficient. | | $ | 127.4 | | | $ | 36.9 | | | $ | 164.3 | | | | 3.2% | |
| |
| WMA Equity Corporation and Affiliates d/b/a/ Wear Me Apparel | | Designer and marketer of licensed and private children’s apparel. | | $ | 183.1 | | | $ | (32.1 | ) | | $ | 151.0 | | | | 2.9% | |
| |
| Driven Brands, Inc. | | Business format franchisor in the car care sector of the automotive aftermarket industry and in the general car care services with approximately 1,100 locations worldwide operating primarily under the Meineke Car Care Centers® and Econo Lube N’ Tune® brands. | | $ | 149.2 | | | $ | (13.5 | ) | | $ | 135.7 | | | | 2.6% | |
| |
| Financial Pacific Company | | Specialized commercial finance company that leases business-essential equipment to small businesses nationwide. | | $ | 97.9 | | | $ | 32.8 | | | $ | 130.7 | | | | 2.5% | |
| |
| Huddle House, Inc. | | Franchisor of value-priced, full service family dining restaurants primarily in the Southeast. | | $ | 101.2 | | | $ | 2.6 | | | $ | 103.8 | | | | 2.0% | |
| |
| The Step2 Company, LLC | | Manufacturer of branded plastic children’s and home products manufactured through a rotational molding process. | | $ | 98.2 | | | $ | 0.5 | | | $ | 98.7 | | | | 1.9% | |
| |
| Woodstream Corporation | | Manufactures and markets poison free pest control and pet and wildlife caring control products. | | $ | 97.1 | | | | — | | | $ | 97.1 | | | | 1.9% | |
6
We monitor the portfolio to maintain diversity within the industries in which we invest. We may or may not concentrate in any industry or group of industries in the future. The industry composition of the private finance portfolio at value at December 31, 2007 and 2006, was as follows:
| | | | | | | | | | |
| | | 2007 | | | 2006 | |
| | | | | | | |
Industry | | | | | | | | |
| Business services | | | 37 | % | | | 39 | % |
| Consumer products | | | 25 | | | | 20 | |
| Industrial products | | | 10 | | | | 9 | |
| Financial services | | | 7 | | | | 9 | |
CLO/CDO(1) | | | 6 | | | | 3 | |
| Retail | | | 4 | | | | 6 | |
| Consumer services | | | 4 | | | | 6 | |
| Healthcare services | | | 3 | | | | 3 | |
| Other | | | 4 | | | | 5 | |
| | | | | | | |
| | Total | | | 100 | % | | | 100 | % |
| | | | | | | |
| |
| (1) | These funds primarily invest in senior corporate loans. Certain of these funds are managed by Callidus, a portfolio company of Allied Capital. |
Commercial Real Estate Finance Portfolio. Since 1998, our commercial real estate investments were generally in the non-investment grade tranches of commercial mortgage-backed securities, also known as CMBS, and in the bonds and preferred shares of collateralized debt obligations, also known as CDOs. On May 3, 2005, we completed the sale of our portfolio of CMBS and CDO investments to affiliates of Caisse de dépôt et placement du Québec (the Caisse). See “Item 7. Management’s Discussion and Analysis of Financial Condition and Results of Operations.” Simultaneous with the sale of our CMBS and CDO portfolio, we entered into a platform assets purchase agreement, under which we have agreed not to primarily invest in non-investment grade CMBS and real estate related CDOs and refrain from certain other real estate related investing or servicing activities for a period of three years or through May 2008 subject to certain limitations and excluding our existing portfolio and related activities.
At December 31, 2007, our commercial real estate finance portfolio consisted of commercial mortgage loans, real estate owned and equity interests, which totaled $121.2 million at value, or 2.3% of our total assets.
Managed Funds
We manage funds that invest in the debt and equity of primarily private middle market companies in a variety of industries. As of December 31, 2007, the funds that we manage had total assets of approximately $400 million. During 2007, we launched the Allied Capital Senior Debt Fund, L.P. and the Unitranche Fund LLC, and in early 2008, we formed the AGILE Fund I, LLC, all discussed below (together, the Managed Funds). Our responsibilities to the Managed Funds may include deal origination, underwriting, and portfolio monitoring and development services consistent with the activities that we perform for our portfolio as outlined below. Each of the Managed Funds may separately invest in the debt or equity of a portfolio company. Our portfolio may include debt or equity investments issued by the same portfolio company as investments held by one or more Managed Funds, and these investments may be senior, pari passu or junior to the debt and equity investments held by us. We may or may not participate in investments made by investment funds managed by us or one of our affiliates. We expect to continue to grow our managed capital base and have identified other private equity-related funds that we intend to develop. By growing our privately managed capital base, we are seeking to diversify our sources of capital, leverage our core investment expertise and increase fees and other income from asset management activities.
Allied Capital Senior Debt Fund, L.P. The Allied Capital Senior Debt Fund, L.P. (ACSDF) is a private fund that generally invests in senior, unitranche and second lien debt. ACSDF has closed on $125 million in equity capital commitments and had total assets of approximately $400 million at
7
December 31, 2007. A.C. Corporation (AC Corp), our wholly-owned subsidiary, is the investment manager and Callidus acts as special manager to ACSDF. One of our affiliates is the general partner of ACSDF, and AC Corp serves as collateral manager to a warehouse financing vehicle associated with ACSDF. AC Corp will earn a management fee of up to 2% per annum of the net asset value of ACSDF and will pay Callidus 25% of that management fee to compensate Callidus for its role as special manager.
We are a special limited partner in ACSDF, which is a portfolio investment, and have committed and funded $31.8 million to ACSDF. At December 31, 2007, our investment in ACSDF totaled $31.8 million at cost and $32.8 million at value. As a special limited partner, we expect to earn an incentive allocation of 20% of the annual net income of ACSDF, subject to certain performance benchmarks.
From time to time, we may offer to sell loans to ACSDF or the warehouse financing vehicle. ACSDF or the warehouse financing vehicle may purchase loans from us. They also purchase loans from other third parties.
Unitranche Fund LLC. In December 2007, we formed the Unitranche Fund LLC (Unitranche Fund), which we co-manage with an affiliate of General Electric Capital Corporation (GE). The Unitranche Fund is a private fund that generally focuses on making first lien unitranche loans to middle market companies with Earning Before Interest, Taxes, Depreciation, and Amortization (EBITDA) of at least $15 million. The Unitranche Fund may invest up to $270 million for a single borrower. For financing needs greater than $270 million, we and GE may jointly underwrite additional financing for a total unitranche financing of up to $500 million. Allied Capital, GE and the Unitranche Fund may co-invest in a single borrower, with the Unitranche Fund holding at least a majority of the issuance. We may hold the portion of a unitranche loan underwritten by us. GE has committed $3.075 billion to the Unitranche Fund consisting of $3.0 billion of senior notes and $0.075 billion of subordinated certificates and we have committed $525.0 million of subordinated certificates. The Unitranche Fund will be capitalized as transactions are completed. At December 31, 2007, our investment in the Unitranche Fund totaled $0.7 million at cost and at value.
The Unitranche Fund is governed by an investment committee with equal representation from Allied Capital and GE and both Allied Capital and GE and its affiliates provide origination, underwriting and portfolio management services to the Unitranche Fund. We will earn a management and sourcing fee totaling 0.375% per annum of managed assets.
AGILE Fund I, LLC. In January 2008, we entered into an investment agreement with the Goldman Sachs Private Equity Group, part of Goldman Sachs Asset Management (Goldman Sachs). As part of the investment agreement, we agreed to sell a pro-rata strip of private equity and debt investments to AGILE Fund I, LLC (AGILE), a private fund in which a fund managed by Goldman Sachs owns substantially all of the interests, for a total transaction value of $169 million. The majority of the investment sale closed simultaneously with the execution of the investment agreement. The sales of the remaining assets are expected to close by the end of the first quarter of 2008, subject to certain terms and conditions.
The sale to AGILE included 13.7% of our equity investments in 23 of our buyout portfolio companies and 36 of our minority equity portfolio companies for a total purchase price of $109 million. In addition, we sold approximately $60 million in debt investments, which represented 7.3% of our unitranche, second lien and subordinated debt investments in the buyout investments included in the equity sale. AGILE generally has the right to co-invest in its proportional share of any future follow-on investment opportunities presented by the companies in its portfolio.
We are the managing member of AGILE, and will be entitled to an incentive allocation subject to certain performance benchmarks. We own the remaining interests in AGILE not held by Goldman Sachs.
In addition, pursuant to the investment agreement Goldman Sachs has committed to invest at least $125 million in future investment vehicles managed by us and will have future opportunities to invest in our affiliates, or vehicles managed by them, and to co-invest alongside us in the future, subject to various terms and conditions. As part of this transaction, we have also agreed to sell 11 venture capital and private equity limited partnership investments for approximately $28 million to a fund managed by Goldman Sachs, which will assume the $6.5 million of unfunded commitments related to these limited partnership
8
investments. The sales of these limited partnership investments are expected to be completed by May 2008.
Business Processes
Business Development and New Deal Origination.Over the years, we believe we have developed and maintained a strong industry reputation and an extensive network of relationships. We have a team of business development professionals dedicated to sourcing investments through our relationships with numerous private equity investors, investment banks, business brokers, merger and acquisition advisors, financial services companies, banks, law firms and accountants through whom we source investment opportunities. Through these relationships, we believe we have been able to strengthen our position as a private equity investor. We are well known in the private equity industry, and we believe that our experience and reputation provide a competitive advantage in originating new investments.
We believe that our debt portfolio relationships and sponsor relationships are a significant source for buyout investments. We generally source our buyout transactions in ways other than going to broad auctions, which include capitalizing on existing relationships with companies and sponsors to participate in proprietary buyout opportunities. We work closely with these companies and sponsors while we are debt investors so that we may be positioned to partner with them on buyout opportunities in a subsequent transaction.
From time to time, we may receive referrals for new prospective investments from our portfolio companies as well as other participants in the capital markets. We may pay referral fees to those who refer transactions to us that we consummate.
New Deal Underwriting and Investment Execution. In a typical transaction, we review, analyze, and substantiate through due diligence, the business plan and operations of the potential portfolio company. We perform financial due diligence, perform operational due diligence, study the industry and competitive landscape, and conduct reference checks with company management or other employees, customers, suppliers, and competitors, as necessary. We may work with external consultants, including accounting firms and industry or operational consultants, in performing due diligence and in monitoring our portfolio investments.
Once we have determined that a prospective portfolio company is suitable for investment, we work with the management and the other capital providers, including senior, junior, and equity capital providers, to structure a “deal.” We negotiate among these parties to agree on the rights and terms of our investment relative to the other capital in the portfolio company’s capital structure. The typical debt transaction requires approximately two to six months of diligence and structuring before funding occurs. The typical buyout transaction may take longer to complete because the due diligence and structuring process is significantly longer when investing in a substantial equity stake in the company.
Our investments are tailored to the facts and circumstances of each deal. The specific structure is designed to protect our rights and manage our risk in the transaction. We generally structure the debt instrument to require restrictive affirmative and negative covenants, default penalties, or other protective provisions. In addition, each debt investment is individually priced to achieve a return that reflects our rights and priorities in the portfolio company’s capital structure, the structure of the debt instrument, and our perceived risk of the investment. Our loans and debt securities have an annual stated interest rate; however, that interest rate is only one factor in pricing the investment. The annual stated interest rate may include some component of contractual payment-in-kind interest, which represents contractual interest accrued and added to the loan balance that generally becomes due at maturity or upon prepayment. In addition to the interest earned on loans and debt securities, our debt investments may include equity features, such as nominal cost warrants or options to buy a minority interest in the portfolio company. In a buyout transaction where our equity investment represents a significant portion of the equity, our equity ownership may or may not represent a controlling interest. If we invest in non-voting equity in a buyout, we generally have an option to acquire a controlling stake in the voting securities of the portfolio company at fair market value.
9
We have a centralized, credit-based approval process. The key steps in our investment process are:
| | |
| | • | Initial investment screening; |
| |
| | • | Initial investment committee approval; |
| |
| | • | Due diligence, structuring and negotiation; |
| |
| | • | Internal review of diligence results, including peer review; |
| |
| | • | Final investment committee approval; |
| |
| | • | Approval by the Investment Review Committee of the Board of Directors for all debt investments that represent a commitment equal to or greater than $20 million and every buyout transaction; and |
| |
| | • | Funding of the investment (due diligence must be completed with final investment committee approval and Board Investment Review Committee approval, as needed, before funds are disbursed). |
The investment process benefits from the significant professional experience of the members of our investment committee, which is chaired by our Chief Executive Officer and includes our Chief Operating Officer, our Chief Financial Officer, and certain of our Managing Directors.
Portfolio Monitoring and Development.Middle market companies often lack the management expertise and experience found in larger companies. As a BDC, we are required by the 1940 Act to make available significant managerial assistance to our portfolio companies. Our senior level professionals work with portfolio company management teams to assist them in building their businesses. Managerial assistance includes, but is not limited to, management and consulting services related to corporate finance, marketing, human resources, personnel and board member recruiting, business operations, corporate governance, risk management and other general business matters. Our corporate finance assistance includes supporting our portfolio companies’ efforts to structure and attract additional capital. We believe our extensive network of industry relationships and our internal resources help make us a collaborative partner in the development of our portfolio companies.
Our team of investment professionals regularly monitors the status and performance of each investment. This portfolio company monitoring process generally includes review of the portfolio company’s financial performance against its business plan, review of current financial statements and compliance with financial covenants, evaluation of significant current developments and assessment of future exit strategies. For debt investments we may have board observation rights that allow us to attend portfolio company board meetings. For buyout investments, we generally hold a majority of the seats on the board of directors where we own a controlling interest in the portfolio company and we have board observation rights where we do not own a controlling interest in the portfolio company.
Our portfolio management committee is responsible for review and oversight of the investment portfolio, including reviewing the performance of selected portfolio companies, overseeing portfolio companies in workout status, reviewing and approving certain modifications or amendments to or certain additional investments in existing investments, reviewing and approving certain portfolio exits, reviewing and approving certain actions by portfolio companies whose voting securities are more than 50% owned by us, reviewing significant investment-related litigation matters where we are a named party, and reviewing and approving proxy votes with respect to our portfolio investments. Our portfolio management committee is chaired by our Chief Executive Officer and includes our Chief Operating Officer, Chief Financial Officer, Chief Valuation Officer (non-voting member), our private finance general counsel, and certain of our Managing Directors. From time to time we will identify investments that require closer monitoring or become workout assets. We develop a workout strategy for workout assets and the portfolio management committee gauges our progress against the strategy.
We seek to price our investments to provide an investment return considering the fact that certain investments in the portfolio may underperform or result in loss of investment return or investment principal. As a private equity investor, we will incur losses from our investing activities, however we have a history of working with troubled portfolio companies in order to recover as much of our investments as is practicable.
10
Portfolio Grading
We employ a grading system for our entire portfolio. Grade 1 is for those investments from which a capital gain is expected. Grade 2 is for investments performing in accordance with plan. Grade 3 is for investments that require closer monitoring; however, no loss of investment return or principal is expected. Grade 4 is for investments that are in workout and for which some loss of current investment return is expected, but no loss of principal is expected. Grade 5 is for investments that are in workout and for which some loss of principal is expected. At December 31, 2007, Grade 1, 2, and 3 investments totaled $4,577.8 million, or 95.8% of the total portfolio at value, and Grade 4 and 5 investments totaled $202.7 million, or 4.2% of the total portfolio at value.
Portfolio Valuation
We determine the value of each investment in our portfolio on a quarterly basis, and changes in value result in unrealized appreciation or depreciation being recognized in our statement of operations. Value, as defined in Section 2(a)(41) of the 1940 Act, is (i) the market price for those securities for which a market quotation is readily available and (ii) for all other securities and assets, fair value is as determined in good faith by the Board of Directors. Since there is typically no readily available market value for the investments in our portfolio, we value substantially all of our portfolio investments at fair value as determined in good faith by the Board of Directors pursuant to our valuation policy and a consistently applied valuation process. Because of the inherent uncertainty of determining the fair value of investments that do not have a readily available market value, the fair value of our investments determined in good faith by the Board of Directors may differ significantly from the values that would have been used had a ready market existed for the investments, and the differences could be material.
There is no single standard for determining fair value in good faith. As a result, determining fair value requires that judgment be applied to the specific facts and circumstances of each portfolio investment while employing a consistently applied valuation process for the types of investments we make. Unlike banks, we are not permitted to provide a general reserve for anticipated loan losses. Instead, we are required to specifically value each individual investment on a quarterly basis. We will record unrealized depreciation on investments when we believe that an investment has become impaired, including where collection of a loan or realization of an equity security is doubtful, or when the enterprise value of the portfolio company does not currently support the cost of our debt or equity investment. Enterprise value means the entire value of the company to a potential buyer, including the sum of the values of debt and equity securities used to capitalize the enterprise at a point in time. We will record unrealized appreciation if we believe that the underlying portfolio company has appreciated in value and/or our equity security has appreciated in value. Changes in fair value are recorded in the statement of operations as net change in unrealized appreciation or depreciation. See “Item 7. Management’s Discussion and Analysis of Financial Condition and Results of Operations — Results of Operations — Change in Unrealized Appreciation or Depreciation” for a discussion of our valuation methodology.
Valuation Process.The portfolio valuation process is managed by our Chief Valuation Officer (CVO). The CVO works with the investment professionals responsible for each investment. The following is an overview of the steps we take each quarter to determine the value of our portfolio.
| | |
| | • | Our valuation process begins with each portfolio company or investment being initially valued by the investment professionals, led by the Managing Director or senior officer who is responsible for the portfolio company relationship (the Deal Team). |
| |
| | • | The CVO and third-party valuation consultants, as applicable (see below), review the preliminary valuation documentation as prepared by the Deal Team. |
| |
| | • | The CVO, members of the valuation team, and third-party consultants (see below), as applicable, meet with each Managing Director or responsible senior officer to discuss the preliminary valuation determined and documented by the Deal Team for each of their respective investments. |
11
| | |
| | • | The CEO, COO, CFO and the Managing Directors meet with the CVO to discuss the preliminary valuation results. |
| |
| | • | Valuation documentation is distributed to the members of the Board of Directors. |
| |
| | • | The Audit Committee of the Board of Directors meets separately from the full Board of Directors with the third-party consultants (see below) to discuss the assistance provided and results. The CVO attends this meeting. |
| |
| | • | The CVO discusses and reviews the valuations with the Board of Directors. |
| |
| | • | To the extent there are changes or if additional information is deemed necessary, afollow-up Board meeting may take place. |
| |
| | • | The Board of Directors determines the fair value of the portfolio in good faith. |
In connection with our valuation process to determine the fair value of a private finance investment, we work with third-party consultants to obtain assistance and advice as additional support in the preparation of our internal valuation analysis for a portion of the portfolio each quarter. In addition, we may receive other third-party assessments of a particular private finance portfolio company’s value in the ordinary course of business, most often in the context of a prospective sale transaction or in the context of a bankruptcy process.
The valuation analysis prepared by management is submitted to our Board of Directors who is ultimately responsible for the determination of fair value of the portfolio in good faith. Valuation assistance from Duff & Phelps, LLC (Duff & Phelps) for our private finance portfolio consisted of certain limited procedures (the Procedures) we identified and requested them to perform. Based upon the performance of the Procedures on a selection of our final portfolio company valuations, Duff & Phelps concluded that the fair value of those portfolio companies subjected to the Procedures did not appear unreasonable. In addition, we also received third-party valuation assistance from other third-party consultants for certain private finance portfolio companies.
We currently intend to continue to work with third-party consultants to obtain valuation assistance for a portion of the private finance portfolio each quarter. We currently anticipate that we will generally obtain valuation assistance for all companies in the portfolio where we own more than 50% of the outstanding voting equity securities on a quarterly basis and that we will generally obtain assistance for companies where we own equal to or less than 50% of the outstanding voting equity securities at least once during the course of the calendar year. Valuation assistance may or may not be obtained for new companies that enter the portfolio after June 30 of any calendar year during that year or for investments with a cost and value less than $250,000. For the quarter ended December 31, 2007, we received valuation assistance for 112 portfolio companies, which represented 91.1% of the private finance portfolio at value. See “Item 7. Management’s Discussion and Analysis of Financial Condition and Results of Operations” below.
Disposition of Investments
We manage our portfolio of investments in an effort to maximize our expected returns. We are generally repaid by our borrowers and exit our debt and equity investments as portfolio companies are sold, recapitalized or complete an initial public offering.
We may retain a position in the senior loans we originate or we may sell all or a portion of these investments. In our debt investments where we have equity features, we are generally in a minority ownership position in a portfolio company, and as a result, generally exit the investment when the majority equity stakeholder decides to sell or recapitalize the company. Where we have a control position in an investment, as we may have in buyout investments, we have more flexibility and can determine whether or not we should exit our investment. Our most common exit strategy for a buyout investment is the sale of a portfolio company to a strategic or financial buyer. If an investment has appreciated in value, we may realize a gain when we exit the investment. If an investment has depreciated in value, we may realize a loss when we exit the investment.
12
We are in the investment business, which includes acquiring and exiting investments. It is our policy not to comment on potential transactions in the portfolio prior to reaching a definitive agreement or, in many cases, prior to consummating a transaction. To the extent we enter into any material transactions, we would provide disclosure as required.
Dividends
We have elected to be taxed as a regulated investment company under Subchapter M of the Internal Revenue Code of 1986 (the Code). Assuming that we continue to qualify as a regulated investment company, we generally will not be subject to corporate level income taxation on income we timely distribute to our stockholders as dividends. We pay regular quarterly dividends based upon an estimate of annual taxable income available for distribution to shareholders, which includes our taxable interest, dividend, and fee income, as well as taxable net capital gains. Taxable income generally differs from net income for financial reporting purposes due to temporary and permanent differences in the recognition of income and expenses, and generally excludes net unrealized appreciation or depreciation, as gains or losses generally are not included in taxable income until they are realized. In addition, gains realized for financial reporting purposes may differ from gains included in taxable income as a result of our election to recognize gains using installment sale treatment, which generally results in the deferment of gains for tax purposes until notes or other amounts, including amounts held in escrow, received as consideration from the sale of investments are collected in cash. Taxable income includes non-cash income, such as changes in accrued and reinvested interest and dividends, which includes contractual payment-in-kind interest, and the amortization of discounts and fees. Cash collections of income resulting from contractual payment-in-kind interest or the amortization of discounts and fees generally occur upon the repayment of the loans or debt securities that include such items. Non-cash taxable income is reduced by non-cash expenses, such as realized losses and depreciation and amortization expense.
As a regulated investment company, we distribute substantially all of our annual taxable income to shareholders through the payment of cash dividends. Our Board of Directors reviews the dividend rate quarterly, and may adjust the quarterly dividend throughout the year. Dividends are declared considering our estimate of annual taxable income available for distribution to shareholders and the amount of taxable income carried over from the prior year for distribution in the current year. Our goal is to declare what we believe to be sustainable increases in our regular quarterly dividends. To the extent that we earn annual taxable income in excess of dividends paid from such taxable income for the year, we may carry over the excess taxable income into the next year and such excess income will be available for distribution in the next year as permitted under the Code. The maximum amount of excess taxable income that may be carried over for distribution in the next year under the Code is the total amount of dividends paid in the following year, subject to certain declaration and payment guidelines. Excess taxable income carried over and paid out in the next year is generally subject to a nondeductible 4% excise tax. See “Item 7. Management’s Discussion and Analysis of Financial Condition and Results of Operation — Other Matters — Regulated Investment Company Status”. We believe that carrying over excess taxable income into future periods may provide increased visibility with respect to taxable earnings available to pay the regular quarterly dividend.
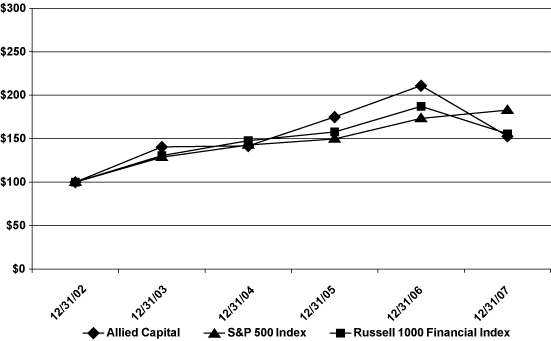
We began paying quarterly dividends in 1963, and our portfolio has provided sufficient ordinary taxable income and realized net capital gains to sustain or grow our dividends over time. Since inception through December 31, 2007, our average annual total return to shareholders (assuming all dividends were reinvested) was 16.9%. Over the past one, three, five and ten years (assuming each period ended on December 31, 2007), our total return to shareholders (assuming all dividends were reinvested) has been (27.6%), 2.5%, 8.9% and 8.8%, respectively, with the dividend providing a meaningful portion of this return.
13
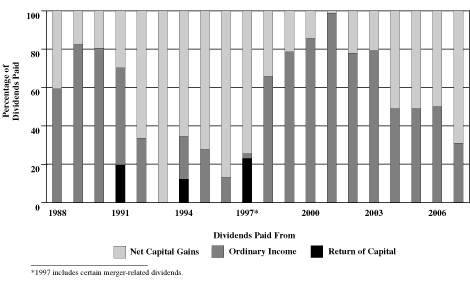
The percentage of our dividend generated by ordinary taxable income versus capital gain income will vary from year to year. The percentage of ordinary taxable income versus net capital gain income supporting the dividend since 1987 is shown below.
Corporate Structure and Offices
We are a Maryland corporation and a closed-end, non-diversified management investment company that has elected to be regulated as a business development company under the 1940 Act. We have a real estate investment trust subsidiary, Allied Capital REIT, Inc., and several subsidiaries that are single-member limited liability companies established for specific purposes, including holding real estate property. We also have a subsidiary, A.C. Corporation, that generally provides diligence and structuring services, as well as transaction, management, consulting, and other services, including underwriting and arranging senior loans, to Allied Capital and our portfolio companies. A.C. Corporation also provides fund management services to certain funds managed by us.
Our executive offices are located at 1919 Pennsylvania Avenue, NW, Washington, DC20006-3434 and our telephone number is (202) 721-6100. In addition, we have regional offices in New York, Chicago, and Los Angeles.
Available Information
Our Internet address is www.alliedcapital.com. We make available free of charge on our website our annual report on Form 10-K, quarterly reports on Form 10-Q, current reports on Form 8-K and amendments to those reports as soon as reasonably practicable after we electronically file such material with, or furnish it to, the SEC. Information contained on our website is not incorporated by reference into this annual report on Form 10-K and you should not consider information contained on our website to be part of this annual report on Form 10-K.
Employees
At December 31, 2007, we employed 177 individuals including investment and portfolio management professionals, operations professionals and administrative staff. The majority of our employees are located in our Washington, DC office. We believe that our relations with our employees are excellent.
14
Certain Government Regulations
We operate in a highly regulated environment. The following discussion generally summarizes certain government regulations that we are subject to.
Business Development Company.A business development company is defined and regulated by the 1940 Act. A business development company must be organized in the United States for the purpose of investing in or lending to primarily private companies and making managerial assistance available to them. A business development company may use capital provided by public shareholders and from other sources to invest in long-term, private investments in businesses. A business development company provides shareholders the ability to retain the liquidity of a publicly traded stock, while sharing in the possible benefits, if any, of investing in primarily privately owned companies.
As a business development company, we may not acquire any asset other than “qualifying assets” unless, at the time we make the acquisition, the value of our qualifying assets represent at least 70% of the value of our total assets. The principal categories of qualifying assets relevant to our business are:
| | |
| | • | Securities purchased in transactions not involving any public offering, the issuer of which is an eligible portfolio company; |
| |
| | • | Securities received in exchange for or distributed with respect to securities described in the bullet above or pursuant to the exercise of options, warrants or rights relating to such securities; and |
| |
| | • | Cash, cash items, government securities or high quality debt securities (within the meaning of the 1940 Act), maturing in one year or less from the time of investment. |
An eligible portfolio company is generally a domestic company that is not an investment company and that:
| | |
| | • | does not have a class of securities with respect to which a broker may extend margin credit at the time the acquisition is made; |
| |
| | • | is controlled by the business development company and has an affiliate of a business development company on its board of directors; |
| |
| | • | does not have any class of securities listed on a national securities exchange; or |
| |
| | • | meets such other criteria as may be established by the SEC. |
Control, as defined by the 1940 Act, is presumed to exist where a business development company beneficially owns more than 25% of the outstanding voting securities of the portfolio company.
We do not intend to acquire securities issued by any investment company that exceed the limits imposed by the 1940 Act. Under these limits, we generally cannot acquire more than 3% of the voting stock of any investment company (as defined in the 1940 Act), invest more than 5% of the value of our total assets in the securities of one such investment company or invest more than 10% of the value of our total assets in the securities of such investment companies in the aggregate. With regard to that portion of our portfolio invested in securities issued by investment companies, it should be noted that such investments might subject our stockholders to additional expenses.
In October 2006, the SEC re-proposed rules providing for an additional definition of eligible portfolio company. As re-proposed, the rule would expand the definition of eligible portfolio company to include certain public companies that list their securities on a national securities exchange. The SEC sought comment regarding the application of this proposed rule to companies with: (1) a public float of less than $75 million; (2) a market capitalization of less than $150 million; or (3) a market capitalization of less than $250 million. There is no assurance that such proposal will be adopted or what the final proposal will entail.
To include certain securities described above as qualifying assets for the purpose of the 70% test, a business development company must make available to the issuer of those securities significant managerial assistance such as providing significant guidance and counsel concerning the management, operations, or
15
business objectives and policies of a portfolio company. We offer to provide significant managerial assistance to our portfolio companies.
As a business development company, we are entitled to issue senior securities in the form of stock or senior securities representing indebtedness, including debt securities and preferred stock, as long as each class of senior security has an asset coverage of at least 200% immediately after each such issuance. In addition, while any senior securities remain outstanding, we must make provisions to prohibit any distribution to our shareholders unless we meet the applicable asset coverage ratio at the time of the distribution.
We are not generally able to issue and sell our common stock at a price below net asset value per share. We may, however, sell our common stock, at a price below the current net asset value of the common stock, or sell warrants, options or rights to acquire such common stock, at a price below the current net asset value of the common stock if our board of directors determines that such sale is in the best interests of the Company and our stockholders, and our stockholders approve our policy and practice of making such sales. We have included such a proposal in our proxy statement for our 2008 Annual Meeting of Stockholders. In any such case, the price at which our securities are to be issued and sold may not be less than a price which, in the determination of our board of directors, closely approximates the market value of such securities (less any distributing commission or discount).
We are also limited in the amount of stock options that may be issued and outstanding at any point in time. The 1940 Act provides that the amount of a business development company’s voting securities that would result from the exercise of all outstanding warrants, options and rights at the time of issuance may not exceed 25% of the business development company’s outstanding voting securities, except that if the amount of voting securities that would result from the exercise of all outstanding warrants, options, and rights issued to the business development company’s directors, officers, and employees pursuant to any executive compensation plan would exceed 15% of the business development company’s outstanding voting securities, then the amount of voting securities that would result from the exercise of all outstanding warrants, options, and rights at the time of issuance shall not exceed 20% of the outstanding voting securities of the business development company.
We have applied for an exemptive order of the SEC to permit us to issue restricted shares of our common stock as part of the compensation packages for certain of our employees and directors. There can be no assurance that the SEC will grant an exemptive order to allow the granting of restricted stock. In addition, the issuance of restricted shares of our common stock will require the approval of our stockholders.
We may also be prohibited under the 1940 Act from knowingly participating in certain transactions with our affiliates without the prior approval of the members of our Board of Directors who are not interested persons and, in some cases, prior approval by the SEC. We have been granted an exemptive order by the SEC permitting us to engage in certain transactions that would be permitted if we and our subsidiaries were one company and permitting certain transactions among our subsidiaries, subject to certain conditions and limitations.
We have designated a chief compliance officer and established a compliance program pursuant to the requirements of the 1940 Act. We are periodically examined by the SEC for compliance with the 1940 Act.
As with other companies regulated by the 1940 Act, a business development company must adhere to certain substantive regulatory requirements. A majority of our directors must be persons who are not interested persons, as that term is defined in the 1940 Act. Additionally, we are required to provide and maintain a bond issued by a reputable fidelity insurance company to protect us against larceny and embezzlement. Furthermore, as a business development company, we are prohibited from protecting any director or officer against any liability to us or our shareholders arising from willful misfeasance, bad faith, gross negligence or reckless disregard of the duties involved in the conduct of such person’s office.
We maintain a code of ethics that establishes procedures for personal investment and restricts certain transactions by our personnel. Our code of ethics generally does not permit investment by our employees in securities that have been or are contemplated to be purchased or held by us. Our code of ethics is
16
posted on our website at www.alliedcapital.com and is also filed as an exhibit to our registration statement which is on file with the SEC. You may read and copy the code of ethics at the SEC’s Public Reference Room in Washington, D.C. You may obtain information on operations of the Public Reference Room by calling the SEC at1-800-SEC-0330. In addition, the code of ethics is available on the EDGAR database on the SEC Internet site at http://www.sec.gov. You may obtain copies of the code of ethics, after paying a duplicating fee, by electronic request at the following email address: publicinfo@sec.gov, or by writing to the SEC’s Public Reference Section, 100 F Street, NE, Washington, D.C. 20549.
We may not change the nature of our business so as to cease to be, or withdraw our election as, a business development company unless authorized by vote of a “majority of the outstanding voting securities,” as defined in the 1940 Act. A majority of the outstanding voting securities of a company is defined under the 1940 Act as the lesser of: (i) 67% or more of such company’s shares present at a meeting if more than 50% of the outstanding shares of such company are present and represented by proxy or (ii) more than 50% of the outstanding shares of such company.
Regulated Investment Company Status.We have elected to be taxed as a regulated investment company under Subchapter M of the Code. As long as we qualify as a regulated investment company, we are not taxed on our investment company taxable income or realized net capital gains, to the extent that such taxable income or gains are distributed, or deemed to be distributed, to shareholders on a timely basis.
Taxable income generally differs from net income for financial reporting purposes due to temporary and permanent differences in the recognition of income and expenses, and generally excludes net unrealized appreciation or depreciation, as gains or losses generally are not included in taxable income until they are realized. In addition, gains realized for financial reporting purposes may differ from gains included in taxable income as a result of our election to recognize gains using installment sale treatment, which generally results in the deferment of gains for tax purposes until notes or other amounts, including amounts held in escrow, received as consideration from the sale of investments are collected in cash.
Dividends declared and paid by us in a year generally differ from taxable income for that year as such dividends may include the distribution of current year taxable income, the distribution of prior year taxable income carried over into and distributed in the current year, or returns of capital. We are generally required to distribute 98% of our taxable income during the year the income is earned to avoid paying an excise tax. If this requirement is not met, the Code imposes a nondeductible excise tax equal to 4% of the amount by which 98% of the current year’s taxable income exceeds the distribution for the year from such taxable income. The taxable income on which an excise tax is paid is generally carried over and distributed to shareholders in the next tax year. Depending on the level of taxable income earned in a tax year, we may choose to carry over taxable income in excess of current year distributions from such taxable income into the next tax year and pay a 4% excise tax on such income, as required.
In order to maintain our status as a regulated investment company and obtain regulated investment company tax benefits, we must, in general, (1) continue to qualify as a business development company; (2) derive at least 90% of our gross income from dividends, interest, gains from the sale of securities and other specified types of income; (3) meet asset diversification requirements as defined in the Code; and (4) timely distribute to shareholders at least 90% of our annual investment company taxable income as defined in the Code. We intend to take all steps necessary to continue to qualify as a regulated investment company. However, there can be no assurance that we will continue to qualify for such treatment in future years.
Compliance with the Sarbanes-Oxley Act of 2002.The Sarbanes-Oxley Act of 2002 (the Sarbanes-Oxley Act) imposes a wide variety of regulatory requirements on publicly held companies and their insiders. Many of these requirements apply to us, including:
| | |
| | • | Our Chief Executive Officer and Chief Financial Officer certify the financial statements contained in our periodic reports through the filing of Section 302 certifications; |
17
| | |
| | • | Our periodic reports disclose our conclusions about the effectiveness of our disclosure controls and procedures; |
| |
| | • | Our annual report on Form 10-K contains a report from our management on internal control over financial reporting, including a statement that our management is responsible for establishing and maintaining adequate internal control over financial reporting as well as our management’s assessment of the effectiveness of our internal control over financial reporting, and an attestation report on the effectiveness of our internal control over financial reporting issued by our independent registered public accounting firm; |
| |
| | • | Our periodic reports disclose whether there were significant changes in our internal control over financial reporting or in other factors that could significantly affect our internal control over financial reporting subsequent to the date of their evaluation, including any corrective actions with regard to significant deficiencies and material weaknesses; and |
| |
| | • | We may not make any loan to any director or executive officer and we may not materially modify any existing loans. |
We have adopted procedures to comply with the Sarbanes-Oxley Act and the regulations promulgated thereunder. We will continue to monitor our compliance with all future regulations that are adopted under the Sarbanes-Oxley Act and will take actions necessary to ensure that we are in compliance therewith.
We have adopted certain policies and procedures to comply with the New York Stock Exchange (NYSE) corporate governance rules. In accordance with the NYSE procedures, shortly after our 2007 Annual Meeting of Stockholders, we submitted the required CEO certification to the NYSE pursuant to Section 303A.12(a) of the listed company manual.
Item 1A. Risk Factors.
Investing in Allied Capital involves a number of significant risks relating to our business and investment objective. As a result, there can be no assurance that we will achieve our investment objective.
Our portfolio of investments is illiquid. We generally acquire our investments directly from the issuer in privately negotiated transactions. The majority of the investments in our portfolio are subject to certain restrictions on resale or otherwise have no established trading market. We typically exit our investments when the portfolio company has a liquidity event such as a sale, recapitalization, or initial public offering of the company. The illiquidity of our investments may adversely affect our ability to dispose of debt and equity securities at times when we may need to or when it may be otherwise advantageous for us to liquidate such investments. In addition, if we were forced to immediately liquidate some or all of the investments in the portfolio, the proceeds of such liquidation could be significantly less than the current value of such investments.
Investing in private companies involves a high degree of risk. Our portfolio primarily consists of long-term loans to and investments in middle market private companies. Investments in private businesses involve a high degree of business and financial risk, which can result in substantial losses for us in those investments and accordingly should be considered speculative. There is generally no publicly available information about the companies in which we invest, and we rely significantly on the diligence of our employees and agents to obtain information in connection with our investment decisions. If we are unable to identify all material information about these companies, among other factors, we may fail to receive the expected return on our investment or lose some or all of the money invested in these companies. In addition, these businesses may have shorter operating histories, narrower product lines, smaller market shares and less experienced management than their competition and may be more vulnerable to customer preferences, market conditions, loss of key personnel, or economic downturns, which may adversely affect the return on, or the recovery of, our investment in such businesses. As an investor, we are subject to the risk that a portfolio company may make a business decision that does not serve our interest, which could decrease the value of our investment. Deterioration in a portfolio company’s financial condition and prospects may be accompanied by deterioration in the collateral for a loan, if any.
18
Substantially all of our portfolio investments, which are generally illiquid, are recorded at fair value as determined in good faith by our Board of Directors and, as a result, there is uncertainty regarding the value of our portfolio investments. At December 31, 2007, portfolio investments recorded at fair value were 92% of our total assets. Pursuant to the requirements of the 1940 Act, we value substantially all of our investments at fair value as determined in good faith by our Board of Directors on a quarterly basis. Since there is typically no readily available market value for the investments in our portfolio, our Board of Directors determines in good faith the fair value of these investments pursuant to a valuation policy and a consistently applied valuation process.
There is no single standard for determining fair value in good faith. As a result, determining fair value requires that judgment be applied to the specific facts and circumstances of each portfolio investment while employing a consistently applied valuation process for the types of investments we make. In determining fair value in good faith, we generally obtain financial and other information from portfolio companies, which may represent unaudited, projected or proforma financial information. Unlike banks, we are not permitted to provide a general reserve for anticipated loan losses; we are instead required by the 1940 Act to specifically value each individual investment on a quarterly basis and record unrealized depreciation for an investment that we believe has become impaired, including where collection of a loan or realization of an equity security is doubtful, or when the enterprise value of the portfolio company does not currently support the cost of our debt or equity investment. Enterprise value means the entire value of the company to a potential buyer, including the sum of the values of debt and equity securities used to capitalize the enterprise at a point in time. We will record unrealized appreciation if we believe that the underlying portfolio company has appreciated in value and/or our equity security has appreciated in value. Without a readily available market value and because of the inherent uncertainty of valuation, the fair value of our investments determined in good faith by the Board of Directors may differ significantly from the values that would have been used had a ready market existed for the investments, and the differences could be material. Our net asset value could be affected if our determination of the fair value of our investments is materially different than the value that we ultimately realize.
We adjust quarterly the valuation of our portfolio to reflect the Board of Directors’ determination of the fair value of each investment in our portfolio. Any changes in fair value are recorded in our statement of operations as net change in unrealized appreciation or depreciation.
We are currently analyzing the effect of adoption of Statement No. 157,Fair Value Measurements, on our consolidated financial position, including our net asset value and results of operations. We will adopt this statement on a prospective basis beginning in the quarter ending March 31, 2008. Adoption of this statement could have a material effect on our consolidated financial statements, including our net asset value. However, the actual impact on our consolidated financial statements in the period of adoption and subsequent to the period of adoption cannot be determined at this time as it will be influenced by the estimates of fair value for that period and the number and amount of investments we originate, acquire or exit. See Note 2, “Summary of Significant Accounting Policies” from our Notes to the Consolidated Financial Statements included in Item 8.
Economic recessions or downturns could impair our portfolio companies and harm our operating results. Many of the companies in which we have made or will make investments may be susceptible to economic slowdowns or recessions. An economic slowdown may affect the ability of a company to repay our loans or engage in a liquidity event such as a sale, recapitalization, or initial public offering. Our nonperforming assets are likely to increase and the value of our portfolio is likely to decrease during these periods. Adverse economic conditions also may decrease the value of any collateral securing some of our loans. These conditions could lead to financial losses in our portfolio and a decrease in our revenues, net income, and assets.
Our business of making private equity investments and positioning them for liquidity events also may be affected by current and future market conditions. The absence of an active senior lending environment or a slowdown in middle market merger and acquisition activity may slow the amount of private equity investment activity generally. As a result, the pace of our investment activity may slow. In addition,
19
significant changes in the capital markets could have an effect on the valuations of private companies, which may negatively affect the value of our investments, and on the potential for liquidity events involving such companies. This could affect the timing of exit events in our portfolio, reduce the level of net realized gains from exit events in a given year, and could negatively affect the amount of gains or losses upon exit.
Our borrowers may default on their payments, which may have a negative effect on our financial performance. We make long-term loans and invest in equity securities primarily in private middle market companies, which may involve a higher degree of repayment risk. We primarily invest in companies that may have limited financial resources, may be highly leveraged and may be unable to obtain financing from traditional sources. Numerous factors may affect a borrower’s ability to repay its loan, including the failure to meet its business plan, a downturn in its industry, or negative economic conditions. A portfolio company’s failure to satisfy financial or operating covenants imposed by us or other lenders could lead to defaults and, potentially, termination of its loans or foreclosure on its secured assets, which could trigger cross defaults under other agreements and jeopardize our portfolio company’s ability to meet its obligations under the loans or debt securities that we hold. In addition, our portfolio companies may have, or may be permitted to incur, other debt that ranks senior to or equally with our securities. This means that payments on such senior-ranking securities may have to be made before we receive any payments on our subordinated loans or debt securities. Deterioration in a borrower’s financial condition and prospects may be accompanied by deterioration in any related collateral and may have a negative effect on our financial results.
Our private finance investments may not produce current returns or capital gains. Our private finance portfolio includes loan and debt securities that require the payment of interest currently and equity securities such as conversion rights, warrants, or options, minority equityco-investments, or more significant equity investments in the case of buyout transactions. Our private finance debt investments are generally structured to generate interest income from the time they are made and our equity investments may also produce a realized gain. We cannot be sure that our portfolio will generate a current return or capital gains.
Our financial results could be negatively affected if a significant portfolio investment fails to perform as expected. Our total investment in companies may be significant individually or in the aggregate. As a result, if a significant investment in one or more companies fails to perform as expected, our financial results could be more negatively affected and the magnitude of the loss could be more significant than if we had made smaller investments in more companies.
At December 31, 2007, our investment in Ciena Capital LLC (f/k/a Business Loan Express, LLC) (Ciena) totaled $327.8 million at cost and $68.6 million at value, after the effect of unrealized depreciation of $259.2 million. In addition, we have an unconditional guarantee of 100% of the total obligations under Ciena’s revolving credit facility that totaled $399.0 million at January 31, 2008. Ciena focuses on loan products that provide financing to commercial real estate owners and operators. Ciena relies on the asset-backed securitization market to finance its loan origination activity. That financing source is an unreliable one in the current capital markets, and as a result, Ciena has significantly curtailed loan origination activity. Ciena continues to reposition its business; however, there is an inherent risk in repositioning the business and we continue to work with Ciena on restructuring. Ciena is a participant in the SBA’s 7(a) Guaranteed Loan Program and its wholly-owned subsidiary is licensed by the SBA as a Small Business Lending Company (SBLC). The Office of the Inspector General of the SBA (OIG) and the United States Secret Service are conducting ongoing investigations of allegedly fraudulently obtained SBA-guaranteed loans issued by Ciena. The OIG and the U.S. Department of Justice are also conducting a civil investigation of Ciena’s lending practices in various jurisdictions. As an SBA lender, Ciena is also subject to other SBA and OIG audits, investigations, and reviews. In addition, the Office of the Inspector General of the U.S. Department of Agriculture is conducting an investigation of Ciena’s lending practices under the Business and Industry Loan program. These investigations, audits, and reviews are ongoing. These investigations, audits, and reviews have had and may continue to have a material adverse impact on Ciena and, as a result, could negatively affect our
20
financial results. See “Item 7. Management’s Discussion and Analysis of Financial Condition and Results of Operations — Private Finance, Ciena Capital LLC, and — Valuation of Ciena Capital LLC”.
We borrow money, which magnifies the potential for gain or loss on amounts invested and may increase the risk of investing in us. Borrowings, also known as leverage, magnify the potential for gain or loss on amounts invested and, therefore, increase the risks associated with investing in our securities. We borrow from and issue senior debt securities to banks, insurance companies, and other lenders or investors. Holders of these senior securities have fixed dollar claims on our consolidated assets that are superior to the claims of our common shareholders. If the value of our consolidated assets increases, then leveraging would cause the net asset value attributable to our common stock to increase more sharply than it would have had we not leveraged. Conversely, if the value of our consolidated assets decreases, leveraging would cause net asset value to decline more sharply than it otherwise would have had we not leveraged. Similarly, any increase in our consolidated income in excess of consolidated interest payable on the borrowed funds would cause our net income to increase more than it would without the leverage, while any decrease in our consolidated income would cause net income to decline more sharply than it would have had we not borrowed. Such a decline could negatively affect our ability to make common stock dividend payments. Leverage is generally considered a speculative investment technique. We and, indirectly, our stockholders will bear the cost associated with our leverage activity. Our revolving line of credit and notes payable contain financial and operating covenants that could restrict our business activities, including our ability to declare dividends if we default under certain provisions. Breach of any of those covenants could cause a default under those instruments. Such a default, if not cured or waived, could have a material adverse effect on us.
At December 31, 2007, we had $2.3 billion of outstanding indebtedness bearing a weighted average annual interest cost of 6.5% and a debt to equity ratio of 0.83 to 1.00. We may incur additional debt in the future. If our portfolio of investments fails to produce adequate returns, we may be unable to make interest or principal payments on our indebtedness when they are due. In order for us to cover annual interest payments on indebtedness, we must achieve annual returns on our assets of at least 2.8% as of December 31, 2007, which returns were achieved.
We may not borrow money unless we maintain asset coverage for indebtedness of at least 200%, which may affect returns to shareholders. Under the 1940 Act and the covenants applicable to our public debt, we must maintain asset coverage for total borrowings of at least 200%. Our ability to achieve our investment objective may depend in part on our continued ability to maintain a leveraged capital structure by borrowing from banks, insurance companies or other lenders or investors on favorable terms. There can be no assurance that we will be able to maintain such leverage. If asset coverage declines to less than 200%, we may be required to sell a portion of our investments when it is disadvantageous to do so. As of December 31, 2007, our asset coverage for senior indebtedness was 221%.
Changes in interest rates may affect our cost of capital and net investment income. Because we borrow money to make investments, our net investment income is dependent upon the difference between the rate at which we borrow funds and the rate at which we invest these funds. As a result, there can be no assurance that a significant change in market interest rates will not have a material adverse effect on our net investment income. In periods of rising interest rates, our cost of funds would increase, which would reduce our net investment income. We use a combination of long-term and short-term borrowings and equity capital to finance our investing activities. We utilize our revolving line of credit as a means to bridge to long-term financing. Our long-term fixed-rate investments are financed primarily with long-term fixed-rate debt and equity. We may use interest rate risk management techniques in an effort to limit our exposure to interest rate fluctuations. Such techniques may include various interest rate hedging activities to the extent permitted by the 1940 Act. We have analyzed the potential impact of changes in interest rates on interest income net of interest expense.
Assuming that the balance sheet as of December 31, 2007, were to remain constant and no actions were taken to alter the existing interest rate sensitivity, a hypothetical immediate 1% change in interest rates would have affected net income by approximately 1% over a one year horizon. Although management
21
believes that this measure is indicative of our sensitivity to interest rate changes, it does not adjust for potential changes in credit quality, size and composition of the assets on the balance sheet and other business developments that could affect net increase in net assets resulting from operations, or net income. Accordingly, no assurances can be given that actual results would not differ materially from the potential outcome simulated by this estimate.
We will continue to need additional capital to grow because we must distribute our income. We will continue to need capital to fund growth in our investments. Historically, we have borrowed from financial institutions or other investors and have issued debt and equity securities to grow our portfolio. A reduction in the availability of new debt or equity capital could limit our ability to grow. We must distribute at least 90% of our investment company taxable ordinary income (as defined in the Code), which excludes realized net long-term capital gains, to our shareholders to maintain our eligibility for the tax benefits available to regulated investment companies. As a result, such earnings will not be available to fund investment originations. In addition, as a business development company, we (i) are generally required to maintain a ratio of at least 200% of total assets to total borrowings, which may restrict our ability to borrow in certain circumstances and (ii) may only issue new equity capital at a price, net of discounts and commissions, above our net asset value unless we have received shareholder approval. We intend to continue to borrow from financial institutions or other investors and issue additional debt and equity securities. If we fail to obtain funds from such sources or from other sources to fund our investments, it could limit our ability to grow, which could have a material adverse effect on the value of our debt securities or common stock.
Loss of regulated investment company tax treatment would substantially reduce net assets and income available for debt service and dividends. We have operated so as to qualify as a regulated investment company under Subchapter M of the Code. If we meet source of income, asset diversification, and distribution requirements, we generally will not be subject to corporate-level income taxation on income we timely distribute to our stockholders as dividends. We would cease to qualify for such tax treatment if we were unable to comply with these requirements. In addition, we may have difficulty meeting the requirement to make distributions to our stockholders because in certain cases we may recognize income before or without receiving cash representing such income. If we fail to qualify as a regulated investment company, we will have to pay corporate-level taxes on all of our income whether or not we distribute it, which would substantially reduce the amount of income available for debt service and distributions to our stockholders. Even if we qualify as a regulated investment company, we generally will be subject to a corporate-level income tax on the income we do not distribute. If we do not distribute at least 98% of our annual taxable income in the year earned, we generally will be required to pay an excise tax on amounts carried over and distributed to shareholders in the next year equal to 4% of the amount by which 98% of our annual taxable income exceeds the distributions from such income for the current year.
There is a risk that our common stockholders may not receive dividends or distributions. We intend to make distributions on a quarterly basis to our stockholders. We may not be able to achieve operating results that will allow us to make distributions at a specific level or to increase the amount of these distributions from time to time. In addition, due to the asset coverage test applicable to us as a business development company, we may be limited in our ability to make distributions. Also, certain of our credit facilities limit our ability to declare dividends if we default under certain provisions. If we do not distribute a certain percentage of our income annually, we will suffer adverse tax consequences, including possible loss of the tax benefits available to us as a regulated investment company. In addition, in accordance with U.S. generally accepted accounting principles and tax regulations, we include in income certain amounts that we have not yet received in cash, such as contractual payment-in-kind interest, which represents contractual interest added to the loan balance that becomes due at the end of the loan term, or the accrual of original issue discount. The increases in loan balances as a result of contractual payment-in-kind arrangements are included in income in advance of receiving cash payment and are separately included in the change in accrued or reinvested interest and dividends in our consolidated statement of cash flows. Since we may recognize income before or without receiving cash representing such income, we
22
may have difficulty meeting the requirement to distribute at least 90% of our investment company taxable income to obtain tax benefits as a regulated investment company.
We operate in a competitive market for investment opportunities. We compete for investments with a large number of private equity funds and mezzanine funds, other business development companies, investment banks, other equity and non-equity based investment funds, and other sources of financing, including specialty finance companies and traditional financial services companies such as commercial banks. Some of our competitors may have greater resources than we do. Increased competition would make it more difficult for us to purchase or originate investments at attractive prices. As a result of this competition, sometimes we may be precluded from making otherwise attractive investments.
There are potential conflicts of interest between us and the funds managed by us. Certain of our officers serve or may serve in an investment management capacity to funds managed by us. As a result, investment professionals may allocate such time and attention as is deemed appropriate and necessary to carry out the operations of the managed funds. In this respect, they may experience diversions of their attention from us and potential conflicts of interest between their work for us and their work for the managed funds in the event that the interests of the managed funds run counter to our interests.
Although managed funds may have a different primary investment objective than we do, the managed funds may, from time to time, invest in the same or similar asset classes that we target. These investments may be made at the direction of the same individuals acting in their capacity on behalf of us and the managed funds. As a result, there may be conflicts in the allocation of investment opportunities between us and the managed funds. In the future, we may not be given the opportunity to participate in investments made by investment funds managed by us or one of our affiliates. See “Management’s Discussion and Analysis and Results of Operations — Managed Funds” below.
We have sold assets to certain managed funds and, as part of our investment strategy, we may offer to sell additional assets to managed funds or we may purchase assets from managed funds. While assets may be sold or purchased at prices that are consistent with those that could be obtained from third parties in the marketplace, there is an inherent conflict of interest in such transactions between us and funds we manage.
Our business depends on our key personnel. We depend on the continued services of our executive officers and other key management personnel. If we were to lose any of these officers or other management personnel, such a loss could result in inefficiencies in our operations and lost business opportunities, which could have a negative effect on our business.
Changes in the law or regulations that govern us could have a material impact on us or our operations. We are regulated by the SEC. In addition, changes in the laws or regulations that govern business development companies, regulated investment companies, and real estate investment trusts may significantly affect our business. Any change in the law or regulations that govern our business could have a material impact on us or our operations. Laws and regulations may be changed from time to time, and the interpretations of the relevant laws and regulations also are subject to change, which may have a material effect on our operations.
Failure to invest a sufficient portion of our assets in qualifying assets could preclude us from investing in accordance with our current business strategy. As a business development company, we may not acquire any assets other than “qualifying assets” unless, at the time of and after giving effect to such acquisition, at least 70% of our total assets are qualifying assets. Therefore, we may be precluded from investing in what we believe are attractive investments if such investments are not qualifying assets for purposes of the 1940 Act. If we do not invest a sufficient portion of our assets in qualifying assets, we could lose our status as a business development company, which would have a material adverse effect on our business, financial condition and results of operations. Similarly, these rules could prevent us from making additional investments in existing portfolio companies, which could result in the dilution of our position, or could require us to dispose of investments at inopportune times in order to comply with the
23
1940 Act. If we were forced to sell nonqualifying investments in the portfolio for compliance purposes, the proceeds from such sale could be significantly less than the current value of such investments.
Results may fluctuate and may not be indicative of future performance. Our operating results may fluctuate and, therefore, you should not rely on current or historical period results to be indicative of our performance in future reporting periods. Factors that could cause operating results to fluctuate include, but are not limited to, variations in the investment origination volume and fee income earned, changes in the accrual status of our loans and debt securities, variations in timing of prepayments, variations in and the timing of the recognition of net realized gains or losses and changes in unrealized appreciation or depreciation, the level of our expenses, the degree to which we encounter competition in our markets, and general economic conditions.
Our common stock price may be volatile. The trading price of our common stock may fluctuate substantially. The price of the common stock may be higher or lower than the price paid by stockholders, depending on many factors, some of which are beyond our control and may not be directly related to our operating performance. These factors include, but are not limited to, the following:
| | |
| | • | price and volume fluctuations in the overall stock market from time to time; |
| |
| | • | significant volatility in the market price and trading volume of securities of business development companies or other financial services companies; |
| |
| | • | volatility resulting from trading in derivative securities related to our common stock including puts, calls, long-term equity anticipation securities, or LEAPs, or short trading positions; |
| |
| | • | changes in laws or regulatory policies or tax guidelines with respect to business development companies or regulated investment companies; |
| |
| | • | actual or anticipated changes in our earnings or fluctuations in our operating results or changes in the expectations of securities analysts; |
| |
| | • | general economic conditions and trends; |
| |
| | • | loss of a major funding source; or |
| |
| | • | departures of key personnel. |
The trading market or market value of our publicly issued debt securities may be volatile. Our publicly issued debt securities may or may not have an established trading market. We cannot assure that a trading market for our publicly issued debt securities will ever develop or be maintained if developed. In addition to our creditworthiness, many factors may materially adversely affect the trading market for, and market value of, our publicly issued debt securities. These factors include, but are not limited to, the following:
| | |
| | • | the time remaining to the maturity of these debt securities; |
| |
| | • | the outstanding principal amount of debt securities with terms identical to these debt securities; |
| |
| | • | the supply of debt securities trading in the secondary market, if any; |
| |
| | • | the redemption or repayment features, if any, of these debt securities; |
| |
| | • | the level, direction and volatility of market interest rates generally; and |
| |
| | • | market rates of interest higher or lower than rates borne by the debt securities. |
There also may be a limited number of buyers for our debt securities. This too may materially adversely affect the market value of the debt securities or the trading market for the debt securities.
Our credit ratings may not reflect all risks of an investment in the debt securities. Our credit ratings are an assessment of our ability to pay our obligations. Consequently, real or anticipated changes in our credit ratings will generally affect the market value of the publicly issued debt securities. Our credit
24
ratings, however, may not reflect the potential impact of risks related to market conditions generally or other factors discussed above on the market value of, or trading market for, the publicly issued debt securities.
Terms relating to redemption may materially adversely affect the return on the debt securities. If our debt securities are redeemable at our option, we may choose to redeem the debt securities at times when prevailing interest rates are lower than the interest rate paid on the debt securities. In addition, if the debt securities are subject to mandatory redemption, we may be required to redeem the debt securities at times when prevailing interest rates are lower than the interest rate paid on the debt securities. In this circumstance, a holder of the debt securities may not be able to reinvest the redemption proceeds in a comparable security at an effective interest rate as high as the debt securities being redeemed.
Item 1B. Unresolved Staff Comments
Not applicable.
Item 2. Properties.
Our principal offices are located at 1919 Pennsylvania Avenue, N.W., Washington, DC20006-3434. Our lease for approximately 56,000 square feet of office space at that location expires in December 2010. The office is equipped with an integrated network of computers for word processing, financial analysis, accounting and loan servicing. We believe our office space is suitable for our needs for the foreseeable future. We also maintain offices in New York, NY; Chicago, IL; and Los Angeles, CA.
| |
| Item 3. | Legal Proceedings. |
On June 23, 2004, we were notified by the SEC that they were conducting an informal investigation of us. The investigation related to the valuation of securities in our private finance portfolio and other matters. On June 20, 2007, we announced that we entered into a settlement with the SEC that resolved the SEC’s informal investigation. As part of the settlement and without admitting or denying the SEC’s allegations, we agreed to the entry of an administrative order. In the order the SEC alleged that, between June 30, 2001, and March 31, 2003, we did not maintain books, records and accounts which, in reasonable detail, supported or accurately and fairly reflected valuations of certain securities in our private finance portfolio and, as a result, did not meet certain recordkeeping and internal controls provisions of the federal securities laws. In the administrative order, the SEC ordered us to continue to maintain certain of our current valuation-related controls. Specifically, for a period of two years, we have undertaken to: (1) continue to employ a Chief Valuation Officer, or a similarly structured officer-level employee, to oversee our quarterly valuation processes; and (2) continue to employ third-party valuation consultants to assist in our quarterly valuation processes.
On December 22, 2004, we received letters from the U.S. Attorney for the District of Columbia requesting the preservation and production of information regarding us and Business Loan Express, LLC (currently known as Ciena Capital LLC) in connection with a criminal investigation relating to matters similar to those investigated by and settled with the SEC as discussed above. We produced materials in response to the requests from the U.S. Attorney’s office and certain current and former employees were interviewed by the U.S. Attorney’s Office. We have voluntarily cooperated with the investigation.
In late December 2006, we received a subpoena from the U.S. Attorney for the District of Columbia requesting, among other things, the production of records regarding the use of private investigators by us or our agents. The Board established a committee, which was advised by its own counsel, to review this matter. In the course of gathering documents responsive to the subpoena, we became aware that an agent of Allied Capital obtained what were represented to be telephone records of David Einhorn and which purport to be records of calls from Greenlight Capital during a period of time in 2005. Also, while we were gathering documents responsive to the subpoena, allegations were made that our management had authorized the acquisition of these records and that management was subsequently advised that these
25
records had been obtained. Our management has stated that these allegations are not true. We have cooperated fully with the inquiry by the U.S. Attorney’s Office.
On February 13, 2007, Rena Nadoff filed a shareholder derivative action in the Superior Court of the District of Columbia, captioned Rena Nadoff v. Walton, et al., CA 001060-07, seeking unspecified compensatory and other damages, as well as equitable relief on behalf of Allied Capital Corporation. The complaint was summarily dismissed in July 2007. The complaint alleged breach of fiduciary duty by the Board of Directors arising from internal control failures and mismanagement of Business Loan Express, LLC, an Allied Capital portfolio company. On October 5, 2007, Rena Nadoff sent a letter to our Board of Directors with substantially the same claims and a request that the Board of Directors investigate the claims and take appropriate action. The Board of Directors has established a committee, which is advised by its own counsel, to review the matter.
On February 26, 2007, Dana Ross filed a class action complaint in the U.S. District Court for the District of Columbia in which she alleges that Allied Capital Corporation and certain members of management violated Sections 10(b) and 20(a) of the Securities Exchange Act of 1934 and Rule 10b-5 thereunder. Thereafter, the court appointed new lead counsel and approved new lead plaintiffs. On July 30, 2007, plaintiffs served an amended complaint. Plaintiffs claim that, between November 7, 2005, and January 22, 2007, Allied Capital either failed to disclose or misrepresented information about our portfolio company, Business Loan Express, LLC. Plaintiffs seek unspecified compensatory and other damages, as well as other relief. We believe the lawsuit is without merit, and we intend to defend the lawsuit vigorously. On September 13, 2007, we filed a motion to dismiss the lawsuit. The motion is pending.
In addition to the above matters, we are party to certain lawsuits in the normal course of business.
While the outcome of any of the open legal proceedings described above cannot at this time be predicted with certainty, we do not expect these matters will materially affect our financial condition or results of operations; however, there can be no assurance whether any pending legal proceedings will have a material adverse effect on our financial condition or results of operations in any future reporting period.
Item 4. Submission of Matters to a Vote of Security Holders.
No matters were submitted to a vote of stockholders during the fourth quarter of 2007.
PART II
Item 5. Market For Registrant’s Common Equity, Related Stockholder Matters and Issuer Purchases of Equity Securities.
Our common stock is traded on the New York Stock Exchange under the trading symbol ALD as its primary listing and is also traded on the Nasdaq Global Select Market. There are approximately 4,000 shareholders of record and approximately 179,000 beneficial shareholders of the Company. The quarterly stock prices quoted below represent interdealer quotations and do not include markups, markdowns, or commissions and may not necessarily represent actual transactions.
Quarterly Stock Prices for 2007 and 2006
| | | | | | | | | | | | | | | | | | | | | | | | | | | | | | | | | |
| | | 2007 | | | 2006 | |
| | | | | | | |
| | | Q1 | | | Q2 | | | Q3 | | | Q4 | | | Q1 | | | Q2 | | | Q3 | | | Q4 | |
| | | | | | | | | | | | | | | | | | | | | | | | | |
| High | | $ | 32.98 | | | $ | 32.96 | | | $ | 32.87 | | | $ | 30.90 | | | $ | 30.68 | | | $ | 31.32 | | | $ | 30.88 | | | $ | 32.70 | |
| Low | | $ | 28.05 | | | $ | 28.90 | | | $ | 27.10 | | | $ | 21.15 | | | $ | 28.51 | | | $ | 28.77 | | | $ | 27.30 | | | $ | 29.99 | |
| Close | | $ | 28.81 | | | $ | 30.96 | | | $ | 29.39 | | | $ | 21.50 | | | $ | 30.60 | | | $ | 28.77 | | | $ | 30.21 | | | $ | 32.68 | |
We began paying quarterly dividends in 1963, and our portfolio has provided sufficient ordinary taxable income and realized net capital gains to sustain or grow our dividends over time. See “Item 7. Management’s Discussion and Analysis of Financial Condition and Results of Operations — Other Matters
26
and Dividends and Distributions” and Note 10, “Dividends and Distributions and Taxes” from our Notes to the Consolidated Financial Statements included in Item 8.
Dividend Declarations
The following table summarizes our dividends declared during 2007 and 2006:
| | | | | | | | | | | | | | |
| Date Declared | | Record Date | | | Payment Date | | | Amount | |
| | | | | | | | | | |
| February 2, 2007 | | | March 16, 2007 | | | | March 28, 2007 | | | $ | 0.63 | |
| April 24, 2007 | | | June 15, 2007 | | | | June 27, 2007 | | | $ | 0.64 | |
| July 27, 2007 | | | September 14, 2007 | | | | September 26, 2007 | | | $ | 0.65 | |
| July 27, 2007 | | | December 14, 2007 | | | | December 26, 2007 | | | $ | 0.65 | |
| September 14, 2007 | | | December 14, 2007 | | | | December 27, 2007 | | | $ | 0.07 | |
| | | | | | | | | | |
| | Total declared for 2007 | | | | | | | | | | $ | 2.64 | |
| | | | | | | | | | |
| January 20, 2006 | | | March 17, 2006 | | | | March 31, 2006 | | | $ | 0.59 | |
| April 21, 2006 | | | June 16, 2006 | | | | June 30, 2006 | | | $ | 0.60 | |
| July 21, 2006 | | | September 15, 2006 | | | | September 29, 2006 | | | $ | 0.61 | |
| October 20, 2006 | | | December 15, 2006 | | | | December 27, 2006 | | | $ | 0.62 | |
| December 12, 2006 | | | December 22, 2006 | | | | January 19, 2007 | | | $ | 0.05 | |
| | | | | | | | | | |
| | Total declared for 2006 | | | | | | | | | | $ | 2.47 | |
| | | | | | | | | | |
The Board of Directors has declared a dividend of $0.65 per common share for the first quarter of 2008.
27
Performance Graph
This graph compares the return on our common stock with that of the Standard & Poor’s 500 Stock Index and the Russell 1000 Financial Index, for the years 2003 through 2007. The graph assumes that, on December 31, 2002, a person invested $100 in each of our common stock, the S&P 500 Stock Index, and the Russell 1000 Financial Index. The graph measures total shareholder return, which takes into account both changes in stock price and dividends. It assumes that dividends paid are reinvested in like securities.
Shareholder Return Performance Graph
Five-Year Cumulative Total Return(1)
(Through December 31, 2007)
| |
| (1) | Total return includes reinvestment of dividends through December 31, 2007. |
Sales of Unregistered Securities
During 2007, we issued 623,951 shares of common stock pursuant to our dividend reinvestment plan in lieu of cash distributions. This plan is not registered and relies on an exemption from registration under the Securities Act of 1933. See Note 6, “Shareholders’ Equity” from our Notes to the Consolidated Financial Statements included in Item 8.
In July 2007, we completed a tender offer related to our offer to all optionees who held vested “in-the-money” stock options as of June 20, 2007, to receive an option cancellation payment (OCP) equal to the “in-the-money” value of the stock options cancelled, determined based on the Weighted Average Market Price of $31.75. The OCP was paid one-half in cash and one-half in unregistered shares of our common stock. We accepted for cancellation 10.3 million vested options, which in the aggregate had a weighted average exercise price of $21.50. This resulted in a total option cancellation payment of approximately $105.6 million, of which $52.8 million was paid in cash and $52.8 million was paid through the issuance of 1.7 million unregistered shares of our common stock, determined using the Weighted Average Market Price of $31.75. The Weighted Average Market Price represented the volume weighted average price of our common stock over the fifteen trading days preceding the first day of the offer period, or June 20, 2007. The 1.7 million shares were issued pursuant to an exemption from the registration requirements of the Securities Act of 1933.
28
Issuer Purchases of Equity Securities
The following table provides information for the quarter ended December 31, 2007, regarding shares of our common stock that were purchased under The 2005 Allied Capital Corporation Non-Qualified Deferred Compensation Plan I (2005 DCP I) and The 2005 Allied Capital Corporation Non-Qualified Deferred Compensation Plan II (2005 DCP II), which are administered by a third-party trustee. The administrator of the 2005 DCP I and 2005 DCP II is the Compensation Committee of our Board of Directors.
| | | | | | | | | | |
| | | Total Number | | | Weighted Average | |
| | | of Shares | | | Price Paid | |
| | | Purchased | | | Per Share | |
| | | | | | | |
2005 DCP I(1) | | | | | | | | |
| | 10/1/2007 – 10/31/2007 | | | 115 | | | $ | 29.69 | |
| | 11/1/2007 – 11/30/2007 | | | — | | | | — | |
| | 12/1/2007 – 12/31/2007 | | | — | | | | — | |
2005 DCP II(2) | | | | | | | | |
| | 10/1/2007 – 10/31/2007 | | | 26,392 | | | $ | 29.69 | |
| | 11/1/2007 – 11/30/2007 | | | — | | | | — | |
| | 12/1/2007 – 12/31/2007 | | | 107,000 | | | $ | 22.29 | |
| | | | | | | |
| Total | | | 133,507 | | | $ | 23.76 | |
| | | | | | | |
| |
| (1) | The 2005 DCP I is an unfunded plan, as defined by the Code, that provides for the deferral of compensation by our directors, employees, and consultants. In addition, we made contributions to 2005 DCP I on compensation deemed ineligible for a 401(k) contribution. Our directors, employees, or consultants were eligible to participate in the plan at such time and for such period as designated by the Board of Directors. The 2005 DCP I is administered through a trust by a third-party trustee, and we fund this plan through cash contributions. Directors were able to choose to defer directors’ fees through the 2005 DCP I, and to invest such deferred income in shares of our common stock. To the extent a director elected to invest in our common stock, the trustee of the 2005 DCP I was required to use such deferred directors’ fees to purchase shares of our common stock in the market. |
| |
| (2) | We have a long-term incentive compensation program whereby we will generally determine an individual performance award (IPA) for certain officers annually at the beginning of each year. The Compensation Committee may adjust the IPAs as needed, or make new awards as new officers are hired. In conjunction with the program, we instituted the DCP II plans, which are unfunded plans as defined by the Code that are administered through a trust by a third-party trustee. The IPAs were deposited in the trust in four equal installments, generally on a quarterly basis in the form of cash and the 2005 DCP II required the trustee to use the cash to purchase shares of our common stock in the market. See discussion below on the termination of the deferred compensation arrangements. For 2008, the Compensation Committee has determined that the IPAs will be paid in cash in two equal installments during the year to eligible officers, as long as the recipient remains employed by us. |
On December 14, 2007, our Board of Directors made a determination that it is in Allied Capital’s best interest to terminate our deferred compensation plans. The Board of Directors’ decision was primarily in response to increased complexity resulting from recent changes in the regulation of deferred compensation arrangements. The accounts under these plans will be distributed to participants in full on March 18, 2008, the termination and distribution date, or as soon as is reasonably practicable thereafter, in accordance with the transition rule for payment elections under Section 409A of the Code. Distributions from the plans will be made in cash or shares of our common stock, net of required withholding taxes.
29
Item 6. Selected Financial Data.
SELECTED CONDENSED CONSOLIDATED FINANCIAL DATA
You should read the condensed consolidated financial information below with the Consolidated Financial Statements and Notes thereto included herein. The financial information below has been derived from our financial statements that were audited by KPMG LLP.
| | | | | | | | | | | | | | | | | | | | | | | |
| | | Year Ended December 31, | |
| | | | |
| (in thousands, | | 2007 | | | 2006 | | | 2005 | | | 2004 | | | 2003 | |
| except per share data) | | | | | | | | | | | | | | | |
Operating Data: | | | | | | | | | | | | | | | | | | | | |
| Interest and related portfolio income: | | | | | | | | | | | | | | | | | | | | |
| | Interest and dividends | | | 417,576 | | | $ | 386,427 | | | $ | 317,153 | | | $ | 319,642 | | | $ | 290,719 | |
| | Fees and other income | | | 44,129 | | | | 66,131 | | | | 56,999 | | | | 47,448 | | | | 38,510 | |
| | | | | | | | | | | | | | | | |
| | | Total interest and related portfolio income | | | 461,705 | | | | 452,558 | | | | 374,152 | | | | 367,090 | | | | 329,229 | |
| | | | | | | | | | | | | | | | |
| Expenses: | | | | | | | | | | | | | | | | | | | | |
| | Interest | | | 132,080 | | | | 100,600 | | | | 77,352 | | | | 75,650 | | | | 77,233 | |
| | Employee | | | 89,155 | | | | 92,902 | | | | 78,300 | | | | 53,739 | | | | 36,945 | |
| | Employee stock options(1) | | | 35,233 | | | | 15,599 | | | | — | | | | — | | | | — | |
| | Administrative | | | 50,580 | | | | 39,005 | | | | 69,713 | | | | 34,686 | | | | 22,387 | |
| | | | | | | | | | | | | | | | |
| | | Total operating expenses | | | 307,048 | | | | 248,106 | | | | 225,365 | | | | 164,075 | | | | 136,565 | |
| | | | | | | | | | | | | | | | |
| Net investment income before income taxes | | | 154,657 | | | | 204,452 | | | | 148,787 | | | | 203,015 | | | | 192,664 | |
| | Income tax expense (benefit), including excise tax | | | 13,624 | | | | 15,221 | | | | 11,561 | | | | 2,057 | | | | (2,466 | ) |
| | | | | | | | | | | | | | | | |
| Net investment income | | | 141,033 | | | | 189,231 | | | | 137,226 | | | | 200,958 | | | | 195,130 | |
| | | | | | | | | | | | | | | | |
| Net realized and unrealized gains (losses): | | | | | | | | | | | | | | | | | | | | |
| | Net realized gains | | | 268,513 | | | | 533,301 | | | | 273,496 | | | | 117,240 | | | | 75,347 | |
| | Net change in unrealized appreciation or depreciation | | | (256,243 | ) | | | (477,409 | ) | | | 462,092 | | | | (68,712 | ) | | | (78,466 | ) |
| | | | | | | | | | | | | | | | |
| | | Total net gains (losses) | | | 12,270 | | | | 55,892 | | | | 735,588 | | | | 48,528 | | | | (3,119 | ) |
| | | | | | | | | | | | | | | | |
| Net increase in net assets resulting from operations | | $ | 153,303 | | | $ | 245,123 | | | $ | 872,814 | | | $ | 249,486 | | | $ | 192,011 | |
| | | | | | | | | | | | | | | | |
Per Share: | | | | | | | | | | | | | | | | | | | | |
| Diluted earnings per common share | | $ | 0.99 | | | $ | 1.68 | | | $ | 6.36 | | | $ | 1.88 | | | $ | 1.62 | |
Net investment income plus net realized gains per share(2) | | $ | 2.65 | | | $ | 4.96 | | | $ | 2.99 | | | $ | 2.40 | | | $ | 2.28 | |
Dividends per common share(2) | | $ | 2.64 | | | $ | 2.47 | | | $ | 2.33 | | | $ | 2.30 | | | $ | 2.28 | |
| Weighted average common shares outstanding – diluted | | | 154,687 | | | | 145,599 | | | | 137,274 | | | | 132,458 | | | | 118,351 | |
30
| | | | | | | | | | | | | | | | | | | | | |
| | | At December 31, | |
| | | | |
| (in thousands, | | 2007 | | | 2006 | | | 2005 | | | 2004 | | | 2003 | |
| except per share data) | | | | | | | | | | | | | | | |
Balance Sheet Data: | | | | | | | | | | | | | | | | | | | | |
| Portfolio at value | | $ | 4,780,521 | | | $ | 4,496,084 | | | $ | 3,606,355 | | | $ | 3,013,411 | | | $ | 2,584,599 | |
| Total assets | | | 5,214,576 | | | | 4,887,505 | | | | 4,025,880 | | | | 3,260,998 | | | | 3,019,870 | |
Total debt outstanding(3) | | | 2,289,470 | | | | 1,899,144 | | | | 1,284,790 | | | | 1,176,568 | | | | 954,200 | |
| Undistributed (distributions in excess of) earnings | | | 535,853 | | | | 502,163 | | | | 112,252 | | | | 12,084 | | | | (13,401 | ) |
| Shareholders’ equity | | | 2,771,847 | | | | 2,841,244 | | | | 2,620,546 | | | | 1,979,778 | | | | 1,914,577 | |
Shareholders’ equity per common share (net asset value)(4) | | $ | 17.54 | | | $ | 19.12 | | | $ | 19.17 | | | $ | 14.87 | | | $ | 14.94 | |
| Common shares outstanding at end of year | | | 158,002 | | | | 148,575 | | | | 136,697 | | | | 133,099 | | | | 128,118 | |
| | | | | | | | | | | | | | | | | | | | | |
| | | Year Ended December 31, | |
| | | | |
| | | 2007 | | | 2006 | | | 2005 | | | 2004 | | | 2003 | |
| | | | | | | | | | | | | | | | |
Other Data: | | | | | | | | | | | | | | | | | | | | |
| Investments funded | | $ | 1,845,973 | | | $ | 2,437,828 | | | $ | 1,675,773 | | | $ | 1,524,523 | | | $ | 931,450 | |
Principal collections related to investment
repayments or sales | | | 1,211,550 | | | | 1,055,347 | | | | 1,503,388 | | | | 909,189 | | | | 788,328 | |
| Realized gains | | | 400,510 | | | | 557,470 | | | | 343,061 | | | | 267,702 | | | | 94,305 | |
| Realized losses | | | (131,997 | ) | | | (24,169 | ) | | | (69,565 | ) | | | (150,462 | ) | | | (18,958 | ) |
| | | | | | | | | | | | | | | | | | | | | | | | | | | | | | | | | |
| | | 2007 | | | 2006 | |
| | | | | | | |
| (in thousands, | | Qtr 4 | | | Qtr 3 | | | Qtr 2 | | | Qtr 1 | | | Qtr 4 | | | Qtr 3 | | | Qtr 2 | | | Qtr 1 | |
| except per share data) | | | | | | | | | | | | | | | | | | | | | | | | |
Quarterly Data (unaudited): | | | | | | | | | | | | | | | | | | | | | | | | | | | | | | | | |
| Total interest and related portfolio income | | $ | 117,709 | | | $ | 118,368 | | | $ | 117,676 | | | $ | 107,952 | | | $ | 117,708 | | | $ | 113,383 | | | $ | 110,456 | | | $ | 111,011 | |
| Net investment income | | | 58,040 | | | | 18,318 | | | | 25,175 | | | | 39,500 | | | | 49,078 | | | | 48,658 | | | | 50,195 | | | | 41,300 | |
| Net increase (decrease) in net assets resulting from operations | | | 27,527 | | | | (96,468 | ) | | | 89,158 | | | | 133,086 | | | | 33,921 | | | | 77,886 | | | | 33,729 | | | | 99,587 | |
| Diluted earnings (loss) per common share | | $ | 0.18 | | | $ | (0.62 | ) | | $ | 0.57 | | | $ | 0.87 | | | $ | 0.23 | | | $ | 0.53 | | | $ | 0.24 | | | $ | 0.70 | |
Dividends declared per common share(5) | | | 0.72 | | | | 0.65 | | | | 0.64 | | | | 0.63 | | | | 0.67 | | | | 0.61 | | | | 0.60 | | | | 0.59 | |
Net asset value per common share(4) | | | 17.54 | | | | 17.90 | | | | 19.59 | | | | 19.58 | | | | 19.12 | | | | 19.38 | | | | 19.17 | | | | 19.50 | |
| |
| (1) | Effective January 1, 2006, we adopted the provisions of Statement No. 123 (Revised 2004),Share-Based Payment. See “Item 7. Management’s Discussion and Analysis of Financial Condition and Results of Operations” below. |
| (2) | Dividends are based on taxable income, which differs from income for financial reporting purposes. Net investment income and net realized gains are the most significant components of our annual taxable income from which dividends are paid. See “Item 7. Management’s Discussion and Analysis of Financial Condition and Results of Operations” below. |
| (3) | See “Item 7. Management’s Discussion and Analysis of Financial Condition and Results of Operations” for more information regarding our level of indebtedness. |
| (4) | We determine net asset value per common share as of the last day of the period presented. The net asset values shown are based on outstanding shares at the end of each period presented. |
| (5) | Dividends declared per common share for the fourth quarter of 2007 included the regular quarterly dividend of $0.65 per common share and an extra dividend of $0.07 per common share. Dividends declared per common share for the fourth quarter of 2006 included the regular quarterly dividend of $0.62 per common share and an extra dividend of $0.05 per common share. |
31
Item 7. Management’s Discussion and Analysis of Financial Condition and Results of Operations.
The information contained in this section should be read in conjunction with our Consolidated Financial Statements and the Notes thereto. In addition, this annual report on Form 10-K contains certain forward-looking statements. These statements include the plans and objectives of management for future operations and financial objectives and can be identified by the use of forward-looking terminology such as “may,” “will,” “expect,” “intend,” “anticipate,” “estimate,” or “continue” or the negative thereof or other variations thereon or comparable terminology. These forward-looking statements are subject to the inherent uncertainties in predicting future results and conditions. Certain factors that could cause actual results and conditions to differ materially from those projected in these forward-looking statements are set forth in “Risk Factors” above. Other factors that could cause actual results to differ materially include:
| | |
| | • | changes in the economy, including economic downturns or recessions; |
| |
| | • | risks associated with possible disruption in our operations due to terrorism; |
| |
| | • | future changes in laws or regulations or changes in accounting principles; and |
| |
| | • | other risks and uncertainties as may be detailed from time to time in our public announcements and SEC filings. |
Financial or other information presented for private finance portfolio companies has been obtained from the portfolio companies, and this financial information presented may represent unaudited, projected or pro forma financial information, and therefore may not be indicative of actual results. In addition, the private equity industry uses financial measures such as EBITDA or EBITDAM (Earnings Before Interest, Taxes, Depreciation, Amortization and, in some instances, Management fees) in order to assess a portfolio company’s financial performance and to value a portfolio company. EBITDA and EBITDAM are not intended to represent cash flow from operations as defined by U.S. generally accepted accounting principles and such information should not be considered as an alternative to net income, cash flow from operations or any other measure of performance prescribed by U.S. generally accepted accounting principles.
OVERVIEW
As a business development company, we are in the private equity business. Specifically, we provide long-term debt and equity investment capital to companies in a variety of industries. Our private finance activity principally involves providing financing to middle market U.S. companies through privately negotiated long-term debt and equity investment capital. Our financing is generally used to fund buyouts, acquisitions, growth, recapitalizations, note purchases, and other types of financings. We generally invest in private companies though, from time to time, we may invest in companies that are public but lack access to additional public capital. Our investment objective is to achieve current income and capital gains.
Our portfolio composition at December 31, 2007, 2006, and 2005, was as follows:
| | | | | | | | | | | | | |
| | | 2007 | | | 2006 | | | 2005 | |
| | | | | | | | | | |
| Private finance | | | 97 | % | | | 97 | % | | | 96 | % |
| Commercial real estate finance | | | 3 | % | | | 3 | % | | | 4 | % |
Our earnings depend primarily on the level of interest and dividend income, fee and other income, and net realized and unrealized gains or losses on our investment portfolio after deducting interest expense on borrowed capital, operating expenses and income taxes, including excise tax. Interest income primarily results from the stated interest rate earned on a loan or debt security and the amortization of loan origination fees and discounts. The level of interest income is directly related to the balance of the interest-bearing investment portfolio outstanding during the year multiplied by the weighted average yield. Our ability to generate interest income is dependent on economic, regulatory, and competitive factors that influence new investment activity, interest rates on the types of loans we make, the level of repayments in the portfolio, the amount of loans and debt securities for which interest is not accruing and our ability to secure debt and equity capital for our investment activities. The level of fee income is primarily related to
32
the level of new investment activity and the level of fees earned from portfolio companies and managed funds. The level of investment activity can vary substantially from year to year depending on many factors, including the amount of debt and equity capital available to middle market companies, the level of merger and acquisition activity for such companies, the general economic environment, and the competitive environment for the types of investments we make.
Because we are a regulated investment company for tax purposes, we intend to distribute substantially all of our annual taxable income available for distribution as dividends to our shareholders. See “Other Matters” below.
PORTFOLIO AND INVESTMENT ACTIVITY
The total portfolio at value, investment activity, and the yield on interest-bearing investments at and for the years ended December 31, 2007, 2006, and 2005, were as follows:
| | | | | | | | | | | | | |
| | | At and for the | |
| | | Years Ended December 31, | |
| | | | |
| | | 2007 | | | 2006 | | | 2005 | |
| ($ in millions) | | | | | | | | | |
| Portfolio at value | | $ | 4,780.5 | | | $ | 4,496.1 | | | $ | 3,606.4 | |
Investments funded(1) | | $ | 1,846.0 | | | $ | 2,437.8 | | | $ | 1,675.8 | |
| Change in accrued or reinvested interest and dividends | | $ | 23.9 | | | $ | 8.2 | | | $ | 6.6 | |
Principal collections related to investment repayments or sales(2) | | $ | 1,211.6 | | | $ | 1,055.3 | | | $ | 1,503.4 | |
Yield on interest-bearing investments(3) | | | 12.1 | % | | | 11.9 | % | | | 12.8 | % |
| |
| (1) | Investments funded included investments acquired through the issuance of our common stock as consideration totaling $7.2 million for the year ended December 31, 2005. See also “— Private Finance” below. |
| |
| (2) | Principal collections related to investment repayments or sales for the year ended December 31, 2007, included collections of $224.2 million related to the sale of loans to the Allied Capital Senior Debt Fund, L.P. See discussion above. |
| |
| (3) | The weighted average yield on interest-bearing investments is computed as the (a) annual stated interest on accruing loans and debt securities plus the annual amortization of loan origination fees, original issue discount, and market discount on accruing loans and debt securities less the annual amortization of loan origination costs, plus the effective interest yield on the preferredshares/income notes of CLOs divided by (b) total interest-bearing investments at value. The weighted average yield is computed as of the balance sheet date. |
33
Private Finance
The private finance portfolio at value, investment activity, and the yield on loans and debt securities at and for the years ended December 31, 2007, 2006, and 2005, were as follows:
| | | | | | | | | | | | | | | | | | | | | | | | | | | | |
| | | At and for the | |
| | | Years Ended December 31, | |
| | | | |
| | | 2007 | | | 2006 | | | 2005 | |
| | | | | | | | | | |
| | | Value | | | Yield(1) | | | Value | | | Yield(1) | | | Value | | | Yield(1) | |
| ($ in millions) | | | | | | | | | | | | | | | | | | |
| Portfolio at value: | | | | | | | | | | | | | | | | | | | | | | | | |
| | Loans and debt securities: | | | | | | | | | | | | | | | | | | | | | | | | |
| | | Senior loans | | $ | 344.3 | | | | 7.7% | | | $ | 405.2 | | | | 8.4% | | | $ | 239.8 | | | | 9.5% | |
| | | Unitranche debt | | | 653.9 | | | | 11.5% | | | | 799.2 | | | | 11.2% | | | | 294.2 | | | | 11.4% | |
| | | Subordinated debt | | | 2,416.4 | | | | 12.8% | | | | 1,980.8 | | | | 12.9% | | | | 1,560.9 | | | | 13.8% | |
| | | | | | | | | | | | | | | | | | | |
| | | | Total loans and debt securities | | | 3,414.6 | | | | 12.1% | | | | 3,185.2 | | | | 11.9% | | | | 2,094.9 | | | | 13.0% | |
| Equity securities: | | | | | | | | | | | | | | | | | | | | | | | | |
| | Preferred shares/income notes of CLOs(2) | | | 203.0 | | | | 14.6% | | | | 97.2 | | | | 15.5% | | | | 72.3 | | | | 13.7% | |
| | Other equity securities | | | 1,041.7 | | | | | | | | 1,095.5 | | | | | | | | 1,312.1 | | | | | |
| | | | | | | | | | | | | | | | | | | |
| | | Total equity securities | | | 1,244.7 | | | | | | | | 1,192.7 | | | | | | | | 1,384.4 | | | | | |
| | | | | | | | | | | | | | | | | | | |
| Total portfolio | | $ | 4,659.3 | | | | | | | $ | 4,377.9 | | | | | | | $ | 3,479.3 | | | | | |
| | | | | | | | | | | | | | | | | | | |
Investments funded(3) | | $ | $1,828.0 | | | | | | | $ | 2,423.4 | | | | | | | $ | 1,462.3 | | | | | |
| Change in accrued or reinvested interest and dividends | | $ | 24.6 | | | | | | | $ | 7.2 | | | | | | | $ | 24.6 | | | | | |
Principal collections related to investment repayments or sales(4) | | $ | 1,188.2 | | | | | | | $ | 1,015.4 | | | | | | | $ | 703.9 | | | | | |
| |
| (1) | The weighted average yield on loans and debt securities is computed as the (a) annual stated interest on accruing loans and debt securities plus the annual amortization of loan origination fees, original issue discount, and market discount on accruing loans and debt securities less the annual amortization of loan origination costs, divided by (b) total loans and debt securities at value. The weighted average yield on the preferred shares/income notes of CLOs is calculated as the (a) effective interest yield on the preferred shares/income notes of CLOs, divided by (b) preferred shares/income notes of CLOs at value. The weighted average yields are computed as of the balance sheet date. |
| |
| (2) | Investments in the preferred shares/income notes of CLOs earn a current return that is included in interest income in the consolidated statement of operations. |
| |
| (3) | Investments funded for the year ended December 31, 2006, included debt investments in certain portfolio companies received in conjunction with the sale of such companies. See “— Private Finance - Investments Funded” below. |
| |
| (4) | Includes collections from the sale or repayment of senior loans totaling $393.4 million, $322.7 million, and $301.8 million for the years ended December 31, 2007, 2006, and 2005, respectively. |
Our investment activity is primarily focused on making long-term investments in the debt and equity of primarily private middle market companies. Debt investments may include senior loans, unitranche debt (generally in a first lien position), or subordinated debt (with or without equity features). The junior debt that we invest in that is lower in repayment priority than senior debt is also known as mezzanine debt. Equity investments may include a minority equity stake in connection with a debt investment or a substantial equity stake in connection with a buyout transaction. In a buyout transaction, we generally invest in senior and/or subordinated debt and equity (preferred and/or voting or non-voting common) where our equity ownership represents a significant portion of the equity, but may or may not represent a controlling interest.
We intend to take a balanced approach to private equity investing that emphasizes a complementary mix of debt investments and buyout investments. The combination of these two types of investments provides current interest and related portfolio income and the potential for future capital gains. In addition, we may invest in funds that are managed or co-managed by us that are complementary to our business of investing in middle market companies, such as the Allied Capital Senior Debt Fund L.P. and the
34
Unitranche Fund LLC (discussed below). Investments in funds may provide current interest and related portfolio income, including management fees.
During the first six months of 2007, we found it difficult to find investments with reasonable prices and structures. As a result, new investment activity was lower than in prior quarters totaling $659.1 million for the first six months of 2007. During the second half of the year, our investment pace increased as pricing and structures improved and we invested $1.2 billion in the last half of 2007.
The level of investment activity for investments funded and principal repayments for private finance investments can vary substantially from year to year depending on the number and size of investments that we make or that we exit and many other factors, including the amount of debt and equity capital available to middle market companies, the level of merger and acquisition activity for such companies, the general economic environment, and the competitive environment for the types of investments we make.
35
Investments Funded. Investments funded and the weighted average yield on loans and debt securities funded for the years ended December 31, 2007, 2006, and 2005, consisted of the following:
| | | | | | | | | | | | | | | | | | | | | | | | | | | |
| | | 2007 Investments Funded | |
| | | | |
| | | Debt Investments | | | Buyout Investments | | | Total | |
| | | | | | | | | | |
| | | | | Weighted | | | | | Weighted | | | | | Weighted | |
| | | | | Average | | | | | Average | | | | | Average | |
| | | Amount | | | Yield(1) | | | Amount | | | Yield(1) | | | Amount | | | Yield(1) | |
| ($ in millions) | | | | | | | | | | | | | | | | | | |
| Loans and debt securities: | | | | | | | | | | | | | | | | | | | | | | | | |
| | Senior loans | | $ | 249.0 | | | | 9.2 | % | | $ | 63.1 | | | | 8.8 | % | | $ | 312.1 | | | | 9.1 | % |
| | Unitranche debt(2) | | | 109.1 | | | | 10.8 | % | | | 74.9 | | | | 13.0 | % | | | 184.0 | | | | 11.7 | % |
| | Subordinated debt | | | 719.4 | (4) | | | 12.8 | % | | | 197.6 | | | | 12.1 | % | | | 917.0 | | | | 12.6 | % |
| | | | | | | | | | | | | | | | | | | |
| | | Total loans and debt securities | | | 1,077.5 | | | | 11.7 | % | | | 335.6 | | | | 11.7 | % | | | 1,413.1 | | | | 11.7 | % |
Preferred shares/income notes of CLOs(5) | | | 116.2 | | | | 16.4 | % | | | — | | | | | | | | 116.2 | | | | 16.4 | % |
| Equity | | | 152.7 | (6) | | | | | | | 146.0 | | | | | | | | 298.7 | | | | | |
| | | | | | | | | | | | | | | | | | | |
| | Total | | $ | 1,346.4 | | | | | | | $ | 481.6 | | | | | | | $ | 1,828.0 | | | | | |
| | | | | | | | | | | | | | | | | | | |
| | | | | | | | | | | | | | | | | | | | | | | | | | | |
| | | 2006 Investments Funded | |
| | | | |
| | | Debt Investments | | | Buyout Investments | | | Total | |
| | | | | | | | | | |
| | | | | Weighted | | | | | Weighted | | | | | Weighted | |
| | | | | Average | | | | | Average | | | | | Average | |
| | | Amount | | | Yield(1) | | | Amount | | | Yield(1) | | | Amount | | | Yield(1) | |
| ($ in millions) | | | | | | | | | | | | | | | | | | |
| Loans and debt securities: | | | | | | | | | | | | | | | | | | | | | | | | |
| | Senior loans | | $ | 245.4 | | | | 9.4 | % | | $ | 239.8 | | | | 8.9 | % | | $ | 485.2 | | | | 9.2 | % |
| | Unitranche debt(2) | | | 471.7 | | | | 10.7 | % | | | 146.5 | | | | 12.9 | % | | | 618.2 | | | | 11.3 | % |
| | Subordinated debt(3) | | | 510.7 | | | | 13.0 | % | | | 423.8 | | | | 14.4 | % | | | 934.5 | | | | 13.6 | % |
| | | | | | | | | | | | | | | | | | | |
| | | Total loans and debt securities | | | 1,227.8 | | | | 11.4 | % | | | 810.1 | | | | 12.5 | % | | | 2,037.9 | | | | 11.9 | % |
Preferred shares/income notes of CLOs(5) | | | 26.1 | | | | 14.8 | % | | | — | | | | | | | | 26.1 | | | | 14.8 | % |
| Equity | | | 65.3 | | | | | | | | 294.1 | | | | | | | | 359.4 | | | | | |
| | | | | | | | | | | | | | | | | | | |
| | Total | | $ | 1,319.2 | | | | | | | $ | 1,104.2 | | | | | | | $ | 2,423.4 | | | | | |
| | | | | | | | | | | | | | | | | | | |
| | | | | | | | | | | | | | | | | | | | | | | | | | | |
| | | 2005 Investments Funded | |
| | | | |
| | | Debt Investments | | | Buyout Investments | | | Total | |
| | | | | | | | | | |
| | | | | Weighted | | | | | Weighted | | | | | Weighted | |
| | | | | Average | | | | | Average | | | | | Average | |
| | | Amount | | | Yield(1) | | | Amount | | | Yield(1) | | | Amount | | | Yield(1) | |
| ($ in millions) | | | | | | | | | | | | | | | | | | |
| Loans and debt securities: | | | | | | | | | | | | | | | | | | | | | | | | |
| | Senior loans | | $ | 76.8 | | | | 10.0 | % | | $ | 250.2 | | | | 6.4 | % | | $ | 327.0 | | | | 7.2 | % |
| | Unitranche debt(2) | | | 259.5 | | | | 10.5 | % | | | — | | | | — | | | | 259.5 | | | | 10.5 | % |
| | Subordinated debt | | | 296.9 | (4) | | | 12.3 | % | | | 330.9 | | | | 12.5 | % | | | 627.8 | | | | 12.4 | % |
| | | | | | | | | | | | | | | | | | | |
| | | Total loans and debt securities | | | 633.2 | | | | 11.3 | % | | | 581.1 | | | | 9.9 | % | | | 1,214.3 | | | | 10.6 | % |
Preferred shares/income notes of CLOs(5) | | | 47.9 | | | | 14.2 | % | | | — | | | | | | | | 47.9 | | | | 14.2 | % |
| Equity | | | 34.6 | | | | | | | | 165.5 | | | | | | | | 200.1 | | | | | |
| | | | | | | | | | | | | | | | | | | |
| | Total | | $ | 715.7 | | | | | | | $ | 746.6 | | | | | | | $ | 1,462.3 | | | | | |
| | | | | | | | | | | | | | | | | | | |
| |
| (1) | The weighted average yield on interest-bearing investments is computed as the (a) annual stated interest on accruing interest-bearing investments, divided by (b) total interest-bearing investments funded. The weighted average yield on the preferred shares/income notes of CLOs is calculated as the (a) effective interest yield on the preferred shares/income notes of CLOs, divided by (b) preferred shares/income notes of CLOs funded. The weighted average yield is calculated using yields as of the date an investment is funded. |
| |
| (2) | Unitranche debt is generally in a first lien position. The yield on a unitranche investment reflects the blended yield of senior and subordinated debt. |
| |
| (3) | Debt investments funded for the year ended December 31, 2006, included a $150 million subordinated debt investment in Advantage Sales & Marketing, Inc. received in conjunction with the sale of Advantage and a $30 million subordinated debt investment in STS Operating, Inc. received in conjunction with the sale of STS. |
| |
| (4) | Subordinated debt investments for the years ended December 31, 2007 and 2005, included $45.3 million and $45.5 million, respectively, in investments in the bonds of collateralized loan obligations (CLOs) and one collateralized debt obligations (CDO). Certain of these CLOs and the CDO are managed by Callidus Capital Corporation (Callidus), a portfolio company controlled by us. These CLOs and the CDO primarily invest in senior corporate loans. |
| |
| (5) | CLO equity investments included preferred shares/income notes of CLOs that primarily invest in senior corporate loans. Certain of these CLOs are managed by Callidus. |
| |
| (6) | Equity investments for the year ended December 31, 2007, included $31.8 million invested in the Allied Capital Senior Debt Fund, L.P. and $0.7 million invested in the Unitranche Fund LLC. See “Managed Funds” below. |
36
We generally fund new investments using cash. In addition, we may acquire securities in exchange for our common equity. Also, we may acquire new securities through the reinvestment of previously accrued interest and dividends in debt or equity securities, or the current reinvestment of interest and dividend income through the receipt of a debt or equity security (payment-in-kind income). From time to time we may opt to reinvest accrued interest receivable in a new debt or equity security in lieu of receiving such interest in cash.
We may underwrite or arrange senior loans related to our portfolio investments or for other companies that are not in our portfolio. When we underwrite or arrange senior loans, we may earn a fee for such activities. Senior loans underwritten or arranged by us may be funded by us at closing. When these senior loans are closed, we may fund all or a portion of the underwritten commitment pending sale of the loan to other investors, which may include loan sales to Callidus Capital Corporation (Callidus), a portfolio company controlled by us, or funds managed by Callidus or by us, including the Allied Capital Senior Debt Fund, L.P. (discussed below). After completion of loan sales, we may retain a position in these senior loans. We generally earn a fee on the senior loans we underwrite or arrange whether or not we fund the underwritten commitment. In addition, we may fund most or all of the debt and equity capital upon the closing of certain buyout transactions, which may include investments in lower-yielding senior debt. Subsequent to the closing, the portfolio company may refinance all or a portion of the lower-yielding senior debt, which would reduce our investment. Principal collections include repayments of senior debt funded by us that was subsequently sold by us or refinanced or repaid by the portfolio companies.
Yield. The weighted average yield on the private finance loans and debt securities was 12.1% at December 31, 2007, as compared to 11.9% and 13.0% at December 31, 2006 and 2005, respectively. The weighted average yield on the private finance loans and debt securities may fluctuate from year to year depending on the yield on new loans and debt securities funded, the yield on loans and debt securities repaid, the amount of loans and debt securities for which interest is not accruing (see “Portfolio Asset Quality — Loans and Debt Securities on Non-Accrual Status” below) and the amount of lower-yielding senior or unitranche debt in the portfolio at the end of the year. Yields on loans and debt securities have generally been lower because of the supply of capital available to middle market companies.
The yield on the private finance portfolio has declined over the past two years partly due to our strategy to pursue investments where our position in the portfolio company capital structure is more senior, such as senior debt and unitranche investments that typically have lower yields than subordinated debt investments. In addition, during the fourth quarter of 2006, the guaranteed dividend yield on our investment in Ciena Capital LLC’s 25% Class A equity interests was placed on non-accrual status. The Class A equity interests are included in our loans and debt securities. See “Ciena Capital LLC” below.
37
Outstanding Investment Commitments. At December 31, 2007, we had outstanding private finance investment commitments as follows:
| | | | | | | | | | | | | | | | | | |
| | | Companies | | | | | Companies | | | |
| | | More Than | | | Companies 5% | | | Less Than 5% | | | |
| | | 25% Owned(1) | | | to 25% Owned | | | Owned | | | Total | |
| | | | | | | | | | | | | |
| ($ in millions) | | | | | | | | |
| Senior loans | | $ | 12.0 | | | $ | 13.0 | | | $ | 105.1 | | | $ | 130.1 | (2) |
| Unitranche debt | | | 3.5 | | | | — | | | | 28.1 | | | | 31.6 | |
| Subordinated debt | | | 18.0 | | | | 0.1 | | | | — | | | | 18.1 | |
| | | | | | | | | | | | | |
| | Total loans and debt securities | | | 33.5 | | | | 13.1 | | | | 133.2 | | | | 179.8 | |
Unitranche Fund(3) | | | 524.3 | | | | — | | | | — | | | | 524.3 | |
| Equity securities | | | 96.6 | | | | 10.2 | | | | 71.5 | | | | 178.3 | (4) |
| | | | | | | | | | | | | |
| | Total | | $ | 654.4 | | | $ | 23.3 | | | $ | 204.7 | | | $ | 882.4 | |
| | | | | | | | | | | | | |
| | |
| | (1) | Includes various commitments to Callidus Capital Corporation (Callidus), a portfolio company controlled by us, which owns 80% (subject to dilution) of Callidus Capital Management, LLC, an asset management company that structures and manages collateralized loan obligations (CLOs), collateralized debt obligations (CDOs), and other related investments, as follows: |
| | | | | | | | | | | | | | |
| | | | | | | Amount | |
| | | Committed | | | Amount | | Available | |
| | | Amount | | | Drawn | | to be Drawn | |
| ($ in millions) | | | | | | | | |
| Revolving line of credit for working capital | | $ | 4.0 | | | $ | — | | | $ | 4.0 | |
Subordinated debt to support warehouse facilities & warehousing activities(*) | | | 18.0 | | | | — | | | | 18.0 | |
| | | | | | | | | | |
| | Total | | $ | 22.0 | | | $ | — | | | $ | 22.0 | |
| | | | | | | | | | |
| | |
| | (*) | Callidus has a synthetic credit facility with a third party for up to approximately $55 million. We have agreed to designate our subordinated debt commitment for Callidus to draw upon to provide first loss capital as needed to support this facility. |
| | |
| | (2) | Includes $126.6 million in the form of revolving senior debt facilities to 32 companies. |
| |
| | (3) | Represents our commitment to the Unitranche Fund LLC (see discussion below), which we estimate will be funded over a two to three year period as investments are made by the Unitranche Fund. |
| |
| | (4) | Includes $81.7 million to 22 private equity and venture capital funds, including $4.4 million in co-investment commitments to one private equity fund. |
In addition to these outstanding investment commitments at December 31, 2007, we may be required to fund additional amounts under earn-out arrangements primarily related to buyout transactions in the future if those companies meet agreed-upon performance targets. We also had commitments to private finance portfolio companies in the form of standby letters of credit and guarantees. See “Financial Condition, Liquidity and Capital Resources” below.
Investments in Collateralized Loan Obligations and Collateralized Debt Obligations (CLO/CDO Assets).At December 31, 2007, we had investments in ten CLO issuances and one CDO bond, which represented 5.6% of our total assets, and five CLO issuances and one CDO bond, which represented 2.9%
38
of our total assets, at December 31, 2006. At December 31, 2007 and 2006, our CLO/CDO Assets were as follows:
| | | | | | | | | | | | | | | | | | | | | | | | | | |
| | | 2007 | | | 2006 | |
| | | | | | | |
| | | Cost | | | Value | | | Yield(1) | | | Cost | | | Value | | | Yield(1) | |
| ($ in millions) | | | | | | | | | | | | | | | | | | |
| CLO/CDO bonds | | $ | 90.7 | | | $ | 89.9 | | | | 13.3% | | | $ | 45.4 | | | $ | 45.6 | | | | 12.8% | |
| Preferred shares/income notes of CLOs | | | 218.3 | | | | 203.0 | | | | 14.6% | | | | 101.1 | | | | 97.2 | | | | 15.5% | |
| | | | | | | | | | | | | | | | | | | |
| | Total | | $ | 309.0 | | | $ | 292.9 | | | | | | | $ | 146.5 | | | $ | 142.8 | | | | | |
| | | | | | | | | | | | | | | | | | | |
| |
| (1) | The weighted average yield is calculated as the (a) annual stated interest or the effective interest yield on the accruing bonds or the effective interest yield on the preferred shares/income notes, divided by (b) CLO and CDO assets at value. The market yield used in the valuation of the CLO and CDO assets may be different than the interest yields shown above. |
The CLO and CDO issuances in which we have invested are primarily invested in senior corporate loans. See also Note 3, “Portfolio” from our Notes to the Consolidated Financial Statements included in Item 8.
The initial yields on the cost basis of the CLO preferred shares and income notes are based on the estimated future cash flows expected to be paid to these CLO classes from the underlying collateral assets. As each CLO preferred share or income note ages, the estimated future cash flows are updated based on the estimated performance of the underlying collateral assets, and the respective yield on the cost basis is adjusted as necessary. As future cash flows are subject to uncertainties and contingencies that are difficult to predict and are subject to future events that may alter current assumptions, no assurance can be given that the anticipated yields to maturity will be achieved.
The CLO/CDO Assets in which we have invested are junior in priority for payment of interest and principal to the more senior notes issued by the CLOs and CDO. Cash flow from the underlying collateral assets in the CLOs and CDO is generally allocated first to the senior bonds in order of priority, then any remaining cash flow is generally distributed to the preferred shareholders and income note holders. To the extent there are defaults and unrecoverable losses on the underlying collateral assets that result in reduced cash flows, the preferred shares/income notes will bear this loss first and then the subordinated bonds would bear any loss after the preferred shares/income notes. At December 31, 2007 and 2006, the face value of the CLO/CDO Assets held by us was subordinate to as much as 94% and 92%, respectively, of the face value of the securities outstanding in these CLOs and CDO.
At December 31, 2007 and 2006, the underlying collateral assets of these CLO and CDO issuances, consisting primarily of senior corporate loans, were issued by 671 issuers and 465 issuers, respectively, and had balances as follows:
| | | | | | | | | | |
| | | 2007 | | | 2006 | |
| ($ in millions) | | | | | | |
| Bonds | | $ | 288.5 | | | $ | 245.4 | |
| Syndicated loans | | | 4,122.7 | | | | 1,769.9 | |
Cash(1) | | | 104.4 | | | | 59.5 | |
| | | | | | | |
| | Total underlying collateral assets(2) | | $ | 4,515.6 | | | $ | 2,074.8 | |
| | | | | | | |
| |
| (1) | Includes undrawn liability amounts. |
| |
| (2) | At December 31, 2007 and 2006, the total face value of defaulted obligations was $18.4 million and $9.6 million, respectively, or approximately 0.4% and 0.5%, respectively, of the total underlying collateral assets. |
During the second half of 2007, the debt capital markets were volatile and market yields for CLO securities increased. We believe the market yields for our investments in CLO preferred shares/income notes have increased, and as a result, the fair value of certain of our investments in these assets has decreased. At December 31, 2007, the market yields used to value our preferred shares/income notes were
39
20% to 21%, with the exception of the income notes in one CLO with a cost and value of $18.7 million where we used a market yield of 15.9% and one CLO with a cost and value of $22.1 million where we used a market yield of 18.0% due to the characteristics of these issuances. Net change in unrealized appreciation or depreciation for the year ended December 31, 2007, included a net decrease of $12.4 million related to our investments in CLO/CDO Assets. We received valuation assistance from Duff & Phelps for our investments in the CLO/CDO Assets in each quarter of 2007. See “Results of Operations — Valuation Methodology — Private Finance” below for further discussion of the third-party valuation assistance we received.
Ciena Capital LLC. Ciena Capital LLC (f/k/a Business Loan Express, LLC) (Ciena) focuses on loan products that provide financing to commercial real estate owners and operators. Ciena is also a participant in the SBA’s 7(a) Guaranteed Loan Program and its wholly-owned subsidiary is licensed by the SBA as a Small Business Lending Company (SBLC). Ciena is headquartered in New York, NY and maintains offices in other U.S. locations. We invested in Ciena in 2000.
At December 31, 2007, our investment in Ciena totaled $327.8 million at cost and $68.6 million at value, after the effect of unrealized depreciation of $259.2 million. See “Results of Operations, Valuation of Ciena Capital LLC” for a discussion of the determination of the value of Ciena at December 31, 2007. In 2007, we increased our investment in Ciena by $32.4 million. We acquired $29.2 million in additional Class A equity interests to fund payments to the SBA discussed below and to provide additional capital to Ciena. In addition, we purchased $3.2 million in Class A equity interests from Ciena’s former Chief Executive Officer. At December 31, 2006, our investment in Ciena totaled $295.3 million at cost and $210.7 million at value, after the effect of unrealized depreciation of $84.6 million.
Net change in unrealized appreciation or depreciation included a net decrease on our investment in Ciena of $174.5 million and $142.3 million for the years ended December 31, 2007 and 2006, respectively, and a net increase of $2.9 million for the year ended December 31, 2005. See “Results of Operations, Valuation of Ciena Capital LLC” below.
Total interest and related portfolio income earned from our investment in Ciena for the years ended December 31, 2007, 2006, and 2005, was as follows:
| | | | | | | | | | | | | | |
| | | 2007 | | | 2006 | | | 2005 | |
| ($ in millions) | | | | | | | | | |
Interest income on subordinated debt and Class A equity interests(1) | | $ | — | | | $ | 11.9 | | | $ | 14.3 | |
Dividend income on Class B equity interests(1) | | | — | | | | — | | | | 14.0 | |
| Fees and other income | | | 5.4 | | | | 7.8 | | | | 9.2 | |
| | | | | | | | | | |
| | Total interest and related portfolio income | | $ | 5.4 | | | $ | 19.7 | | | $ | 37.5 | |
| | | | | | | | | | |
| |
| (1) | Interest and dividend income from Ciena for the years ended December 31, 2006 and 2005, included interest and dividend income of $5.7 million and $8.9 million, respectively, which was paid in kind. The interest and dividends paid in kind were paid to us through the issuance of additional debt or equity interests. |
In the fourth quarter of 2006, we placed our investment in Ciena’s 25% Class A equity interests on non-accrual status. As a result, there was no interest income from our investment in Ciena for the year ended December 31, 2007, and interest income for 2006 was lower as compared to 2005. In consideration for providing a guaranty on Ciena’s revolving credit facility and standby letters of credit (discussed below), we earned fees of $5.4 million, $6.1 million, and $6.3 million for the years ended December 31, 2007, 2006, and 2005, respectively, which were included in fees and other income. Ciena has not yet paid the $5.4 million in such fees earned by us in 2007. At December 31, 2007, such fees were included as a receivable in other assets. We considered this outstanding receivable in our valuation of Ciena at December 31, 2007. The remaining fees and other income in 2006 and 2005 relate to management fees from Ciena. We did not charge Ciena management fees in 2007 or in the fourth quarter of 2006.
We guarantee Ciena’s revolving credit facility that matures in March 2009. On January 30, 2008, Ciena completed an amendment of the terms of its revolving credit facility. The amendment reduced the commitments from the lenders under the facility from $500 million to $450 million at the effective date of the amendment, with further periodic reductions in total commitments to $325 million by December 31,
40
2008. In addition, certain financial and other covenants were amended. In connection with this amendment, we increased our unconditional guarantee from 60% to 100% of the total obligations under this facility (consisting of principal, letters of credit issued under the facility, accrued interest, and other fees) and agreed to replace $42.5 million in letters of credit issued under the Ciena credit facility with new letters of credit under our revolving line of credit. The guaranty of the Ciena revolving credit facility can be called by the lenders in the event of a default, which includes the occurrence of any event of default under our revolving credit facility, subject to grace periods in certain cases. The amendment also prohibits cash payments from Ciena to us for interest, guarantee fees, management fees, and dividends. On January 30, 2008, the principal amount outstanding on Ciena’s revolving credit facility was $351.9 million and letters of credit issued under the facility were $89.1 million, of which we replaced $42.5 million on January 31, 2008. Following the amendment of the revolving credit facility and the replacement of certain letters of credit by us, at January 31, 2008, amounts guaranteed by us under Ciena’s line of credit were $399.0 million, including $46.6 million of letters of credit issued under the facility. At December 31, 2007, the total obligation guaranteed by us was $258.7 million, and we had provided four standby letters of credit totaling $18.0 million in connection with four term securitization transactions completed by Ciena.
Ciena relies on the asset-backed securitization market to finance its loan origination activity. That financing source is an unreliable one in the current capital markets, and as a result, Ciena has significantly curtailed loan origination activity, including loan originations under the SBA’s 7(a) Guaranteed Loan Program. Ciena continues to reposition its business. However, there is an inherent risk in this repositioning and we continue to work with Ciena on restructuring. Ciena maintains two non-recourse securitization warehouse facilities, and there is no assurance that Ciena will be able to refinance these facilities in the term securitization market. We have issued performance guaranties whereby we have agreed to indemnify the warehouse providers for any damages, losses, liabilities and related costs and expenses that they may incur as a result of Ciena’s failure to perform any of its obligations as loan originator, loan seller or loan servicer under the warehouse securitizations.
The Office of the Inspector General of the SBA (OIG) and the United States Secret Service are conducting ongoing investigations of allegedly fraudulently obtained SBA guaranteed loans issued by Ciena. Specifically, on or about January 9, 2007, Ciena became aware of an indictment captioned as the United States v. Harrington, No. 2:06-CR-20662 pending in the United States District Court for the Eastern District of Michigan. The indictment alleged that a former Ciena employee in the Detroit office engaged in the fraudulent origination of loans guaranteed, in substantial part, by the SBA. We understand that Ciena is working cooperatively with the U.S. Attorney’s Office and the investigating agencies with respect to this matter. On October 1, 2007, the former Ciena employee pled guilty to one count of conspiracy to fraudulently originate SBA-guaranteed loans and one count of making a false statement before a grand jury. The OIG and the U.S. Department of Justice are also conducting a civil investigation of Ciena’s lending practices in various jurisdictions. As an SBA lender, Ciena is also subject to other SBA and OIG audits, investigations, and reviews. In addition, the Office of the Inspector General of the U.S. Department of Agriculture is conducting an investigation of Ciena’s lending practices under the Business and Industry Loan (B&I) program. These investigations, audits and reviews are ongoing.
On March 6, 2007, Ciena entered into an agreement with the SBA. According to the agreement, Ciena remains a preferred lender in the SBA 7(a) Guaranteed Loan Program and retains the ability to sell loans into the secondary market. As part of this agreement, Ciena agreed to the immediate payment of approximately $10 million to the SBA to cover amounts paid by the SBA with respect to some of the SBA-guaranteed loans that have been the subject of the charges by the U.S. Attorney’s Office for the Eastern District of Michigan against Mr. Harrington. As part of the SBA’s increased oversight, the agreement provides that any loans originated and closed by Ciena during the term of the agreement will be reviewed by an independent third party selected by the SBA prior to the sale of such loans into the secondary market. The agreement also requires Ciena to repurchase the guaranteed portion of certain loans that default after having been sold into the secondary market, and subjects such loans to a similar third party review prior to any reimbursement of Ciena by the SBA. In connection with this agreement, Ciena also entered into an escrow agreement with the SBA and an escrow agent in which Ciena agreed to
41
deposit $10 million with the escrow agent for any additional payments Ciena may be obligated to pay to the SBA in the future. Ciena remains subject to SBA rules and regulations and as a result may be required to make additional payments to the SBA in the ordinary course of business.
On or about January 16, 2007, Ciena and its subsidiary Business Loan Center LLC (BLC) became aware of a lawsuit titled, United States, ex rel James R. Brickman and Greenlight Capital, Inc. v. Business Loan Express LLC f/k/a Business Loan Express, Inc.; Business Loan Center LLC f/k/a Business Loan Center, Inc.; Robert Tannenhauser; Matthew McGee; and George Harrigan, 05-CV-3147 (JEC). The complaint includes allegations arising under the False Claims Act and relating to alleged fraud in connection with SBA guarantees on shrimp vessel loans. On December 18, 2007, the United States District Court for the Northern District of Georgia dismissed all claims in this matter. In January 2008, the plaintiffs filed a notice of their intention to appeal the dismissal.
These investigations, audits, reviews, and litigation have had and may continue to have a material adverse impact on Ciena and, as a result, could continue to negatively affect our financial results. We have considered Ciena’s current regulatory issues, ongoing investigations, litigation, and the repositioning of its business in performing the valuation of Ciena at December 31, 2007. See “Results of Operations — Valuation of Ciena Capital LLC” below. We are monitoring the situation.
Mercury Air Centers, Inc.At December 31, 2006, our investment in Mercury Air Centers, Inc. (Mercury) totaled $84.3 million at cost and $244.2 million at value, or 5.0% of our total assets, which included unrealized appreciation of $159.9 million. We completed the purchase of a majority ownership in Mercury in April 2004.
In August 2007, we completed the sale of our majority equity interest in Mercury. For the year ended December 31, 2007, we realized a gain of $262.4 million, subject to post-closing adjustments. In addition, we were repaid approximately $51 million of subordinated debt outstanding to Mercury at closing.
Mercury owned and operated fixed base operations generally under long-term leases from local airport authorities, which consisted of terminal and hangar complexes that serviced the needs of the general aviation community. Mercury was headquartered in Richmond Heights, OH.
Total interest and related portfolio income earned from our investment in Mercury for the years ended December 31, 2007, 2006, and 2005, was as follows:
| | | | | | | | | | | | | | |
| | | 2007 | | | 2006 | | | 2005 | |
| ($ in millions) | | | | | | | | | |
| Interest income | | $ | 5.1 | | | $ | 9.3 | | | $ | 8.8 | |
| Fees and other income | | | 0.2 | | | | 0.6 | | | | 0.7 | |
| | | | | | | | | | |
| | Total interest and related portfolio income | | $ | 5.3 | | | $ | 9.9 | | | $ | 9.5 | |
| | | | | | | | | | |
Net change in unrealized appreciation or depreciation for the year ended December 31, 2007, included an increase in unrealized appreciation totaling $74.9 million for the first half of 2007 and the reversal of $234.8 million associated with the sale of our majority equity interest in the third quarter of 2007. Net change in unrealized appreciation or depreciation included a net increase in unrealized appreciation on our investment in Mercury of $106.1 million and $53.8 million for the years ended December 31, 2006 and 2005, respectively.
Advantage Sales & Marketing, Inc. At December 31, 2005, our investment in Advantage totaled $257.7 million at cost and $660.4 million at value, or 16.4% of our total assets, which included unrealized appreciation of $402.7 million. Advantage is a sales and marketing agency providing outsourced sales, merchandising, and marketing services to the consumer packaged goods industry. Advantage has offices across the United States and is headquartered in Irvine, CA. We completed the purchase of a majority ownership in Advantage in June 2004.
On March 29, 2006, we sold our majority equity interest in Advantage. We were repaid our $184 million in subordinated debt outstanding at closing. For the year ended December 31, 2006, we realized a gain on the sale of our equity investment of $434.4 million, subject to post-closing adjustments
42
and excluding any earn-out amounts. We realized additional gains in 2007 resulting from post-closing adjustments and an earn-out payment totaling $3.4 million, subject to additional post-closing adjustments.
As consideration for the common stock sold in the transaction, we received a $150 million subordinated note, with the balance of the consideration paid in cash. In addition, a portion of our cash proceeds from the sale of the common stock were placed in escrow, subject to certain holdback provisions. At December 31, 2007, the amount of the escrow included in other assets on our consolidated balance sheet was approximately $25 million. For tax purposes, the receipt of the $150 million subordinated note as part of our consideration for the common stock sold and the hold back of certain proceeds in escrow will generally allow us, through installment treatment, to defer the recognition of taxable income for a portion of our realized gain until the note or other amounts are collected.
Total interest and related portfolio income earned from our investment in Advantage while we held a majority equity interest was $14.1 million (which included a prepayment premium of $5.0 million), and $37.4 million, for the years ended December 31, 2006, and 2005, respectively. In addition, we earned structuring fees of $2.3 million on our new $150 million subordinated debt investment in Advantage upon the closing of the sale transaction in 2006. Net change in unrealized appreciation or depreciation for the year ended December 31, 2006, included the reversal of $389.7 million of previously recorded unrealized appreciation associated with the realization of a gain on the sale of our majority equity interest in Advantage and for the year ended December 31, 2005, included an increase in unrealized appreciation of $378.4 million, related to our majority equity interest investment in Advantage.
In connection with the sale transaction, we retained an equity investment in the business valued at $15 million at closing as a minority shareholder. During the fourth quarter of 2006, Advantage made a distribution on this minority equity investment, which resulted in a realized gain of $4.8 million.
Our investment in Advantage at December 31, 2007, which was composed of subordinated debt and a minority equity interest, totaled $154.8 million at cost and $165.8 million at value, which included unrealized appreciation of $11.0 million.
Commercial Real Estate Finance
The commercial real estate finance portfolio at value, investment activity, and the yield on interest-bearing investments at and for the years ended December 31, 2007, 2006, and 2005, were as follows:
| | | | | | | | | | | | | | | | | | | | | | | | | | |
| | | At and for the Years Ended December 31, | |
| | | | |
| | | 2007 | | | 2006 | | | 2005 | |
| | | | | | | | | | |
| | | Value | | | Yield(1) | | | Value | | | Yield(1) | | | Value | | | Yield(1) | |
| ($ in millions) | | | | | | | | | | | | | | | | | | |
| Portfolio at value: | | | | | | | | | | | | | | | | | | | | | | | | |
| | Commercial mortgage loans | | | 65.4 | | | | 6.8% | | | | 71.9 | | | | 7.5% | | | | 102.6 | | | | 7.6% | |
| | Real estate owned | | | 21.3 | | | | | | | | 19.6 | | | | | | | | 13.9 | | | | | |
| | Equity interests | | | 34.5 | | | | | | | | 26.7 | | | | | | | | 10.6 | | | | | |
| | | | | | | | | | | | | | | | | | | |
| Total portfolio | | $ | 121.2 | | | | | | | $ | 118.2 | | | | | | | $ | 127.1 | | | | | |
| | | | | | | | | | | | | | | | | | | |
| Investments funded | | $ | 18.0 | | | | | | | $ | 14.4 | | | | | | | $ | 213.5 | | | | | |
| Change in accrued or reinvested interest | | $ | (0.7 | ) | | | | | | $ | 1.0 | | | | | | | $ | (18.0 | ) | | | | |
Principal collections related to investment repayments or sales(2) | | $ | 23.4 | | | | | | | $ | 39.9 | | | | | | | $ | 799.5 | | | | | |
| |
| (1) | The weighted average yield on the interest-bearing investments is computed as the (a) annual stated interest on accruing loans plus the annual amortization of loan origination fees, original issue discount, and market discount on accruing interest-bearing investments less the annual amortization of origination costs, divided by (b) total interest-bearing investments at value. The weighted average yield is computed as of the balance sheet date. Interest-bearing investments for the commercial real estate finance portfolio include all investments except for real estate owned and equity interests. |
| (2) | Principal collections related to investment repayments or sales for the year ended December 31, 2005, included $718.1 million related to the sale of our CMBS and CDO portfolio in May 2005. |
43
Our commercial real estate investments funded for the years ended December 31, 2007, 2006, and 2005, were as follows:
| | | | | | | | | | | | | | |
| | | Face | | | | | Amount | |
| ($ in millions) | | Amount | | | Discount | | | Funded | |
| For the Year Ended December 31, 2007 | | | | | | | | | |
| Commercial mortgage loans | | $ | 17.0 | | | $ | — | | | $ | 17.0 | |
| Equity interests | | | 1.0 | | | | — | | | | 1.0 | |
| | | | | | | | | | |
| | Total | | $ | 18.0 | | | $ | — | | | $ | 18.0 | |
| | | | | | | | | | |
For the Year Ended December 31, 2006 | | | | | | | | | | | | |
| Commercial mortgage loans | | $ | 8.0 | | | | — | | | | 8.0 | |
| Equity interests | | | 6.4 | | | | — | | | | 6.4 | |
| | | | | | | | | | |
| | Total | | $ | 14.4 | | | $ | — | | | $ | 14.4 | |
| | | | | | | | | | |
For the Year Ended December 31, 2005 | | | | | | | | | | | | |
CMBS bonds(1) | | $ | 211.5 | | | $ | (90.5 | ) | | $ | 121.0 | |
| Commercial mortgage loans | | | 88.5 | | | | (0.8 | ) | | | 87.7 | |
| Equity interests | | | 4.8 | | | | — | | | | 4.8 | |
| | | | | | | | | | |
| | Total | | $ | 304.8 | | | $ | (91.3 | ) | | $ | 213.5 | |
| | | | | | | | | | |
| |
| (1) | The CMBS bonds invested in during 2005 were sold on May 3, 2005. |
At December 31, 2007, we had outstanding funding commitments related to commercial mortgage loans and equity interests of $41.2 million, and commitments in the form of standby letters of credit and guarantees related to equity interests of $8.2 million.
Sale of CMBS Bonds and Collateralized Debt Obligation Bonds and Preferred Shares. On May 3, 2005, we completed the sale of our portfolio of commercial mortgage-backed securities (CMBS) and real estate related collateralized debt obligation (CDO) bonds and preferred shares to affiliates of Caisse de dépôt et placement du Québec (the Caisse) for cash proceeds of $976.0 million and a net realized gain of $227.7 million, after transaction and other costs of $7.8 million. Transaction costs included investment banking fees, legal and other professional fees, and other transaction costs. The CMBS and CDO assets sold had a cost basis at closing of $739.8 million, including accrued interest of $21.7 million. Upon the closing of the sale, we settled all the hedge positions relating to these assets, which resulted in a net realized loss of $0.7 million, which was included in the net realized gain on the sale.
Simultaneous with the sale of our CMBS and CDO portfolio, we entered into a platform assets purchase agreement with CWCapital Investments LLC, an affiliate of the Caisse (CWCapital), pursuant to which we agreed to sell certain commercial real estate related assets, including servicer advances, intellectual property, software and other platform assets, subject to certain adjustments. Under this agreement, we agreed not to primarily invest in non-investment grade CMBS and real estate-related CDOs and refrain from certain other real estate-related investing or servicing activities for a period of three years or through May 2008 subject to certain limitations and excluding our existing portfolio and related activities.
The real estate securities purchase agreement, under which we sold the CMBS and CDO portfolio, and the platform asset purchase agreement contain customary representations and warranties, and require us to indemnify the affiliates of the Caisse that are parties to the agreements for certain liabilities arising under the agreements, subject to certain limitations and conditions.
Managed Funds
We manage funds that invest in the debt and equity of primarily private middle market companies in a variety of industries. As of December 31, 2007, the funds that we manage had total assets of approximately $400 million. During 2007, we launched the Allied Capital Senior Debt Fund, L.P. and the Unitranche Fund LLC, and in early 2008, we formed the AGILE Fund I, LLC, all discussed below (together, the Managed Funds). Our responsibilities to the Managed Funds may include deal origination,
44
underwriting, and portfolio monitoring and development services consistent with the activities that we perform for our portfolio. Each of the Managed Funds may separately invest in the debt or equity of a portfolio company. Our portfolio may include debt or equity investments issued by the same portfolio company as investments held by one or more Managed Funds, and these investments may be senior, pari passu or junior to the debt and equity investments held by us. We may or may not participate in investments made by investment funds managed by us or one of our affiliates. We expect to continue to grow our managed capital base and have identified other private equity-related funds that we intend to develop. By growing our privately managed capital base, we are seeking to diversify our sources of capital, leverage our core investment expertise and increase fees and other income from asset management activities.
Allied Capital Senior Debt Fund, L.P. The Allied Capital Senior Debt Fund, L.P. (ACSDF) is a private fund that generally invests in senior, unitranche and second lien debt. ACSDF has closed on $125 million in equity capital commitments and had total assets of approximately $400 million at December 31, 2007. AC Corp, our wholly-owned subsidiary, is the investment manager and Callidus acts as special manager to ACSDF. One of our affiliates is the general partner of ACSDF, and AC Corp serves as collateral manager to a warehouse financing vehicle associated with ACSDF. AC Corp will earn a management fee of up to 2% per annum of the net asset value of ACSDF and will pay Callidus 25% of that management fee to compensate Callidus for its role as special manager.
We are a special limited partner in ACSDF, which is a portfolio investment, and have committed and funded $31.8 million to ACSDF. At December 31, 2007, our investment in ACSDF totaled $31.8 million at cost and $32.8 million at value. As a special limited partner, we expect to earn an incentive allocation of 20% of the annual net income of ACSDF, subject to certain performance benchmarks. The value of our investment in ACSDF is based on the net asset value of ACSDF, which reflects the capital invested plus our allocation of the net earnings of ACSDF, including the incentive allocation.
In connection with ACSDF’s formation in June 2007, we sold an initial portfolio of approximately $183 million of seasoned assets with a weighted average yield of 10.3% to a warehouse financing vehicle associated with ACSDF. In the second half of 2007, we sold $41.7 million of seasoned assets with a weighted average yield of 8.5% to the warehouse financing vehicle. We may offer to sell additional loans to ACSDF or the warehouse financing vehicle. ACSDF or the warehouse financing vehicle may purchase loans from us. ACSDF also purchases loans from other third parties. In addition, during the second half of 2007, we repurchased one asset for $12.0 million from ACSDF, which we had sold to ACSDF in June 2007.
Unitranche Fund LLC. In December 2007, we formed the Unitranche Fund LLC (Unitranche Fund), which we co-manage with an affiliate of General Electric Capital Corporation (GE). The Unitranche Fund is a private fund that generally focuses on making first lien unitranche loans to middle market companies with EBITDA of at least $15 million. The Unitranche Fund may invest up to $270 million for a single borrower. For financing needs greater than $270 million, we and GE may jointly underwrite additional financing for a total unitranche financing of up to $500 million. Allied Capital, GE and the Unitranche Fund may co-invest in a single borrower, with the Unitranche Fund holding at least a majority of the issuance. We may hold the portion of a unitranche loan underwritten by us. GE has committed $3.075 billion to the Unitranche Fund consisting of $3.0 billion of senior notes and $0.075 billion of subordinated certificates and we have committed $525.0 million of subordinated certificates. The Unitranche Fund will be capitalized as transactions are completed. At December 31, 2007, our investment in the Unitranche Fund totaled $0.7 million at cost and at value.
The Unitranche Fund is governed by an investment committee with equal representation from Allied Capital and GE and both Allied Capital and GE provide origination, underwriting and portfolio management services to the Unitranche Fund and its affiliates. We will earn a management and sourcing fee totaling 0.375% per annum of managed assets.
AGILE Fund I, LLC. In January 2008, we entered into an investment agreement with the Goldman Sachs Private Equity Group, part of Goldman Sachs Asset Management (Goldman Sachs). As part of the investment agreement, we agreed to sell a pro-rata strip of private equity and debt investments to AGILE
45
Fund I, LLC (AGILE), a private fund in which a fund managed by Goldman Sachs owns substantially all of the interests, for a total transaction value of $169 million. The majority of the investment sale closed simultaneously with the execution of the investment agreement. The sales of the remaining assets are expected to close by the end of the first quarter of 2008, subject to certain terms and conditions.
The sale to AGILE included 13.7% of our equity investments in 23 of our buyout portfolio companies and 36 of our minority equity portfolio companies for a total purchase price of $109 million. In addition, we sold approximately $60 million in debt investments, which represented 7.3% of our unitranche, second lien and subordinated debt investments in the buyout investments included in the equity sale. AGILE generally has the right to co-invest in its proportional share of any future follow-on investment opportunities presented by the companies in its portfolio.
We are the managing member of AGILE, and will be entitled to an incentive allocation subject to certain performance benchmarks. We own the remaining interests in AGILE not held by Goldman Sachs.
In addition, pursuant to the investment agreement Goldman Sachs has committed to invest at least $125 million in future investment vehicles managed by us and will have future opportunities to invest in our affiliates, or vehicles managed by them, and to coinvest alongside us in the future, subject to various terms and conditions. As part of this transaction, we have also agreed to sell 11 venture capital and private equity limited partnership investments for approximately $28 million to a fund managed by Goldman Sachs, which will assume the $6.5 million of unfunded commitments related to these limited partnership investments. The sales of these limited partnership investments are expected to be completed by May 2008.
In aggregate, including capital committed to our managed funds and our balance sheet, we have approximately $9 billion in managed capital.
PORTFOLIO ASSET QUALITY
Portfolio by Grade.We employ a grading system for our entire portfolio. Grade 1 is used for those investments from which a capital gain is expected. Grade 2 is used for investments performing in accordance with plan. Grade 3 is used for investments that require closer monitoring; however, no loss of investment return or principal is expected. Grade 4 is used for investments that are in workout and for which some loss of current investment return is expected, but no loss of principal is expected. Grade 5 is used for investments that are in workout and for which some loss of principal is expected.
At December 31, 2007 and 2006, our portfolio was graded as follows:
| | | | | | | | | | | | | | | | | |
| | | 2007 | | | 2006 | |
| | | | | | | |
| | | Portfolio | | | Percentage of | | | Portfolio | | | Percentage of | |
| Grade | | at Value | | | Total Portfolio | | | at Value | | | Total Portfolio | |
| | | | | | | | | | | | | |
| ($ in millions) | | | | | | | | |
| 1 | | $ | 1,539.6 | | | | 32.2 | % | | $ | 1,307.3 | | | | 29.1 | % |
| 2 | | | 2,915.7 | | | | 61.0 | | | | 2,672.3 | | | | 59.4 | |
| 3 | | | 122.5 | | | | 2.6 | | | | 308.1 | | | | 6.9 | |
| 4 | | | 157.2 | | | | 3.3 | | | | 84.2 | | | | 1.9 | |
| 5 | | | 45.5 | | | | 0.9 | | | | 124.2 | | | | 2.7 | |
| | | | | | | | | | | | | |
| | | $ | 4,780.5 | | | | 100.0 | % | | $ | 4,496.1 | | | | 100.0 | % |
| | | | | | | | | | | | | |
The amount of the portfolio in each grading category may vary substantially from year to year resulting primarily from changes in the composition of the portfolio as a result of new investment, repayment, and exit activity, changes in the grade of investments to reflect our expectation of performance, and changes in investment values. We expect that a number of investments will be in the Grades 4 or 5 categories from time to time. Part of the private equity business is working with troubled portfolio companies to improve their businesses and protect our investment. The number and amount of investments included in Grade 4 and 5 may fluctuate from year to year. We continue to follow our historical practice
46
of working with portfolio companies in order to recover the maximum amount of our investment. Grade 4 and 5 assets include loans, debt securities, and equity securities.
Total Grade 4 and 5 portfolio assets were $202.7 million and $208.4 million, respectively, or were 4.2% and 4.6%, respectively, of the total portfolio value at December 31, 2007 and 2006.
At December 31, 2007, our Class A equity interests in Ciena, valued at $68.6 million, were classified as Grade 4, and our Class B and Class C equity interests, which had no value, were classified as Grade 5. At December 31, 2006, $135.9 million of our investment in Ciena at value was classified as Grade 3, which included our Class A equity interests and certain of our Class B equity interests that were not depreciated, and $74.8 million of our investment in Ciena at value was classified as Grade 5, which included certain of our Class B equity interests and all our Class C equity interests that were depreciated at December 31, 2006. See “— Private Finance — Ciena Capital LLC” above.
Loans and Debt Securities on Non-Accrual Status.In general, interest is not accrued on loans and debt securities if we have doubt about interest collection or where the enterprise value of the portfolio company may not support further accrual. In addition, interest may not accrue on loans to portfolio companies that are more than 50% owned by us depending on such company’s capital requirements. To the extent interest payments are received on a loan that is not accruing interest, we may use such payments to reduce our cost basis in the investment in lieu of recognizing interest income.
At December 31, 2007 and 2006, loans and debt securities at value not accruing interest for the total investment portfolio were as follows:
| | | | | | | | | | | |
| | | 2007 | | | 2006 | |
| ($ in millions) | | | | | | |
Loans and debt securities in workout status (classified as Grade 4 or 5)(1) | | | | | | | | |
| | Private finance | | | | | | | | |
| | | Companies more than 25% owned | | $ | 114.1 | | | $ | 51.1 | |
| | | Companies 5% to 25% owned | | | 11.7 | | | | 4.0 | |
| | | Companies less than 5% owned | | | 23.8 | | | | 31.6 | |
| | Commercial real estate finance | | | 12.4 | | | | 12.2 | |
| Loans and debt securities not in workout status | | | | | | | | |
| | Private finance | | | | | | | | |
| | | Companies more than 25% owned | | | 21.4 | | | | 87.1 | |
| | | Companies 5% to 25% owned | | | 13.4 | | | | 7.2 | |
| | | Companies less than 5% owned | | | 13.3 | | | | 38.9 | |
| | Commercial real estate finance | | | 1.9 | | | | 6.7 | |
| | | | | | | |
| | | Total | | $ | 212.0 | | | $ | 238.8 | |
| | | | | | | |
| | | Percentage of total portfolio | | | 4.4 | % | | | 5.3 | % |
| |
| (1) | Workout loans and debt securities exclude equity securities that are included in the total Grade 4 and 5 assets above. |
At December 31, 2007 and 2006, our Class A equity interests in Ciena of $68.6 million, which represented 1.4% of the total portfolio at value, and $66.6 million, which represented 1.5% of the total portfolio at value, respectively, were included in non-accruals. At December 31, 2007, these Class A equity interests were classified as Grade 4 and at December 31, 2006, these Class A equity interests were classified as Grade 3. See “ — Private Finance — Ciena Capital LLC” above.
Loans and Debt Securities Over 90 Days Delinquent.Loans and debt securities greater than 90 days delinquent at value at December 31, 2007 and 2006, were as follows:
| | | | | | | | | | |
| | | 2007 | | | 2006 | |
| | | | | | | |
| ($ in millions) | | | | |
| Private finance | | $ | 139.9 | | | $ | 46.5 | |
| Commercial mortgage loans | | | 9.2 | | | | 1.9 | |
| | | | | | | |
| | Total | | $ | 149.1 | | | $ | 48.4 | |
| | | | | | | |
| | Percentage of total portfolio | | | 3.1 | % | | | 1.1 | % |
47
The amount of loans and debt securities over 90 days delinquent increased to $149.1 million at December 31, 2007, from $48.4 million at December 31, 2006. The increase in loans and debt securities over 90 days delinquent primarily relates to not receiving payment on our Class A equity interests of Ciena, which became over 90 days delinquent in the first quarter of 2007. At December 31, 2007, the Class A equity interests were $68.6 million, or 1.4% of the total portfolio at value. These equity interests were placed on non-accrual during the fourth quarter of 2006. See “ — Private Finance, Ciena Capital LLC” above.
The amount of the portfolio that is on non-accrual status or greater than 90 days delinquent may vary from year to year. Loans and debt securities on non-accrual status and over 90 days delinquent should not be added together as they are two separate measures of portfolio asset quality. Loans and debt securities that are in both categories (i.e., on non-accrual statusand over 90 days delinquent) totaled $149.1 million and $44.3 million at December 31, 2007 and 2006, respectively.
OTHER ASSETS AND OTHER LIABILITIES
Other assets is composed primarily of fixed assets, assets held in deferred compensation trusts, prepaid expenses, deferred financing and offering costs, and accounts receivable, which includes amounts received in connection with the sale of portfolio companies, including amounts held in escrow, and other receivables from portfolio companies. At December 31, 2007 and 2006, other assets totaled $157.9 million and $123.0 million, respectively. The increase since December 31, 2006, was primarily the result of an increase in prepaid expenses related to tax deposits, deferred financing costs, assets held in deferred compensation trusts, and escrow receivables. See “— Private Finance” above.
Accounts payable and other liabilities is primarily composed of the liabilities related to the deferred compensation trust and accrued interest, bonus and taxes, including excise tax. At December 31, 2007 and 2006, accounts payable and other liabilities totaled $153.3 million and $147.1 million, respectively. The increase since December 31, 2006, was primarily the result of an increase in the accrued interest payable of $7.1 million. Accrued interest fluctuates from period to period depending on the amount of debt outstanding and the contractual payment dates of the interest on such debt.
48
RESULTS OF OPERATIONS
Comparison of the Years Ended December 31, 2007, 2006, and 2005
The following table summarizes our operating results for the years ended December 31, 2007, 2006, and 2005.
| | | | | | | | | | | | | | | | | | | | | | | | | | | | | | | | | | | |
| | | | | | | | | Percent | | | | | | | | | Percent | |
| | | 2007 | | | 2006 | | | Change | | | Change | | | 2006 | | | 2005 | | | Change | | | Change | |
| (in thousands, except per share amounts) | | | | | | | | | | | | | | | | | | | | | | | | |
| Interest and Related Portfolio Income | | | | | | | | | | | | | | | | | | | | | | | | | | | | | | | | |
| | Interest and dividends | | $ | 417,576 | | | $ | 386,427 | | | $ | 31,149 | | | | 8 | % | | $ | 386,427 | | | $ | 317,153 | | | $ | 69,274 | | | | 22 | % |
| | Fees and other income | | | 44,129 | | | | 66,131 | | | | (22,002 | ) | | | (33 | )% | | | 66,131 | | | | 56,999 | | | | 9,132 | | | | 16 | % |
| | | | | | | | | | | | | | | | | | | | | | | | | |
| | | Total interest and related portfolio income | | | 461,705 | | | | 452,558 | | | | 9,147 | | | | 2 | % | | | 452,558 | | | | 374,152 | | | | 78,406 | | | | 21 | % |
| | | | | | | | | | | | | | | | | | | | | | | | | |
Expenses | | | | | | | | | | | | | | | | | | | | | | | | | | | | | | | | |
| | Interest | | | 132,080 | | | | 100,600 | | | | 31,480 | | | | 31 | % | | | 100,600 | | | | 77,352 | | | | 23,248 | | | | 30 | % |
| | Employee | | | 89,155 | | | | 92,902 | | | | (3,747 | ) | | | (4 | )% | | | 92,902 | | | | 78,300 | | | | 14,602 | | | | 19 | % |
| | Employee stock options | | | 35,233 | | | | 15,599 | | | | 19,634 | | | | 126 | % | | | 15,599 | | | | — | | | | 15,599 | | | | — | |
| | Administrative | | | 50,580 | | | | 39,005 | | | | 11,575 | | | | 30 | % | | | 39,005 | | | | 69,713 | | | | (30,708 | ) | | | (44 | )% |
| | | | | | | | | | | | | | | | | | | | | | | | | |
| | | Total operating expenses | | | 307,048 | | | | 248,106 | | | | 58,942 | | | | 24 | % | | | 248,106 | | | | 225,365 | | | | 22,741 | | | | 10 | % |
| | | | | | | | | | | | | | | | | | | | | | | | | |
| | | Net investment income before income taxes | | | 154,657 | | | | 204,452 | | | | (49,795 | ) | | | (24 | )% | | | 204,452 | | | | 148,787 | | | | 55,665 | | | | 37 | % |
| | | Income tax expense, including excise tax | | | 13,624 | | | | 15,221 | | | | (1,597 | ) | | | (10 | )% | | | 15,221 | | | | 11,561 | | | | 3,660 | | | | 32 | % |
| | | | | | | | | | | | | | | | | | | | | | | | | |
| | | Net investment income | | | 141,033 | | | | 189,231 | | | | (48,198 | ) | | | (25 | )% | | | 189,231 | | | | 137,226 | | | | 52,005 | | | | 38 | % |
| | | | | | | | | | | | | | | | | | | | | | | | | |
Net Realized and Unrealized Gains (Losses) | | | | | | | | | | | | | | | | | | | | | | | | | | | | | | | | |
| | Net realized gains | | | 268,513 | | | | 533,301 | | | | (264,788 | ) | | | (50 | )% | | | 533,301 | | | | 273,496 | | | | 259,805 | | | | 95 | % |
| | Net change in unrealized appreciation or depreciation | | | (256,243 | ) | | | (477,409 | ) | | | 221,166 | | | | * | | | | (477,409 | ) | | | 462,092 | | | | (939,501 | ) | | | * | |
| | | | | | | | | | | | | | | | | | | | | | | | | |
| | Total net gains (losses) | | | 12,270 | | | | 55,892 | | | | (43,622 | ) | | | * | | | | 55,892 | | | | 735,588 | | | | (679,696 | ) | | | * | |
| | | | | | | | | | | | | | | | | | | | | | | | | |
| | | Net income | | $ | 153,303 | | | $ | 245,123 | | | $ | (91,820 | ) | | | (37 | )% | | $ | 245,123 | | | $ | 872,814 | | | $ | (627,691 | ) | | | (72 | )% |
| | | | | | | | | | | | | | | | | | | | | | | | | |
| Diluted earnings per common share | | $ | 0.99 | | | $ | 1.68 | | | $ | (0.69 | ) | | | (41 | )% | | $ | 1.68 | | | $ | 6.36 | | | $ | (4.68 | ) | | | (74 | )% |
| | | | | | | | | | | | | | | | | | | | | | | | | |
| Weighted average common shares outstanding — diluted | | | 154,687 | | | | 145,599 | | | | 9,088 | | | | 6 | % | | | 145,599 | | | | 137,274 | | | | 8,325 | | | | 6 | % |
| |
| * | Net change in unrealized appreciation or depreciation and net gains (losses) can fluctuate significantly from year to year. |
49
Total Interest and Related Portfolio Income. Total interest and related portfolio income includes interest and dividend income and fees and other income.
Interest and Dividends. Interest and dividend income for the years ended December 31, 2007, 2006, and 2005, was composed of the following:
| | | | | | | | | | | | | | | |
| | | 2007 | | | 2006 | | | 2005 | |
| ($ in millions) | | | | | | | | | |
| Interest | | | | | | | | | | | | |
| | Private finance loans and debt securities | | $ | 376.1 | | | $ | 348.4 | | | $ | 247.8 | |
| | Preferred shares/income notes of CLOs | | | 18.0 | | | | 11.5 | | | | 3.2 | |
| | CMBS and real estate-related CDO portfolio | | | — | | | | — | | | | 29.4 | |
| | Commercial mortgage loans | | | 6.4 | | | | 8.3 | | | | 7.6 | |
| | Cash, U.S. Treasury bills, money market and other securities | | | 15.1 | | | | 14.0 | | | | 9.4 | |
| | | | | | | | | | |
| | | Total interest | | | 415.6 | | | | 382.2 | | | | 297.4 | |
| Dividends | | | 2.0 | | | | 4.2 | | | | 19.8 | |
| | | | | | | | | | |
| | | Total interest and dividends | | $ | 417.6 | | | $ | 386.4 | | | $ | 317.2 | |
| | | | | | | | | | |
The level of interest income, which includes interest paid in cash and in kind, is directly related to the balance of the interest-bearing investment portfolio outstanding during the year multiplied by the weighted average yield. The interest-bearing investments in the portfolio at value and the yield on the interest-bearing investments in the portfolio at December 31, 2007, 2006, and 2005, were as follows:
| | | | | | | | | | | | | | | | | | | | | | | | | | | |
| | | 2007 | | | 2006 | | | 2005 | |
| | | | | | | | | | |
| ($ in millions) | | Value | | | Yield(1) | | | Value | | | Yield(1) | | | Value | | | Yield(1) | |
| | | | | | | | | | | | | | | | | | | |
| Loans and debt securities: | | | | | | | | | | | | | | | | | | | | | | | | |
| | Private finance | | $ | 3,414.6 | | | | 12.1 | % | | $ | 3,185.2 | | | | 11.9 | % | | $ | 2,094.9 | | | | 13.0 | % |
| | Commercial mortgage loans | | | 65.4 | | | | 6.8 | % | | | 71.9 | | | | 7.5 | % | | | 102.6 | | | | 7.6 | % |
| | | | | | | | | | | | | | | | | | | |
| | | Total loans and debt securities | | | 3,480.0 | | | | 12.0 | % | | | 3,257.1 | | | | 11.8 | % | | | 2,197.5 | | | | 12.8 | % |
| Equity securities: | | | | | | | | | | | | | | | | | | | | | | | | |
| | Preferred shares/income notes
of CLOs | | | 203.0 | | | | 14.6 | % | | | 97.2 | | | | 15.5 | % | | | 72.3 | | | | 13.7 | % |
| | | | | | | | | | | | | | | | | | | |
| | | Total interest bearing securities | | $ | 3,683.0 | | | | 12.1 | % | | $ | 3,354.3 | | | | 11.9 | % | | $ | 2,269.8 | | | | 12.8 | % |
| | | | | | | | | | | | | | | | | | | |
| |
| (1) | The weighted average yield on loans and debt securities is computed as the (a) annual stated interest on accruing loans and debt securities plus the annual amortization of loan origination fees, original issue discount, and market discount on accruing loans and debt securities less the annual amortization of loan origination costs, divided by (b) total interest-bearing investments at value. The weighted average yield on the preferred shares/income notes of CLOs is calculated as the (a) effective interest yield on the preferred shares/income notes of CLOs, divided by (b) preferred shares/income notes of CLOs at value. The weighted average yields are computed as of the balance sheet date. |
Our interest income from our private finance loans and debt securities has increased year over year primarily as a result of the growth in this portfolio. The private finance loan and debt securities portfolio yield at December 31, 2007, of 12.1% as compared to the private finance portfolio yield of 11.9% and 13.0% at December 31, 2006 and 2005, respectively, reflects the mix of debt investments in the private finance loan and debt securities portfolio. The weighted average yield varies from year to year based on the current stated interest on loans and debt securities and the amount of loans and debt securities for which interest is not accruing. See the discussion of the private finance portfolio yield above under the caption “— Portfolio and Investment Activity — Private Finance.”
Interest income also includes the effective interest yield on our investments in the preferred shares/income notes of CLOs. Interest income from these investments has increased year over year primarily as a result of the growth in these assets. The weighted average yield on the preferred shares/income notes of the CLOs at December 31, 2007, was 14.6%, as compared to the weighted average yield on the preferred shares/income notes of the CLOs yield of 15.5% and 13.7% at December 31, 2006 and 2005, respectively.
50
There was no interest income from the CMBS and real estate-related CDO portfolio in 2007 or 2006 as we sold this portfolio on May 3, 2005. The CMBS and CDO portfolio sold had a cost basis of $718.1 million and a weighted average yield on the cost basis of the portfolio of approximately 13.8%. We generally reinvested the principal proceeds from the CMBS and CDO portfolio into our private finance portfolio.
Interest income from cash, U.S. Treasury bills, money market and other securities results primarily from interest earned on our liquidity portfolio and excess cash on hand. During the fourth quarter of 2005, we established a liquidity portfolio that was composed primarily of money market and other securities and U.S. Treasury bills. At December 31, 2007, the liquidity portfolio was composed primarily of money market securities. See “Financial Condition, Liquidity and Capital Resources” below. The value and weighted average yield of the liquidity portfolio was $201.2 million and 4.6%, respectively, at December 31, 2007, $201.8 million and 5.3%, respectively, at December 31, 2006, and $200.3 million and 4.2%, respectively, at December 31, 2005.
Dividend income results from the dividend yield on preferred equity interests, if any, or the declaration of dividends by a portfolio company on preferred or common equity interests. Dividend income will vary from year to year depending upon the timing and amount of dividends that are declared or paid by a portfolio company on preferred or common equity interests. Dividend income for the years ended December 31, 2007 and 2006, did not include any dividends from Ciena. See “— Private Finance, Ciena Capital LLC” above. Dividend income for the year ended December 31, 2005, included dividends from Ciena on the Class B equity interests held by us of $14.0 million. For the year ended December 31, 2005, $12.0 million of these dividends were paid in cash and $2.0 million of these dividends were paid through the issuance of additional Class B equity interests.
Fees and Other Income. Fees and other income primarily include fees related to financial structuring, diligence, transaction services, management and consulting services to portfolio companies, commitments, guarantees, and other services and loan prepayment premiums. As a business development company, we are required to make significant managerial assistance available to the companies in our investment portfolio. Managerial assistance includes, but is not limited to, management and consulting services related to corporate finance, marketing, human resources, personnel and board member recruiting, business operations, corporate governance, risk management and other general business matters.
Fees and other income for the years ended December 31, 2007, 2006, and 2005, included fees relating to the following:
| | | | | | | | | | | | | | |
| | | 2007 | | | 2006 | | | 2005 | |
| ($ in millions) | | | | | | | | | |
| Structuring and diligence | | $ | 20.7 | | | $ | 37.3 | | | $ | 24.6 | |
Management, consulting and other services provided to portfolio companies(1) | | | 9.6 | | | | 11.1 | | | | 14.4 | |
Commitment, guaranty and other fees from portfolio companies(2) | | | 9.3 | | | | 8.8 | | | | 9.3 | |
Fund management fees(3) | | | 0.5 | | | | — | | | | — | |
| Loan prepayment premiums | | | 3.7 | | | | 8.8 | | | | 6.3 | |
| Other income | | | 0.3 | | | | 0.1 | | | | 2.4 | |
| | | | | | | | | | |
| | Total fees and other income(4) | | $ | 44.1 | | | $ | 66.1 | | | $ | 57.0 | |
| | | | | | | | | | |
| |
| (1) | 2006 includes $1.8 million in management fees from Advantage prior to its sale on March 29, 2006. See “— Portfolio and Investment Activity” above for further discussion. 2005 includes $6.5 million in management fees from Advantage. 2006 and 2005 included management fees from Ciena of $1.7 million and $2.9 million, respectively. We did not charge Ciena management fees in 2007 or in the fourth quarter of 2006. See “ — Private Finance — Ciena Capital LLC” above. |
| |
| (2) | Includes guaranty and other fees from Ciena of $5.4 million, $6.1 million, and $6.3 million for 2007, 2006, and 2005, respectively. See “— Private Finance — Ciena Capital LLC” above. |
| |
| (3) | See “Portfolio and Investment Activity — Managed Funds” above. |
| |
| (4) | Fees and other income related to the CMBS and CDO portfolio were $4.1 million for 2005. As noted above, we sold our CMBS and CDO portfolio on May 3, 2005. |
51
Fees and other income are generally related to specific transactions or services and therefore may vary substantially from year to year depending on the level of investment activity, the types of services provided and the level of assets in managed funds for which we earn management or other fees. Loan origination fees that represent yield enhancement on a loan are capitalized and amortized into interest income over the life of the loan.
Structuring and diligence fees primarily relate to the level of new investment originations. Private finance investments funded were $1.8 billion for the year ended December 31, 2007, as compared to $2.4 billion and $1.5 billion for the years ended December 31, 2006 and 2005, respectively. This resulted in lower structuring and diligence fees in 2007 versus 2006.
Loan prepayment premiums for the year ended December 31, 2006, included $5.0 million related to the repayment of our subordinated debt in connection with the sale of our majority equity interest in Advantage on March 29, 2006. See “— Portfolio and Investment Activity” above for further discussion. While the scheduled maturities of private finance and commercial real estate loans generally range from five to ten years, it is not unusual for our borrowers to refinance or pay off their debts to us ahead of schedule. Therefore, we generally structure our loans to require a prepayment premium for the first three to five years of the loan. Accordingly, the amount of prepayment premiums will vary depending on the level of repayments and the age of the loans at the time of repayment.
See “— Portfolio and Investment Activity” above for further information regarding our total interest and related portfolio income for Ciena, Mercury, and Advantage.
Operating Expenses. Operating expenses include interest, employee, employee stock options, and administrative expenses.
Interest Expense. The fluctuations in interest expense during the years ended December 31, 2007, 2006, and 2005, were primarily attributable to changes in the level of our borrowings under various notes payable and our revolving line of credit. Our borrowing activity and weighted average cost of debt, including fees and debt financing costs, at and for the years ended December 31, 2007, 2006, and 2005, were as follows:
| | | | | | | | | | | | | |
| | | 2007 | | | 2006 | | | 2005 | |
| ($ in millions) | | | | | | | | | |
| Total outstanding debt | | $ | 2,289.5 | | | $ | 1,899.1 | | | $ | 1,284.8 | |
| Average outstanding debt | | $ | 1,924.2 | | | $ | 1,491.0 | | | $ | 1,087.1 | |
Weighted average cost(1) | | | 6.5 | % | | | 6.5 | % | | | 6.5 | % |
| |
| (1) | The weighted average annual interest cost is computed as the (a) annual stated interest rate on the debt plus the annual amortization of commitment fees, other facility fees and debt financing costs that are recognized into interest expense over the contractual life of the respective borrowings, divided by (b) debt outstanding on the balance sheet date. |
In addition, interest expense included interest paid to the Internal Revenue Service related to installment sale gains totaling $5.8 million, $0.9 million, and $0.6 million for the years ended December 31, 2007, 2006, and 2005, respectively. See “Dividends and Distributions” below.
Interest expense also included interest on our obligations to replenish borrowed Treasury securities related to our hedging activities of $0.7 million and $1.4 million for the years ended December 31, 2006 and 2005, respectively.
52
Employee Expense. Employee expenses for the years ended December 31, 2007, 2006, and 2005, were as follows:
| | | | | | | | | | | | | | |
| | | 2007 | | | 2006 | | | 2005 | |
| ($ in millions) | | | | | | | | | |
| Salaries and employee benefits | | $ | 83.9 | | | $ | 73.8 | | | $ | 57.3 | |
| Individual performance award (IPA) | | | 9.8 | | | | 8.1 | | | | 7.0 | |
| IPA mark to market expense (benefit) | | | (14.0 | ) | | | 2.9 | | | | 2.0 | |
| Individual performance bonus (IPB) | | | 9.5 | | | | 8.1 | | | | 6.9 | |
Transition compensation, net(1) | | | — | | | | — | | | | 5.1 | |
| | | | | | | | | | |
| | Total employee expense(2) | | $ | 89.2 | | | $ | 92.9 | | | $ | 78.3 | |
| | | | | | | | | | |
| Number of employees at end of period | | | 177 | | | | 170 | | | | 131 | |
| |
| (1) | Transition compensation for the year ended December 31, 2005, included $3.1 million of costs under retention agreements and $3.1 million of transition services bonuses awarded to certain employees in the commercial real estate group as a result of the sale of the CMBS and CDO portfolio. Transition compensation costs were reduced by $1.1 million for salary reimbursements from CWCapital under a transition services agreement. |
| |
| (2) | Excludes stock options expense. See below. |
The change in salaries and employee benefits reflects the effect of compensation increases, the change in mix of employees given their area of responsibility and relevant experience level and an increase in the number of employees. The overall increase in salaries and employee benefits also reflects the competitive environment for attracting and retaining talent in the private equity industry. Salaries and employee benefits include an accrual for employee bonuses, which are generally paid annually after the completion of the fiscal year. Salaries and employee benefits included bonus expense of $40.1 million, $38.2 million, and $26.9 million for the years ended December 31, 2007, 2006, and 2005, respectively.
The IPA is an incentive compensation program for certain officers and is generally determined annually at the beginning of each year. Through December 31, 2007, the IPA was deposited into a deferred compensation trust generally in four equal installments, on a quarterly basis, in the form of cash. The trustee was required to use the cash to purchase shares of our common stock in the open market. The accounts of the trust are consolidated with our accounts. We are required to mark to market the liability of the trust and this adjustment is recorded to the IPA compensation expense. Because the IPA has been deferred compensation, the cost of this award is not a current expense for purposes of computing our taxable income until distributions are made from the trust.
On December 14, 2007, our Board of Directors made a determination that it is in Allied Capital’s best interest to terminate our deferred compensation plans. The Board of Directors’ decision was primarily in response to increased complexity resulting from recent changes in the regulation of deferred compensation arrangements. The Board of Directors resolved that our deferred compensation plans will be terminated in accordance with the provisions of each of the plans and the accounts under the plans will be distributed to participants in full on March 18, 2008, the termination and distribution date, or as soon as is reasonably practicable thereafter, in accordance with the transition rule for payment elections under Section 409A of the Internal Revenue Code of 1986.
Distributions from the plans will be made in cash or shares of our common stock, net of required withholding taxes. The assets of the rabbi trust related to The Allied Capital Corporation Non-Qualified Deferred Compensation Plans (DCPs I) are primarily invested in assets other than shares of our common stock. At December 31, 2007, the liability to participants related to DCPs I was valued at $21.1 million in the aggregate, and that liability is fully funded by assets held in the rabbi trust.
The assets of the rabbi trust related to The Allied Capital Corporation Non-Qualified Deferred Compensation Plans II(DCPs II) are primarily invested in shares of our common stock. At December 31, 2007, the liability to participants related to DCPs II was valued at $31.4 million in the aggregate, and that
53
liability is fully funded by assets held in the rabbi trust. At December 31, 2007, the DCPs II rabbi trust held approximately 1.4 million shares of our common stock.
The account balances in the plans have accumulated as a result of prior compensation earned by the participants. The contributions to the plans reflect a combination of participant elective compensation deferrals and non-elective employer contributions, including contributions related to previously earned individual performance awards. The distribution of the DCPs I and DCPs II assets will result in a tax deduction for 2008, subject to the limitations set by Section 162(m) of the Code for persons subject to such section.
The IPB is distributed in cash to award recipients throughout the year (beginning in February of each respective year) as long as the recipient remains employed by us.
The Compensation Committee of the Board of Directors and the Board of Directors have determined the IPA and the IPB for 2008 and they are currently estimated to be approximately $9.6 million each; however, the Compensation Committee may adjust the IPA or IPB as needed, or make new awards as new officers are hired. For 2008, the Compensation Committee has determined that the IPAs will be paid in cash in two equal installments during the year, as long as the recipient remains employed by us. If a recipient terminates employment during the year, any remaining payments under the IPA or IPB would be forfeited.
Stock Options Expense. Effective January 1, 2006, we adopted Statement No. 123 (Revised 2004),Share-Based Payment (SFAS 123R) using the modified prospective method of application, which required us to recognize compensation costs on a prospective basis beginning January 1, 2006. Under this method, the unamortized cost of previously awarded options that were unvested as of January 1, 2006, will be recognized over the remaining service period in the statement of operations beginning in 2006, using the fair value amounts determined for proforma disclosure under SFAS 123R. With respect to options granted on or after January 1, 2006, compensation cost based on estimated grant date fair value is recognized in the consolidated statement of operations over the service period. Our employee stock options are typically granted with ratable vesting provisions, and we amortize the compensation cost over the related service period. The stock option expense for the years ended December 31, 2007 and 2006, was as follows:
| | | | | | | | | | | | |
| | | 2007 | | | 2006 | |
| ($ in millions) | | | | | | |
| Employee Stock Option Expense: | | | | | | | | |
| | Options granted: | | | | | | | | |
| | | Previously awarded, unvested options as of January 1, 2006 | | $ | 10.1 | | | $ | 13.2 | |
| | | Options granted on or after January 1, 2006 | | | 10.7 | | | | 2.4 | |
| | | | | | | |
| | | | Total options granted | | | 20.8 | | | | 15.6 | |
| | Options cancelled in connection with tender offer (see below) | | | 14.4 | | | | — | |
| | | | | | | |
| | | | Total employee stock option expense | | $ | 35.2 | | | $ | 15.6 | |
| | | | | | | |
Options Granted. In addition to the employee stock option expense for both options granted, for both the years ended December 31, 2007 and 2006, administrative expense included $0.2 million of expense related to options granted to directors during each year. Options were granted to non-officer directors in the second quarters of 2007 and 2006. Options granted to non-officer directors vest on the grant date and therefore, the full expense is recorded on the grant date.
During the second quarter of 2007, options were granted for 6.4 million shares. One-third of the options granted to employees vested on June 30, 2007; therefore, approximately one-third of the expense related to this grant, or $5.9 million, was recorded in the second quarter of 2007. Of the remaining options granted, one-half will vest on June 30, 2008, and one-half will vest on June 30, 2009. We estimate that the employee-related stock option expense for outstanding unvested options as of December 31, 2007, will be approximately $9.7 million and $2.8 million for the years ended December 31, 2008 and 2009, respectively. This estimate may change if our assumptions related to future option forfeitures change. This estimate does not include any expense related to stock option grants after December 31, 2007, as the fair value of those stock options will be determined at the time of grant.
54
On February 1, 2008, the Compensation Committee of our Board of Directors granted 7.1 million options with an exercise price of $22.96. The options vest ratably over a three-year period beginning on June 30, 2009. The estimated expense detailed above does not include any expense related to the options granted in 2008.
Options Cancelled in Connection with Tender Offer. On July 18, 2007, we completed a tender offer to our optionees who held vested “in-the-money” stock options as of June 20, 2007,where optionees received an option cancellation payment (OCP), equal to the “in-the-money” value of the stock options cancelled determined using a Weighted Average Market Price of $31.75 paid one-half in cash and one-half in unregistered shares of our common stock. We accepted for cancellation 10.3 million vested options held by employees and non-officer directors, which in the aggregate had a weighted average exercise price of $21.50. This resulted in a total option cancellation payment of approximately $105.6 million, of which $52.8 million was paid in cash and $52.8 million was paid through the issuance of 1.7 million unregistered shares of the Company’s common stock. Our stockholders approved the issuance of the shares of our common stock in exchange for the cancellation of vested “in-the-money” stock options at our 2006 Annual Meeting of Stockholders. Cash payments to employee optionees were paid net of required payroll and income tax withholdings.
The OCP was equal to the “in-the-money” value of the stock options cancelled, determined using the Weighted Average Market Price of $31.75, and was paid one-half in cash and one-half in unregistered shares of the Company’s common stock. In accordance with the terms of the tender offer, the Weighted Average Market Price represented the volume weighted average price of our common stock over the fifteen trading days preceding the first day of the offer period, or June 20, 2007. Because the Weighted Average Market Price at the commencement of the tender offer on June 20, 2007, was higher than the market price of our common stock at the close of the offer on July 18, 2007, SFAS 123R required us to record a non-cash employee-related stock option expense of $14.4 million and administrative expense related to stock options cancelled that were held by non-officer directors of $0.4 million. The same amounts were recorded as an increase to additional paid-in capital and, therefore, had no effect on our net asset value. The portion of the OCP paid in cash of $52.8 million reduced our additional paid-in capital and therefore reduced our net asset value. For income tax purposes, our tax deduction resulting from the OCP will be similar to the tax deduction that would have resulted from an exercise of stock options in the market. Any tax deduction resulting from the OCP or an exercise of stock options in the market is limited by Section 162(m) of the Code.
Administrative Expense. Administrative expenses include legal and accounting fees, valuation assistance fees, insurance premiums, the cost of leases for our headquarters in Washington, DC, and our regional offices, portfolio origination and development expenses, travel costs, stock record expenses, directors’ fees and related stock options expense, and various other expenses. Administrative expenses for the years ended December 31, 2007, 2006, and 2005, were as follows:
| | | | | | | | | | | | | | |
| | | 2007 | | | 2006 | | | 2005 | |
| ($ in millions) | | | | | | | | | |
| Administrative expenses | | $ | 44.8 | | | $ | 34.0 | | | $ | 33.3 | |
| Investigation and litigation costs | | | 5.8 | | | | 5.0 | | | | 36.4 | |
| | | | | | | | | | |
| | Total administrative expenses | | $ | 50.6 | | | $ | 39.0 | | | $ | 69.7 | |
| | | | | | | | | | |
Administrative expenses, excluding investigation and litigation costs, for the year ended December 31, 2007, included costs of $1.4 million incurred in the first quarter of 2007 to engage a third party to conduct a review of Ciena’s internal control systems. See “— Private Finance, Ciena Capital LLC” above. In addition, administrative expenses for the year ended December 31, 2007, included $2.5 million in placement fees related to securing equity commitments to the Allied Capital Senior Debt Fund, L.P. in the second quarter of 2007. See “— Managed Funds — Allied Capital Senior Debt Fund, L.P.” above.
Administrative expenses, excluding investigation and litigation costs and the costs outlined above, were $40.9 million for the year ended December 31, 2007, which is an increase of $6.9 million from 2006. The increase was primarily due to increased expenses related to directors’ fees of $1.6 million, an increase in
55
stock record expenses of $0.7 million due to the increase in our shareholder base, an increase in rent expense of $0.7 million, and an increase in costs related to evaluating potential new investments of $0.7 million. Costs related to debt investments are generally paid by the borrower, however, costs related to buyout investments are generally funded by us. Accordingly, if a prospective deal does not close, we incur expenses that are not recoverable.
Investigation and litigation costs are difficult to predict and may vary from year to year. See “Item 3. Legal Proceedings”.
Income Tax Expense, Including Excise Tax. Income tax expense for the years ended December 31, 2007, 2006, and 2005, was as follows:
| | | | | | | | | | | | | | |
| | | 2007 | | | 2006 | | | 2005 | |
| ($ in millions) | | | | | | | | | |
| Income tax expense (benefit) | | $ | (2.7 | ) | | $ | 0.1 | | | $ | 5.4 | |
Excise tax expense(1) | | | 16.3 | | | | 15.1 | | | | 6.2 | |
| | | | | | | | | | |
| | Income tax expense, including excise tax | | $ | 13.6 | | | $ | 15.2 | | | $ | 11.6 | |
| | | | | | | | | | |
| |
| (1) | While excise tax expense is presented in the Consolidated Statement of Operations as a reduction to net investment income, excise tax relates to both net investment income and net realized gains. |
Our wholly-owned subsidiary, A.C. Corporation, is a corporation subject to federal and state income taxes and records a benefit or expense for income taxes as appropriate based on its operating results in a given period.
Our estimated annual taxable income for 2007 exceeded our dividend distributions to shareholders from such taxable income in 2007, and such estimated excess taxable income will be distributed in 2008. Therefore, we will generally be required to pay an excise tax equal to 4% of the amount by which 98% of our annual taxable income exceeds the distributions for the year. We have recorded an estimated excise tax of $16.3 million for the year ended December 31, 2007. See “Dividends and Distributions.”
In June 2006, the FASB issued Interpretation No. 48,Accounting for Uncertainty in Income Taxes, which clarifies the accounting for uncertainty in income taxes recognized in an enterprise’s financial statements in accordance with FASB Statement No. 109,Accounting for Income Taxes. This interpretation is effective for fiscal years beginning after December 15, 2006. The adoption of this interpretation did not have a significant effect on our consolidated financial position or our results of operations.
Realized Gains and Losses.Net realized gains primarily result from the sale of equity securities associated with certain private finance investments and the realization of unamortized discount resulting from the sale and early repayment of private finance loans and commercial mortgage loans, offset by losses on investments. In 2005, net realized gains also resulted from the sale of real estate-related CMBs bonds and CDO bonds and preferred shares. Net realized gains for the years ended December 31, 2007, 2006, and 2005, were as follows:
| | | | | | | | | | | | | |
| | | 2007 | | | 2006 | | | 2005 | |
| ($ in millions) | | | | | | | | | |
| Realized gains | | $ | 400.5 | | | $ | 557.5 | | | $ | 343.1 | |
| Realized losses | | | (132.0 | ) | | | (24.2 | ) | | | (69.6 | ) |
| | | | | | | | | | |
| Net realized gains | | $ | 268.5 | | | $ | 533.3 | | | $ | 273.5 | |
| | | | | | | | | | |
When we exit an investment and realize a gain or loss, we make an accounting entry to reverse any unrealized appreciation or depreciation, respectively, we had previously recorded to reflect the appreciated or depreciated value of the investment. For the years ended December 31, 2007, 2006, and 2005, we
56
reversed previously recorded unrealized appreciation or depreciation when gains or losses were realized as follows:
| | | | | | | | | | | | | | |
| | | 2007 | | | 2006 | | | 2005(1) | |
| ($ in millions) | | | | | | | | | |
| Reversal of previously recorded net unrealized appreciation associated with realized gains | | $ | (332.6 | ) | | $ | (501.5 | ) | | $ | (108.0 | ) |
| Reversal of previously recorded net unrealized depreciation associated with realized losses | | | 139.8 | | | | 22.5 | | | | 68.0 | |
| | | | | | | | | | |
| | Total reversal | | $ | (192.8 | ) | | $ | (479.0 | ) | | $ | (40.0 | ) |
| | | | | | | | | | |
| | | |
| | (1) | Includes the reversal of net unrealized appreciation of $6.5 million on the CMBS and CDO assets sold and the related hedges. The net unrealized appreciation recorded on these assets prior to their sale was determined on an individual security-by-security basis. The net gain realized upon the sale of $227.7 million reflects the total value received for the portfolio as a whole. | |
Realized gains for the years ended December 31, 2007, 2006, and 2005, were as follows:
($ in millions)
| | | | | | |
| 2007 | |
| | |
| Portfolio Company | | Amount | |
| | | | |
Private Finance: | | | | |
| Mercury Air Centers, Inc. | | $ | 262.4 | |
| HMT, Inc. | | | 39.9 | |
| Healthy Pet Corp. | | | 36.6 | |
| Palm Coast Data, LLC | | | 20.0 | |
| Woodstream Corporation | | | 14.6 | |
| Wear Me Apparel Corporation | | | 6.1 | |
| Mogas Energy, LLC | | | 5.7 | |
| Tradesmen International, Inc. | | | 3.8 | |
| ForeSite Towers, LLC | | | 3.8 | |
| Advantage Sales & Marketing, Inc. | | | 3.4 | |
| Geotrace Technologies, Inc. | | | 1.1 | |
| Other | | | 3.0 | |
| | | | |
| | Total private finance | | | 400.4 | |
| | | | |
Commercial Real Estate: | | | | |
| Other | | | 0.1 | |
| | | | |
| | Total commercial real estate | | | 0.1 | |
| | | | |
| Total realized gains | | $ | 400.5 | |
| | | | |
| | | | | | |
| 2006 | |
| | |
| Portfolio Company | | Amount | |
| | | | |
Private Finance: | | | | |
Advantage Sales & Marketing, Inc.(1) | | $ | 434.4 | |
| STS Operating, Inc. | | | 94.8 | |
| Oriental Trading Company, Inc. | | | 8.9 | |
Advantage Sales & Marketing, Inc.(2) | | | 4.8 | |
| United Site Services, Inc. | | | 3.3 | |
| Component Hardware Group, Inc. | | | 2.8 | |
| Opinion Research Corporation | | | 1.9 | |
| Nobel Learning Communities, Inc. | | | 1.5 | |
| MHF Logistical Solutions, Inc. | | | 1.2 | |
| The Debt Exchange, Inc. | | | 1.1 | |
| Other | | | 1.5 | |
| | | | |
| | Total private finance | | | 556.2 | |
| | | | |
Commercial Real Estate: | | | | |
| Other | | | 1.3 | |
| | | | |
| | Total commercial real estate | | | 1.3 | |
| | | | |
| Total realized gains | | $ | 557.5 | |
| | | | |
| | | | | | |
| 2005 | |
| | |
| Portfolio Company | | Amount | |
| | | | |
Private Finance: | | | | |
| Housecall Medical Resources, Inc. | | $ | 53.7 | |
| Fairchild Industrial Products Company | | | 16.2 | |
| Apogen Technologies Inc. | | | 9.0 | |
| Polaris Pool Systems, Inc. | | | 7.4 | |
| MasterPlan, Inc. | | | 3.7 | |
| U.S. Security Holdings, Inc. | | | 3.3 | |
| Ginsey Industries, Inc. | | | 2.8 | |
| E-Talk Corporation | | | 1.6 | |
| Professional Paint, Inc. | | | 1.6 | |
| Oriental Trading Company, Inc. | | | 1.0 | |
| Woodstream Corporation | | | 0.9 | |
| Impact Innovations Group, LLC | | | 0.8 | |
| DCS Business Services, Inc. | | | 0.7 | |
| Other | | | 3.4 | |
| | | | |
| | Total private finance | | | 106.1 | |
| | | | |
Commercial Real Estate: | | | | |
CMBS/CDO assets, net(3) | | | 227.7 | |
| Other | | | 9.3 | |
| | | | |
| | Total commercial real estate | | | 237.0 | |
| | | | |
| Total realized gains | | $ | 343.1 | |
| | | | |
| |
| (1) | Represents the realized gain on our majority equity investment only. See “—Private Finance” above. |
| (2) | Represents a realized gain on our minority equity investment only. See “—Private Finance” above. |
| (3) | Net of net realized losses from related hedges of $0.7 million for the year ended December 31, 2005. |
57
Realized losses for the years ended December 31, 2007, 2006, and 2005, were as follows:
($ in millions)
| | | | | |
| 2007 | |
| | |
| Portfolio Company | | Amount | |
| | | | |
Private Finance: | | | | |
| Global Communications, LLC | | $ | 34.3 | |
| Jakel, Inc. | | | 24.8 | |
| Startec Global Communications, Inc. | | | 20.2 | |
| Gordian Group, Inc. | | | 19.3 | |
| Powell Plant Farms, Inc. | | | 11.6 | |
| Universal Environmental Services, LLC | | | 8.6 | |
| PresAir, LLC | | | 6.0 | |
| Legacy Partners Group, LLC | | | 5.8 | |
| Alaris Consulting, LLC | | | 1.0 | |
| Other | | | 0.4 | |
| | | | |
| Total realized losses | | $ | 132.0 | |
| | | | |
| | | | | | |
| 2006 | |
| | |
| Portfolio Company | | Amount | |
| | | | |
Private Finance: | | | | |
| Staffing Partners Holding Company, Inc. | | $ | 10.6 | |
| Acme Paging, L.P. | | | 4.7 | |
| Cooper Natural Resources, Inc. | | | 2.2 | |
| Aspen Pet Products, Inc. | | | 1.6 | |
| Nobel Learning Communities, Inc. | | | 1.4 | |
| Other | | | 1.6 | |
| | | | |
| | Total private finance | | | 22.1 | |
| | | | |
Commercial Real Estate: | | | | |
| Other | | | 2.1 | |
| | | | |
| | Total commercial real estate | | | 2.1 | |
| | | | |
| Total realized losses | | $ | 24.2 | |
| | | | |
| | | | | | |
| 2005 | |
| | |
| Portfolio Company | | Amount | |
| | | | |
Private Finance: | | | | |
| Norstan Apparel Shops, Inc. | | $ | 18.5 | |
| Acme Paging, L.P. | | | 13.8 | |
| E-Talk Corporation | | | 9.0 | |
| Garden Ridge Corporation | | | 7.1 | |
| HealthASPex, Inc. | | | 3.5 | |
| MortgageRamp, Inc. | | | 3.5 | |
| Maui Body Works, Inc. | | | 2.7 | |
| Packaging Advantage Corporation | | | 2.2 | |
| Other | | | 3.7 | |
| | | | |
| | Total private finance | | | 64.0 | |
| | | | |
Commercial Real Estate: | | | | |
| Other | | | 5.6 | |
| | | | |
| | Total commercial real estate | | | 5.6 | |
| | | | |
| Total realized losses | | $ | 69.6 | |
| | | | |
Change in Unrealized Appreciation or Depreciation.We determine the value of each investment in our portfolio on a quarterly basis, and changes in value result in unrealized appreciation or depreciation being recognized in our statement of operations. Value, as defined in Section 2(a)(41) of the Investment Company Act of 1940, is (i) the market price for those securities for which a market quotation is readily available and (ii) for all other securities and assets, fair value is as determined in good faith by the Board of Directors. Since there is typically no readily available market value for the investments in our portfolio, we value substantially all of our portfolio investments at fair value as determined in good faith by the Board of Directors pursuant to our valuation policy and a consistently applied valuation process. At December 31, 2007, portfolio investments recorded at fair value were approximately 92% of our total assets. Because of the inherent uncertainty of determining the fair value of investments that do not have a readily available market value, the fair value of our investments determined in good faith by the Board of Directors may differ significantly from the values that would have been used had a ready market existed for the investments, and the differences could be material.
There is no single standard for determining fair value in good faith. As a result, determining fair value requires that judgment be applied to the specific facts and circumstances of each portfolio investment while employing a consistently applied valuation process for the types of investments we make. Unlike banks, we are not permitted to provide a general reserve for anticipated loan losses. Instead, we are required to specifically value each individual investment on a quarterly basis. We will record unrealized depreciation on investments when we believe that an investment has become impaired, including where collection of a loan or realization of an equity security is doubtful, or when the enterprise value of the portfolio company does not currently support the cost of our debt or equity investment. Enterprise value means the entire value of the company to a potential buyer, including the sum of the values of debt and equity securities used to capitalize the enterprise at a point in time. We will record unrealized appreciation if we believe that the underlying portfolio company has appreciated in value and/or our equity security has appreciated in value. Changes in fair value are recorded in the statement of operations as net change in unrealized appreciation or depreciation.
As a business development company, we have invested in illiquid securities including debt and equity securities of companies, CLO bonds and preferred shares/income notes, and CDO bonds. The structure of each debt and equity security is specifically negotiated to enable us to protect our investment and maximize our returns. We include many terms governing interest rate, repayment terms, prepayment
58
penalties, financial covenants, operating covenants, ownership parameters, dilution parameters, liquidation preferences, voting rights, and put or call rights. Our investments may be subject to certain restrictions on resale and generally have no established trading market. Because of the type of investments that we make and the nature of our business, our valuation process requires an analysis of various factors. Our fair value methodology includes the examination of, among other things, the underlying investment performance, financial condition, and market changing events that impact valuation.
We are currently analyzing the effect of adoption of Statement No. 157,Fair Value Measurements,which we will be adopting on a prospective basis beginning in the quarter ending March 31, 2008. See “Critical Accounting Policies” below.
Valuation Methodology — Private Finance.Our process for determining the fair value of a private finance investment begins with determining the enterprise value of the portfolio company. The fair value of our investment is based on the enterprise value at which the portfolio company could be sold in an orderly disposition over a reasonable period of time between willing parties other than in a forced or liquidation sale. The liquidity event whereby we exit a private finance investment is generally the sale, the recapitalization or, in some cases, the initial public offering of the portfolio company.
There is no one methodology to determine enterprise value and, in fact, for any one portfolio company, enterprise value is best expressed as a range of fair values. However, we must derive a single estimate of enterprise value. To determine the enterprise value of a portfolio company, we analyze its historical and projected financial results. This financial and other information is generally obtained from the portfolio companies, and may represent unaudited, projected or pro forma financial information. We generally require portfolio companies to provide annual audited and quarterly unaudited financial statements, as well as annual projections for the upcoming fiscal year. Typically in the private equity business, companies are bought and sold based on multiples of EBITDA, cash flow, net income, revenues or, in limited instances, book value. The private equity industry uses financial measures such as EBITDA or EBITDAM (Earnings Before Interest, Taxes, Depreciation, Amortization and, in some instances, Management fees) in order to assess a portfolio company’s financial performance and to value a portfolio company. EBITDA and EBITDAM are not intended to represent cash flow from operations as defined by U.S. generally accepted accounting principles and such information should not be considered as an alternative to net income, cash flow from operations, or any other measure of performance prescribed by U.S. generally accepted accounting principles. When using EBITDA to determine enterprise value, we may adjust EBITDA for non-recurring items. Such adjustments are intended to normalize EBITDA to reflect the portfolio company’s earnings power. Adjustments to EBITDA may include compensation to previous owners, acquisition, recapitalization, or restructuring related items or one-time non-recurring income or expense items.
In determining a multiple to use for valuation purposes, we generally look to private merger and acquisition statistics, the entry multiple for the transaction, discounted public trading multiples or industry practices. In estimating a reasonable multiple, we consider not only the fact that our portfolio company may be a private company relative to a peer group of public comparables, but we also consider the size and scope of our portfolio company and its specific strengths and weaknesses. In some cases, the best valuation methodology may be a discounted cash flow analysis based on future projections. If a portfolio company is distressed, a liquidation analysis may provide the best indication of enterprise value.
If there is adequate enterprise value to support the repayment of our debt, the fair value of our loan or debt security normally corresponds to cost unless the borrower’s condition or other factors lead to a determination of fair value at a different amount. The fair value of equity interests in portfolio companies is determined based on various factors, including the enterprise value remaining for equity holders after the repayment of the portfolio company’s debt and other preference capital, and other pertinent factors such as recent offers to purchase a portfolio company, recent transactions involving the purchase or sale of the portfolio company’s equity securities, liquidation events, or other events. The determined equity values are
59
generally discounted when we have a minority position, restrictions on resale, specific concerns about the receptivity of the capital markets to a specific company at a certain time, or other factors.
CLO/CDO Assets are carried at fair value, which is based on a discounted cash flow model that utilizes prepayment, re-investment and loss assumptions based on historical experience and projected performance, economic factors, the characteristics of the underlying cash flow and comparable yields for similar bonds and preferred shares/income notes, when available. We recognize unrealized appreciation or depreciation on our CLO/CDO Assets as comparable yields in the market change and/ or based on changes in estimated cash flows resulting from changes in prepayment, re-investment or loss assumptions in the underlying collateral pool. We determine the fair value of our CLO/CDO Assets on an individual security-by-security basis. If we were to sell a group of these CLO/CDO Assets in a pool in one or more transactions, the total value received for that pool may be different than the sum of the fair values of the individual assets.
As a participant in the private equity business, we invest primarily in private middle market companies for which there is generally no publicly available information. Because of the private nature of these businesses, there is a need to maintain the confidentiality of the financial and other information that we have for the private companies in our portfolio. We believe that maintaining this confidence is important, as disclosure of such information could disadvantage our portfolio companies and could put us at a disadvantage in attracting new investments. Therefore, we do not intend to disclose financial or other information about our portfolio companies, unless required, because we believe doing so may put them at an economic or competitive disadvantage, regardless of our level of ownership or control.
We currently intend to continue to work with third-party consultants to obtain assistance in determining fair value for a portion of the private finance portfolio each quarter. We work with these consultants to obtain assistance as additional support in the preparation of our internal valuation analysis. In addition, we may receive third-party assessments of a particular private finance portfolio company’s value in the ordinary course of business, most often in the context of a prospective sale transaction or in the context of a bankruptcy process.
The valuation analysis prepared by management is submitted to our Board of Directors who is ultimately responsible for the determination of fair value of the portfolio in good faith. Valuation assistance from Duff & Phelps, LLC (Duff & Phelps) for our private finance portfolio consisted of certain limited procedures (the Procedures) we identified and requested them to perform. Based upon the performance of the Procedures on a selection of our final portfolio company valuations, Duff & Phelps concluded that the fair value of those portfolio companies subjected to the Procedures did not appear unreasonable. In addition, we also received third-party valuation assistance from other third-party consultants for certain private finance portfolio companies. For the years ended December 31, 2007, 2006, and 2005, we received third-party valuation assistance as follows:
| | | | | | | | | | | | | | | | | |
| | | 2007 | |
| | | | |
| | | Q4 | | | Q3 | | | Q2 | | | Q1 | |
| | | | | | | | | | | | | |
| Number of private finance portfolio companies reviewed | | | 112 | | | | 135 | | | | 92 | | | | 88 | |
| Percentage of private finance portfolio reviewed at value | | | 91.1 | % | | | 92.1 | % | | | 92.1 | % | | | 91.8 | % |
| | | | | | | | | | | | | | | | | |
| | | 2006 | |
| | | | |
| | | Q4 | | | Q3 | | | Q2 | | | Q1 | |
| | | | | | | | | | | | | |
| Number of private finance portfolio companies reviewed | | | 81 | | | | 105 | | | | 78 | | | | 78 | |
| Percentage of private finance portfolio reviewed at value | | | 82.9 | % | | | 86.5 | % | | | 89.6 | % | | | 87.0 | % |
| | | | | | | | | | | | | | | | | |
| | | 2005 | |
| | | | |
| | | Q4 | | | Q3 | | | Q2 | | | Q1 | |
| | | | | | | | | | | | | |
| Number of private finance portfolio companies reviewed | | | 80 | | | | 89 | | | | 72 | | | | 36 | |
| Percentage of private finance portfolio reviewed at value | | | 92.4 | % | | | 89.3 | % | | | 83.0 | % | | | 74.5 | % |
60
Professional fees for third-party valuation assistance for the years ended December 31, 2007, 2006, and 2005, were $1.8 million, $1.5 million, and $1.4 million, respectively.
Net Change in Unrealized Appreciation or Depreciation. Net change in unrealized appreciation or depreciation for the years ended December 31, 2007, 2006, and 2005, consisted of the following:
| | | | | | | | | | | | | | |
| | | 2007(1) | | | 2006(1) | | | 2005(1) | |
| ($ in millions) | | | | | | | | | |
Net unrealized appreciation (depreciation)(2) | | $ | (63.4 | ) | | $ | 1.6 | | | $ | 502.1 | |
| Reversal of previously recorded unrealized appreciation associated with realized gains | | | (332.6 | ) | | | (501.5 | ) | | | (108.0 | ) |
| Reversal of previously recorded unrealized depreciation associated with realized losses | | | 139.8 | | | | 22.5 | | | | 68.0 | |
| | | | | | | | | | |
| | Net change in unrealized appreciation or depreciation | | $ | (256.2 | ) | | $ | (477.4 | ) | | $ | 462.1 | |
| | | | | | | | | | |
| |
| (1) | The net change in unrealized appreciation or depreciation can fluctuate significantly from year to year. As a result, annual comparisons may not be meaningful. |
| |
| (2) | The sale of certain of our portfolio investments to Goldman Sachs that occurred in the first quarter of 2008 provided transaction values for 59 portfolio investments that were used in the December 31, 2007, valuation process. |
Valuation of Ciena Capital LLC.Our investment in Ciena totaled $327.8 million at cost and $68.6 million at value, which included unrealized depreciation of $259.2 million, at December 31, 2007, and $295.3 million at cost and $210.7 million at value, which included unrealized depreciation of $84.6 million, at December 31, 2006.
Ciena relies on the asset-backed securitization market to finance its loan origination activity. That financing source is an unreliable one in the current capital markets, and as a result, Ciena has significantly curtailed loan origination activity. To value our investment at December 31, 2007, we determined that no value could be attributed to Ciena’s origination platform or enterprise due to the state of the securitization markets, among other factors. In addition, Ciena’s book value declined during the quarter ended December 31, 2007. We valued our investment in Ciena at December 31, 2007 solely based on the estimated realizable value of Ciena’s net assets, including the estimated realizable value of the cash flows generated from Ciena’s retained interests in its current servicing portfolio, which includes portfolio servicing fees as well as cash flows from Ciena’s equity investments in its securitizations and its interest-only strip. This resulted in a value to our investment, after repayment of senior debt outstanding, of $68.6 million at December 31, 2007.
We also continued to consider Ciena’s current regulatory issues and ongoing investigations and litigation in performing the valuation analysis at December 31, 2007. (See “— Private Finance, Ciena Capital LLC” above.)
Net change in unrealized appreciation or depreciation included a net decrease of $174.5 million and $142.3 million for the years ended December 31, 2007 and 2006, respectively, and a net increase of $2.9 million for the year ended December 31, 2005, related to our investment in Ciena. We received valuation assistance from Duff & Phelps for our investment in Ciena at December 31, 2007, 2006, and 2005. See “Valuation Methodology — Private Finance” above for further discussion of the third-party valuation assistance we received.
Per Share Amounts.All per share amounts included in the Management’s Discussion and Analysis of Financial Condition and Results of Operations section have been computed using the weighted average common shares used to compute diluted earnings per share, which were 154.7 million, 145.6 million, and 137.3 million for the years ended December 31, 2007, 2006, and 2005, respectively.
OTHER MATTERS
Regulated Investment Company Status.We have elected to be taxed as a regulated investment company under Subchapter M of the Code. As long as we qualify as a regulated investment company, we are not taxed on our investment company taxable income or realized net capital gains, to the extent that
61
such taxable income or gains are distributed, or deemed to be distributed, to shareholders on a timely basis.
Dividends are paid to shareholders from taxable income. Taxable income generally differs from net income for financial reporting purposes due to temporary and permanent differences in the recognition of income and expenses, and generally excludes net unrealized appreciation or depreciation, as gains or losses generally are not included in taxable income until they are realized. In addition, gains realized for financial reporting purposes may differ from gains included in taxable income as a result of our election to recognize gains using installment sale treatment, which generally results in the deferment of gains for tax purposes until notes or other amounts, including amounts held in escrow, received as consideration from the sale of investments are collected in cash. See “Dividends and Distributions” below.
Dividends declared and paid by us in a year generally differ from taxable income for that year as such dividends may include the distribution of current year taxable income, the distribution of prior year taxable income carried over into and distributed in the current year, or returns of capital. We are generally required to distribute 98% of our taxable income during the year the income is earned to avoid paying an excise tax. If this requirement is not met, the Code imposes a nondeductible excise tax equal to 4% of the amount by which 98% of the current year’s taxable income exceeds the distribution for the year from such taxable income. The taxable income on which an excise tax is paid is generally carried over and distributed to shareholders in the next tax year. Depending on the level of taxable income earned in a tax year, we may choose to carry over taxable income in excess of current year distributions from such taxable income into the next tax year and pay a 4% excise tax on such income, as required. See “Dividends and Distributions” below.
In order to maintain our status as a regulated investment company and obtain regulated investment company tax benefits, we must, in general, (1) continue to qualify as a business development company; (2) derive at least 90% of our gross income from dividends, interest, gains from the sale of securities and other specified types of income; (3) meet asset diversification requirements as defined in the Code; and (4) timely distribute to shareholders at least 90% of our annual investment company taxable income as defined in the Code. We intend to take all steps necessary to continue to qualify as a regulated investment company. However, there can be no assurance that we will continue to qualify for such treatment in future years.
DIVIDENDS AND DISTRIBUTIONS
Total regular quarterly dividends to common shareholders were $2.57, $2.42, and $2.30 per common share for the years ended December 31, 2007, 2006, and 2005, respectively. An extra cash dividend of $0.07, $0.05, and $0.03 per common share was declared during 2007, 2006, and 2005, respectively, and was paid to shareholders on December 27, 2007, January 19, 2007, and January 27, 2006, respectively. The Board of Directors has declared a dividend of $0.65 per common share for the first quarter of 2008.
Our Board of Directors reviews the dividend rate quarterly, and may adjust the quarterly dividend throughout the year. Dividends are declared considering our estimate of annual taxable income available for distribution to shareholders and the amount of taxable income carried over from the prior year for distribution in the current year. Our goal is to declare what we believe to be sustainable increases in our regular quarterly dividends. To the extent that we earn annual taxable income in excess of dividends paid from such taxable income for the year, we may carry over the excess taxable income into the next year and such excess income will be available for distribution in the next year as permitted under the Code (see discussion below). Such income will be treated under the Code as having been distributed during the prior year for purposes of our qualification for RIC tax treatment for such year. The maximum amount of excess taxable income that we may carry over for distribution in the next year under the Code is the total amount of dividends paid in the following year, subject to certain declaration and payment guidelines. Excess taxable income carried over and paid out in the next year is generally subject to a nondeductible 4% excise tax. We believe that carrying over excess taxable income into future periods may provide increased visibility with respect to taxable earnings available to pay the regular quarterly dividend.
62
Taxable income includes our taxable interest, dividend and fee income, as well as taxable net capital gains. Taxable income generally differs from net income for financial reporting purposes due to temporary and permanent differences in the recognition of income and expenses, and generally excludes net unrealized appreciation or depreciation, as gains or losses are not included in taxable income until they are realized. In addition, gains realized for financial reporting purposes may differ from gains included in taxable income as a result of our election to recognize gains using installment sale treatment, which generally results in the deferment of gains for tax purposes until notes or other amounts, including amounts held in escrow, received as consideration from the sale of investments are collected in cash. Taxable income includes non-cash income, such as changes in accrued and reinvested interest and dividends, which includes contractual payment-in-kind interest, and the amortization of discounts and fees. Cash collections of income resulting from contractual payment-in-kind interest or the amortization of discounts and fees generally occur upon the repayment of the loans or debt securities that include such items. Non-cash taxable income is reduced by non-cash expenses, such as realized losses and depreciation and amortization expense.
The summary of our taxable income and distributions of such taxable income for the years ended December 31, 2007, 2006, and 2005, is as follows:
| | | | | | | | | | | | | | |
| | | 2007 | | | 2006 | | | 2005 | |
| ($ in millions) | | | | | | | | | |
| | | (ESTIMATED)(1) | | | | | |
Taxable income(2) | | $ | 407.6 | | | $ | 601.2 | | | $ | 445.0 | |
| Taxable income earned in current year and carried forward for distribution in next year | | | (403.1 | ) | | | (402.8 | ) | | | (156.5 | ) |
| Taxable income earned in prior year and carried forward and distributed in current year | | | 402.8 | | | | 156.5 | | | | 26.0 | |
| | | | | | | | | | |
| | Total dividends to common shareholders | | $ | 407.3 | | | $ | 354.9 | | | $ | 314.5 | |
| | | | | | | | | | |
| |
| (1) | Our taxable income for 2007 is an estimate and will not be finally determined until we file our 2007 tax return in September 2008. Therefore, the final taxable income and the taxable income earned in 2007 and carried forward for distribution in 2008 may be different than the estimate above. See “Risk Factors” under Item 1A and Note 10, “Dividends and Distributions and Taxes” of our Notes to Consolidated Financial Statements included in Item 8. |
| |
| (2) | See Note 10, “Dividends and Distributions and Taxes” of our Notes to Consolidated Financial Statements included in Item 8 for further information on the differences between net income for book purposes and taxable income. |
Our estimated annual taxable income for 2007 exceeded our dividend distributions to shareholders for 2007 from such taxable income, and, therefore, we will carry over excess taxable income, which is currently estimated to be $403.1 million, for distribution to shareholders in 2008. The maximum amount of excess taxable income that may be carried over for distribution in the next year under the Code is the total amount of dividends paid in the following year, subject to certain declaration and payment guidelines. Excess taxable income carried over and paid out in the next year is generally subject to a 4% excise tax. For the years ended December 31, 2007, 2006, and 2005, excise tax expense was $16.3 million, $15.1 million, and $6.2 million, respectively. See “Other Matters — Regulated Investment Company Status” above.
In addition to excess taxable income available to be carried over from 2007 for distribution in 2008, we currently estimate that we have cumulative deferred taxable income related to installment sale gains of approximately $234.5 million as of December 31, 2007, which is composed of cumulative deferred taxable income of $211.5 million as of December 31, 2006, and approximately $23.0 million for the year ended December 31, 2007. These gains have been recognized for financial reporting purposes in the respective years they were realized, but generally will be deferred for tax purposes until the notes or other amounts received from the sale of the related investments are collected in cash. The installment sale gains for 2007 are estimates and will not be finally determined until we file our 2007 tax return in September 2008. See “Other Matters — Regulated Investment Company Status” above.
To the extent that installment sale gains are deferred for recognition in taxable income, we pay interest to the Internal Revenue Service. Installment-related interest expense for the years ended December 31, 2007, 2006, and 2005, was $5.8 million, $0.9 million, and $0.6 million, respectively. This interest is included in interest expense in our Consolidated Statement of Operations.
63
FINANCIAL CONDITION, LIQUIDITY AND CAPITAL RESOURCES
At December 31, 2007 and 2006, our liquidity portfolio, cash and investments in money market and other securities, total assets, total debt outstanding, total shareholders’ equity, debt to equity ratio and asset coverage for senior indebtedness were as follows:
| | | | | | | | | |
| | | 2007 | | | 2006 | |
| ($ in millions) | | | | | | |
| Liquidity portfolio (including money market and other securities) | | $ | 201.2 | | | $ | 201.8 | |
| Cash and investments in money market securities (including money market and other securities: 2007-$ —; 2006-$0.4) | | $ | 3.5 | | | $ | 2.1 | |
| Total assets | | $ | 5,214.6 | | | $ | 4,887.5 | |
| Total debt outstanding | | $ | 2,289.5 | | | $ | 1,899.1 | |
| Total shareholders’ equity | | $ | 2,771.8 | | | $ | 2,841.2 | |
| Debt to equity ratio | | | 0.83 | | | | 0.67 | |
Asset coverage ratio(1) | | | 221 | % | | | 250 | % |
| |
| (1) | As a business development company, we are generally required to maintain a minimum ratio of 200% of total assets to total borrowings. |
Cash generated from the portfolio includes cash flow from net investment income and net realized gains and principal collections related to investment repayments or sales. Cash flow provided by our operating activities before new investment activity for the years ended December 31, 2007, 2006, and 2005, was as follows:
| | | | | | | | | | | | | | |
| | | 2007 | | | 2006 | | | 2005 | |
| ($ in millions) | | | | | | | | | |
| Net cash provided by (used in) operating activities | | $ | (112.2 | ) | | $ | (597.5 | ) | | $ | 116.0 | |
| Add: portfolio investments funded | | | 1,846.0 | | | | 2,257.8 | | | | 1,668.1 | |
| | | | | | | | | | |
| | Total cash provided by operating activities before new investments | | $ | 1,733.8 | | | $ | 1,660.3 | | | $ | 1,784.1 | |
| | | | | | | | | | |
In addition to the net cash flow provided by our operating activities before funding investments, we have sources of liquidity through our liquidity portfolio and revolving line of credit as discussed below.
At December 31, 2007 and 2006, the value and yield of the securities in the liquidity portfolio were as follows:
| | | | | | | | | | | | | | | | | | |
| | | 2007 | | | 2006 | |
| | | | | | | |
| | | Value | | | Yield | | | Value | | | Yield | |
| ($ in millions) | | | | | | | | | | | | |
| Money market securities | | $ | 201.2 | | | | 4.6 | % | | $ | 161.2 | | | | 5.3 | % |
| Certificate of Deposit | | | — | | | | — | | | | 40.6 | | | | 5.6 | % |
| | | | | | | | | | | | | |
| | Total | | $ | 201.2 | | | | 4.6 | % | | $ | 201.8 | | | | 5.3 | % |
| | | | | | | | | | | | | |
The liquidity portfolio was established to provide a pool of liquid assets within our balance sheet given that our investment portfolio is primarily composed of private, illiquid assets for which there is no readily available market. We assess the amount held in and the composition of the liquidity portfolio throughout the year.
We invest otherwise uninvested cash in U.S. government- or agency-issued or guaranteed securities that are backed by the full faith and credit of the United States, or in high quality, short-term securities. We place our cash with financial institutions and, at times, cash held in checking accounts in financial institutions may be in excess of the Federal Deposit Insurance Corporation insured limit.
We employ an asset-liability management approach that focuses on matching the estimated maturities of our investment portfolio to the estimated maturities of our borrowings. We use our revolving line of credit facility as a means to bridge to long-term financing in the form of debt or equity capital, which may or may not result in temporary differences in the matching of estimated maturities. Availability on the revolving line of credit, net of amounts committed for standby letters of credit issued under the line of credit facility, was $496.7 million on December 31, 2007. We evaluate our interest rate exposure on an
64
ongoing basis. Generally, we seek to fund our primarily fixed-rate debt portfolio and our equity portfolio with fixed-rate debt or equity capital. To the extent deemed necessary, we may hedge variable and short-term interest rate exposure through interest rate swaps or other techniques.
During the years ended December 31, 2007 and 2006, we sold new equity of $171.3 million and $295.8 million, respectively, in public offerings. We did not sell new equity in a public offering during the year ended December 31, 2005. During the year ended December 31, 2005, we issued $7.2 million of our common stock as consideration for investments. In addition, shareholders’ equity increased by $31.5 million, $27.7 million, and $77.5 million through the exercise of stock options, the collection of notes receivable from the sale of common stock, and the issuance of shares through our dividend reinvestment plan for the years ended December 31, 2007, 2006, and 2005, respectively. For the year ended December 31, 2007, shareholders’ equity decreased by $52.8 for the cash portion of the option cancellation payment made in connection with out tender offer. See “— Results of Operations, Stock Option Expense, Options Cancelled in Connection with Tender Offer.” See Note 13, “Financial Highlights” from our Notes to the Consolidated Financial Statements, included in Item 8, for further detail on the change in shareholders’ equity for the period.
We generally target a debt to equity ratio ranging between 0.50:1.00 to 0.70:1.00 because we believe that it is prudent to operate with a larger equity capital base and less leverage. At December 31, 2007, our debt to equity ratio was 0.83:1.00 which is above the higher end of the targeted range at the end of the year due to the timing of funding new investments with borrowings. In February 2008, we completed a public offering of 4.3 million shares of common stock for net proceeds, after the underwriting discount and estimated offering expenses, of $91.8 million. In addition, as discussed above, in January 2008, we agreed to sell a portion of our private finance portfolio for a total transaction value of $169 million to an Allied Capital managed fund named AGILE Fund I, LLC, in which a fund managed by Goldman Sachs is the sole investor other than us. We also agreed to sell certain venture capital and private equity limited partnership investments for approximately $28 million to a fund managed by Goldman Sachs, with such sales expected to be completed by May 2008. The proceeds of the equity offering and the sales to funds managed by Goldman Sachs have been or will be used to reduce outstanding borrowings on our revolving line of credit or for other general corporate purposes.
65
At December 31, 2007 and 2006, we had outstanding debt as follows:
| | | | | | | | | | | | | | | | | | | | | | | | | | | |
| | | 2007 | | | 2006 | |
| | | | | | | |
| | | | | Annual | | | | | Annual | |
| | | Facility | | | Amount | | | Interest | | | Facility | | | Amount | | | Interest | |
| | | Amount | | | Outstanding | | | Cost(1) | | | Amount | | | Outstanding | | | Cost(1) | |
| ($ in millions) | | | | | | | | | | | | | | | | | | |
| Notes payable and debentures: | | | | | | | | | | | | | | | | | | | | | | | | |
| | Privately issued unsecured notes payable | | $ | 1,042.2 | | | $ | 1,042.2 | | | | 6.1 | % | | $ | 1,041.4 | | | $ | 1,041.4 | | | | 6.1 | % |
| | Publicly issued unsecured notes payable | | | 880.0 | | | | 880.0 | | | | 6.7 | % | | | 650.0 | | | | 650.0 | | | | 6.6 | % |
| | | | | | | | | | | | | | | | | | | |
| | | Total notes payable and debentures | | | 1,922.2 | | | | 1,922.2 | | | | 6.4 | % | | | 1,691.4 | | | | 1,691.4 | | | | 6.3 | % |
Revolving line of credit(2) | | | 922.5 | | | | 367.3 | | | | 5.9 | %(3) | | | 922.5 | | | | 207.7 | | | | 6.4 | %(3) |
| | | | | | | | | | | | | | | | | | | |
| | | Total debt | | $ | 2,844.7 | | | $ | 2,289.5 | | | | 6.5 | %(4) | | $ | 2,613.9 | | | $ | 1,899.1 | | | | 6.5 | %(4) |
| | | | | | | | | | | | | | | | | | | |
| |
| (1) | The weighted average annual interest cost is computed as the (a) annual stated interest on the debt plus the annual amortization of commitment fees, other facility fees and the amortization of debt financing costs that are recognized into interest expense over the contractual life of the respective borrowings, divided by (b) debt outstanding on the balance sheet date. |
| |
| (2) | At December 31, 2007, $496.7 million remained unused and available on the revolving line of credit, net of amounts committed for standby letters of credit of $58.5 million issued under the credit facility. |
| |
| (3) | The annual interest cost reflects the interest rate payable for borrowings under the revolving line of credit. In addition to the current interest rate payable, there were annual costs of commitment fees, other facility fees and amortization of debt financing costs of $3.7 million and $3.9 million at December 31, 2007 and 2006, respectively. |
| |
| (4) | The annual interest cost for total debt includes the annual cost of commitment fees and the amortization of debt financing costs on the revolving line of credit and other facility fees regardless of the amount outstanding on the facility as of the balance sheet date. |
Privately Issued Unsecured Notes Payable.We have privately issued unsecured long-term notes to institutional investors, primarily insurance companies. The notes have five- or seven-year maturities and fixed rates of interest. The notes generally require payment of interest only semi-annually, and all principal is due upon maturity. At December 31, 2007, the notes had maturities from May 2008 to May 2013. The notes may be prepaid in whole or in part, together with an interest premium, as stipulated in the note agreements.
We have issued five-year unsecured long-term notes denominated in Euros and Sterling for a total U.S. dollar equivalent of $15.2 million. The notes have fixed interest rates and have substantially the same terms as our other unsecured notes. The Euro notes require annual interest payments and the Sterling notes require semi-annual interest payments until maturity. Simultaneous with issuing the notes, we entered into a cross currency swap with a financial institution which fixed our interest and principal payments in U.S. dollars for the life of the debt.
Publicly Issued Unsecured Notes Payable. At December 31, 2007, we had outstanding publicly issued unsecured notes as follows:
| | | | | | | | | | |
| | | Amount | | | Maturity Date | |
| ($ in millions) | | | | | | |
| 6.625% Notes due 2011 | | $ | 400.0 | | | | July 15, 2011 | |
| 6.000% Notes due 2012 | | | 250.0 | | | | April 1, 2012 | |
| 6.875% Notes due 2047 | | | 230.0 | | | | April 15, 2047 | |
| | | | | | | |
| | Total | | $ | 880.0 | | | | | |
| | | | | | | |
The 6.625% Notes due 2011 and the 6.000% Notes due 2012 require payment of interest onlysemi-annually, and all principal is due upon maturity. We have the option to redeem these notes in whole or in part, together with a redemption premium, as stipulated in the notes.
On March 28, 2007, we completed the issuance of $200.0 million of 6.875% Notes due 2047 for net proceeds of $193.0 million. In April 2007, we issued additional notes, through an over-allotment option, totaling $30.0 million for net proceeds of $29.1 million. Net proceeds are net of underwriting discounts and estimated offering expenses. The notes are listed on the New York Stock Exchange under the trading symbol AFC.
66
The 6.875% Notes due 2047 require payment of interest only quarterly, and all principal is due upon maturity. We may redeem these notes in whole or in part at any time or from time to time on or after April 15, 2012, at par and upon the occurrence of certain tax events as stipulated in the notes.
Revolving Line of Credit.At December 31, 2007 and 2006, we had an unsecured revolving line of credit with a committed amount of $922.5 million that expires on September 30, 2008. At our option, borrowings under the revolving line of credit generally bears interest at a rate equal to (i) LIBOR (for the period we select) plus 1.05% or (ii) the higher of the Federal Funds rate plus 0.50% or the Bank of America N.A. prime rate. The revolving line of credit requires the payment of an annual commitment fee equal to 0.20% of the committed amount (whether used or unused). The revolving line of credit generally requires payments of interest at the end of each LIBOR interest period, but no less frequently than quarterly, on LIBOR based loans and monthly payments of interest on other loans. All principal is due upon maturity.
At December 31, 2007, there was $367.3 million outstanding on our unsecured revolving line of credit. The amount available under the line at December 31, 2007, was $496.7 million, net of amounts committed for standby letters of credit of $58.5 million. Net borrowings under the revolving lines of credit for the years ended December 31, 2007 and 2006, were $159.5 million and $116.0 million, respectively.
Covenant Compliance. We have various financial and operating covenants required by the revolving line of credit and the privately issued unsecured notes payable outstanding at December 31, 2007 and 2006. These covenants require us to maintain certain financial ratios, including asset coverage, debt to equity and interest coverage, and a minimum net worth. These credit facilities provide for customary events of default, including, but not limited to, payment defaults, breach of representations or covenants, cross-defaults, bankruptcy events, failure to pay judgments, attachment of our assets, change of control and the issuance of an order of dissolution. Certain of these events of default are subject to notice and cure periods or materiality thresholds. Our credit facilities limit our ability to declare dividends if we default under certain provisions. As of December 31, 2007 and 2006, we were in compliance with these covenants. On February 29, 2008, we completed amendments to our revolving line of credit and certain privately issued unsecured notes payable primarily to modify the interest coverage covenant. These amendments are effective prospectively from the amendment date.
We have certain financial and operating covenants that are required by the publicly issued unsecured notes payable, including that we will maintain a minimum ratio of 200% of total assets to total borrowings, as required by the Investment Company Act of 1940, as amended, while these notes are outstanding. At December 31, 2007 and 2006, we were in compliance with these covenants.
Contractual Obligations. The following table shows our significant contractual obligations for the repayment of debt and payment of other contractual obligations as of December 31, 2007.
| | | | | | | | | | | | | | | | | | | | | | | | | | | | | | |
| | | | | Payments Due By Year | |
| | | | | | |
| | | | | | | After | |
| | | Total | | | 2008 | | | 2009 | | | 2010 | | | 2011 | | | 2012 | | | 2012 | |
| ($ in millions) | | | | | | | | | | | | | | | | | | | | | |
| Unsecured notes payable | | $ | 1,922.2 | | | $ | 153.0 | | | $ | 269.7 | | | $ | 408.0 | | | $ | 472.5 | | | $ | 339.0 | | | $ | 280.0 | |
Revolving line of credit(1) | | | 367.3 | | | | 367.3 | | | | — | | | | — | | | | — | | | | — | | | | — | |
| Operating leases | | | 20.2 | | | | 4.4 | | | | 4.6 | | | | 4.5 | | | | 1.8 | | | | 1.8 | | | | 3.1 | |
| | | | | | | | | | | | | | | | | | | | | | |
| | Total contractual obligations | | $ | 2,309.7 | | | $ | 524.7 | | | $ | 274.3 | | | $ | 412.5 | | | $ | 474.3 | | | $ | 340.8 | | | $ | 283.1 | |
| | | | | | | | | | | | | | | | | | | | | | |
| |
| (1) | At December 31, 2007, 496.7 million remained unused and available on the revolving line of credit, net of amounts committed for standby letters of credit of $58.5 million issued under the credit facility. |
Off-Balance Sheet Arrangements
In the ordinary course of business, we have issued guarantees and have extended standby letters of credit through financial intermediaries on behalf of certain portfolio companies. We have generally issued guarantees of debt and lease obligations. Under these arrangements, we would be required to make payments to third-party beneficiaries if the portfolio companies were to default on their related payment
67
obligations. The following table shows our guarantees and standby letters of credit that may have the effect of creating, increasing, or accelerating our liabilities as of December 31, 2007.
| | | | | | | | | | | | | | | | | | | | | | | | | | | | | | |
| | | | | Amount of Commitment Expiration Per Year | |
| | | | | | |
| | | | | | | After | |
| | | Total | | | 2008 | | | 2009 | | | 2010 | | 2011 | | | 2012 | | | 2012 | |
| ($ in millions) | | | | | | | | | | | | | | | | | | | | |
| Guarantees | | $ | 270.6 | | | $ | 3.0 | | | $ | 261.2 | | | $ | — | | | $ | 4.4 | | | $ | 0.1 | | | $ | 1.9 | |
Standby letters of credit(1) | | | 58.5 | | | | 58.5 | | | | — | | | | — | | | | — | | | | — | | | | — | |
| | | | | | | | | | | | | | | | | | | | | | |
| | Total commitments(2) | | $ | 329.1 | | | $ | 61.5 | | | $ | 261.2 | | | $ | — | | | $ | 4.4 | | | $ | 0.1 | | | $ | 1.9 | |
| | | | | | | | | | | | | | | | | | | | | | |
| |
| (1) | Standby letters of credit are issued under our revolving line of credit that expires in September 2008. Therefore, unless a standby letter of credit is set to expire at an earlier date, we have assumed that the standby letters of credit will expire contemporaneously with the expiration of our line of credit in September 2008. |
| |
| (2) | Our most significant commitments relate to our investment in Ciena Capital LLC (Ciena), which commitments totaled $276.7 million at December 31, 2007. At December 31, 2007, the principal components of these guarantees included a guarantee of 60% of the outstanding total obligations on Ciena’s revolving line of credit, which matures in March 2009, for a total guaranteed amount of $258.7 million and standby letters of credit issued totaling $18.0 million in connection with term securitizations completed by Ciena. In January 2008, we increased the guaranteed amount on Ciena’s revolving line of credit from 60% to 100% in connection with an amendment completed by Ciena and also issued additional letters of credit totaling $42.5 million related to other term securitizations completed by Ciena. See “— Private Finance, Ciena Capital LLC” above for further discussion. |
In addition, we had outstanding commitments to fund investments totaling $923.6 million at December 31, 2007, including $882.4 million related to private finance investments and $41.2 million related to commercial real estate finance investments. Outstanding commitments related to private finance investments included $524.3 million to the Unitranche Fund LLC, which we believe will be funded over a two to three year period as investments are funded by the Unitranche Fund. See “— Portfolio and Investment Activity — Outstanding Commitments” above. We intend to fund these commitments and prospective investment opportunities with existing cash, through cash flow from operations before new investments, through borrowings under our line of credit or other long-term debt agreements, or through the sale or issuance of new equity capital.
CRITICAL ACCOUNTING POLICIES
The consolidated financial statements are based on the selection and application of critical accounting policies, which require management to make significant estimates and assumptions. Critical accounting policies are those that are both important to the presentation of our financial condition and results of operations and require management’s most difficult, complex, or subjective judgments. Our critical accounting policies are those applicable to the valuation of investments, certain revenue recognition matters and certain tax matters as discussed below.
Valuation of Portfolio Investments.As a business development company, we invest in illiquid securities including debt and equity securities of companies, CLO bonds and preferred shares/income notes, and CDO bonds. Our investments may be subject to certain restrictions on resale and generally have no established trading market. We value substantially all of our investments at fair value as determined in good faith by the Board of Directors in accordance with our valuation policy. We determine fair value to be the amount for which an investment could be exchanged in an orderly disposition over a reasonable period of time between willing parties other than in a forced or liquidation sale. Our valuation policy considers the fact that no ready market exists for substantially all of the securities in which we invest. Our valuation policy is intended to provide a consistent basis for determining the fair value of the portfolio. We will record unrealized depreciation on investments when we believe that an investment has become impaired, including where collection of a loan or realization of an equity security is doubtful, or when the enterprise value of the portfolio company does not currently support the cost of our debt or equity investments. Enterprise value means the entire value of the company to a potential buyer, including the sum of the values of debt and equity securities used to capitalize the enterprise at a point in time. We will
68
record unrealized appreciation if we believe that the underlying portfolio company has appreciated in value and/ or our equity security has also appreciated in value. The value of investments in publicly traded securities is determined using quoted market prices discounted for restrictions on resale, if any.
See “— Results of Operations — Change in Unrealized Appreciation or Depreciation” above for more discussion on portfolio valuation.
Loans and Debt Securities.Our loans and debt securities generally do not trade. We typically exit our loans and debt securities upon the sale or recapitalization of the portfolio company. Therefore, we generally determine the enterprise value of the portfolio company and then allocate that value to the loans and debt securities in order of the legal priority of the contractual obligations, with the remaining value, if any, going to the portfolio company’s outstanding equity securities. For loans and debt securities, fair value generally approximates cost unless the borrower’s enterprise value, overall financial condition or other factors lead to a determination of fair value at a different amount. The value of loan and debt securities may be greater than our cost basis if the amount that would be repaid on the loan or debt security upon the sale or recapitalization of the portfolio company is greater than our cost basis.
When we receive nominal cost warrants or free equity securities (nominal cost equity), we allocate our cost basis in our investment between debt securities and nominal cost equity at the time of origination. At that time, the original issue discount basis of the nominal cost equity is recorded by increasing the cost basis in the equity and decreasing the cost basis in the related debt securities.
Interest income is recorded on an accrual basis to the extent that such amounts are expected to be collected. For loans and debt securities with contractual payment-in-kind interest, which represents contractual interest accrued and added to the loan balance that generally becomes due at maturity, we will not accrue payment-in-kind interest if the portfolio company valuation indicates that the payment-in-kind interest is not collectible. In general, interest is not accrued on loans and debt securities if we have doubt about interest collection or where the enterprise value of the portfolio company may not support further accrual. Loans in workout status do not accrue interest. In addition, interest may not accrue on loans or debt securities to portfolio companies that are more than 50% owned by us depending on such company’s capital requirements. Loan origination fees, original issue discount, and market discount are capitalized and then amortized into interest income using a method that approximates the effective interest method. Upon the prepayment of a loan or debt security, any unamortized loan origination fees are recorded as interest income and any unamortized original issue discount or market discount is recorded as a realized gain.
Equity Securities.Our equity securities in portfolio companies for which there is no liquid public market are valued at fair value based on the enterprise value of the portfolio company, which is determined using various factors, including cash flow from operations of the portfolio company, multiples at which private companies are bought and sold, and other pertinent factors, such as recent offers to purchase a portfolio company, recent transactions involving the purchase or sale of the portfolio company’s equity securities, liquidation events, or other events. The determined equity values are generally discounted when we have a minority ownership position, restrictions on resale, specific concerns about the receptivity of the capital markets to a specific company at a certain time, or other factors.
The value of our equity investments in private debt and equity funds are generally valued at the fund’s net asset value. The value of our equity securities in public companies for which market quotations are readily available is based on the closing public market price on the balance sheet date. Securities that carry certain restrictions on sale are typically valued at a discount from the public market value of the security.
Dividend income on preferred equity securities is recorded as dividend income on an accrual basis to the extent that such amounts are expected to be collected and to the extent that we have the option to receive the dividend in cash. Dividend income on common equity securities is recorded on the record date for private companies or on the ex-dividend date for publicly traded companies.
69
Collateralized Loan Obligations (CLO) and Collateralized Debt Obligations (CDO).CLO bonds and preferred shares/ income notes and CDO bonds (CLO/ CDO Assets) are carried at fair value, which is based on a discounted cash flow model that utilizes prepayment, re-investment and loss assumptions based on historical experience and projected performance, economic factors, the characteristics of the underlying cash flow, and comparable yields for similar bonds and preferred shares/ income notes, when available. We recognize unrealized appreciation or depreciation on our CLO/ CDO Assets as comparable yields in the market change and/ or based on changes in estimated cash flows resulting from changes in prepayment, re-investment or loss assumptions in the underlying collateral pool. We determine the fair value of our CLO/ CDO Assets on an individual security-by-security basis.
We recognize interest income on the preferred shares/income notes using the effective interest method, based on the anticipated yield and the estimated cash flows over the projected life of the investment. Yields are revised when there are changes in actual or estimated cash flows due to changes in prepayments and/or re-investments, credit losses or asset pricing. Changes in estimated yield are recognized as an adjustment to the estimated yield over the remaining life of the preferred shares/income notes from the date the estimated yield was changed. CLO and CDO bonds have stated interest rates. The weighted average yield on the CLO/CDO Assets is calculated as the (a) annual stated interest or the effective interest yield on the accruing bonds or the effective yield on the preferred shares/income notes, divided by (b) CLO/CDO Assets at value. The weighted average yields are computed as of the balance sheet date.
Net Realized Gains or Losses and Net Change in Unrealized Appreciation or Depreciation.Realized gains or losses are measured by the difference between the net proceeds from the repayment or sale and the cost basis of the investment without regard to unrealized appreciation or depreciation previously recognized, and include investments charged off during the year, net of recoveries. Net change in unrealized appreciation or depreciation primarily reflects the change in portfolio investment values during the reporting period, including the reversal of previously recorded unrealized appreciation or depreciation when gains or losses are realized. Net change in unrealized appreciation or depreciation also reflects the change in the value of U.S. Treasury bills and deposits of proceeds from sales of borrowed Treasury securities, if any, and depreciation on accrued interest and dividends receivable and other assets where collection is doubtful.
Fee Income.Fee income includes fees for loan prepayment premiums, guarantees, commitments, and services rendered by us to portfolio companies and other third parties such as diligence, structuring, transaction services, management and consulting services, and other services. Loan prepayment premiums are recognized at the time of prepayment. Guaranty and commitment fees are generally recognized as income over the related period of the guaranty or commitment, respectively. Diligence, structuring, and transaction services fees are generally recognized as income when services are rendered or when the related transactions are completed. Management, consulting and other services fees are generally recognized as income as the services are rendered.
Federal and State Income Taxes and Excise Tax. We intend to comply with the requirements of the Internal Revenue Code that are applicable to regulated investment companies (RIC) and real estate investment trusts (REIT). We and any of our subsidiaries that qualify as a RIC or a REIT intend to distribute or retain through a deemed distribution all of our annual taxable income to shareholders; therefore, we have made no provision for income taxes for these entities.
If we do not distribute at least 98% of our annual taxable income in the year earned, we will generally be required to pay an excise tax equal to 4% of the amount by which 98% of our annual taxable income exceeds the distributions from such taxable income for the year. To the extent that we determine that our estimated current year annual taxable income will be in excess of estimated current year dividend distributions from such taxable income, we accrue excise taxes, if any, on estimated excess taxable income as taxable income is earned using an annual effective excise tax rate. The annual effective excise tax rate is determined by dividing the estimated annual excise tax by the estimated annual taxable income.
70
Income taxes for AC Corp are accounted for under the asset and liability method. Deferred tax assets and liabilities are recognized for the future tax consequences attributable to differences between the financial statement carrying amounts of existing assets and liabilities and their respective tax bases as well as operating loss and tax credit carryforwards. Deferred tax assets and liabilities are measured using enacted tax rates expected to apply to taxable income in the years in which those temporary differences are expected to be recovered or settled.
Recent Accounting Pronouncements. In September 2006, the FASB issued Statement No. 157,Fair Value Measurements. This statement defines fair value, establishes a framework for measuring fair value in generally accepted accounting principles, and expands disclosures about fair value measurements. This statement is effective for financial statements issued for fiscal years beginning after November 15, 2007, and interim periods within those fiscal years. We are currently analyzing the effect of adoption of this statement on our consolidated financial position, including our net asset value and results of operations. We will adopt this statement on a prospective basis beginning in the quarter ending March 31, 2008. Adoption of this statement could have a material effect on our consolidated financial statements, including our net asset value. However, the actual impact on our consolidated financial statements in the period of adoption and subsequent to the period of adoption cannot be determined at this time as it will be influenced by the estimates of fair value for that period and the number and amount of investments we originate, acquire or exit.
Item 7A. Quantitative and Qualitative Disclosure about Market Risk.
Our business activities contain elements of risk. We consider the principal types of market risk to be fluctuations in interest rates. We consider the management of risk essential to conducting our businesses. Accordingly, our risk management systems and procedures are designed to identify and analyze our risks, to set appropriate policies and limits and to continually monitor these risks and limits by means of reliable administrative and information systems and other policies and programs.
Because we borrow money to make investments, our net investment income is dependent upon the difference between the rate at which we borrow funds and the rate at which we invest these funds. As a result, there can be no assurance that a significant change in market interest rates will not have a material adverse effect on our net investment income. In periods of rising interest rates, our cost of funds would increase, which would reduce our net investment income. We use a combination of long-term and short-term borrowings and equity capital to finance our investing activities. We utilize our revolving line of credit as a means to bridge to long-term financing. Our long-term fixed-rate investments are financed primarily with long-term fixed-rate debt and equity. We may use interest rate risk management techniques in an effort to limit our exposure to interest rate fluctuations. Such techniques may include various interest rate hedging activities to the extent permitted by the 1940 Act. We have analyzed the potential impact of changes in interest rates on interest income net of interest expense.
Assuming that the balance sheet as of December 31, 2007, were to remain constant and no actions were taken to alter the existing interest rate sensitivity, a hypothetical immediate 1% change in interest rates would have affected net income by approximately 1% over a one year horizon. Although management believes that this measure is indicative of our sensitivity to interest rate changes, it does not adjust for potential changes in credit quality, size and composition of the assets on the balance sheet and other business developments that could affect net increase in net assets resulting from operations, or net income. Accordingly, no assurances can be given that actual results would not differ materially from the potential outcome simulated by this estimate.
In addition, we may have risk regarding portfolio valuation. See “Item 1. Business — Portfolio Valuation” above.
71
Item 8. Financial Statements and Supplementary Data.
| | | | | |
| | | Page | |
| | | | |
| Management’s Report on Internal Control over Financial Reporting | | | 73 | |
| Reports of Independent Registered Public Accounting Firm | | | 74 | |
| Consolidated Balance Sheet — December 31, 2007 and 2006 | | | 77 | |
| Consolidated Statement of Operations — For the Years Ended December 31, 2007, 2006, and 2005 | | | 78 | |
| Consolidated Statement of Changes in Net Assets — For the Years Ended December 31, 2007, 2006, and 2005 | | | 79 | |
| Consolidated Statement of Cash Flows — For the Years Ended December 31, 2007, 2006, and 2005 | | | 80 | |
| Consolidated Statement of Investments — December 31, 2007 | | | 81 | |
| Consolidated Statement of Investments — December 31, 2006 | | | 92 | |
| Notes to Consolidated Financial Statements | | | 103 | |
72
Management’s Report on Internal Control over Financial Reporting
The management of Allied Capital Corporation and subsidiaries (the Company) is responsible for establishing and maintaining adequate internal control over financial reporting, as such term is defined in Exchange Act Rules 13a-15(f). Under the supervision and with the participation of management, including the Chief Executive Officer and Chief Financial Officer, the Company conducted an evaluation of the effectiveness of the Company’s internal control over financial reporting based on the criteria established inInternal Control — Integrated Framework issued by the Committee of Sponsoring Organizations of the Treadway Commission (COSO). Based on the Company’s evaluation under the framework inInternal Control — Integrated Framework, management concluded that the Company’s internal control over financial reporting was effective as of December 31, 2007. KPMG LLP, our independent registered public accounting firm, has issued an attestation report on the effectiveness of the Company’s internal control over financial reporting as of December 31, 2007, as stated in its report which is included herein.
73
Report of Independent Registered Public Accounting Firm
The Board of Directors and Shareholders
Allied Capital Corporation:
We have audited Allied Capital Corporation and subsidiaries’ (the Company) internal control over financial reporting as of December 31, 2007, based on criteria established inInternal Control — Integrated Framework issued by the Committee of Sponsoring Organizations of the Treadway Commission (COSO). Allied Capital Corporation’s management is responsible for maintaining effective internal control over financial reporting and for its assessment of the effectiveness of internal control over financial reporting, included in the accompanying Management’s Report on Internal Control over Financial Reporting. Our responsibility is to express an opinion on the Company’s internal control over financial reporting based on our audit.
We conducted our audit in accordance with the standards of the Public Company Accounting Oversight Board (United States). Those standards require that we plan and perform the audit to obtain reasonable assurance about whether effective internal control over financial reporting was maintained in all material respects. Our audit included obtaining an understanding of internal control over financial reporting, assessing the risk that a material weakness exists, and testing and evaluating the design and operating effectiveness of internal control based on the assessed risk. Our audit also included performing such other procedures as we considered necessary in the circumstances. We believe that our audit provides a reasonable basis for our opinion.
A company’s internal control over financial reporting is a process designed to provide reasonable assurance regarding the reliability of financial reporting and the preparation of financial statements for external purposes in accordance with generally accepted accounting principles. A company’s internal control over financial reporting includes those policies and procedures that (1) pertain to the maintenance of records that, in reasonable detail, accurately and fairly reflect the transactions and dispositions of the assets of the company; (2) provide reasonable assurance that transactions are recorded as necessary to permit preparation of financial statements in accordance with generally accepted accounting principles, and that receipts and expenditures of the company are being made only in accordance with authorizations of management and directors of the company; and (3) provide reasonable assurance regarding prevention or timely detection of unauthorized acquisition, use, or disposition of the company’s assets that could have a material effect on the financial statements.
Because of its inherent limitations, internal control over financial reporting may not prevent or detect misstatements. Also, projections of any evaluation of effectiveness to future periods are subject to the risk that controls may become inadequate because of changes in conditions, or that the degree of compliance with the policies or procedures may deteriorate.
In our opinion, Allied Capital Corporation maintained, in all material respects, effective internal control over financial reporting as of December 31, 2007, based on criteria established inInternal Control — Integrated Framework issued by the Committee of Sponsoring Organizations of the Treadway Commission (COSO).
74
We also have audited, in accordance with the standards of the Public Company Accounting Oversight Board (United States), the consolidated balance sheet of Allied Capital Corporation and subsidiaries as of December 31, 2007 and 2006, including the consolidated statement of investments as of December 31, 2007 and 2006, and the related consolidated statements of operations, changes in net assets and cash flows, and the financial highlights (included in Note 13), for each of the years in the three-year period ended December 31, 2007, and our report dated February 28, 2008, expressed an unqualified opinion on those consolidated financial statements.
Washington, D.C.
February 28, 2008
75
Report of Independent Registered Public Accounting Firm
The Board of Directors and Shareholders
Allied Capital Corporation:
We have audited the accompanying consolidated balance sheet of Allied Capital Corporation and subsidiaries (the Company) as of December 31, 2007 and 2006, including the consolidated statements of investments as of December 31, 2007 and 2006, and the related consolidated statements of operations, changes in net assets and cash flows, and the financial highlights (included in Note 13), for each of the years in the three-year period ended December 31, 2007. These consolidated financial statements and financial highlights are the responsibility of the Company’s management. Our responsibility is to express an opinion on these consolidated financial statements and financial highlights based on our audits.
We conducted our audits in accordance with the standards of the Public Company Accounting Oversight Board (United States). Those standards require that we plan and perform the audit to obtain reasonable assurance about whether the financial statements and financial highlights are free of material misstatement. An audit includes examining, on a test basis, evidence supporting the amounts and disclosures in the financial statements. Our procedures included physical inspection or confirmation of securities owned as of December 31, 2007 and 2006. An audit also includes assessing the accounting principles used and significant estimates made by management, as well as evaluating the overall financial statement presentation. We believe that our audits provide a reasonable basis for our opinion.
In our opinion, the consolidated financial statements and financial highlights referred to above present fairly, in all material respects, the financial position of Allied Capital Corporation and subsidiaries as of December 31, 2007 and 2006, and the results of their operations, their cash flows, changes in their net assets, and financial highlights for each of the years in the three-year period ended December 31, 2007, in conformity with U.S. generally accepted accounting principles.
As discussed in Note 2 to the consolidated financial statements, effective January 1, 2006, the Company adopted the provisions of Statement of Financial Accounting Standards No. 123 (Revised 2004),Share Based Payment.
We also have audited, in accordance with the standards of the Public Company Accounting Oversight Board (United States), Allied Capital Corporation’s internal control over financial reporting as of December 31, 2007, based on criteria established inInternal Control — Integrated Frameworkissued by the Committee of Sponsoring Organizations of the Treadway Commission (COSO), and our report dated February 28, 2008, expressed an unqualified opinion on the effectiveness of the Company’s internal control over financial reporting.
Washington, D.C.
February 28, 2008
76
ALLIED CAPITAL CORPORATION AND SUBSIDIARIES
CONSOLIDATED BALANCE SHEET
| | | | | | | | | | | | |
| | | December 31, | |
| | | | |
| | | 2007 | | | 2006 | |
| (in thousands, except per share amounts) | | | | | | |
| ASSETS |
| Portfolio at value: | | | | | | | | |
| | Private finance | | | | | | | | |
| | | Companies more than 25% owned (cost: 2007-$1,622,094; 2006-$1,578,822) | | $ | 1,279,080 | | | $ | 1,490,180 | |
| | | Companies 5% to 25% owned (cost: 2007-$426,908;
2006-$438,560) | | | 389,509 | | | | 449,813 | |
| | | Companies less than 5% owned (cost: 2007-$2,994,880; 2006-$2,479,981) | | | 2,990,732 | | | | 2,437,908 | |
| | | | | | | |
| | | | Total private finance (cost: 2007-$5,043,882; 2006-$4,497,363) | | | 4,659,321 | | | | 4,377,901 | |
| | Commercial real estate finance (cost: 2007-$96,942; 2006-$103,546) | | | 121,200 | | | | 118,183 | |
| | | | | | | |
| | | | Total portfolio at value (cost: 2007-$5,140,824; 2006-$4,600,909) | | | 4,780,521 | | | | 4,496,084 | |
| Investments in money market and other securities | | | 201,222 | | | | 202,210 | |
| Accrued interest and dividends receivable | | | 71,429 | | | | 64,566 | |
| Other assets | | | 157,864 | | | | 122,958 | |
| Cash | | | 3,540 | | | | 1,687 | |
| | | | | | | |
| | | | Total assets | | $ | 5,214,576 | | | $ | 4,887,505 | |
| | | | | | | |
| LIABILITIES AND SHAREHOLDERS’ EQUITY |
| Liabilities: | | | | | | | | |
| | Notes payable and debentures (maturing within one year: 2007-$153,000; 2006-$—) | | $ | 1,922,220 | | | $ | 1,691,394 | |
| | Revolving line of credit | | | 367,250 | | | | 207,750 | |
| | Accounts payable and other liabilities | | | 153,259 | | | | 147,117 | |
| | | | | | | |
| | | | Total liabilities | | | 2,442,729 | | | | 2,046,261 | |
| | | | | | | |
| Commitments and contingencies | | | | | | | | |
| Shareholders’ equity: | | | | | | | | |
| | Common stock, $0.0001 par value, 400,000 shares authorized; 158,002 and 148,575 shares issued and outstanding at December 31, 2007 and 2006, respectively | | | 16 | | | | 15 | |
| | Additional paid-in capital | | | 2,657,939 | | | | 2,493,335 | |
| | Common stock held in deferred compensation trust | | | (39,942 | ) | | | (28,335 | ) |
| | Notes receivable from sale of common stock | | | (2,692 | ) | | | (2,850 | ) |
| | Net unrealized appreciation (depreciation) | | | (379,327 | ) | | | (123,084 | ) |
| | Undistributed earnings | | | 535,853 | | | | 502,163 | |
| | | | | | | |
| | | | Total shareholders’ equity | | | 2,771,847 | | | | 2,841,244 | |
| | | | | | | |
| | | | Total liabilities and shareholders’ equity | | $ | 5,214,576 | | | $ | 4,887,505 | |
| | | | | | | |
| Net asset value per common share | | $ | 17.54 | | | $ | 19.12 | |
| | | | | | | |
The accompanying notes are an integral part of these consolidated financial statements.
77
ALLIED CAPITAL CORPORATION AND SUBSIDIARIES
CONSOLIDATED STATEMENT OF OPERATIONS
| | | | | | | | | | | | | | | | |
| | | For the Years Ended December 31, | |
| | | | |
| | | 2007 | | | 2006 | | | 2005 | |
| (in thousands, except per share amounts) | | | | | | | | | |
| Interest and Related Portfolio Income: | | | | | | | | | | | | |
| | Interest and dividends | | | | | | | | | | | | |
| | | Companies more than 25% owned | | $ | 105,634 | | | $ | 102,636 | | | $ | 122,450 | |
| | | Companies 5% to 25% owned | | | 41,577 | | | | 39,754 | | | | 21,924 | |
| | | Companies less than 5% owned | | | 270,365 | | | | 244,037 | | | | 172,779 | |
| | | | | | | | | | |
| | | | Total interest and dividends | | | 417,576 | | | | 386,427 | | | | 317,153 | |
| | Fees and other income | | | | | | | | | | | | |
| | | Companies more than 25% owned | | | 18,505 | | | | 29,606 | | | | 27,365 | |
| | | Companies 5% to 25% owned | | | 810 | | | | 4,447 | | | | 124 | |
| | | Companies less than 5% owned | | | 24,814 | | | | 32,078 | | | | 29,510 | |
| | | | | | | | | | |
| | | | Total fees and other income | | | 44,129 | | | | 66,131 | | | | 56,999 | |
| | | | | | | | | | |
| | | | Total interest and related portfolio income | | | 461,705 | | | | 452,558 | | | | 374,152 | |
| | | | | | | | | | |
| Expenses: | | | | | | | | | | | | |
| | Interest | | | 132,080 | | | | 100,600 | | | | 77,352 | |
| | Employee | | | 89,155 | | | | 92,902 | | | | 78,300 | |
| | Employee stock options | | | 35,233 | | | | 15,599 | | | | — | |
| | Administrative | | | 50,580 | | | | 39,005 | | | | 69,713 | |
| | | | | | | | | | |
| | | | Total operating expenses | | | 307,048 | | | | 248,106 | | | | 225,365 | |
| | | | | | | | | | |
| Net investment income before income taxes | | | 154,657 | | | | 204,452 | | | | 148,787 | |
| Income tax expense, including excise tax | | | 13,624 | | | | 15,221 | | | | 11,561 | |
| | | | | | | | | | |
| Net investment income | | | 141,033 | | | | 189,231 | | | | 137,226 | |
| | | | | | | | | | |
| Net Realized and Unrealized Gains (Losses): | | | | | | | | | | | | |
| | Net realized gains (losses) | | | | | | | | | | | | |
| | | Companies more than 25% owned | | | 226,437 | | | | 513,314 | | | | 33,237 | |
| | | Companies 5% to 25% owned | | | (10,046 | ) | | | 4,467 | | | | 5,285 | |
| | | Companies less than 5% owned | | | 52,122 | | | | 15,520 | | | | 234,974 | |
| | | | | | | | | | |
| | | | Total net realized gains | | | 268,513 | | | | 533,301 | | | | 273,496 | |
| | Net change in unrealized appreciation or depreciation | | | (256,243 | ) | | | (477,409 | ) | | | 462,092 | |
| | | | | | | | | | |
| | | | Total net gains | | | 12,270 | | | | 55,892 | | | | 735,588 | |
| | | | | | | | | | |
| Net increase in net assets resulting from operations | | $ | 153,303 | | | $ | 245,123 | | | $ | 872,814 | |
| | | | | | | | | | |
| Basic earnings per common share | | $ | 1.00 | | | $ | 1.72 | | | $ | 6.48 | |
| | | | | | | | | | |
| Diluted earnings per common share | | $ | 0.99 | | | $ | 1.68 | | | $ | 6.36 | |
| | | | | | | | | | |
| Weighted average common shares outstanding — basic | | | 152,876 | | | | 142,405 | | | | 134,700 | |
| | | | | | | | | | |
| Weighted average common shares outstanding — diluted | | | 154,687 | | | | 145,599 | | | | 137,274 | |
| | | | | | | | | | |
The accompanying notes are an integral part of these consolidated financial statements.
78
ALLIED CAPITAL CORPORATION AND SUBSIDIARIES
CONSOLIDATED STATEMENT OF CHANGES IN NET ASSETS
| | | | | | | | | | | | | | | |
| | | For the Years Ended December 31, | |
| | | | |
| | | 2007 | | | 2006 | | | 2005 | |
| (in thousands, except per share amounts) | | | | | | | | | |
| Operations: | | | | | | | | | | | | |
| | Net investment income | | $ | 141,033 | | | $ | 189,231 | | | $ | 137,226 | |
| | Net realized gains | | | 268,513 | | | | 533,301 | | | | 273,496 | |
| | Net change in unrealized appreciation or depreciation | | | (256,243 | ) | | | (477,409 | ) | | | 462,092 | |
| | | | | | | | | | |
| | | Net increase in net assets resulting from operations | | | 153,303 | | | | 245,123 | | | | 872,814 | |
| | | | | | | | | | |
| Shareholder distributions: | | | | | | | | | | | | |
| | Common stock dividends | | | (407,317 | ) | | | (354,892 | ) | | | (314,509 | ) |
| | Preferred stock dividends | | | (10 | ) | | | (10 | ) | | | (10 | ) |
| | | | | | | | | | |
| | | Net decrease in net assets resulting from shareholder distributions | | | (407,327 | ) | | | (354,902 | ) | | | (314,519 | ) |
| | | | | | | | | | |
| Capital share transactions: | | | | | | | | | | | | |
| | Sale of common stock | | | 171,282 | | | | 295,769 | | | | — | |
| | Issuance of common stock for portfolio investments | | | — | | | | — | | | | 7,200 | |
| | Issuance of common stock in lieu of cash distributions | | | 17,095 | | | | 14,996 | | | | 9,257 | |
| | Issuance of common stock upon the exercise of stock options | | | 14,251 | | | | 11,734 | | | | 66,688 | |
| | Cash portion of option cancellation payment | | | (52,833 | ) | | | — | | | | — | |
| | Stock option expense | | | 35,810 | | | | 15,835 | | | | — | |
| | Net decrease in notes receivable from sale of common stock | | | 158 | | | | 1,018 | | | | 1,602 | |
| | Purchase of common stock held in deferred compensation trust | | | (12,444 | ) | | | (9,855 | ) | | | (7,968 | ) |
| | Distribution of common stock held in deferred compensation trust | | | 837 | | | | 980 | | | | 2,011 | |
| | Other | | | 10,471 | | | | — | | | | 3,683 | |
| | | | | | | | | | |
| | | Net increase in net assets resulting from capital share transactions | | | 184,627 | | | | 330,477 | | | | 82,473 | |
| | | | | | | | | | |
| | | Total net increase (decrease) in net assets | | | (69,397 | ) | | | 220,698 | | | | 640,768 | |
| Net assets at beginning of year | | | 2,841,244 | | | | 2,620,546 | | | | 1,979,778 | |
| | | | | | | | | | |
| Net assets at end of year | | $ | 2,771,847 | | | $ | 2,841,244 | | | $ | 2,620,546 | |
| | | | | | | | | | |
| Net asset value per common share | | $ | 17.54 | | | $ | 19.12 | | | $ | 19.17 | |
| | | | | | | | | | |
| Common shares outstanding at end of year | | | 158,002 | | | | 148,575 | | | | 136,697 | |
| | | | | | | | | | |
The accompanying notes are an integral part of these consolidated financial statements.
79
ALLIED CAPITAL CORPORATION AND SUBSIDIARIES
CONSOLIDATED STATEMENT OF CASH FLOWS
| | | | | | | | | | | | | | | | |
| | | For the Years Ended December 31, | |
| | | | |
| | | 2007 | | | 2006 | | | 2005 | |
| (in thousands) | | | | | | | | | |
| Cash flows from operating activities: | | | | | | | | | | | | |
| | Net increase in net assets resulting from operations | | $ | 153,303 | | | $ | 245,123 | | | $ | 872,814 | |
| | Adjustments: | | | | | | | | | | | | |
| | | Portfolio investments | | | (1,845,973 | ) | | | (2,257,828 | ) | | | (1,668,113 | ) |
| | | Principal collections related to investment repayments or sales | | | 1,211,550 | | | | 1,055,347 | | | | 1,503,388 | |
| | | Change in accrued or reinvested interest and dividends | | | (23,913 | ) | | | (8,159 | ) | | | (6,594 | ) |
| | | Net collection (amortization) of discounts and fees | | | (4,101 | ) | | | 1,713 | | | | (1,564 | ) |
| | | Redemption of (investments in) U.S. Treasury bills | | | — | | | | 100,000 | | | | (100,000 | ) |
| | | Redemption of (investments in) money market securities | | | 988 | | | | (80,243 | ) | | | (121,967 | ) |
| | | Stock option expense | | | 35,810 | | | | 15,835 | | | | — | |
| | | Changes in other assets and liabilities | | | (12,466 | ) | | | 36,418 | | | | 33,023 | |
| | | Depreciation and amortization | | | 2,064 | | | | 1,800 | | | | 1,820 | |
| | | Realized gains from the receipt of notes and other consideration from sale of investments, net of collections | | | (17,706 | ) | | | (209,049 | ) | | | (4,293 | ) |
| | | Realized losses | | | 131,997 | | | | 24,169 | | | | 69,565 | |
| | | Net change in unrealized (appreciation) or depreciation | | | 256,243 | | | | 477,409 | | | | (462,092 | ) |
| | | | | | | | | | |
| | | | Net cash provided by (used in) operating activities | | | (112,204 | ) | | | (597,465 | ) | | | 115,987 | |
| | | | | | | | | | |
| Cash flows from financing activities: | | | | | | | | | | | | |
| | Sale of common stock | | | 171,282 | | | | 295,769 | | | | — | |
| | Sale of common stock upon the exercise of stock options | | | 14,251 | | | | 11,734 | | | | 66,688 | |
| | Collections of notes receivable from sale of common stock | | | 158 | | | | 1,018 | | | | 1,602 | |
| | Borrowings under notes payable | | | 230,000 | | | | 700,000 | | | | 350,000 | |
| | Repayments on notes payable and debentures | | | — | | | | (203,500 | ) | | | (219,700 | ) |
| | Net borrowings under (repayments on) revolving line of credit | | | 159,500 | | | | 116,000 | | | | (20,250 | ) |
| | Cash portion of option cancellation payment | | | (52,833 | ) | | | — | | | | — | |
| | Purchase of common stock held in deferred compensation trust | | | (12,444 | ) | | | (9,855 | ) | | | (7,968 | ) |
| | Other financing activities | | | 1,798 | | | | (6,795 | ) | | | (8,333 | ) |
| | Common stock dividends and distributions paid | | | (397,645 | ) | | | (336,572 | ) | | | (303,813 | ) |
| | Preferred stock dividends paid | | | (10 | ) | | | (10 | ) | | | (10 | ) |
| | | | | | | | | | |
| | | | Net cash provided by (used in) financing activities | | | 114,057 | | | | 567,789 | | | | (141,784 | ) |
| | | | | | | | | | |
| Net increase (decrease) in cash | | | 1,853 | | | | (29,676 | ) | | | (25,797 | ) |
| Cash at beginning of year | | | 1,687 | | | | 31,363 | | | | 57,160 | |
| | | | | | | | | | |
| Cash at end of year | | $ | 3,540 | | | $ | 1,687 | | | $ | 31,363 | |
| | | | | | | | | | |
The accompanying notes are an integral part of these consolidated financial statements.
80
ALLIED CAPITAL CORPORATION AND SUBSIDIARIES
CONSOLIDATED STATEMENT OF INVESTMENTS
| | | | | | | | | | | | | | | | |
| | | | | December 31, 2007 | |
| Private Finance | | | | | |
| Portfolio Company | | | | |
| (in thousands, except number of shares) | | Investment(1)(2) | | Principal | | | Cost | | | Value | |
| | | | | | | | | | | | |
| Companies More Than 25% Owned | | | | | | | | | | | | |
| |
| Alaris Consulting, LLC | | Senior Loan (16.5%, Due 12/05 – 12/07)(6) | | $ | 27,055 | | | $ | 26,987 | | | $ | — | |
| | (Business Services) | | Equity Interests | | | | | | | 5,189 | | | | — | |
| | | Guaranty ($1,100) | | | | | | | | | | | | |
| |
| AllBridge Financial, LLC | | Equity Interests | | | | | | | 7,800 | | | | 7,800 | |
| | (Financial Services) | | Standby Letter of Credit ($30,000) | | | | | | | | | | | | |
| |
Allied Capital Senior Debt Fund, L.P.(5) | | Equity Interests (See Note 3) | | | | | | | 31,800 | | | | 32,811 | |
| | (Private Debt Fund) | | | | | | | | | | | | | | |
| |
Avborne, Inc.(7) | | Preferred Stock (12,500 shares) | | | | | | | 611 | | | | 1,633 | |
| | (Business Services) | | Common Stock (27,500 shares) | | | | | | | — | | | | — | |
| |
Avborne Heavy Maintenance, Inc.(7) | | Preferred Stock (1,568 shares) | | | | | | | 2,401 | | | | 2,557 | |
| | (Business Services) | | Common Stock (2,750 shares) | | | | | | | — | | | | 370 | |
| | | Guaranty ($2,401) | | | | | | | | | | | | |
| |
| Aviation Properties Corporation | | Common Stock (100 shares) | | | | | | | 65 | | | | — | |
| | (Business Services) | | Standby Letters of Credit ($1,000) | | | | | | | | | | | | |
| |
| Border Foods, Inc. | | Preferred Stock (100,000 shares) | | | | | | | 12,721 | | | | 4,648 | |
| | (Consumer Products) | | Common Stock (148,838 shares) | | | | | | | 3,847 | | | | — | |
| |
Calder Capital Partners, LLC(5) | | Senior Loan (9.4%, Due 5/09)(6) | | | 2,907 | | | | 2,907 | | | | 3,035 | |
| | (Financial Services) | | Equity Interests | | | | | | | 2,396 | | | | 3,559 | |
| |
| Callidus Capital Corporation | | Subordinated Debt (18.0%, Due 10/08) | | | 6,871 | | | | 6,871 | | | | 6,871 | |
| | (Financial Services) | | Common Stock (100 shares) | | | | | | | 2,067 | | | | 44,587 | |
| |
Ciena Capital LLC
(f/k/a Business Loan | | Class A Equity Interests(25.0% — See Note 3)(6) | | | 99,044 | | | | 99,044 | | | | 68,609 | |
| | Express, LLC) | | Class B Equity Interests | | | | | | | 119,436 | | | | — | |
| | (Financial Services) | | Class C Equity Interests | | | | | | | 109,301 | | | | — | |
| | | Guaranty ($258,707 — See Note 3) | | | | | | | | | | | | |
| | | Standby Letters of Credit ($18,000 —
See Note 3) | | | | | | | | | | | | |
| |
| CitiPostal Inc. | | Senior Loan (8.4%, Due 12/13) | | | 692 | | | | 679 | | | | 679 | |
| | (Business Services) | | Unitranche Debt (12.0%, Due 12/13) | | | 50,852 | | | | 50,597 | | | | 50,597 | |
| | | | Subordinated Debt (16.0%, Due 12/15) | | | 8,049 | | | | 8,049 | | | | 8,049 | |
| | | | Common Stock (37,024 shares) | | | | | | | 12,726 | | | | 12,726 | |
| |
| Coverall North America, Inc. | | Unitranche Debt (12.0%, Due 7/11) | | | 35,054 | | | | 34,923 | | | | 34,923 | |
| | (Business Services) | | Subordinated Debt (15.0%, Due 7/11) | | | 6,000 | | | | 5,979 | | | | 5,979 | |
| | | | Common Stock (884,880 shares) | | | | | | | 16,648 | | | | 27,597 | |
| |
| CR Holding, Inc. | | Subordinated Debt (16.6%, Due 2/13) | | | 40,956 | | | | 40,812 | | | | 40,812 | |
| | (Consumer Products) | | Common Stock (37,200,551 shares) | | | | | | | 33,321 | | | | 40,934 | |
| |
| Direct Capital Corporation | | Subordinated Debt (16.0%, Due 3/13) | | | 39,184 | | | | 39,030 | | | | 39,030 | |
| | (Financial Services) | | Common Stock (2,097,234 shares) | | | | | | | 19,250 | | | | 6,906 | |
| |
| Financial Pacific Company | | Subordinated Debt (17.4%, Due 2/12 – 8/12) | | | 73,031 | | | | 72,850 | | | | 72,850 | |
| | (Financial Services) | | Preferred Stock (10,964 shares) | | | | | | | 10,276 | | | | 19,330 | |
| | | | Common Stock (14,735 shares) | | | | | | | 14,819 | | | | 38,544 | |
| |
| ForeSite Towers, LLC | | Equity Interest | | | | | | | — | | | | 878 | |
| | (Tower Leasing) | | | | | | | | | | | | | | |
| |
| | | |
(1) | | Interest rates represent the weighted average annual stated interest rate on loans and debt securities, which are presented by nature of indebtedness for a single issuer. The maturity dates represent the earliest and the latest maturity dates. |
(2) | | Common stock, preferred stock, warrants, options, and equity interests are generally non-income producing and restricted. |
(3) | | Public company. |
(4) | | Non-U.S. company or principal place of business outside the U.S. |
(5) | | Non-registered investment company. |
(6) | | Loan or debt security is on non-accrual status and therefore is considered non-income producing. |
(7) | | Avborne, Inc. and Avborne Heavy Maintenance, Inc. are affiliated companies. |
The accompanying notes are an integral part of these consolidated financial statements.
81
ALLIED CAPITAL CORPORATION AND SUBSIDIARIES
CONSOLIDATED STATEMENT OF INVESTMENTS — (Continued)
| | | | | | | | | | | | | | | | |
| | | | | December 31, 2007 | |
| Private Finance | | | | | |
| Portfolio Company | | | | |
| (in thousands, except number of shares) | | Investment(1)(2) | | Principal | | | Cost | | | Value | |
| | | | | | | | | | | | |
| Global Communications, LLC | | Senior Loan (10.0%, Due 9/02)(6) | | $ | 1,822 | | | $ | 1,822 | | | $ | 1,822 | |
| | (Business Services) | | | | | | | | | | | | | | |
| |
| Hot Stuff Foods, LLC | | Senior Loan (8.4%, Due 2/11-2/12) | | | 50,940 | | | | 50,752 | | | | 50,752 | |
| | (Consumer Products) | | Subordinated Debt (12.1%, Due 8/12) | | | 30,000 | | | | 29,907 | | | | 29,907 | |
| | | | Subordinated Debt (15.4%, Due 2/13)(6) | | | 52,373 | | | | 52,150 | | | | 1,337 | |
| | | | Common Stock (1,147,453 shares) | | | | | | | 56,187 | | | | — | |
| |
| Huddle House, Inc. | | Subordinated Debt (15.0%, Due 12/12) | | | 59,857 | | | | 59,618 | | | | 59,618 | |
| | (Retail) | | Common Stock (415,328 shares) | | | | | | | 41,533 | | | | 44,154 | |
| |
| Impact Innovations Group, LLC | | Equity Interests in Affiliate | | | | | | | — | | | | 320 | |
| | (Business Services) | | | | | | | | | | | | | | |
| |
| Insight Pharmaceuticals Corporation | | Subordinated Debt (15.0%, Due 9/12) | | | 44,257 | | | | 44,136 | | | | 45,041 | |
| | (Consumer Products) | | Subordinated Debt (19.0%, Due 9/12)(6) | | | 16,181 | | | | 16,130 | | | | 16,796 | |
| | | Preferred Stock (25,000 shares) | | | | | | | 25,000 | | | | 1,462 | |
| | | Common Stock (620,000 shares) | | | | | | | 6,325 | | | | — | |
| |
| Jakel, Inc. | | Subordinated Debt (15.5%, Due 3/08)(6) | | | 1,563 | | | | 1,563 | | | | 1,563 | |
| | (Industrial Products) | | | | | | | | | | | | | | |
| |
| Legacy Partners Group, Inc. | | Senior Loan (14.0%, Due 5/09)(6) | | | 3,843 | | | | 3,843 | | | | 3,843 | |
| | (Financial Services) | | Equity Interests | | | | | | | 4,261 | | | | 1,332 | |
| |
Litterer Beteiligungs-GmbH(4) | | Subordinated Debt (8.0%, Due 12/08) | | | 772 | | | | 772 | | | | 772 | |
| | (Business Services) | | Equity Interest | | | | | | | 1,809 | | | | 700 | |
| |
| MVL Group, Inc. | | Senior Loan (12.0%, Due 6/09 – 7/09) | | | 30,674 | | | | 30,639 | | | | 30,639 | |
| | (Business Services) | | Subordinated Debt (14.5%, Due 6/09 – 7/09) | | | 40,191 | | | | 39,943 | | | | 39,943 | |
| | | Common Stock (648,661 shares) | | | | | | | 643 | | | | 4,949 | |
| |
| Old Orchard Brands, LLC | | Subordinated Debt (18.0%, Due 7/14) | | | 19,632 | | | | 19,544 | | | | 19,544 | |
| | (Consumer Products) | | Equity Interests | | | | | | | 18,767 | | | | 25,419 | |
| |
| Penn Detroit Diesel Allison, LLC | | Subordinated Debt (15.5%, Due 8/13) | | | 39,331 | | | | 39,180 | | | | 39,180 | |
| | (Business Services) | | Equity Interests | | | | | | | 21,128 | | | | 37,965 | |
| |
| Powell Plant Farms, Inc. | | Senior Loan (15.0%, Due 12/07)(6) | | | 1,350 | | | | 1,350 | | | | 1,534 | |
| | (Consumer Products) | | | | | | | | | | | | | | |
| |
| | | |
(1) | | Interest rates represent the weighted average annual stated interest rate on loans and debt securities, which are presented by nature of indebtedness for a single issuer. The maturity dates represent the earliest and the latest maturity dates. |
(2) | | Common stock, preferred stock, warrants, options, and equity interests are generally non-income producing and restricted. |
(3) | | Public company. |
(4) | | Non-U.S. company or principal place of business outside the U.S. |
(5) | | Non-registered investment company. |
(6) | | Loan or debt security is on non-accrual status and therefore is considered non-income producing. |
The accompanying notes are an integral part of these consolidated financial statements.
82
ALLIED CAPITAL CORPORATION AND SUBSIDIARIES
CONSOLIDATED STATEMENT OF INVESTMENTS — (Continued)
| | | | | | | | | | | | | | | | |
| | | | | December 31, 2007 | |
| Private Finance | | | | | |
| Portfolio Company | | | | | | |
| (in thousands, except number of shares) | | Investment(1)(2) | | Principal | | | Cost | | | Value | |
| | | | | | | | | | | | |
| Service Champ, Inc. | | Subordinated Debt (15.5%, Due 4/12) | | $ | 28,443 | | | $ | 28,351 | | | $ | 28,351 | |
| | (Business Services) | | Common Stock (63,888 shares) | | | | | | | 13,662 | | | | 26,292 | |
| |
| Staffing Partners Holding | | | | | | | | | | | | | | |
| | Company, Inc. | | Subordinated Debt (13.5%, Due 1/07)(6) | | | 509 | | | | 509 | | | | 223 | |
| | (Business Services) | | | | | | | | | | | | | | |
| |
| Startec Equity, LLC | | Equity Interests | | | | | | | 190 | | | | 430 | |
| | (Telecommunications) | | | | | | | | | | | | | | |
| |
| Sweet Traditions, Inc. | | Senior Loan (13.0%, Due 9/08 – 8/11)(6) | | | 39,692 | | | | 36,052 | | | | 35,229 | |
| | (Retail) | | Preferred Stock (961 shares) | | | | | | | 950 | | | | — | |
| | | Common Stock (10,000 shares) | | | | | | | 50 | | | | — | |
| |
Triview Investments, Inc.(8) | | Senior Loan (10.0%, Due 12/07) | | | 433 | | | | 433 | | | | 433 | |
| | (Broadcasting & Cable/Business | | Subordinated Debt (12.9%, Due 1/10 – 6/17) | | | 43,157 | | | | 42,977 | | | | 42,977 | |
| | Services/Consumer Products) | | Subordinated Debt (12.5%, Due 11/07 – 3/08)(6) | | | 1,400 | | | | 1,400 | | | | 1,583 | |
| | | | Common Stock (202 shares) | | | | | | | 120,638 | | | | 83,453 | |
| | | Guaranty ($900) | | | | | | | | | | | | |
| | | Standby Letter of Credit ($200) | | | | | | | | | | | | |
| |
| Unitranche Fund LLC | | Subordinated Certificates | | | | | | | 744 | | | | 744 | |
| | (Private Debt Fund) | | Equity Interests | | | | | | | 1 | | | | 1 | |
| |
| Worldwide Express Operations, LLC | | Subordinated Debt (14.0%, Due 2/14) | | | 2,845 | | | | 2,670 | | | | 2,670 | |
| | (Business Services) | | Equity Interests | | | | | | | 12,900 | | | | 21,516 | |
| | | | Warrants | | | | | | | 163 | | | | 272 | |
| |
| Total companies more than 25% owned | | | | | | $ | 1,622,094 | | | $ | 1,279,080 | |
| |
| Companies 5% to 25% Owned | | | | |
| |
10thStreet, LLC | | Subordinated Debt (13.0%, Due 12/14) | | $ | 20,774 | | | $ | 20,645 | | | $ | 20,645 | |
| | (Business Services) | | Equity Interests | | | | | | | 446 | | | | 1,100 | |
| |
| Advantage Sales & Marketing, Inc. | | Subordinated Debt (12.0%, Due 3/14) | | | 155,432 | | | | 154,854 | | | | 154,854 | |
| | (Business Services) | | Equity Interests | | | | | | | — | | | | 10,973 | |
| |
| Air Medical Group Holdings LLC | | Senior Loan (7.8%, Due 3/11) | | | 3,030 | | | | 2,980 | | | | 2,980 | |
| | (Healthcare Services) | | Equity Interests | | | | | | | 3,470 | | | | 10,800 | |
| |
| Alpine ESP Holdings, Inc. | | Preferred Stock (622 shares) | | | | | | | 622 | | | | 749 | |
| | (Business Services) | | Common Stock (13,513 shares) | | | | | | | 14 | | | | 262 | |
| |
| Amerex Group, LLC | | Subordinated Debt (12.0%, Due 1/13) | | | 8,400 | | | | 8,400 | | | | 8,400 | |
| | (Consumer Products) | | Equity Interests | | | | | | | 3,509 | | | | 13,713 | |
| |
| BB&T Capital Partners/Windsor | | | | | | | | | | | | | | |
| | Mezzanine Fund, LLC(5) | | Equity Interests | | | | | | | 11,739 | | | | 11,467 | |
| | (Private Equity Fund) | | | | | | | | | | | | | | |
| |
| Becker Underwood, Inc. | | Subordinated Debt (14.5%, Due 8/12) | | | 24,865 | | | | 24,798 | | | | 24,798 | |
| | (Industrial Products) | | Common Stock(5,073 shares) | | | | | | | 5,813 | | | | 4,190 | |
| |
| BI Incorporated | | Subordinated Debt (13.5%, Due 2/14) | | | 30,615 | | | | 30,499 | | | | 30,499 | |
| | (Business Services) | | Common Stock (40,000 shares) | | | | | | | 4,000 | | | | 7,382 | |
| |
| | | |
(1) | | Interest rates represent the weighted average annual stated interest rate on loans and debt securities, which are presented by nature of indebtedness for a single issuer. The maturity dates represent the earliest and the latest maturity dates. |
(2) | | Common stock, preferred stock, warrants, options, and equity interests are generally non-income producing and restricted. |
(3) | | Public company. |
(4) | | Non-U.S. company or principal place of business outside the U.S. |
(5) | | Non-registered investment company. |
(6) | | Loan or debt security is on non-accrual status and therefore is considered non-income producing. |
(8) | | Triview Investments, Inc. had a cost basis of $165.4 million and holds investments in Longview Cable & Data, LLC (Broadcasting & Cable) with a value of $7.0 million, Triax Holdings, LLC (Consumer Products) with a value of $62.0 million, and Crescent Hotels & Resorts, LLC and affiliates (Business Services) with a value of $59.4 million, for a total value of $128.4 million. |
The accompanying notes are an integral part of these consolidated financial statements.
83
ALLIED CAPITAL CORPORATION AND SUBSIDIARIES
CONSOLIDATED STATEMENT OF INVESTMENTS — (Continued)
| | | | | | | | | | | | | | | | |
| | | | | December 31, 2007 | |
| Private Finance | | | | | |
| Portfolio Company | | | | |
| (in thousands, except number of shares) | | Investment(1)(2) | | Principal | | | Cost | | | Value | |
| | | | | | | | | | | | |
| Creative Group, Inc. | | Subordinated Debt (14.0%, Due 9/13)(6) | | $ | 15,000 | | | $ | 13,686 | | | $ | 6,197 | |
| | (Business Services) | | Common Stock (20,000 shares) | | | | | | | — | | | | — | |
| | | | Warrant | | | | | | | 1,387 | | | | — | |
| |
| Drew Foam Companies, Inc. | | Preferred Stock (722 shares) | | | | | | | 722 | | | | 396 | |
| | (Business Services) | | Common Stock (7,287 shares) | | | | | | | 7 | | | | — | |
| |
| MedBridge Healthcare, LLC | | Senior Loan (8.0%, Due 8/09)(6) | | | 7,164 | | | | 7,164 | | | | 7,164 | |
| | (Healthcare Services) | | Subordinated Debt (10.0%, Due 8/14)(6) | | | 5,184 | | | | 5,184 | | | | 2,406 | |
| | | Convertible Subordinated Debt (2.0%,
Due 8/14)(6) | | | 2,970 | | | | 984 | | | | — | |
| | | Equity Interests | | | | | | | 1,416 | | | | — | |
| |
| MHF Logistical Solutions, Inc. | | Subordinated Debt (11.5%, Due 6/12)(6) | | | 33,600 | | | | 33,448 | | | | 9,280 | |
| | (Business Services) | | Subordinated Debt (18.0%, Due 6/13)(6) | | | 11,211 | | | | 11,154 | | | | — | |
| | | Common Stock (20,934 shares)(12) | | | | | | | 20,942 | | | | — | |
| | | Warrants(12) | | | | | | | — | | | | — | |
| |
| Multi-Ad Services, Inc. | | Unitranche Debt (11.3%, Due 11/11) | | | 19,800 | | | | 19,704 | | | | 19,704 | |
| | (Business Services) | | Equity Interests | | | | | | | 2,000 | | | | 940 | |
| |
| Progressive International | | | | | | | | | | | | | | |
| | Corporation | | Subordinated Debt (16.0%, Due 12/09) | | | 1,557 | | | | 1,545 | | | | 1,545 | |
| | (Consumer Products) | | Preferred Stock (500 shares) | | | | | | | 500 | | | | 1,038 | |
| | | Common Stock (197 shares) | | | | | | | 13 | | | | 4,900 | |
| | | Warrants | | | | | | | — | | | | — | |
| |
| Regency Healthcare Group, LLC | | Unitranche Debt (11.1%, Due 6/12) | | | 12,000 | | | | 11,941 | | | | 11,941 | |
| | (Healthcare Services) | | Equity Interests | | | | | | | 1,500 | | | | 1,681 | |
| |
SGT India Private Limited(4) | | Common Stock (150,596 shares) | | | | | | | 4,098 | | | | 3,075 | |
| | (Business Services) | | | | | | | | | | | | | | |
| |
| Soteria Imaging Services, LLC | | Subordinated Debt (12.0%, Due 11/10) | | | 14,500 | | | | 13,744 | | | | 13,744 | |
| | (Healthcare Services) | | Equity Interests | | | | | | | 2,170 | | | | 2,686 | |
| |
| Universal Environmental Services, LLC | | Equity Interests | | | | | | | 1,810 | | | | — | |
| | (Business Services) | | | | | | | | | | | | | | |
| |
| Total companies 5% to 25% owned | | | | | | $ | 426,908 | | | $ | 389,509 | |
| |
Companies Less Than 5% Owned | | | | | | | | | | | | | | |
| |
| 3SI Security Systems, Inc. | | Subordinated Debt (14.5%, Due 8/13) | | $ | 27,937 | | | $ | 27,837 | | | $ | 27,837 | |
| | (Consumer Products) | | | | | | | | | | | | | | |
| |
| AgData, L.P. | | Senior Loan (10.3%, Due 7/12) | | | 843 | | | | 815 | | | | 815 | |
| | (Consumer Services) | | | | | | | | | | | | | | |
| |
| Axium Healthcare Pharmacy, Inc. | | Senior Loan (12.5%, Due 12/12) | | | 2,600 | | | | 2,567 | | | | 2,567 | |
| | (Healthcare Services) | | Unitranche Debt (12.5%, Due 12/12) | | | 8,500 | | | | 8,463 | | | | 8,463 | |
| | | | Common Stock (26,500 shares) | | | | | | | 2,650 | | | | 1,097 | |
| |
Baird Capital Partners IV Limited Partnership(5)
(Private Equity Fund) | |
Limited Partnership Interest | | | | | | | 2,234 | | | | 2,114 | |
| |
| | | |
(1) | | Interest rates represent the weighted average annual stated interest rate on loans and debt securities, which are presented by nature of indebtedness for a single issuer. The maturity dates represent the earliest and the latest maturity dates. |
(2) | | Common stock, preferred stock, warrants, options, and equity interests are generally non-income producing and restricted. |
(3) | | Public company. |
(4) | | Non-U.S. company or principal place of business outside the U.S. |
(5) | | Non-registered investment company. |
(6) | | Loan or debt security is on non-accrual status and therefore is considered non-income producing. |
(12) | | Common stock is non-voting. In addition to non-voting stock ownership, the Company has an option to acquire a majority of the voting securities of the portfolio company at fair market value. |
The accompanying notes are an integral part of these consolidated financial statements.
84
ALLIED CAPITAL CORPORATION AND SUBSIDIARIES
CONSOLIDATED STATEMENT OF INVESTMENTS — (Continued)
| | | | | | | | | | | | | | | | |
| | | | | December 31, 2007 | |
| Private Finance | | | | | |
| Portfolio Company | | | | |
| (in thousands, except number of shares) | | Investment(1)(2) | | Principal | | | Cost | | | Value | |
| | | | | | | | | | | | |
| BenefitMall, Inc. | | Subordinated Debt (14.9%, Due 10/13-10/14) | | $ | 82,167 | | | $ | 81,930 | | | $ | 81,930 | |
| | (Business Services) | | Common Stock (45,528,000 shares)(12) | | | | | | | 45,528 | | | | 82,404 | |
| | | | Warrants(12) | | | | | | | — | | | | — | |
| | | | Standby Letters of Credit ($3,961) | | | | | | | | | | | | |
| |
| Broadcast Electronics, Inc. | | Senior Loan (9.0%, Due 7/12)(6) | | | 4,913 | | | | 4,884 | | | | 3,273 | |
| | (Business Services) | | | | | | | | | | | | | | |
| |
| Bushnell, Inc. | | Subordinated Debt (11.3%, Due 2/14) | | | 41,325 | | | | 39,821 | | | | 39,821 | |
| | (Consumer Products) | | | | | | | | | | | | | | |
| |
| Callidus Debt Partners | | | | | | | | | | | | | | |
| | CDO Fund I, Ltd.(4)(10) | | Class C Notes (12.9%, Due 12/13) | | | 18,800 | | | | 18,929 | | | | 18,988 | |
| | (CDO/CLO) | | Class D Notes (17.0%, Due 12/13) | | | 9,400 | | | | 9,465 | | | | 9,494 | |
| |
| Callidus Debt Partners | | | | | | | | | | | | | | |
| | CLO Fund III, Ltd.(4)(10) | | Preferred Shares (23,600,000 shares, | | | | | | | | | | | | |
| | (CDO/CLO) | | 12.9%)(11) | | | | | | | 21,783 | | | | 19,999 | |
| |
| Callidus Debt Partners | | | | | | | | | | | | | | |
| | CLO Fund IV, Ltd.(4)(10) | | Income Notes (14.8%)(11) | | | | | | | 12,298 | | | | 11,290 | |
| | (CDO/CLO) | | | | | | | | | | | | | | |
| |
| Callidus Debt Partners | | | | | | | | | | | | | | |
| | CLO Fund V, Ltd.(4)(10) | | Income Notes (20.3%)(11) | | | | | | | 13,977 | | | | 14,658 | |
| | (CDO/CLO) | | | | | | | | | | | | | | |
| |
| Callidus Debt Partners | | | | | | | | | | | | | | |
| | CLO Fund VI, Ltd.(4)(10) | | Class D Notes (11.3%) Due 10/21) | | | 5,000 | | | | 4,329 | | | | 4,329 | |
| | (CDO/CLO) | | Income Notes (19.3%)(11) | | | | | | | 26,985 | | | | 26,985 | |
| |
Callidus Debt Partners(4)(10) | | | | | | | | | | | | | | |
| | CLO Fund VII, Ltd. | | Income Notes (16.6%)(11) | | | | | | | 22,113 | | | | 22,113 | |
| | (CDO/CLO) | | | | | | | | | | | | | | |
| |
Callidus MAPS CLO Fund I LLC(10) | | Class E Notes (10.4%, Due 12/17) | | | 17,000 | | | | 17,000 | | | | 16,119 | |
| | (CDO/CLO) | | Income Notes (5.6%)(11) | | | | | | | 49,252 | | | | 36,085 | |
| |
Callidus MAPS CLO Fund II, Ltd.(4)(10) | | Income Notes (14.7%)(11) | | | | | | | 18,753 | | | | 18,753 | |
| | (CDO/CLO) | | | | | | | | | | | | | | |
| |
Camden Partners Strategic Fund II, L.P.(5) | | Limited Partnership Interest | | | | | | | 997 | | | | 1,350 | |
| | (Private Equity Fund) | | | | | | | | | | | | | | |
| |
| Carlisle Wide Plank Floors, Inc. | | Senior Loan (9.8%, Due 6/11) | | | 500 | | | | 497 | | | | 497 | |
| | (Consumer Products) | | Unitranche Debt (10.0%, Due 6/11) | | | 3,161 | | | | 3,129 | | | | 3,129 | |
| | | Preferred Stock (400,000 Shares) | | | | | | | 400 | | | | 507 | |
| |
Catterton Partners V, L.P.(5) | | Limited Partnership Interest | | | | | | | 3,624 | | | | 2,952 | |
| | (Private Equity Fund) | | | | | | | | | | | | | | |
| |
Catterton Partners VI, L.P.(5) | | Limited Partnership Interest | | | | | | | 2,259 | | | | 2,103 | |
| | (Private Equity Fund) | | | | | | | | | | | | | | |
| |
Centre Capital Investors IV, L.P.(5) | | Limited Partnership Interest | | | | | | | 2,215 | | | | 2,276 | |
| | (Private Equity Fund) | | | | | | | | | | | | | | |
| |
Centre Capital Investors V, L.P.(5) | | Limited Partnership Interest | | | | | | | 628 | | | | 628 | |
| | (Private Equity Fund) | | | | | | | | | | | | | | |
| |
| | | |
(1) | | Interest rates represent the weighted average annual stated interest rate on loans and debt securities, which are presented by nature of indebtedness for a single issuer. The maturity dates represent the earliest and the latest maturity dates. |
(2) | | Common stock, preferred stock, warrants, options, and equity interests are generally non-income producing and restricted. |
(3) | | Public company. |
(4) | | Non-U.S. company or principal place of business outside the U.S. |
(5) | | Non-registered investment company. |
(6) | | Loan or debt security is on non-accrual status and therefore is considered non-income producing. |
(10) | | The fund is managed by Callidus Capital, a portfolio company of Allied Capital. |
(11) | | Represents the effective interest yield earned on the cost basis of these preferred equity investments and income notes. The yield is included in interest income from companies less than 5% owned in the consolidated statement of operations. |
(12) | | Common stock is non-voting. In addition to non-voting stock ownership, the Company has an option to acquire a majority of the voting securities of the portfolio company at fair market value. |
The accompanying notes are an integral part of these consolidated financial statements.
85
ALLIED CAPITAL CORPORATION AND SUBSIDIARIES
CONSOLIDATED STATEMENT OF INVESTMENTS — (Continued)
| | | | | | | | | | | | | | | | |
| | | | | December 31, 2007 | |
| Private Finance | | | | | |
| Portfolio Company | | | | |
| (in thousands, except number of shares) | | Investment(1)(2) | | Principal | | | Cost | | | Value | |
| | | | | | | | | | | | |
| CK Franchising, Inc. | | Senior Loan (8.7%, Due 7/12) | | $ | 9,000 | | | $ | 8,911 | | | $ | 8,911 | |
| | (Consumer Services) | | Subordinated Debt (12.3%, Due 7/12 – 7/17) | | | 21,000 | | | | 20,908 | | | | 20,908 | |
| | | | Preferred Stock (1,486,004 shares) | | | | | | | 1,486 | | | | 1,586 | |
| | | | Common Stock (8,793,408 shares) | | | | | | | 8,793 | | | | 8,654 | |
| |
| Commercial Credit Group, Inc. | | Subordinated Debt (14.8%, Due 2/11) | | | 12,000 | | | | 12,023 | | | | 12,023 | |
| | (Financial Services) | | Preferred Stock (74,978 shares) | | | | | | | 18,018 | | | | 19,421 | |
| | | | Warrants | | | | | | | — | | | | — | |
| |
| Community Education Centers, Inc. | | Subordinated Debt (13.5%, Due 11/13) | | | 35,011 | | | | 34,936 | | | | 34,936 | |
| | (Education Services) | | | | | | | | | | | | | | |
| |
| Component Hardware Group, Inc. | | Subordinated Debt (13.5%, Due 1/13) | | | 18,432 | | | | 18,363 | | | | 18,363 | |
| | (Industrial Products) | | | | | | | | | | | | | | |
| |
| Cook Inlet Alternative Risk, LLC | | Unitranche Debt (10.8%, Due 4/13) | | | 95,000 | | | | 94,530 | | | | 94,530 | |
| | (Business Services) | | Equity Interests | | | | | | | 640 | | | | 1,696 | |
| |
Cortec Group Fund IV, L.P.(5) | | Limited Partnership Interest | | | | | | | 3,383 | | | | 2,922 | |
| | (Private Equity) | | | | | | | | | | | | | | |
| |
| Diversified Mercury | | | | | | | | | | | | | | |
| Communications, LLC | | Senior Loan (8.5%, Due 3/13) | | | 233 | | | | 217 | | | | 217 | |
| | (Business Services) | | | | | | | | | | | | | | |
| |
| Digital VideoStream, LLC | | Unitranche Debt (11.0%, Due 2/12) | | | 17,213 | | | | 17,128 | | | | 17,128 | |
| | (Business Services) | | Convertible Subordinated Debt | | | | | | | | | | | | |
| | | | (10.0%, Due 2/16) | | | 4,118 | | | | 4,103 | | | | 5,397 | |
| |
| DirectBuy Holdings, Inc. | | Subordinated Debt (14.5%, Due 5/13) | | | 75,000 | | | | 74,631 | | | | 74,631 | |
| | (Financial Services) | | Equity Interests | | | | | | | 8,000 | | | | 8,000 | |
| |
| Distant Lands Trading Co. | | Senior Loan (10.3%, Due 11/11) | | | 10,000 | | | | 9,966 | | | | 9,966 | |
| | (Consumer Products) | | Unitranche Debt (11.0%, Due 11/11) | | | 42,375 | | | | 42,226 | | | | 42,226 | |
| | | | Common Stock (4,000 shares) | | | | | | | 4,000 | | | | 2,645 | |
| |
| Driven Brands, Inc. | | Senior Loan (8.7%, Due 6/11) | | | 37,070 | | | | 36,951 | | | | 36,951 | |
| | d/b/a Meineke and Econo Lube | | Subordinated Debt (12.1%, Due 6/12 – 6/13) | | | 83,000 | | | | 82,754 | | | | 82,754 | |
| | (Consumer Services) | | Common Stock (11,675,331 shares)(12) | | | | | | | 29,455 | | | | 15,977 | |
| | | | Warrants(12) | | | | | | | — | | | | — | |
| |
| Dryden XVIII Leveraged | | | | | | | | | | | | | | |
| | Loan 2007 Limited(4) | | Subordinated Debt (9.7%, Due 10/19) | | | 9,000 | | | | 7,406 | | | | 7,406 | |
| | (CDO/CLO) | | Income Notes (14.2%)(11) | | | | | | | 21,940 | | | | 21,940 | |
| |
Dynamic India Fund IV(4)(5) | | Equity Interests | | | | | | | 6,050 | | | | 6,215 | |
| | (Private Equity Fund) | | | | | | | | | | | | | | |
| |
| EarthColor, Inc. | | Subordinated Debt (15.0%, Due 11/13) | | | 127,000 | | | | 126,463 | | | | 126,463 | |
| | (Business Services) | | Common Stock (73,540 shares)(12) | | | | | | | 73,540 | | | | 62,675 | |
| | | Warrants(12) | | | | | | | — | | | | — | |
| |
eCentury Capital Partners, L.P.(5) | | Limited Partnership Interest | | | | | | | 6,899 | | | | 2,176 | |
| | (Private Equity Fund) | | | | | | | | | | | | | | |
| |
| eInstruction Corporation | | Subordinated Debt (13.5%, Due 7/14-1/15) | | | 47,000 | | | | 46,765 | | | | 46,765 | |
| | (Education Services) | | Common Stock (2,406 shares) | | | | | | | 2,500 | | | | 2,500 | |
| |
| | | | | |
| | (1) | | | Interest rates represent the weighted average annual stated interest rate on loans and debt securities, which are presented by nature of indebtedness for a single issuer. The maturity dates represent the earliest and the latest maturity dates. |
| | (2) | | | Common stock, preferred stock, warrants, options, and equity interests are generally non-income producing and restricted. |
| | (3) | | | Public company. |
| | (4) | | | Non-U.S. company or principal place of business outside the U.S. |
| | (5) | | | Non-registered investment company. |
| | (6) | | | Loan or debt security is on non-accrual status and therefore is considered non-income producing. |
| | (11) | | | Represents the effective interest yield earned on the cost basis of these preferred equity investments and income notes. The yield is included in interest income from companies less than 5% owned in the consolidated statement of operations. |
| | (12) | | | Common stock is non-voting. In addition to non-voting stock ownership, the Company has an option to acquire a majority of the voting securities of the portfolio company at fair market value. |
The accompanying notes are an integral part of these consolidated financial statements.
86
ALLIED CAPITAL CORPORATION AND SUBSIDIARIES
CONSOLIDATED STATEMENT OF INVESTMENTS — (Continued)
| | | | | | | | | | | | | | | | |
| | | | | December 31, 2007 | |
| Private Finance | | | | | |
| Portfolio Company | | | | |
| (in thousands, except number of shares) | | Investment(1)(2) | | Principal | | | Cost | | | Value | |
| | | | | | | | | | | | |
| Farley’s & Sathers Candy Company, Inc. | | Subordinated Debt (13.7%, Due 3/11) | | $ | 18,000 | | | $ | 17,932 | | | $ | 17,932 | |
| | (Consumer Products) | | | | | | | | | | | | | | |
| |
| FCP-BHI Holdings, LLC | | Subordinated Debt (12.8%, Due 9/13) | | | 24,000 | | | | 23,887 | | | | 23,887 | |
| | d/b/a Bojangles’ | | Equity Interests | | | | | | | 1,000 | | | | 998 | |
| | (Consumer Products) | | | | | | | | | | | | | | |
| |
Fidus Mezzanine Capital, L.P.(5) | | Limited Partnership Interest | | | | | | | 6,357 | | | | 6,357 | |
| | (Private Equity Fund) | | | | | | | | | | | | | | |
| |
| Frozen Specialties, Inc. | | Warrants | | | | | | | 435 | | | | 229 | |
| | (Consumer Products) | | | | | | | | | | | | | | |
| |
Garden Ridge Corporation
(Retail) | | Subordinated Debt (7.0%, Due 5/12)(6) | | | 20,500 | | | | 20,500 | | | | 20,500 | |
| |
| Geotrace Technologies, Inc. | | Subordinated Debt (10.0%, Due 6/09) | | | 6,772 | | | | 6,616 | | | | 6,616 | |
| | (Energy Services) | | Warrants | | | | | | | 2,350 | | | | 2,993 | |
| |
| Gilchrist & Soames, Inc. | | Senior Loan (9.0%, Due 10/13) | | | 20,000 | | | | 19,954 | | | | 19,954 | |
| | (Consumer Products) | | Subordinated Debt (13.4%, Due 10/13) | | | 25,800 | | | | 25,676 | | | | 25,676 | |
| |
Grotech Partners, VI, L.P.(5) | | Limited Partnership Interest | | | | | | | 8,808 | | | | 8,252 | |
| | (Private Equity Fund) | | | | | | | | | | | | | | |
| |
| Havco Wood Products LLC | | Senior Loan (9.7%, Due 8/11) | | | 600 | | | | 585 | | | | 585 | |
| | (Industrial Products) | | Unitranche Debt (11.5%, Due 8/11) | | | 5,100 | | | | 4,248 | | | | 4,248 | |
| | | | Equity Interests | | | | | | | 1,055 | | | | 3,192 | |
| |
| Haven Eldercare of New England, LLC | | Subordinated Debt (12.0%, Due 8/09)(6) | | | 1,927 | | | | 1,927 | | | | — | |
| | (Healthcare Services) | | | | | | | | | | | | | | |
| |
| Higginbotham Insurance Agency, Inc. | | Senior Loan (7.7%, Due 8/12) | | | 15,033 | | | | 14,942 | | | | 14,942 | |
| | (Business Services) | | Subordinated Debt (13.5%,
Due 8/13 – 8/14) | | | 46,356 | | | | 46,136 | | | | 46,136 | |
| | | | Common Stock (23,926 shares)(12) | | | | | | | 23,926 | | | | 23,868 | |
| | | | Warrant(12) | | | | | | | — | | | | — | |
| |
The Hillman Companies, Inc.(3) | | Subordinated Debt (10.0%, Due 9/11) | | | 44,580 | | | | 44,458 | | | | 44,458 | |
| | (Consumer Products) | | | | | | | | | | | | | | |
| |
| The Homax Group, Inc. | | Senior Loan (8.7%, Due 10/12) | | | 10,969 | | | | 10,969 | | | | 10,969 | |
| | (Consumer Products) | | Subordinated Debt (12.0%, Due 4/14) | | | 14,000 | | | | 13,244 | | | | 13,244 | |
| | | | Preferred Stock (89 shares) | | | | | | | 89 | | | | 13 | |
| | | | Common Stock (28 shares) | | | | | | | 6 | | | | — | |
| | | | Warrants | | | | | | | 1,106 | | | | 194 | |
| |
| Ideal Snacks Corporation | | Senior Loan (9.0%, Due 6/10) | | | 288 | | | | 288 | | | | 288 | |
| | (Consumer Products) | | | | | | | | | | | | | | |
| |
| Integrity Interactive Corporation | | Unitranche Debt (10.5%, Due 2/12) | | | 12,193 | | | | 12,095 | | | | 12,095 | |
| | (Business Services) | | | | | | | | | | | | | | |
| |
| International Fiber Corporation | | Subordinated Debt (14.0%, Due 6/12) | | | 24,572 | | | | 24,476 | | | | 24,476 | |
| | (Industrial Products) | | Preferred Stock (25,000 shares) | | | | | | | 2,500 | | | | 2,194 | |
| |
| | | | | |
| | (1) | | | Interest rates represent the weighted average annual stated interest rate on loans and debt securities, which are presented by nature of indebtedness for a single issuer. The maturity dates represent the earliest and the latest maturity dates. |
| | (2) | | | Common stock, preferred stock, warrants, options, and equity interests are generally non-income producing and restricted. |
| | (3) | | | Public company. |
| | (4) | | | Non-U.S. company or principal place of business outside the U.S. |
| | (5) | | | Non-registered investment company. |
| | (6) | | | Loan or debt security is on non-accrual status and therefore is considered non-income producing. |
| | (12) | | | Common stock is non-voting. In addition to non-voting stock ownership, the Company has an option to acquire a majority of the voting securities of the portfolio company at fair market value. |
The accompanying notes are an integral part of these consolidated financial statements.
87
ALLIED CAPITAL CORPORATION AND SUBSIDIARIES
CONSOLIDATED STATEMENT OF INVESTMENTS — (Continued)
| | | | | | | | | | | | | | | | |
| | | | | December 31, 2007 | |
| Private Finance | | | | | |
| Portfolio Company | | | | |
| (in thousands, except number of shares) | | Investment(1)(2) | | Principal | | | Cost | | | Value | |
| | | | | | | | | | | | |
| Jones Stephens Corporation | | Senior Loan (8.8%, Due 9/12) | | $ | 5,537 | | | $ | 5,525 | | | $ | 5,525 | |
| | (Consumer Products) | | | | | | | | | | | | | | |
| |
Knightsbridge CLO 2007-1 Limited(4) | | Subordinated Debt (14.1%, Due 1/22) | | | 22,000 | | | | 22,000 | | | | 22,000 | |
| | (CDO/CLO) | | Income Notes (15.2%)(11) | | | | | | | 31,211 | | | | 31,211 | |
| |
Kodiak Fund LP(5) | | Equity Interests | | | | | | | 9,423 | | | | 2,853 | |
| | (Private Equity Fund) | | | | | | | | | | | | | | |
| |
| Line-X, Inc. | | Senior Loan (12.0%, Due 8/11) | | | 900 | | | | 885 | | | | 885 | |
| | (Consumer Products) | | Unitranche Debt (12.0% Due 8/11) | | | 48,198 | | | | 48,039 | | | | 42,784 | |
| | | | Standby Letter of Credit ($1,500) | | | | | | | | | | | | |
| |
MedAssets, Inc.(3) | | Common Stock (224,817 shares) | | | | | | | 2,049 | | | | 6,652 | |
| | (Business Services) | | | | | | | | | | | | | | |
| |
Mid-Atlantic Venture Fund IV, L.P.(5) | | Limited Partnership Interest | | | | | | | 6,975 | | | | 1,791 | |
| | (Private Equity Fund) | | | | | | | | | | | | | | |
| |
Milestone AV Technologies, Inc.
(f/k/a CSAV, Inc.) | | Subordinated Debt (11.3%, Due 6/13) | | | 37,500 | | | | 37,500 | | | | 36,750 | |
| | (Business Services) | | | | | | | | | | | | | | |
| |
| NetShape Technologies, Inc. | | Senior Loan (8.6%, Due 2/13) | | | 5,802 | | | | 5,773 | | | | 5,773 | |
| | (Industrial Products) | | | | | | | | | | | | | | |
| |
| Network Hardware Resale, Inc. | | Unitranche Debt (10.5%, Due 12/11) | | | 20,512 | | | | 20,614 | | | | 20,614 | |
| | (Business Services) | | Convertible Subordinated Debt (9.8%, Due 12/15) | | | 13,242 | | | | 13,302 | | | | 15,586 | |
| |
| Norwesco, Inc. | | Subordinated Debt (12.7%, Due 1/12 – 7/12) | | | 82,924 | | | | 82,674 | | | | 82,674 | |
| | (Industrial Products) | | Common Stock (559,603 shares)(12) | | | | | | | 38,313 | | | | 117,831 | |
| | | Warrants(12) | | | | | | | — | | | | — | |
| |
Novak Biddle Venture Partners III, L.P.(5) | | Limited Partnership Interest | | | | | | | 1,910 | | | | 1,256 | |
| | (Private Equity Fund) | | | | | | | | | | | | | | |
| |
| Oahu Waste Services, Inc. | | Stock Appreciation Rights | | | | | | | 239 | | | | 998 | |
| | (Business Services) | | | | | | | | | | | | | | |
| |
Odyssey Investment Partners Fund III, LP(5) | | Limited Partnership Interest | | | | | | | 2,276 | | | | 2,567 | |
| | (Private Equity Fund) | | | | | | | | | | | | | | |
| |
Pangaea CLO 2007-1 Ltd.(4) | | Subordinated Debt (10.2%, Due 10/21) | | | 15,000 | | | | 11,570 | | | | 11,570 | |
| | (CDO/CLO) | | | | | | | | | | | | | | |
| |
| Passport Health | | | | | | | | | | | | | | |
| | Communications, Inc. | | Preferred Stock (651,381 shares) | | | | | | | 2,000 | | | | 2,433 | |
| | (Healthcare Services) | | Common Stock (19,680 shares) | | | | | | | 48 | | | | 7 | |
| |
| PC Helps Support, LLC | | Senior Loan (8.9%, Due 12/13) | | | 20,000 | | | | 20,000 | | | | 20,000 | |
| | (Business Services) | | Subordinated Debt (13.3%, Due 12/13) | | | 30,895 | | | | 30,743 | | | | 30,743 | |
| |
| Pendum, Inc. | | Subordinated Debt (17.0%, Due 1/11)(6) | | | 34,028 | | | | 34,028 | | | | — | |
| | (Business Services) | | Preferred Stock (82,715 shares) | | | | | | | — | | | | — | |
| | | | Warrants | | | | | | | — | | | | — | |
| |
| Performant Financial Corporation | | Common Stock (478,816 shares) | | | | | | | 734 | | | | — | |
| | (Business Services) | | | | | | | | | | | | | | |
| |
| | | | | |
| | (1) | | | Interest rates represent the weighted average annual stated interest rate on loans and debt securities, which are presented by nature of indebtedness for a single issuer. The maturity dates represent the earliest and the latest maturity dates. |
| | (2) | | | Common stock, preferred stock, warrants, options, and equity interests are generally non-income producing and restricted. |
| | (3) | | | Public company. |
| | (4) | | | Non-U.S. company or principal place of business outside the U.S. |
| | (5) | | | Non-registered investment company. |
| | (6) | | | Loan or debt security is on non-accrual status and therefore is considered non-income producing. |
| | (11) | | | Represents the effective interest yield earned on the cost basis of these preferred equity investments and income notes. The yield is included in interest income from companies less than 5% owned in the consolidated statement of operations. |
| | (12) | | | Common stock is non-voting. In addition to non-voting stock ownership, the Company has an option to acquire a majority of the voting securities of the portfolio company at fair market value. |
The accompanying notes are an integral part of these consolidated financial statements.
88
ALLIED CAPITAL CORPORATION AND SUBSIDIARIES
CONSOLIDATED STATEMENT OF INVESTMENTS — (Continued)
| | | | | | | | | | | | | | | | |
| | | | | December 31, 2007 | |
| Private Finance | | | | | |
| Portfolio Company | | | | |
| (in thousands, except number of shares) | | Investment(1)(2) | | Principal | | | Cost | | | Value | |
| | | | | | | | | | | | |
| PharMEDium Healthcare Corporation | | Senior Loan (8.6%, Due 10/13) | | $ | 19,577 | | | $ | 19,577 | | | $ | 19,577 | |
| | (Healthcare Services) | | | | | | | | | | | | | | |
| |
| Postle Aluminum Company, LLC | | Unitranche Debt (11.0%, Due 10/12) | | | 61,500 | | | | 61,252 | | | | 61,252 | |
| | (Industrial Products) | | Equity Interests | | | | | | | 2,500 | | | | 3,092 | |
| |
| Pro Mach, Inc. | | Subordinated Debt (13.0%, Due 6/12) | | | 14,562 | | | | 14,506 | | | | 14,506 | |
| | (Industrial Products) | | Equity Interests | | | | | | | 1,500 | | | | 1,596 | |
| |
| Promo Works, LLC | | Unitranche Debt (10.3%, Due 12/11) | | | 26,215 | | | | 26,006 | | | | 26,006 | |
| | (Business Services) | | Guaranty ($600) | | | | | | | | | | | | |
| |
| Reed Group, Ltd. | | Senior Loan (8.7%, Due 12/13) | | | 21,000 | | | | 20,970 | | | | 20,970 | |
| | (Healthcare Services) | | Subordinated Debt (13.8%, Due 12/13) | | | 18,000 | | | | 17,910 | | | | 17,910 | |
| | | Equity Interests | | | | | | | 1,800 | | | | 1,800 | |
| |
| S.B. Restaurant Company | | Unitranche Debt (9.8%, Due 4/11) | | | 34,001 | | | | 33,733 | | | | 33,733 | |
| | (Retail) | | Preferred Stock (54,125 shares) | | | | | | | 135 | | | | 135 | |
| | | Warrants | | | | | | | 619 | | | | 2,095 | |
| | | Standby Letters of Credit ($2,540) | | | | | | | | | | | | |
| |
| SBBUT, LLC | | Equity Interests | | | | | | | — | | | | — | |
| | (Consumer Products) | | | | | | | | | | | | | | |
| |
| Service Center Metals, LLC | | Subordinated Debt (15.5%, Due 9/11) | | | 5,000 | | | | 4,981 | | | | 4,981 | |
| | (Industrial Products) | | Equity Interests | | | | | | | 313 | | | | 343 | |
| |
Snow Phipps Group, L.P.(5) | | Limited Partnership Interest | | | | | | | 2,288 | | | | 2,288 | |
| | (Private Equity Fund) | | | | | | | | | | | | | | |
| |
SPP Mezzanine Funding, L.P.(5) | | Limited Partnership Interest | | | | | | | 2,268 | | | | 1,942 | |
| | (Private Equity Fund) | | | | | | | | | | | | | | |
| |
SPP Mezzanine Funding II, L.P.(5) | | Limited Partnership Interest | | | | | | | 4,077 | | | | 3,731 | |
| | (Private Equity Fund) | | | | | | | | | | | | | | |
| |
| Stag-Parkway, Inc. | | Unitranche Debt (10.8%, Due 7/12) | | | 51,000 | | | | 50,810 | | | | 50,810 | |
| | (Business Services) | | | | | | | | | | | | | | |
| |
| STS Operating, Inc. | | Subordinated Debt (11.0%, Due 1/13) | | | 30,386 | | | | 30,273 | | | | 30,273 | |
| | (Industrial Products) | | | | | | | | | | | | | | |
| |
| Summit Energy Services, Inc. | | Senior Loan (8.5%, Due 8/13) | | | 24,239 | | | | 24,239 | | | | 23,512 | |
| | (Business Services) | | Subordinated Debt (11.6%, Due 8/13) | | | 35,765 | | | | 35,596 | | | | 35,596 | |
| | | Common Stock (89,406 shares) | | | | | | | 2,000 | | | | 1,995 | |
| |
| Tappan Wire and Cable Inc. | | Unitranche Debt (15.0%, Due 8/14) | | | 24,100 | | | | 23,975 | | | | 23,975 | |
| | (Business Services) | | Common Stock (15,000 shares)(12) | | | | | | | 2,250 | | | | 5,810 | |
| | | | Warrant(12) | | | | | | | — | | | | — | |
| |
| The Step2 Company, LLC | | Unitranche Debt (11.0%, Due 4/12) | | | 96,041 | | | | 95,693 | | | | 95,693 | |
| | (Consumer Products) | | Equity Interests | | | | | | | 2,483 | | | | 2,987 | |
| |
| Tradesmen International, Inc. | | Subordinated Debt (12.0%, Due 12/12) | | | 49,124 | | | | 48,431 | | | | 48,431 | |
| | (Business Services) | | | | | | | | | | | | | | |
| |
| TransAmerican Auto Parts, LLC | | Subordinated Debt (14.0%, Due 11/12) | | | 24,076 | | | | 23,907 | | | | 23,907 | |
| | (Consumer Products) | | Equity Interests | | | | | | | 1,198 | | | | 1,014 | |
| |
| Trover Solutions, Inc. | | Subordinated Debt (12.0%, Due 11/12) | | | 60,000 | | | | 59,740 | | | | 59,740 | |
| | (Business Services) | | | | | | | | | | | | | | |
| |
| Universal Air Filter Company | | Subordinated Debt (12.0%, Due 11/12) | | | 14,750 | | | | 14,688 | | | | 14,688 | |
| | (Industrial Products) | | | | | | | | | | | | | | |
| |
| | | | | |
| | (1) | | | Interest rates represent the weighted average annual stated interest rate on loans and debt securities, which are presented by nature of indebtedness for a single issuer. The maturity dates represent the earliest and the latest maturity dates. |
| | (2) | | | Common stock, preferred stock, warrants, options, and equity interests are generally non-income producing and restricted. |
| | (3) | | | Public company. |
| | (4) | | | Non-U.S. company or principal place of business outside the U.S. |
| | (5) | | | Non-registered investment company. |
| | (6) | | | Loan or debt security is on non-accrual status and therefore is considered non-income producing. |
| | (12) | | | Common stock is non-voting. In addition to non-voting stock ownership, the Company has an option to acquire a majority of the voting securities of the portfolio company at fair market value. |
The accompanying notes are an integral part of these consolidated financial statements.
89
ALLIED CAPITAL CORPORATION AND SUBSIDIARIES
CONSOLIDATED STATEMENT OF INVESTMENTS — (Continued)
| | | | | | | | | | | | | | | | | |
| | | | | December 31, 2007 | |
| Private Finance | | | | | |
| Portfolio Company | | | | |
| (in thousands, except number of shares) | | Investment(1)(2) | | Principal | | | Cost | | | Value | |
| | | | | | | | | | | | |
Updata Venture Partners II, L.P.(5) | | Limited Partnership Interest | | | | | | $ | 4,465 | | | $ | 4,306 | |
| | (Private Equity Fund) | | | | | | | | | | | | | | |
| |
| Venturehouse-Cibernet Investors, LLC | | Equity Interest | | | | | | | — | | | | 54 | |
| | (Business Services) | | | | | | | | | | | | | | |
| |
Venturehouse Group, LLC(5) | | Equity Interest | | | | | | | — | | | | 613 | |
| | (Private Equity Fund) | | | | | | | | | | | | | | |
| |
| VICORP Restaurants, Inc. | | Warrants | | | | | | | 33 | | | | — | |
| | (Retail) | | | | | | | | | | | | | | |
| |
Walker Investment Fund II, LLLP(5) | | Limited Partnership Interest | | | | | | | 1,330 | | | | — | |
| | (Private Equity Fund) | | | | | | | | | | | | | | |
| |
| WMA Equity Corporation and Affiliates | | Subordinated Debt (13.6%, Due 4/13) | | $ | 125,000 | | | | 124,010 | | | | 124,010 | |
| | d/b/a Wear Me Apparel | | Subordinated Debt (9.0%, Due 4/14)(6) | | | 13,033 | | | | 13,033 | | | | 13,302 | |
| | (Consumer Products) | | Common Stock (100 shares) | | | | | | | 46,046 | | | | 13,726 | |
| |
Webster Capital II, L.P.(5) | | Limited Partnership Interest | | | | | | | 897 | | | | 897 | |
| | (Private Equity Fund) | | | | | | | | | | | | | | |
| |
| Woodstream Corporation | | Subordinated Debt (12.0%, Due 2/15) | | | 90,000 | | | | 89,574 | | | | 89,574 | |
| | (Consumer Products) | | Common Stock (7,500 shares) | | | | | | | 7,500 | | | | 7,482 | |
| |
| York Insurance Services Group, Inc. | | Subordinated Debt (14.5%, Due 1/14) | | | 45,141 | | | | 44,966 | | | | 44,966 | |
| | (Business Services) | | Common Stock (15,000 shares) | | | | | | | 1,500 | | | | 1,995 | |
| |
| Other companies | | Other debt investments | | | 159 | | | | 57 | | | | 62 | |
| | | Other equity investments | | | | | | | 8 | | | | — | |
| |
| | | | | | | | | | | | | | | | | |
| Total companies less than 5% owned | | | | | | $ | 2,994,880 | | | $ | 2,990,732 | |
| |
| Total private finance (156 portfolio investments) | | | | | | $ | 5,043,882 | | | $ | 4,659,321 | |
| |
| | | | | |
| | (1) | | | Interest rates represent the weighted average annual stated interest rate on loans and debt securities, which are presented by nature of indebtedness for a single issuer. The maturity dates represent the earliest and the latest maturity dates. |
| | (2) | | | Common stock, preferred stock, warrants, options, and equity interests are generally non-income producing and restricted. |
| | (3) | | | Public company. |
| | (4) | | | Non-U.S. company or principal place of business outside the U.S. |
| | (5) | | | Non-registered investment company. |
| | (6) | | | Loan or debt security is on non-accrual status and therefore is considered non-income producing. |
The accompanying notes are an integral part of these consolidated financial statements.
90
ALLIED CAPITAL CORPORATION AND SUBSIDIARIES
CONSOLIDATED STATEMENT OF INVESTMENTS — (Continued)
| | | | | | | | | |
Commercial Real Estate Finance | | | | | | | | |
(in thousands, except number of loans) | | | | | | | | |
| | | | | | | | | | | | | | | | | | | |
| | | | | | | December 31, 2007 | |
| | | Interest | | | Number of | | | | |
| | | Rate Ranges | | | Loans | | | Cost | | | Value | |
| | | | | | | | | | | | | |
Commercial Mortgage Loans | | | | | | | | | | | | | | | | |
| | | | Up to 6.99% | | | | 3 | | | $ | 20,361 | | | $ | 19,842 | |
| | | | 7.00%–8.99% | | | | 8 | | | | 22,768 | | | | 22,768 | |
| | | | 9.00%–10.99% | | | | 3 | | | | 8,372 | | | | 8,372 | |
| | | | 11.00%–12.99% | | | | 1 | | | | 10,456 | | | | 10,456 | |
| | | 15.00% and above | | | 2 | | | | 3,970 | | | | 3,970 | |
| |
| | | Total commercial mortgage loans(13) | | | | | | | 17 | | | $ | 65,927 | | | $ | 65,408 | |
| |
Real Estate Owned | | | | | | | | | | $ | 15,272 | | | $ | 21,253 | |
| |
| Equity Interests(2) — Companies more than 25% owned | | | | | | $ | 15,743 | | | $ | 34,539 | |
| | Guarantees ($6,871) | | | | | | | | | | | | | | | | |
| | Standby Letter of Credit ($1,295) | | | | | | | | | | | | | | | | |
| |
| | | Total commercial real estate finance | | | | | | | | | | $ | 96,942 | | | $ | 121,200 | |
| |
| Total portfolio | | | | | | | | | | $ | 5,140,824 | | | $ | 4,780,521 | |
| |
| | | | | | | | | | | | | | | |
| | | Yield | | | Cost | | | Value | |
| | | | | | | | | | |
Liquidity Portfolio(14) | | | | | | | | | | | | |
| | American Beacon Money Market Select FD Fund | | | 4.5% | | | $ | 126,910 | | | $ | 126,910 | |
| | American Beacon Money Market Fund | | | 4.8% | | | | 40,163 | | | | 40,163 | |
| | SEI Daily Income Tr Prime Obligation Money Market Fund | | | 4.9% | | | | 34,143 | | | | 34,143 | |
| |
| | | Total liquidity portfolio | | | | | | $ | 201,216 | | | $ | 201,216 | |
| |
Other Investments in Money Market Securities(14) | | | | | | | | | | | | |
| | Columbia Treasury Reserves Money Market Fund | | | 4.6% | | | $ | 6 | | | $ | 6 | |
| |
| | | | | | | | | | | | | |
(1) Interest rates represent the weighted average annual stated interest rate on loans and debt securities, which are presented by nature of indebtedness for
a single issuer. The maturity dates represent the earliest and the latest maturity dates. |
| (2) Common stock, preferred stock, warrants, options, and equity interests are generally non-income producing and restricted. |
| (3) Public company. |
| (4) Non-U.S. company or principal place of business outside the U.S. |
| (5) Non-registered investment company. |
| (13) Commercial mortgage loans totaling $14.3 million at value were on non-accrual status and therefore were considered non-income producing. |
| (14) Included in investments in money market and other securities on the accompanying Consolidated Balance Sheet. |
The accompanying notes are an integral part of these consolidated financial statements.
91
ALLIED CAPITAL CORPORATION AND SUBSIDIARIES
CONSOLIDATED STATEMENT OF INVESTMENTS
| | | | | | | | | | | | | | | | |
| | | | | December 31, 2006 | |
| Private Finance | | | | | |
| Portfolio Company | | | | |
| (in thousands, except number of shares) | | Investment(1)(2) | | Principal | | | Cost | | | Value | |
| | | | | | | | | | | | |
| Companies More Than 25% Owned | | | | | | | | | | | | |
| |
| Alaris Consulting, LLC | | Senior Loan (16.5%, Due 12/05 – 12/07)(6) | | $ | 27,055 | | | $ | 26,987 | | | $ | — | |
| | (Business Services) | | Equity Interests | | | | | | | 5,305 | | | | — | |
| | | Guaranty ($1,100) | | | | | | | | | | | | |
| |
Avborne, Inc.(7) | | Preferred Stock (12,500 shares) | | | | | | | 610 | | | | 918 | |
| | (Business Services) | | Common Stock (27,500 shares) | | | | | | | — | | | | — | |
| |
Avborne Heavy Maintenance, Inc.(7) | | Preferred Stock (1,568 shares) | | | | | | | 2,401 | | | | — | |
| | (Business Services) | | Common Stock (2,750 shares) | | | | | | | — | | | | — | |
| | | Guaranty ($2,401) | | | | | | | | | | | | |
| |
| Border Foods, Inc. | | Preferred Stock (100,000 shares) | | | | | | | 12,721 | | | | — | |
| | (Consumer Products) | | Common Stock (148,838 shares) | | | | | | | 3,848 | | | | — | |
| |
Calder Capital Partners, LLC(5) | | Senior Loan (8.0%, Due 5/09)(6) | | | 975 | | | | 975 | | | | 975 | |
| | (Financial Services) | | Equity Interests | | | | | | | 2,076 | | | | 2,076 | |
| |
| Callidus Capital Corporation | | Subordinated Debt (18.0%, Due 10/08) | | | 5,762 | | | | 5,762 | | | | 5,762 | |
| | (Financial Services) | | Common Stock (100 shares) | | | | | | | 2,058 | | | | 22,550 | |
| |
| Ciena Capital LLC (f/k/a Business | | Class A Equity Interests(25.0%)(6) | | | 66,622 | | | | 66,622 | | | | 66,622 | |
| | Loan Express, LLC) | | Class B Equity Interests | | | | | | | 119,436 | | | | 79,139 | |
| | (Financial Services) | | Class C Equity Interests | | | | | | | 109,301 | | | | 64,976 | |
| | | Guaranty ($189,706 — See Note 3) | | | | | | | | | | | | |
| | | Standby Letters of Credit ($25,000 —
See Note 3) | | | | | | | | | | | | |
| |
| Coverall North America, Inc. | | Unitranche Debt (12.0%, Due 7/11) | | | 36,500 | | | | 36,333 | | | | 36,333 | |
| | (Business Services) | | Subordinated Debt (15.0%, Due 7/11) | | | 6,000 | | | | 5,972 | | | | 5,972 | |
| | | | Common Stock (884,880 shares) | | | | | | | 16,649 | | | | 19,619 | |
| |
| CR Brands, Inc. | | Subordinated Debt (16.6%, Due 2/13) | | | 39,573 | | | | 39,401 | | | | 39,401 | |
| | (Consumer Products) | | Common Stock (37,200,551 shares) | | | | | | | 33,321 | | | | 25,738 | |
| |
| Financial Pacific Company | | Subordinated Debt (17.4%, Due 2/12 – 8/12) | | | 71,589 | | | | 71,362 | | | | 71,362 | |
| | (Financial Services) | | Preferred Stock (10,964 shares) | | | | | | | 10,276 | | | | 15,942 | |
| | | | Common Stock (14,735 shares) | | | | | | | 14,819 | | | | 65,186 | |
| |
| ForeSite Towers, LLC | | Equity Interests | | | | | | | 7,620 | | | | 12,290 | |
| | (Tower Leasing) | | | | | | | | | | | | | | |
| |
| Global Communications, LLC | | Senior Loan (10.7%, Due 9/02 – 11/07)(6) | | | 15,957 | | | | 15,957 | | | | 15,957 | |
| | (Business Services) | | Subordinated Debt (17.0%, Due 12/03 – 9/05)(6) | | | 11,339 | | | | 11,336 | | | | 11,237 | |
| | | Preferred Equity Interest | | | | | | | 14,067 | | | | — | |
| | | Options | | | | | | | 1,639 | | | | — | |
| |
| Gordian Group, Inc. | | Senior Loan (10.0%, Due 6/06 – 12/08)(6) | | | 11,792 | | | | 11,803 | | | | — | |
| | (Business Services) | | Common Stock (1,000 shares) | | | | | | | 6,762 | | | | — | |
| |
| | | |
(1) | | Interest rates represent the weighted average annual stated interest rate on loans and debt securities, which are presented by nature of indebtedness for a single issuer. The maturity dates represent the earliest and the latest maturity dates. |
(2) | | Common stock, preferred stock, warrants, options, and equity interests are generally non-income producing and restricted. |
(3) | | Public company. |
(4) | | Non-U.S. company or principal place of business outside the U.S. |
(5) | | Non-registered investment company. |
(6) | | Loan or debt security is on non-accrual status and therefore is considered non-income producing. |
(7) | | Avborne, Inc. and Avborne Heavy Maintenance, Inc. are affiliated companies. |
The accompanying notes are an integral part of these consolidated financial statements.
92
ALLIED CAPITAL CORPORATION AND SUBSIDIARIES
CONSOLIDATED STATEMENT OF INVESTMENTS — (Continued)
| | | | | | | | | | | | | | | | |
| | | | | December 31, 2006 | |
| Private Finance | | | | | |
| Portfolio Company | | | | |
| (in thousands, except number of shares) | | Investment(1)(2) | | Principal | | | Cost | | | Value | |
| | | | | | | | | | | | |
| Healthy Pet Corp. | | Senior Loan (9.9%, Due 8/10) | | $ | 27,038 | | | $ | 27,038 | | | $ | 27,038 | |
| | (Consumer Services) | | Subordinated Debt (15.0%, Due 8/10) | | | 43,720 | | | | 43,579 | | | | 43,579 | |
| | | | Common Stock (30,142 shares) | | | | | | | 30,142 | | | | 28,921 | |
| |
| HMT, Inc. | | Preferred Stock (554,052 shares) | | | | | | | 2,637 | | | | 2,637 | |
| | (Energy Services) | | Common Stock (300,000 shares) | | | | | | | 3,000 | | | | 8,664 | |
| | | Warrants | | | | | | | 1,155 | | | | 3,336 | |
| |
| Huddle House, Inc. | | Senior Loan (8.9%, Due 12/11) | | | 19,950 | | | | 19,950 | | | | 19,950 | |
| | (Retail) | | Subordinated Debt (15.0%, Due 12/12) | | | 58,484 | | | | 58,196 | | | | 58,196 | |
| | | Common Stock (415,328 shares) | | | | | | | 41,662 | | | | 41,662 | |
| |
| Impact Innovations Group, LLC | | Equity Interests in Affiliate | | | | | | | — | | | | 873 | |
| | (Business Services) | | | | | | | | | | | | | | |
| |
| Insight Pharmaceuticals Corporation | | Subordinated Debt (16.1%, Due 9/12) | | | 60,049 | | | | 59,850 | | | | 59,850 | |
| | (Consumer Products) | | Preferred Stock (25,000 shares) | | | | | | | 25,000 | | | | 7,845 | |
| | | Common Stock (620,000 shares) | | | | | | | 6,325 | | | | — | |
| |
| Jakel, Inc. | | Subordinated Debt (15.5%, Due 3/08)(6) | | | 15,192 | | | | 15,192 | | | | 6,655 | |
| | (Industrial Products) | | Preferred Stock (6,460 shares) | | | | | | | 6,460 | | | | — | |
| | | | Common Stock (158,061 shares) | | | | | | | 9,347 | | | | — | |
| |
| Legacy Partners Group, LLC | | Senior Loan (14.0%, Due 5/09)(6) | | | 7,646 | | | | 7,646 | | | | 4,843 | |
| | (Financial Services) | | Subordinated Debt (18.0%, Due 5/09)(6) | | | 2,952 | | | | 2,952 | | | | — | |
| | | Equity Interests | | | | | | | 4,248 | | | | — | |
| |
Litterer Beteiligungs-GmbH(4) | | Subordinated Debt (8.0%, Due 3/07) | | | 692 | | | | 692 | | | | 692 | |
| | (Business Services) | | Equity Interest | | | | | | | 1,809 | | | | 1,199 | |
| |
| Mercury Air Centers, Inc. | | Subordinated Debt (16.0%, Due 4/09 – | | | | | | | | | | | | |
| | (Business Services) | | 11/12) | | | 49,358 | | | | 49,217 | | | | 49,217 | |
| | | | Common Stock (57,970 shares) | | | | | | | 35,053 | | | | 195,019 | |
| | | | Standby Letters of Credit ($1,581) | | | | | | | | | | | | |
| |
| MVL Group, Inc. | | Senior Loan (12.0%, Due 6/09 – 7/09) | | | 27,299 | | | | 27,245 | | | | 27,245 | |
| | (Business Services) | | Subordinated Debt (14.5%, Due 6/09) | | | 35,846 | | | | 35,478 | | | | 35,478 | |
| | | Common Stock (648,661 shares) | | | | | | | 643 | | | | — | |
| |
| Penn Detroit Diesel Allison, LLC | | Subordinated Debt (15.5%, Due 8/13) | | | 38,173 | | | | 37,994 | | | | 37,994 | |
| | (Business Services) | | Equity Interests | | | | | | | 21,128 | | | | 25,949 | |
| |
| Powell Plant Farms, Inc. | | Senior Loan (15.0%, Due 12/07)(6) | | | 35,040 | | | | 26,192 | | | | 26,192 | |
| | (Consumer Products) | | Subordinated Debt (20.0%, Due 6/03)(6) | | | 19,291 | | | | 19,223 | | | | 962 | |
| | | | Preferred Stock (1,483 shares) | | | | | | | — | | | | — | |
| | | | Warrants | | | | | | | — | | | | — | |
| |
| Service Champ, Inc. | | Subordinated Debt (15.5%, Due 4/12) | | | 27,733 | | | | 27,619 | | | | 27,619 | |
| | (Business Services) | | Common Stock (63,888 shares) | | | | | | | 13,662 | | | | 16,786 | |
| |
| | | |
(1) | | Interest rates represent the weighted average annual stated interest rate on loans and debt securities, which are presented by nature of indebtedness for a single issuer. The maturity dates represent the earliest and the latest maturity dates. |
(2) | | Common stock, preferred stock, warrants, options, and equity interests are generally non-income producing and restricted. |
(3) | | Public company. |
(4) | | Non-U.S. company or principal place of business outside the U.S. |
(5) | | Non-registered investment company. |
(6) | | Loan or debt security is on non-accrual status and therefore is considered non-income producing. |
The accompanying notes are an integral part of these consolidated financial statements.
93
ALLIED CAPITAL CORPORATION AND SUBSIDIARIES
CONSOLIDATED STATEMENT OF INVESTMENTS — (Continued)
| | | | | | | | | | | | | | | | |
| | | | | December 31, 2006 | |
| Private Finance | | | | | |
| Portfolio Company | | | | | | |
| (in thousands, except number of shares) | | Investment(1)(2) | | Principal | | | Cost | | | Value | |
| | | | | | | | | | | | |
| Staffing Partners Holding | | | | | | | | | | | | | | |
| | Company, Inc. | | Subordinated Debt (13.5%, Due 1/07)(6) | | $ | 540 | | | $ | 540 | | | $ | 486 | |
| | (Business Services) | | | | | | | | | | | | | | |
| |
| Startec Global Communications | | | | | | | | | | | | | | |
| | Corporation | | Senior Loan (10.0%, Due 5/07 – 5/09) | | | 15,965 | | | | 15,965 | | | | 15,965 | |
| | (Telecommunications) | | Common Stock (19,180,000 shares) | | | | | | | 37,256 | | | | 11,232 | |
| |
| Sweet Traditions, LLC | | Senior Loan (9.0%, Due 8/11) | | | 39,022 | | | | 35,172 | | | | 35,172 | |
| | (Retail) | | Equity Interests | | | | | | | 450 | | | | 450 | |
| | | | Standby Letter of Credit ($120) | | | | | | | | | | | | |
| |
Triview Investments, Inc.(8) | | Senior Loan (9.6%, Due 6/07 – 12/07) | | | 14,758 | | | | 14,747 | | | | 14,747 | |
| | (Broadcasting & Cable/Business | | Subordinated Debt (16.0%, Due 9/11 – 7/12) | | | 56,288 | | | | 56,008 | | | | 56,008 | |
| | Services/Consumer Products) | | Subordinated Debt (7.9%, Due 11/07 – 7/08)(6) | | | 4,327 | | | | 4,327 | | | | 4,342 | |
| | | | Common Stock (202 shares) | | | | | | | 98,604 | | | | 31,322 | |
| | | Guaranty ($800) | | | | | | | | | | | | |
| | | Standby Letter of Credit ($200) | | | | | | | | | | | | |
| |
| Total companies more than 25% owned | | | | | | $ | 1,578,822 | | | $ | 1,490,180 | |
| |
| Companies 5% to 25% Owned | | | | |
| |
| Advantage Sales & Marketing, Inc. | | Subordinated Debt (12.0%, Due 3/14) | | $ | 152,320 | | | $ | 151,648 | | | $ | 151,648 | |
| | (Business Services) | | Equity Interests | | | | | | | — | | | | 11,000 | |
| |
| Air Medical Group Holdings LLC | | Senior Loan (9.9%, Due 3/11) | | | 1,828 | | | | 1,763 | | | | 1,763 | |
| | (Healthcare Services) | | Subordinated Debt (14.0%, Due 11/12) | | | 35,180 | | | | 35,128 | | | | 35,128 | |
| | | Equity Interests | | | | | | | 3,470 | | | | 5,950 | |
| |
| Alpine ESP Holdings, Inc. | | Preferred Stock (622 shares) | | | | | | | 622 | | | | 602 | |
| | (Business Services) | | Common Stock (13,513 shares) | | | | | | | 14 | | | | — | |
| |
| Amerex Group, LLC | | Subordinated Debt (12.0%, Due 1/13) | | | 8,400 | | | | 8,400 | | | | 8,400 | |
| | (Consumer Products) | | Equity Interests | | | | | | | 3,546 | | | | 13,823 | |
| |
| BB&T Capital Partners/Windsor | | | | | | | | | | | | | | |
| | Mezzanine Fund, LLC(5) | | Equity Interests | | | | | | | 5,873 | | | | 5,554 | |
| | (Private Equity Fund) | | | | | | | | | | | | | | |
| |
| Becker Underwood, Inc. | | Subordinated Debt (14.5%, Due 8/12) | | | 24,244 | | | | 24,163 | | | | 24,163 | |
| | (Industrial Products) | | Common Stock (5,073 shares) | | | | | | | 5,813 | | | | 3,700 | |
| |
| BI Incorporated | | Subordinated Debt (13.5%, Due 2/14) | | | 30,269 | | | | 30,135 | | | | 30,135 | |
| | (Business Services) | | Common Stock (40,000 shares) | | | | | | | 4,000 | | | | 4,100 | |
| | | | | | | | | | | | | | | |
| |
| | | |
(1) | | Interest rates represent the weighted average annual stated interest rate on loans and debt securities, which are presented by nature of indebtedness for a single issuer. The maturity dates represent the earliest and the latest maturity dates. |
(2) | | Common stock, preferred stock, warrants, options, and equity interests are generally non-income producing and restricted. |
(3) | | Public company. |
(4) | | Non-U.S. company or principal place of business outside the U.S. |
(5) | | Non-registered investment company. |
(6) | | Loan or debt security is on non-accrual status and therefore is considered non-income producing. |
(8) | | Triview Investments, Inc. holds investments in Longview Cable & Data, LLC (Broadcasting & Cable) with a cost of $67.3 million and a value of $7.5 million, Triax Holdings, LLC (Consumer Products) with a cost of $98.9 million and a value of $91.5 million, and Crescent Hotels & Resorts, LLC and affiliates (Business Services) with a cost of $7.5 million and a value of $7.3 million. |
The accompanying notes are an integral part of these consolidated financial statements.
94
ALLIED CAPITAL CORPORATION AND SUBSIDIARIES
CONSOLIDATED STATEMENT OF INVESTMENTS — (Continued)
| | | | | | | | | | | | | | | | |
| | | | | December 31, 2006 | |
| Private Finance | | | | | |
| Portfolio Company | | | | |
| (in thousands, except number of shares) | | Investment(1)(2) | | Principal | | | Cost | | | Value | |
| | | | | | | | | | | | |
| CitiPostal, Inc. and Affiliates | | Senior Loan (11.1%, Due 8/13-11/14) | | $ | 20,670 | | | $ | 20,569 | | | $ | 20,569 | |
| | (Business Services) | | Equity Interests | | | | | | | 4,447 | | | | 4,700 | |
| |
| Creative Group, Inc. | | Subordinated Debt (12.0%, Due 9/13) | | | 15,000 | | | | 13,656 | | | | 13,656 | |
| | (Business Services) | | Warrant | | | | | | | 1,387 | | | | 1,387 | |
| |
| Drew Foam Companies, Inc. | | Preferred Stock (722 shares) | | | | | | | 722 | | | | 722 | |
| | (Business Services) | | Common Stock (7,287 shares) | | | | | | | 7 | | | | 7 | |
| |
| MedBridge Healthcare, LLC | | Senior Loan (6.0%, Due 8/09)(6) | | | 7,164 | | | | 7,164 | | | | 7,164 | |
| | (Healthcare Services) | | Subordinated Debt (10.0%, Due 8/14)(6) | | | 5,184 | | | | 5,184 | | | | 1,813 | |
| | | Convertible Subordinated Debt (2.0%,
Due 8/14)(6) | | | 2,970 | | | | 984 | | | | — | |
| | | Equity Interests | | | | | | | 1,306 | | | | — | |
| |
| Multi-Ad Services, Inc. | | Unitranche Debt (11.3%, Due 11/11) | | | 20,000 | | | | 19,879 | | | | 19,879 | |
| | (Business Services) | | Equity Interests | | | | | | | 2,000 | | | | 2,000 | |
| |
| Nexcel Synthetics, LLC | | Subordinated Debt (14.5%, Due 6/09) | | | 10,998 | | | | 10,978 | | | | 10,978 | |
| | (Consumer Products) | | Equity Interests | | | | | | | 1,755 | | | | 1,486 | |
| |
| PresAir LLC | | Senior Loan (7.5%, Due 12/10)(6) | | | 5,810 | | | | 5,492 | | | | 2,206 | |
| | (Industrial Products) | | Equity Interests | | | | | | | 1,336 | | | | — | |
| |
| Progressive International | | | | | | | | | | | | | | |
| | Corporation | | Subordinated Debt (16.0%, Due 12/09) | | | 7,553 | | | | 7,533 | | | | 7,533 | |
| | (Consumer Products) | | Preferred Stock (500 shares) | | | | | | | 500 | | | | 1,024 | |
| | | Common Stock (197 shares) | | | | | | | 13 | | | | 2,300 | |
| | | Warrants | | | | | | | — | | | | — | |
| |
| Regency Healthcare Group, LLC | | Senior Loan (11.1%, Due 6/12) | | | 1,250 | | | | 1,232 | | | | 1,232 | |
| | (Healthcare Services) | | Unitranche Debt (11.1%, Due 6/12) | | | 20,000 | | | | 19,908 | | | | 19,908 | |
| | | | Equity Interests | | | | | | | 1,500 | | | | 1,616 | |
| |
SGT India Private Limited(4) | | Common Stock (109,524 shares) | | | | | | | 3,944 | | | | 3,346 | |
| | (Business Services) | | | | | | | | | | | | | | |
| |
| Soteria Imaging Services, LLC | | Subordinated Debt (11.6%, Due 11/10) | | | 18,500 | | | | 17,569 | | | | 17,569 | |
| | (Healthcare Services) | | Equity Interests | | | | | | | 2,163 | | | | 2,541 | |
| |
| Universal Environmental Services, LLC | | Unitranche Debt (14.5%, Due 2/09) | | | 10,989 | | | | 10,962 | | | | 10,211 | |
| | (Business Services) | | Equity Interests | | | | | | | 1,795 | | | | — | |
| |
| Total companies 5% to 25% owned | | | | | | $ | 438,560 | | | $ | 449,813 | |
| |
Companies Less Than 5% Owned | | | | | | | | | | | | | | |
| |
| 3SI Security Systems, Inc. | | Subordinated Debt (14.5%, Due 8/13) | | $ | 26,857 | | | $ | 26,740 | | | $ | 26,740 | |
| | (Consumer Products) | | | | | | | | | | | | | | |
| |
| AgData, L.P. | | Unitranche Debt (10.3%, Due 7/12) | | | 11,330 | | | | 11,269 | | | | 11,269 | |
| | (Consumer Services) | | | | | | | | | | | | | | |
| |
| Anthony, Inc. | | Subordinated Debt (13.3%, Due 8/11 – | | | | | | | | | | | | |
| | (Industrial Products) | | 9/12) | | | 14,818 | | | | 14,768 | | | | 14,768 | |
| |
| Axium Healthcare Pharmacy, Inc. | | Senior Loan (12.0%, Due 12/12) | | | 200 | | | | 161 | | | | 161 | |
| | (Healthcare Services) | | Unitranche Debt (12.0%, Due 12/12) | | | 9,000 | | | | 8,956 | | | | 8,956 | |
| | | | Common Stock (26,500 shares) | | | | | | | 2,650 | | | | 2,650 | |
| |
Baird Capital Partners IV Limited Partnership(5)
(Private Equity Fund) | |
Limited Partnership Interest | | | | | | | 876 | | | | 876 | |
| |
| | | |
(1) | | Interest rates represent the weighted average annual stated interest rate on loans and debt securities, which are presented by nature of indebtedness for a single issuer. The maturity dates represent the earliest and the latest maturity dates. |
(2) | | Common stock, preferred stock, warrants, options, and equity interests are generally non-income producing and restricted. |
(3) | | Public company. |
(4) | | Non-U.S. company or principal place of business outside the U.S. |
(5) | | Non-registered investment company. |
(6) | | Loan or debt security is on non-accrual status and therefore is considered non-income producing. |
The accompanying notes are an integral part of these consolidated financial statements.
95
ALLIED CAPITAL CORPORATION AND SUBSIDIARIES
CONSOLIDATED STATEMENT OF INVESTMENTS — (Continued)
| | | | | | | | | | | | | | | | |
| | | | | December 31, 2006 | |
| Private Finance | | | | | |
| Portfolio Company | | | | |
| (in thousands, except number of shares) | | Investment(1)(2) | | Principal | | | Cost | | | Value | |
| | | | | | | | | | | | |
| Bantek West, Inc. | | Subordinated Debt (11.6%, Due 1/11)(6) | | $ | 30,000 | | | $ | 30,000 | | | $ | 21,463 | |
| | (Business Services) | | | | | | | | | | | | | | |
| |
| Benchmark Medical, Inc. | | Warrants | | | | | | | 18 | | | | — | |
| | (Healthcare Services) | | | | | | | | | | | | | | |
| |
| BenefitMall, Inc. | | Unitranche Debt (13.3%, Due 8/12) | | | 110,030 | | | | 109,648 | | | | 109,648 | |
| | (Business Services) | | Common Stock (45,528,000 shares)(11) | | | | | | | 45,528 | | | | 43,578 | |
| | | | Warrants(11) | | | | | | | — | | | | — | |
| | | | Standby Letters of Credit ($9,981) | | | | | | | | | | | | |
| |
Breeze-Eastern Corporation(3) | | Senior Loan (10.1%, Due 5/11) | | | 10,000 | | | | 10,000 | | | | 10,000 | |
| | (Industrial Products) | | | | | | | | | | | | | | |
| |
| Broadcast Electronics, Inc. | | Senior Loan (9.1%, Due 7/12) | | | 4,963 | | | | 4,930 | | | | 4,930 | |
| | (Business Services) | | | | | | | | | | | | | | |
| |
| C&K Market, Inc. | | Subordinated Debt (14.0%, Due 12/08) | | | 27,819 | | | | 27,738 | | | | 27,738 | |
| | (Retail) | | | | | | | | | | | | | | |
| |
| Callidus Debt Partners | | | | | | | | | | | | | | |
| | CDO Fund I, Ltd.(4)(9) | | Class C Notes (12.9%, Due 12/13) | | | 18,800 | | | | 18,951 | | | | 18,951 | |
| | (CDO/CLO) | | Class D Notes (17.0%, Due 12/13) | | | 9,400 | | | | 9,476 | | | | 9,476 | |
| |
| Callidus Debt Partners | | | | | | | | | | | | | | |
| | CLO Fund III, Ltd.(4)(9)
(CDO/CLO) | | Preferred Shares (23,600,000 shares, 12.7%)(12) | | | | | | |
23,285 | | | |
23,010 | |
| |
| Callidus Debt Partners | | | | | | | | | | | | | | |
| | CLO Fund IV, Ltd.(4)(9) | | Income Notes (13.8%)(12) | | | | | | | 12,986 | | | | 12,986 | |
| | (CDO/CLO) | | | | | | | | | | | | | | |
| |
| Callidus Debt Partners | | | | | | | | | | | | | | |
| | CLO Fund V, Ltd.(4)(9) | | Income Notes (15.8%)(12) | | | | | | | 13,769 | | | | 13,769 | |
| | (CDO/CLO) | | | | | | | | | | | | | | |
| |
Callidus MAPS CLO Fund I LLC(9) | | Class E Notes (10.9%, Due 12/17) | | | 17,000 | | | | 17,000 | | | | 17,155 | |
| | (CDO/CLO) | | Income Notes (15.9%)(12) | | | | | | | 50,960 | | | | 47,421 | |
| |
| Camden Partners Strategic Fund II, | | | | | | | | | | | | | | |
| | L.P.(5) | | Limited Partnership Interest | | | | | | | 2,141 | | | | 2,873 | |
| | (Private Equity Fund) | | | | | | | | | | | | | | |
| |
| Carlisle Wide Plank Floors, Inc. | | Unitranche Debt (10.5%, Due 6/11) | | | 14,000 | | | | 13,900 | | | | 13,900 | |
| | (Consumer Products) | | Preferred Stock (400,000 Shares) | | | | | | | 400 | | | | 400 | |
| |
Catterton Partners V, L.P.(5) | | Limited Partnership Interest | | | | | | | 3,306 | | | | 3,412 | |
| | (Private Equity Fund) | | | | | | | | | | | | | | |
| |
Catterton Partners VI, L.P.(5) | | Limited Partnership Interest | | | | | | | 531 | | | | 531 | |
| | (Private Equity Fund) | | | | | | | | | | | | | | |
| |
Centre Capital Investors IV, L.P.(5) | | Limited Partnership Interest | | | | | | | 1,991 | | | | 1,889 | |
| | (Private Equity Fund) | | | | | | | | | | | | | | |
| |
| | | |
(1) | | Interest rates represent the weighted average annual stated interest rate on loans and debt securities, which are presented by nature of indebtedness for a single issuer. The maturity dates represent the earliest and the latest maturity dates. |
(2) | | Common stock, preferred stock, warrants, options, and equity interests are generally non-income producing and restricted. |
(3) | | Public company. |
(4) | | Non-U.S. company or principal place of business outside the U.S. |
(5) | | Non-registered investment company. |
(6) | | Loan or debt security is on non-accrual status and therefore is considered non-income producing. |
(9) | | The fund is managed by Callidus Capital, a portfolio company of Allied Capital. |
(11) | | Common stock is non-voting. In addition to non-voting stock ownership, the Company has an option to acquire a majority of the voting securities of the portfolio company at fair market value. |
(12) | | Represents the effective yield earned on these preferred equity investments. The yield is included in interest income from companies less than 5% owned in the consolidated statement of operations. |
The accompanying notes are an integral part of these consolidated financial statements.
96
ALLIED CAPITAL CORPORATION AND SUBSIDIARIES
CONSOLIDATED STATEMENT OF INVESTMENTS — (Continued)
| | | | | | | | | | | | | | | | |
| | | | | December 31, 2006 | |
| Private Finance | | | | | |
| Portfolio Company | | | | |
| (in thousands, except number of shares) | | Investment(1)(2) | | Principal | | | Cost | | | Value | |
| | | | | | | | | | | | |
| Commercial Credit Group, Inc. | | Subordinated Debt (14.8%, Due 2/11) | | $ | 5,000 | | | $ | 4,959 | | | $ | 4,959 | |
| | (Financial Services) | | Preferred Stock (32,500 shares) | | | | | | | 3,900 | | | | 3,900 | |
| | | | Warrants | | | | | | | — | | | | — | |
| |
| Community Education Centers, Inc. | | Subordinated Debt (16.0%, Due 12/10) | | | 34,158 | | | | 34,067 | | | | 34,067 | |
| | (Education Services) | | | | | | | | | | | | | | |
| |
| Compass Group Diversified | | | | | | | | | | | | | | |
| | Holdings LLC(3) | | Senior Loan (8.4%, Due 11/11) | | | 8,500 | | | | 8,375 | | | | 8,375 | |
| | (Financial Services) | | | | | | | | | | | | | | |
| |
| Component Hardware Group, Inc. | | Subordinated Debt (13.5%, Due 1/13) | | | 18,158 | | | | 18,075 | | | | 18,075 | |
| | (Industrial Products) | | | | | | | | | | | | | | |
| |
| Cook Inlet Alternative Risk, LLC | | Unitranche Debt (10.0%, Due 4/12) | | | 67,500 | | | | 67,146 | | | | 67,146 | |
| | (Business Services) | | Equity Interests | | | | | | | 2,000 | | | | 2,300 | |
| |
Cortec Group Fund IV, L.P.(5) | | Limited Partnership Interest | | | | | | | 1,137 | | | | 1,137 | |
| | (Private Equity) | | | | | | | | | | | | | | |
| |
| CSAV, Inc. | | Subordinated Debt (11.9%, Due 6/13) | | | 37,500 | | | | 37,500 | | | | 37,500 | |
| | (Business Services) | | | | | | | | | | | | | | |
| |
| DCWV Acquisition Corporation | | Senior Loan (8.9%, Due 7/12) | | | 2,074 | | | | 2,060 | | | | 2,060 | |
| | (Consumer Products) | | Unitranche Debt (11.0%, Due 7/12) | | | 16,788 | | | | 16,694 | | | | 16,694 | |
| |
| Deluxe Entertainment Services Group, Inc. | | Subordinated Debt (13.6%, Due 7/11) | | | 30,000 | | | | 30,000 | | | | 30,000 | |
| | (Business Services) | | | | | | | | | | | | | | |
| |
| Distant Lands Trading Co. | | Senior Loan (10.6%, Due 11/11) | | | 2,700 | | | | 2,656 | | | | 2,656 | |
| | (Consumer Products) | | Unitranche Debt (11.0%, Due 11/11) | | | 54,375 | | | | 54,130 | | | | 54,130 | |
| | | | Common Stock (4,000 shares) | | | | | | | 4,000 | | | | 2,975 | |
| |
| Drilltec Patents & Technologies | | | | | | | | | | | | | | |
| | Company, Inc. | | Subordinated Debt (18.0%, Due 8/06) | | | 4,119 | | | | 4,119 | | | | 4,119 | |
| | (Energy Services) | | Subordinated Debt (16.5%, Due 8/06)(6) | | | 10,994 | | | | 10,918 | | | | 9,121 | |
| |
| Driven Brands, Inc. | | Senior Loan (8.9%, Due 6/11) | | | 37,070 | | | | 36,918 | | | | 36,918 | |
| | d/b/a Meineke and Econo Lube | | Subordinated Debt (12.1%, Due 6/12 – 6/13) | | | 83,000 | | | | 82,684 | | | | 82,684 | |
| | (Consumer Services) | | Common Stock (11,675,331 shares)(11) | | | | | | | 29,455 | | | | 19,702 | |
| | | | Warrants(11) | | | | | | | — | | | | — | |
| |
| Digital VideoStream, LLC | | Unitranche Debt (11.0%, Due 2/12) | | | 19,127 | | | | 19,021 | | | | 19,021 | |
| | (Business Services) | | Convertible Subordinated Debt
(10.0%, Due 2/16) | | | 3,730 | | | | 3,714 | | | | 3,714 | |
| |
Dynamic India Fund IV(4)(5) | | Equity Interests | | | | | | | 3,850 | | | | 3,850 | |
| | (Private Equity Fund) | | | | | | | | | | | | | | |
| |
| EarthColor, Inc. | | Senior Loan (7.4%, Due 11/11) | | | 35,000 | | | | 35,000 | | | | 35,000 | |
| | (Business Services) | | Subordinated Debt (15.0%, Due 11/13) | | | 107,000 | | | | 106,478 | | | | 106,478 | |
| | | Common Stock (53,540 shares)(11) | | | | | | | 53,540 | | | | 53,540 | |
| | | Warrants(11) | | | | | | | — | | | | — | |
| |
eCentury Capital Partners, L.P.(5) | | Limited Partnership Interest | | | | | | | 6,274 | | | | 2,090 | |
| | (Private Equity Fund) | | | | | | | | | | | | | | |
| |
| | | | | |
| | (1) | | | Interest rates represent the weighted average annual stated interest rate on loans and debt securities, which are presented by nature of indebtedness for a single issuer. The maturity dates represent the earliest and the latest maturity dates. |
| | (2) | | | Common stock, preferred stock, warrants, options, and equity interests are generally non-income producing and restricted. |
| | (3) | | | Public company. |
| | (4) | | | Non-U.S. company or principal place of business outside the U.S. |
| | (5) | | | Non-registered investment company. |
| | (6) | | | Loan or debt security is on non-accrual status and therefore is considered non-income producing. |
| | (11) | | | Common stock is non-voting. In addition to non-voting stock ownership, the Company has an option to acquire a majority of the voting securities of the portfolio company at fair market value. |
The accompanying notes are an integral part of these consolidated financial statements.
97
ALLIED CAPITAL CORPORATION AND SUBSIDIARIES
CONSOLIDATED STATEMENT OF INVESTMENTS — (Continued)
| | | | | | | | | | | | | | | | |
| | | | | December 31, 2006 | |
| Private Finance | | | | | |
| Portfolio Company | | | | |
| (in thousands, except number of shares) | | Investment(1)(2) | | Principal | | | Cost | | | Value | |
| | | | | | | | | | | | |
Elexis Beta GmbH(4) | | Options | | | | | | $ | 426 | | | $ | 50 | |
| | (Industrial Products) | | | | | | | | | | | | | | |
| |
| Farley’s & Sathers Candy Company, Inc. | | Subordinated Debt (11.4%, Due 3/11) | | $ | 20,000 | | | | 19,931 | | | | 19,931 | |
| | (Consumer Products) | | | | | | | | | | | | | | |
| |
| Frozen Specialties, Inc. | | Warrants | | | | | | | 435 | | | | 320 | |
| | (Consumer Products) | | | | | | | | | | | | | | |
| |
Garden Ridge Corporation
(Retail) | | Subordinated Debt (7.0%, Due 5/12)(6) | | | 22,500 | | | | 22,500 | | | | 22,500 | |
| |
| Geotrace Technologies, Inc. | | Subordinated Debt (10.0%, Due 6/09) | | | 23,945 | | | | 22,481 | | | | 22,481 | |
| | (Energy Services) | | Warrants | | | | | | | 2,350 | | | | 1,900 | |
| |
| Ginsey Industries, Inc. | | Subordinated Debt (12.5%, Due 3/07) | | | 2,743 | | | | 2,743 | | | | 2,743 | |
| | (Consumer Products) | | | | | | | | | | | | | | |
| |
| Grant Broadcasting Systems II | | Subordinated Debt (5.0%, Due 6/11) | | | 3,005 | | | | 3,005 | | | | 3,005 | |
| | (Broadcasting & Cable) | | | | | | | | | | | | | | |
| |
Grotech Partners, VI, L.P.(5) | | Limited Partnership Interest | | | | | | | 8,223 | | | | 6,088 | |
| | (Private Equity Fund) | | | | | | | | | | | | | | |
| |
| Havco Wood Products LLC | | Unitranche Debt (11.1%, Due 8/11) | | | 19,654 | | | | 18,615 | | | | 18,615 | |
| | (Industrial Products) | | Equity Interests | | | | | | | 1,049 | | | | 3,000 | |
| |
Haven Eldercare of New England, LLC(10) | | Subordinated Debt (12.0%, Due 8/09) | | | 2,827 | | | | 2,827 | | | | 2,827 | |
| | (Healthcare Services) | | | | | | | | | | | | | | |
| |
Haven Healthcare Management, LLC(10) | | Subordinated Debt (18.0%, Due 4/07) | | | 140 | | | | 140 | | | | 140 | |
| | (Healthcare Services) | | | | | | | | | | | | | | |
| |
| HealthASPex Services Inc. | | Senior Loan (4.0%, Due 7/08) | | | 500 | | | | 500 | | | | 500 | |
| | (Business Services) | | | | | | | | | | | | | | |
| |
The Hillman Companies, Inc.(3) | | Subordinated Debt (10.0%, Due 9/11) | | | 44,580 | | | | 44,427 | | | | 44,427 | |
| | (Consumer Products) | | | | | | | | | | | | | | |
| |
| The Homax Group, Inc. | | Senior Loan (9.2%, Due 10/12) | | | 12,485 | | | | 12,485 | | | | 12,485 | |
| | (Consumer Products) | | Subordinated Debt (12.0%, Due 4/14) | | | 14,000 | | | | 13,171 | | | | 13,171 | |
| | | | Preferred Stock (89 shares) | | | | | | | 89 | | | | 89 | |
| | | | Common Stock (28 shares) | | | | | | | 6 | | | | 6 | |
| | | | Warrants | | | | | | | 1,106 | | | | 1,106 | |
| |
| Hot Stuff Foods, LLC | | Senior Loan (8.9%, Due 2/11-2/12) | | | 48,580 | | | | 48,351 | | | | 48,351 | |
| | (Consumer Products) | | Subordinated Debt (13.7%, Due 8/12 – 2/13) | | | 60,606 | | | | 60,353 | | | | 60,353 | |
| | | | Subordinated Debt (16.0%, Due 2/13)(6) | | | 20,841 | | | | 20,749 | | | | 8,460 | |
| | | | Common Stock (1,122,452 shares)(11) | | | | | | | 56,186 | | | | — | |
| | | | Warrants(11) | | | | | | | — | | | | — | |
| |
| Ideal Snacks Corporation | | Senior Loan (9.0%, Due 6/10) | | | 5,850 | | | | 5,815 | | | | 5,815 | |
| | (Consumer Products) | | | | | | | | | | | | | | |
| |
| Integrity Interactive Corporation | | Unitranche Debt (10.5%, Due 2/12) | | | 29,500 | | | | 29,314 | | | | 29,314 | |
| | (Business Services) | | | | | | | | | | | | | | |
| |
| International Fiber Corporation | | Subordinated Debt (14.0%, Due 6/12) | | | 21,986 | | | | 21,914 | | | | 21,914 | |
| | (Industrial Products) | | Preferred Stock (25,000 shares) | | | | | | | 2,500 | | | | 2,200 | |
| |
| | | | | |
| | (1) | | | Interest rates represent the weighted average annual stated interest rate on loans and debt securities, which are presented by nature of indebtedness for a single issuer. The maturity dates represent the earliest and the latest maturity dates. |
| | (2) | | | Common stock, preferred stock, warrants, options, and equity interests are generally non-income producing and restricted. |
| | (3) | | | Public company. |
| | (4) | | | Non-U.S. company or principal place of business outside the U.S. |
| | (5) | | | Non-registered investment company. |
| | (6) | | | Loan or debt security is on non-accrual status and therefore is considered non-income producing. |
| | (10) | | | Haven Eldercare of New England, LLC and Haven Healthcare Management, LLC are affiliated companies. |
| | (11) | | | Common stock is non-voting. In addition to non-voting stock ownership, the Company has an option to acquire a majority of the voting securities of the portfolio company at fair market value. |
The accompanying notes are an integral part of these consolidated financial statements.
98
ALLIED CAPITAL CORPORATION AND SUBSIDIARIES
CONSOLIDATED STATEMENT OF INVESTMENTS — (Continued)
| | | | | | | | | | | | | | | | |
| | | | | December 31, 2006 | |
| Private Finance | | | | | |
| Portfolio Company | | | | |
| (in thousands, except number of shares) | | Investment(1)(2) | | Principal | | | Cost | | | Value | |
| | | | | | | | | | | | |
Kodiak Fund LP(5) | | Equity Interests | | | | | | $ | 4,700 | | | $ | 4,656 | |
| | (Private Equity Fund) | | | | | | | | | | | | | | |
| |
| Line-X, Inc. | | Senior Loan (9.1%, Due 8/11) | | $ | 2,000 | | | | 1,981 | | | | 1,981 | |
| | (Consumer Products) | | Unitranche Debt (10.0% Due 8/11) | | | 48,509 | | | | 48,306 | | | | 48,306 | |
| | | | Standby Letter of Credit ($1,500) | | | | | | | | | | | | |
| |
| MedAssets, Inc. | | Preferred Stock (227,865 shares) | | | | | | | 2,049 | | | | 3,623 | |
| | (Business Services) | | Common Stock (50,000 shares) | | | | | | | — | | | | 250 | |
| |
| MHF Logistical Solutions, Inc. | | Subordinated Debt (11.5%, Due 6/12) | | | 33,600 | | | | 33,448 | | | | 33,448 | |
| | (Business Services) | | Subordinated Debt (18.0%, Due 6/13)(6) | | | 11,211 | | | | 11,155 | | | | 8,719 | |
| | | | Common Stock (20,934 shares)(11) | | | | | | | 20,942 | | | | — | |
| | | | Warrants(11) | | | | | | | — | | | | — | |
| |
Mid-Atlantic Venture Fund IV, L.P.(5) | | Limited Partnership Interest | | | | | | | 6,974 | | | | 3,221 | |
| | (Private Equity Fund) | | | | | | | | | | | | | | |
| |
| Mogas Energy, LLC | | Subordinated Debt (9.5%, Due 3/12 – 4/12) | | | 16,336 | | | | 15,100 | | | | 16,318 | |
| | (Energy Services) | | Warrants | | | | | | | 1,774 | | | | 6,250 | |
| |
| Network Hardware Resale, Inc. | | Unitranche Debt (10.5%, Due 12/11) | | | 37,154 | | | | 37,357 | | | | 37,357 | |
| | (Business Services) | | Convertible Subordinated Debt (9.8%, Due 12/15) | | | 12,000 | | | | 12,068 | | | | 12,559 | |
| |
| Norwesco, Inc. | | Subordinated Debt (12.6%, Due 1/12 – 7/12) | | | 82,486 | | | | 82,172 | | | | 82,172 | |
| | (Industrial Products) | | Common Stock (559,603 shares)(11) | | | | | | | 38,313 | | | | 83,329 | |
| | | Warrants(11) | | | | | | | — | | | | — | |
| |
Novak Biddle Venture Partners III, L.P.(5) | | Limited Partnership Interest | | | | | | | 1,834 | | | | 1,947 | |
| | (Private Equity Fund) | | | | | | | | | | | | | | |
| |
| Oahu Waste Services, Inc. | | Stock Appreciation Rights | | | | | | | 239 | | | | 800 | |
| | (Business Services) | | | | | | | | | | | | | | |
| |
| Odyssey Investment Partners Fund III, | | | | | | | | | | | | | | |
| | LP(5) | | Limited Partnership Interest | | | | | | | 1,883 | | | | 1,744 | |
| | (Private Equity Fund) | | | | | | | | | | | | | | |
| |
| Palm Coast Data, LLC | | Senior Loan (8.9%, Due 8/10) | | | 15,306 | | | | 15,243 | | | | 15,243 | |
| | (Business Services) | | Subordinated Debt (15.5%, Due 8/12 – 8/15) | | | 30,396 | | | | 30,277 | | | | 30,277 | |
| | | | Common Stock (21,743 shares)(11) | | | | | | | 21,743 | | | | 41,707 | |
| | | | Warrants(11) | | | | | | | — | | | | — | |
| |
| Passport Health | | | | | | | | | | | | | | |
| | Communications, Inc. | | Subordinated Debt (14.0%, Due 4/12) | | | 10,145 | | | | 10,101 | | | | 10,101 | |
| | (Healthcare Services) | | Preferred Stock (651,381 shares) | | | | | | | 2,000 | | | | 2,189 | |
| |
| Performant Financial Corporation | | Common Stock (478,816 shares) | | | | | | | 734 | | | | — | |
| | (Business Services) | | | | | | | | | | | | | | |
| |
| | | | | |
| | (1) | | | Interest rates represent the weighted average annual stated interest rate on loans and debt securities, which are presented by nature of indebtedness for a single issuer. The maturity dates represent the earliest and the latest maturity dates. |
| | (2) | | | Common stock, preferred stock, warrants, options, and equity interests are generally non-income producing and restricted. |
| | (3) | | | Public company. |
| | (4) | | | Non-U.S. company or principal place of business outside the U.S. |
| | (5) | | | Non-registered investment company. |
| | (6) | | | Loan or debt security is on non-accrual status and therefore is considered non-income producing. |
| | (11) | | | Common stock is non-voting. In addition to non-voting stock ownership, the Company has an option to acquire a majority of the voting securities of the portfolio company at fair market value. |
The accompanying notes are an integral part of these consolidated financial statements.
99
ALLIED CAPITAL CORPORATION AND SUBSIDIARIES
CONSOLIDATED STATEMENT OF INVESTMENTS — (Continued)
| | | | | | | | | | | | | | | | |
| | | | | December 31, 2006 | |
| Private Finance | | | | | |
| Portfolio Company | | | | |
| (in thousands, except number of shares) | | Investment(1)(2) | | Principal | | | Cost | | | Value | |
| | | | | | | | | | | | |
| Postle Aluminum Company, LLC | | Unitranche Debt (11.0%, Due 10/12) | | $ | 57,500 | | | $ | 57,189 | | | $ | 57,189 | |
| | (Industrial Products) | | Equity Interests | | | | | | | 2,500 | | | | 2,500 | |
| |
| Pro Mach, Inc. | | Subordinated Debt (12.5%, Due 6/12) | | | 14,471 | | | | 14,402 | | | | 14,402 | |
| | (Industrial Products) | | Equity Interests | | | | | | | 1,500 | | | | 2,200 | |
| |
| Promo Works, LLC | | Unitranche Debt (10.3%, Due 12/11) | | | 31,000 | | | | 30,727 | | | | 30,727 | |
| | (Business Services) | | Guaranty ($1,200) | | | | | | | | | | | | |
| |
| S.B. Restaurant Company | | Unitranche Debt (9.8%, Due 4/11) | | | 41,501 | | | | 41,094 | | | | 41,094 | |
| | (Retail) | | Preferred Stock (54,125 shares) | | | | | | | 135 | | | | 135 | |
| | | Warrants | | | | | | | 619 | | | | 1,200 | |
| | | Standby Letters of Credit ($2,611) | | | | | | | | | | | | |
| |
| SBBUT, LLC | | Equity Interests | | | | | | | — | | | | — | |
| | (Consumer Products) | | | | | | | | | | | | | | |
| |
| Service Center Metals, LLC | | Subordinated Debt (15.5%, Due 9/11) | | | 5,000 | | | | 4,976 | | | | 4,976 | |
| | (Industrial Products) | | Equity Interests | | | | | | | 312 | | | | 318 | |
| |
| Soff-Cut Holdings, Inc. | | Preferred Stock (300 shares) | | | | | | | 300 | | | | 300 | |
| | (Industrial Products) | | Common Stock (2,000 shares) | | | | | | | 200 | | | | 180 | |
| |
SPP Mezzanine Funding, L.P.(5) | | Limited Partnership Interest | | | | | | | 2,551 | | | | 2,825 | |
| | (Private Equity Fund) | | | | | | | | | | | | | | |
| |
SPP Mezzanine Funding II, L.P.(5) | | Limited Partnership Interest | | | | | | | 326 | | | | 326 | |
| | (Private Equity Fund) | | | | | | | | | | | | | | |
| |
| Stag-Parkway, Inc. | | Unitranche Debt (10.8%, Due 7/12) | | | 63,000 | | | | 62,711 | | | | 62,711 | |
| | (Business Services) | | | | | | | | | | | | | | |
| |
| STS Operating, Inc. | | Subordinated Debt (15.0%, Due 1/13) | | | 30,156 | | | | 30,021 | | | | 30,021 | |
| | (Industrial Products) | | | | | | | | | | | | | | |
| |
| The Step2 Company, LLC | | Unitranche Debt (10.5%, Due 4/12) | | | 67,898 | | | | 67,457 | | | | 67,457 | |
| | (Consumer Products) | | Equity Interests | | | | | | | 2,000 | | | | 1,763 | |
| |
| Tradesmen International, Inc. | | Subordinated Debt (12.0%, Due 12/09) | | | 15,000 | | | | 14,468 | | | | 14,468 | |
| | (Business Services) | | Warrants | | | | | | | 710 | | | | 3,300 | |
| |
| TransAmerican Auto Parts, LLC | | Subordinated Debt (14.0%, Due 11/12) | | | 12,947 | | | | 12,892 | | | | 12,892 | |
| | (Consumer Products) | | Equity Interests | | | | | | | 1,190 | | | | 747 | |
| |
| Universal Air Filter Company | | Unitranche Debt (11.0%, Due 11/11) | | | 19,117 | | | | 19,026 | | | | 19,026 | |
| | (Industrial Products) | | | | | | | | | | | | | | |
| |
Updata Venture Partners II, L.P.(5) | | Limited Partnership Interest | | | | | | | 5,477 | | | | 5,158 | |
| | (Private Equity Fund) | | | | | | | | | | | | | | |
| |
| Venturehouse-Cibernet Investors, LLC | | Equity Interest | | | | | | | 42 | | | | 42 | |
| | (Business Services) | | | | | | | | | | | | | | |
| |
Venturehouse Group, LLC(5) | | Equity Interest | | | | | | | 598 | | | | 365 | |
| | (Private Equity Fund) | | | | | | | | | | | | | | |
| |
| VICORP Restaurants, Inc. | | Warrants | | | | | | | 33 | | | | — | |
| | (Retail) | | | | | | | | | | | | | | |
| |
| | | | | |
| | (1) | | | Interest rates represent the weighted average annual stated interest rate on loans and debt securities, which are presented by nature of indebtedness for a single issuer. The maturity dates represent the earliest and the latest maturity dates. |
| | (2) | | | Common stock, preferred stock, warrants, options, and equity interests are generally non-income producing and restricted. |
| | (3) | | | Public company. |
| | (4) | | | Non-U.S. company or principal place of business outside the U.S. |
| | (5) | | | Non-registered investment company. |
| | (6) | | | Loan or debt security is on non-accrual status and therefore is considered non-income producing. |
The accompanying notes are an integral part of these consolidated financial statements.
100
ALLIED CAPITAL CORPORATION AND SUBSIDIARIES
CONSOLIDATED STATEMENT OF INVESTMENTS — (Continued)
| | | | | | | | | | | | | | | | |
| | | | | December 31, 2006 | |
| Private Finance | | | | | |
| Portfolio Company | | | | |
| (in thousands, except number of shares) | | Investment(1)(2) | | Principal | | | Cost | | | Value | |
| | | | | | | | | | | | |
Walker Investment Fund II, LLLP(5) | | Limited Partnership Interest | | | | | | $ | 1,329 | | | $ | 458 | |
| | (Private Equity Fund) | | | | | | | | | | | | | | |
| |
| Wear Me Apparel Corporation | | Subordinated Debt (15.0%, Due 12/10) | | $ | 40,000 | | | | 39,407 | | | | 39,407 | |
| | (Consumer Products) | | Warrants | | | | | | | 1,219 | | | | 5,120 | |
| |
| Wilton Industries, Inc. | | Subordinated Debt (16.0%, Due 6/08) | | | 2,400 | | | | 2,400 | | | | 2,400 | |
| | (Consumer Products) | | | | | | | | | | | | | | |
| |
| Woodstream Corporation | | Subordinated Debt (13.5%, Due 11/12 – 5/13) | | | 53,114 | | | | 52,989 | | | | 52,989 | |
| | (Consumer Products) | | Common Stock (180 shares) | | | | | | | 673 | | | | 3,885 | |
| | | | Warrants | | | | | | | — | | | | 2,815 | |
| |
| York Insurance Services Group, Inc. | | Subordinated Debt (14.5%, Due 1/14) | | | 44,249 | | | | 44,045 | | | | 44,045 | |
| | (Business Services) | | Common Stock (15,000 shares) | | | | | | | 1,500 | | | | 1,500 | |
| |
| Other companies | | Other debt investments(6) | | | 223 | | | | 223 | | | | 218 | |
| | | Other equity investments | | | | | | | 8 | | | | — | |
| |
| Total companies less than 5% owned | | | | | | $ | 2,479,981 | | | $ | 2,437,908 | |
| |
| Total private finance (145 portfolio investments) | | | | | | $ | 4,497,363 | | | $ | 4,377,901 | |
| |
| | | | | |
| | (1) | | | Interest rates represent the weighted average annual stated interest rate on loans and debt securities, which are presented by nature of indebtedness for a single issuer. The maturity dates represent the earliest and the latest maturity dates. |
| | (2) | | | Common stock, preferred stock, warrants, options, and equity interests are generally non-income producing and restricted. |
| | (3) | | | Public company. |
| | (4) | | | Non-U.S. company or principal place of business outside the U.S. |
| | (5) | | | Non-registered investment company. |
| | (6) | | | Loan or debt security is on non-accrual status and therefore is considered non-income producing. |
The accompanying notes are an integral part of these consolidated financial statements.
101
ALLIED CAPITAL CORPORATION AND SUBSIDIARIES
CONSOLIDATED STATEMENT OF INVESTMENTS — (Continued)
| | | | | | | | | |
Commercial Real Estate Finance | | | | | | | | |
(in thousands, except number of loans) | | | | | | | | |
| | | | | | | | | | | | | | | | | | |
| | | | | | | December 31, 2006 | |
| | | Interest | | | Number of | | | | |
| | | Rate Ranges | | | Loans | | | Cost | | | Value | |
| | | | | | | | | | | | | |
Commercial Mortgage Loans | | | | | | | | | | | | | | | | |
| | | | Up to 6.99% | | | | 3 | | | $ | 20,470 | | | $ | 19,692 | |
| | | | 7.00%–8.99% | | | | 9 | | | | 24,092 | | | | 24,073 | |
| | | | 9.00%–10.99% | | | | 4 | | | | 24,117 | | | | 24,117 | |
| | | 15.00% and above | | | 2 | | | | 3,970 | | | | 3,970 | |
| |
| | Total commercial mortgage loans(13) | | | | | | | 18 | | | $ | 72,649 | | | $ | 71,852 | |
| |
Real Estate Owned | | | | | | | | | | $ | 15,708 | | | $ | 19,660 | |
| |
Equity Interests(2) — Companies more than 25% owned
(Guarantees — $6,871) | | | | | | $ | 15,189 | | | $ | 26,671 | |
| |
| | Total commercial real estate finance | | | | | | | | | | $ | 103,546 | | | $ | 118,183 | |
| |
| Total portfolio | | | | | | | | | | $ | 4,600,909 | | | $ | 4,496,084 | |
| |
| | | | | | | | | | | | | | | |
| | | Yield | | | Cost | | | Value | |
| | | | | | | | | | |
Liquidity Portfolio(14) | | | | | | | | | | | | |
| | American Beacon Money Market Select FD Fund | | | 5.3% | | | $ | 85,672 | | | $ | 85,672 | |
| | Certificate of Deposit (Due March 2007) | | | 5.6% | | | | 40,565 | | | | 40,565 | |
| | American Beacon Money Market Fund | | | 5.2% | | | | 40,384 | | | | 40,384 | |
| | SEI Daily Income Tr Prime Obligation Money Market Fund | | | 5.2% | | | | 34,671 | | | | 34,671 | |
| | Blackrock Liquidity Funds | | | 5.2% | | | | 476 | | | | 476 | |
| |
| | | Total liquidity portfolio | | | | | | $ | 201,768 | | | $ | 201,768 | |
| |
Other Investments in Money Market Securities(14) | | | | | | | | | | | | |
| | Columbia Treasury Reserves Money Market Fund | | | 5.2% | | | $ | 441 | | | $ | 441 | |
| | Columbia Money Market Reserves | | | 5.2% | | | $ | 1 | | | $ | 1 | |
| |
| | | | | | | | | | | | | |
(1) Interest rates represent the weighted average annual stated interest rate on loans and debt securities, which are presented by nature of indebtedness for
a single issuer. The maturity dates represent the earliest and the latest maturity dates. |
| (2) Common stock, preferred stock, warrants, options, and equity interests are generally non-income producing and restricted. |
| (3) Public company. |
| (4) Non-U.S. company or principal place of business outside the U.S. |
| (5) Non-registered investment company. |
| (13) Commercial mortgage loans totaling $18.9 million at value were on non-accrual status and therefore were considered non-income producing. |
| (14) Included in investments in money market and other securities on the accompanying Consolidated Balance Sheet. |
The accompanying notes are an integral part of these consolidated financial statements.
102
ALLIED CAPITAL CORPORATION AND SUBSIDIARIES
NOTES TO CONSOLIDATED FINANCIAL STATEMENTS
Note 1. Organization
Allied Capital Corporation, a Maryland corporation, is a closed-end, non-diversified management investment company that has elected to be regulated as a business development company (“BDC”) under the Investment Company Act of 1940 (“1940 Act”). Allied Capital Corporation (“ACC”) has a real estate investment trust subsidiary, Allied Capital REIT, Inc. (“Allied REIT”), and several subsidiaries that are single member limited liability companies established for specific purposes including holding real estate properties. ACC also has a subsidiary, A.C. Corporation (“AC Corp”), that generally provides diligence and structuring services, as well as transaction, management, consulting, and other services, including underwriting and arranging senior loans, to the Company and its portfolio companies.
ACC and its subsidiaries, collectively, are referred to as the “Company.” The Company consolidates the results of its subsidiaries for financial reporting purposes.
Pursuant to Article 6 of Regulation S-X, the financial results of the Company’s portfolio investments are not consolidated in the Company’s financial statements. Portfolio investments are held for purposes of deriving investment income and future capital gains.
The investment objective of the Company is to achieve current income and capital gains. In order to achieve this objective, the Company has primarily invested in debt and equity securities of private companies in a variety of industries.
Note 2. Summary of Significant Accounting Policies
Basis of Presentation
The consolidated financial statements include the accounts of ACC and its subsidiaries. All intercompany accounts and transactions have been eliminated in consolidation. Certain reclassifications have been made to the 2006 and 2005 balances to conform with the 2007 financial statement presentation.
The private finance portfolio and the interest and related portfolio income and net realized gains (losses) on the private finance portfolio are presented in three categories: companies more than 25% owned, which represent portfolio companies where the Company directly or indirectly owns more than 25% of the outstanding voting securities of such portfolio company or where the Company controls the portfolio company’s board of directors and, therefore, are deemed controlled by the Company under the 1940 Act; companies owned 5% to 25%, which represent portfolio companies where the Company directly or indirectly owns 5% to 25% of the outstanding voting securities of such portfolio company or where the Company holds one or more seats on the portfolio company’s board of directors and, therefore, are deemed to be an affiliated person under the 1940 Act; and companies less than 5% owned which represent portfolio companies where the Company directly or indirectly owns less than 5% of the outstanding voting securities of such portfolio company and where the Company has no other affiliations with such portfolio company. The interest and related portfolio income and net realized gains (losses) from the commercial real estate finance portfolio and other sources, including investments in money market and other securities, are included in the companies less than 5% owned category on the consolidated statement of operations.
In the ordinary course of business, the Company enters into transactions with portfolio companies that may be considered related party transactions.
| |
| | Valuation Of Portfolio Investments |
The Company, as a BDC, has invested in illiquid securities including debt and equity securities of companies, CLO bonds and preferred shares/income notes, and CDO bonds. The Company’s investments may be subject to certain restrictions on resale and generally have no established trading market. The Company values substantially all of its investments at fair value as determined in good faith by the Board
103
ALLIED CAPITAL CORPORATION AND SUBSIDIARIES
NOTES TO CONSOLIDATED FINANCIAL STATEMENTS — (Continued)
Note 2. Summary of Significant Accounting Policies, continued
of Directors in accordance with the Company’s valuation policy. The Company determines fair value to be the amount for which an investment could be exchanged in an orderly disposition over a reasonable period of time between willing parties other than in a forced or liquidation sale. The Company’s valuation policy considers the fact that no ready market exists for substantially all of the securities in which it invests. The Company’s valuation policy is intended to provide a consistent basis for determining the fair value of the portfolio. The Company will record unrealized depreciation on investments when it believes that an investment has become impaired, including where collection of a loan or realization of an equity security is doubtful, or when the enterprise value of the portfolio company does not currently support the cost of the Company’s debt or equity investments. Enterprise value means the entire value of the company to a potential buyer, including the sum of the values of debt and equity securities used to capitalize the enterprise at a point in time. The Company will record unrealized appreciation if it believes that the underlying portfolio company has appreciated in value and/or the Company’s equity security has also appreciated in value. The value of investments in publicly traded securities is determined using quoted market prices discounted for restrictions on resale, if any.
| |
| | Loans and Debt Securities |
The Company’s loans and debt securities generally do not trade. The Company typically exits its loans and debt securities upon the sale or recapitalization of the portfolio company. Therefore, the Company generally determines the enterprise value of the portfolio company and then allocates that value to the loans and debt securities in order of the legal priority of contractual obligations, with the remaining value, if any, going to the portfolio company’s outstanding equity securities. For loans and debt securities, fair value generally approximates cost unless the borrower’s enterprise value, overall financial condition or other factors lead to a determination of fair value at a different amount. The value of loan and debt securities may be greater than the Company’s cost basis if the amount that would be repaid on the loan or debt security upon the sale or recapitalization of the portfolio company is greater than the Company’s cost basis.
When the Company receives nominal cost warrants or free equity securities (“nominal cost equity”), the Company allocates its cost basis in its investment between its debt securities and its nominal cost equity at the time of origination. At that time, the original issue discount basis of the nominal cost equity is recorded by increasing the cost basis in the equity and decreasing the cost basis in the related debt securities.
Interest income is recorded on an accrual basis to the extent that such amounts are expected to be collected. For loans and debt securities with contractual payment-in-kind interest, which represents contractual interest accrued and added to the loan balance that generally becomes due at maturity, the Company will not accrue payment-in-kind interest if the portfolio company valuation indicates that the payment-in-kind interest is not collectible. In general, interest is not accrued on loans and debt securities if the Company has doubt about interest collection or where the enterprise value of the portfolio company may not support further accrual. Loans in workout status do not accrue interest. In addition, interest may not accrue on loans or debt securities to portfolio companies that are more than 50% owned by the Company depending on such company’s capital requirements. Loan origination fees, original issue discount, and market discount are capitalized and then amortized into interest income using a method that approximates the effective interest method. Upon the prepayment of a loan or debt security, any unamortized loan origination fees are recorded as interest income and any unamortized original issue discount or market discount is recorded as a realized gain.
104
ALLIED CAPITAL CORPORATION AND SUBSIDIARIES
NOTES TO CONSOLIDATED FINANCIAL STATEMENTS — (Continued)
Note 2. Summary of Significant Accounting Policies, continued
The weighted average yield on loans and debt securities is computed as the (a) annual stated interest on accruing loans and debt securities plus the annual amortization of loan origination fees, original issue discount, and market discount on accruing loans and debt securities less the annual amortization of loan origination costs, divided by (b) total loans and debt securities at value. The weighted average yield is computed as of the balance sheet date.
The Company’s equity securities in portfolio companies for which there is no liquid public market are valued at fair value based on the enterprise value of the portfolio company, which is determined using various factors, including cash flow from operations of the portfolio company, multiples at which private companies are bought and sold, and other pertinent factors, such as recent offers to purchase a portfolio company, recent transactions involving the purchase or sale of the portfolio company’s equity securities, liquidation events, or other events. The determined equity values are generally discounted when the company has a minority ownership position, restrictions on resale, specific concerns about the receptivity of the capital markets to a specific company at a certain time, or other factors.
The value of the Company’s equity investments in private debt and equity funds are generally valued at the fund’s net asset value. The value of the Company’s equity securities in public companies for which market quotations are readily available is based on the closing public market price on the balance sheet date. Securities that carry certain restrictions on sale are typically valued at a discount from the public market value of the security.
Dividend income on preferred equity securities is recorded as dividend income on an accrual basis to the extent that such amounts are expected to be collected and to the extent that the Company has the option to receive the dividend in cash. Dividend income on common equity securities is recorded on the record date for private companies or on the ex-dividend date for publicly traded companies.
Collateralized Loan Obligations (“CLO”) and Collateralized Debt Obligations (“CDO”)
CLO bonds and preferred shares/ income notes and CDO bonds (“CLO/ CDO Assets”) are carried at fair value, which is based on a discounted cash flow model that utilizes prepayment, re-investment and loss assumptions based on historical experience and projected performance, economic factors, the characteristics of the underlying cash flow, and comparable yields for similar bonds and preferred shares/income notes, when available. The Company recognizes unrealized appreciation or depreciation on its CLO/ CDO Assets as comparable yields in the market change and/or based on changes in estimated cash flows resulting from changes in prepayment, re-investment or loss assumptions in the underlying collateral pool. The Company determines the fair value of its CLO/CDO Assets on an individual security-by-security basis.
The Company recognizes interest income on the preferred shares/income notes using the effective interest method, based on the anticipated yield and the estimated cash flows over the projected life of the investment. Yields are revised when there are changes in actual or estimated cash flows due to changes in prepayments and/or re-investments, credit losses or asset pricing. Changes in estimated yield are recognized as an adjustment to the estimated yield over the remaining life of the preferred shares/income notes from the date the estimated yield was changed. CLO and CDO bonds have stated interest rates. The weighted average yield on the CLO/CDO Assets is calculated as the (a) annual stated interest or the effective interest yield on the accruing bonds or the effective yield on the preferred shares/income notes, divided by (b) CLO/CDO Assets at value. The weighted average yields are computed as of the balance sheet date.
105
ALLIED CAPITAL CORPORATION AND SUBSIDIARIES
NOTES TO CONSOLIDATED FINANCIAL STATEMENTS — (Continued)
Note 2. Summary of Significant Accounting Policies, continued
| |
| | Net Realized Gains or Losses and Net Change in Unrealized Appreciation or Depreciation |
Realized gains or losses are measured by the difference between the net proceeds from the repayment or sale and the cost basis of the investment without regard to unrealized appreciation or depreciation previously recognized, and include investments charged off during the year, net of recoveries. Net change in unrealized appreciation or depreciation primarily reflects the change in portfolio investment values during the reporting period, including the reversal of previously recorded unrealized appreciation or depreciation when gains or losses are realized. Net change in unrealized appreciation or depreciation also reflects the change in the value of U.S. Treasury bills and deposits of proceeds from sales of borrowed Treasury securities, if any, and depreciation on accrued interest and dividends receivable and other assets where collection is doubtful.
Fee income includes fees for loan prepayment premiums, guarantees, commitments, and services rendered by the Company to portfolio companies and other third parties such as diligence, structuring, transaction services, management and consulting services, and other services. Loan prepayment premiums are recognized at the time of prepayment. Guaranty and commitment fees are generally recognized as income over the related period of the guaranty or commitment, respectively. Diligence, structuring, and transaction services fees are generally recognized as income when services are rendered or when the related transactions are completed. Management, consulting and other services fees are generally recognized as income as the services are rendered.
Guarantees meeting the characteristics described in FASB Interpretation No. 45,Guarantor’s Accounting and Disclosure Requirements for Guarantees, Including Indirect Guarantees of Indebtedness of Others and issued or modified after December 31, 2002, are recognized at fair value at inception. Guarantees made on behalf of portfolio companies are considered in determining the fair value of the Company’s investments. See Note 5.
Debt financing costs are based on actual costs incurred in obtaining debt financing and are deferred and amortized as part of interest expense over the term of the related debt instrument using a method that approximates the effective interest method. Costs associated with the issuance of common stock are recorded as a reduction to the proceeds from the sale of common stock. Financing costs generally include underwriting, accounting and legal fees, and printing costs.
| |
| | Dividends to Shareholders |
Dividends to shareholders are recorded on the record date.
The Company has a stock-based employee compensation plan. See Note 9. Effective January 1, 2006, the Company adopted the provisions of FASB Statement No. 123 (Revised 2004),Share-Based Payment(“SFAS 123R”). SFAS 123R was adopted using the modified prospective method of application, which required the Company to recognize compensation costs on a prospective basis beginning January 1, 2006. Accordingly, the Company did not restate prior year financial statements. Under this method, the
106
ALLIED CAPITAL CORPORATION AND SUBSIDIARIES
NOTES TO CONSOLIDATED FINANCIAL STATEMENTS — (Continued)
Note 2. Summary of Significant Accounting Policies, continued
unamortized cost of previously awarded options that were unvested as of January 1, 2006, is recognized over the remaining service period in the statement of operations beginning in 2006, using the fair value amounts determined for pro forma disclosure under SFAS 123R. With respect to options granted on or after January 1, 2006, compensation cost based on estimated grant date fair value is recognized over the related service period in the consolidated statement of operations. The stock option expense for the years ended December 31, 2007 and 2006, was as follows:
| | | | | | | | | | | | |
| | | 2007 | | | 2006 | |
| ($ in millions, except per share amounts) | | | | | | |
| Employee Stock Option Expense: | | | | | | | | |
| | Options granted: | | | | | | | | |
| | | Previously awarded, unvested options as of January 1, 2006 | | $ | 10.1 | | | $ | 13.2 | |
| | | Options granted on or after January 1, 2006 | | | 10.7 | | | | 2.4 | |
| | | | | | | |
| | | | Total options granted | | | 20.8 | | | | 15.6 | |
| | | Options cancelled in connection with tender offer (see Note 9) | | | 14.4 | | | | — | |
| | | | | | | |
| | | Total employee stock option expense | | $ | 35.2 | | | $ | 15.6 | |
| | | | | | | |
| | | Per basic share | | $ | 0.23 | | | $ | 0.11 | |
| | | Per diluted share | | $ | 0.23 | | | $ | 0.11 | |
In addition to the employee stock option expense for options granted, for both the years ended December 31, 2007 and 2006, administrative expense included $0.2 million of expense related to options granted to directors during each year. Options were granted to non-officer directors in the second quarters of 2007 and 2006. Options granted to non-officer directors vest on the grant date and therefore, the full expense is recorded on the grant date.
Prior to January 1, 2006, the Company accounted for this plan under the recognition and measurement principles of APB Opinion No. 25,Accounting for Stock Issued to Employees, and related interpretations. Prior to January 1, 2006, no stock-based compensation cost was reflected in net increase in net assets resulting from operations, as all options granted under this plan had an exercise price equal to the market value of the underlying common stock on the date of grant. The following table illustrates the effect on net increase in net assets resulting from operations and earnings per share if the Company had
107
ALLIED CAPITAL CORPORATION AND SUBSIDIARIES
NOTES TO CONSOLIDATED FINANCIAL STATEMENTS — (Continued)
Note 2. Summary of Significant Accounting Policies, continued
applied the fair value recognition provisions of FASB Statement No. 123,Accounting for Stock-Based Compensation, to stock-based compensation for the year ended December 31, 2005.
| | | | | | |
| | | 2005 | |
| ($ in millions, except per share amounts) | | | |
| Net increase in net assets resulting from operations as reported | | $ | 872.8 | |
| Less total stock-based compensation expense determined under fair value based method for all awards, net of related tax effects | | | (12.7 | ) |
| | | | |
| Pro forma net increase in net assets resulting from operations | | | 860.1 | |
| Less preferred stock dividends | | | — | |
| | | | |
| Pro forma net income available to common shareholders | | $ | 860.1 | |
| | | | |
| Basic earnings per common share: | | | | |
| | As reported | | $ | 6.48 | |
| | Pro forma | | $ | 6.39 | |
| Diluted earnings per common share: | | | | |
| | As reported | | $ | 6.36 | |
| | Pro forma | | $ | 6.27 | |
Options Granted. The stock option expense for options granted for 2007 and 2006, and the pro forma expense for 2005 shown in the tables above were based on the underlying value of the options granted by the Company. The fair value of each option grant was estimated on the date of grant using the Black-Scholes option pricing model and expensed over the vesting period. The following weighted average assumptions were used to calculate the fair value of options granted during the years ended December 31, 2007, 2006, and 2005:
| | | | | | | | | | | | | |
| | | 2007 | | | 2006 | | | 2005 | |
| | | | | | | | | | |
| Expected term (in years) | | | 5.0 | | | | 5.0 | | | | 5.0 | |
| Risk-free interest rate | | | 4.6 | % | | | 4.8 | % | | | 4.1 | % |
| Expected volatility | | | 26.4 | % | | | 29.1 | % | | | 35.1 | % |
| Dividend yield | | | 8.9 | % | | | 9.0 | % | | | 9.0 | % |
| Weighted average fair value per option | | $ | 2.96 | | | $ | 3.47 | | | $ | 3.94 | |
The expected term of the options granted represents the period of time that such options are expected to be outstanding. To determine the expected term of the options, the Company used historical data to estimate option exercise time frames, including considering employee terminations. The risk free rate was based on the U.S. Treasury bond yield curve at the date of grant consistent with the expected term. Expected volatilities were determined based on the historical volatility of the Company’s common stock over a historical time period consistent with the expected term. The dividend yield was determined based on the Company’s historical dividend yield over a historical time period consistent with the expected term.
To determine the stock options expense for options granted, the calculated fair value of the options granted is applied to the options granted, net of assumed future option forfeitures. The Company estimates that the employee-related stock option expense for outstanding unvested options as of December 31, 2007, will be approximately $9.7 million and $2.8 million for the years ended December 31, 2008 and 2009, respectively. This estimate may change if the Company’s assumptions related to future option forfeitures change. This estimate does not include any expense related to stock option grants after December 31, 2007, as the fair value of those stock options will be determined at the time of grant. The aggregate total
108
ALLIED CAPITAL CORPORATION AND SUBSIDIARIES
NOTES TO CONSOLIDATED FINANCIAL STATEMENTS — (Continued)
Note 2. Summary of Significant Accounting Policies, continued
stock option expense remaining as of December 31, 2007, is expected to be recognized over an estimated weighted-average period of 1.0 year.
Options Cancelled in Connection with Tender Offer. As discussed in Note 9, the Company completed a tender offer in July 2007, whereby the Company accepted for cancellation 10.3 million vested options held by employees and non-officer directors of the Company in exchange for an option cancellation payment (“OCP”). The OCP was equal to the “in-the-money” value of the stock options cancelled, determined using the Weighted Average Market Price of $31.75, and was paid one-half in cash and one-half in unregistered shares of the Company’s common stock. In accordance with the terms of the tender offer, the Weighted Average Market Price represented the volume weighted average price of the Company’s common stock over the fifteen trading days preceding the first day of the offer period, or June 20, 2007. Because the Weighted Average Market Price at the commencement of the tender offer on June 20, 2007, was higher than the market price of the Company’s common stock at the close of the offer on July 18, 2007, SFAS 123R required the Company to record a non-cash employee-related stock option expense of $14.4 million and administrative expense related to stock options cancelled that were held by non-officer directors of $0.4 million. The same amounts were recorded as an increase to additional paid-in capital and, therefore, had no effect on the Company’s net asset value. The portion of the OCP paid in cash of $52.8 million reduced the Company’s additional paid-in capital and therefore reduced the Company’s net asset value. For income tax purposes, the Company’s tax deduction resulting from the OCP will be similar to the tax deduction that would have resulted from an exercise of stock options in the market. Any tax deduction for the Company resulting from the OCP or an exercise of stock options in the market is limited by Section 162(m) of the Internal Revenue Code (“Code”).
| |
| | Federal and State Income Taxes and Excise Tax |
The Company intends to comply with the requirements of the Code that are applicable to regulated investment companies (“RIC”) and real estate investment trusts (“REIT”). ACC and any subsidiaries that qualify as a RIC or a REIT intend to distribute or retain through a deemed distribution all of their annual taxable income to shareholders; therefore, the Company has made no provision for income taxes exclusive of excise taxes for these entities.
If the Company does not distribute at least 98% of its annual taxable income in the year earned, the Company will generally be required to pay an excise tax equal to 4% of the amount by which 98% of the Company’s annual taxable income exceeds the distributions from such taxable income during the year earned. To the extent that the Company determines that its estimated current year annual taxable income will be in excess of estimated current year dividend distributions from such taxable income, the Company accrues excise taxes on estimated excess taxable income as taxable income is earned using an annual effective excise tax rate. The annual effective excise tax rate is determined by dividing the estimated annual excise tax by the estimated annual taxable income.
Income taxes for AC Corp are accounted for under the asset and liability method. Deferred tax assets and liabilities are recognized for the future tax consequences attributable to differences between the financial statement carrying amounts of existing assets and liabilities and their respective tax bases as well as operating loss and tax credit carryforwards. Deferred tax assets and liabilities are measured using enacted tax rates expected to apply to taxable income in the years in which those temporary differences are expected to be recovered or settled.
109
ALLIED CAPITAL CORPORATION AND SUBSIDIARIES
NOTES TO CONSOLIDATED FINANCIAL STATEMENTS — (Continued)
Note 2. Summary of Significant Accounting Policies, continued
Basic earnings per common share is calculated using the weighted average number of common shares outstanding for the year presented. Diluted earnings per common share reflects the potential dilution that could occur if options to issue common stock were exercised into common stock. Earnings per share is computed after subtracting dividends on preferred shares, if any.
| |
| | Use of Estimates in the Preparation of Financial Statements |
The preparation of financial statements in conformity with U.S. generally accepted accounting principles requires management to make estimates and assumptions that affect the reported amounts of assets and liabilities and disclosure of contingent assets and liabilities at the date of the financial statements and the reported amounts of revenue and expenses during the reporting period. Actual results could differ from these estimates.
The consolidated financial statements include portfolio investments at value of $4.8 billion and $4.5 billion at December 31, 2007 and 2006, respectively. At both December 31, 2007 and 2006, 92% of the Company’s total assets represented portfolio investments whose fair values have been determined by the Board of Directors in good faith in the absence of readily available market values. Because of the inherent uncertainty of valuation, the Board of Directors’ determined values may differ significantly from the values that would have been used had a ready market existed for the investments, and the differences could be material.
| |
| Recent Accounting Pronouncements |
In June 2006, the FASB issued Interpretation No. 48,Accounting for Uncertainty in Income Taxes, which clarifies the accounting for uncertainty in income taxes recognized in an enterprise’s financial statements in accordance with FASB Statement No. 109,Accounting for Income Taxes.This interpretation is effective for fiscal years beginning after December 15, 2006. The adoption of this interpretation did not have a significant effect on the Company’s consolidated financial position or its results of operations.
In September 2006, the FASB issued Statement No. 157,Fair Value Measurements.This statement defines fair value, establishes a framework for measuring fair value in generally accepted accounting principles, and expands disclosures about fair value measurements. This statement is effective for financial statements issued for fiscal years beginning after November 15, 2007, and interim periods within those fiscal years. The Company is currently analyzing the effect of adoption of this statement on its consolidated financial position, including its net asset value, and results of operations. The Company will adopt this statement on a prospective basis beginning in the quarter ending March 31, 2008. Adoption of this statement could have a material effect on the Company’s consolidated financial statements, including the Company’s net asset value. However, the actual impact on its consolidated financial statements in the period of adoption and subsequent to the period of adoption cannot be determined at this time as it will be influenced by the estimates of fair value for that period and the number and amount of investments the Company originates, acquires or exits.
In February 2007, the FASB issued Statement No. 159,The Fair Value Option for Financial Assets and Financial Liabilities — Including an Amendment of FASB Statement No. 115.This statement permits an entity to choose to measure many financial instruments and certain other items at fair value. This statement applies to all reporting entities, and contains financial statement presentation and disclosure requirements for assets and liabilities reported at fair value as a consequence of the election. This
110
ALLIED CAPITAL CORPORATION AND SUBSIDIARIES
NOTES TO CONSOLIDATED FINANCIAL STATEMENTS — (Continued)
Note 2. Summary of Significant Accounting Policies, continued
statement is effective for fiscal years beginning after November 15, 2007, and interim periods within those fiscal years. The Company does not intend to elect fair value measurement for assets or liabilities other than portfolio investments, which are already measured at fair value, therefore, the Company does not believe the adoption of this statement will have a significant effect on the Company’s consolidated financial position or its results of operations.
Note 3. Portfolio
At December 31, 2007 and 2006, the private finance portfolio consisted of the following:
| | | | | | | | | | | | | | | | | | | | | | | | | | | |
| | | 2007 | | | 2006 | |
| | | | | | | |
| | | Cost | | | Value | | | Yield(1) | | | Cost | | | Value | | | Yield(1) | |
| ($ in millions) | | | | | | | | | | | | | | | | | | |
| Loans and debt securities: | | | | | | | | | | | | | | | | | | | | | | | | |
| | Senior loans | | $ | 374.1 | | | | 344.3 | | | | 7.7 | % | | $ | 450.0 | | | $ | 405.2 | | | | 8.4 | % |
| | Unitranche debt(2) | | | 659.2 | | | | 653.9 | | | | 11.5 | % | | | 800.0 | | | | 799.2 | | | | 11.2 | % |
| | Subordinated debt | | | 2,576.4 | | | | 2,416.4 | | | | 12.8 | % | | | 2,038.3 | | | | 1,980.8 | | | | 12.9 | % |
| | | | | | | | | | | | | | | | | | | |
| | | Total loans and debt securities(3) | | | 3,609.7 | | | | 3,414.6 | | | | 12.1 | % | | | 3,288.3 | | | | 3,185.2 | | | | 11.9 | % |
| Equity securities: | | | | | | | | | | | | | | | | | | | | | | | | |
| | Preferred shares/income notes of CLOs(4) | | | 218.3 | | | | 203.0 | | | | 14.6 | % | | | 101.1 | | | | 97.2 | | | | 15.5 | % |
| | Other equity securities | | | 1,215.9 | | | | 1,041.7 | | | | | | | | 1,108.0 | | | | 1,095.5 | | | | | |
| | | | | | | | | | | | | | | | | | | |
| | | Total equity securities | | | 1,434.2 | | | | 1,244.7 | | | | | | | | 1,209.1 | | | | 1,192.7 | | | | | |
| | | | | | | | | | | | | | | | | | | |
| | | Total | | $ | 5,043.9 | | | $ | 4,659.3 | | | | | | | $ | 4,497.4 | | | $ | 4,377.9 | | | | | |
| | | | | | | | | | | | | | | | | | | |
| |
| (1) | The weighted average yield on loans and debt securities is computed as the (a) annual stated interest on accruing loans and debt securities plus the annual amortization of loan origination fees, original issue discount, and market discount on accruing loans and debt securities less the annual amortization of loan origination costs, divided by (b) total loans and debt securities at value. At December 31, 2007 and 2006, the cost and value of subordinated debt included the Class A equity interests in Ciena Capital LLC, which were placed on non-accrual status during the fourth quarter of 2006. |
| |
| | The weighted average yield on the preferred shares/income notes of CLOs is calculated as the (a) effective interest yield on the preferred shares/income notes of CLOs, divided by (b) total preferred shares/income notes of CLOs at value. The weighted average yields are computed as of the balance sheet date. The yield on the CLO assets represents the yield used for recording interest income. The market yield used in the valuation of the CLO assets may be different than the interest yields. |
| |
| (2) | Unitranche debt is generally in a first lien position. |
| |
| (3) | The total principal balance outstanding on loans and debt securities was $3,639.6 million and $3,322.3 million at December 31, 2007 and 2006, respectively. The difference between principal and cost is represented by unamortized loan origination fees and costs, original issue discounts, and market discounts totaling $29.9 million and $34.0 million at December 31, 2007 and 2006, respectively. |
| |
| (4) | Investments in the preferred shares/income notes of CLOs earn a current return that is included in interest income in the accompanying consolidated statement of operations. |
The Company’s private finance investment activity principally involves providing financing through privately negotiated long-term debt and equity investments. The Company’s private finance debt and equity investments are generally issued by private companies and are generally illiquid and may be subject to certain restrictions on resale.
The Company’s private finance debt investments are generally structured as loans and debt securities that carry a relatively high fixed rate of interest, which may be combined with equity features, such as
111
ALLIED CAPITAL CORPORATION AND SUBSIDIARIES
NOTES TO CONSOLIDATED FINANCIAL STATEMENTS — (Continued)
Note 3. Portfolio, continued
conversion privileges, or warrants or options to purchase a portion of the portfolio company’s equity at a pre-determined strike price, which is generally a nominal price for warrants or options in a private company. The annual stated interest rate is only one factor in pricing the investment relative to the Company’s rights and priority in the portfolio company’s capital structure, and will vary depending on many factors, including if the Company has received nominal cost equity or other components of investment return, such as loan origination fees or market discount. The stated interest rate may include some component of contractual payment-in-kind interest, which represents contractual interest accrued and added to the loan balance that generally becomes due at maturity.
At both December 31, 2007 and 2006, 86% of the private finance loans and debt securities had a fixed rate of interest and 14% had a floating rate of interest. Senior loans may carry a fixed rate of interest or a floating rate of interest, usually set as a spread over LIBOR, and may require payments of both principal and interest throughout the life of the loan. Senior loans generally have contractual maturities of three to six years and interest is generally paid to the Company monthly or quarterly. Unitranche debt generally carries a fixed rate of interest. Unitranche debt generally requires payments of both principal and interest throughout the life of the loan. Unitranche debt generally has contractual maturities of five to six years and interest is generally paid to the Company quarterly. Subordinated debt generally carries a fixed rate of interest generally with contractual maturities of five to ten years and generally has interest-only payments in the early years and payments of both principal and interest in the later years, although maturities and principal amortization schedules may vary. Interest on subordinated debt is generally paid to the Company quarterly.
Equity securities consist primarily of securities issued by private companies and may be subject to certain restrictions on their resale and are generally illiquid. The Company may make equity investments for minority stakes in portfolio companies or may receive equity features, such as nominal cost warrants, in conjunction with its debt investments. The Company may also invest in the equity (preferred and/or voting or non-voting common) of a portfolio company where the Company’s equity ownership may represent a significant portion of the equity, but may or may not represent a controlling interest. If the Company invests in non-voting equity in a buyout investment, the Company generally has the option to acquire a controlling stake in the voting securities of the portfolio company at fair market value. The Company may incur costs associated with making buyout investments that will be included in the cost basis of the Company’s equity investment. These include costs such as legal, accounting and other professional fees associated with diligence, referral and investment banking fees, and other costs. Equity securities generally do not produce a current return, but are held with the potential for investment appreciation and ultimate gain on sale.
Ciena Capital LLC. Ciena Capital LLC (f/k/a Business Loan Express, LLC) (Ciena) focuses on loan products that provide financing to commercial real estate owners and operators. Ciena is also a participant in the Small Business Administration’s 7(a) Guaranteed Loan Program and its wholly-owned subsidiary is licensed by the SBA as a Small Business Lending Company (SBLC). Ciena is headquartered in New York, NY.
At December 31, 2007, the Company’s investment in Ciena totaled $327.8 million at cost and $68.6 million at value, after the effect of unrealized depreciation of $259.2 million. At December 31, 2006, the Company’s investment in Ciena totaled $295.3 million at cost and $210.7 million at value, after the effect of unrealized depreciation of $84.6 million. In 2007, the Company increased its investment in Ciena by $32.4 million. The Company acquired $29.2 million in additional Class A equity interests to fund payments to the SBA discussed below and to provide additional capital to Ciena. In addition, the Company purchased $3.2 million in Class A equity interests from Ciena’s former Chief Executive Officer.
112
ALLIED CAPITAL CORPORATION AND SUBSIDIARIES
NOTES TO CONSOLIDATED FINANCIAL STATEMENTS — (Continued)
Note 3. Portfolio, continued
Net change in unrealized appreciation or depreciation included a net decrease in the Company’s investment in Ciena of $174.5 million and $142.3 million for the years ended December 31, 2007 and 2006, respectively, and a net increase of $2.9 million for the year ended December 31, 2005.
Total interest and related portfolio income earned from the Company’s investment in Ciena for the years ended December 31, 2007, 2006, and 2005, was as follows:
| | | | | | | | | | | | | | |
| | | 2007 | | | 2006 | | | 2005 | |
| ($ in millions) | | | | | | | | | |
Interest income on subordinated debt and Class A equity interests(1) | | $ | — | | | $ | 11.9 | | | $ | 14.3 | |
Dividend income on Class B equity interests(1) | | | — | | | | — | | | | 14.0 | |
| Fees and other income | | | 5.4 | | | | 7.8 | | | | 9.2 | |
| | | | | | | | | | |
| | Total interest and related portfolio income | | $ | 5.4 | | | $ | 19.7 | | | $ | 37.5 | |
| | | | | | | | | | |
| |
| (1) | Interest and dividend income from Ciena for the years ended December 31, 2006 and 2005, included interest and dividend income of $5.7 million and $8.9 million, respectively, which was paid in kind. The interest and dividends paid in kind were paid to the Company through the issuance of additional debt or equity interests. |
In the fourth quarter of 2006, the Company placed its investment in Ciena’s 25% Class A equity interests on non-accrual status. As a result, there was no interest income from the Company’s investment in Ciena for the year ended December 31, 2007, and interest income for 2006 was lower as compared to 2005. In consideration for providing a guaranty on Ciena’s revolving credit facility and standby letters of credit (discussed below), the Company earned fees of $5.4 million, $6.1 million, and $6.3 million for the years ended December 31, 2007, 2006, and 2005, respectively, which were included in fees and other income. Ciena has not yet paid the $5.4 million in such fees earned by the Company in 2007. At December 31, 2007, such fees were included as a receivable in other assets. The Company considered this outstanding receivable in its valuation of Ciena at December 31, 2007. The remaining fees and other income in 2006 and 2005 relate to management fees from Ciena. The Company did not charge Ciena management fees in 2007 or in the fourth quarter of 2006.
The Company guarantees Ciena’s revolving credit facility that matures in March 2009. On January 30, 2008, Ciena completed an amendment of the terms of its revolving credit facility. The amendment reduced the commitments from the lenders under the facility from $500 million to $450 million at the effective date of the amendment, with further periodic reductions in total commitments to $325 million by December 31, 2008. In addition, certain financial and other covenants were amended. In connection with this amendment, the Company increased its unconditional guarantee from 60% to 100% of the total obligations under this facility (consisting of principal, letters of credit issued under the facility, accrued interest, and other fees) and agreed to replace $42.5 million in letters of credit issued under the Ciena credit facility with new letters of credit under the Company’s revolving line of credit. The guaranty of the Ciena revolving credit facility can be called by the lenders in the event of a default, which includes the occurrence of any event of default under the Company’s revolving credit facility, subject to grace periods in certain cases. The amendment also prohibits cash payments from Ciena to the Company for interest, guarantee fees, management fees, and dividends. On January 30, 2008, the principal amount outstanding on Ciena’s revolving credit facility was $351.9 million and letters of credit issued under the facility were $89.1 million, of which the Company replaced $42.5 million on January 31, 2008. Following the amendment of the revolving credit facility and the replacement of certain letters of credit by the Company, at January 31, 2008, amounts guaranteed under Ciena’s line of credit by the Company were $399.0 million, including $46.6 million of letters of credit issued under the facility. At
113
ALLIED CAPITAL CORPORATION AND SUBSIDIARIES
NOTES TO CONSOLIDATED FINANCIAL STATEMENTS — (Continued)
Note 3. Portfolio, continued
December 31, 2007, the total obligation guaranteed by the Company was $258.7 million, and the Company had provided four standby letters of credit totaling $18.0 million in connection with four term securitization transactions completed by Ciena.
Ciena relies on the asset-backed securitization market to finance its loan origination activity. That financing source is an unreliable one in the current capital markets, and as a result, Ciena has significantly curtailed loan origination activity, including loan originations under the SBA’s 7(a) Guaranteed Loan Program. Ciena continues to reposition its business. However, there is an inherent risk in this repositioning and the Company continues to work with Ciena on restructuring. Ciena maintains two non-recourse securitization warehouse facilities, and there is no assurance that Ciena will be able to refinance these facilities in the term securitization market. The Company has issued performance guaranties whereby the Company agreed to indemnify the warehouse providers for any damages, losses, liabilities and related costs and expenses that they may incur as a result of Ciena’s failure to perform any of its obligations as loan originator, loan seller or loan servicer under the warehouse securitizations.
The Office of the Inspector General of the SBA (OIG) and the United States Secret Service are conducting ongoing investigations of allegedly fraudulently obtained SBA-guaranteed loans issued by Ciena. Specifically, on or about January 9, 2007, Ciena became aware of an indictment captioned as the United States v. Harrington, No. 2:06-CR-20662 pending in the United States District Court for the Eastern District of Michigan. The indictment alleged that a former Ciena employee in the Detroit office engaged in the fraudulent origination of loans guaranteed, in substantial part, by the SBA. The Company understands that Ciena is working cooperatively with the U.S. Attorney’s Office and the investigating agencies with respect to this matter. On October 1, 2007, the former Ciena employee pled guilty to one count of conspiracy to fraudulently originate SBA-guaranteed loans and one count of making a false statement before a grand jury. The OIG and the U.S. Department of Justice are also conducting a civil investigation of Ciena’s lending practices in various jurisdictions. As an SBA lender, Ciena is also subject to other SBA and OIG audits, investigations, and reviews. In addition, the Office of the Inspector General of the U.S. Department of Agriculture is conducting an investigation of Ciena’s lending practices under the Business and Industry Loan (B&I) program. These investigations, audits and reviews are ongoing.
On March 6, 2007, Ciena entered into an agreement with the SBA. According to the agreement, Ciena remains a preferred lender in the SBA 7(a) Guaranteed Loan Program and retains the ability to sell loans into the secondary market. As part of this agreement, Ciena agreed to the immediate payment of approximately $10 million to the SBA to cover amounts paid by the SBA with respect to some of the SBA-guaranteed loans that have been the subject of the charges by the U.S. Attorney’s Office for the Eastern District of Michigan against Mr. Harrington. As part of the SBA’s increased oversight, the agreement provides that any loans originated and closed by Ciena during the term of the agreement will be reviewed by an independent third party selected by the SBA prior to the sale of such loans into the secondary market. The agreement also requires Ciena to repurchase the guaranteed portion of certain loans that default after having been sold into the secondary market, and subjects such loans to a similar third party review prior to any reimbursement of Ciena by the SBA. In connection with this agreement, Ciena also entered into an escrow agreement with the SBA and an escrow agent in which Ciena agreed to deposit $10 million with the escrow agent for any additional payments Ciena may be obligated to pay to the SBA in the future. Ciena remains subject to SBA rules and regulations and as a result may be required to make additional payments to the SBA in the ordinary course of business.
On or about January 16, 2007, Ciena and its subsidiary Business Loan Center LLC (BLC) became aware of a lawsuit titled, United States, ex rel James R. Brickman and Greenlight Capital, Inc. v. Business Loan Express LLC f/k/a Business Loan Express, Inc.; Business Loan Center LLC f/k/a Business Loan Center, Inc.; Robert Tannenhauser; Matthew McGee; and George Harrigan, 05-CV-3147 (JEC).
114
ALLIED CAPITAL CORPORATION AND SUBSIDIARIES
NOTES TO CONSOLIDATED FINANCIAL STATEMENTS — (Continued)
Note 3. Portfolio, continued
The complaint includes allegations arising under the False Claims Act and relating to alleged fraud in connection with SBA guarantees on shrimp vessel loans. On December 18, 2007, the United States District Court for the Northern District of Georgia dismissed all claims in this matter. In January 2008, the plaintiffs filed a notice of their intention to appeal the dismissal.
These investigations, audits, reviews, and litigation have had and may continue to have a material adverse impact on Ciena and, as a result, could continue to negatively affect the Company’s financial results. The Company has considered Ciena’s current regulatory issues, ongoing investigations, litigation, and the repositioning of its business in performing the valuation of Ciena at December 31, 2007. The Company is monitoring the situation.
At December 31, 2007 and 2006, the Company held all of the Class A equity interests, all of the Class B equity interests and 94.9% of the Class C equity interests.
At the time of the corporate reorganization of Business Loan Express, Inc. from a C corporation to a limited liability company in 2003, for tax purposes Ciena had a“built-in gain” representing the aggregate fair market value of its assets in excess of the tax basis of its assets. As a RIC, the Company will be subject to special built-in gain rules on the assets of Ciena. Under these rules, taxes will be payable by the Company at the time and to the extent that the built-in gains on Ciena’s assets at the date of reorganization are recognized in a taxable disposition of such assets in the10-year period following the date of the reorganization. At such time, the built-in gains, if any, realized upon the disposition of these assets will be included in the Company’s taxable income, net of the corporate level taxes paid by the Company on the built-in gains. At the date of Ciena’s reorganization, the Company estimated that its future tax liability resulting from the built-in gains may total up to a maximum of $40 million. However, if these assets are disposed of after the10-year period, there will be no corporate level taxes on these built-in gains. The Company has no obligation to pay the built-in gains tax until these assets or its interests in Ciena are disposed of in the future, within the 10-year period, at a value that would result in a tax liability. At December 31, 2006, the Company considered the impact on the fair value of its investment in Ciena due to Ciena’s tax attributes as an LLC and has also considered the impact on the fair value of its investment due to estimated built-in gain taxes, if any, in determining the fair value of its investment in Ciena. At December 31, 2007, there would be no built-in gain tax liability if the assets or the Company’s interests in Ciena were sold at the current valuation.
Mercury Air Centers, Inc.In April 2004, the Company completed the purchase of a majority ownership in Mercury Air Centers, Inc. (“Mercury”). At December 31, 2006, the Company’s investment in Mercury totaled $84.3 million at cost and $244.2 million at value, which included unrealized appreciation of $159.9 million.
In August 2007, the Company completed the sale of its majority equity interest in Mercury. For the year ended December 31, 2007, the Company realized a gain of $262.4 million, subject to post-closing adjustments. In addition, the Company was repaid approximately $51 million of subordinated debt outstanding to Mercury at closing.
Mercury owned and operated fixed base operations generally under long-term leases from local airport authorities, which consisted of terminal and hangar complexes that serviced the needs of the general aviation community. Mercury was headquartered in Richmond Heights, OH.
115
ALLIED CAPITAL CORPORATION AND SUBSIDIARIES
NOTES TO CONSOLIDATED FINANCIAL STATEMENTS — (Continued)
Note 3. Portfolio, continued
Total interest and related portfolio income earned from the Company’s investment in Mercury for the years ended December 31, 2007, 2006, and 2005, was as follows:
| | | | | | | | | | | | | | |
| | | 2007 | | | 2006 | | | 2005 | |
| ($ in millions) | | | | | | | | | |
| Interest income | | $ | 5.1 | | | $ | 9.3 | | | $ | 8.8 | |
| Fees and other income | | | 0.2 | | | | 0.6 | | | | 0.7 | |
| | | | | | | | | | |
| | Total interest and related portfolio income | | $ | 5.3 | | | $ | 9.9 | | | $ | 9.5 | |
| | | | | | | | | | |
Net change in unrealized appreciation or depreciation for the year ended December 31, 2007, included an increase in unrealized appreciation totaling $74.9 million for the first half of 2007 and the reversal of $234.8 million associated with the sale of the Company’s majority equity interest in the third quarter of 2007. Net change in unrealized appreciation or depreciation for the years ended December 31, 2006 and 2005, included an increase in unrealized appreciation of $106.1 million and $53.8 million, respectively, related to the Company’s investment in Mercury.
Advantage Sales and Marketing, Inc.In June 2004, the Company completed the purchase of a majority voting ownership in Advantage. Advantage is a sales and marketing agency providing outsourced sales, merchandising, and marketing services to the consumer packaged goods industry. Advantage has offices across the United States and is headquartered in Irvine, CA.
On March 29, 2006, the Company sold its majority equity interest in Advantage. The Company was repaid its $184 million in subordinated debt outstanding at closing. For the year ended December 31, 2006, the Company realized a gain on the sale of its equity investment of $434.4 million, subject to post-closing adjustments and excluding any earn-out amounts. The Company realized additional gains in 2007 resulting from post-closing adjustments and an earn-out payment totaling $3.4 million, subject to additional post-closing adjustments.
As consideration for the common stock sold in the transaction, the Company received a $150 million subordinated note, with the balance of the consideration paid in cash. In addition, a portion of the Company’s cash proceeds from the sale of the common stock were placed in escrow, subject to certain holdback provisions. At December 31, 2007, the amount of the escrow included in other assets in the accompanying consolidated balance sheet was approximately $25 million.
Total interest and related portfolio income earned from the Company’s investment in Advantage while the Company held a majority equity interest for the years ended December 31, 2006 and 2005, was $14.1 million and $37.4 million, respectively. Net change in unrealized appreciation or depreciation for the year ended December 31, 2006, included the reversal of $389.7 million of previously recorded unrealized appreciation associated with the realization of a gain on the sale of the Company’s majority equity interest in Advantage and for the year ended December 31, 2005, included an increase in unrealized appreciation of $378.4 million related to the Company’s majority equity interest investment in Advantage.
In connection with the sale transaction, the Company retained an equity investment in the business valued at $15 million at closing as a minority shareholder. During the fourth quarter of 2006, Advantage made a distribution on this minority equity investment, which reduced the Company’s cost basis to zero and resulted in a realized gain of $4.8 million.
The Company’s investment in Advantage at December 31, 2007, which was composed of subordinated debt and a minority equity interest, totaled $154.8 million at cost and $165.8 million at value. This investment was included in companies 5% to 25% owned in the consolidated financial statements as the Company continues to hold a seat on Advantage’s board of directors.
116
ALLIED CAPITAL CORPORATION AND SUBSIDIARIES
NOTES TO CONSOLIDATED FINANCIAL STATEMENTS — (Continued)
Note 3. Portfolio, continued
Collateralized Loan Obligations (“CLOs”) and Collateralized Debt Obligations (“CDOs”).At December 31, 2007 and 2006, the Company owned bonds and preferred shares/income notes in CLOs and bonds in a CDO as follows:
| | | | | | | | | | | | | | | | | | | | | | | | | | | |
| | | 2007 | | | 2006 | |
| | | | | | | |
| | | Cost | | | Value | | | Yield(1) | | | Cost | | | Value | | | Yield(1) | |
| ($ in millions) | | | | | | | | | | | | | | | | | | |
Bonds(2): | | | | | | | | | | | | | | | | | | | | | | | | |
| Callidus Debt Partners CDO Fund I, Ltd. | | $ | 28.4 | | | $ | 28.5 | | | | 14.0% | | | $ | 28.4 | | | $ | 28.4 | | | | 14.0% | |
| Callidus Debt Partners CLO Fund VI, Ltd. | | | 4.3 | | | | 4.3 | | | | 13.4% | | | | — | | | | — | | | | | |
| Callidus MAPS CLO Fund I LLC | | | 17.0 | | | | 16.1 | | | | 11.0% | | | | 17.0 | | | | 17.2 | | | | 10.8% | |
| Dryden XVIII Leveraged Loan 2007 Limited | | | 7.4 | | | | 7.4 | | | | 12.7% | | | | — | | | | — | | | | | |
| Knightsbridge CLO 2007-1 Limited | | | 22.0 | | | | 22.0 | | | | 14.1% | | | | — | | | | — | | | | | |
| Pangaea CLO 2007-1 Ltd. | | | 11.6 | | | | 11.6 | | | | 13.9% | | | | — | | | | — | | | | | |
| | | | | | | | | | | | | | | | | | | |
| | Total bonds | | | 90.7 | | | | 89.9 | | | | 13.3% | | | | 45.4 | | | | 45.6 | | | | 12.8% | |
Preferred Shares/ Income Notes(3): | | | | | | | | | | | | | | | | | | | | | | | | |
| Callidus Debt Partners CLO Fund III, Ltd. | | | 21.8 | | | | 20.0 | | | | 14.1% | | | | 23.3 | | | | 23.0 | | | | 12.8% | |
| Callidus Debt Partners CLO Fund IV, Ltd. | | | 12.3 | | | | 11.3 | | | | 16.1% | | | | 13.0 | | | | 13.0 | | | | 13.8% | |
| Callidus Debt Partners CLO Fund V, Ltd. | | | 14.0 | | | | 14.7 | | | | 19.3% | | | | 13.8 | | | | 13.8 | | | | 15.8% | |
| Callidus Debt Partners CLO Fund VI, Ltd. | | | 27.0 | | | | 27.0 | | | | 19.3% | | | | — | | | | — | | | | | |
| Callidus Debt Partners CLO Fund VII, Ltd. | | | 22.1 | | | | 22.1 | | | | 16.6% | | | | — | | | | — | | | | | |
| Callidus MAPS CLO Fund I LLC | | | 49.3 | | | | 36.1 | | | | 7.6% | | | | 51.0 | | | | 47.4 | | | | 17.1% | |
| Callidus MAPS CLO Fund II, Ltd. | | | 18.7 | | | | 18.7 | | | | 14.7% | | | | — | | | | — | | | | | |
| Dryden XVIII Leveraged Loan 2007 Limited | | | 21.9 | | | | 21.9 | | | | 14.2% | | | | — | | | | — | | | | | |
| Knightsbridge CLO 2007-1 Limited | | | 31.2 | | | | 31.2 | | | | 15.2% | | | | — | | | | — | | | | | |
| | | | | | | | | | | | | | | | | | | |
| | Total preferred shares/income notes | | | 218.3 | | | | 203.0 | | | | 14.6% | | | | 101.1 | | | | 97.2 | | | | 15.5% | |
| | | | | | | | | | | | | | | | | | | |
| | | Total | | $ | 309.0 | | | $ | 292.9 | | | | | | | $ | 146.5 | | | $ | 142.8 | | | | | |
| | | | | | | | | | | | | | | | | | | |
| |
| (1) | The weighted average yield is calculated as the (a) annual stated interest or the effective interest yield on the accruing bonds or the effective interest yield on the preferred shares/income notes, divided by (b) CLO and CDO assets at value. The market yield used in the valuation of the CLO and CDO assets may be different than the interest yields shown above. The yield on these debt and equity securities is included in interest income in the accompanying consolidated statement of operations. |
| |
| (2) | These securities are included in private finance subordinated debt. |
| |
| (3) | These securities are included in private finance equity securities. |
The initial yields on the cost basis of the CLO preferred shares and income notes are based on the estimated future cash flows expected to be paid to these CLO classes from the underlying collateral assets. As each CLO preferred share or income note ages, the estimated future cash flows are updated based on the estimated performance of the underlying collateral assets, and the respective yield on the cost basis is adjusted as necessary. As future cash flows are subject to uncertainties and contingencies that are difficult to predict and are subject to future events that may alter current assumptions, no assurance can be given that the anticipated yields to maturity will be achieved.
The bonds, preferred shares and income notes of the CLOs and CDO in which the Company has invested are junior in priority for payment of interest and principal to the more senior notes issued by the CLOs and CDO. Cash flow from the underlying collateral assets in the CLOs and CDO is generally allocated first to the senior bonds in order of priority, then any remaining cash flow is generally distributed to the preferred shareholders and income note holders. To the extent there are defaults and unrecoverable losses on the underlying collateral assets that result in reduced cash flows, the preferred shares/income notes will bear this loss first and then the subordinated bonds would bear any loss after the preferred
117
ALLIED CAPITAL CORPORATION AND SUBSIDIARIES
NOTES TO CONSOLIDATED FINANCIAL STATEMENTS — (Continued)
Note 3. Portfolio, continued
shares/income notes. At December 31, 2007 and 2006, the face value of the CLO and CDO assets held by the Company was subordinate to as much as 94% and 92%, respectively, of the face value of the securities outstanding in these CLOs and CDO.
At December 31, 2007 and 2006, the underlying collateral assets of these CLO and CDO issuances, consisting primarily of senior corporate loans, were issued by 671 issuers and 465 issuers, respectively, and had balances as follows:
| | | | | | | | | | |
| | | 2007 | | | 2006 | |
| ($ in millions) | | | | | | |
| Bonds | | $ | 288.5 | | | $ | 245.4 | |
| Syndicated loans | | | 4,122.7 | | | | 1,769.9 | |
Cash(1) | | | 104.4 | | | | 59.5 | |
| | | | | | | |
| | Total underlying collateral assets(2) | | $ | 4,515.6 | | | $ | 2,074.8 | |
| | | | | | | |
| |
| (1) | Includes undrawn liability amounts. |
| |
| (2) | At December 31, 2007 and 2006, the total face value of defaulted obligations was $18.4 million and $9.6 million, respectively, or approximately 0.4% and 0.5% respectively, of the total underlying collateral assets. |
Loans and Debt Securities on Non-Accrual Status. At December 31, 2007 and 2006, private finance loans and debt securities at value not accruing interest were as follows:
| | | | | | | | | | | |
| | | 2007 | | | 2006 | |
| ($ in millions) | | | | | | |
| Loans and debt securities in workout status | | | | | | | | |
| | Companies more than 25% owned | | $ | 114.1 | | | $ | 51.1 | |
| | Companies 5% to 25% owned | | | 11.7 | | | | 4.0 | |
| | Companies less than 5% owned | | | 23.8 | | | | 31.6 | |
| Loans and debt securities not in workout status | | | | | | | | |
| | Companies more than 25% owned | | | 21.4 | | | | 87.1 | |
| | Companies 5% to 25% owned | | | 13.4 | | | | 7.2 | |
| | Companies less than 5% owned | | | 13.3 | | | | 38.9 | |
| | | | | | | |
| | | Total | | $ | 197.7 | | | $ | 219.9 | |
| | | | | | | |
118
ALLIED CAPITAL CORPORATION AND SUBSIDIARIES
NOTES TO CONSOLIDATED FINANCIAL STATEMENTS — (Continued)
Note 3. Portfolio, continued
Industry and Geographic Compositions. The industry and geographic compositions of the private finance portfolio at value at December 31, 2007 and 2006, were as follows:
| | | | | | | | | | |
| | | 2007 | | | 2006 | |
| | | | | | | |
Industry | | | | | | | | |
| Business services | | | 37 | % | | | 39 | % |
| Consumer products | | | 25 | | | | 20 | |
| Industrial products | | | 10 | | | | 9 | |
| Financial services | | | 7 | | | | 9 | |
CLO/CDO(1) | | | 6 | | | | 3 | |
| Retail | | | 4 | | | | 6 | |
| Consumer services | | | 4 | | | | 6 | |
| Healthcare services | | | 3 | | | | 3 | |
| Other | | | 4 | | | | 5 | |
| | | | | | | |
| | Total | | | 100 | % | | | 100 | % |
| | | | | | | |
Geographic Region(2) | | | | | | | | |
| Mid-Atlantic | | | 36 | % | | | 31 | % |
| Midwest | | | 32 | | | | 30 | |
| Southeast | | | 17 | | | | 18 | |
| West | | | 14 | | | | 17 | |
| Northeast | | | 1 | | | | 4 | |
| | | | | | | |
| | Total | | | 100 | % | | | 100 | % |
| | | | | | | |
| |
| (1) | These funds primarily invest in senior corporate loans. Certain of these funds are managed by Callidus Capital, a portfolio company of Allied Capital. |
| |
| (2) | The geographic region for the private finance portfolio depicts the location of the headquarters for the Company’s portfolio companies. The portfolio companies may have a number of other locations in other geographic regions. |
| |
| | Commercial Real Estate Finance |
At December 31, 2007 and 2006, the commercial real estate finance portfolio consisted of the following:
| | | | | | | | | | | | | | | | | | | | | | | | | | |
| | | 2007 | | | 2006 | |
| | | | | | | |
| | | Cost | | | Value | | | Yield(1) | | | Cost | | | Value | | | Yield(1) | |
| ($ in millions) | | | | | | | | | | | | | | | | | | |
| Commercial mortgage loans | | $ | 65.9 | | | $ | 65.4 | | | | 6.8% | | | $ | 72.6 | | | $ | 71.9 | | | | 7.5% | |
| Real estate owned | | | 15.3 | | | | 21.3 | | | | | | | | 15.7 | | | | 19.6 | | | | | |
| Equity interests | | | 15.7 | | | | 34.5 | | | | | | | | 15.2 | | | | 26.7 | | | | | |
| | | | | | | | | | | | | | | | | | | |
| | Total | | $ | 96.9 | | | $ | 121.2 | | | | | | | $ | 103.5 | | | $ | 118.2 | | | | | |
| | | | | | | | | | | | | | | | | | | |
| |
| (1) | The weighted average yield on the commercial mortgage loans is computed as the (a) annual stated interest on accruing loans plus the annual amortization of loan origination fees, original issue discount, and market discount on accruing loans less the annual amortization of origination costs, divided by (b) total interest-bearing investments at value. The weighted average yield is computed as of the balance sheet date. |
Commercial Mortgage Loans and Equity Interests.The commercial mortgage loan portfolio contains loans that were originated by the Company or were purchased from third-party sellers. At December 31, 2007,
119
ALLIED CAPITAL CORPORATION AND SUBSIDIARIES
NOTES TO CONSOLIDATED FINANCIAL STATEMENTS — (Continued)
Note 3. Portfolio, continued
approximately 85% and 15% of the Company’s commercial mortgage loan portfolio was composed of fixed and adjustable interest rate loans, respectively. At December 31, 2006, approximately 96% and 4% of the Company’s commercial mortgage loan portfolio was composed of fixed and adjustable interest rate loans, respectively. At December 31, 2007 and 2006, loans with a value of $14.3 million and $18.9 million, respectively, were not accruing interest. Loans greater than 120 days delinquent generally do not accrue interest.
Equity interests consist primarily of equity securities issued by privately owned companies that invest in single real estate properties. These equity interests may be subject to certain restrictions on their resale and are generally illiquid. Equity interests generally do not produce a current return, but are generally held in anticipation of investment appreciation and ultimate realized gain on sale.
The property types and the geographic composition securing the commercial mortgage loans and equity interests at value at December 31, 2007 and 2006, were as follows:
| | | | | | | | | | |
| | | 2007 | | | 2006 | |
| | | | | | | |
Property Type | | | | | | | | |
| Hospitality | | | 44 | % | | | 45 | % |
| Office | | | 21 | | | | 20 | |
| Retail | | | 18 | | | | 19 | |
| Recreation | | | 15 | | | | 1 | |
| Housing | | | — | | | | 13 | |
| Other | | | 2 | | | | 2 | |
| | | | | | | |
| | Total | | | 100 | % | | | 100 | % |
| | | | | | | |
Geographic Region | | | | | | | | |
| Southeast | | | 37 | % | | | 36 | % |
| Midwest | | | 31 | | | | 21 | |
| West | | | 20 | | | | 21 | |
| Northeast | | | 8 | | | | 8 | |
| Mid-Atlantic | | | 4 | | | | 14 | |
| | | | | | | |
| | Total | | | 100 | % | | | 100 | % |
| | | | | | | |
CMBS Bonds and Collateralized Debt Obligation Bonds and Preferred Shares (“CDOs”).On May 3, 2005, the Company completed the sale of its portfolio of CMBS bonds and CDO bonds and preferred shares to affiliates of Caisse de dépôt et placement du Québec (the Caisse) for cash proceeds of $976.0 million and realized a net gain of $227.7 million, after transaction and other costs of $7.8 million. Transaction costs included investment banking fees, legal and other professional fees, and other transaction costs. Upon the closing of the sale, the Company settled all the hedge positions relating to these assets, which resulted in a net realized loss of $0.7 million, which has been included in the net realized gain on the sale. The value of these assets prior to their sale was determined on an individual security-by-security basis. The net gain realized upon the sale of $227.7 million reflects the total value received for the portfolio as a whole. Simultaneous with the sale of the Company’s CMBS and CDO portfolio, the Company entered into certain agreements with affiliates of the Caisse, including a platform assets purchase agreement, pursuant to which the Company agreed to sell certain additional commercial real estate-related assets to the Caisse, subject to certain adjustments and closing conditions.
The platform assets purchase agreement was completed on July 13, 2005, and the Company received total cash proceeds from the sale of the platform assets of approximately $5.3 million. No gain or loss resulted from the transaction. Under this agreement, the Company agreed not to primarily invest in non-
120
ALLIED CAPITAL CORPORATION AND SUBSIDIARIES
NOTES TO CONSOLIDATED FINANCIAL STATEMENTS — (Continued)
Note 3. Portfolio, continued
investment grade CMBS and real estate-related CDOs and refrain from certain other real estate-related investing or servicing activities for a period of three years or through May 2008 subject to certain limitations and excluding the Company’s existing portfolio and related activities.
Managed Funds
The Company manages funds that invest in the debt and equity of primarily private middle market companies in a variety of industries. As of December 31, 2007, the funds that the Company manages had total assets of approximately $400 million. During 2007, the Company launched the Allied Capital Senior Debt Fund, L.P. and the Unitranche Fund LLC, and in early 2008, the Company formed the AGILE Fund I, LLC, all discussed below (together, the “Managed Funds”). The Company’s responsibilities to the Managed Funds may include deal origination, underwriting, and portfolio monitoring and development services consistent with the activities that the Company performs for its portfolio. Each of the Managed Funds may separately invest in the debt or equity of a portfolio company. The Company’s portfolio may include debt or equity investments issued by the same portfolio company as investments held by one or more Managed Funds, and these investments may be senior, pari passu or junior to the debt and equity investments held by the Company.
The Company accounts for the sale of securities to funds with which it has continuing involvement as sales pursuant to SFAS No. 140,Accounting for Transfers and Servicing of Financial Assets and Extinguishments of Liabilities, a replacement of FASB Statement 125, when the securities have been legally isolated from the Company, the Company has no ability to restrict or constrain the ability of the funds to pledge or exchange the transferred securities, and the Company does not have either the entitlement and the obligation to repurchase the securities or the ability to unilaterally cause the fund to put the securities back to the Company.
Allied Capital Senior Debt Fund, L.P.The Company is a special limited partner in the Allied Capital Senior Debt Fund, L.P. (“ACSDF”), a private fund that generally invests in senior, unitranche and second lien debt. The Company has committed and funded $31.8 million to ACSDF, which is a portfolio company. At December 31, 2007, the Company’s investment in ACSDF totaled $31.8 million at cost and $32.8 million at value. ACSDF has closed on $125 million in equity capital commitments and had total assets of approximately $400 million. As a special limited partner, the Company expects to earn an incentive allocation of 20% of the annual net income of ACSDF, subject to certain performance benchmarks. The value of the Company’s investment in ACSDF is based on the net asset value of ACSDF, which reflects the capital invested plus its allocation of the net earnings of ACSDF, including the incentive allocation.
AC Corp is the investment manager to ACSDF. Callidus Capital Corporation, a portfolio investment controlled by the Company, acts as special manager to ACSDF. An affiliate of the Company is the general partner of ACSDF, and AC Corp serves as collateral manager to a warehouse financing vehicle associated with ACSDF. AC Corp will earn a management fee of up to 2% per annum of the net asset value of ACSDF and will pay Callidus 25% of that management fee to compensate Callidus for its role as special manager.
In connection with ACSDF’s formation in June 2007, the Company sold an initial portfolio of approximately $183 million of seasoned assets with a weighted average yield of 10.3% to a warehouse financing vehicle associated with ACSDF. In the second half of 2007, the Company sold $41.7 million of seasoned assets with a weighted average yield of 8.5% to the warehouse financing vehicle. The Company may offer to sell additional loans to ACSDF or the warehouse financing vehicle. ACSDF or the warehouse financing vehicle may purchase loans from the Company. ACSDF also purchases loans from other third
121
ALLIED CAPITAL CORPORATION AND SUBSIDIARIES
NOTES TO CONSOLIDATED FINANCIAL STATEMENTS — (Continued)
Note 3. Portfolio, continued
parties. In addition, during the second half of 2007, the Company repurchased one asset totaling $12.0 million from ACSDF, which the Company had sold to ACSDF in June 2007.
Unitranche Fund LLC.In December 2007, the Company formed the Unitranche Fund LLC (“Unitranche Fund”), which the Company co-manages with an affiliate of General Electric Capital Corporation (GE). The Unitranche Fund is a private fund that generally focuses on making first lien unitranche loans to middle market companies with Earning before Interest, Taxes, Depreciation, and Amortization of at least $15 million. GE has committed $3.075 billion to the Unitranche Fund consisting of $3.0 billion of senior notes and $0.075 billion of subordinated certificates and the Company has committed $525.0 million of subordinated certificates. The Unitranche Fund will be capitalized as transactions are completed. At December 31, 2007, the Company’s investment in the Unitranche Fund totaled $0.7 million at cost and at value. The Company will earn a management and sourcing fee totaling 0.375% per annum of managed assets.
AGILE Fund I, LLC.In January 2008, the Company entered into an investment agreement with the Goldman Sachs Private Equity Group, part of Goldman Sachs Asset Management (“Goldman Sachs”). As part of the investment agreement, the Company agreed to sell a pro-rata strip of private equity and debt investments to AGILE Fund I, LLC (“AGILE”), a private fund in which a fund managed by Goldman Sachs owns substantially all of the interests, for a total transaction value of $169 million. The majority of the investment sale closed simultaneously with the execution of the investment agreement. The sales of the remaining assets are expected to close by the end of the first quarter of 2008, subject to certain terms and conditions.
The sale to AGILE included 13.7% of the Company’s equity investments in 23 of its buyout portfolio companies and 36 of its minority equity portfolio companies for a total purchase price of $109 million. In addition, the Company sold approximately $60 million in debt investments, which represented 7.3% of its unitranche, second lien and subordinated debt investments in the buyout investments included in the equity sale. AGILE generally has the right to co-invest in its proportional share of any future follow-on investment opportunities presented by the companies in its portfolio.
The Company is the managing member of AGILE, and will be entitled to an incentive allocation subject to certain performance benchmarks. The Company owns the remaining interests in AGILE not held by Goldman Sachs.
In addition, pursuant to the investment agreement Goldman Sachs has committed to invest at least $125 million in future investment vehicles managed by the Company and will have future opportunities to invest in the Company’s affiliates, or vehicles managed by them, and to coinvest alongside the Company in the future, subject to various terms and conditions. As part of this transaction, the Company has also agreed to sell 11 venture capital and private equity limited partnership investments for approximately $28 million to a fund managed by Goldman Sachs, which will assume the $6.5 million of unfunded commitments related to these limited partnership investments. The sales of these limited partnership investments are expected to be completed by May 2008.
122
ALLIED CAPITAL CORPORATION AND SUBSIDIARIES
NOTES TO CONSOLIDATED FINANCIAL STATEMENTS — (Continued)
Note 4. Debt
At December 31, 2007 and 2006, the Company had the following debt:
| | | | | | | | | | | | | | | | | | | | | | | | | | | |
| | | 2007 | | | 2006 | |
| | | | | | | |
| | | | | Annual | | | | | Annual | |
| | | Facility | | | Amount | | | Interest | | | Facility | | | Amount | | | Interest | |
| | | Amount | | | Drawn | | | Cost(1) | | | Amount | | | Drawn | | | Cost(1) | |
| ($ in millions) | | | | | | | | | | | | | | | | | | |
| Notes payable and debentures: | | | | | | | | | | | | | | | | | | | | | | | | |
| | Privately issued unsecured notes payable | | $ | 1,042.2 | | | $ | 1,042.2 | | | | 6.1 | % | | $ | 1,041.4 | | | $ | 1,041.4 | | | | 6.1 | % |
| | Publicly issued unsecured notes payable | | | 880.0 | | | | 880.0 | | | | 6.7 | % | | | 650.0 | | | | 650.0 | | | | 6.6 | % |
| | | | | | | | | | | | | | | | | | | |
| | | Total notes payable and debentures | | | 1,922.2 | | | | 1,922.2 | | | | 6.4 | % | | | 1,691.4 | | | | 1,691.4 | | | | 6.3 | % |
Revolving line of credit(4) | | | 922.5 | | | | 367.3 | | | | 5.9 | %(2) | | | 922.5 | | | | 207.7 | | | | 6.4 | %(2) |
| | | | | | | | | | | | | | | | | | | |
| | Total debt | | $ | 2,844.7 | | | $ | 2,289.5 | | | | 6.5 | %(3) | | $ | 2,613.9 | | | $ | 1,899.1 | | | | 6.5 | %(3) |
| | | | | | | | | | | | | | | | | | | |
| |
| (1) | The weighted average annual interest cost is computed as the (a) annual stated interest on the debt plus the annual amortization of commitment fees, other facility fees and amortization of debt financing costs that are recognized into interest expense over the contractual life of the respective borrowings, divided by (b) debt outstanding on the balance sheet date. |
| |
| (2) | The annual interest cost reflects the interest rate payable for borrowings under the revolving line of credit. In addition to the current interest payable, there were annual costs of commitment fees, other facility fees and amortization of debt financing costs of $3.7 million and $3.9 million at December 31, 2007 and 2006, respectively. |
| |
| (3) | The annual interest cost for total debt includes the annual cost of commitment fees, other facility fees and amortization of debt financing costs on the revolving line of credit regardless of the amount outstanding on the facility as of the balance sheet date. |
| |
| (4) | At December 31, 2007, $496.7 million remained unused and available on the revolving line of credit, net of amounts committed for standby letters of credit of $58.5 million issued under the credit facility. |
Notes Payable and Debentures
Privately Issued Unsecured Notes Payable.The Company has privately issued unsecured long-term notes to institutional investors. The notes have five- or seven-year maturities and have fixed rates of interest. The notes generally require payment of interest only semi-annually, and all principal is due upon maturity. At December 31, 2007, the notes had maturities from May 2008 to May 2013. The notes may be prepaid in whole or in part, together with an interest premium, as stipulated in the note agreements.
The Company has issued five-year unsecured long-term notes denominated in Euros and Sterling for a total U.S. dollar equivalent of $15.2 million. The notes have fixed interest rates and have substantially the same terms as the Company’s other unsecured notes. The Euro notes require annual interest payments and the Sterling notes require semi-annual interest payments until maturity. Simultaneous with issuing the notes, the Company entered into a cross currency swap with a financial institution which fixed the Company’s interest and principal payments in U.S. dollars for the life of the debt.
On October 16, 2006, the Company repaid $150.0 million of unsecured long-term debt that matured. This debt had a fixed interest rate of 7.2%.
On May 1, 2006, the Company issued $50.0 million of seven-year, unsecured notes with a fixed interest rate of 6.8%. This debt matures in May 2013. The proceeds from the issuance of the notes were used in part to repay $25 million of 7.5% unsecured long-term notes that matured on May 1, 2006.
Publicly Issued Unsecured Notes Payable.At December 31, 2007, the Company had outstanding publicly issued unsecured notes as follows:
| | | | | | | | | | |
| | | Amount | | | Maturity Date | |
| ($ in millions) | | | | | | |
| 6.625% Notes due 2011 | | $ | 400.0 | | | | July 15, 2011 | |
| 6.000% Notes due 2012 | | | 250.0 | | | | April 1, 2012 | |
| 6.875% Notes due 2047 | | | 230.0 | | | | April 15, 2047 | |
| | | | | | | |
| | Total | | $ | 880.0 | | | | | |
| | | | | | | |
123
ALLIED CAPITAL CORPORATION AND SUBSIDIARIES
NOTES TO CONSOLIDATED FINANCIAL STATEMENTS — (Continued)
Note 4. Debt, continued
The 6.625% Notes due 2011 and the 6.000% Notes due 2012 require payment of interest only semi-annually, and all principal is due upon maturity. The Company has the option to redeem these notes in whole or in part, together with a redemption premium, as stipulated in the notes.
On March 28, 2007, the Company completed the issuance of $200.0 million of 6.875% Notes due 2047 for net proceeds of $193.0 million. In April 2007, the Company issued additional notes, through an over-allotment option, totaling $30.0 million for net proceeds of $29.1 million. Net proceeds are net of underwriting discounts and estimated offering expenses.
The 6.875% Notes due 2047 require payment of interest only quarterly, and all principal is due upon maturity. The Company may redeem these notes in whole or in part at any time or from time to time on or after April 15, 2012, at par and upon the occurrence of certain tax events as stipulated in the notes.
Scheduled Maturities. Scheduled future maturities of notes payable at December 31, 2007, were as follows:
| | | | | | |
| Year | | Amount Maturing | |
| | | | |
| | | ($ in millions) | |
| 2008 | | $ | 153.0 | |
| 2009 | | | 269.7 | |
| 2010 | | | 408.0 | |
| 2011 | | | 472.5 | |
| 2012 | | | 339.0 | |
| Thereafter | | | 280.0 | |
| | | | |
| |
| | Total | | $ | 1,922.2 | |
| | | | |
At December 31, 2007 and 2006, the Company had an unsecured revolving line of credit with a committed amount of $922.5 million that expires on September 30, 2008. At the Company’s option, borrowings under the revolving line of credit generally bear interest at a rate equal to (i) LIBOR (for the period the Company selects) plus 1.05% or (ii) the higher of the Federal Funds rate plus 0.50% or the Bank of America, N.A. prime rate. The revolving line of credit requires the payment of an annual commitment fee equal to 0.20% of the committed amount (whether used or unused). The revolving line of credit generally requires payments of interest at the end of each LIBOR interest period, but no less frequently than quarterly, on LIBOR based loans and monthly payments of interest on other loans. All principal is due upon maturity.
The annual cost of commitment fees, other facility fees and amortization of debt financing costs was $3.7 million and $3.9 million at December 31, 2007 and 2006, respectively.
The revolving credit facility provides for a sub-facility for the issuance of letters of credit for up to an amount equal to 16.66% of the committed facility or $153.7 million. The letter of credit fee is 1.05% per annum on letters of credit issued, which is payable quarterly.
The average debt outstanding on the revolving line of credit was $58.5 million and $142.1 million, respectively, for the years ended December 31, 2007 and 2006. The maximum amount borrowed under this facility and the weighted average stated interest rate for the years ended December 31, 2007 and 2006, were $381.3 million and 6.3%, respectively, and $540.3 million and 6.3%, respectively. At December 31,
124
ALLIED CAPITAL CORPORATION AND SUBSIDIARIES
NOTES TO CONSOLIDATED FINANCIAL STATEMENTS — (Continued)
Note 4. Debt, continued
2007, the amount available under the revolving line of credit was $496.7 million, net of amounts committed for standby letters of credit of $58.5 million issued under the credit facility.
The Company records debt at cost. The fair value of the Company’s outstanding debt was approximately $2.2 billion and $1.9 billion at December 31, 2007 and 2006, respectively. The fair value of the Company’s publicly issued 6.875% Notes due 2047 was determined using the market price of the retail notes at December 31, 2007. The fair value of the Company’s other debt was determined using market interest rates as of the balance sheet date for similar instruments.
The Company has various financial and operating covenants required by the revolving line of credit and the privately issued unsecured notes payable outstanding at December 31, 2007 and 2006. These covenants require the Company to maintain certain financial ratios, including asset coverage, debt to equity and interest coverage, and a minimum net worth. These credit facilities provide for customary events of default, including, but not limited to, payment defaults, breach of representations or covenants, cross-defaults, bankruptcy events, failure to pay judgments, attachment of the Company’s assets, change of control and the issuance of an order of dissolution. Certain of these events of default are subject to notice and cure periods or materiality thresholds. The Company’s credit facilities limit its ability to declare dividends if the Company defaults under certain provisions. As of December 31, 2007 and 2006, the Company was in compliance with these covenants.
The Company has certain financial and operating covenants that are required by the publicly issued unsecured notes payable, including that the Company will maintain a minimum ratio of 200% of total assets to total borrowings, as required by the Investment Company Act of 1940, as amended, while these notes are outstanding. As of December 31, 2007 and 2006, the Company was in compliance with these covenants.
Note 5. Guarantees and Commitments
In the ordinary course of business, the Company has issued guarantees and has extended standby letters of credit through financial intermediaries on behalf of certain portfolio companies. All standby letters of credit have been issued through Bank of America, N.A. As of December 31, 2007 and 2006, the Company had issued guarantees of debt and rental obligations aggregating $270.6 million and $202.1 million, respectively, and had extended standby letters of credit aggregating $58.5 million and $41.0 million, respectively. Under these arrangements, the Company would be required to make payments to third-party beneficiaries if the portfolio companies were to default on their related payment obligations. The maximum amount of potential future payments was $329.1 million and $243.1 million at December 31, 2007 and 2006, respectively.
125
ALLIED CAPITAL CORPORATION AND SUBSIDIARIES
NOTES TO CONSOLIDATED FINANCIAL STATEMENTS — (Continued)
Note 5. Guarantees and Commitments, continued
As of December 31, 2007, the guarantees and standby letters of credit expired as follows:
| | | | | | | | | | | | | | | | | | | | | | | | | | | | | | |
| | | Total | | | 2008 | | | 2009 | | | 2010 | | 2011 | | | 2012 | | | After 2012 | |
| (in millions) | | | | | | | | | | | | | | | | | | | | |
| Guarantees | | $ | 270.6 | | | $ | 3.0 | | | $ | 261.2 | | | $ | — | | | $ | 4.4 | | | $ | 0.1 | | | $ | 1.9 | |
Standby letters of credit(1) | | | 58.5 | | | | 58.5 | | | | — | | | | — | | | | — | | | | — | | | | — | |
| | | | | | | | | | | | | | | | | | | | | | |
| | Total(2) | | $ | 329.1 | | | $ | 61.5 | | | $ | 261.2 | | | $ | — | | | $ | 4.4 | | | $ | 0.1 | | | $ | 1.9 | |
| | | | | | | | | | | | | | | | | | | | | | |
| |
| (1) | Standby letters of credit are issued under the Company’s revolving line of credit that expires in September 2008. Therefore, unless a standby letter of credit is set to expire at an earlier date, it is assumed that the standby letters of credit will expire contemporaneously with the expiration of the Company’s line of credit in September 2008. |
| (2) | The Company’s most significant commitments relate to its investment in Ciena Capital LLC (Ciena), which commitments totaled $276.7 million at December 31, 2007. At December 31, 2007, the Company guaranteed 60% of the outstanding total obligations on Ciena’s revolving line of credit, which matures in March 2009, for a total guaranteed amount of $258.7 million and had standby letters of credit issued totaling $18.0 million in connection with term securitizations completed by Ciena. In January 2008, the Company increased the guaranteed amount on Ciena’s revolving line of credit from 60% to 100% in connection with an amendment completed by Ciena and also issued additional letters of credit totaling $42.5 million related to other term securitizations completed by Ciena. See Note 3. |
In the ordinary course of business, the Company enters into agreements with service providers and other parties that may contain provisions for the Company to indemnify and guaranty certain minimum fees to such parties under certain circumstances.
At December 31, 2007, the Company had outstanding commitments to fund investments totaling $923.6 million, including $882.4 million related to private finance investments and $41.2 million related to commercial real estate finance investments. Total outstanding commitments related to private finance investments included $524.3 million to the Unitranche Fund LLC, which the Company estimates will be funded over a two to three year period as investments are funded by the Unitranche Fund. See Note 3.
Note 6. Shareholders’ Equity
Sales of common stock for the years ended December 31, 2007, 2006, and 2005, were as follows:
| | | | | | | | | | | | | | |
| | | 2007 | | | 2006 | | | 2005(1) |
| (in millions) | | | | | | | | |
| Number of common shares | | | 6.6 | | | | 10.9 | | | | — | |
| | | | | | | | | | |
| Gross proceeds | | $ | 177.7 | | | $ | 310.2 | | | $ | — | |
| Less costs, including underwriting fees | | | (6.4 | ) | | | (14.4 | ) | | | — | |
| | | | | | | | | | |
| | Net proceeds | | $ | 171.3 | | | $ | 295.8 | | | $ | — | |
| | | | | | | | | | |
| |
| (1) | The Company did not sell any common stock during the year ended December 31, 2005. |
The Company issued 0.6 million shares, 0.5 million shares, and 3.0 million shares of common stock upon the exercise of stock options during the years ended December 31, 2007, 2006, and 2005, respectively. In addition, in July 2007, the Company issued 1.7 million unregistered shares of common stock upon the cancellation of stock options pursuant to a tender offer. See Note 9.
The Company issued 0.3 million shares of common stock with a value of $7.2 million as consideration for an additional investment in Mercury Air Centers, Inc. during the year ended December 31, 2005.
The Company has a dividend reinvestment plan, whereby the Company may buy shares of its common stock in the open market or issue new shares in order to satisfy dividend reinvestment requests. If
126
ALLIED CAPITAL CORPORATION AND SUBSIDIARIES
NOTES TO CONSOLIDATED FINANCIAL STATEMENTS — (Continued)
Note 6. Shareholders’ Equity, continued
the Company issues new shares, the issue price is equal to the average of the closing sale prices reported for the Company’s common stock for the five consecutive trading days immediately prior to the dividend payment date. For the years ended December 31, 2007, 2006, and 2005, the Company issued new shares in order to satisfy dividend reinvestment requests. Dividend reinvestment plan activity for the years ended December 31, 2007, 2006, and 2005, was as follows:
| | | | | | | | | | | | | |
| | | 2007 | | | 2006 | | | 2005 | |
| (in millions, except per share amounts) | | | | | | | | | |
| Shares issued | | | 0.6 | | | | 0.5 | | | | 0.3 | |
| Average price per share | | $ | 27.40 | | | $ | 30.58 | | | $ | 28.00 | |
Note 7. Earnings Per Common Share
Earnings per common share for the years ended December 31, 2007, 2006, and 2005, were as follows:
| | | | | | | | | | | | | |
| | | 2007 | | | 2006 | | | 2005 | |
| (in millions, except per share amounts) | | | | | | | | | |
| Net increase in net assets resulting from operations | | $ | 153.3 | | | $ | 245.1 | | | $ | 872.8 | |
| Weighted average common shares outstanding — basic | | | 152.9 | | | | 142.4 | | | | 134.7 | |
| Dilutive options outstanding | | | 1.8 | | | | 3.2 | | | | 2.6 | |
| | | | | | | | | | |
| Weighted average common shares outstanding — diluted | | | 154.7 | | | | 145.6 | | | | 137.3 | |
| | | | | | | | | | |
| Basic earnings per common share | | $ | 1.00 | | | $ | 1.72 | | | $ | 6.48 | |
| | | | | | | | | | |
| Diluted earnings per common share | | $ | 0.99 | | | $ | 1.68 | | | $ | 6.36 | |
| | | | | | | | | | |
Note 8. Employee Compensation Plans
401(k) Plan. Prior to the 2008 Plan Year, the Company’s 401(k) retirement investment plan was open to all of its full-time employees who were at least 21 years of age. The employees could elect voluntary pre-tax wage deferrals ranging from 0% to 100% of eligible compensation for the year up to $15.5 thousand annually for the 2007 plan year. Plan participants who were age 50 or older during the 2007 plan year were eligible to defer an additional $5 thousand during the year. For the years ended December 31, 2007, 2006, and 2005, the Company made contributions to the 401(k) plan of up to 5% of each participant’s eligible compensation for the year up to a maximum compensation permitted by the IRS, which fully vests at the time of contribution. For the year ended December 31, 2007, the maximum compensation was $0.2 million. Employer contributions that exceed the IRS limitation (excess contributions) were directed to the participant’s deferred compensation plan account as discussed below for the 2006 and 2005 plan years. Excess contributions for the 2007 plan year totaled $2.0 million and will be paid to participants in cash as a result of the planned termination of the deferred compensation arrangements in the first quarter of 2008 as discussed below. Total 401(k) contribution expense for the years ended December 31, 2007, 2006, and 2005, was $1.4 million, $1.2 million, and $1.0 million, respectively.
For the 2008 plan year, the Company amended its 401(k) plan to amend certain plan features, and to provide that the Company will match 100% of the first 4% of deferral contributions made by each participant on up to $0.2 million of eligible compensation. There will be no excess contributions.
127
ALLIED CAPITAL CORPORATION AND SUBSIDIARIES
NOTES TO CONSOLIDATED FINANCIAL STATEMENTS — (Continued)
Note 8. Employee Compensation Plans, continued
Deferred Compensation Plans. The Company also has deferred compensation plans. The Company’s deferred compensation arrangements will be terminated effective March 18, 2008, as discussed below, and no further contributions were accepted into the plans after December 31, 2007.
Through December 31, 2007, eligible participants in the deferred compensation plan (“DCP I”) could elect to defer some of their compensation and have such compensation credited to a participant account. In addition, the Company made contributions to the deferred compensation plan on compensation deemed ineligible for a 401(k) contribution for 2006 and 2005. Contribution expense for the deferred compensation plan for the years ended December 31, 2006 and 2005, was $1.5 million and $0.7 million, respectively. All amounts credited to a participant’s account were credited solely for purposes of accounting and computation and remain assets of the Company and subject to the claims of the Company’s general creditors until distributed. Amounts credited to participants under the deferred compensation plan are at all times 100% vested and non-forfeitable. Amounts deferred by participants under the deferred compensation plan were funded to a trust, which is administered by a third-party trustee. The accounts of the deferred compensation trust are consolidated with the Company’s accounts. The assets of the trust are classified as other assets and the liability to the plan participants is included in other liabilities in the accompanying financial statements. The deferred compensation plan accounts at December 31, 2007 and 2006, totaled $21.1 million and $18.6 million, respectively.
The Company has an Individual Performance Award (“IPA”), which was established as a long-term incentive compensation program for certain officers. In conjunction with the program, the Board of Directors approved non-qualified deferred compensation plans (“DCP II”), which are administered through a trust by a third-party trustee. The administrator of the DCP II is the Compensation Committee of the Company’s Board of Directors.
The IPA is generally determined annually at the beginning of each year but may be adjusted throughout the year. Through December 31, 2007, the IPA was deposited in the trust in four equal installments, generally on a quarterly basis, in the form of cash. The Compensation Committee of the Board of Directors designed the DCP II to require the trustee to use the cash to purchase shares of the Company’s common stock in the open market. During the years ended December 31, 2007, 2006, and 2005, 0.4 million shares, 0.3 million shares, and 0.3 million shares, respectively, were purchased in the DCP II.
All amounts deposited and then credited to a participant’s account in the trust, based on the amount of the IPA received by such participant, were credited solely for purposes of accounting and computation and remain assets of the Company and subject to the claims of the Company’s general creditors until distributed. Amounts credited to participants under the DCP II are immediately vested and generally non-forfeitable once deposited by the Company into the trust.
During any period of time in which a participant has an account in the DCP II, any dividends declared and paid on shares of the Company’s common stock allocated to the participant’s account were reinvested in shares of the Company’s common stock.
Through December 31, 2007, the IPA amounts were contributed into the DCP II trust and invested in the Company’s common stock. The accounts of the DCP II are consolidated with the Company’s accounts. The common stock is classified as common stock held in deferred compensation trust in the accompanying financial statements and the deferred compensation obligation, which represents the amount owed to the employees, is included in other liabilities. Changes in the value of the Company’s common stock held in the deferred compensation trust are not recognized. However, the liability is marked to market with a corresponding charge or credit to employee compensation expense. At December 31, 2007
128
ALLIED CAPITAL CORPORATION AND SUBSIDIARIES
NOTES TO CONSOLIDATED FINANCIAL STATEMENTS — (Continued)
Note 8. Employee Compensation Plans, continued
and 2006, common stock held in DCP II was $39.9 million and $28.3 million, respectively, and the IPA liability was $31.4 million and $33.9 million, respectively. At December 31, 2007 and 2006, the DCP II held 1.4 million shares and 1.0 million shares, respectively, of the Company’s common stock.
The IPA expense for the years ended December 31, 2007, 2006, and 2005, was as follows:
| | | | | | | | | | | | | | |
| | | 2007 | | | 2006 | | | 2005 | |
| ($ in millions) | | | | | | | | | |
| IPA contributions | | $ | 9.8 | | | $ | 8.1 | | | $ | 7.0 | |
| IPA mark to market expense (benefit) | | | (14.0 | ) | | | 2.9 | | | | 2.0 | |
| | | | | | | | | | |
| | Total IPA expense (benefit) | | $ | (4.2 | ) | | $ | 11.0 | | | $ | 9.0 | |
| | | | | | | | | | |
The Company also has an individual performance bonus (“IPB”) which is distributed in cash to award recipients throughout the year (beginning in February of each year) as long as the recipient remains employed by the Company. If a recipient terminates employment during the year, any remaining cash payments under the IPB would be forfeited. For the years ended December 31, 2007, 2006, and 2005, the IPB expense was $9.5 million, $8.1 million, and $6.9 million, respectively. The IPA and IPB expenses are included in employee expenses.
Termination of Deferred Compensation Plans.On December 14, 2007, the Company’s Board of Directors made a determination that it is in the Company’s best interest to terminate its deferred compensation plans. The Board of Directors’ decision was primarily in response to increased complexity resulting from recent changes in the regulation of deferred compensation arrangements. The accounts under these plans will be distributed to participants in full on March 18, 2008, the termination and distribution date, or as soon as is reasonably practicable thereafter, in accordance with the transition rule for payment elections under Section 409A of the Code. Distributions from the plans will be made in cash or shares of the Company’s common stock, net of required withholding taxes.
For 2008, the Compensation Committee has determined that the IPA will be paid in cash in two equal installments during the year to eligible officers, as long as the recipient remains employed by the Company.
Note 9. Stock Option Plan
The purpose of the stock option plan (“Option Plan”) is to provide officers and non-officer directors of the Company with additional incentives. Options are exercisable at a price equal to the fair market value of the shares on the day the option is granted. Each option states the period or periods of time within which the option may be exercised by the optionee, which may not exceed ten years from the date the option is granted. The options granted to officers generally vest ratably over up to a three year period. Options granted to non-officer directors vest on the grant date.
All rights to exercise options terminate 60 days after an optionee ceases to be (i) a non-officer director, (ii) both an officer and a director, if such optionee serves in both capacities, or (iii) an officer (if such officer is not also a director) of the Company for any cause other than death or total and permanent disability. In the event of a change of control of the Company, all outstanding options will become fully vested and exercisable as of the change of control.
At December 31, 2006, there were 32.2 million shares authorized under the Option Plan. On May 15, 2007, the Company’s stockholders voted to increase the number of shares of common stock authorized for issuance to 37.2 million shares. At December 31, 2007, there were 37.2 million shares authorized under the Option Plan.
129
ALLIED CAPITAL CORPORATION AND SUBSIDIARIES
NOTES TO CONSOLIDATED FINANCIAL STATEMENTS — (Continued)
Note 9. Stock Option Plan, continued
On July 18, 2007, the Company completed a tender offer related to the Company’s offer to all optionees who held vested “in-the-money” stock options as of June 20, 2007, the opportunity to receive an option cancellation payment (“OCP”) equal to the “in-the-money” value of the stock options cancelled, determined using the Weighted Average Market Price of $31.75, which would be paid one-half in cash and one-half in unregistered shares of the Company’s common stock. The Company accepted for cancellation 10.3 million vested options, which in the aggregate had a weighted average exercise price of $21.50. This resulted in a total option cancellation payment of approximately $105.6 million, of which $52.8 million was paid in cash and $52.8 million was paid through the issuance of 1.7 million unregistered shares of the Company’s common stock, determined using the Weighted Average Market Price of $31.75. The Weighted Average Market Price represented the volume weighted average price of the Company’s common stock over the fifteen trading days preceding the first day of the offer period, or June 20, 2007. See Note 2 — Stock Compensation Plans.
At December 31, 2007 and 2006, the number of shares available to be granted under the Option Plan was 10.7 million and 1.6 million, respectively.
Information with respect to options granted, exercised and forfeited under the Option Plan for the years ended December 31, 2007, 2006, and 2005, was as follows:
| | | | | | | | | | | | | | | | | |
| | | | | Weighted | | | Weighted | | | |
| | | | | Average | | | Average | | | |
| | | | | Exercise | | | Contractual | | | Aggregate Intrinsic | |
| | | | | Price Per | | | Remaining | | | Value at | |
| | | Shares | | | Share | | | Term (Years) | | | December 31, 2007(1) | |
| (in millions, except per share amounts) | | | | | | | | | | | | |
| Options outstanding at January 1, 2005 | | | 20.4 | | | $ | 23.55 | | | | | | | | | |
| Granted | | | 6.8 | | | $ | 27.37 | | | | | | | | | |
| Exercised | | | (3.0 | ) | | $ | 22.32 | | | | | | | | | |
| Forfeited | | | (1.9 | ) | | $ | 27.83 | | | | | | | | | |
| | | | | | | | | | | | | |
| Options outstanding at December 31, 2005 | | | 22.3 | | | $ | 24.52 | | | | | | | | | |
| Granted | | | 1.8 | | | $ | 29.88 | | | | | | | | | |
| Exercised | | | (0.5 | ) | | $ | 22.99 | | | | | | | | | |
| Forfeited | | | (0.4 | ) | | $ | 27.67 | | | | | | | | | |
| | | | | | | | | | | | | |
| Options outstanding at December 31, 2006 | | | 23.2 | | | $ | 24.92 | | | | | | | | | |
| | | | | | | | | | | | | |
| Granted | | | 6.7 | | | $ | 29.52 | | | | | | | | | |
| Exercised | | | (0.6 | ) | | $ | 25.25 | | | | | | | | | |
Cancelled in tender offer(2) | | | (10.3 | ) | | $ | 21.50 | | | | | | | | | |
| Forfeited | | | (0.5 | ) | | $ | 28.96 | | | | | | | | | |
| | | | | | | | | | | | | |
| Options outstanding at December 31, 2007 | | | 18.5 | | | $ | 28.36 | | | | 6.58 | | | $ | 0.2 | |
| | | | | | | | | | | | | |
Exercisable at December 31, 2007(3) | | | 11.7 | | | $ | 27.99 | | | | 6.54 | | | $ | 0.2 | |
| | | | | | | | | | | | | |
Exercisable and expected to be exercisable at December 31, 2007(4) | | | 17.9 | | | $ | 28.34 | | | | 6.58 | | | $ | 0.2 | |
| | | | | | | | | | | | | |
| |
| (1) | Represents the difference between the market value of the options at December 31, 2007, and the cost for the option holders to exercise the options. |
| (2) | See description of the tender offer above. |
| (3) | Represents vested options. |
| (4) | The amount of options expected to be exercisable at December 31, 2007, is calculated based on an estimate of expected forfeitures. |
130
ALLIED CAPITAL CORPORATION AND SUBSIDIARIES
NOTES TO CONSOLIDATED FINANCIAL STATEMENTS — (Continued)
Note 9. Stock Option Plan, continued
The fair value of the shares vested during the years ended December 31, 2007, 2006, and 2005, was $21.6 million, $16.1 million, and $16.2 million, respectively. The total intrinsic value of the options exercised during the years ended December 31, 2007, 2006, and 2005, was $2.7 million, $3.6 million, and $18.4 million, respectively.
The following table summarizes information about stock options outstanding at December 31, 2007:
| | | | | | | | | | | | | | | | | | | | | |
| | | Outstanding | | | |
| | | | | | Exercisable | |
| | | | | Weighted | | | | | | |
| | | | | Average | | | Weighted | | | | | Weighted | |
| | | Total | | | Remaining | | | Average | | | Total | | | Average | |
| Range of | | Number | | | Contractual Life | | | Exercise | | | Number | | | Exercise | |
| Exercise Prices | | Outstanding | | | (Years) | | | Price | | | Exercisable | | | Price | |
| | | | | | | | | | | | | | | | |
| (in millions, except per share amounts and years) | | | |
| $16.81 — $26.80 | | | 1.9 | | | | 6.02 | | | $ | 24.05 | | | | 1.8 | | | $ | 24.02 | |
| $27.00 — $27.38 | | | 0.1 | | | | 6.56 | | | $ | 27.13 | | | | 0.1 | | | $ | 27.10 | |
| $27.51 | | | 4.8 | | | | 7.59 | | | $ | 27.51 | | | | 3.1 | | | $ | 27.51 | |
| $28.15 — $29.23 | | | 4.2 | | | | 6.34 | | | $ | 28.94 | | | | 3.9 | | | $ | 28.97 | |
| $29.58 | | | 6.3 | | | | 6.36 | | | $ | 29.58 | | | | 2.1 | | | $ | 29.58 | |
| $30.00 — $30.52 | | | 1.2 | | | | 5.43 | | | $ | 30.13 | | | | 0.7 | | | $ | 30.08 | |
| | | | | | | | | | | | | | | | |
| | | | 18.5 | | | | 6.58 | | | $ | 28.36 | | | | 11.7 | | | $ | 27.99 | |
| | | | | | | | | | | | | | | | |
On February 1, 2008, the Company granted 7.1 million options with an exercise price of $22.96. The options vest ratably over a three-year term beginning on June 30, 2009.
Notes Receivable from the Sale of Common Stock
As a business development company under the 1940 Act, the Company is entitled to provide and has provided loans to the Company’s officers in connection with the exercise of options. However, as a result of provisions of the Sarbanes-Oxley Act of 2002, the Company is prohibited from making new loans to its executive officers. The outstanding loans are full recourse, have varying terms not exceeding ten years, bear interest at the applicable federal interest rate in effect at the date of issue and have been recorded as a reduction to shareholders’ equity. At December 31, 2007 and 2006, the Company had outstanding loans to officers of $2.7 million and $2.9 million, respectively. Officers with outstanding loans repaid principal of $0.2 million, $1.0 million, and $1.6 million, for the years ended December 31, 2007, 2006, and 2005, respectively. The Company recognized interest income from these loans of $0.1 million, $0.2 million, and $0.2 million, respectively, during these same periods. This interest income is included in interest and dividends for companies less than 5% owned.
131
ALLIED CAPITAL CORPORATION AND SUBSIDIARIES
NOTES TO CONSOLIDATED FINANCIAL STATEMENTS — (Continued)
Note 10. Dividends and Distributions and Taxes
For the years ended December 31, 2007, 2006, and 2005, the Company’s Board of Directors declared the following distributions:
| | | | | | | | | | | | | | | | | | | | | | | | | | |
| | | 2007 | | | 2006 | | | 2005 | |
| | | | | | | | | | |
| | | Total | | | Total Per | | | Total | | | Total Per | | | Total | | | Total Per | |
| | | Amount | | | Share | | | Amount | | | Share | | | Amount | | | Share | |
| | | | | | | | | | | | | | | | | | | |
| (in millions, except per share amounts) | | | | | | | | | | | | |
| First quarter | | $ | 95.8 | | | $ | 0.63 | | | $ | 82.5 | | | $ | 0.59 | | | $ | 76.1 | | | $ | 0.57 | |
| Second quarter | | | 97.6 | | | | 0.64 | | | | 84.1 | | | | 0.60 | | | | 76.2 | | | | 0.57 | |
| Third quarter | | | 100.3 | | | | 0.65 | | | | 88.8 | | | | 0.61 | | | | 78.8 | | | | 0.58 | |
| Fourth quarter | | | 102.6 | | | | 0.65 | | | | 92.0 | | | | 0.62 | | | | 79.3 | | | | 0.58 | |
| Extra dividend | | | 11.0 | | | | 0.07 | | | | 7.5 | | | | 0.05 | | | | 4.1 | | | | 0.03 | |
| | | | | | | | | | | | | | | | | | | |
| | Total distributions to common shareholders | | $ | 407.3 | | | $ | 2.64 | | | $ | 354.9 | | | $ | 2.47 | | | $ | 314.5 | | | $ | 2.33 | |
| | | | | | | | | | | | | | | | | | | |
For income tax purposes, distributions for 2007, 2006, and 2005, were composed of the following:
| | | | | | | | | | | | | | | | | | | | | | | | | | |
| | | 2007 | | | 2006 | | | 2005 | |
| | | | | | | | | | |
| | | Total | | | Total Per | | | Total | | | Total Per | | | Total | | | Total Per | |
| | | Amount | | | Share | | | Amount | | | Share | | | Amount | | | Share | |
| | | | | | | | | | | | | | | | | | | |
| (in millions, except per share amounts) | | | | | | | | | | | | |
Ordinary income(1)(2) | | $ | 126.7 | | | $ | 0.82 | | | $ | 177.4 | | | $ | 1.23 | | | $ | 157.3 | | | $ | 1.17 | |
| Long-term capital gains | | | 280.6 | | | | 1.82 | | | | 177.5 | | | | 1.24 | | | | 157.2 | | | | 1.16 | |
| | | | | | | | | | | | | | | | | | | |
| | Total distributions
to common shareholders | | $ | 407.3 | | | $ | 2.64 | | | $ | 354.9 | | | $ | 2.47 | | | $ | 314.5 | | | $ | 2.33 | |
| | | | | | | | | | | | | | | | | | | |
| |
| (1) | For the years ended December 31, 2007, 2006, and 2005, ordinary income included dividend income of approximately zero, $0.04 per share, and $0.03 per share, respectively, that qualified to be taxed at the 15% maximum capital gains rate. |
| |
| (2) | For certain eligible corporate shareholders, the dividend received deduction for 2007, 2006, and 2005, was zero, $0.042 per share, and $0.034 per share, respectively. |
The Company’s Board of Directors also declared a dividend of $0.65 per common share for the first quarter of 2008.
132
ALLIED CAPITAL CORPORATION AND SUBSIDIARIES
NOTES TO CONSOLIDATED FINANCIAL STATEMENTS — (Continued)
Note 10. Dividends and Distributions and Taxes, continued
The following table summarizes the differences between financial statement net increase in net assets resulting from operations and taxable income available for distribution to shareholders for the years ended December 31, 2007, 2006, and 2005:
| | | | | | | | | | | | | | | |
| | | 2007 | | | 2006 | | | 2005 | |
| | | | | | | | | | |
| ($ in millions) | | (ESTIMATED)(1) | | | | | |
| Financial statement net increase in net assets resulting from operations | | $ | 153.3 | | | $ | 245.1 | | | $ | 872.8 | |
| Adjustments: | | | | | | | | | | | | |
| | Net change in unrealized appreciation or depreciation | | | 256.2 | | | | 477.4 | | | | (462.1 | ) |
| | Amortization of discounts and fees | | | 0.7 | | | | (1.7 | ) | | | 4.7 | |
| | Interest- and dividend-related items | | | 6.0 | | | | 11.9 | | | | 5.5 | |
| | Employee compensation-related items | | | 0.2 | | | | 23.1 | | | | 3.0 | |
| | Nondeductible excise tax | | | 16.3 | | | | 15.4 | | | | 6.2 | |
| | Realized gains recognized (deferred) through installment treatment(2) | | | (12.7 | ) | | | (182.3 | ) | | | (5.9 | ) |
| | Other realized gain or loss related items | | | (7.2 | ) | | | 15.0 | | | | 18.6 | |
| | Net income (loss) from partnerships and limited liability companies(3) | | | (6.6 | ) | | | (4.7 | ) | | | 18.0 | |
| | Net loss from consolidated SBIC subsidiary | | | — | | | | — | | | | (8.4 | ) |
| | Net (income) loss from consolidated taxable subsidiary, net of tax | | | 1.4 | | | | 3.9 | | | | (5.0 | ) |
| | Other | | | — | | | | (1.9 | ) | | | (2.4 | ) |
| | | | | | | | | | |
| | | Taxable income | | $ | 407.6 | | | $ | 601.2 | | | $ | 445.0 | |
| | | | | | | | | | |
| |
| (1) | The Company’s taxable income for 2007 is an estimate and will not be finally determined until the Company files its 2007 tax return in September 2008. Therefore, the final taxable income may be different than this estimate. |
| |
| (2) | 2006 includes the deferral of long-term capital gains through installment treatment related to the Company’s sale of its control equity investment in Advantage and certain other portfolio companies. |
| |
| (3) | Includes taxable income (loss) passed through to the Company from Ciena Capital LLC (Ciena) in excess of interest and related portfolio income from Ciena included in the financial statements totaling ($12.0) million, $3.7 million, and $15.4 million for the years ended December 31, 2007, 2006, and 2005, respectively. See Note 3 for additional related disclosure. In the fourth quarter of 2007, Ciena made an election to be taxed prospectively as a C corporation; therefore Ciena’s taxable income or losses will no longer be passed through to the Company subsequent to this election. |
Taxable income generally differs from net income for financial reporting purposes due to temporary and permanent differences in the recognition of income and expenses, and generally excludes net unrealized appreciation or depreciation, as gains or losses are not included in taxable income until they are realized.
133
ALLIED CAPITAL CORPORATION AND SUBSIDIARIES
NOTES TO CONSOLIDATED FINANCIAL STATEMENTS — (Continued)
Note 10. Dividends and Distributions and Taxes, continued
The Company must distribute at least 90% of its investment company taxable income to qualify for pass-through tax treatment and maintain its RIC status. The Company has distributed and currently intends to distribute or retain through a deemed distribution sufficient dividends to eliminate taxable income. Dividends declared and paid by the Company in a year generally differ from taxable income for that year as such dividends may include the distribution of current year taxable income, less amounts carried over into the following year, and the distribution of prior year taxable income carried over into and distributed in the current year. For income tax purposes, distributions for 2007, 2006, and 2005, were made from taxable income as follows:
| | | | | | | | | | | | | | |
| | | 2007 | | | 2006 | | | 2005 | |
| | | | | | | | | | |
| ($ in millions) | | (ESTIMATED)(1) | | | | | |
| Taxable income | | $ | 407.6 | | | $ | 601.2 | | | $ | 445.0 | |
Taxable income earned in current year and carried forward for distribution in next year(2) | | | (403.1 | ) | | | (402.8 | ) | | | (156.5 | ) |
| Taxable income earned in prior year and carried forward and distributed in current year | | | 402.8 | | | | 156.5 | | | | 26.0 | |
| | | | | | | | | | |
| | Total distributions to common shareholders | | $ | 407.3 | | | $ | 354.9 | | | $ | 314.5 | |
| | | | | | | | | | |
| |
| (1) | The Company’s taxable income for 2007 is an estimate and will not be finally determined until the Company files its 2007 tax return in September 2008. Therefore, the final taxable income and the taxable income earned in 2007 and carried forward for distribution in 2008 may be different than this estimate. |
| |
| (2) | Estimated taxable income for 2007 includes undistributed income of $403.1 million that is being carried over for distribution in 2008, which represents approximately $50.0 million of ordinary income and approximately $353.1 million of net long-term capital gains. |
The Company will generally be required to pay an excise tax equal to 4% of the amount by which 98% of the Company’s annual taxable income exceeds the distributions for the year. The Company’s 2007 (estimated), 2006, and 2005, annual taxable income were in excess of its dividend distributions from such taxable income in those respective years, and accordingly, the Company had an excise tax expense of $16.3 million, $15.1 million, and $6.2 million, respectively, on the excess taxable income carried forward.
In addition to excess taxable income carried forward, the Company currently estimates that it has cumulative deferred taxable income related to installment sale gains of approximately $234.5 million as of December 31, 2007, which is composed of cumulative deferred taxable income of $211.5 million as of December 31, 2006, and approximately $23.0 million for the year ended December 31, 2007. These gains have been recognized for financial reporting purposes in the respective years they were realized, but are generally deferred for tax purposes until the notes or other amounts received from the sale of the related investments are collected in cash. The realized gains deferred through installment treatment for 2007 are estimates and will not be finally determined until the Company files its 2007 tax return in September 2008.
The Company’s undistributed book earnings of $535.9 million as of December 31, 2007, resulted from undistributed ordinary income and long-term capital gains. The difference between undistributed book earnings at the end of the year and taxable income carried over from the current year into the next year relates to a variety of timing and permanent differences in the recognition of income and expenses for book and tax purposes as discussed above.
At December 31, 2007 and 2006, the aggregate gross unrealized appreciation of the Company’s investments above cost for federal income tax purposes was $609.8 million (estimated) and $618.2 million, respectively. At December 31, 2007 and 2006, the aggregate gross unrealized depreciation of the Company’s investments below cost for federal income tax purposes was $633.1 million (estimated) and
134
ALLIED CAPITAL CORPORATION AND SUBSIDIARIES
NOTES TO CONSOLIDATED FINANCIAL STATEMENTS — (Continued)
Note 10. Dividends and Distributions and Taxes, continued
$425.0 million, respectively. The Company’s investments as compared to cost for federal income tax purposes was net unrealized depreciation of $23.3 million (estimated) and net unrealized appreciation of $193.2 million at December 31, 2007 and 2006, respectively. At December 31, 2007 and 2006, the aggregate cost of securities, for federal income tax purposes was $4.8 billion (estimated) and $4.3 billion, respectively.
The Company’s consolidated subsidiary, AC Corp, is subject to federal and state income taxes. For the years ended December 31, 2007, 2006, and 2005, AC Corp’s income tax expense (benefit) was $(2.7) million, $(0.1) million, and $5.3 million, respectively. For the years ended December 31, 2007 and 2005, paid in capital was increased for the tax benefit of amounts deducted for tax purposes but not for financial reporting purposes primarily related to stock-based compensation by $10.9 million and $3.7 million, respectively.
The net deferred tax asset at December 31, 2007, was $18.4 million, consisting of deferred tax assets of $26.5 million and deferred tax liabilities of $8.1 million. The net deferred tax asset at December 31, 2006, was $6.9 million, consisting of deferred tax assets of $13.7 million and deferred tax liabilities of $6.8 million. At December 31, 2007, the deferred tax assets primarily related to compensation-related items and the deferred tax liabilities primarily related to depreciation. Management believes that the realization of the net deferred tax asset is more likely than not based on expectations as to future taxable income and scheduled reversals of temporary differences. Accordingly, the Company did not record a valuation allowance at December 31, 2007, 2006, or 2005.
Note 11. Cash
The Company places its cash with financial institutions and, at times, cash held in checking accounts in financial institutions may be in excess of the Federal Deposit Insurance Corporation insured limit.
At December 31, 2007 and 2006, cash consisted of the following:
| | | | | | | | | | |
| | | 2007 | | | 2006 | |
| ($ in millions) | | | | | | |
| Cash | | $ | 4.6 | | | $ | 2.3 | |
| Less escrows held | | | (1.1 | ) | | | (0.6 | ) |
| | | | | | | |
| | Total cash | | $ | 3.5 | | | $ | 1.7 | |
| | | | | | | |
Note 12. Supplemental Disclosure of Cash Flow Information
The Company paid interest of $123.5 million, $90.6 million, and $75.2 million, respectively, for the years ended December 31, 2007, 2006, and 2005.
Non-cash operating activities for the years ended December 31, 2007, 2006 and 2005, totaled $142.2 million, $315.9 million, and $120.7 million, respectively. Non-cash operating activities for the year ended December 31, 2006, included a note received as consideration from the sale of the Company’s equity investment in Advantage of $150.0 million and a note received as consideration from the sale of the Company’s equity investment in STS Operating, Inc. of $30.0 million. Non-cash operating activities for the year ended December 31, 2005, included the exchange of existing subordinated debt securities and accrued interest of Ciena with a cost basis of $44.8 million for additional Class B equity interests.
Non-cash financing activities included the issuance of common stock in lieu of cash distributions totaling $17.1 million, $15.0 million, and $9.3 million, for the years ended December 31, 2007, 2006, and 2005, respectively. Non-cash financing activities for the year ended December 31, 2007, also included the
135
ALLIED CAPITAL CORPORATION AND SUBSIDIARIES
NOTES TO CONSOLIDATED FINANCIAL STATEMENTS — (Continued)
Note 12. Supplemental Disclosure of Cash Flow Information, continued
payment of one-half of the value of the option cancellation payment in connection with the tender offer, or $52.8 million, through the issuance of 1.7 million unregistered shares of the Company’s common stock. See Notes 2 and 9. Non-cash financing activities for the year ended December 31, 2005, included the issuance of $7.2 million of the Company’s common stock as consideration for an additional investment in Mercury Air Centers, Inc.
Note 13. Financial Highlights
| | | | | | | | | | | | | | | |
| | | At and for the Years | |
| | | Ended December 31, | |
| | | | |
| | | 2007 | | | 2006 | | | 2005 | |
| | | | | | | | | | |
Per Common Share Data | | | | | | | | | | | | |
| Net asset value, beginning of year | | $ | 19.12 | | | $ | 19.17 | | | $ | 14.87 | |
| | | | | | | | | | |
| | Net investment income(1) | | | 0.91 | | | | 1.30 | | | | 1.00 | |
| | Net realized gains(1)(2) | | | 1.74 | | | | 3.66 | | | | 1.99 | |
| | | | | | | | | | |
| | | Net investment income plus net realized gains(1) | | | 2.65 | | | | 4.96 | | | | 2.99 | |
| | Net change in unrealized appreciation or depreciation(1)(2) | | | (1.66 | ) | | | (3.28 | ) | | | 3.37 | |
| | | | | | | | | | |
Net increase in net assets resulting from operations(1) | | | 0.99 | | | | 1.68 | | | | 6.36 | |
| | | | | | | | | | |
| Decrease in net assets from shareholder distributions | | | (2.64 | ) | | | (2.47 | ) | | | (2.33 | ) |
Net increase in net assets from capital share transactions(1)(3) | | | 0.41 | | | | 0.74 | | | | 0.27 | |
Decrease in net assets from cash portion of the option cancellation payment(1)(4) | | | (0.34 | ) | | | — | | | | — | |
| | | | | | | | | | |
| Net asset value, end of year | | $ | 17.54 | | | $ | 19.12 | | | $ | 19.17 | |
| | | | | | | | | | |
| Market value, end of year | | $ | 21.50 | | | $ | 32.68 | | | $ | 29.37 | |
Total return(5) | | | (27.6 | )% | | | 20.6 | % | | | 23.5 | % |
Ratios and Supplemental Data
($ and shares in millions, except per share amounts) | | | | | | | | | | | | |
| Ending net assets | | $ | 2,771.8 | | | $ | 2,841.2 | | | $ | 2,620.5 | |
| Common shares outstanding at end of year | | | 158.0 | | | | 148.6 | | | | 136.7 | |
| Diluted weighted average common shares outstanding | | | 154.7 | | | | 145.6 | | | | 137.3 | |
| Employee, employee stock option and administrative expenses/average net assets | | | 6.10 | % | | | 5.38 | % | | | 6.56 | % |
| Total operating expenses/average net assets | | | 10.70 | % | | | 9.05 | % | | | 9.99 | % |
| Net investment income/average net assets | | | 4.91 | % | | | 6.90 | % | | | 6.08 | % |
| Net increase in net assets resulting from operations/ average net assets | | | 5.34 | % | | | 8.94 | % | | | 38.68 | % |
| Portfolio turnover rate | | | 26.84 | % | | | 27.05 | % | | | 47.72 | % |
| Average debt outstanding | | $ | 1,924.2 | | | $ | 1,491.0 | | | $ | 1,087.1 | |
Average debt per share(1) | | $ | 12.44 | | | $ | 10.24 | | | $ | 7.92 | |
| |
| (1) | Based on diluted weighted average number of common shares outstanding for the year. |
| |
| (2) | Net realized gains and net change in unrealized appreciation or depreciation can fluctuate significantly from year to year. |
| |
| (3) | Excludes capital share transactions related to the cash portion of the option cancellation payment. |
| |
| (4) | See Notes 2 and 9 to the consolidated financial statements above for further discussion. |
| |
| (5) | Total return assumes the reinvestment of all dividends paid for the years presented. |
136
ALLIED CAPITAL CORPORATION AND SUBSIDIARIES
NOTES TO CONSOLIDATED FINANCIAL STATEMENTS — (Continued)
Note 14. Selected Quarterly Data (Unaudited)
| | | | | | | | | | | | | | | | | |
| | | 2007 | |
| | | | |
| | | Qtr. 1 | | | Qtr. 2 | | | Qtr. 3 | | | Qtr. 4 | |
| ($ in millions, except per share amounts) | | | | | | | | | | | | |
| Total interest and related portfolio income | | $ | 108.0 | | | $ | 117.7 | | | $ | 118.4 | | | $ | 117.7 | |
| Net investment income | | $ | 39.5 | | | $ | 25.2 | �� | | $ | 18.3 | | | $ | 58.0 | |
| Net increase (decrease) in net assets resulting from operations | | $ | 133.1 | | | $ | 89.2 | | | $ | (96.5 | ) | | $ | 27.5 | |
| Basic earnings (loss) per common share | | $ | 0.89 | | | $ | 0.59 | | | $ | (0.63 | ) | | $ | 0.18 | |
| Diluted earnings (loss) per common share | | $ | 0.87 | | | $ | 0.57 | | | $ | (0.62 | ) | | $ | 0.18 | |
| | | | | | | | | | | | | | | | | |
| | | 2006 | |
| | | | |
| | | Qtr. 1 | | | Qtr. 2 | | | Qtr. 3 | | | Qtr. 4 | |
| | | | | | | | | | | | | |
| Total interest and related portfolio income | | $ | 111.0 | | | $ | 110.5 | | | $ | 113.4 | | | $ | 117.7 | |
| Net investment income | | $ | 41.3 | | | $ | 50.2 | | | $ | 48.7 | | | $ | 49.1 | |
| Net increase in net assets resulting from operations | | $ | 99.6 | | | $ | 33.7 | | | $ | 77.9 | | | $ | 33.9 | |
| Basic earnings per common share | | $ | 0.72 | | | $ | 0.24 | | | $ | 0.54 | | | $ | 0.23 | |
| Diluted earnings per common share | | $ | 0.70 | | | $ | 0.24 | | | $ | 0.53 | | | $ | 0.23 | |
Note 15. Litigation
On June 23, 2004, the Company was notified by the SEC that the SEC was conducting an informal investigation of the Company. The investigation related to the valuation of securities in the Company’s private finance portfolio and other matters. On June 20, 2007, the Company announced that it entered into a settlement with the SEC that resolved the SEC’s informal investigation. As part of the settlement and without admitting or denying the SEC’s allegations, the Company agreed to the entry of an administrative order. In the order the SEC alleged that, between June 30, 2001, and March 31, 2003, the Company did not maintain books, records and accounts which, in reasonable detail, supported or accurately and fairly reflected valuations of certain securities in the Company’s private finance portfolio and, as a result, did not meet certain recordkeeping and internal controls provisions of the federal securities laws. In the administrative order, the SEC ordered the Company to continue to maintain certain of its current valuation-related controls. Specifically, for a period of two years, the Company has undertaken to: (1) continue to employ a Chief Valuation Officer, or a similarly structured officer-level employee, to oversee its quarterly valuation processes; and (2) continue to employ third-party valuation consultants to assist in its quarterly valuation processes.
On December 22, 2004, the Company received letters from the U.S. Attorney for the District of Columbia requesting the preservation and production of information regarding the Company and Business Loan Express, LLC (currently known as Ciena Capital LLC) in connection with a criminal investigation relating to matters similar to those investigated by and settled with the SEC as discussed above. The Company produced materials in response to the requests from the U.S. Attorney’s office and certain current and former employees were interviewed by the U.S. Attorney’s Office. The Company has voluntarily cooperated with the investigation.
In late December 2006, the Company received a subpoena from the U.S. Attorney for the District of Columbia requesting, among other things, the production of records regarding the use of private investigators by the Company or its agents. The Board established a committee, which was advised by its own counsel, to review this matter. In the course of gathering documents responsive to the subpoena, the Company became aware that an agent of the Company obtained what were represented to be telephone
137
ALLIED CAPITAL CORPORATION AND SUBSIDIARIES
NOTES TO CONSOLIDATED FINANCIAL STATEMENTS — (Continued)
Note 15. Litigation, continued
records of David Einhorn and which purport to be records of calls from Greenlight Capital during a period of time in 2005. Also, while the Company was gathering documents responsive to the subpoena, allegations were made that the Company’s management had authorized the acquisition of these records and that management was subsequently advised that these records had been obtained. The Company’s management has stated that these allegations are not true. The Company has cooperated fully with the inquiry by the U.S. Attorney’s Office.
On February 13, 2007, Rena Nadoff filed a shareholder derivative action in the Superior Court of the District of Columbia, captioned Rena Nadoff v. Walton, et al., CA 001060-07, seeking unspecified compensatory and other damages, as well as equitable relief on behalf of Allied Capital Corporation. The complaint was summarily dismissed in July 2007. The complaint alleged breach of fiduciary duty by the Board of Directors arising from internal control failures and mismanagement of Business Loan Express, LLC, an Allied Capital portfolio company. On October 5, 2007, Rena Nadoff sent a letter to the Company’s Board of Directors with substantially the same claims and a request that the Board of Directors investigate the claims and take appropriate action. The Board of Directors has established a committee, which is advised by its own counsel, to review the matter.
On February 26, 2007, Dana Ross filed a class action complaint in the U.S. District Court for the District of Columbia in which she alleges that Allied Capital Corporation and certain members of management violated Sections 10(b) and 20(a) of the Securities Exchange Act of 1934 and Rule 10b-5 thereunder. Thereafter, the court appointed new lead counsel and approved new lead plaintiffs. On July 30, 2007, plaintiffs served an amended complaint. Plaintiffs claim that, between November 7, 2005, and January 22, 2007, Allied Capital either failed to disclose or misrepresented information about its portfolio company, Business Loan Express, LLC. Plaintiffs seek unspecified compensatory and other damages, as well as other relief. The Company believes the lawsuit is without merit, and intends to defend the lawsuit vigorously. On September 13, 2007, the Company filed a motion to dismiss the lawsuit. The motion is pending.
In addition, the Company is party to certain lawsuits in the normal course of business.
While the outcome of any of the open legal proceedings described above cannot at this time be predicted with certainty, the Company does not expect these matters will materially affect its financial condition or results of operations.
138
Item 9. Changes in and Disagreements with Accountants on Accounting and Financial Disclosure.
None.
Item 9A. Controls and Procedures.
(a) Evaluation of Disclosure Controls and Procedures.As of the end of the year covered by this annual report on Form 10-K, our Chief Executive Officer and Chief Financial Officer conducted an evaluation of our disclosure controls and procedures (as defined in Rules 13a-15(e) of the Securities Exchange Act of 1934). Based upon this evaluation, our Chief Executive Officer and Chief Financial Officer concluded that our disclosure controls and procedures are effective to allow timely decisions regarding required disclosure of any material information relating to us that is required to be disclosed by us in the reports we file or submit under the Securities Exchange Act of 1934.
(b) Management’s Annual Report on Internal Control over Financial Reporting. Our Management is responsible for establishing and maintaining adequate internal control over financial reporting, as such term is defined in Rule 13a-15(f) under the Securities Exchange Act of 1934 and for the assessment of the effectiveness of internal control over financial reporting. Management’s report on internal control over financial reporting is set forth above under the heading “Management’s Report on Internal Control over Financial Reporting” in Item 8.
(c) Attestation Report of the Registered Public Accounting Firm. Our independent registered public accounting firm, KPMG LLP, has issued an attestation report on the effectiveness of the Company’s internal control over financial reporting, which is set forth above under the heading “Report of Independent Registered Public Accounting Firm” in Item 8.
(d) Changes in Internal Control over Financial Reporting.There have been no changes in our internal control over financial reporting (as defined in Rule 13a-15(f) of the Securities Exchange Act of 1934) that occurred during our most recently completed fiscal quarter, that have materially affected, or are reasonably likely to materially affect, our internal control over financial reporting.
Item 9B. Other Information.
None.
PART III
Item 10. Directors, Executive Officers and Corporate Governance.
Information in response to this Item is incorporated by reference to the identification of directors and nominees contained in the “Proposal 1. Election of Directors” section, and the subsections “Proposal 1. Election of Directors — Section 16(a) Beneficial Ownership Reporting Compliance,” “Corporate Governance — Committees of the Board of Directors” and “Corporate Governance — Information about Executive Officers” of our definitive proxy statement in connection with its 2008 Annual Meeting of Stockholders, scheduled to be held on April 25, 2008, (the “2008 Proxy Statement”).
We have adopted a Code of Business Conduct for all of our directors and employees, including our Chief Executive Officer and Chief Financial Officer. We have posted a copy of our Code of Business Conduct on our website at www.alliedcapital.com. We will provide you a copy of our Code of Business Conduct without charge upon request. To obtain a copy of our Code of Business Conduct, please send your written request to Allied Capital Corporation, 1919 Pennsylvania Avenue, N.W., Washington, D.C. 20006, Attn: Corporate Secretary.
139
Any waivers of the Code of Business Conduct must be approved, in advance, by our Board of Directors. Any amendments to, or waivers from, the Code of Business Conduct that apply to our executive officers and directors will be posted on our website located at www.alliedcapital.com.
Our common stock is listed on the New York Stock Exchange (NYSE) as its primary listing. The NYSE requires the Chief Executive Officer of each listed company to certify to the NYSE annually, after the company’s annual meeting of stockholders, that the company is in compliance with the NYSE’s corporate governance listing standards. In accordance with the NYSE’s procedures, shortly after the 2007 annual meeting of stockholders, William L. Walton, our Chairman and Chief Executive Officer, certified to the NYSE that he was unaware of any violation of the NYSE’s corporate governance listing standards.
Item 11. Executive Compensation.
Information in response to this Item is incorporated by reference to subsections “Proposal 1. Election of Directors — Director Compensation,” “Executive Compensation” and “Corporate Governance — Compensation Committee Interlocks and Insider Participation” of the 2008 Proxy Statement.
Item 12. Security Ownership of Certain Beneficial Owners and Management and Related Stockholder Matters.
Information in response to this Item is incorporated by reference to the subsections “Proxy Statement — Security Ownership of Management and Certain Beneficial Owners” and “Executive Compensation — Equity Compensation Plan Information” of the 2008 Proxy Statement.
Item 13. Certain Relationships and Related Transactions, and Director Independence.
Information in response to this Item is incorporated by reference to the section “Corporate Governance — Certain Relationships and Related Transactions” and “Corporate Governance — Director Independence” of the 2008 Proxy Statement.
Item 14. Principal Accountant Fees and Services.
Information in response to this Item is incorporated by reference to the subsections “Proposal 2. Ratification of Selection of Independent Registered Public Accounting Firm — Fees Paid to KPMG LLP for 2007 and 2006” and “Proposal 2. Ratification of Selection of Independent Registered Public Accounting Firm — Report of the Audit Committee” of the 2008 Proxy Statement.
PART IV
Item 15. Exhibits and Financial Statement Schedules
(a) Documents filed as part of this Report:
| |
| | 1. The following financial statements are filed herewith under Item 8: |
| |
| | Management’s Report on Internal Control Over Financial Reporting |
| |
| | Reports of the Independent Registered Public Accounting Firm |
| |
| | Consolidated Balance Sheet — December 31, 2007 and 2006 |
| |
| | Consolidated Statement of Operations — For the Years Ended December 31, 2007, 2006, and 2005 |
| |
| | Consolidated Statement of Changes in Net Assets — For the Years Ended December 31, 2007, 2006, and 2005 |
140
| |
| | Consolidated Statement of Cash Flows — For the Years Ended December 31, 2007, 2006, and 2005 |
| |
| | Consolidated Statement of Investments — December 31, 2007 |
| |
| | Consolidated Statement of Investments — December 31, 2006 |
| |
| | Notes to Consolidated Financial Statements |
| |
| | 2. The following financial statement schedules are filed herewith: |
Schedule 12-14 of Investments in and Advances to Affiliates.
| |
| | In addition, there may be additional information not provided in a schedule because (i) such information is not required or (ii) the information required has been presented in the aforementioned financial statements. |
| |
| | 3. The following exhibits are filed herewith or incorporated by reference as set forth below: |
| | | | | | | |
| Exhibit | | | | | |
| Number | | | | | |
| | | | | | |
| | | Description |
| | | |
| | 3 | .1 | | Restated Articles of Incorporation.(Incorporated by reference to Exhibit a.2 filed with Allied Capital’s Post-Effective Amendment No. 1 to registration statement on Form N-2 (File No. 333-141847) filed on June 1, 2007). |
| | 3 | .2 | | Amended and Restated Bylaws.(Incorporated by reference to Exhibit 3.1. filed with Allied Capital’s Form 8-K on July 30, 2007). |
| | 4 | .1 | | Specimen Certificate of Allied Capital’s Common Stock, par value $0.0001 per share.(Incorporated by reference to Exhibit d. filed with Allied Capital’s registration statement on Form N-2 (File No. 333-51899) filed on May 6, 1998). |
| | 4 | .3 | | Form of Note under the Indenture relating to the issuance of debt securities.(Contained in Exhibit 4.4). (Incorporated by reference to Exhibit d.1 filed with Allied Capital’s registration statement on Form N-2/ A (File No. 333-133755) filed on June 21, 2006). |
| | 4 | .4 | | Indenture by and between Allied Capital Corporation and The Bank of New York, dated June 16, 2006.(Incorporated by reference to Exhibit d.2 filed with Allied Capital’s registration statement on Form N-2/ A (File No. 333-133755) filed on June 21, 2006). |
| | 4 | .5 | | Statement of Eligibility of Trustee on Form T-1.(Incorporated by reference to Exhibit d.3 filed with Allied Capital’s registration statement on Form N-2 (File No. 333-133755) filed on May 3, 2006). |
| | 4 | .6 | | Form of First Supplemental Indenture by and between Allied Capital Corporation and the Bank of New York, dated as of July 25, 2006.(Incorporated by reference to Exhibit d.4 filed with Allied Capital’s Post-Effective Amendment No. 1 to the registration statement on Form N-2/A (File No. 333-133755) filed on July 25, 2006). |
| | 4 | .7 | | Form of 6.625% Note due 2011.(Incorporated by reference to Exhibit d.5 filed with Allied Capital’s Post-Effective Amendment No. 1 to the registration statement on Form N-2/A (File No. 333-133755) filed on July 25, 2006). |
| | 4 | .8 | | Form of Second Supplemental Indenture by and between Allied Capital Corporation and The Bank of New York, dated as of December 8, 2006.(Incorporated by reference to Exhibit d.6 filed with Allied Capital’s Post-Effective Amendment No. 2 to the registration statement on Form N-2/A (File No. 333-133755) filed on December 8, 2006). |
| | 4 | .9 | | Form of 6.000% Notes due 2012.(Incorporated by reference to Exhibit d.7 filed with Allied Capital’s Post-Effective Amendment No. 2 to the registration statement on Form N-2/A (File No. 333-133755) filed on December 8, 2006). |
141
| | | | | | | |
| Exhibit | | | | | |
| Number | | | | | |
| | | | | | |
| | | Description |
| | | |
| | 4 | .10 | | Form of Third Supplemental Indenture by and between Allied Capital Corporation and The Bank of New York, dated as of March 28, 2007.(Incorporated by reference to Exhibit d.8 filed with Allied Capital’s Post-Effective Amendment No. 3 to the registration statement on Form N-2/A (File No. 333-133755) filed on March 28, 2007). |
| | 4 | .11 | | Form of 6.875% Notes due 2047.(Incorporated by reference to Exhibit d.9 filed with Allied Capital’s Post-Effective Amendment No. 3 to the registration statement on Form N-2/A (File No. 333-133755) filed on March 28, 2007). |
| | 4 | .11(a) | | Form of 6.875% Notes due 2047.(Incorporated by reference to Exhibit d.9(a) filed with Allied Capital’s Post-Effective Amendment No. 4 to the registration statement on Form N-2/A (File No. 333-133755) filed on April 2, 2007). |
| | 10 | .1 | | Dividend Reinvestment Plan, as amended.(Incorporated by reference to Exhibit e. filed with Allied Capital’s registration statement on Form N-2 (File No. 333-87862) filed on May 8, 2002). |
| | 10 | .2 | | Credit Agreement, dated September 30, 2005.(Incorporated by reference to Exhibit 10.1 filed with Allied Capital’s Form 8-K on October 3, 2005). |
| | 10 | .2(a) | | First Amendment to Credit Agreement, dated November 4, 2005.(Incorporated by reference to Exhibit 10.2(a) filed with Allied Capital’s Form 10-Q for the period ended September 30, 2005). |
| | 10 | .2(b) | | Second Amendment to Credit Agreement, dated May 11, 2006.(Incorporated by reference to Exhibit 10.1 filed with Allied Capital’s Form 8-K filed on May 12, 2006). |
| | 10 | .2(c) | | Third Amendment to Credit Agreement, dated May 19, 2006.(Incorporated by reference to Exhibit 10.1 filed with Allied Capital’s Form 8-K filed on May 23, 2006). |
| | 10 | .3 | | Note Agreement, dated October 13, 2005.(Incorporated by reference to Exhibit 10.1 filed with Allied Capital’s Form 8-K on October 14, 2005). |
| | 10 | .4 | | Note Agreement, dated May 1, 2006.(Incorporated by reference to Exhibit 10.1 filed with Allied Capital’s Form 8-K on May 1, 2006). |
| | 10 | .15 | | Second Amended and Restated Control Investor Guaranty, dated as of January 30, 2008, between Allied Capital and CitiBank, N.A., as Administrative Agent.(Incorporated by reference to Exhibit 10.1 filed with Allied Capital’s Form 8-K filed on February 5, 2008). |
| | 10 | .17 | | The 2005 Allied Capital Corporation Non-Qualified Deferred Compensation Plan II.(Incorporated by reference to Exhibit 10.2 filed with Allied Capital’s Form 8-K filed on December 21, 2005). |
| | 10 | .17(a) | | Amendment to The 2005 Allied Capital Corporation Non-Qualified Deferred Compensation Plan II, dated January 20, 2006.(Incorporated by reference to Exhibit 10.17(a) filed with Allied Capital’s Form 10-K for the year ended December 31, 2005). |
| | 10 | .17(b) | | Amendment to The 2005 Allied Capital Corporation Non-Qualified Deferred Compensation Plan II, dated December 14, 2007.(Incorporated by reference to Exhibit 10.2 filed with Allied Capital’s Form 8-K filed on December 19, 2007). |
| | 10 | .18 | | The 2005 Allied Capital Corporation Non-Qualified Deferred Compensation Plan.(Incorporated by reference to Exhibit 10.1 filed with Allied Capital’s Form 8-K filed on December 21, 2005). |
| | 10 | .18(a) | | Amendment to The 2005 Allied Capital Corporation Non-Qualified Deferred Compensation Plan, dated January 20, 2006.(Incorporated by reference to Exhibit 10.18(a) filed with Allied Capital’s Form 10-K for the year ended December 31, 2005). |
| | 10 | .18(b) | | Amendment to The 2005 Allied Capital Corporation Non-Qualified Deferred Compensation Plan, dated December 14, 2007.(Incorporated by reference to Exhibit 10.1 filed with Allied Capital’s Form 8-K filed on December 19, 2007). |
142
| | | | | | | |
| Exhibit | | | | | |
| Number | | | | | |
| | | | | | |
| | | Description |
| | | |
| | 10 | .19 | | Amended Stock Option Plan.(Incorporated by reference to Appendix B of Allied Capital’s definitive proxy statement for Allied Capital’s 2007 Annual Meeting of Stockholders filed on April 3, 2007). |
| | 10 | .20(a) | | Allied Capital Corporation 401(k) Plan, dated September 1, 1999.(Incorporated by reference to Exhibit 4.4 filed with Allied Capital’s registration statement on Form S-8 (File No. 333-88681) filed on October 8, 1999). |
| | 10 | .20(b) | | Amendment to Allied Capital Corporation 401(k) Plan, dated April 15, 2004.(Incorporated by reference to Exhibit 10.20(b) filed with Allied Capital’s Form 10-Q for the period ended June 30, 2004). |
| | 10 | .20(c) | | Amendment to Allied Capital Corporation 401(k) plan, dated November 1, 2005.(Incorporated by reference to Exhibit 10.20(c) filed with Allied Capital’s Form 10-Q for the quarter ended September 30, 2005). |
| | 10 | .20(d) | | Amendment to Allied Capital Corporation 401(k) plan, dated April 21, 2006.(Incorporated by reference to Exhibit i.4(c) filed with Allied Capital’s Form N-2 (File No. 333-133755) filed on May 3, 2006). |
| | 10 | .20(e) | | Amendment to Allied Capital Corporation 401(k) plan, adopted December 18, 2006.(Incorporated by reference to Exhibit 10.20(e) filed with Allied Capital’s Form 10-K for the year ended December 31, 2006). |
| | 10 | .20(f) | | Amendment to Allied Capital Corporation 401(k) plan, dated June 21, 2007.(Incorporated by reference to Exhibit 10.20(f) filed with Allied Capital’s Form 10-Q for the quarter ended June 30, 2007). |
| | 10 | .20(g) | | Amendment to Allied Capital Corporation 401(k) plan, dated June 21, 2007.(Incorporated by reference to Exhibit 10.20(g) filed with Allied Capital’s Form 10-Q for the quarter ended June 30, 2007). |
| | 10 | .20(h) | | Amendment to Allied Capital Corporation 401(k) plan, dated September 14, 2007, with an effective date of January 1, 2008.(Incorporated by reference to Exhibit 10.20(h) filed with Allied Capital’s Form 10-Q for the quarter ended September 30, 2007). |
| | 10 | .21 | | Employment Agreement, dated January 1, 2004, between Allied Capital and William L. Walton.(Incorporated by reference to Exhibit 10.21 filed with Allied Capital’s Form 10-K for the year ended December 31, 2003). |
| | 10 | .21(a) | | Amendment to Employment Agreement, dated March 29, 2007, between Allied Capital and William L. Walton.(Incorporated by reference to Exhibit 10.1 filed with Allied Capital’s Form 8-K filed on April 3, 2007). |
| | 10 | .22 | | Employment Agreement, dated January 1, 2004, between Allied Capital and Joan M. Sweeney.(Incorporated by reference to Exhibit 10.22 filed with Allied Capital’s Form 10-K for the year ended December 31, 2003). |
| | 10 | .22(a) | | Amendment to Employment Agreement, dated March 29, 2007, between Allied Capital and Joan M. Sweeney.(Incorporated by reference to Exhibit 10.2 filed with Allied Capital’s Form 8-K filed on April 3, 2007). |
| | 10 | .23 | | Employment Agreement, dated January 1, 2004, between Allied Capital and Penelope F. Roll.(Incorporated by reference to Exhibit 10.23 filed with Allied Capital’s Form 10-K for the year ended December 31, 2006). |
| | 10 | .23(a) | | Amendment to Employment Agreement, dated March 29, 2007, between Allied Capital and Penelope F. Roll.(Incorporated by reference to Exhibit 10.3 filed with Allied Capital’s Form 8-K filed on April 3, 2007). |
| | 10 | .25 | | Form of Custody Agreement with Riggs Bank N.A., which was assumed by PNC Bank through merger.(Incorporated by reference to Exhibit j.1 filed with Allied Capital’s registration statement on Form N-2 (File No. 333-51899) filed on May 6, 1998). |
| | 10 | .26 | | Custodian Agreement with Chevy Chase Trust.(Incorporated by reference to Exhibit 10.26 filed with Allied Capital’s Form 10-K for the year ended December 31, 2005). |
143
| | | | | | | |
| Exhibit | | | | | |
| Number | | | | | |
| | | | | | |
| | | Description |
| | | |
| | 10 | .27 | | Custodian Agreement with Bank of America.(Incorporated by reference to Exhibit 10.27 filed with Allied Capital’s Form 10-K for the year ended December 31, 2005). |
| | 10 | .28 | | Code of Ethics.(Incorporated by reference to Exhibit 10.28 filed with Allied Capital’s Form 10-K for the year ended December 31, 2006). |
| | 10 | .29 | | Custodian Agreement with Union Bank of California.(Incorporated by reference to Exhibit 10.29 filed with Allied Capital’s Form 10-Q for the quarter ended June 30, 2006). |
| | 10 | .30 | | Custodian Agreement with M&T Bank.(Incorporated by reference to Exhibit 10.30 filed with Allied Capital’s Form 10-Q for the quarter ended June 30, 2006). |
| | 10 | .31 | | Note Agreement, dated as of May 14, 2003.(Incorporated by reference to Exhibit 10.31 filed with Allied Capital’s Form 10-Q for the quarter ended March 31, 2003). |
| | 10 | .37 | | Form of Indemnification Agreement between Allied Capital and its directors and certain officers.(Incorporated by reference to Exhibit 10.37 filed with Allied Capital’s Form 10-K for the year ended December 31, 2003). |
| | 10 | .38 | | Note Agreement, dated as of March 25, 2004.(Incorporated by reference to Exhibit 10.38 filed with Allied Capital’s Form 10-Q for the period ended March 31, 2004.) |
| | 10 | .39 | | Note Agreement, dated as of November 15, 2004.(Incorporated by reference to Exhibit 99.1 filed with Allied Capital’s current report on Form 8-K filed on November 18, 2004.) |
| | 10 | .40 | | Real Estate Securities Purchase Agreement.(Incorporated by reference to Exhibit 2.1 filed with Allied Capital’s Form 8-K filed on May 4, 2005.) |
| | 10 | .41 | | Platform Assets Purchase Agreement.(Incorporated by reference to Exhibit 2.2 filed with Allied Capital’s Form 8-K filed on May 4, 2005.) |
| | 10 | .42 | | Transition Services Agreement.(Incorporated by reference to Exhibit 10.1 filed with Allied Capital’s Form 8-K filed on May 4, 2005.) |
| | 11 | | | Statement regarding computation of per share earnings is included in Note 7 to Allied Capital’s Notes to the Consolidated Financial Statements. |
| | 21 | | | Subsidiaries of Allied Capital and jurisdiction of incorporation/organization: |
| | | | | A.C. Corporation | | Delaware |
| | | | | Allied Capital REIT, Inc. | | Maryland |
| | | | | Allied Capital Holdings, LLC | | Delaware |
| | | | | Allied Investment Holdings, LLC | | Delaware |
| | | | | Allied Capital Beteiligungsberatung GmbH (inactive) | | Germany |
| | 23 | * | | Report and Consent of KPMG LLP, independent registered public accounting firm. |
| | 31 | .1* | | Certification of the Chief Executive Officer pursuant to Rule 13a-14 of the Securities Exchange Act of 1934. |
| | 31 | .2* | | Certification of the Chief Financial Officer pursuant to Rule 13a-14 of the Securities Exchange Act of 1934. |
| | 32 | .1* | | Certification of the Chief Executive Officer pursuant to Section 906 of the Sarbanes-Oxley Act of 2002, 18 U.S.C. Section 1350. |
| | 32 | .2* | | Certification of the Chief Financial Officer pursuant to Section 906 of the Sarbanes-Oxley Act of 2002, 18 U.S.C. Section 1350. |
144
SIGNATURES
Pursuant to the requirements of Section 13 or 15(d) of the Securities Exchange Act of 1934, the Registrant has duly caused this Report to be signed on its behalf by the undersigned, thereunto duly authorized on February 29, 2008.
| |
| | /s/William L. Walton |
| | |
| | William L. Walton |
| | Chairman of the Board and |
| | Chief Executive Officer |
Pursuant to the requirements of the Securities Exchange Act of 1934, this Report has been signed below by the following persons on behalf of the Registrant in the capacities and on the dates indicated.
| | | | | |
| | | Title | | |
| Signature | | (Capacity) | | Date |
| | | | | |
/s/William L. Walton
William L. Walton | | Chairman and Chief Executive Officer (Principal Executive Officer) | | February 29, 2008 |
| |
/s/Ann Torre Bates
Ann Torre Bates | | Director | | February 29, 2008 |
| |
/s/Brooks H. Browne
Brooks H. Browne | | Director | | February 29, 2008 |
| |
/s/John D. Firestone
John D. Firestone | | Director | | February 29, 2008 |
| |
/s/Anthony T. Garcia
Anthony T. Garcia | | Director | | February 29, 2008 |
| |
/s/Edwin L. Harper
Edwin L. Harper | | Director | | February 29, 2008 |
| |
/s/Lawrence I. Hebert
Lawrence I. Hebert | | Director | | February 29, 2008 |
| |
/s/John I. Leahy
John I. Leahy | | Director | | February 29, 2008 |
| |
/s/Robert E. Long
Robert E. Long | | Director | | February 29, 2008 |
| |
/s/Alex J. Pollock
Alex J. Pollock | | Director | | February 29, 2008 |
| |
/s/Marc F. Racicot
Marc F. Racicot | | Director | | February 29, 2008 |
| |
/s/Guy T. Steuart II
Guy T. Steuart II | | Director | | February 29, 2008 |
145
| | | | | |
| | | Title | | |
| Signature | | (Capacity) | | Date |
| | | | | |
/s/Joan M. Sweeney
Joan M. Sweeney | | Director | | February 29, 2008 |
| |
/s/Laura W. van Roijen
Laura W. van Roijen | | Director | | February 29, 2008 |
| |
/s/Penni F. Roll
Penni F. Roll | | Chief Financial Officer (Principal Financial and Accounting Officer) | | February 29, 2008 |
146
EXHIBIT INDEX
| | | | | |
| Exhibit | | | |
| Number | | | Description |
| | | | |
| | 23 | | | Report and Consent of KPMG LLP, independent registered public accounting firm. |
| | 31 | .1 | | Certification of the Chief Executive Officer pursuant to Rule 13a-14 of the Securities Exchange Act of 1934. |
| | 31 | .2 | | Certification of the Chief Financial Officer pursuant to Rule 13a-14 of the Securities Exchange Act of 1934. |
| | 32 | .1 | | Certification of the Chief Executive Officer pursuant to Section 906 of the Sarbanes-Oxley Act of 2002, 18 U.S.C. Section 1350. |
| | 32 | .2 | | Certification of the Chief Financial Officer pursuant to Section 906 of the Sarbanes-Oxley Act of 2002, 18 U.S.C. Section 1350. |
147
Schedule 12-14
ALLIED CAPITAL CORPORATION AND SUBSIDIARIES
SCHEDULE OF INVESTMENTS IN AND ADVANCES TO AFFILIATES
| | | | | | | | | | | | | | | | | | | | | | | | | | | | |
| | | | | Amount of Interest or | | | | | | | | |
| | | | | Dividends | | | | | | | | |
| PRIVATE FINANCE | | | | | | December 31, | | | | | | December 31, |
| Portfolio Company | | | | Credited | | | | 2006 | | Gross | | Gross | | 2007 |
| (in thousands) | | Investment(1) | | to Income(6) | | Other(2) | | Value | | Additions(3) | | Reductions(4) | | Value |
| |
| Companies More Than 25% Owned |
| |
| Alaris Consulting, LLC | | Senior Loan(5) | | | | | | | | | | $ | — | | | $ | 572 | | | $ | (572 | ) | | $ | — | |
| | (Business Services) | | Equity Interests | | | | | | | | | | | — | | | | 1,025 | | | | (1,025 | ) | | | — | |
| |
| AllBridge Financial, LLC | | Equity Interests | | | | | | | | | | | — | | | | 7,800 | | | | — | | | | 7,800 | |
| | (Financial Services) | | | | | | | | | | | | | | | | | | | | | | | | | | |
| |
| Allied Capital Senior Debt Fund, L.P. | | Equity Interests | | | | | | | | | | | — | | | | 32,811 | | | | — | | | | 32,811 | |
| | (Private Debt Fund) | | | | | | | | | | | | | | | | | | | | | | | | | | |
| |
| Avborne, Inc. | | Preferred Stock | | | | | | | | | | | 918 | | | | 715 | | | | — | | | | 1,633 | |
| | (Business Services) | | Common Stock | | | | | | | | | | | — | | | | — | | | | — | | | | — | |
| |
Avborne Heavy Maintenance,
Inc. | | Preferred Stock | | | | | | | | | | | — | | | | 2,557 | | | | — | | | | 2,557 | |
| | (Business Services) | | Common Stock | | | | | | | | | | | — | | | | 370 | | | | — | | | | 370 | |
| |
| Aviation Properties Corporation | | Common Stock | | | | | | | | | | | — | | | | 65 | | | | (65 | ) | | | — | |
| | (Business Services) | | | | | | | | | | | | | | | | | | | | | | | | | | |
| |
| Border Foods, Inc. | | Preferred Stock | | | | | | | | | | | — | | | | 4,648 | | | | — | | | | 4,648 | |
| | (Consumer Products) | | Common Stock | | | | | | | | | | | — | | | | — | | | | — | | | | — | |
| |
| Calder Capital Partners, LLC | | Senior Loan(5) | | | | | | $ | 46 | | | | 975 | | | | 2,189 | | | | (129 | ) | | | 3,035 | |
| | (Financial Services) | | Equity Interests | | | | | | | | | | | 2,076 | | | | 1,483 | | | | — | | | | 3,559 | |
| |
| Callidus Capital Corporation | | Senior Loan | | $ | 42 | | | | | | | | — | | | | 2,100 | | | | (2,100 | ) | | | — | |
| | (Financial Services) | | Subordinated Debt | | | 1,159 | | | | | | | | 5,762 | | | | 1,109 | | | | — | | | | 6,871 | |
| | | Common Stock | | | | | | | | | | | 22,550 | | | | 22,037 | | | | — | | | | 44,587 | |
| |
| Ciena Capital LLC | | Class A Equity | | | | | | | | | | | | | | | | | | | | | | | | |
| | (f/k/a Business Loan | | Interests(5) | | | | | | | | | | | 66,622 | | | | 32,422 | | | | (30,435 | ) | | | 68,609 | |
| | Express, LLC)
(Financial Services) | | Class B Equity Interests | | | | | | | | | | | 79,139 | | | | — | | | | (79,139 | ) | | | — | |
| | | | Class C Equity Interests | | | | | | | | | | | 64,976 | | | | — | | | | (64,976 | ) | | | — | |
| |
CitiPostal Inc.(9) | | Senior Loan | | | 2 | | | | | | | | | | | | 679 | | | | — | | | | 679 | |
| | (Business Services) | | Unitranche Debt | | | 187 | | | | | | | | | | | | 50,597 | | | | — | | | | 50,597 | |
| | | Subordinated Debt | | | 39 | | | | | | | | | | | | 8,049 | | | | — | | | | 8,049 | |
| | | Common Stock | | | | | | | | | | | | | | | 12,726 | | | | — | | | | 12,726 | |
| |
| Coverall North America, Inc. | | Unitranche Debt | | | 4,324 | | | | | | | | 36,333 | | | | 36 | | | | (1,446 | ) | | | 34,923 | |
| | (Business Services) | | Subordinated Debt | | | 919 | | | | | | | | 5,972 | | | | 7 | | | | — | | | | 5,979 | |
| | | Common Stock | | | | | | | | | | | 19,619 | | | | 7,978 | | | | — | | | | 27,597 | |
| |
| CR Holding, Inc. | | Subordinated Debt | | | 6,838 | | | | | | | | 39,401 | | | | 1,411 | | | | — | | | | 40,812 | |
| | (Consumer Products) | | Common Stock | | | | | | | | | | | 25,738 | | | | 15,196 | | | | — | | | | 40,934 | |
| |
| Direct Capital Corporation | | Subordinated Debt | | | 5,027 | | | | | | | | — | | | | 39,030 | | | | — | | | | 39,030 | |
| | (Financial Services) | | Common Stock | | | | | | | | | | | — | | | | 19,250 | | | | (12,344 | ) | | | 6,906 | |
| |
| Financial Pacific Company | | Subordinated Debt | | | 12,663 | | | | | | | | 71,362 | | | | 1,488 | | | | — | | | | 72,850 | |
| | (Financial Services) | | Preferred Stock | | | | | | | | | | | 15,942 | | | | 3,388 | | | | — | | | | 19,330 | |
| | | Common Stock | | | | | | | | | | | 65,186 | | | | — | | | | (26,642 | ) | | | 38,544 | |
| |
| ForeSite Towers, LLC | | Equity Interest | | | 1,269 | | | | | | | | 12,290 | | | | — | | | | (11,412 | ) | | | 878 | |
| | (Tower Leasing) | | | | | | | | | | | | | | | | | | | | | | | | | | |
| |
| Global Communications, LLC | | Senior Loan(5) | | | | | | | | | | | 15,957 | | | | — | | | | (14,135 | ) | | | 1,822 | |
| | (Business Services) | | Subordinated Debt | | | 3 | | | | | | | | 11,237 | | | | 99 | | | | (11,336 | ) | | | — | |
| | | Preferred Equity | | | | | | | | | | | | | | | | | | | | | | | | |
| | | Interest | | | | | | | | | | | — | | | | 14,067 | | | | (14,067 | ) | | | — | |
| | | Options | | | | | | | | | | | — | | | | 1,639 | | | | (1,639 | ) | | | — | |
| |
| Gordian Group, Inc. | | Senior Loan | | | (11 | ) | | | | | | | — | | | | 11,794 | | | | (11,794 | ) | | | — | |
| | (Business Services) | | Common Stock | | | | | | | | | | | — | | | | 6,942 | | | | (6,942 | ) | | | — | |
| |
| Healthy Pet Corp. | | Senior Loan | | | 1,309 | | | | | | | | 27,038 | | | | 6,350 | | | | (33,388 | ) | | | — | |
| | (Consumer Services) | | Subordinated Debt | | | 2,893 | | | | | | | | 43,579 | | | | 580 | | | | (44,159 | ) | | | — | |
| | | Common Stock | | | | | | | | | | | 28,921 | | | | 1,221 | | | | (30,142 | ) | | | — | |
| |
| HMT, Inc. | | Preferred Stock | | | | | | | | | | | 2,637 | | | | — | | | | (2,637 | ) | | | — | |
| | (Energy Services) | | Common Stock | | | | | | | | | | | 8,664 | | | | — | | | | (8,664 | ) | | | — | |
| | | Warrants | | | | | | | | | | | 3,336 | | | | — | | | | (3,336 | ) | | | — | |
| |
See related footnotes at the end of this schedule.
148
| | | | | | | | | | | | | | | | | | | | | | | | | | | | |
| | | | | Amount of Interest or | | | | | | | | |
| | | | | Dividends | | | | | | | | |
| PRIVATE FINANCE | | | | | | December 31, | | | | | | December 31, |
| Portfolio Company | | | | Credited | | | | 2006 | | Gross | | Gross | | 2007 |
| (in thousands) | | Investment(1) | | to Income(6) | | Other(2) | | Value | | Additions(3) | | Reductions(4) | | Value |
| |
Hot Stuff Foods, LLC(7) | | Senior Loan | | $ | 4,191 | | | | | | | $ | — | | | $ | 51,192 | | | $ | (440 | ) | | $ | 50,752 | |
| | (Consumer Products) | | Subordinated Debt | | | 6,543 | | | | | | | | — | | | | 29,907 | | | | — | | | | 29,907 | |
| | | | Subordinated Debt(5) | | | | | | | | | | | — | | | | 31,402 | | | | (30,065 | ) | | | 1,337 | |
| | | | Common Stock | | | | | | | | | | | — | | | | 8,461 | | | | (8,461 | ) | | | — | |
| |
| Huddle House, Inc. | | Senior Loan | | | 426 | | | | | | | | 19,950 | | | | — | | | | (19,950 | ) | | | — | |
| | (Retail) | | Subordinated Debt | | | 9,032 | | | | | | | | 58,196 | | | | 1,600 | | | | (178 | ) | | | 59,618 | |
| | | Common Stock | | | | | | | | | | | 41,662 | | | | 2,621 | | | | (129 | ) | | | 44,154 | |
| |
| Impact Innovations Group, LLC | | Equity Interests in | | | | | | | | | | | | | | | | | | | | | | | | |
| | (Business Services) | | Affiliate | | | | | | | | | | | 873 | | | | — | | | | (553 | ) | | | 320 | |
| |
| Insight Pharmaceuticals | | Subordinated Debt | | | 5,905 | | | | | | | | 43,884 | | | | 1,157 | | | | — | | | | 45,041 | |
| | Corporation | | Subordinated Debt(5) | | | | | | | | | | | 15,966 | | | | 830 | | | | — | | | | 16,796 | |
| | (Consumer Products) | | Preferred Stock | | | | | | | | | | | 7,845 | | | | — | | | | (6,383 | ) | | | 1,462 | |
| | | Common Stock | | | | | | | | | | | — | | | | — | | | | — | | | | — | |
| |
| Jakel, Inc. | | Subordinated Debt(5) | | | (11 | ) | | | | | | | 6,655 | | | | 9,025 | | | | (14,117 | ) | | | 1,563 | |
| | (Industrial Products) | | Preferred Stock | | | | | | | | | | | — | | | | 9,347 | | | | (9,347 | ) | | | — | |
| | | Common Stock | | | | | | | | | | | — | | | | 6,460 | | | | (6,460 | ) | | | — | |
| |
| Legacy Partners Group, Inc. | | Senior Loan(5) | | | | | | | | | | | 4,843 | | | | 2,804 | | | | (3,804 | ) | | | 3,843 | |
| | (Financial Services) | | Subordinated Debt | | | | | | | | | | | — | | | | — | | | | — | | | | — | |
| | | | Equity Interests | | | | | | | | | | | — | | | | 1,332 | | | | — | | | | 1,332 | |
| |
| Litterer Beteiligungs-GmbH | | Subordinated Debt | | | 42 | | | | | | | | 692 | | | | 80 | | | | — | | | | 772 | |
| | (Business Services) | | Equity Interest | | | | | | | | | | | 1,199 | | | | — | | | | (499 | ) | | | 700 | |
| |
| Mercury Air Centers, Inc. | | Subordinated Debt | | | 5,054 | | | | | | | | 49,217 | | | | 1,654 | | | | (50,871 | ) | | | — | |
| | (Business Services) | | Common Stock | | | | | | | | | | | 195,019 | | | | — | | | | (195,019 | ) | | | — | |
| |
| MVL Group, Inc. | | Senior Loan | | | 3,677 | | | | | | | | 27,245 | | | | 3,394 | | | | — | | | | 30,639 | |
| | (Business Services) | | Subordinated Debt | | | 5,931 | | | | | | | | 35,478 | | | | 4,465 | | | | — | | | | 39,943 | |
| | | Common Stock | | | | | | | | | | | — | | | | 4,949 | | | | — | | | | 4,949 | |
| |
| Old Orchard Brands, LLC | | Senior Loan | | | 347 | | | | | | | | — | | | | 23,500 | | | | (23,500 | ) | | | — | |
| | (Consumer Products) | | Subordinated Debt | | | 2,404 | | | | | | | | — | | | | 19,544 | | | | — | | | | 19,544 | |
| | | Equity Interests | | | | | | | | | | | — | | | | 25,419 | | | | — | | | | 25,419 | |
| |
| Penn Detroit Diesel Allison, LLC | | Subordinated Debt | | | 6,056 | | | | | | | | 37,994 | | | | 1,186 | | | | — | | | | 39,180 | |
| | (Business Services) | | Equity Interests | | | | | | | | | | | 25,949 | | | | 12,016 | | | | — | | | | 37,965 | |
| |
| Powell Plant Farms, Inc. | | Senior Loan(5) | | | | | | | | | | | 26,192 | | | | 4,134 | | | | (28,792 | ) | | | 1,534 | |
| | (Consumer Products) | | Subordinated Debt | | | | | | | | | | | 962 | | | | 18,261 | | | | (19,223 | ) | | | — | |
| | | Preferred Stock | | | | | | | | | | | — | | | | — | | | | — | | | | — | |
| | | Warrants | | | | | | | | | | | — | | | | — | | | | — | | | | — | |
| |
| Service Champ, Inc. | | Subordinated Debt | | | 4,450 | | | | | | | | 27,619 | | | | 732 | | | | — | | | | 28,351 | |
| | (Business Services) | | Common Stock | | | | | | | | | | | 16,786 | | | | 9,506 | | | | — | | | | 26,292 | |
| |
| Staffing Partners Holding | | | | | | | | | | | | | | | | | | | | | | | | | | |
| | Company, Inc. | | Subordinated Debt(5) | | | | | | | | | | | 486 | | | | — | | | | (263 | ) | | | 223 | |
| | (Business Services) | | | | | | | | | | | | | | | | | | | | | | | | | | |
| |
| Startec Global Communications | | | | | | | | | | | | | | | | | | | | | | | | | | |
| | Corporation | | Senior Loan | | | 723 | | | | | | | | 15,965 | | | | — | | | | (15,965 | ) | | | — | |
| | (Telecommunications) | | Common Stock | | | | | | | | | | | 11,232 | | | | 26,023 | | | | (37,255 | ) | | | — | |
| |
| Startec Equity, LLC | | Equity Interests | | | | | | | | | | | — | | | | 469 | | | | (39 | ) | | | 430 | |
| | (Telecommunications) | | | | | | | | | | | | | | | | | | | | | | | | | | |
| |
| Sweet Traditions, Inc. | | Senior Loan(5) | | | 1,088 | | | | | | | | 35,172 | | | | 1,181 | | | | (1,124 | ) | | | 35,229 | |
| | (Retail) | | Preferred Stock | | | | | | | | | | | 400 | | | | 550 | | | | (950 | ) | | | — | |
| | | | Common Stock | | | | | | | | | | | 50 | | | | — | | | | (50 | ) | | | — | |
| |
| Triview Investments, Inc. | | Senior Loan | | | 977 | | | | | | | | 14,747 | | | | 11 | | | | (14,325 | ) | | | 433 | |
| | (Broadcasting & Cable/ | | Subordinated Debt | | | 11,338 | | | | | | | | 56,008 | | | | 32,425 | | | | (45,456 | ) | | | 42,977 | |
| | Business Services/ | | Subordinated Debt(5) | | | 592 | | | | | | | | 4,342 | | | | 841 | | | | (3,600 | ) | | | 1,583 | |
| | Consumer Products) | | Common Stock | | | 37 | | | | | | | | 31,322 | | | | 53,975 | | | | (1,844 | ) | | | 83,453 | |
| |
| Unitranche Fund LLC | | Subordinated Certificates | | | 3 | | | | | | | | | | | | 744 | | | | — | | | | 744 | |
| | (Private Debt Fund) | | Equity Interests | | | | | | | | | | | | | | | 1 | | | | — | | | | 1 | |
| |
| Worldwide Express Operations, LLC | | Subordinated Debt | | | 166 | | | | | | | | — | | | | 2,846 | | | | (176 | ) | | | 2,670 | |
| | (Business Services) | | Equity Interests | | | | | | | | | | | — | | | | 21,516 | | | | — | | | | 21,516 | |
| | | | Warrants | | | | | | | | | | | — | | | | 272 | | | | — | | | | 272 | |
| |
| Total companies more than 25% owned | | $ | 105,634 | | | | | | | $ | 1,490,180 | | | | | | | | | | | $ | 1,279,080 | |
| |
See related footnotes at the end of this schedule.
149
| | | | | | | | | | | | | | | | | | | | | | | | | | | | |
| | | | | Amount of Interest or | | | | | | | | |
| | | | | Dividends | | | | | | | | |
| PRIVATE FINANCE | | | | | | December 31, | | | | | | December 31, |
| Portfolio Company | | | | Credited | | | | 2006 | | Gross | | Gross | | 2007 |
| (in thousands) | | Investment(1) | | to Income(6) | | Other(2) | | Value | | Additions(3) | | Reductions(4) | | Value |
| |
Companies 5% to 25% Owned | | | | | | | | | | | | | | | | | | | | | | | | | | |
| |
| 10th Street, LLC | | Subordinated Debt | | $ | 457 | | | | | | | $ | 2,289 | | | $ | 20,647 | | | $ | (2,291 | ) | | $ | 20,645 | |
| | (Business Services) | | Equity Interests | | | | | | | | | | | 2,250 | | | | 679 | | | | (1,829 | ) | | | 1,100 | |
| |
| Advantage Sales & | | | | | | | | | | | | | | | | | | | | | | | | | | |
| | Marketing, Inc. | | Subordinated Debt | | | 18,768 | | | | | | | | 151,648 | | | | 3,206 | | | | — | | | | 154,854 | |
| | (Business Services) | | Equity Interests | | | | | | | | | | | 11,000 | | | | — | | | | (27 | ) | | | 10,973 | |
| |
| Air Medical Group Holdings LLC | | Senior Loan | | | 219 | | | | | | | | 1,763 | | | | 7,367 | | | | (6,150 | ) | | | 2,980 | |
| | (Healthcare Services) | | Subordinated Debt | | | 1,931 | | | | | | | | 35,128 | | | | 318 | | | | (35,446 | ) | | | — | |
| | | | Equity Interests | | | | | | | | | | | 5,950 | | | | 4,850 | | | | — | | | | 10,800 | |
| |
| Alpine ESP Holdings, Inc. | | Preferred Stock | | | | | | | | | | | 602 | | | | 147 | | | | — | | | | 749 | |
| | (Business Services) | | Common Stock | | | | | | | | | | | — | | | | 262 | | | | — | | | | 262 | |
| |
| Amerex Group, LLC | | Subordinated Debt | | | 1,022 | | | | | | | | 8,400 | | | | — | | | | — | | | | 8,400 | |
| | (Consumer Products) | | Equity Interests | | | | | | | | | | | 13,823 | | | | — | | | | (110 | ) | | | 13,713 | |
| |
| BB&T Capital | | | | | | | | | | | | | | | | | | | | | | | | | | |
| | Partners/Windsor | | | | | | | | | | | | | | | | | | | | | | | | | | |
| | Mezzanine Fund, LLC | | Equity Interests | | | | | | | | | | | 5,554 | | | | 5,913 | | | | — | | | | 11,467 | |
| | (Private Equity Fund) | | | | | | | | | | | | | | | | | | | | | | | | | | |
| |
| Becker Underwood, Inc. | | Subordinated Debt | | | 3,636 | | | | | | | | 24,163 | | | | 635 | | | | — | | | | 24,798 | |
| | (Industrial Products) | | Common Stock | | | | | | | | | | | 3,700 | | | | 490 | | | | — | | | | 4,190 | |
| |
| BI Incorporated | | Subordinated Debt | | | 4,197 | | | | | | | | 30,135 | | | | 364 | | | | — | | | | 30,499 | |
| | (Business Services) | | Common Stock | | | | | | | | | | | 4,100 | | | | 3,282 | | | | — | | | | 7,382 | |
| |
CitiPostal, Inc. and Affiliates(9) | | Senior Loan | | | 2,012 | | | | | | | | 18,280 | | | | 2,894 | | | | (21,174 | ) | | | — | |
| | (Business Services) | | Equity Interests | | | 105 | | | | | | | | 2,450 | | | | 183 | | | | (2,633 | ) | | | — | |
| |
| Creative Group, Inc. | | Subordinated Debt(5) | | | 480 | | | | | | | | 13,656 | | | | 30 | | | | (7,489 | ) | | | 6,197 | |
| | (Business Services) | | Common Stock | | | | | | | | | | | — | | | | — | | | | — | | | | — | |
| | | Warrant | | | | | | | | | | | 1,387 | | | | — | | | | (1,387 | ) | | | — | |
| |
| Drew Foam Companies, Inc. | | Preferred Stock | | | | | | | | | | | 722 | | | | — | | | | (326 | ) | | | 396 | |
| | (Business Services) | | Common Stock | | | | | | | | | | | 7 | | | | — | | | | (7 | ) | | | — | |
| |
| MedBridge Healthcare, LLC | | Senior Loan(5) | | | | | | | | | | | 7,164 | | | | — | | | | — | | | | 7,164 | |
| | (Healthcare Services) | | Subordinated Debt(5) | | | | | | | | | | | 1,813 | | | | 593 | | | | — | | | | 2,406 | |
| | | Convertible | | | | | | | | | | | | | | | | | | | | | | | | |
| | | Subordinated Debt(5) | | | | | | | | | | | — | | | | — | | | | — | | | | — | |
| | | Equity Interests | | | | | | | | | | | — | | | | 110 | | | | (110 | ) | | | — | |
| |
MHF Logistical Solutions, Inc(8) | | Subordinated Debt(5) | | | | | | | | | | | — | | | | 27,518 | | | | (18,238 | ) | | | 9,280 | |
| | (Business Services) | | Subordinated Debt(5) | | | | | | | | | | | — | | | | — | | | | — | | | | — | |
| | | Common Stock | | | | | | | | | | | — | | | | — | | | | — | | | | — | |
| | | Warrants | | | | | | | | | | | — | | | | — | | | | — | | | | — | |
| |
| Multi-Ad Services, Inc. | | Unitranche Debt | | | 2,292 | | | | | | | | 19,879 | | | | 25 | | | | (200 | ) | | | 19,704 | |
| | (Business Services) | | Equity Interests | | | | | | | | | | | 2,000 | | | | — | | | | (1,060 | ) | | | 940 | |
| |
| Nexcel Synthetics, LLC | | Subordinated Debt | | | 611 | | | | | | | | 10,978 | | | | 199 | | | | (11,177 | ) | | | — | |
| | (Consumer Products) | | Equity Interests | | | | | | | | | | | 1,486 | | | | 269 | | | | (1,755 | ) | | | — | |
| |
| PresAir LLC | | Senior Loan | | | 28 | | | | | | | | 2,206 | | | | 3,315 | | | | (5,521 | ) | | | — | |
| | (Industrial Products) | | Equity Interests | | | | | | | | | | | — | | | | 1,341 | | | | (1,341 | ) | | | — | |
| |
| Progressive International | | | | | | | | | | | | | | | | | | | | | | | | | | |
| | Corporation | | Subordinated Debt | | | 995 | | | | | | | | 7,533 | | | | 151 | | | | (6,139 | ) | | | 1,545 | |
| | (Consumer Products) | | Preferred Stock | | | | | | | | | | | 1,024 | | | | 14 | | | | — | | | | 1,038 | |
| | | Common Stock | | | | | | | | | | | 2,300 | | | | 2,600 | | | | — | | | | 4,900 | |
| | | Warrants | | | | | | | | | | | — | | | | — | | | | — | | | | — | |
| |
| Regency Healthcare Group, LLC | | Senior Loan | | | 96 | | | | | | | | 1,232 | | | | 18 | | | | (1,250 | ) | | | — | |
| | (Healthcare Services) | | Unitranche Debt | | | 1,791 | | | | | | | | 19,908 | | | | 47 | | | | (8,014 | ) | | | 11,941 | |
| | | | Equity Interests | | | | | | | | | | | 1,616 | | | | 65 | | | | — | | | | 1,681 | |
| |
| SGT India Private Limited | | Common Stock | | | | | | | | | | | 3,346 | | | | 155 | | | | (426 | ) | | | 3,075 | |
| | (Business Services) | | | | | | | | | | | | | | | | | | | | | | | | | | |
| |
| Soteria Imaging Services, LLC | | Subordinated Debt | | | 2,122 | | | | | | | | 17,569 | | | | 1,175 | | | | (5,000 | ) | | | 13,744 | |
| | (Healthcare Services) | | Equity Interests | | | | | | | | | | | 2,541 | | | | 145 | | | | — | | | | 2,686 | |
| |
| Universal Environmental | | | | | | | | | | | | | | | | | | | | | | | | | | |
| | Services, LLC | | Unitranche Debt | | | 815 | | | | | | | | 10,211 | | | | 777 | | | | (10,988 | ) | | | — | |
| | (Business Services) | | Equity Interests | | | | | | | | | | | — | | | | 15 | | | | (15 | ) | | | — | |
| |
| Total companies 5% to 25% owned | | $ | 41,577 | | | | | | | $ | 449,813 | | | | | | | | | | | $ | 389,509 | |
| |
This schedule should be read in conjunction with the Company’s consolidated financial statements, including the consolidated statement of investments and Note 3 to the consolidated financial statements. Note 3 includes additional information regarding activities in the private finance portfolio.
| |
| (1) | Common stock, preferred stock, warrants, options, and equity interests are generally non-income producing and restricted. The principal amount for loans and debt securities and the number of shares of common stock and preferred stock is shown in the consolidated statement of investments as of December 31, 2007. |
| |
| (2) | Other includes interest, dividend, or other income which was applied to the principal of the investment and therefore reduced the total investment. These reductions are also included in the Gross Reductions for the investment, as applicable. |
150
| |
| (3) | Gross additions include increases in the cost basis of investments resulting from new portfolio investments,paid-in-kind interest or dividends, the amortization of discounts and closing fees, the exchange of one or more existing securities for one or more new securities and the movement of an existing portfolio company into this category from a different category. Gross additions also include net increases in unrealized appreciation or net decreases in unrealized depreciation. |
| |
| (4) | Gross reductions include decreases in the cost basis of investments resulting from principal collections related to investment repayments or sales, the exchange of one or more existing securities for one or more new securities and the movement of an existing portfolio company out of this category into a different category. Gross reductions also include net increases in unrealized depreciation or net decreases in unrealized appreciation. |
| |
| (5) | Loan or debt security is on non-accrual status at December 31, 2007, and is therefore considered non-income producing. Loans or debt securities on non-accrual status at the end of the period may or may not have been on non-accrual status for the full period. |
| |
| (6) | Represents the total amount of interest or dividends credited to income for the portion of the year an investment was included in the companies more than 25% owned or companies 5% to 25% owned categories, respectively. |
| |
| (7) | In the first quarter of 2007, the Company exercised its option to acquire a majority of the voting securities of Hot Stuff Foods, LLC (Hot Stuff) at fair market value. Therefore, Hot Stuff was reclassified to companies more than 25% owned in the first quarter of 2007. At December 31, 2006, the Company’s investment in Hot Stuff was included in the companies less than 5% owned category. |
| |
| (8) | In the second quarter of 2007, the Company obtained a seat on the board of directors of MHF Logistical Solutions, Inc. (MHF). Therefore, MHF was reclassified to companies 5% to 25% owned in the second quarter of 2007. At December 31, 2006, the Company’s investment in MHF was included in the companies less than 5% owned category. |
| |
| (9) | In December 2007, the Company acquired the majority ownership of CitiPostal Inc. |
151