UNITED STATES
SECURITIES AND EXCHANGE COMMISSION
Washington, D.C. 20549
FORM 10-K
[X] ANNUAL REPORT PURSUANT TO SECTION 13 OR 15(d) OF THE SECURITIES EXCHANGE ACT OF 1934
For the fiscal year ended December 31, 2011
or
[ ] TRANSITION REPORT PURSUANT TO SECTION 13 OR 15(d) OF THE SECURITIES EXCHANGE ACT OF 1934
For the transition period from ________ to ________
Commission file number 1-10006
FROZEN FOOD EXPRESS INDUSTRIES, INC. (Exact name of registrant as specified in its charter)
TEXAS (State or other jurisdiction of incorporation or organization) | | 75-1301831 (I.R.S. Employer Identification No.) |
1145 EMPIRE CENTRAL PLACE, DALLAS, TEXAS (Address of principal executive offices) | | 75247-4305 (Zip Code) |
Registrant's telephone number, including area code: (214) 630-8090
Securities registered pursuant to Section 12(b) of the Act:
| Title of Each Class | | Name of Each Exchange on Which Registered |
i) Common Stock $1.50 par value ii) Rights to purchase Common Stock | | The NASDAQ Stock Market LLC (NASDAQ Global Select Market) |
Securities registered pursuant to Section 12(g) of the Act: NONE
Indicate by check mark if the registrant is a well-known seasoned issuer, as defined in Rule 405 of the Securities Act: Yes [ ] No [ X ]
Indicate by check mark if the registrant is not required to file reports pursuant to Section 13 or 15(d) of the Act: Yes [ ] No [ X ]
Indicate by check mark whether the registrant (l) has filed all reports required to be filed by Section 13 or 15(d) of the Securities Exchange Act of 1934 during the preceding 12 months (or for such shorter period that the registrant was required to file such reports), and (2) has been subject to such filing requirements for the past 90 days. Yes [X] No [ ]
Indicate by check mark whether the registrant has submitted electronically and posted on its corporate Web site, if any, every Interactive Data File required to be submitted and posted pursuant to Rule 405 of Regulation S-T (§232.405 of this chapter) during the preceding 12 months (or for such shorter period that the registrant was required to submit and post such files). Yes [X] No [ ]
Indicate by check mark if disclosure of delinquent filers pursuant to Item 405 of Regulation S-K is not contained herein, and will not be contained, to the best of registrant's knowledge, in definitive proxy or information statements incorporated by reference in Part III of this Form 10-K or any amendment to this Form 10-K. [ X ]
Indicate by check mark whether the registrant is a large accelerated filer, an accelerated filer, a non-accelerated filer, or smaller reporting company. See the definition of “large accelerated filer”, “accelerated filer”, and “smaller reporting company” in Rule 12b-2 of the Exchange Act.
Large accelerated filer [ ] Accelerated filer [ ] Non-accelerated filer [X] Smaller reporting company [ ]
Indicate by check mark whether the registrant is a shell company (as defined in Rule 12b-2 of the Exchange Act). Yes [ ] No [X]
The aggregate market value of 15,653,114 shares of the registrant’s $1.50 par value common stock held by non-affiliates as of June 30, 2011 was approximately $55,881,616 (based upon $3.57 per share).
As of March 23, 2012, the number of outstanding shares of the registrant’s common stock was 17,868,269.
DOCUMENTS INCORPORATED BY REFERENCE
Portions of the registrant's Annual Report to Stockholders for the year ended December 31, 2011 and Proxy Statement for use in connection with its Annual Meeting of Stockholders to be held on May 16, 2012, to be filed with the Securities and Exchange Commission pursuant to Regulation 14A not later than 120 days after December 31, 2011, are incorporated by reference in Part III (Items 10, 11, 12, 13 and 14).
TABLE OF CONTENTS
| | | PAGE |
| | | |
| Business | 1 |
| | | |
| Risk Factors | 8 |
| | | |
| Unresolved Staff Comments | 12 |
| | | |
| Properties | 12 |
| | | |
| Legal Proceedings | 12 |
| | | |
| Mine Safety Disclosures | 12 |
| | | |
| | | |
| | | |
| Market for Registrant's Common Equity, Related Stockholder Matters and Issuer Purchases of Equity Securities | 13 |
| | | |
| Selected Financial Data | 15 |
| | | |
| Management's Discussion and Analysis of Financial Condition and Results of Operations | 15 |
| | | |
| Quantitative and Qualitative Disclosures about Market Risk | 30 |
| | | |
| Financial Statements and Supplementary Data | 32 |
| | | |
| Changes in and Disagreements with Accountants on Accounting and Financial Disclosure | 47 |
| | | |
| Controls and Procedures | 47 |
| | | |
| Other Information | 47 |
| | | |
| | | |
| | | |
| Directors and Executive Officers and Corporate Governance | 48 |
| | | |
| Executive Compensation | 48 |
| | | |
| Security Ownership of Certain Beneficial Owners and Management and Related Stockholder Matters | 49 |
| | | |
| Certain Relationships and Related Transactions, and Director Independence | 49 |
| | | |
| Principal Accountant Fees and Services | 49 |
| | | |
| | | |
| | | |
| Exhibits and Financial Statement Schedules | 49 |
| | | |
| | | |
| | | |
| | | 50 |
| | | |
| | | 51 |
FORWARD-LOOKING STATEMENTS
This Annual Report on Form 10-K contains information and forward-looking statements that are based on management's current beliefs and expectations and assumptions we made based upon information currently available. Such statements are made pursuant to the safe harbor provisions of the Private Securities Litigation Reform Act of 1995. Any statements not of historical fact may be considered forward-looking statements. Forward-looking statements include statements relating to our plans, strategies, objectives, expectations, intentions and adequacy of resources , including whether the Company will return to profitability in fiscal 2012, and may be identified by words such as “will”, “could”, “should”, “believe”, “expect”, “intend”, “plan”, “schedule”, “estimate”, “project” or other variations of these or similar words, identify such statements. These statements are based on our current expectations and are subject to uncertainty and change.
Although we believe the expectations reflected in such forward-looking statements are reasonable, actual results could differ materially from the expectations reflected in such forward-looking statements. Should one or more of the risks or uncertainties underlying such expectations not materialize, or should underlying assumptions prove incorrect, actual results may vary materially from those we expect.
Factors that are not within our control that could cause actual results to differ materially from those in such forward-looking statements include demand for our services and products, and our ability to meet that demand, which may be affected by, among other things, competition, weather conditions and the general economy, the demand for bulk tank water transportation services, the availability and cost of labor and owner-operators, our ability to negotiate favorably with lenders and lessors, continued availability of credit on commercially reasonable terms, the effects of terrorism and war, the availability and cost of equipment, fuel and supplies, the market for previously-owned equipment, the impact of changes in the tax and regulatory environment in which we operate, operational risks and insurance, risks of lawsuits and unfavorable judgements, risks associated with the technologies and systems we use and the other risks and uncertainties described in Item 1A, Risk Factors of this report and risks and uncertainties described elsewhere in our filings with the Securities and Exchange Commission (“SEC”). We undertake no obligation to correct or update any forward-looking statements, whether as a result of new information, future events, or otherwise.
References in the Annual Report to “we”, “us”, “our”, or the Company or similar terms refer to Frozen Food Express Industries, Inc. and it’s consolidated subsidiaries unless the context otherwise requires.
ITEM 1. Business
OVERVIEW
Frozen Food Express Industries, Inc. is one of the leading providers of temperature-controlled truckload and less-than-truckload services in the United States with operations in the transport of temperature-controlled products and perishable goods including food, health care and confectionary products. Transportation services are offered in over-the-road and intermodal modes for temperature-controlled truckload and less-than-truckload. We also provide brokerage and logistics services, including ocean, air, both domestic and international expedited services and oil field water delivery services, as well as dedicated fleets to our customers.
We were incorporated in Texas in 1969, as successor to a company formed in 1946. Our principal office is located at 1145 Empire Central Place, Dallas, Texas 75247-4305. Our telephone number is (214) 630-8090 and our website is www.ffeinc.com.
Our growth strategy is to expand our business internally by offering shippers a high level of service with flexible shipping capacity. We market our temperature-controlled truckload services primarily to large shippers that require consistent freight capacity within our preferred lanes, desire the high service level we provide and understand the pricing necessary to support these service levels. We market our temperature-controlled less-than-truckload services to shippers who need the flexibility to ship varying quantities based upon scheduled departure and delivery times. Our fleet of company and independent contractor tractors allows us to offer a high quality of service and on-time performance within tight time windows at stringent temperature standards.
Our services are further described below:
| · | TRUCKLOAD (“TL”) LINEHAUL SERVICE: This service provides for the shipment of a load, typically weighing between 20,000 and 40,000 pounds and usually from a single shipper, which fills the trailer. Normally, a truckload shipment has a single destination, although we are also able to provide multiple stop deliveries. We are one of the largest temperature-controlled truckload carriers in the United States. In prior years up and through the third quarter of 2011, we offered dry-freight services using dry-van equipment. In the fourth quarter of 2011, we completed a sale of our dry-van equipment; however, dry-freight services are offered using refrigerated trailers. |
| · | DEDICATED FLEETS: This service provides trucks and drivers to handle certain of our customers’ transportation needs, including guaranteed year-round capacity without the capital investment, insurance risks and equipment utilization issues of private fleets. Providing this service allows our customers to eliminate all or a portion of their internal dedicated fleet to lower their customers’ transportation costs and improve the quality of service. |
| · | LESS-THAN-TRUCKLOAD ("LTL") LINEHAUL SERVICE: This service provides for the shipment of a load, typically consisting of up to 30 shipments, which may weigh as little as 50 pounds or as much as 20,000 pounds, from multiple shippers destined to multiple locations. Our temperature-controlled LTL operation is the largest in the United States and the only one offering regularly scheduled nationwide service. In providing temperature-controlled LTL service, multi-compartment trailers enable us to haul products requiring various levels of temperatures in a single load. |
| · | BROKERAGE and LOGISTICS SERVICES: Our brokerage and logistics services help us to balance the level of demand in our core business. Orders for shipments to be transported for which we have no readily available transportation assets are assigned to other unaffiliated motor carriers through our brokerage service. Our services also include ocean, air, and both domestic and international expedited services as well as water related delivery services for the oil field industry. We establish the price to be paid by the customer, invoice the customer and pay the service provider. We also assume the credit risk associated with the transaction. |
| · | EQUIPMENT RENTAL: Revenue from equipment rental includes amounts we charge to independent contractors for the use of trucks we own and lease to them. We also lease refrigerated trailers for the storage and transportation of perishable items as needed by our customers. |
The following table summarizes and compares the components of our revenue for each of the years in the five-year period ended December 31, 2011: | | | (in thousands) | |
| Revenue from: | | 2011 | | | 2010 | | | 2009 | | | 2008 | | | 2007 | |
| Truckload linehaul services | | $ | 156,302 | | | $ | 171,392 | | | $ | 187,234 | | | $ | 214,348 | | | $ | 212,416 | |
| Dedicated fleets | | | 17,469 | | | | 17,467 | | | | 19,707 | | | | 24,609 | | | | 17,861 | |
| Less-than-truckload linehaul services | | | 112,030 | | | | 110,467 | | | | 109,054 | | | | 124,091 | | | | 127,438 | |
| Fuel surcharges | | | 80,705 | | | | 57,410 | | | | 44,876 | | | | 109,144 | | | | 73,391 | |
| Brokerage and logistics services | | | 18,524 | | | | 6,798 | | | | 7,266 | | | | 13,142 | | | | 15,586 | |
| Equipment rental | | | 3,431 | | | | 5,288 | | | | 4,914 | | | | 5,202 | | | | 5,522 | |
| Total operating revenue | | $ | 388,461 | | | $ | 368,822 | | | $ | 373,051 | | | $ | 490,536 | | | $ | 452,214 | |
Additional information regarding our business is presented in the Notes to Consolidated Financial Statements included in Item 8 and in Management's Discussion and Analysis of Financial Condition and Results of Operations in Item 7 of this Annual Report on Form 10-K.
Temperature-controlled transportation: The products we haul include meat, ice, poultry, seafood, processed foods, candy and other confectionaries, dairy products, pharmaceuticals, medical supplies, fresh and frozen fruits and vegetables, cosmetics, film and Christmas trees. In the temperature-controlled market, it may be necessary to keep freight frozen, as with ice; to keep freight cool, as with candy; or to keep freight from freezing. The common and contract hauling of temperature-sensitive cargo is highly fragmented and comprised primarily of carriers generating less than $70 million in annual revenue. In addition, many major food companies, food distribution firms and grocery chain companies transport a portion of their freight with their own fleets.
Intermodal transportation: In providing our truckload linehaul service, we often engage railroads to transport shipments between major cities. In such an arrangement, loaded trailers are transported to a rail facility and placed on flat rail cars for transport to their destination. Upon arrival, we pick up the trailer and deliver the freight to the consignee. Intermodal service is a cost effective way of providing service in major truckload markets that do not have restrictive service requirements that would limit the ability to rely on intermodal rail service.
MARKETING AND OPERATIONS
Our temperature-controlled, dedicated and brokerage logistics services, trucking operations serve nearly 4,000 customers in the United States, Mexico and Canada. Revenue from international activities was approximately 3% of total operating revenue during each of the past five years.
We strive to provide high service levels at a value added price to our customers as opposed to competing with low cost, low service providers. Our marketing efforts target shippers requesting premium service, reliable capacity, and value added service options. We market mainly temperature controlled truckload, less-than-truckload, intermodal, and brokerage logistics services, but also provide intermodal and engineering services, all focused on value added services and pricing. Due to the decline in industry-wide truckload capacity, pricing for our truckload and intermodal services has been more favorable to us. However, improved pricing for the LTL market continues to be challenging and route specific, as well as more seasonally influenced.
Excluding fuel surcharges, temperature-controlled shipments account for approximately 87% of our total operating revenue. Our customers are involved in a variety of products including food products, pharmaceuticals, medical supplies and household goods. Our customer base is diverse in that our top 5, 10 and 20 largest customers accounted for 32%, 45% and 55%, respectively, of our total operating revenue during 2011. None of our markets are dominated by any single competitor nor did any customer account for more than 8% of total operating revenue during any of the past five years. We compete with several hundred other trucking companies. The principal methods of competition are price, quality of service and availability of equipment needed to satisfy customer needs.
Our marketing efforts are conducted by a staff of dedicated sales, customer service and support personnel under the supervision of our senior management team. Sales personnel travel within assigned regions to solicit new customers and maintain contact with existing customers. We also have an enterprise sales force team that focuses primarily on large LTL and truckload temperature-controlled shippers. We utilize a group of inside sales personnel (the Account Management Center) who solicit customers who do not warrant or desire direct outside sales representation. Additionally, we market and sell our brokerage logistics services from our corporate sales and service office in Dallas, Texas. Our brokerage and brokerage logistics services include temperature-controlled, dry van and other specialized needs of our customers not typically offered by other carriers, including ocean, air, both expedited domestic and international services and oil field water delivery services.
Our operations personnel strive to improve our asset utilization by seeking freight that allows for efficient and timely use of assets, minimizes empty miles, carries a value added rate structure and allows our drivers to remain within our preferred network of lanes. Once we have established a relationship with a customer, customer service managers work closely with our fleet managers to match the customer’s needs with our capacity. Load planners or dispatchers utilize various optimization solutions to assign loads in ways that meet our customers’ needs and provide the most efficient use of our assets. We attempt to route most of our trucks over preferred lanes, which we believe assists us in meeting our customer’s needs, balancing traffic, reducing empty miles and improving the reliability of our delivery schedules. Within our LTL services, we provide for regularly scheduled pick-up and delivery times so our customers can depend upon a pre-existing schedule.
DRIVERS AND OTHER PERSONNEL
We select drivers using specific guidelines for safety records, background information, driving experience and personal evaluations. We believe that maintaining a safe and professional driver group is essential to providing excellent customer service, safer roads for others and achieving profitability. We maintain stringent screening, training and testing procedures for our drivers to reduce the risk for accidents and thereby controlling our insurance and claims cost. We train our drivers at our service centers in all phases of our policies and operations including safety techniques, fuel-efficient operation of the equipment, and customer service. We also offer computer and audio based training through our website. Heightened competition in the trucking industry for qualified drivers has resulted in additional expense to recruit and retain an adequate supply of drivers. In February of 2011, we opened a driving school, the FFE Driver Academy, and increased our recruiting efforts. This has shown excellent potential in allowing us to increase our fleet with Company trained drivers. We have graduated and hired 650 drivers from the academy for the year ended December 31, 2011. All drivers must also pass United States Department of Transportation (“DOT”) required tests prior to commencing employment.
At December 31, 2011 we had 1,439 company drivers and 266 independent contractors. Our turnover for company drivers was approximately 85%. We find that if we can retain a driver beyond the first 12 months, we have a much better opportunity to retain that driver for a longer period of time. We pay our company drivers on a fixed rate per mile basis and the independent contractors either a percentage of the earned revenue or on a per mile basis.
Independent contractors provide their tractors to pull our loaded trailers. We generally utilize the independent contractors based upon our existing capacity and the needs of our customers as those needs increase or decrease. At December 31, 2011, we had 158 independent contractors providing truckload services and 108 providing LTL services compared to 138 independent contractors providing truckload services and 166 providing LTL services for the period ended December 31, 2010. Each independent contractor pays for their driver wages, fuel, equipment related expenses and other transportation costs. We bill the customer and pay the independent contractor upon proof of delivery to the destination. The Company assumes the credit risk with the customer and provides all customer support.
For the year ended December 31, 2011, we had 2,125 employees, consisting of 1,439 drivers, 499 field and operations personnel and 187 sales, general and administrative employees, compared to 1,572 drivers, 503 field and operations personnel and 211 sales and general and administrative employees for the period ended December 31, 2010. None of our employees are represented by a collective bargaining unit, and we consider relations with our employees to be good. The decrease in personnel at the end of 2011 resulted from a reduction in back-office work force and the sale of certain dry-freight equipment in the fourth quarter of 2011, which reduced our company paid drivers.
FUEL
We are dependent on diesel fuel for our transportation services and our customers and we are impacted by the volatility of fuel prices. The price and availability of diesel fuel can vary significantly and are subject to political, economic and market factors that are beyond our control. While we do not hedge our exposure to volatile energy prices, we attempt to minimize our exposure through volume fuel purchasing arrangements with national fuel centers and bulk purchases of fuel at our service centers. During 2011, approximately 93.1% of our fuel purchases were made within this national network.
We further manage the price volatility through fuel surcharge programs with our customers. The Company adjusts fuel surcharge factors on a weekly basis; however, it may not fully recover price increases in the preceding week. Compared to fuel price levels in 2010, the surge in fuel prices in 2011 has increased shippers’ resistance to fuel price surcharges. Fuel surcharges help to offset the higher cost of tractor fuel only and do not offset higher fuel costs related to refrigerated trailers. Net fuel prices per gallon increased approximately 33.6% compared to 2010, but not with the volatility we witnessed in 2008. Nevertheless, in the current economy, shippers continued to be resistant to fuel surcharge programs.
Factors that could prevent us from fully recovering fuel cost increases include the competitive environment, empty miles, out-of-route miles, tractor engine idling and fuel to power our trailer refrigeration units. Such fuel consumption often cannot be attributed to a particular load, and therefore, there is no incremental revenue to which a fuel surcharge may be applied.
In most years, states increase fuel and road use taxes. Our recovery of future increases or realization of future decreases in fuel prices and fuel taxes, if any, will continue to depend upon competitive freight market conditions.
INSURANCE AND CLAIMS
We self-insure for a portion of our claims exposure resulting from workers’ compensation, auto liability, general liability, cargo and property damage claims and employees’ health insurance. We are also responsible for our proportionate share of the legal expenses related to such claims. We reserve currently for anticipated losses and related expenses and periodically evaluate and adjust our insurance and claims reserves to reflect our experience. The Company is responsible for the first $4.0 million on each personal injury and property damage claim and $300,000 for employees’ health claims. We have excess coverage from $4.0 million to $75.0 million. We are also responsible for the first $500,000 for workers’ compensation claims generated outside of Texas and for $500,000 on work injury claims filed in Texas. We are fully insured for auto and general liability exposures between $4.0 million and $75.0 million. We are fully insured between our retention of $500,000 and $1.5 million for Texas work injury claims and between our retention of $500,000 and state statutory limits for workers’ compensation claims outside of Texas. We have a $300,000 stop-loss retention on employee health claims. Our significant self-insured retention exposes us to the possibility of significant fluctuations in claims expense between periods depending on the frequency, severity and timing of claims and to adverse financial results if we incur large or numerous losses. In the event of an uninsured claim above our insurance coverage, a claim that approaches the maximum self-insured retention level or an increase in the frequency or severity of claims within our self-insured retention, our financial condition and results of operations could be materially and adversely affected. In the second half of 2011, the Company was affected with unfavorable settlements and legal costs, some dating back to 2005, which increased our claims and insurance expense by approximately $8.9 million. As of December 31, 2011, we have $3.0 million in standby letters of credit to guarantee settlement of claims under agreements with our insurance carriers and regulatory authorities.
Insurance rates have proven to be influenced by events outside of our Company’s control. As a result, our insurance and claims expense could increase, or we could raise our self-insured retention when our policies are renewed in 2012. Although insurance rates have declined the last several years, our risk management program is founded on the continual enhancement of safety in our operations. Our safety department conducts programs that include driver education and over-the-road observation and requires that drivers meet or exceed specific safety guidelines, driving experience, drug testing and physical examinations.
Our insurance and claims accruals represent our estimate of ultimate claims outcomes and are established based on the information available at the time of an incident. As additional information regarding the incident becomes available, any necessary adjustments are made to previously recorded amounts, including any expenses related to the incident.
INFORMATION TECHNOLOGY
The demanding shipping requirements of today’s world creates a need for continued investment in information technology to maintain a successful temperature-controlled trucking operation. In 2011, we handled approximately 125,000 truckload and 278,000 LTL shipments. These shipments are tracked for quality and service reasons. Our technology continues to advance and provides improved tracking systems, driver communication and routing systems and driver safety systems. Additionally, federal regulations continue to create demand for new systems such as electronic driver log systems, which are part of our current on board communication and routing system.
Our truckload and LTL fleets use computer and satellite technology to enhance efficiency and customer service. The mobile communications system provides automatic position updates of each truckload tractor and permits real-time communication between operations personnel and drivers. Dispatchers relay pick-up, delivery, weather, road conditions and other information to the drivers. Additionally, our on board systems have back-office integration to allow us to identify out-of-route mileage by matching actual driven location data with prescribed routes, thereby flagging cases of non-compliant driving. By utilizing these tools to analyze the situations, we can quickly identify route compliance issues by vehicle and driver, and make corrections to reduce costly excess miles driven. With this, we will reduce accident risks, save money and time, while also reducing driver frustrations that are associated with going off route.
The Company has also invested in the following technology that we believe allows us to operate more efficiently:
| · | Freight optimization software that assists us in selecting loads that match our overall criteria, including profitability, repositioning, identifying capacity for expedited loads, driver availability and home time, and other factors; |
| · | Fuel-routing software that optimizes the fuel stops for each trip to take advantage of volume discounts available in our national fuel network; |
| · | Electronic data interchange and internet communication with various customers concerning freight tendering, invoices, shipment status and other information; |
| · | Costing software that allows us to develop the appropriate pricing to our customers and to determine the profitability of specific moves; and |
| · | Trailer tracking devices utilizing global positioning system technology, which provides product traceability and desktop control of the refrigerated trailers. |
REVENUE EQUIPMENT
We operate premium company-owned tractors in order to help attract and retain qualified employee-drivers, promote safe operations, minimize repair and maintenance costs and ensure dependable service to our customers. We believe the higher initial investment for our equipment is recovered through more efficient vehicle performance offered by such premium tractors and improved resale value. Major repair costs are mostly recovered through manufacturers' warranties, but routine and preventative maintenance is our responsibility.
Changes in the size of our fleet depend upon developments in the nation's economy, demand for our services and the availability of qualified drivers. Continued emphasis will be placed on improving the operating efficiency and increasing the utilization of the fleet through enhanced driver training and retention and reducing the percentage of empty, non-revenue producing miles.
As of December 31, 2011, we operated a fleet of 1,656 tractors, including 1,390 company-owned tractors and 266 tractors supplied by independent contractors. The average age of our tractors was approximately 2.2 years. We typically replace our tractors within 42 months after purchase. As of December 31, 2011, we maintained 3,388 trailers. Our general policy is to retire our refrigerated trailers after seven years of service. Occasionally, we retain older equipment for use in local delivery operations.
The following represents a breakdown of the age of our tractors and trailers at the end of 2011 and 2010:
| | | Age in Years | | | | | | | |
| Tractors | | Less than 1 | | | 1 through 3 | | | More than 3 | | | Total | |
| | | 2011 | | | 2010 | | | 2011 | | | 2010 | | | 2011 | | | 2010 | | | 2011 | | | 2010 | |
| Company-owned and leased | | | 446 | | | | 205 | | | | 635 | | | | 815 | | | | 309 | | | | 479 | | | | 1,390 | | | | 1,499 | |
| Owner-operator provided | | | 43 | | | | 87 | | | | 133 | | | | 134 | | | | 90 | | | | 83 | | | | 266 | | | | 304 | |
| | | | 489 | | | | 292 | | | | 768 | | | | 949 | | | | 399 | | | | 562 | | | | 1,656 | | | | 1,803 | |
| | | Age in Years | | | | | | | |
| Trailers | | Less than 1 | | | 1 through 5 | | | More than 5 | | | Total | |
| | | 2011 | | | 2010 | | | 2011 | | | 2010 | | | 2011 | | | 2010 | | | 2011 | | | 2010 | |
| Company-owned and leased | | | 501 | | | | 289 | | | | 1,075 | | | | 1,484 | | | | 1,812 | | | | 1,730 | | | | 3,388 | | | | 3,503 | |
| | | | 501 | | | | 289 | | | | 1,075 | | | | 1,484 | | | | 1,812 | | | | 1,730 | | | | 3,388 | | | | 3,503 | |
Approximately 99% of our trailers are insulated and equipped with refrigeration units capable of providing the temperature control necessary to maintain perishable freight. Trailers used primarily in LTL operations are equipped with movable partitions permitting the transportation of goods requiring different temperatures. Company-operated trailers are primarily 102 inches wide. Truckload trailers used in temperature-controlled linehaul operations are primarily 53 feet long.
Since approximately 2004, the federal government, through the Environmental Protection Agency (the “EPA”), has mandated the phase in of truck engines that reduce particulate matter count, nitrous oxides and sulfur emissions. This new technology serves to reduce emissions from diesel engines but generally also reduces miles per gallon and increases the new cost of the engines, as well as maintenance cost.�� We have been in full compliance of these programs due to our vehicle replacement programs that replace tractors at a rate that maintains proper ratios as required by the EPA. While the EPA-compliant engines are more costly to purchase and maintain, we are committed to the EPA’s SmartWay Transport Partner Program (“SmartWay”) to minimize the negative environmental impacts of diesel-powered equipment.
INTERNATIONAL OPERATIONS
We provide services to and from Canada and Mexico. We utilize tractors from our fleets for services provided to and from Canada. We partner with Mexico-based trucking companies to facilitate freight moving both ways across the southern United States border. Freight moving from Mexico is hauled in our trailers to the border by the Mexico-based carrier, where the trailers are exchanged. Southbound shipments work much the same way. This arrangement has been in place for more than ten years, and we do not expect to change our manner of dealing with freight to or from Mexico and the Mexican border. Changes in United States, Canadian, or Mexican government regulations could cause us to change our operations, including border management, taxation, or various transportation and safety practices. Approximately 3% of our total operating revenue during 2011 involved international shipments, all of which were billed and collected in United States currency.
REGULATION
Our trucking operations are regulated by the DOT. The DOT generally governs matters such as safety requirements, registration to engage in motor carrier operations, certain mergers, insurance, consolidations and acquisitions. The DOT conducts periodic on-site audits of our compliance with its safety rules and procedures. Our most recent audit, which was completed in October of 2010, resulted in a rating of "satisfactory", the highest safety rating available.
During 2005, the Federal Motor Carrier Safety Administration ("FMCSA") began to enforce changes to the regulations that govern drivers' hours of service. Hours of Service ("HOS") rules issued by the FMCSA, in effect since 1939, generally limit the number of consecutive hours and consecutive days that a driver may work. The new rules reduced by one hour the number of hours that a driver may work in a shift, but increased by one hour the number of hours that a driver may drive during the same shift. Drivers are often working at times they are not driving. Duties such as fueling, loading and waiting to load count as part of a driver's shift that are not considered driving. Under the old rules, a driver was required to rest for at least eight hours between shifts. The new rules increased that to ten hours, thereby reducing the amount of time a driver can be "on duty" by two hours. We believe we are well equipped to minimize the economic impact of the current HOS rules on our business. In many cases, we have negotiated time delay charges with our customers. Additionally, we work directly with our customers in an effort to manage our drivers’ non-driving activities such as loading, unloading or waiting and we continue to communicate with our customers regarding these matters. We also are able to assess detention and other charges to offset losses in productivity resulting from the current HOS regulations. A new HOS rule was issued on December, 27, 2011, the final ruling is effective February 27, 2012 and the compliance date of selected provisions is July 1, 2013. According to the Regulatory Impact Analysis (RIA), the economic impact on this ruling will reduce the productivity level of the driver. At this point, we are unable to confirm the impact on productivity level or additional expense.
In December 2010, the FMCSA launched the Compliance Safety Accountability (“CSA”) program. The program was created to provide a better view into how well large commercial motor vehicle carriers and drivers are complying with safety rules and regulations. The program will allow FMCSA to reach more carriers earlier and deploy interventions as needed. The CSA Operation Model has three major components: measurement, evaluation and intervention. We have taken an aggressive pro-active approach toward monitoring drivers through installation of electronic on board recorders as well as inspections. We have seen a slight increase in maintenance costs on minor non-safety related repairs in coordination to this program.
We have experienced higher prices for new tractors over the past few years, partially as a result of government regulations applicable to newly manufactured tractors and diesel engines. The entire linehaul sleeper fleet has either the 2004-EGR (“Exhaust-Gas Recirculation”) or the 2007-EGR EPA-mandated engines. Further restrictions for clean air compliance were mandated by the EPA for all engines manufactured after January 1, 2010. All of our tractors are EPA SmartWay certified.
In 2010, the state of California enforced stricter carbon emission standards for refrigeration units on temperature-controlled trailers. Currently, approximately 90% of our trailers are C.A.R.B. (“California Air Research Board”) compliant and all of our trailers located in California are C.A.R.B. compliant. We will continue to replace the non-compliant trailers during our 2012 replacement cycle. We do not anticipate a significant increase in cost for these trailers.
ENVIRONMENT
We are subject to various environmental laws and regulations by various state regulatory agencies with respect to certain aspects of our operations including the operations of fuel storage tanks, air emissions from our trucks and engine idling. We have been committed to environmental quality for many years and joined SmartWay at its inception in 2004. SmartWay is an innovative collaboration between the EPA and the freight sector designed to improve energy efficiency, reduce greenhouse gas and air pollutant emissions, and improve energy security. Currently, every truck of the Company is an EPA 2004 Engine or newer. Constant upgrades are made to replace with environmentally friendly models that have fuel-efficient tires, aerodynamic styling and skirts. We use environmentally friendly refrigerants in our refrigeration units and every truck in our fleet is ULSD (“Ultra Low Sulfur Diesel”). Furthermore, in 2009 we reduced our fleet trucks to sixty-two miles per hour to achieve greater fuel efficiency. We utilize a fuel optimizer program to reduce miles and maintain idle management devices on our trucks. We are also diligent in our recycling programs for used oil and other hazardous material by-products.
SEASONALITY
Seasonal changes affect our temperature-controlled operations. The growing seasons for fruits and vegetables in Florida, California and Texas typically create increased demand for trailers equipped to transport cargo that requires refrigeration. LTL shipment volume during the winter is normally lower than the other seasons. Shipping volumes of LTL freight are usually highest during July through October. LTL volumes also tend to increase in the weeks before holidays such as Halloween, Thanksgiving, Christmas, Valentine’s Day and Easter when significant volumes of food and candy are transported.
EFFECT OF CLIMATE CHANGES
Considering a significant portion of our total operating revenue excluding fuel surcharges is from temperature controlled transport of goods, the climate could affect our customers’ service needs and our service product. As the climate becomes warmer, more refrigerated capacity would be needed. In a cold, harsh winter, we could be required to heat more products and handle freight that would not normally need a temperature controlled environment.
Greenhouse gas emissions have increasingly become the subject of a large amount of international, national, regional, state and local attention. Cap and trade initiatives to limit greenhouse gas emissions have been introduced in the European Union (“EU”). Similarly, numerous bills related to climate change have been introduced in the United States Congress, which could adversely impact all industries. In addition, future regulation of greenhouse gases could occur pursuant to future U.S. treaty obligations, statutory or regulatory changes under the Clean Air Act or new climate change legislation. It is uncertain whether any of these initiatives will be implemented, although, based on published media reports, we believe it is not reasonably likely the current proposed initiatives will be implemented without substantial modification. If such initiatives are implemented, restrictions, caps, taxes, or other controls on emissions of greenhouse gases, including diesel exhaust, could significantly increase our operating costs. Restrictions on emissions could also affect our customers that use significant amounts of energy or burn fossil fuels in producing or delivering the products we carry including, but not limited to, food producers and distributors. Although significant cost increases, government regulation, and changes of consumer needs or preferences for goods or services relating to alternative sources of energy or emissions reductions or changes in our customers' shipping needs could materially affect the markets for the products we carry, which in turn could have a material adverse effect on our results of operations, financial condition, and liquidity, or, in the alternative, could result in increased demand for our transportation services. We are currently unable to predict the manner or extent of such effect.
INTERNET WEB SITE
We maintain a web site, www.ffeinc.com, on the Internet where additional information about our company is available. Our annual reports on Form 10-K, quarterly reports on Form 10-Q, current reports on Form 8-K, press releases, earnings releases and other reports filed with and furnished to the SEC, pursuant to Section 13 or 15(d) of the Exchange Act are available, free of charge, on our web site as soon as practical after they are filed.
We have adopted a Code of Business Conduct and Ethics that applies to our board of directors, chief executive office, principal financial officer, controller, or persons performing similar functions as well as all employees. We also have charters for the Audit Committee, Compensation Committee, and Nominating and Corporate Governance Committee of our Board of Directors. Copies of the foregoing documents may be obtained on our web site, and such information is available in print to any shareholder who requests it. Such requests should be made to the Senior Vice President and Chief Financial Officer at 1145 Empire Central Place, Dallas, Texas 75247.
SEC FILINGS
The annual, quarterly, special and other reports we file with and furnish to the SEC are available at the SEC's Public Reference Room, located at 100 F Street, NE, Room 1580, Washington, D.C. 20549. Information may be obtained on the operation of the Public Reference Room by calling the SEC at 1-800-732-0330. The SEC also maintains a web site at www.sec.gov. The SEC site also contains information we file with and furnish to the agency.
ITEM 1A. Risk Factors
The following factors are important and should be considered carefully in connection with any evaluation of our business, financial condition, results of operations, prospects, or an investment in our common stock. The risks and uncertainties described below are those we currently believe may materially affect our company or our financial results. Additional risks and uncertainties not presently known to us or that we currently deem immaterial may also impair our business operations or affect our financial results.
Our business is subject to general economic factors and business risks that are largely out of our control, any of which could have a material adverse effect on our operating results. Our business is subject to general economic factors and business factors that may have a material adverse effect on our results of operations, many of which are beyond our control. These factors include excess capacity in the trucking and temperature-controlled industry, strikes, or other work stoppages, significant increases in interest rates, fuel costs, taxes and license and registration fees. Recessionary economic cycles, changes in customers' business activities and excess tractor or trailer capacity in comparison with shipping demands could materially affect our operations. Economic conditions that decrease shipping demand or an increase in the supply of tractors and trailers generally available in the transportation sector of the economy can exert downward pressure on our pricing programs and equipment utilization, thereby decreasing asset profitability. Economic conditions also may adversely influence our customers and their ability to pay for our services.
Financial institutions may continue to consolidate or cease to do business, which could result in tightening of the credit markets, lower levels of liquidity in many financial markets, and increased volatility in fixed income, credit, currency and equity markets. A credit crisis could negatively impact our business, including through the impaired credit availability and financial stability of our customers, including our distribution partners and channels. A disruption in the financial markets may also have an effect on our banking partners on which we rely for operating cash management. We may need to incur indebtedness or issue debt or equity securities in the future to fund working capital requirements, make investments in revenue generating equipment, or for general operating purposes. Continued losses may impact our ability to obtain sufficient financing due to the inability to access the capital markets on financially economical or feasible terms. This could impact our ability to provide services to our customers and may materially and adversely affect our business, financial results, current operations, results of operations and potential investments.
It is not possible to predict the effects on the economy or consumer confidence of actual or threatened armed conflicts or terrorist attacks, efforts to combat terrorism, military action against a foreign state or group located in a foreign state, or heightened security requirements.
We operate in a highly competitive and fragmented industry and numerous competitive factors could impair our growth and profitability. Some of these factors include:
| · | We compete with many other transportation carriers of varying sizes, some of which have more equipment and greater capital resources than we do or have other competitive advantages; |
| · | Some of our competitors periodically reduce their freight rates to gain business, especially during times of reduced growth rates in the economy, which may limit our ability to maintain or increase freight rates or maintain our profitability levels; |
| · | Many customers reduce the number of carriers they use by selecting so-called “core carriers” as approved transportation service providers or current bids from multiple carriers, and in some instances we may not be selected; |
| · | Many customers periodically accept bids from multiple carriers for their shipping needs, and this process may depress freight rates or result in the loss of some business to competitors as a core carrier; |
| · | Certain of our customers that operate private fleets to transport their own freight could decide to expand their operations; |
| · | Competition from freight logistics and brokerage companies may negatively impact our customer relationships and freight rates; and |
| · | Economies of scale that may be passed onto smaller carriers by procurement aggregation providers may improve such carriers’ ability to compete with us. |
We derive a significant portion of our revenue from our major customers, the loss of one or more of which could have a material adverse effect on our business. A significant portion of our revenue is generated from our major customers. For 2011, our top 20 customers accounted for approximately 55% of our revenue; our top 10 customers accounted for 45% of our revenue; and our top 5 customers accounted for approximately 32% of our revenue. Generally, we enter into one-year agreements with our major customers, which generally do not contain minimum shipment volumes with us. We cannot ensure that, upon expiration of existing contracts, these customers will continue to utilize our services at the current levels. Many of our customers periodically solicit bids from multiple carriers for their shipping needs, and this process may depress freight rates or result in a loss of business to one of our competitors. Some of our customers also operate their own private fleets and the expansion of those fleets may result in lowering the demand for our services with such customers.
Future insurance and claims expense could reduce our earnings. Our future insurance and claims expense might exceed historical levels, which could reduce our earnings. We self-insure significant portions of our claims exposure resulting from work-related injuries, auto liability, general liability, cargo and property damage claims, as well as employees' health insurance. We currently reserve for anticipated losses and expenses. We periodically evaluate and adjust our claims reserves to reflect our experience. However, ultimate results usually differ from our estimates, which could result in losses in excess of our reserved amounts.
We maintain insurance above the amounts for which we self-insure. Although we believe the aggregate insurance limits should be sufficient to cover reasonably expected claims, it is possible that one or more claims could exceed our aggregate coverage limits. Insurance carriers have raised premiums for many businesses, including transportation companies. As a result, our insurance and claims expense could increase, or we could raise our self-insured retention when our policies are renewed. If these expenses increase, if we experience a claim in excess of our coverage limits, or if we experience a claim for which coverage is not provided, results of our operations and financial condition could be materially affected. We were affected by unfavorable settlements of claims from prior years in the second half of 2011 reflected by the increase in insurance and claims expense.
Fluctuations in the price or availability of fuel may increase our cost of operations, which could materially affect our profitability. We are subject to risk with respect to purchases of fuel for use in our tractors and refrigerated trailers. Fuel prices are influenced by many factors that are not within our control.
Because our operations are dependent upon diesel fuel, significant increases in diesel fuel costs could materially and adversely affect our results of operations and financial condition unless we are able to pass increased costs on to customers through rate increases or fuel surcharges. Historically, we have sought to recover increases in fuel prices from customers through fuel surcharges. Fuel surcharges that can be collected have not always fully offset the increase in the cost of diesel fuel in the past, and there can be no assurance that fuel surcharges that can be collected will offset the increase in the cost of diesel fuel in the future.
Seasonality and the impact of weather can affect our profitability. Our tractor productivity generally decreases during the winter season because inclement weather impedes operations and some shippers reduce their shipments. At the same time, operating expenses generally increase, with fuel efficiency declining because of engine idling and harsh weather creating higher accident frequency, increased claims and more equipment repairs. During extended periods of excessive heat, we may experience higher reefer fuel and repair costs. We can also suffer short-term impacts from weather-related events, such as hurricanes, blizzards, ice-storms and floods, which may increase in severity or frequency due to the physical effects of climate change that could harm our results or make our results more volatile.
We will have significant ongoing capital requirements that could negatively affect our growth and profitability. The trucking industry is capital intensive, and replacing older equipment requires significant investment. If we elect to expand our fleet in future periods, our capital needs would increase. We expect to pay for our capital expenditures with cash flows from operations, borrowings under our revolving credit facility and leasing arrangements. If we are unable to generate sufficient cash from operations and obtain financing on favorable terms, we may need to limit our growth, enter into less favorable financing arrangements or operate our revenue equipment for longer periods, any of which could affect our profitability. Continued losses may inhibit our ability to obtain financing for our ongoing capital requirements.
We rely on our key management and other employees and depend on recruitment and retention of qualified personnel. Difficulty in attracting or retaining qualified employee-drivers and independent contractors who provide tractors for use in our business could impede our growth and profitability. A limited number of key executives manage our business. Their departure could have a material effect on our operations. In addition, our performance is primarily dependent upon our ability to attract and retain qualified drivers. Our independent contractors are responsible for paying for their own equipment, labor, fuel, and other operating costs. Significant increases in these costs could cause them to seek higher compensation from us or other opportunities. Competition for employee-drivers continues to increase. If a shortage of employee-drivers occurs, or if we were unable to continue to sufficiently contract with independent contractors, we could be forced to limit our growth or experience an increase in the number of our tractors without drivers, which would lower our profitability.
Service instability in the railroad industry could increase our operating costs and reduce our ability to offer intermodal services, which could adversely affect our revenue, results of operations and customer relationships. Our intermodal operations are dependent on railroads, and our dependence on railroads may increase if we expand our intermodal services. In most markets, rail service is limited to a few railroads or even a single railroad. Any reduction in service by the railroads may increase the cost of the rail-based services we provide and reduce the reliability, timeliness and overall attractiveness of our rail-based services. Railroads are relatively free to adjust their rates as market conditions change. That could result in higher costs to our customers and influence our ability to offer intermodal services. There is no assurance that we will be able to negotiate replacement of or additional contracts with railroads, which could limit our ability to provide this service and may affect our profitability.
Interruptions in the operation of our computer and communications systems could reduce our income. We depend on the efficient and uninterrupted operation of our computer and communications systems and infrastructure. Our operations and those of our technology and communications service providers are vulnerable to interruption by fire, earthquake, power loss, telecommunications failure, terrorist attacks, internet failures, computer viruses and other events beyond our control. In the event of a system failure, our business could experience significant disruption. We have established an off-site facility where our data and processing functions are replicated; however, there can be no assurances that the business recovery plan will work as intended or may not prevent significant interruptions of our operations.
Changes in the availability of or the demand for new and used trucks could reduce our growth and negatively affect our income. More restrictive federal emissions standards require new technology diesel engines. As a result, we expect to continue to pay increased prices for equipment and incur additional expenses and related financing costs for the foreseeable future.
We have a conditional commitment from our principal tractor vendor regarding the amount we will be paid on the disposal of most of our tractors as part of a trade-in program. We could incur a financial loss upon disposition of our equipment if the vendor cannot meet its obligations under these agreements.
If we are unable to obtain favorable prices for our used equipment, or if the cost of new equipment continues to increase, we will increase our depreciation expense or recognize less gain (or a loss) on the disposition of our tractors and trailers. This may affect our earnings and cash flows.
We operate in a highly regulated industry, and increased costs of compliance with, or liability for violation of, existing or future regulations could have a material adverse effect on our business. The DOT and various state and local agencies exercise broad powers over our business, generally governing such activities as authorization to engage in motor carrier operations, safety and insurance requirements. Our company drivers and independent contractors must also comply with the safety and fitness regulations promulgated by the DOT, including those relating to drug and alcohol testing and hours-of-service. We may also become subject to new or more restrictive regulations relating to fuel emissions, drivers’ hours-of-service, ergonomics, or other matters affecting our safety or operating methods.
Other agencies, such as the EPA, FMCSA and the Department of Homeland Security, also regulate our equipment, operations, and drivers. In December 2010, the FMCSA launched the Compliance Safety Accountability (“CSA”) program. The program was created to provide a better view into how well large commercial motor vehicle carriers and drivers are complying with safety rules and regulations. The program will allow FMCSA to reach more carriers earlier and deploy interventions as needed. The CSA Operation Model has three major components: measurement, evaluation and intervention. We could be affected by increases in maintenance costs on minor non-safety related repairs in coordination to this program. Future laws and regulations may be more stringent and require changes in our operating practices, influence the demand for transportation services, or require us to incur significant additional costs: see Part I, Item 1. Business - Regulation.
Our operations are subject to various environmental laws and regulations, the violation of which could result in substantial fines or penalties. We are subject to various environmental laws and regulations dealing with the handling of hazardous materials, fuel storage tanks, air emissions from our vehicles and facilities, engine idling, and discharge and retention of storm water. We operate in industrial areas, where truck terminals and other industrial activities are located and where groundwater or other forms of environmental contamination have occurred. Our operations involve the risks of fuel spillage or seepage, environmental damage, and hazardous waste disposal, among others. Although we have instituted programs to monitor and control environmental risks and promote compliance with applicable environmental laws and regulations, if we are involved in a spill or other accident involving hazardous substances or if we are found to be in violation of applicable laws or regulations, we could be subject to liabilities, including substantial fines or penalties or civil and criminal liability, any of which could have a material adverse effect on our business and operating results.
We may not be able to improve our operating efficiency rapidly enough to meet market conditions. Because the markets in which we operate are highly competitive, we must continue to improve our operating efficiency in order to achieve, maintain or improve our profitability. Although we have been able to improve efficiency and reduce costs in the past, there is no assurance we will continue to do so in the future. In addition, the need to reduce ongoing operating costs may result in significant up-front costs to reduce workforce, close or consolidate facilities, or upgrade equipment and technology.
Our operations could be affected by a work stoppage at locations of our customers. Although none of our employees are covered by a collective bargaining agreement, a strike or other work stoppage at a customer location could negatively affect our revenue and earnings and could cause us to incur unexpected costs to redeploy or deactivate assets and personnel.
We are subject to anticipated future increases in the statutory federal tax rate. An increase in the statutory tax rate would increase our tax expense. In addition, our net deferred tax asset is stated net of offsetting deferred tax liabilities. The assets consist of anticipated future tax deductions for items such as personal and work-related injuries and bad debt expenses, which have been reflected on our financial statements but which are not yet tax deductible. Due to probable tax rate increases in the future, we would be required to adjust our deferred tax liabilities at that time to reflect higher federal tax rates.
Changes in market demand may have an unfavorable impact on our operating efficiency. We provide transportation services to a number of customers that ship a variety of products including, but not limited to, food, health care, and confectionary products. Should the demand for our customers’ products decline, our revenues could be negatively affected. Should those conditions arise, there is no assurance that we will be able to adjust our operating costs sufficiently to offset the decline in revenue.
We are subject to potential litigation and claims. We are exposed to litigation involving personal injury, property damage, work-related injuries, cargo losses, Equal Employment Opportunity Commission (“EEOC”), unemployment claims and general liability during the normal course of operating our business, any of which could affect our results depending on the severity and resolution of the aforementioned exposures.
A negative economic impact on our customers’ businesses may adversely affect our credit risk. Certain customers may not be able to meet their financial obligations due to deterioration of their own financial condition, credit ratings, or bankruptcy. While we do record an allowance for doubtful accounts, a considerable amount of judgment is required in assessing the realization of these receivables which could affect our cash collections and operating results.
We are dependent on our customers’ product safety and quality control procedures to ensure product integrity. As most shipments tendered to us are packaged in such a way to prevent inspection and testing, we are dependent upon our customers’ quality control to ensure our other customers’ products are not subject to chemicals, bacteria, or other harmful agents that could contaminate their products. Such contamination could result in loss of business, consumer confidence in our Company, and possibly cause public health concerns resulting in fines, costly litigation, and/or loss of operating authority.
ITEM 1B. Unresolved Staff Comments
None.
ITEM 2. Properties
At December 31, 2011, we maintained service centers or office facilities of 10,000 square feet or more in or near the cities listed below. We also occupy a number of smaller rented recruiting and sales offices around the country. Remaining lease terms range from one month to approximately thirteen years. We expect our present facilities are sufficient to support our operations.
The following table sets forth certain information regarding our properties at December 31, 2011:
| | | Approximate Square Footage | | Approximate Acreage | | Owned or Leased | | Lease Expiration Date |
| Dallas, TX | | | | | | | | |
| Maintenance, service center and freight handling | | 100,000 | | 80 | | Owned | | NA |
| Corporate office | | 34,000 | | 2 | | Owned | | NA |
| Burlington, NJ | | 84,000 | | 10 | | Leased | | May 2024 |
| Ft. Worth, TX | | 34,000 | | 7 | | Owned | | NA |
| Chicago, IL | | 37,000 | | 5 | | Owned | | NA |
| Lakeland, FL | | 26,000 | | 15 | | Owned | | NA |
| Atlanta, GA | | 50,000 | | 13 | | Owned | | NA |
| Ontario, CA | | 92,000 | | * | | Leased | | October 2020 |
| Salt Lake City, UT | | 12,500 | | * | | Leased | | November 2015 |
| Miami, FL | | 17,500 | | * | | Leased | | January 2014 |
| Olive Branch, MS | | 16,000 | | * | | Leased | | September 2017 |
| | | | | | | | |
*Facilities are part of an industrial park in which we share acreage with other tenants.
ITEM 3. Legal Proceedings
Due to the nature of our industry, we are regularly involved in litigation incidental to our operations, primarily involving claims for personal injury, property damage, work-related injuries and cargo losses incurred in the ordinary and routine transportation of freight. Based on our current assessment of information on-hand, we believe that the routine litigation is adequately covered by our insurance reserves and adverse effects arising from these events will not have a material impact on our financial statements. However, litigation is highly unpredictable and unexpected unfavorable jury verdicts may have a material impact on the financial statements in the future, such as we experienced in the third and fourth quarters of the year ending, December 31, 2011.
ITEM 4. Mine Safety Disclosures
None.
ITEM 5. Market for Registrant's Common Equity, Related Shareholder Matters and Issuer Purchases of Equity Securities
Market for Registrant's Common Equity and Related Shareholder Matters
Our common stock is listed on the NASDAQ Global Select Market under the symbol “FFEX”. The table below shows the range of high and low bid prices for the quarters indicated on the NASDAQ Global Select Market. Such quotations reflect inter-dealer prices, without retail markups, markdowns or commissions and therefore, may not necessarily represent actual transactions. The following table sets forth the high and low prices of our stock within each quarter of the previous two years:
| | | Price Range | |
| Year Ended December 31, 2011 | | High | | | Low | |
| Fourth Quarter | | $ | 2.10 | | | $ | 1.09 | |
| Third Quarter | | | 4.30 | | | | 1.99 | |
| Second Quarter | | | 4.28 | | | | 3.04 | |
| First Quarter | | | 5.00 | | | | 3.11 | |
| | | | | | | | | |
| Year Ended December 31, 2010 | | | | | | | | |
| Fourth Quarter | | $ | 4.96 | | | $ | 2.78 | |
| Third Quarter | | | 3.91 | | | | 2.68 | |
| Second Quarter | | | 4.99 | | | | 3.50 | |
| First Quarter | | | 4.42 | | | | 3.09 | |
On March 21, 2012, we had approximately 2,200 beneficial shareholders of our common stock.
Unregistered Sales of Equity Securities and Use of Proceeds
On November 9, 2007, our Board of Directors renewed our authorization to purchase up to 1.3 million shares of our common stock. At December 31, 2011, there were a total of 747,200 remaining authorized shares that could be repurchased. There were no shares repurchased in the fourth quarter of 2011. The authorization did not specify an expiration date. Shares may be purchased from time to time on the open market or through private transactions at such times as management deems appropriate. Purchases may be discontinued by our Board of Directors at any time. | Period | | Total Number of Shares Purchased (a) | | Average Price Paid per Share (b) | | Total Number of Shares Purchased as Part of Publicly Announced Plans or Programs (c) | | Maximum Number (or Approximate Dollar Value) of Shares (or Units) that May Yet Be Purchased Under the Plans or Programs (d) | |
| October 2011 | | - | | | - | | - | | | 747,200 | |
| November 2011 | | - | | | - | | - | | | 747,200 | |
| December 2011 | | - | | | - | | - | | | 747,200 | |
| Total | | - | | | - | | - | | | 747,200 | |
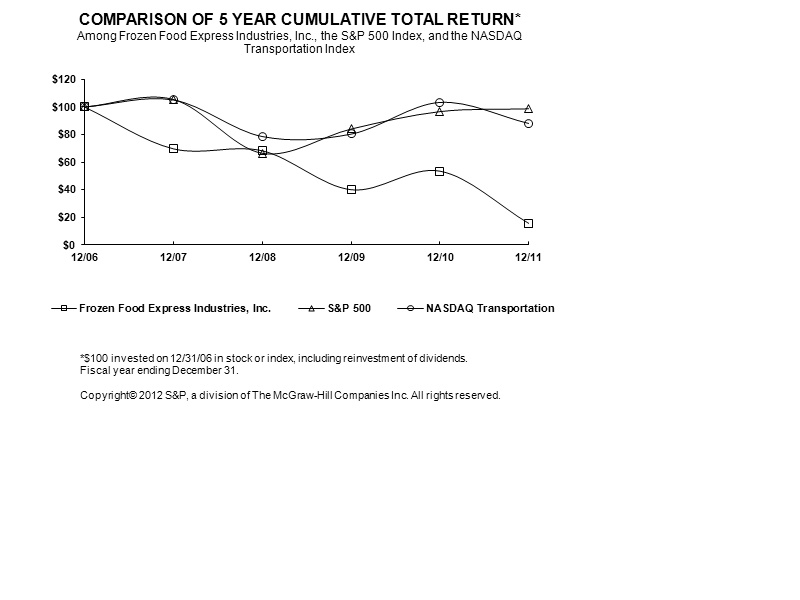
Comparative Stock Performance
The graph below compares the cumulative total stockholder return on our common stock with the NASDAQ Transportation Index and the S&P 500 Index for the last five years. The graph assumes $100 is invested in our common stock, the NASDAQ Transportation Index and the S&P 500 Index on December 31, 2006, with reinvestment of dividends. The comparisons in the graph are based on historical data and are not intended to predict future performance of our stock. The information in the graph shall be deemed “furnished” and not “filed” for purposes of Section 18 of the Exchange Act or otherwise subject to the liabilities of that section.
ITEM 6. Selected Financial Data
The following unaudited data for each of the years in the five-year period ended December 31, 2011 should be read in conjunction with our Consolidated Financial Statements and Notes thereto included under Item 8 of this report and "Management's Discussion and Analysis of Financial Condition and Results of Operations" contained in Item 7.
| | | (dollars in thousands, except per share data) | |
| Summary of Operations | | 2011 | | | 2010 | | | 2009 | | | 2008 | | | 2007 | |
| Statement of Operations Data | | | | | | | | | | | | | | | |
| Total operating revenue | | $ | 388,461 | | | $ | 368,822 | | | $ | 373,051 | | | $ | 490,536 | | | $ | 452,214 | |
| Net (loss) income | | $ | (36,670 | ) | | $ | (11,930 | ) | | $ | (16,415 | ) | | $ | 605 | | | $ | (7,670 | ) |
| Operating expenses | | $ | 426,698 | | | $ | 386,492 | | | $ | 397,964 | | | $ | 488,482 | | | $ | 462,743 | |
Operating ratio (a) | | | 109.8 | % | | | 104.8 | % | | | 106.7 | % | | | 99.6 | % | | | 102.3 | % |
| | | | | | | | | | | | | | | | | | | | | |
| Balance Sheet Data | | | | | | | | | | | | | | | | | | | | |
| Total assets | | $ | 126,404 | | | $ | 134,905 | | | $ | 145,800 | | | $ | 162,186 | | | $ | 173,669 | |
| Long-term debt – borrowings under credit facility | | $ | 19,888 | | | $ | 5,689 | | | $ | - | | | $ | - | | | $ | - | |
| Shareholders' equity | | $ | 42,902 | | | $ | 78,809 | | | $ | 89,735 | | | $ | 106,451 | | | $ | 107,259 | |
| | | | | | | | | | | | | | | | | | | | | |
| Per Share Data | | | | | | | | | | | | | | | | | | | | |
| Net (loss) income per common share, diluted | | $ | (2.08 | ) | | $ | (0.69 | ) | | $ | (0.96 | ) | | $ | 0.04 | | | $ | (0.45 | ) |
Book value per share (b) | | $ | 2.42 | | | $ | 4.50 | | | $ | 5.22 | | | $ | 6.32 | | | $ | 6.41 | |
| Cash dividends per share | | $ | - | | | $ | - | | | $ | 0.03 | | | $ | 0.12 | | | $ | 0.12 | |
| Weighted average diluted shares | | | 17,589 | | | | 17,275 | | | | 17,080 | | | | 16,997 | | | | 17,187 | |
| | | | | | | | | | | | | | | | | | | | | |
| Revenue From | | | | | | | | | | | | | | | | | | | | |
| Truckload linehaul services | | $ | 156,302 | | | $ | 171,392 | | | $ | 187,234 | | | $ | 214,348 | | | $ | 212,416 | |
| Dedicated fleets | | | 17,469 | | | | 17,467 | | | | 19,707 | | | | 24,609 | | | | 17,861 | |
| Less-than-truckload linehaul services | | | 112,030 | | | | 110,467 | | | | 109,054 | | | | 124,091 | | | | 127,438 | |
| Fuel surcharges | | | 80,705 | | | | 57,410 | | | | 44,876 | | | | 109,144 | | | | 73,391 | |
| Brokerage and logistics services | | | 18,524 | | | | 6,798 | | | | 7,266 | | | | 13,142 | | | | 15,586 | |
| Equipment rental | | | 3,431 | | | | 5,288 | | | | 4,914 | | | | 5,202 | | | | 5,522 | |
| Total operating revenue | | $ | 388,461 | | | $ | 368,822 | | | $ | 373,051 | | | $ | 490,536 | | | $ | 452,214 | |
| Computational Notes: |
| (a) | Operating expenses divided by total operating revenue. |
| (b) | Shareholders’ equity divided by the number of total shares issued less the number of treasury shares (excluding treasury shares held in the Rabbi Trust), all as of year-end. |
ITEM 7. Management’s Discussion and Analysis of Financial Condition and Results of Operations
The following discussion and analysis of our financial condition and results of operations should be read together with the selected consolidated financial data and our consolidated financial statements and the related notes appearing elsewhere in this report. This discussion and analysis contains forward-looking statements that involve risks, uncertainties and assumptions. Our actual results may differ materially from those anticipated in these forward-looking statements as a result of many factors, including but not limited to those under the heading “Risk Factors” beginning on page eight. We do not assume, and specifically disclaim, any obligation to update any forward-looking statement contained in this report.
OVERVIEW
The trucking industry continues to face challenges due to an uncertain economy. Higher, fuel costs, driver shortages, increasing material costs highlighted by the dramatic increase in tire prices in 2011, tight credit markets, and the uncertain political climate in the United States are challenges we faced in 2011 as we tried to restore the Company to a competitive position. In the first two months of 2011, our operations were dramatically impacted by ice storms in our major markets in the Northeast, Midwest, Southeast and Texas. Shipping was halted during extended periods, which created higher costs and lost profits estimated to be $2.4 million. Additionally, the excessive heat in the second and third quarter of 2011 resulted in increased maintenance costs, an estimated impact of $2.0 million as a result of the difficult operating conditions and the age of much of our equipment. In the second half of 2011, we lost an arbitration case, which dated back to 2005, had other unfavorable settlements and associated legal costs which increased our claims and insurance expense by approximately $8.9 million. We also incurred additional expense of approximately $3.4 million related to a contract dispute with an existing customer for new logistics services rendered and approximately $1.1 million in additional expense for the restructure of back-office personnel and sale of our dry-van equipment in the fourth quarter of 2011. The sale of our dry-van equipment generated cash of approximately $13.6 million.
Influenced by the industry driver shortage, and more specifically a reduction in owner operators, we finished the year with 31 fewer trucks in service in 2011, on average, versus 2010. However, we capitalized on the success of our driver academy, which we opened in the first half of 2011 to bolster recruitment. The FFE Driver Academy provided approximately 650 drivers to the Company during the year ended December 31, 2011 and had 274 drivers enrolled in the training program at the end of 2011. We will continue these efforts as we anticipate an industry driver shortage will remain for the foreseeable future.
Our LTL and brokerage and logistics services revenues improved for the year ended 2011 compared to 2010. LTL tonnage and shipment count increased by 0.5% and 1.3%, respectively, during 2011 compared to the same period in 2010. The Company achieved slight improvements in its revenue per total mile and revenue per hundredweight in 2011, versus the same period in 2010. However, these rate improvements were insufficient to offset increasing costs for the year. We are implementing rate increases and broadening our logistics services to offset costs and improve yield. We continue to focus on providing excellent service, as well as deploying information technology that we anticipate will differentiate our services and improve shipping efficiencies. Compared to last year’s levels, the surge in fuel prices in 2011 has renewed shippers’ resistance to fuel price surcharges which has affected net sales in 2011. Fuel surcharges help to offset the higher cost of tractor fuel only and do not offset higher fuel costs related to refrigerated trailers.
We are a national leader in full service temperature controlled transportation services and other freight services such as dedicated and brokerage logistics services for a wide range of customers including an expanded logistics service of transporting oil field water for “fracturing”. We generate our revenue from truckload, LTL, dedicated and brokerage and logistics services we provide to our customers. Generally, we are paid either by the mile, the weight or the number of trucks being utilized by our dedicated service customers. We also derive revenue from fuel surcharges, loading and unloading activities, equipment detention and other ancillary services. The main factors that affect our revenue are the rate per mile we receive from our customers, the percentage of miles for which we are compensated and the number of miles we generate with our equipment. These factors relate to, among other things, the United States economy, inventory levels, the level of truck capacity in the transportation industry and specific customer demand. We monitor our revenue production primarily through average revenue per truck per week, net of fuel surcharges, revenue-per-hundredweight for our LTL services, empty mile ratio, revenue per loaded and total miles, the number of linehaul shipments, loaded miles per shipment and the average weight per shipment.
Results of Operations
For the year ended December 31, 2011, our total operating revenue increased by $19.6 million, or 5.3% to $388.5 million from the same period of 2010. Our total operating revenue, net of fuel surcharges, decreased $3.6 million, or 1.2%, to $307.8 million from $311.4 million in the same period in 2010, primarily due to a $13.8 million decrease in dry-freight revenue and a $1.3 million decline in temperature controlled truckload revenue, partially offset by a $11.7 million increase in brokerage and logistics services for additional services provided to an existing customer and the addition of oil field water delivery services. Excluding fuel surcharges, our average revenue per tractor per week decreased 2.8%. Total revenue per loaded mile increased 5.2% to $1.62 in the year ended December 31, 2011 compared to $1.54 in the same period of 2010. Our empty mile ratio remained flat at 11.5% year over year. Our truckload revenue decreased by $15.1 million, or 8.0% partially caused by the shortage of 31 average weekly trucks in service during the year and the sale of dry-freight equipment in the fourth quarter of 2011. LTL revenue increased 1.4%, in the twelve months ended December 31, 2011 compared to the same period in 2010 partially due to a 0.9% increase in our average LTL revenue per hundredweight to $13.94 from $13.81 and a 1.3% increase in the number of shipments. Dedicated revenue remained flat year over year, at $17.5 million. Brokerage and logistics services revenue increased $11.7 million for the year ended 2011, or 172.5% compared to the same period of 2010 primarily due to expanded logistics and transportation management services provided to an existing customer and revenue from services provided to customers in the oil field services industry. These expanded logistics services include contract-pricing based temperature controlled truckload, LTL and brokered services, while the oil field services revenue pertains to both brokered and asset-based transportation services.
The impact on our profitability attributable to operating expense is primarily influenced by variable costs associated with transporting freight for our customers and fixed costs largely related to salaried operations personnel, facilities and equipment. Costs that are more variable in nature include fuel expense, driver-related expenses such as wages, benefits, recruitment and training, and owner operator costs, which are recorded under purchased transportation. Expenses that have both fixed and variable components include maintenance, tire expense and our total cost of insurance and claims. These expenses generally vary with the miles we drive, but also have a controllable component based on safety, fleet age, efficiency and other factors. Our main fixed costs relate to the acquisition and financing of long-term assets, such as revenue equipment and service centers. Although certain factors affecting our expenses are beyond our control, we monitor them closely and attempt to anticipate changes in these factors to help us manage our business. For example, fuel prices fluctuated dramatically and quickly at various times during the last several years. We manage our exposure to changes in fuel prices primarily through fuel surcharge programs with our customers, as well as through volume fuel purchasing arrangements with national fuel centers and bulk purchases of fuel at our service centers. To help further reduce fuel expense, we manage the maximum rate of speed and monitor tractor engine efficiency through controlling cab temperatures when idle. In addition, we anticipate new technology currently being deployed will contribute to improved management of out of route miles and other factors that influence fuel costs.
Our operating expenses as a percentage of total operating revenue, or “operating ratio,” was 109.8% for the twelve months ended December 31, 2011 compared to 104.8% in the same period of 2010. Our loss per diluted share was $2.08 in 2011 compared to $0.69 in 2010.
Our business requires substantial, ongoing capital investments, particularly for new tractors and trailers. At December 31, 2011, we had $19.9 million borrowed under our credit facility and $42.9 million in stockholders’ equity. In 2011, we added revenue equipment of $18.4 million, investments in technology of $3.0 million, had other investments of $0.8 million, and recognized a gain of $5.7 million on the disposition of used equipment. Proceeds from revenue equipment sales were $22.5 million. These capital expenditures were primarily funded with proceeds from the sale of equipment and borrowings under our revolving credit facility. We estimate that capital expenditures, net of proceeds from dispositions, will range from $3 to $5 million in 2012. During 2011, we also incurred revenue equipment rent of $36.6 million as we lease many of our trucks and trailers.
The following table summarizes and compares the significant components of revenue and presents our operating ratio and revenue per truck per week for each of the years ended December 31:
| | | (in thousands, except percentage amounts) | |
| | 2011 | | | 2010 | | | 2009 | |
| Temperature-controlled fleet | | $ | 115,813 | | | $ | 117,111 | | | $ | 136,427 | |
| Dry-freight fleet | | | 40,489 | | | | 54,281 | | | | 50,807 | |
| Total truckload linehaul services | | | 156,302 | | | | 171,392 | | | | 187,234 | |
| Dedicated fleets | | | 17,469 | | | | 17,467 | | | | 19,707 | |
| Total truckload | | | 173,771 | | | | 188,859 | | | | 206,941 | |
| Less-than-truckload linehaul services | | | 112,030 | | | | 110,467 | | | | 109,054 | |
| Fuel surcharges | | | 80,705 | | | | 57,410 | | | | 44,876 | |
| Brokerage and logistics services | | | 18,524 | | | | 6,798 | | | | 7,266 | |
| Equipment rental | | | 3,431 | | | | 5,288 | | | | 4,914 | |
| Total operating revenue | | | 388,461 | | | | 368,822 | | | | 373,051 | |
| | | | | | | | | | | | | |
| Operating expenses | | | 426,698 | | | | 386,492 | | | | 397,964 | |
| Loss from operations | | $ | (38,237 | ) | | $ | (17,670 | ) | | $ | (24,913 | ) |
Operating ratio (a) | | | 109.8 | % | | | 104.8 | % | | | 106.7 | % |
| | | | | | | | | | | | | |
| Total truckload revenue | | $ | 173,771 | | | $ | 188,859 | | | $ | 206,941 | |
| Less-than-truckload linehaul revenue | | | 112,030 | | | | 110,467 | | | | 109,054 | |
| Total linehaul and dedicated fleet revenue | | $ | 285,801 | | | $ | 299,326 | | | $ | 315,995 | |
| | | | | | | | | | | | | |
| Weekly average trucks in service | | | 1,751 | | | | 1,782 | | | | 1,937 | |
Revenue per truck per week (b) | | $ | 3,130 | | | $ | 3,221 | | | $ | 3,129 | |
| Computational notes: |
| (a) | Operating expenses divided by total operating revenue. |
| (b) | Average daily revenue times seven divided by weekly average trucks in service. |
The following table summarizes and compares selected statistical data relating to our freight operations for each of the years ended December 31:
| Truckload | | 2011 | | | 2010 | | | 2009 | |
Total linehaul miles (a) | | | 109,065 | | | | 126,090 | | | | 149,412 | |
Loaded miles (a) | | | 96,547 | | | | 111,537 | | | | 133,956 | |
Empty mile ratio (b) | | | 11.5 | % | | | 11.5 | % | | | 10.3 | % |
Linehaul revenue per total mile (c) | | $ | 1.43 | | | $ | 1.36 | | | $ | 1.25 | |
Linehaul revenue per loaded mile (d) | | $ | 1.62 | | | $ | 1.54 | | | $ | 1.40 | |
Linehaul shipments (a) | | | 107.6 | | | | 124.3 | | | | 154.3 | |
Loaded miles per shipment (e) | | | 897 | | | | 897 | | | | 868 | |
| Less-than-truckload | | | | | | | | | | | | |
Hundredweight (a) | | | 8,038 | | | | 8,001 | | | | 7,619 | |
Shipments (a) | | | 259.8 | | | | 256.5 | | | | 246.9 | |
Linehaul revenue per hundredweight (f) | | $ | 13.94 | | | $ | 13.81 | | | $ | 14.31 | |
Linehaul revenue per shipment (g) | | $ | 431 | | | $ | 431 | | | $ | 442 | |
Average weight per shipment (h) | | | 3,094 | | | | 3,119 | | | | 3,086 | |
| Computational notes: |
| (a) | In thousands. |
| (b) | Total truckload linehaul miles less truckload loaded miles divided by total truckload linehaul miles. |
| (c) | Revenue from truckload linehaul services divided by truckload total linehaul miles. |
| (d) | Revenue from truckload linehaul services divided by truckload loaded miles. |
| (e) | Total truckload loaded miles divided by number of truckload linehaul shipments. |
| (f) | LTL revenue divided by LTL hundredweight. |
| (g) | LTL revenue divided by number of LTL shipments. |
| (h) | LTL hundredweight times one hundred divided by number of LTL shipments. |
The following table summarizes and compares the makeup of our fleets between company-provided tractors and tractors provided by independent contractors as of December 31:
| | 2011 | 2010 | | 2009 | |
| Total company tractors available | 1,390 | 1,499 | | | 1,554 | |
| Total owner-operator tractors available | 266 | 304 | | | 389 | |
| Total tractors available | 1,656 | 1,803 | | | 1,943 | |
| Total trailers available | 3,388 | 3,503 | | | 3,786 | |
Comparison of Year Ended December 31, 2011 to Year Ended December 31, 2010
The following table sets forth revenue, operating income, operating ratios and revenue per truck per week and the dollar and percentage changes of each:
Revenue from (a) | | 2011 | | | 2010 | | | Dollar Change 2011 vs. 2010 | | Percentage Change 2011 vs. 2010 | | |
| Temperature-controlled services | | $ | 115,813 | | | $ | 117,111 | | | $ | (1,298 | ) | (1.1 | ) | % |
| Dry-freight services | | | 40,489 | | | | 54,281 | | | | (13,792 | ) | (25.4 | ) | |
| Total truckload linehaul services | | | 156,302 | | | | 171,392 | | | | (15,090 | ) | (8.8 | ) | |
| Dedicated services | | | 17,469 | | | | 17,467 | | | | 2 | | - | | |
| Total truckload | | | 173,771 | | | | 188,859 | | | | (15,088 | ) | (8.0 | ) | |
| Less-than-truckload linehaul services | | | 112,030 | | | | 110,467 | | | | 1,563 | | 1.4 | | |
| Fuel surcharges | | | 80,705 | | | | 57,410 | | | | 23,295 | | 40.6 | | |
| Brokerage and logistics services | | | 18,524 | | | | 6,798 | | | | 11,726 | | 172.5 | | |
| Equipment rental | | | 3,431 | | | | 5,288 | | | | (1,857 | ) | (35.1 | ) | |
| Total operating revenue | | | 388,461 | | | | 368,822 | | | | 19,639 | | 5.3 | | |
| | | | | | | | | | | | | | | | |
| Operating expenses | | | 426,698 | | | | 386,492 | | | | 40,206 | | 10.4 | | |
| Loss from operations | | $ | (38,237 | ) | | $ | (17,670 | ) | | $ | (20,567 | ) | 116.4 | | % |
Operating ratio (b) | | | 109.8 | % | | | 104.8 | % | | | | | | | |
| | | | | | | | | | | | | | | | |
| Total truckload revenue | | $ | 173,771 | | | $ | 188,859 | | | $ | (15,088 | ) | (8.0 | ) | % |
| Less-than-truckload linehaul revenue | | | 112,030 | | | | 110,467 | | | | 1,563 | | 1.4 | | |
| Total linehaul and dedicated services revenue | | $ | 285,801 | | | $ | 299,326 | | | $ | (13,525 | ) | (4.5 | ) | % |
| | | | | | | | | | | | | | | | |
| Weekly average trucks in service | | | 1,751 | | | | 1,782 | | | | (31 | ) | (1.7 | ) | % |
Revenue per truck per week (c) | | $ | 3,130 | | | $ | 3,221 | | | $ | (91 | ) | (2.8 | ) | % |
| Computational notes: |
| (a) | Revenue and expense amounts are stated in thousands of dollars. |
| (b) | Operating expenses divided by total revenue. |
| (c) | Average daily revenue times seven divided by weekly average trucks in service. |
Our total operating revenue increased $19.6 million, or 5.3%, to $388.5 million in the year ended December 31, 2011 compared to $368.8 million in the same period of 2010. Our total operating revenue excluding fuel surcharges decreased $3.6 million, or 1.2%, to $307.8 million compared to $311.4 million in the same period of 2010.
For the year ended December 31, 2011, total truckload revenue, excluding fuel surcharges, decreased $15.1 million, or 8.0%, to $173.8 million from $188.9 million compared to the same period in 2010. Truckload revenues declined primarily due to a reduction in the average number of trucks in service to 1,751 from 1,782 and a reduction in revenue from dry-freight services compared to the same period in 2010. The number of total truckload shipments decreased 13.4% in 2011 to 107,600 compared to 124,300 in the same period of 2010. Even though loaded miles per shipment remained relatively flat in comparison year-over-year, total and loaded truckload miles decreased by 13.5% and 13.4% respectively, partially due to the 1.7% decline in weekly average trucks in service of 31 trucks. The decrease in truckload services is partially due to the Company’s decision to no longer provide dry-freight services via a dedicated fleet of dry van trailers. Overall, our revenue per loaded mile increased to $1.62 from $1.54.
Due to a 1.3% increase in shipments, total tonnage increased 0.5%. As a result, our LTL revenue increased $1.5 million, or 1.4%, to $112.0 million in the year ended December 31, 2011, compared to $110.5 million in the same period of 2010. Total weight shipped for the year increased 0.5% to 803.8 million pounds from 800.1 million pounds in the same period of 2010. The LTL market is showing signs of strengthening with capacity tightening and rates improving. This helped our revenue per hundredweight to increase to $13.94 in the year ended December 31, 2011 from $13.81 in the same period of 2010, an increase of 0.9%.
Fuel surcharges represent the cost of fuel that we are able to pass along to our customers based upon changes in the Department of Energy’s weekly indices. Net fuel prices per gallon increased approximately 33.6% in 2011 compared to 2010 resulting in fuel surcharges of $80.7 million, a 40.6% increase year-over-year. The additional fuel revenue is offset by increased fuel costs to the Company within fuel and purchased transportation expenses.
The following table sets forth for the years indicated the dollar and percentage increase or decrease of the items in our consolidated statements of operations, and those items as a percentage of revenue:
| | | (in thousands) Dollar Change | | Percentage Change | | Percentage of Revenue | |
| | | 2011 vs. 2010 | | 2011 vs. 2010 | | 2011 | | 2010 | |
| Total operating revenue | | $ | 19,639 | | 5.3 | % | 100.0 | % | 100.0 | % |
| | | | | | | | | | | |
| Operating Expenses | | | | | | | | | | |
| Salaries, wages and related expenses | | | 3,700 | | 3.2 | | 31.1 | | 31.8 | |
| Purchased transportation | | | 385 | | 0.5 | | 18.7 | | 19.6 | |
| Fuel | | | 21,651 | | 30.3 | | 24.0 | | 19.4 | |
| Supplies and maintenance | | | 8,524 | | 17.8 | | 14.5 | | 13.0 | |
| Revenue equipment rent | | | 743 | | 2.1 | | 9.4 | | 9.7 | |
| Depreciation | | | 1,459 | | 8.9 | | 4.6 | | 4.4 | |
| Communications and utilities | | | (293 | ) | (5.9 | ) | 1.2 | | 1.3 | |
| Claims and insurance | | | 7,536 | | 57.9 | | 5.3 | | 3.5 | |
| Operating taxes and licenses | | | (12 | ) | (0.3 | ) | 1.1 | | 1.1 | |
| Gain on sale of property and equipment | | | (4,638 | ) | 420.5 | | (1.5 | ) | (0.3 | ) |
| Miscellaneous | | | 1,151 | | 26.2 | | 1.4 | | 1.3 | |
| Total Operating Expenses | | $ | 40,206 | | 10.4 | % | 109.8 | % | 104.8 | % |
Total operating expenses for the year ended December 31, 2011 increased $40.2 million, or 10.4%, to $426.7 million compared to $386.5 million in the same period of 2010. Our operating ratio increased for the year 2011 to 109.8% from 104.8% in the same period of 2010, as our operating expenses increased at a higher rate than our revenue. As a function of operating ratio, three expense areas had the largest deterioration in year–over-year expense increase: fuel which decreased 4.6 points of operating ratio, supplies and maintenance which decreased1.5 points of operating ratio and claims and insurance, which decreased1.8 points of operating ratio decreasing a total of 7.9 points. Depreciation and miscellaneous expenses collectively decreased the operating ration 0.4 points, while all other areas improved an aggregate 3.2 operating points. Fuel costs increased primarily due to a 33.6% increase in net price per gallon average for the year. The increase in supplies and maintenance expense relates to higher maintenance costs related to weather issues throughout 2011 and the increasing amount of aging tractors and trailers in our fleet. We anticipate we will have all of our out of warranty tractors replaced by the end of the first quarter of 2012 and expect to replace, or retire, the oldest 10 to 12 percent of our trailers by the end of the third quarter of 2012. Additionally, claims and insurance had a larger than normal impact on our negative results due to settlement of large claims in the third and fourth quarters, all from prior years.
Salaries, wages and related expenses consist of compensation for our employees, including drivers and non-drivers. It also includes employee-related costs, such as payroll taxes, work-related injuries, group health insurance, and other fringe benefits. The most variable of the salary, wage and related expenses is driver pay, which is affected by the mix of drivers and owner-operators in our fleets as well as our efficiencies in our over-the-road operations. Salaries, wages and related expenses increased $3.7 million, or 3.2%, for the year ended December 31, 2011, compared to the same period in 2010. Driver salaries including per diem costs increased $1.8 million, or 2.7%, in 2011 compared to the same period in 2010, primarily due to an increase in driver headcount. Recent graduates of our driving academy continue to train with an experienced driver for six weeks, contributing to the driver headcount increase while not attributing to revenue production. Expenses related to work related injuries and group health insurance costs increased $0.6 million partially due to an increase in group health insurance costs and an increase of cost per claim incurred of 1.7%. Non-driver salaries increased $0.4 million, or 1.1% in 2011 compared to the same period in 2010, due to our hiring of additional employees to support new logistics services and an increase in severance pay for the reduction in back-office headcount in the fourth quarter of 2011 compared to the year 2010. Non-driver headcount decreased to 686 at the end of 2011 compared to 714 in the same period of 2010; however, an increase in tax rates for state unemployment, severance pay, and the average non-driver headcount for the year increased payroll tax expense by $0.9 million or 11.6% in the year ended December 31, 2011 compared to the same period in 2010.
Purchased transportation expense consists of payments to independent contractors for the equipment and services they provide, payments to other motor carriers who handle our brokerage and logistics services and to various railroads for intermodal services. It also includes fuel surcharges paid to our independent contractors for which we charge our customers. These expenses are highly variable with revenue and/or the mix of company drivers versus independent contractors. Purchased transportation expense increased $0.4 million, or 0.5%, in the year ended December 31, 2011 compared to the same period in 2010. Intermodal purchased transportation expense decreased $0.4 million, or 2.7%, compared to the same period in 2010. The portion of our purchased transportation connected with our truckload and LTL services decreased $5.1 million, excluding fuel surcharges, primarily reflecting a decrease in the number of owner operators utilized during the year. Purchased transportation associated with our brokerage and logistics services increased $3.0 million, or 52.9%, in the year ended December 31, 2011 compared to the same period in 2010, primarily due to expanded logistics services, such as services provided to customers in the oil field services industry. Fuel payments to our owner operators increased $2.9 million in 2011, or 26.0%, to $13.9 million from $11.0 million compared to the same period in 2010 due to an increase in fuel surcharges.
Fuel expense and fuel taxes increased $21.6 million, or 30.3%, in the year ended December 31, 2011 to $93.2 million from $71.6 million during the same period in 2010. The increase was primarily due to a 33.6% increase in net fuel price per gallon. We have fuel surcharge provisions in substantially all of our transportation contracts and attempt to recover a portion of fuel price increases through fuel surcharges and rates to our customers. Our fuel surcharges apply to tractor fuel burned in loaded miles, but not empty miles, and do not apply to fuel used for the refrigeration units.
Supplies and maintenance expenses primarily consist of repairs, maintenance and tires along with load specific expenses including loading/unloading, tolls, pallets, pickup and delivery and recruiting. Supplies and maintenance costs increased $8.5 million in the year ended December 31, 2011, or 17.8%, compared to the same period in 2010. This increase was primarily driven by an increase in fleet repairs and maintenance costs of $3.6 million due to an increase in the average age of the fleet as full production lines enjoyed by equipment manufacturers inhibited our ability to acquire new equipment on a timely basis, an increase in freight handling costs related to new business in oil field water delivery services of $1.2 million, additional costs of $0.8 million related the driver academy and recruiting, and $0.8 million related to higher tire prices compared to the same period in 2010.
Revenue equipment rent increased $0.7 million, or 2.1%, in the year ended December 31, 2011 to $36.5 million from $35.8 million in the same period of 2010. The increase is primarily due to an increase in the average number of trailers under lease at the end of 2011 of 2,210 compared to 2,112 in the same period in 2010. The average cost of equipment will increase as we replace older equipment with new equipment. We expect equipment costs to increase in future periods as a result of higher prices of new equipment.
Depreciation expense relates to owned tractors, trailers, communications units, service centers, capital assets and other assets. Gains or losses on dispositions of revenue equipment are set forth in a separate line item within our statements of operations. Depreciation expense increased $1.5 million, or 8.9%, primarily as a result of purchases of revenue equipment off of lease programs, purchases of new trailers as well as an increase in depreciation resulting from new technology equipment placed in service. Depreciation expense is also dependent upon the mix of company-owned equipment versus leased equipment. Future depreciation expense will also be impacted by our leasing decisions.
Claims and insurance expense consists of the costs of premiums, as well as reserves we make within our self-insured retention program, primarily for personal injury, property damage, physical damage and cargo claims. These expenses vary and are dependent on the frequency and severity of accidents, our self-insured retention amounts and the insurance market. Claims and insurance costs increased by $7.5 million, or 57.9%, in the year ended December 31, 2011 to $20.5 million compared to $13.0 million in the same period of 2010. The increase was primarily due to unfavorable settlements of claims from prior years. The Company is responsible for the first $4.0 million on each personal injury and property damage claim. We have excess coverage from $4.0 million to $75.0 million. Our significant self-insured retention exposes us to the possibility of significant fluctuations in claims expense between periods depending on the frequency, severity and timing of claims and to adverse financial results if we incur large or numerous losses. In the event of an uninsured claim above our insurance coverage, a claim that approaches the maximum self-insured retention level or an increase in the frequency or severity of claims within our self-insured retention, our financial condition and results of operations could be materially and adversely affected.
Miscellaneous expenses consist of facility rents, legal fees, audit fees, customer bad debts and other administrative costs. Miscellaneous expense increased $1.2 million, or 26.2%, in the year ended December 31, 2011 compared to the same period in 2010 primarily due to an increase in building and office rent.
The Company’s effective tax benefit rate was 5.5% in the year ended December 31, 2011 compared to 31.8% in the same period of 2010 primarily due to the operating results for the year. We pay our drivers a per-diem allowance for travel related expenses for which we are only able to deduct 80% for tax purposes. The difference between our effective tax rate and the federal statutory rate of 35% is primarily attributable to valuation allowances, non-deductible driver related expenses and state income taxes.
As a result of factors described above, our net loss increased to $36.7 million in the year ended December 31, 2011 compared to a net loss of $11.9 million in the same period of 2010. Our net loss per share increased to $2.08 per diluted share from a loss of $0.69 per diluted share in 2010.
Comparison of Year Ended December 31, 2010 to Year Ended December 31, 2009
The following table sets forth revenue, operating income, operating ratios and revenue per truck per week and the dollar and percentage changes of each:
Revenue from (a) | | 2010 | | | 2009 | | | Dollar Change 2010 vs. 2009 | | Percentage Change 2010 vs. 2009 | | |
| Temperature-controlled services | | $ | 117,111 | | | $ | 136,427 | | | $ | (19,316 | ) | (14.2 | ) | % |
| Dry-freight services | | | 54,281 | | | | 50,807 | | | | 3,474 | | 6.8 | | |
| Total truckload linehaul services | | | 171,392 | | | | 187,234 | | | | (15,842 | ) | (8.5 | ) | |
| Dedicated services | | | 17,467 | | | | 19,707 | | | | (2,240 | ) | (11.4 | ) | |
| Total truckload | | | 188,859 | | | | 206,941 | | | | (18,082 | ) | (8.7 | ) | |
| Less-than-truckload linehaul services | | | 110,467 | | | | 109,054 | | | | 1,413 | | 1.3 | | |
| Fuel surcharges | | | 57,410 | | | | 44,876 | | | | 12,534 | | 27.9 | | |
| Brokerage and logistics services | | | 6,798 | | | | 7,266 | | | | (468 | ) | (6.4 | ) | |
| Equipment rental | | | 5,288 | | | | 4,914 | | | | 374 | | 7.6 | | |
| Total operating revenue | | | 368,822 | | | | 373,051 | | | | (4,229 | ) | (1.1 | ) | |
| | | | | | | | | | | | | | | | |
| Operating expenses | | | 386,492 | | | | 397,964 | | | | (11,472 | ) | (2.9 | ) | |
| Income (loss) from operations | | $ | (17,670 | ) | | $ | (24,913 | ) | | $ | 7,243 | | (29.1 | ) | % |
Operating ratio (b) | | | 104.8 | % | | | 106.7 | % | | | | | | | |
| | | | | | | | | | | | | | | | |
| Total truckload revenue | | $ | 188,859 | | | $ | 206,941 | | | $ | (18,082 | ) | (8.7 | ) | % |
| Less-than-truckload linehaul revenue | | | 110,467 | | | | 109,054 | | | | 1,413 | | 1.3 | | |
| Total linehaul and dedicated services revenue | | $ | 299,326 | | | $ | 315,995 | | | $ | (16,669 | ) | (5.3 | ) | % |
| | | | | | | | | | | | | | | | |
| Weekly average trucks in service | | | 1,782 | | | | 1,937 | | | | (155 | ) | (8.0 | ) | % |
Revenue per truck per week (c) | | $ | 3,221 | | | $ | 3,129 | | | $ | 92 | | 3.0 | | % |
| Computational notes: |
| (a) | Revenue and expense amounts are stated in thousands of dollars. |
| (b) | Operating expenses divided by total operating revenue. |
| (c) | Average daily revenue times seven divided by weekly average trucks in service. |
The economy had a negative impact on our operating revenue in 2010, with the greatest impact on our truckload operations. Our total operating revenue decreased $4.2 million, or 1.1%, to $368.8 million in 2010 from $373.1 million in 2009. Our total operating revenue excluding fuel surcharges decreased $16.8 million, or 5.1%, to $311.4 million from $328.2 million in 2009.
Truckload services suffered from a shortage of drivers throughout the year, impacting the company’s weekly average trucks in service by a shortage of 155 trucks compared to 2009. This negatively impacted total truckload revenue, which decreased $18.1 million, or 8.7%, to $188.9 million from $207.0 million in 2009. The number of total truckload shipments decreased 19.4% to 124,300 from 154,300 in 2009. Even though loaded miles per shipment increased by 3.3% compared to a decline of 10.4% in 2009, total and loaded truckload miles decreased by 15.6% and 16.7% respectively, due to the 8% decline in weekly average trucks in service of 155 trucks. Overall, our revenue per loaded mile increased to $1.54 from $1.40.
Due to a 3.9% increase in shipments and a 1.1% increase in weight per shipment, total tonnage increased 5.0% allowing our less-than-truckload revenue to increase $1.4 million, or 1.3%, to $110.5 million from $109.1 million. Total weight shipped for the year increased 5.0% to 800.1 million pounds from 761.9 million pounds in 2009. Unlike the truckload market, the LTL market continues to face excess capacity and stiff competition, with downward pressure on rates, resulting in a decrease in revenue per hundredweight to $13.81 in 2010 from $14.31 in 2009, a decline of 3.5%.
Fuel surcharges represent the cost of fuel that we are able to pass along to our customers based upon changes in the Department of Energy’s weekly indices. Net fuel prices per gallon increased approximately 20% in 2010 compared to 2009 resulting in fuel surcharges of $57.4 million, a 27.9% increase year-over-year. The additional fuel revenue is offset by fuel costs to the Company within fuel and purchased transportation expenses.
The following table sets forth for the years indicated the dollar and percentage increase or decrease of the items in our consolidated statements of operations, and those items as a percentage of revenue:
| | | (in thousands) Dollar Change | | Percentage Change | | Percentage of Revenue | |
| | | 2010 vs. 2009 | | 2010 vs. 2009 | | 2010 | | 2009 | |
| Total operating revenue | | $ | (4,229 | ) | (1.1 | )% | 100.0 | % | 100.0 | % |
| | | | | | | | | | | |
| Operating Expenses | | | | | | | | | | |
| Salaries, wages and related expenses | | | (5,007 | ) | (4.1 | ) | 31.8 | | 32.7 | |
| Purchased transportation | | | (9,066 | ) | (11.1 | ) | 19.6 | | 21.8 | |
| Fuel | | | 8,911 | | 14.2 | | 19.4 | | 16.8 | |
| Supplies and maintenance | | | 539 | | 1.1 | | 13.0 | | 12.7 | |
| Revenue equipment rent | | | (2,874 | ) | (7.4 | ) | 9.7 | | 10.4 | |
| Depreciation | | | (1,228 | ) | (7.0 | ) | 4.4 | | 4.7 | |
| Communications and utilities | | | (170 | ) | (3.3 | ) | 1.3 | | 1.4 | |
| Claims and insurance | | | (2,288 | ) | (14.9 | ) | 3.5 | | 4.1 | |
| Operating taxes and licenses | | | (486 | ) | (10.5 | ) | 1.1 | | 1.2 | |
| Gain on sale of property and equipment | | | (967 | ) | 711.0 | | (0.3 | ) | 0.0 | |
| Miscellaneous | | | 1,164 | | 36.1 | | 1.3 | | 0.9 | |
| Total Operating Expenses | | $ | (11,472 | ) | (2.9 | )% | 104.8 | % | 106.7 | % |
Due to the continued economic uncertainty in 2010, we extended our strict cost cutting plan that resulted in a decrease in operating expenses versus 2009. Performance pay increases were suspended, and 401(k) plan matches and certain other benefits were reduced or suspended, among other steps taken to reduce operating expenses. Total operating expenses for 2010 decreased $11.5 million, or 2.9%, to $386.5 million from $398.0 million in 2009. The decrease in expenses allowed operating losses to decline $7.2 million compared to 2009, an improvement of 29.1%.
Salaries, wages and related expenses consist of compensation for our employees, including drivers and non-drivers. It also includes employee-related costs, such as payroll taxes, work-related injuries, group health insurance, and other fringe benefits. The most variable of the salary, wage and related expenses is driver pay, which is affected by the mix of drivers and owner-operators in our fleets as well as our efficiencies in our over-the-road operations. Salaries, wages and related expenses decreased $5.0 million, or 4.1%, in 2010 compared to the same period in 2009. Driver salaries including per diem costs decreased $3.4 million, or 4.9%, primarily due to the decrease in miles driven. Expenses related to work related injuries decreased $1.3 million and group health insurance costs decreased $1.3 million. Non-driver headcount ended the year at 714 versus 682 at the end of 2009.
Purchased transportation expense consists of payments to independent contractors for the equipment and services they provide, payments to other motor carriers who handle our brokerage services and to various railroads for intermodal services. It also includes fuel surcharges paid to our independent contractors for which we charge our customers. These expenses are highly variable with revenue and/or the mix of company drivers versus independent contractors. Purchased transportation expense decreased $9.1 million, or 11.1%, in 2010 compared to the same period in 2009. The portion of our purchased transportation connected with our truckload and LTL services decreased $8.8 million, including fuel surcharges, primarily reflecting a decrease in the number of independent contractors utilized during 2010. Purchased transportation expense related to our intermodal service and freight brokerage remained relatively flat year-over-year.
Fuel expense and fuel taxes increased $8.9 million, or 14.2%, to $71.6 million from $62.7 million in 2009. The increase was primarily due to a 20.0% increase in the net fuel price per gallon in 2010 compared to 2009. This increase was offset by a 0.4% improvement in miles per gallon to 6.42 miles per gallon in 2010 versus 6.39 miles per gallon in 2009. The majority of our tractors are equipped with opti-idle technology which monitors the temperature of the cab and allows the engine to operate more efficiently while not on the road. We have fuel surcharge provisions in substantially all of our transportation contracts and attempt to recover a portion of increasing fuel prices through fuel surcharges and rates to our customers. We anticipate that fuel expense will increase as the economy improves.
Supplies and maintenance expenses primarily consist of repairs, maintenance and tires along with load specific expenses including loading/unloading, tolls, pallets, pickup and delivery and recruiting. Supplies and maintenance costs increased $0.5 million, or 1.1%, to $47.9 million compared to $47.3 million in 2009. Significant repairs to our equipment are generally covered by manufacturers’ warranties.
Revenue equipment rent expense decreased $2.9 million, or 7.4%, to $35.8 million from $38.7 million in 2009. The decrease is primarily due to a decrease in the average number of tractors under lease in 2010 of 1,120 compared to 1,264 in 2009. This savings was offset by the increase in the average cost of new equipment we lease as we replace our equipment. We expect equipment rent expense to increase in future periods as a result of higher prices of new equipment.
Depreciation expense relates to owned tractors, trailers, communications units, service centers, capital assets and other assets. Gains or losses on dispositions of revenue equipment are set forth in a separate line item within our statements of operations. Depreciation expense decreased $1.2 million, or 7.0%, compared to the same period in 2009, as owned equipment was disposed and replaced with newer leased equipment. Depreciation expense is also dependent upon the mix of company-owned equipment versus independent contractors. We expect our annual cost of tractor and trailer ownership will increase in future periods as a result of higher prices of new equipment, which is expected to result in greater depreciation. Future depreciation expense will also be impacted by our leasing decisions.
Claims and insurance expenses consist of the costs of premiums for insurance and reserves we make within our self-insured retention programs, primarily for personal injury, property damage, physical damage and cargo claims. These expenses will vary and are dependent on the frequency and severity of accidents, our self-insured retention amounts and the insurance market. Claims and insurance costs decreased by $2.3 million, or 14.9%, to $13.0 million from $15.3 million in 2009. This was primarily due to a decrease in property and physical damage claims of $1.0 million and a decrease in cargo claims of $0.8 million in 2010 compared to 2009. The Company is responsible for the first $4.0 million on personal injury and property damage liability claims. The Company has excess coverage from $4.0 million to $75.0 million. Our significant self-insured retention exposes us to the possibility of significant fluctuations in claims expense between periods depending on the frequency, severity and timing of claims and to adverse financial results if we incur large or numerous losses. In the event of an uninsured claim above our insurance coverage, a claim that approaches the maximum self-insured retention level or an increase in the frequency or severity of claims within our self-insured retention, our financial condition and results of operations could be materially and adversely affected.
Miscellaneous expenses consist of facility rents, legal fees, audit fees, customer bad debts and other administrative costs. Miscellaneous expense increased $1.2 million, or 36.1%, compared to the same period in 2009 primarily due to an increase in our bad debt expense. The Company continues to monitor its overall credit risk given the current market and general economic conditions.
The Company’s effective tax benefit rate was 31.8% in 2010 as opposed to a 34.1% effective tax rate in 2009 primarily due to the Company’s pre-tax losses in 2010 and the permanent differences between book and taxable income. We pay our drivers a per-diem allowance for travel related expenses for which we are only able to deduct 80% for tax purposes.
As a result of factors described above, we had a net loss of $11.9 million in 2010, an improvement of 27.3% compared to a net loss of $16.4 million in 2009. Net loss per share was $0.69 per diluted share in 2010 compared to net loss per share of $0.96 per diluted share in 2009.
LIQUIDITY AND CAPITAL RESOURCES
Our business requires substantial, ongoing capital investments, particularly for new tractors and trailers. Our primary sources of liquidity are funds provided by operations, our secured revolving credit facility and our ability to enter into equipment leases with various financing institutions. A portion of our tractor fleet is provided by independent contractors who own and operate their own equipment. We have no capital expenditure requirements relating to those drivers who own their tractors or obtain financing through third parties. However, to the extent we purchase tractors and extend financing to the independent contractors through our tractor purchase program, we have an associated capital expenditure requirement.
Contributing to our net loss for 2011, were several unfavorable settlements of awards, including interest and other legal costs, for claims against the company from prior years. Claims and insurance expense increased in the second half of 2011 by $8.9 million. The Company announced in the fourth quarter of 2011 a restructure of its dry-freight services resulting in the sale of essentially all of its dry vans and related tractors. The sale of our dry-van equipment generated cash of approximately $13.6 million. We expect to see a significant reduction in maintenance costs, improvement in fuel economy and other operating efficiencies. In addition, the Company is in the process of developing and implementing other operational and sales initiatives to reduce costs and improve yield on our service offerings. These initiatives include, but are not limited to adding service offerings which focus on improving margins and returns on assets, improving insurance and liability claims strategy to reduce, or prevent, the high settlement losses that had significant impact on the second half of 2011 operating results, reducing our equipment maintenance costs by improving our average fleet age, and reducing our payroll costs through a reduction in back office staffing levels. We expect these changes to improve our operating results in the future. As of March 5, 2012, we had approximately 490 tractors on order for delivery through-out 2012.
In November 2007, our Board of Directors approved a share repurchase program to repurchase up to 1.3 million shares of our common stock. This program is intended to be implemented through purchases made in either the open market or through private transactions. The timing and extent to which we will repurchase shares depends on market conditions, our bank agreement, and other corporate considerations. We made no open market purchases in 2011 or 2010 and have available approximately 747,000 shares that can be repurchased from that and previous authorizations. The repurchase program does not have an expiration date.
We establish credit terms with our customers based upon their financial strength and their historical payment pattern. Many of our largest customers under contract are Fortune 500 companies. Given the current economic conditions, we have placed additional emphasis on our review of significant outstanding receivable balances. Accounts receivable are recorded at the invoiced amounts, net of an allowance for doubtful accounts. A considerable amount of judgment is required in assessing the realization of these receivables including the current creditworthiness of each customer and related aging of the past-due balances, including any billing disputes. In order to assess the collectability of these receivables, we perform ongoing credit evaluations of our customers’ financial condition. Through these evaluations, we may become aware of a situation in which a customer may not be able to meet its financial obligations due to deterioration of its financial viability, credit ratings or bankruptcy. Our allowance for doubtful accounts is based on the best information available to us and is reevaluated and adjusted as additional information is received. We evaluate the allowance based on historical write-off experience, the size of the individual customer balances, past-due amounts and the overall national economy. Invoice balances outstanding past the contractual due date are considered past due per our policy and the customer balances are reviewed for collectability. Initial payments by new customers are monitored for compliance with contractual terms. Account balances are charged off against the allowance after all means of collection have been exhausted and the potential recovery is considered remote.
On March 28, 2011, the Company secured a committed credit facility with an aggregate availability of $50.0 million that matures in March 2015. The facility replaced the Company’s former credit facility and has more favorable terms, which provides for the ongoing working capital needs and general corporate purposes required by the Company. At December 31, 2011, the borrowing base availability under the credit facility was $46.8 million, $19.9 million was borrowed and $3.0 million of standby letters of credit, which are used primarily for our self-insurance programs and legal matters, were issued. These reduced the availability under our credit facility to $23.9 million.
The obligations under the credit facility are guaranteed by our parent company and certain named subsidiaries and secured by a pledge of substantially all of our assets. The obligations shall bear interest (i) if a Base Rate Loan (as defined in the credit facility), at the Base Rate (as defined in the credit facility) in effect from time to time, plus the Applicable Margin(as defined in the credit facility); (ii) if a LIBOR loan, at LIBOR for the applicable interest period, plus the Applicable Margin; and (iii) if any other obligation (including, to the extent permitted by law, interest not paid when due), at the Base Rate in effect from time to time, plus the Applicable Margin for Base Rate Revolver Loans (as defined in the credit facility). Interest shall accrue from the date the Loan is advanced or the obligation is incurred or payable, until paid by Borrowers. If a loan is repaid on the same day it is made, one day's interest shall accrue. We are obligated to comply with certain covenants under the new credit facility. These covenants provide various guidelines and/or restrictions related to inspections, financial information, notices, insurance, subsidiaries, permitted debt and permitted liens. It also provides for a fixed charge coverage ratio of 1.10 to 1.00 should the availability on the credit line be less than $10,000,000. The fixed charge coverage ratio is equal to the ratio, determined for the Company for the most recent twelve-month period, of (a) EBITDA minus certain capital expenditures and cash taxes paid, to (b) fixed charges, which are equal to the sum of (i) interest expense (other than payment-in-kind), (ii) principal payments made on certain borrowed money, (iii) distributions, interest or dividends on equity interests made and (iv) during certain times, depreciation expenses attributable to certain equipment of the Company based upon a 60-month straight-line depreciation schedule. EBITDA is the Company’s net income, calculated before interest expense, provision for income taxes, depreciation and amortization expense, gains or losses arising from the sale of capital assets, gains arising from the write-up of assets, and any extraordinary gains. If our borrowing base availability drops below $10.0 million we would not be in compliance with this covenant. Under this circumstance, should we need to utilize a portion of the remaining availability, we would seek a waiver of this covenant requirement from our bank. We had $23.9 million in availability at the end of the year and our projections for 2012 indicate that such a waiver will not be necessary.
The credit facility calls for the Applicable Margin to be determined by the fixed charge ratio for the end of the quarter prior to the current quarter as defined in the Loan and Security Agreement. This provision was effective in the fourth quarter of 2011 as the margins remained at Level II until September 30, 2011, per the credit facility; however, the Applicable Margin priced under Level III did not have a material impact on our financial statements. The Applicable Margin table, as determined in the Loan and Security Agreement is shown below.
Applicable Margin: with respect to any Type of Loan, the margin set forth below, as determined by the Fixed Charge Coverage Ratio for the last Fiscal Quarter:
| Level | | Ratio | | Base Rate Revolver Loans (other than Base Rate Equipment Loans) | | LIBOR Revolver Loans (other than LIBOR Equipment Loans) | | Base Rate Equipment Loans | | LIBOR Equipment Loans | |
| I | | > 2.00 to 1.00 | | 1.00 % | | 2.00 % | | 1.50 % | | 2.50 % | |
| II | | > 1.15 to 1.00 and < 2.00 to 1.00 | | 1.25 % | | 2.25 % | | 1.75 % | | 2.75 % | |
| III | | < 1.15 to 1.00 | | 1.50 % | | 2.50 % | | 2.00 % | | 3.00 % | |
As of December 31, 2011, we were in compliance with the covenants under the credit facility and anticipate our compliance will continue throughout 2012.
To improve our operating results, cash flow from operations and liquidity, beginning in the second half of the 2011 we implemented, or were in the process of implementing, a plan to return to profitability which included a number of initiatives:
| · | We exited our dry van service offering allowing us to eliminate losses from unprofitable business and generate approximately $13.6 million from the sale of related equipment which reduced our debt. |
| · | We sold approximately 180 additional tractors that were out of warranty generating $8.6 million in proceeds from the sale and replaced substantially all out of warranty tractors with new tractors obtained under current operating lease agreements. |
| · | With the replacement of these tractors we anticipate we will reduce our average tractor fleet age from 2.8 years in the middle of 2011 to 2.1 years by the end of the first quarter of 2012. This new equipment is projected to reduce our maintenance costs by approximately 2 to 4 cents per mile and improve fuel economy by 5.0%. |
| · | Due to the reduction in drivers related to the dry van services business, we had a reduction in force of non-driving personnel of approximately 12.0% of our non-driving force, resulting in annualized personnel related savings of $5.0 million. |
| · | We began providing water transport services for the crude oil exploration industry ramping up to a fleet of approximately 40 tractor and trailer combinations by early January of 2012 and will increase to approximately 70 tractor-trailer combinations by late 2012. This should result in approximately $40.0 million in revenue. |
| · | We completed the enhancement of our on-board computer systems to provide more exact route guidance which will allow us to reduce our out of route miles and improve our empty percent ratio in our truckload operations. |
| · | We are experiencing improved conditions in our core truckload and LTL service lines and as a result expect to benefit from both volume and rate improvements in 2012. |
| · | We expect insurance and claims expenses to return to pre-2011 levels in 2012, a reduction in expenses of $5 to $7 million. |
| · | We have expanded our FFE Driver Academy and expect it to fulfill the majority of our driver needs in 2012, greatly reducing the impact of the driver shortage on our operations. |
| · | We project, after a loss in our seasonally weakest first quarter of 2012, our results will improve to break-even in the second quarter, followed by profitability in the third and fourth quarters with a near break-even result for the year. |
| · | Due to these results, we should maintain positive cash flow after the first quarter of 2012. The expected debt and availability on the bank credit facility at the end of the first quarter of 2012 should be approximately $21.0 million and approximately $23.0 million respectively. |
During the second half of 2011 and in the normal course of business, the Company chose to enter into various master security agreements and a capital lease agreement as a different option from operating leases to finance the purchase of revenue equipment at more favorable rates. The master security agreements provide for funding structured as promissory notes. The Company entered into these master security agreements to finance $8.5 million of revenue equipment. The effective interest rates on the promissory notes range from 5.5% to 6.4%. The capital lease obligation for approximately $3.0 million of revenue equipment is structured as a 60 month rental agreement with a fixed price purchase option. The effective interest rate on the lease is approximately 6.8%. The capital lease agreement requires us to pay personal property taxes, maintenance and operating expenses. Interest expense related to our notes payable and capital lease obligation for the year ended December 31, 2011 was $189,000. The future payments due under the notes payable and capital lease agreement are shown in Contractual Obligations within this section of Management’s Discussion and Analysis.
Cash Flows
The table below reflects our net cash flows provided by operating activities, net cash flows used in investing activities, net cash flows provided by (used in) financing activities and total outstanding long-term debt for the years indicated.
| | | (in thousands) | |
| | | 2011 | | | 2010 | | | 2009 | |
| Net cash flows (used in) provided by operating activities | | $ | (27,212 | ) | | $ | 3,984 | | | $ | 11,120 | |
| Net cash flows provided by (used in) investing activities | | | 2,018 | | | | (12,672 | ) | | | (8,147 | ) |
| Net cash flows provided by (used in) financing activities | | | 25,039 | | | | 6,224 | | | | (614 | ) |
| Borrowings under credit facility | | | 19,888 | | | | 5,689 | | | | - | |
| Long-term notes payable and capital lease obligations | | | 8,901 | | | | - | | | | - | |
For the year ended December 31, 2011, cash flows used in operating activities primarily consisted of an increase in insurance and claims of $2.4 million, an increase in accounts receivable of $4.6 million and purchases of tires on equipment in use of $4.3 million. We believe our sources of liquidity are adequate to meet our current and anticipated needs. Based upon anticipated cash flows, current borrowing availability and sources of financing we expect to be available to us, we do not anticipate any significant liquidity constraints in the foreseeable future. We estimate that capital expenditures, net of proceeds from dispositions, will range from $3 to $5 million in 2012.
Contractual Obligations
The following is a summary of our contractual obligations as of December 31, 2011:
| | | (in thousands) | |
| Contractual Obligations | | Total | | | 2012 | | | | 2013-2014 | | | | 2015-2016 | | | After 2016 | |
| Letters of credit | | $ | 2,983 | | | $ | 2,629 | | | $ | 354 | | | $ | - | | | $ | - | |
| Borrowings under credit facility | | | 19,888 | | | | - | | | | - | | | | 19,888 | | | | - | |
| Capital lease obligations, including interest | | | 3,522 | | | | 555 | | | | 1,110 | | | | 1,857 | | | | - | |
| Notes payable | | | 9,173 | | | | 2,023 | | | | 3,942 | | | | 3,208 | | | | - | |
| Operating lease obligations | | | | | | | | | | | | | | | | | | | | |
| Rentals | | | 105,273 | | | | 35,095 | | | | 44,056 | | | | 14,056 | | | | 12,066 | |
| Residual guarantees | | | 22,507 | | | | 5,337 | | | | 8,143 | | | | 8,490 | | | | 537 | |
| | | $ | 163,346 | | | $ | 45,639 | | | $ | 57,605 | | | $ | 47,499 | | | $ | 12,603 | |
As of December 31, 2011, we had no purchase obligations which are commitments for equipment replacement.
Off-Balance Sheet Arrangements
As of December 31, 2011, we held 1,260 tractors and 2,354 trailers under operating leases as well as six service centers with 10,000 square feet or more, with varying termination dates ranging from April 2012 through May 2024 and total obligations of $105.0 million. Equipment rental expense for the year ended December 31, 2011, 2010 and 2009 was $36.6 million, $35.8 million and $38.7 million, respectively. In general, the equipment lease renewal terms include month-to-month extensions of the regular lease terms, purchase options at fair market value or an early buy-out option on certain tractor leases. These lease agreements require us to pay personal property taxes, maintenance, and operating expenses. As of December 31, 2011, we maintained $3.0 million in standby letters of credit related to self-insured programs and legal matters. These standby letters of credit allow the Company to self-insure a portion of its insurance exposure.
Inflation and Fuel Costs
Most of our operating expenses are inflation-sensitive, with inflation generally producing increased costs of operations. During the past three years, the most significant effects of inflation have been on revenue equipment prices, accident claims, health insurance, employee compensation, maintenance parts and supplies, and fuel. We attempt to limit the effects of inflation through increases in freight rates, fixed price contracts, and cost control efforts.
In addition to inflation, fluctuations in fuel prices can affect our profitability. We require substantial amounts of fuel to operate our tractors and power the temperature-control units on our trailers. Substantially all of our contracts with customers contain fuel surcharge provisions. Although we historically have been able to pass through most long-term increases in fuel prices and related taxes to our customers in the form of surcharges and higher rates, such increases usually are not fully recovered due to empty miles and refrigeration unit fuel usage. Fuel cost related to the refrigeration units is not generally offset by a fuel surcharge. We do not currently hedge our exposure to fuel prices through financial derivatives.
Seasonality
Our temperature-controlled truckload operations are affected by seasonal changes. The growing seasons for fruits and vegetables in Florida, California and Texas typically create increased demand for trailers equipped to transport cargo requiring refrigeration. Our LTL operations are also impacted by the seasonality of certain commodities. LTL shipment volume during the winter months is normally lower than other months. Shipping volumes of LTL freight are usually highest from July through October. LTL volumes also tend to increase in the weeks before holidays such as Easter, Halloween, Thanksgiving and Christmas when significant volumes of food and candy are transported.
Our tractor productivity generally decreases during the winter season as inclement weather impedes operations and some shippers typically reduce their shipments as there is less need for temperature control during colder months than warmer months. At the same time, operating expenses generally increase with harsh weather creating higher accident frequency, increased claims and more equipment repairs. During extended periods of excessive heat, we may experience higher reefer fuel and repair costs. To the extent that extreme weather patterns increase in severity or frequency due to climate changes, we would expect to see an increase in the effect of inclement or extreme weather patterns. We do not have the ability to forecast these potential changes or the impact of these changes.
Effects of Climate Change and Climate Change Regulation
Greenhouse gas emissions have increasingly become the subject of a large amount of international, national, regional, state and local attention. Cap and trade initiatives to limit greenhouse gas emissions have been introduced in the EU. Similarly, numerous bills related to climate change have been introduced in the U.S. Congress, which could adversely impact all industries. In addition, future regulation of greenhouse gas could occur pursuant to future U.S. treaty obligations, statutory or regulatory changes under the Clean Air Act or new climate change legislation. It is uncertain whether any of these initiatives will be implemented, although, based on published media reports, we believe it is not reasonably likely that the current proposed initiatives will be implemented without substantial modification. If such initiatives are implemented, restrictions, caps, taxes, or other controls on emissions of greenhouse gases, including diesel exhaust, could significantly increase our operating costs. Restrictions on emissions could also affect our customers that use significant amounts of energy or burn fossil fuels in producing or delivering the products we carry including, but not limited to, food producers and distributors. Although significant cost increases, government regulation, and changes of consumer needs or preferences for goods or services relating to alternative sources of energy or emissions reductions or changes in our customers' shipping needs could materially affect the markets for the products we carry, which in turn could have a material adverse effect on our results of operations, financial condition, and liquidity, or, in the alternative, could result in increased demand for our transportation services, we are currently unable to predict the manner or extent of such effect.
Critical Accounting Policies
The preparation of financial statements in conformity with generally accepted accounting principles in the United States of America (“US GAAP”) requires management to make estimates and assumptions about future events and apply judgments that affect the reported amounts of assets, liabilities, revenue and expenses in our consolidated financial statements and related notes. We base our estimates, assumptions and judgments on historical experience, current trends and other factors believed to be relevant at the time our consolidated financial statements are prepared. However, because future events and their effects cannot be determined with certainty, actual results could differ from our estimates and assumptions, and such differences could be material. We believe the following critical accounting policies affect our more significant estimates, assumptions and judgments used in the preparation of our consolidated financial statements.
Accounts Receivable. We are dependent upon contracts with significant customers that generate a large portion of our revenue. Accounts receivable are recorded at the invoiced amounts, net of an allowance for doubtful accounts. A considerable amount of judgment is required in assessing the realization of these receivables including the current creditworthiness of each customer and related aging of the past-due balances, including any billing disputes. In order to assess the collectability of these receivables, we perform ongoing credit evaluations of our customers’ financial condition. Through these evaluations, we may become aware of a situation in which a customer may not be able to meet its financial obligations due to deterioration of its financial viability, credit ratings or bankruptcy. The allowance for doubtful accounts is based on the best information available to us and is reevaluated and adjusted as additional information is received. We evaluate the allowance based on historical write-off experience, the size of the individual customer balances, past-due amounts and the overall state of the economy. We perform ongoing reviews of the adequacy of our allowance for doubtful accounts. Invoice balances past the contractual due date are considered past due per our policy and the customer balances are reviewed for collectability. Account balances are charged off against the allowance after all means of collection have been exhausted and the potential recovery is considered remote.
Revenue Recognition. The Company recognizes revenue and the related direct costs on the date the freight is picked up from the shipper. One of the preferable methods under US GAAP provides the recognition of revenue and direct costs when the shipment is completed. Changing to this method would not have a material impact on the quarterly financial results or operations of the Company.
Property and Equipment. The transportation industry is capital intensive. Our net property and equipment was $57.8 million as of December 31, 2011 and $73.0 million as of December 31, 2010. Our depreciation expense was $17.8 million for the year ended December 31, 2011 which includes $0.2 million related to assets financed under capital leases and $16.3 million for the year ended December 31, 2010. There was no depreciation expense associated with assets financed under capital leases for the year ended December 31, 2010. Depreciation is computed based on the cost of the asset, reduced by its estimated residual value, using the straight-line method for financial reporting purposes. Accelerated methods are used for income tax reporting purposes. Additions and improvements to property and equipment are capitalized at cost. Maintenance and repair expenditures are charged to operations as incurred. Gains and losses on disposals of revenue equipment are included in operations as they are a normal, recurring component of our operations. We have minimal risk to the used equipment market as the majority of our tractors have a pre-arranged trade-in value typically at the end of 42 months, which is utilized as the residual value in computing depreciation expense.
Impairment of Assets. Long-lived assets are reviewed for impairment whenever events or changes in circumstances indicate the carrying amount of an asset may not be recoverable. Recoverability of assets to be held and used is measured by a comparison of the carrying amount of an asset to future net undiscounted cash flows expected to be generated by the asset. If such assets are considered to be impaired, the impairment to be recognized is measured by the amount by which the carrying amount of the assets exceeds the fair value of the assets. Assets to be disposed of are reported at the lower of the carrying amount or fair value less the costs to sell.
Insurance and claims. We are self-insured for a portion of losses relating to workers’ compensation, auto liability, general liability, cargo and property damage claims, along with employees’ health insurance with varying risk retention levels. We maintain insurance coverage for per-incident occurrences and in excess of these risk retention levels in amounts we consider adequate based upon historical experience and our ongoing review. We reserve currently for the estimated cost of the uninsured portion of pending claims. These reserves are periodically evaluated and adjusted based on our evaluation of the nature and severity of outstanding individual claims and an estimate of future claims development based on historical claims development factors. The Company accrues for the anticipated legal and other costs to settle the claims currently. We are responsible for the first $4.0 million on each personal injury and property damage. We have excess coverage from $4.0 million to $75.0 million. Our significant self-insured retention exposes us to the possibility of significant fluctuations in claims expense between periods depending on the frequency, severity and timing of claims and to adverse financial results if we incur large or numerous losses. In the event of an uninsured claim above our insurance coverage, a claim that approaches the maximum self-insured retention level or an increase in the frequency or severity of claims within our self-insured retention, our financial condition and results of operations could be materially and adversely affected.
Income Taxes. Income taxes are accounted for in accordance with US GAAP. The Company records income taxes under the asset and liability method, whereby deferred tax assets and liabilities are recognized based on the future tax consequences attributable to temporary differences between the financial statement carrying amounts of existing assets and liabilities and their respective tax bases and attributable to operating loss and tax credit carryforwards. As part of the process of preparing our consolidated financial statements, we are required to estimate our income taxes in each of the jurisdictions in which we operate. This process involves estimating our current tax exposure together with assessing temporary differences resulting from differing treatment of items for tax and financial reporting purposes. These temporary differences result in deferred tax assets and liabilities, which are included in our accompanying consolidated balance sheets. Deferred tax assets and liabilities are measured using the tax rates enacted by certain tax laws and published guidance expected to apply to taxable income in effect to those years in which the temporary differences are expected to reverse. To the extent it is determined it is more likely than not that our deferred tax assets will be recovered, a valuation allowance must be established for the amount of the deferred tax assets determined not to be realizable. The determination of whether a deferred tax asset is realizable is based on weighing all available evidence, including both positive and negative evidence. We believe that our assumptions and estimates are reasonable, although actual results may have a positive or negative material impact on the balances of deferred tax assets and liabilities, valuation allowances or net income. We will apply judgment to determine the amount of valuation allowance, if any, that would be required in any given period. We will continue to assess whether we will realize all, part, or none of the deferred tax assets. Due to cumulative losses and our operating results for the year ended December 31, 2011, a valuation allowance was determined to be necessary. Therefore, at December 31, 2011, the Company has a valuation allowance of $12.0 million relating to federal deferred tax assets.
Recent Accounting Pronouncements
In June 2011, the FASB issued ASU No. 2011-05, “Comprehensive Income (ASC Topic 220): Presentation of Comprehensive Income” (“ASU 2011-05”), which amends current comprehensive income guidance. This accounting update eliminates the option to present the components of other comprehensive income as part of the statement of shareholders’ equity. Instead, the Company must report comprehensive income in either a single continuous statement of comprehensive income which contains two sections, net income and other comprehensive income, or in two separate but consecutive statements. ASU 2011-05 will be effective for public companies during the interim and annual periods beginning after December 15, 2011 with early adoption permitted. The adoption of ASU 2011-05 will not have a material impact on the Company’s consolidated financial statements as it only requires a change in the format of the current presentation, and we currently have only immaterial amounts of other comprehensive income/loss.
We have reviewed other recently issued accounting pronouncements and determined that they do not have a material impact on our consolidated financial statements.
ITEM 7A. Quantitative and Qualitative Disclosures about Market Risk
We experience various market risks, primarily from commodity prices and interest rates. These risks have not materially changed between fiscal year 2010 and fiscal year 2011.
Commodity Price Risk
Our operations are heavily dependent upon fuel prices. The price and availability can vary and are subject to political, economic and market factors that are beyond our control. Significant increases in diesel fuel costs could materially and adversely affect our results of operations and financial condition; however, historically, we have been able to recover a portion of diesel fuel price increases from customers in the form of fuel surcharges. Fuel prices have fluctuated greatly in recent years. In some periods, our operating performance was affected because we were not able to fully offset the impact of higher diesel fuel prices through increased freight rates and fuel surcharges. We cannot predict the extent to which high fuel price levels will continue in the future or the extent to which fuel surcharges could be collected to offset such increases. We do not currently enter into derivative hedging arrangements that protect us against fuel price increases. Given the volatility in fuel prices and the impact fuel surcharge revenues have on total operating revenue, we often refer to “total operating revenue excluding fuel surcharges” to provide a more consistent basis for comparison of operating revenue without the impact of fluctuating fuel prices. A 5% increase in the net price per gallon would result in increased fuel costs of approximately $4.7 million, the majority of which we anticipate will be offset by fuel surcharges.
Interest Rate Risk
Our market risk is also affected by changes in interest rates. We have historically maintained a combination of fixed rate and variable rate obligations to manage our interest rate exposure. Fixed rates are generally maintained within our lease obligations while variable rates are contained within our credit facility.
We are exposed to interest rate risk primarily from our credit facility. Our credit facility provides for borrowings that bear interest based on LIBOR, plus a certain percentage. At December 31, 2011 there was $19.9 million outstanding under our current credit facility compared to $5.7 million outstanding at the same period of 2010 under our previous credit facility that has since been terminated.
The Company entered into various master security agreements and a capital lease agreement to finance the purchase of revenue equipment at more favorable fixed rates than through off-balance sheet operating leases. We are not exposed to interest rate risk related to these agreements as the interest rates are fixed.
As of December 31, 2011, we held no market-risk-sensitive instruments for trading purposes. For purposes other than trading, we held approximately 70,000 shares of our common stock at a value of $0.6 million in a Rabbi Trust investment. Our consolidated financial statements include the assets and liabilities of the Rabbi Trust established to hold the investments of participants in our 401(k) Wrap Plan and for deferred compensation liabilities under our Executive Bonus and Phantom Stock Plan. Such liabilities are adjusted from time to time to reflect changes in the market price of our common stock. To the extent the trust assets are invested in our stock, our future compensation expense and income will be impacted by fluctuations in the market price of our stock.
ITEM 8. Financial Statements and Supplementary Data
The following documents are filed as part of this Annual Report on Form 10-K:
| Financial Statements | Page |
| Report of Grant Thornton LLP, Independent Registered Public Accounting Firm | 32 |
| Consolidated Balance Sheets as of December 31, 2011 and 2010 | 33 |
| Consolidated Statements of Operations for the three years ended December 31, 2011 | 34 |
| Consolidated Statements of Cash Flows for the three years ended December 31, 2011 | 35 |
| Consolidated Statement of Shareholders' Equity for the three years ended December 31, 2011 | 36 |
| Notes to Consolidated Financial Statements | 37 |
Financial statement schedules are omitted because the required information is not applicable or not present in amounts sufficient to require submission of the schedule or because the required information is included in the consolidated financial statements or the notes thereto.
REPORT OF INDEPENDENT REGISTERED PUBLIC ACCOUNTING FIRM
Board of Directors and Shareholders
Frozen Food Express Industries, Inc.
We have audited the accompanying consolidated balance sheets of Frozen Food Express Industries, Inc. (a Texas corporation) and subsidiaries (the “Company”) as of December 31, 2011 and 2010, and the related consolidated statements of operations, shareholders' equity, and cash flows for each of the three years in the period ended December 31, 2011. These financial statements are the responsibility of the Company's management. Our responsibility is to express an opinion on these financial statements based on our audits.
We conducted our audits in accordance with the standards of the Public Company Accounting Oversight Board (United States). Those standards require that we plan and perform the audit to obtain reasonable assurance about whether the financial statements are free of material misstatement. The Company is not required to have, nor were we engaged to perform an audit of its internal control over financial reporting. Our audit included consideration of internal control over financial reporting as a basis for designing audit procedures that are appropriate in the circumstances, but not for the purpose of expressing an opinion on the effectiveness of the Company’s internal control over financial reporting. Accordingly, we express no such opinion. An audit also includes examining, on a test basis, evidence supporting the amounts and disclosures in the financial statements, assessing the accounting principles used and significant estimates made by management, as well as evaluating the overall financial statement presentation. We believe that our audits provide a reasonable basis for our opinion.
In our opinion, the consolidated financial statements referred to above present fairly, in all material respects, the financial position of Frozen Food Express Industries, Inc. and subsidiaries as of December 31, 2011 and 2010, and the results of their operations and their cash flows for each of the three years in the period ended December 31, 2011 in conformity with accounting principles generally accepted in the United States of America.
/s/ Grant Thornton LLP
Dallas, Texas
March 29, 2012
Frozen Food Express Industries, Inc. and Subsidiaries Consolidated Balance Sheets December 31, (in thousands) | |
| Assets | | 2011 | | | 2010 | |
| Current assets | | | | | | |
| Cash and cash equivalents | | $ | 1,048 | | | $ | 1,203 | |
| Accounts receivable, net | | | 43,450 | | | | 41,921 | |
| Tires on equipment in use, net | | | 5,968 | | | | 5,982 | |
| Deferred income taxes | | | - | | | | 1,150 | |
| Equipment held for sale | | | 3,437 | | | | - | |
| Other current assets | | | 7,868 | | | | 6,575 | |
| Total current assets | | | 61,771 | | | | 56,831 | |
| | | | | | | | | |
| Property and equipment, net | | | 57,757 | | | | 72,993 | |
| Deferred income taxes | | | 1,009 | | | | - | |
| Other assets | | | 5,867 | | | | 5,081 | |
| Total assets | | $ | 126,404 | | | $ | 134,905 | |
| | | | | | | | | |
| Liabilities and Shareholders’ Equity | | | | | | | | |
| Current liabilities | | | | | | | | |
| Accounts payable | | $ | 30,339 | | | $ | 27,443 | |
| Insurance and claims accruals | | | 10,667 | | | | 8,697 | |
| Accrued payroll and deferred compensation | | | 4,047 | | | | 5,032 | |
| Accrued liabilities | | | 1,251 | | | | 709 | |
| Current maturities of notes payable and capital lease obligations | | | 1,936 | | | | - | |
| Deferred income taxes | | | 690 | | | | - | |
| Total current liabilities | | | 48,930 | | | | 41,881 | |
| | | | | | | | | |
| Long-term debt | | | 19,888 | | | | 5,689 | |
| Long-term notes payable and capital lease obligations | | | 8,901 | | | | - | |
| Deferred income taxes | | | - | | | | 3,153 | |
| Insurance and claims accruals | | | 5,783 | | | | 5,373 | |
| Total liabilities | | | 83,502 | | | | 56,096 | |
| | | | | | | | | |
| Shareholders’ equity | | | | | | | | |
| Common stock, $1.50 par value per share; 75,000 shares authorized; | | | | | | | | |
| 18,572 shares issued | | | 27,858 | | | | 27,858 | |
| Additional paid-in capital | | | 427 | | | | 1,353 | |
| Accumulated other comprehensive loss | | | (67 | ) | | | - | |
| Retained earnings | | | 21,572 | | | | 58,242 | |
| Total common shareholders’ equity | | | 49,790 | | | | 87,453 | |
| Treasury stock (980 and 1,146 shares), at cost | | | (6,888 | ) | | | (8,644 | ) |
| Total shareholders’ equity | | | 42,902 | | | | 78,809 | |
| Total liabilities and shareholders’ equity | | $ | 126,404 | | | $ | 134,905 | |
See accompanying notes to consolidated financial statements.
Frozen Food Express Industries, Inc. and Subsidiaries Consolidated Statements of Operations Years ended December 31, (in thousands, except per share amounts) | |
| | | 2011 | | | 2010 | | | 2009 | |
| Total operating revenue | | $ | 388,461 | | | $ | 368,822 | | | $ | 373,051 | |
| Operating expenses | | | | | | | | | | | | |
| Salaries, wages and related expenses | | | 120,834 | | | | 117,134 | | | | 122,141 | |
| Purchased transportation | | | 72,682 | | | | 72,297 | | | | 81,363 | |
| Fuel | | | 93,217 | | | | 71,566 | | | | 62,655 | |
| Supplies and maintenance | | | 56,410 | | | | 47,886 | | | | 47,347 | |
| Revenue equipment rent | | | 36,590 | | | | 35,847 | | | | 38,721 | |
| Depreciation | | | 17,781 | | | | 16,322 | | | | 17,550 | |
| Communications and utilities | | | 4,682 | | | | 4,975 | | | | 5,145 | |
| Claims and insurance | | | 20,553 | | | | 13,017 | | | | 15,305 | |
| Operating taxes and licenses | | | 4,150 | | | | 4,162 | | | | 4,648 | |
| Gain on sale of property and equipment | | | (5,741 | ) | | | (1,103 | ) | | | (136 | ) |
| Miscellaneous | | | 5,540 | | | | 4,389 | | | | 3,225 | |
| Total operating expenses | | | 426,698 | | | | 386,492 | | | | 397,964 | |
| Loss from operations | | | (38,237 | ) | | | (17,670 | ) | | | (24,913 | ) |
| | | | | | | | | | | | | |
| Interest and other (income) expense | | | | | | | | | | | | |
| Interest income | | | - | | | | (32 | ) | | | (6 | ) |
| Interest expense | | | 844 | | | | 470 | | | | 30 | |
| Equity in earnings of limited partnership | | | (914 | ) | | | (816 | ) | | | (739 | ) |
| Life insurance and other | | | 621 | | | | 209 | | | | 697 | |
| Total interest and other (income) expense | | | 551 | | | | (169 | ) | | | (18 | ) |
| Loss before income taxes | | | (38,788 | ) | | | (17,501 | ) | | | (24,895 | ) |
| Income tax benefit | | | (2,118 | ) | | | (5,571 | ) | | | (8,480 | ) |
| Net loss | | $ | (36,670 | ) | | $ | (11,930 | ) | | $ | (16,415 | ) |
| | | | | | | | | | | | | |
| Net loss per share of common stock | | | | | | | | | | | | |
| Basic | | $ | (2.08 | ) | | $ | (0.69 | ) | | $ | (0.96 | ) |
| Diluted | | $ | (2.08 | ) | | $ | (0.69 | ) | | $ | (0.96 | ) |
| Weighted average shares outstanding | | | | | | | | | | | | |
| Basic | | | 17,589 | | | | 17,275 | | | | 17,080 | |
| Diluted | | | 17,589 | | | | 17,275 | | | | 17,080 | |
| Dividends declared per common share | | $ | - | | | $ | - | | | $ | 0.03 | |
See accompanying notes to consolidated financial statements.
Frozen Food Express Industries, Inc. and Subsidiaries Consolidated Statements of Cash Flows Years ended December 31, (in thousands) | |
| | | 2011 | | | 2010 | | | 2009 | |
| Cash flows from operating activities | | | | | | | | | |
| Net loss | | $ | (36,670 | ) | | $ | (11,930 | ) | | $ | (16,415 | ) |
| Non-cash items included in net loss | | | | | | | | | | | | |
| Gain on sale of property and equipment | | | (5,741 | ) | | | (1,103 | ) | | | (136 | ) |
| Depreciation and amortization | | | 22,078 | | | | 20,151 | | | | 22,105 | |
| Provision for losses on accounts receivable | | | 1,081 | | | | 918 | | | | 247 | |
| Deferred income taxes | | | (2,322 | ) | | | (5,474 | ) | | | (4,092 | ) |
| Deferred compensation | | | 316 | | | | 989 | | | | 413 | |
| Investment income | | | (914 | ) | | | (816 | ) | | | (739) | |
| Changes in operating assets and liabilities | | | | | | | | | | | | |
| Accounts receivable | | | (2,610 | ) | | | (1,521 | ) | | | 11,184 | |
| Tires on equipment in use | | | (4,254 | ) | | | (4,004 | ) | | | (3,969 | ) |
| Other current assets | | | (2,510 | ) | | | 6,607 | | | | (1,549 | ) |
| Other assets | | | (1,495 | ) | | | (451 | ) | | | (79 | ) |
| Accounts payable | | | 3,303 | | | | 4,612 | | | | 1,319 | |
| Insurance and claims accruals | | | 2,380 | | | | (3,423 | ) | | | 3,297 | |
| Accrued liabilities, payroll and other | | | 146 | | | | (571 | ) | | | (466 | ) |
| Net cash (used in) provided by operating activities | | | (27,212 | ) | | | 3,984 | | | | 11,120 | |
| | | | | | | | | | | | | |
| Cash flows from investing activities | | | | | | | | | | | | |
| Expenditures for property and equipment | | | (22,118 | ) | | | (20,858 | ) | | | (19,733 | ) |
| Proceeds from sale of property and equipment | | | 22,540 | | | | 7,094 | | | | 10,820 | |
| Cash distributions from investment | | | 1,596 | | | | 1,016 | | | | 860 | |
| Other | | | - | | | | 76 | | | | (94 | ) |
| Net cash provided by (used in) investing activities | | | 2,018 | | | | (12,672 | ) | | | (8,147 | ) |
| | | | | | | | | | | | | |
| Cash flows from financing activities | | | | | | | | | | | | |
| Proceeds from borrowings | | | 118,501 | | | | 51,026 | | | | 37,796 | |
| Repayments of borrowings | | | (104,302 | ) | | | (45,337 | ) | | | (37,796 | ) |
| Proceeds from notes payable and capital lease obligations | | | 11,453 | | | | - | | | | | - |
| Repayments of notes payable and capital lease obligations | | | (616 | ) | | | - | | | | | - |
| Dividends paid | | | - | | | | - | | | | (516 | ) |
| Income tax benefit (expense) of stock options and restricted stock | | | 33 | | | | (60 | ) | | | (33 | ) |
| Proceeds from capital stock transactions | | | 22 | | | | 671 | | | | 96 | |
| Purchases of treasury stock | | | (52 | ) | | | (76 | ) | | | (161) | |
| Net cash provided by (used in) financing activities | | | 25,039 | | | | 6,224 | | | | (614 | ) |
| Net (decrease) increase in cash and cash equivalents | | | (155 | ) | | | (2,464 | ) | | | 2,359 | |
| Cash and cash equivalents at beginning of year | | | 1,203 | | | | 3,667 | | | | 1,308 | |
| Cash and cash equivalents at end of year | | $ | 1,048 | | | $ | 1,203 | | | $ | 3,667 | |
| | | | | | | | | | | | | |
| Supplemental disclosure of cash flow information: | | | | | | | | | | | | |
| Interest paid | | $ | 552 | | | $ | 58 | | | $ | 29 | |
| Stock options | | $ | 582 | | | $ | - | | | $ | - | |
See accompanying notes to consolidated financial statements.
Frozen Food Express Industries, Inc. and Subsidiaries Consolidated Statements of Shareholders' Equity Three years ended December 31, 2011 (in thousands) | |
| | | Common Stock | | | Additional | | | | | | | | | | | | | |
| | | Shares | | | Par | | | Paid-in | | | Retained | | | Accumulated other | | | Treasury Stock | | | | |
| | | Issued | | | Value | | | Capital | | | Earnings | | | Comprehensive loss | | | Shares | | | Cost | | | Total | |
| January 1, 2009 | | | 18,572 | | | $ | 27,858 | | | $ | 5,412 | | | $ | 87,103 | | | $ | - | | | | 1,813 | | | $ | (13,922 | ) | | $ | 106,451 | |
| Net loss | | | - | | | | - | | | | - | | | | (16,415 | ) | | | - | | | | - | | | | - | | | | (16,415 | ) |
| Treasury stock reacquired | | | - | | | | - | | | | - | | | | - | | | | - | | | | 39 | | | | (161 | ) | | | (161 | ) |
| Retirement plans | | | - | | | | - | | | | (15 | ) | | | - | | | | - | | | | 4 | | | | (25 | ) | | | (40 | ) |
| Exercise of stock options | | | - | | | | - | | | | (171 | ) | | | - | | | | - | | | | (35 | ) | | | 267 | | | | 96 | |
| Restricted stock | | | - | | | | - | | | | (2,270 | ) | | | - | | | | - | | | | (344 | ) | | | 2,623 | | | | 353 | |
| Dividends | | | - | | | | - | | | | - | | | | (516 | ) | | | - | | | | - | | | | - | | | | (516 | ) |
| Tax expense of stock options | | | | | | | | | | | (33 | ) | | | - | | | | | | | | - | | | | - | | | | (33 | ) |
| December 31, 2009 | | | 18,572 | | | | 27,858 | | | | 2,923 | | | | 70,172 | | | | - | | | | 1,477 | | | | (11,218 | ) | | | 89,735 | |
| Net loss | | | - | | | | - | | | | - | | | | (11,930 | ) | | | - | | | | - | | | | - | | | | (11,930 | ) |
| Treasury stock reacquired | | | - | | | | - | | | | - | | | | - | | | | - | | | | 21 | | | | (76 | ) | | | (76 | ) |
| Retirement plans | | | - | | | | - | | | | (12 | ) | | | - | | | | - | | | | (1 | ) | | | 4 | | | | (8 | ) |
| Exercise of stock options | | | - | | | | - | | | | (1,146 | ) | | | - | | | | - | | | | (241 | ) | | | 1,817 | | | | 671 | |
| Restricted stock | | | - | | | | - | | | | (352 | ) | | | - | | | | - | | | | (110 | ) | | | 829 | | | | 477 | |
| Tax expense of stock options | | | - | | | | - | | | | (60 | ) | | | - | | | | - | | | | - | | | | - | | | | (60 | ) |
| December 31, 2010 | | | 18,572 | | | | 27,858 | | | | 1,353 | | | | 58,242 | | | | - | | | | 1,146 | | | | (8,644 | ) | | | 78,809 | |
| Net loss | | | - | | | | - | | | | - | | | | (36,670 | ) | | | - | | | | - | | | | - | | | | (36,670 | ) |
| Treasury stock reacquired | | | - | | | | - | | | | - | | | | - | | | | - | | | | 168 | | | | (634 | ) | | | (634 | ) |
| Retirement plans | | | - | | | | - | | | | (62 | ) | �� | | - | | | | (67 | ) | | | (14 | ) | | | 104 | | | | (25 | ) |
| Exercise of stock options | | | - | | | | - | | | | (1,362 | ) | | | - | | | | - | | | | (278 | ) | | | 1,966 | | | | 604 | |
| Restricted stock | | | - | | | | - | | | | 465 | | | | - | | | | - | | | | (42 | ) | | | 320 | | | | 785 | |
| Tax benefit of stock options | | | - | | | | - | | | | 33 | | | | - | | | | - | | | | - | | | | - | | | | 33 | |
| December 31, 2011 | | | 18,572 | | | $ | 27,858 | | | $ | 427 | | | $ | 21,572 | | | $ | (67 | ) | | | 980 | | | $ | (6,888 | ) | | $ | 42,902 | |
See accompanying notes to consolidated financial statements.
Frozen Food Express Industries, Inc. and Subsidiaries Notes to Consolidated Financial Statements
1. Summary of Significant Accounting Policies
Nature of business: Frozen Food Express Industries, Inc. is one of the leading temperature-controlled truckload and less-than-truckload carriers in the United States with core operations in the transport of temperature-controlled products and perishable goods, which include food, health care and confectionary products. The Company operates in one business segment, motor carrier operations qualified by the aggregation criteria under US GAAP Accounting Standards Codification (“ASC”) 280, Segment Reporting. Truckload, LTL and dedicated services are offered utilizing similar equipment under similar economic characteristics and servicing similar type of customers. The Company also provides brokerage logistics services to our customers including a new water transportation service that was not material as a percentage of total operating revenue in 2011.
Principles of consolidation: The accompanying consolidated financial statements include Frozen Food Express Industries, Inc., a Texas corporation, and our subsidiary companies, all of which are wholly-owned (collectively, the “Company”). Intercompany balances and transactions have been eliminated in consolidation.
Cash equivalents: The Company considers all highly liquid investments with a maturity of three months or less at the time of purchase to be cash equivalents. The carrying amount reported on the consolidated balance sheets approximate fair value. The Company’s cash and cash equivalents at commercial banking institutions normally exceed federally insured limits.
Accounts receivable: Accounts receivable are recorded at the invoiced amounts, net of an allowance for doubtful accounts. A considerable amount of judgment is required in assessing the realization of these receivables, including the current credit worthiness of each customer and related aging of the past-due balances, including any billing disputes. In order to assess the collectability of these receivables, we perform ongoing credit evaluations of our customers’ financial condition. Through these evaluations, we may become aware of a situation in which a customer may not be able to meet its financial obligations due to deterioration of its financial viability, credit ratings or bankruptcy. The allowance for doubtful accounts is based on the best information available to us and is reevaluated and adjusted as additional information is received. We evaluate the allowance based on historical write-off experience, the size of the individual customer balances, past-due amounts and the overall national economy. We perform ongoing reviews of the adequacy of our allowance for doubtful accounts. Invoice balances outstanding past the contractual due date are considered past due per our policy and the customer balances are reviewed for collectability. Account balances are charged off against the allowance after all means of collection have been exhausted and the potential recovery is considered remote.
Tires on equipment in use, net: The Company capitalizes the original cost of tires purchased with vehicles and replacement tires as a current asset. Amortization is calculated on a per-mile basis, less an estimated residual value. Amortization of tires, which was $4.3 million, $3.6 million and $3.8 million in 2011, 2010 and 2009, respectively, is included in the consolidated statements of cash flows as depreciation and amortization. It is computed on a per-mile basis based upon the expected life of the tires. The number of miles over which a tire is amortized depends on a variety of factors, including but not limited to the type of tire involved (recap or original tread) and the position of the tire (steering, tractor drive, axle or trailer). Steering tires tend to be shorter-lived (75,000 to 100,000 miles) than does original tread drive-axle (100,000 to 150,000 miles) or original tread trailer tires (125,000 to 150,000 miles). Recaps generally have a service life of about two-thirds as many miles as the similarly-positioned original tread tires. For safety reasons, we do not utilize recaps as steering tires.
Property and equipment, net: Additions and improvements to property and equipment are capitalized at cost. Maintenance and repair expenditures are charged to operations as incurred. Gains and losses on disposals of revenue equipment are included in operations as they are a normal, recurring component of our operations. Depreciation is computed based on the cost of the asset, reduced by its estimated residual value, using the straight-line method for financial reporting purposes. Accelerated methods are used for income tax reporting purposes. Following is a summary of estimated useful lives utilized for the majority of our property and equipment for financial reporting purposes:
| | | | Years | | |
| | Revenue equipment | | 6-10 | | |
| | Buildings and improvements | | 10-39 | | |
| | Service equipment | | 5-15 | | |
| | Computers, software and related equipment | | 3-5 | | |
Frozen Food Express Industries, Inc. and Subsidiaries
Notes to Consolidated Financial Statements (continued)
Our typical replacement cycles are 42 months for tractors and 84 months for refrigerated trailers, with an estimated residual value. The residual values for the majority of the tractors are based upon an estimated trade-in value of the equipment with the original vendor. We periodically evaluate whether the remaining useful lives of our long-lived assets may require revision or whether the remaining unamortized balance is recoverable. When factors indicate an asset should be evaluated for possible impairment, we use an estimate of the asset's projected undiscounted cash flow in evaluating whether an impairment exists. If an impairment exists, the asset is written down to net realizable value.
Insurance and claims accruals: We are self-insured for a portion of losses relating to workers’ compensation, auto liability, general liability, cargo and property damage claims, along with employees’ health insurance with varying risk retention levels. We maintain insurance coverage for per-incident and in excess of these risk retention levels in amounts we consider adequate based upon historical experience and our ongoing review. We are responsible for the first $4.0 million on each personal injury and property damage. We have excess coverage from $4.0 million to $75.0 million. We reserve currently for the estimated cost of the uninsured portion of pending claims. These reserves are periodically evaluated and adjusted based on our evaluation of the nature and severity of outstanding individual claims and an estimate of how those claims will ultimately develop based upon historical claims development factors. The reserves also include an estimate for claims incurred but not reported. We accrue for the anticipated legal and other costs to settle the claims. Under agreements with our insurance carriers and regulatory authorities, we had $3.0 million at December 31, 2011, and currently have $5.2 million as of March 26, 2012, in standby letters of credit to guarantee settlement of claims.
Income Taxes. Income taxes are accounted for in accordance with US GAAP. The Company records income taxes under the asset and liability method, whereby deferred tax assets and liabilities are recognized based on the future tax consequences attributable to temporary differences between the financial statement carrying amounts of existing assets and liabilities and their respective tax bases and attributable to operating loss and tax credit carryforwards. As part of the process of preparing our consolidated financial statements, we are required to estimate our income taxes in each of the jurisdictions in which we operate. This process involves estimating our current tax exposure together with assessing temporary differences resulting from differing treatment of items for tax and financial reporting purposes. These temporary differences result in deferred tax assets and liabilities, which are included in our accompanying consolidated balance sheets. Deferred tax assets and liabilities are measured using the tax rates enacted by certain tax laws and published guidance expected to apply to taxable income in effect to those years in which the temporary differences are expected to reverse. To the extent it is determined it is more likely than not that our deferred tax assets will be recovered, a valuation allowance must be established for the amount of the deferred tax assets determined not to be realizable. The determination of whether a deferred tax asset is realizable is based on weighing all available evidence, including both positive and negative evidence. We believe that our assumptions and estimates are reasonable, although actual results may have a positive or negative material impact on the balances of deferred tax assets and liabilities, valuation allowances or net income. We will apply judgment to determine the amount of valuation allowance, if any, that would be required in any given period. We will continue to assess whether we will realize all, part, or none of the deferred tax assets. Due to cumulative losses and our operating results for the year ended December 31, 2011, a valuation allowance was determined to be necessary. Therefore, at December 31, 2011, the Company has a valuation allowance of $12.0 million relating to federal deferred tax assets.
Revenue recognition: Revenue and associated direct operating expenses are recognized on the date freight is picked up from the shipper. One of the preferable methods outlined in accounting principles generally accepted in the United States of America (“US GAAP”) provides for the recognition of revenue and direct costs when the shipment is completed. Changing to this method would not have a material impact on the quarterly or annual financial statements.
We are the sole obligor with respect to the performance of our freight services provided by independent contractors or through our brokerage business and we assume all related credit risk. Accordingly, our revenue and the related direct expenses are recognized on a gross basis on the date the freight is picked up from the shipper. Revenue from equipment rental is recognized ratably over the term of the associated rental agreements.
Net loss per common share: Net loss per common share is computed by dividing net income or loss by the weighted average number of common shares outstanding during the quarter or year. Diluted earnings per common share is computed by dividing net income by the sum of the weighted average number of common shares outstanding plus all additional common shares that would have been outstanding if potentially dilutive common shares related to stock options and other dilutive securities had been issued using the treasury stock method.
Use of estimates: The preparation of financial statements in conformity with US GAAP requires management to make estimates and assumptions that affect the reported amounts of assets, liabilities, revenues and expenses and the disclosure of contingent assets and liabilities in the consolidated financial statements. A significant degree of judgment is required in the estimates related to the collectability of accounts receivable, impairment of assets and reserves for risk-related items such as workers’ injury claims, auto liability, general liability, cargo and property damage claims and employees’ health insurance. Ultimate results could differ from those estimates.
Frozen Food Express Industries, Inc. and Subsidiaries
Notes to Consolidated Financial Statements (continued)
2. Accounts receivable, net
Accounts receivable are shown net of an allowance for doubtful accounts that we anticipate will not be paid by our customers. A summary of the allowance activity for the years ended December 31 is as follows:
| | | (in thousands) | |
| | | 2011 | | | 2010 | | | 2009 | |
| Balance at beginning of year | | $ | 2,152 | | | $ | 1,943 | | | $ | 2,646 | |
| Provision for losses | | | 1,081 | | | | 918 | | | | 247 | |
| Write-offs, net of recoveries | | | (589 | ) | | | (709 | ) | | | (950 | ) |
| Balance at end of year | | $ | 2,644 | | | $ | 2,152 | | | $ | 1,943 | |
3. Equipment held for sale
Revenue equipment categorized as equipment held for sale on the Consolidated Balance Sheet at December 31, 2011 totaled $3.4 million. Equipment held for sale is no longer subject to depreciation, and are recorded at the lower of depreciated carrying value or fair market value less selling costs. We expect to sell these assets by the end of the first quarter in 2012.
4. Other current assets
Other current assets consist primarily of prepayments of items such as taxes and licenses, insurance and prepaid rent. It also includes inventories and other amounts owed to the Company. As of December 31, other current assets consist of the following:
| | | (in thousands) | |
| | | 2011 | | | 2010 | |
| Due from equipment sales | | $ | 2,197 | | | $ | 921 | |
| Income tax receivable | | | 514 | | | | 441 | |
| Other prepaid taxes | | | 1,240 | | | | 1,239 | |
| Prepaid insurance | | | 913 | | | | 914 | |
| Prepaid rent | | | 327 | | | | 407 | |
| Prepaid licenses and permits | | | 1,543 | | | | 1,443 | |
| Inventory and other | | | 1,134 | | | | 1,210 | |
| Other current assets | | $ | 7,868 | | | $ | 6,575 | |
5. Property and equipment, net
Property and equipment, net are shown at historical cost and as of December 31, consist of the following:
| | | (in thousands) | |
| | | 2011 | | | 2010 | |
| Land | | $ | 3,495 | | | $ | 3,602 | |
| Buildings and improvements | | | 21,286 | | | | 21,109 | |
| Revenue equipment | | | 67,704 | | | | 87,104 | |
| Service equipment | | | 27,456 | | | | 25,339 | |
| Computers, software and related equipment | | | 28,524 | | | | 28,165 | |
| Work in progress | | | 355 | | | | 274 | |
| | | | 148,820 | | | | 165,593 | |
| Less accumulated depreciation | | | (91,063 | ) | | | (92,600 | ) |
| Property and equipment, net | | $ | 57,757 | | | $ | 72,993 | |
Frozen Food Express Industries, Inc. and Subsidiaries
Notes to Consolidated Financial Statements (continued)
Included in revenue equipment is $3.0 million of property and equipment recorded as assets financed under capital leases. Amortization of assets financed under capital leases was recorded under depreciation expense on the Consolidated Statement of Operations. For the year ended December 31, 2011, $0.2 million was included in depreciation expense related to these assets financed under capital leases. There was no depreciation expense for assets financed under capital leases in prior years presented in our financial statements. 6. Long-term debt
Long-term debt consisted of the following:
| | | (in thousands) | |
| | | December 31, 2011 | | | December 31, 2010 | |
| Borrowings under credit facility | | $ | 19,888 | | | $ | 5,689 | |
| Notes payable | | | 7,989 | | | | - | |
| Capitalized lease obligations | | | 2,848 | | | | - | |
| Total long-term debt | | | 30,725 | | | | 5,689 | |
| Less: Current maturities | | | (1,936 | ) | | | - | |
| Total maturities due after one year | | $ | 28,789 | | | $ | 5,689 | |
As of December 31, 2011, the Company had a secured committed credit facility with an aggregate availability of $50.0 million that matures in March 2015. At December 31, 2011, borrowing base availability under the credit facility was $46.8 million, $19.9 million was borrowed and $3.0 million of standby letters of credit, which are used primarily for our self-insurance programs and legal matters, were issued. This reduced the availability under our credit facility to $23.9 million As of December 31, 2011 loans outstanding under the credit facility were categorized as either LIBOR loans, which had an interest rate of 2.5%, or bank base rate loans which had an interest rate of 4.5%. Interest expense on the Credit Facility for the year ended December 31, 2011, 2010 and 2009 was $577,000, $58,000 and $30,000, respectively.
The obligations under the credit facility are guaranteed by our parent company and certain named subsidiaries and secured by a pledge of substantially all of our assets. The obligations shall bear interest (i) if a Base Rate Loan (as defined in the credit facility), at the Base Rate (as defined in the credit facility) in effect from time to time, plus the Applicable Margin (as defined in the credit facility); (ii) if a LIBOR loan, at LIBOR for the applicable interest period, plus the Applicable Margin; and (iii) if any other obligation (including, to the extent permitted by law, interest not paid when due), at the Base Rate in effect from time to time, plus the Applicable Margin for Base Rate Revolver Loans (as defined in the credit facility). Interest shall accrue from the date the loan is advanced or the obligation is incurred or payable, until paid by the borrowers. If a loan is repaid on the same day made, one day's interest shall accrue. We are obligated to comply with certain covenants under the credit facility. These covenants provide various guidelines and/or restrictions related to inspections, financial information, notices, insurance, subsidiaries, permitted debt and permitted liens. The credit facility calls for the Applicable Margin to be determined by the fixed charge ratio for the end of the quarter prior to the current quarter as defined in the Loan and Security Agreement. This provision was effective in the fourth quarter of 2011 as the margins remained at Level II until September 30, 2011, per the credit facility; however, the Applicable Margin priced under Level III did not have a material impact on our financial statements. As of December 31, 2011, we were in compliance with the covenants under the credit facility and anticipate our compliance will continue throughout 2012.
During the second half of 2011 and in the normal course of business, the Company chose to enter into various master security agreements and a capital lease agreement to finance the purchase of revenue equipment at more favorable rates than through off-balance sheet operating losses. The master security agreements provide for funding structured as promissory notes. The Company entered into these master security agreements to finance the purchase of $8.5 million of revenue equipment. The effective interest rates on the promissory notes range from 5.5% to 6.4%. The capital lease obligation for approximately $3.0 million of revenue equipment is structured as a 60 month rental agreement with a fixed price purchase option. The effective interest rate on the lease is approximately 6.8%. The capital lease agreement requires us to pay personal property taxes, maintenance, and operating expenses. Interest expense related to our notes payable and capital lease obligation for the year ended December 31, 2011 was $189,000.
Frozen Food Express Industries, Inc. and Subsidiaries
Notes to Consolidated Financial Statements (continued)
7. Income Taxes
The components of the income tax benefit for the years ended December 31, consist of the following:
| | | (in thousands) | |
| Current: | | 2011 | | | 2010 | | | 2009 | |
| Federal | | $ | - | | | $ | 158 | | | $ | (4,494 | ) |
| State | | | 204 | | | | 247 | | | | 106 | |
| Deferred: | | | | | | | | | | | | |
| Federal | | | (1,249 | ) | | | (5,545 | ) | | | (3,130 | ) |
| State | | | (1,073 | ) | | | (431 | ) | | | (962 | ) |
| Total expense | | $ | (2,118 | ) | | $ | (5,571 | ) | | $ | (8,480 | ) |
State income tax is presented net of the related federal tax benefit or provision.
A reconciliation between the statutory tax rate and the effective tax rate for the years ended December 31, is as follows:
| | | (in thousands) | |
| | | 2011 | | | 2010 | | | 2009 | |
| Income tax (benefit) expense at statutory federal rate | | $ | (13,576 | ) | | $ | (6,125 | ) | | $ | (8,713 | ) |
| Federal income tax effects of: | | | | | | | | | | | | |
| Non-deductible driver per-diem payments | | | 438 | | | | 752 | | | | 916 | |
| Non-taxable life insurance transactions | | | (75 | ) | | | (10 | ) | | | 195 | |
| State income taxes and other | | | (907 | ) | | | (188 | ) | | | (878 | ) |
| Valuation allowance | | | 12,002 | | | | - | | | | - | |
| Total benefit expense | | $ | (2,118 | ) | | $ | (5,571 | | | $ | (8,480 | ) |
| Effective tax rate benefit | | | (5.5 | )% | | | (31.8 | )% | | | (34.1 | )% |
For 2011, our effective tax benefit was 5.5%, as compared to 31.8% in 2010, and 34.1% in 2009. Our effective tax rate differs from federal and state statutory rates because of taxable and non-taxable components of our pre-tax income. Non-deductible items consist primarily of certain expenses incurred by our employee-drivers in the course of their duties. We believe that our assumptions and estimates are reasonable, although actual results may have a positive or negative material impact on the balances of deferred tax assets and liabilities, valuation allowances or net income. We will apply judgment to determine the amount of valuation allowance, if any, that would be required in any given period. We will continue to assess whether we will realize all, part, or none of the deferred tax assets. Due to cumulative losses and our operating results for the year ended December 31, 2011, a valuation allowance was determined to be necessary. At December 31, 2011, the Company has a valuation allowance of $12.0 million relating to federal deferred tax assets. The remaining net deferred tax assets relate to indefinite lived credits and credits that are being utilized on an annual basis. As of December 31, 2011 and 2010, our deferred tax assets and liabilities consisted of the following:
| | | (in thousands) | |
| Deferred tax assets: | | 2011 | | | 2010 | |
| Insurance claims accruals | | $ | 6,096 | | | $ | 5,546 | |
| Allowance for bad debts | | | 1,016 | | | | 860 | |
| Capital lease obligations | | | 1,033 | | | | - | |
| Deferred compensation | | | 388 | | | | 564 | |
| Federal and state net operating loss carryforwards | | | 15,399 | | | | 6,590 | |
| Other | | | 1,350 | | | | 1,452 | |
| Gross deferred tax assets | | | 25,282 | | | | 15,012 | |
| Valuation allowance | | | (12,002 | ) | | | - | |
| Total deferred tax assets | | | 13,280 | | | | 15,012 | |
| | | | | | | | | |
| Deferred tax liabilities: | | | | | | | | |
| Capital lease obligations | | | (1,034 | ) | | | - | |
| Depreciation | | | (8,687 | ) | | | (13,899 | ) |
| Prepaid expenses | | | (3,240 | ) | | | (3,116 | ) |
| Total deferred tax liabilities | | | (12,961 | ) | | | (17,015 | ) |
| Net deferred tax assets (liabilities) | | $ | 319 | | | $ | (2,003 | ) |
Frozen Food Express Industries, Inc. and Subsidiaries
Notes to Consolidated Financial Statements (continued)
Tax refunds were $79 thousand, $4.8 million and $0.8 million for 2011, 2010 and 2009, respectively. Taxes paid were $236,000, $397,000, and $296,000 in 2011, 2010, and 2009, respectively. Federal gross operating loss carryforwards of $35.6 million will begin to expire in 2028.
We generated significant taxable income and paid significant federal income taxes during 2004 and 2005. The U.S. Worker, Homeownership, and Business Assistance Act of 2009 allowed us to “carryback” our 2009 net operating loss to offset the taxes we incurred and paid for these years.
The Company recognizes tax benefits associated with the exercise of stock options directly to stockholders’ equity only when realized. Accordingly, deferred tax assets are not recognized for net operating loss carry-forwards resulting from windfall tax benefits. A windfall tax benefit occurs when the actual tax benefit realized upon an employee’s disposition of a share-based award exceeds the cumulative book compensation charge associated with the award. At December 31, 2011, windfall tax benefits included in net operating loss carry-forwards but not reflected in deferred tax assets are $12,000.
Under US GAAP for accounting for uncertainty in income taxes, the Company has analyzed filing positions in its federal tax returns for all open years. The open periods subject to examination for its federal returns are 2008, 2009 and 2010. The Company also files tax returns in numerous state jurisdictions with varying statutes of limitations. The Company’s policy is to recognize interest related to unrecognized tax benefits and penalties as other miscellaneous expenses.
8. Loss per common share
Basic and diluted loss per common share was computed as follows:
| | | (in thousands, except per share amounts) | |
| | | 2011 | | | 2010 | | | 2009 | |
| Numerator: | | | | | | | | | |
| Net loss | | $ | (36,670 | ) | | $ | (11,930 | ) | | $ | (16,415 | ) |
| | | | | | | | | | | | | |
| Denominator: | | | | | | | | | | | | |
| Basic – weighted-average shares | | | 17,589 | | | | 17,275 | | | | 17,080 | |
| Effect of dilutive stock options | | | - | | | | - | | | | - | |
| Diluted – weighted-average shares | | | 17,589 | | | | 17,275 | | | | 17,080 | |
| | | | | | | | | | | | | |
| Basic loss per common share | | $ | (2.08 | ) | | $ | (0.69 | ) | | $ | (0.96 | ) |
| Diluted loss per common share | | $ | (2.08 | ) | | $ | (0.69 | ) | | $ | (0.96 | ) |
Options totaling 431,000, 549,000 and 581,000 shares were outstanding but were not included in the calculation of diluted earnings per share for 2011, 2010 and 2009, respectively, as their exercise prices were greater than the average market price of the common shares. The Company excluded all common stock equivalents in 2011, 2010, and 2009 as their effect was anti-dilutive due to the net loss.
Frozen Food Express Industries, Inc. and Subsidiaries
Notes to Consolidated Financial Statements (continued)
9. Employee benefits
Stock Incentive Plans – Under our 2005 Stock Incentive Plan (the “2005 Plan”), our employees may be awarded stock options, restricted stock units, performance share awards, and stock appreciation rights. Stock options issued to employees expire within 10 years after the date of grant, and the exercise price must be at least the par value of the Company’s stock or the fair market value of the stock on the date of grant. The Company did not issue any stock options in 2011, 2010 and 2009. During 2011, 2010 and 2009, the Company received $22,000, $645,000 and $3,000 for stock options exercised, respectively. There were no stock options settled for cash in 2011. During 2009, the Company settled stock options for $47,000.
Restricted stock awards are grants of the Company’s stock to eligible individuals including non-employee directors for which the vesting period ranges from three to five years. Shares are awarded upon the non-employee director’s initial appointment or election to the Board. Upon the reelection of any non-employee director to the Board, such individual shall be eligible to receive an award of restricted stock under this plan. During 2011, 2010 and 2009, the Company issued restricted stock awards to employees of approximately 84,000, 100,000, and 369,000 with a value of $320,000, $310,000 and $1,330,000, respectively. During 2011, 2010 and 2009, the Company issued 53,000, 28,000 and 18,000 shares with a market value of $196,000, $102,000 and $79,000, respectively. The fair market value of the shares granted was based on the market closing price on grant date and is recognized in the consolidated statements of operations as the awards vest. Stock units and performance share awards are the grant of a right to receive shares of the Company’s stock in the future, which is contingent on the achievement of performance or other objectives. No stock units or performance share awards are outstanding at the end of 2011. Stock appreciation rights allow the individual to receive the difference between the fair market value of the Company’s stock at time of exercise and the fair market value of the Company’s stock on the date of grant. There are no outstanding stock appreciation rights at the end of 2011, 2010, and 2009.
The following table summarizes information regarding stock options for the years ended December 31:
| | | (in thousands, except price and periodic amounts) | |
| | | 2011 | | | 2010 | | | 2009 | |
| Options outstanding at beginning of year | | | 897 | | | | 1,172 | | | | 1,310 | |
| Exercised | | | (278 | ) | | | (241 | ) | | | (35 | ) |
| Forfeited | | | (171 | ) | | | (34 | ) | | | (103 | ) |
| Options outstanding at end of year | | | 448 | | | | 897 | | | | 1,172 | |
| Year-end weighted average remaining life of options (years) | | | 3.0 | | | | 4.3 | | | | 3.5 | |
| Options available for future grants | | | 575 | | | | 406 | | | | 375 | |
| Weighted average price of options: | | | | | | | | | | | | |
| Exercised during year | | $ | 2.17 | | | $ | 2.79 | | | $ | 2.75 | |
| Forfeited during year | | $ | 9.16 | | | $ | 8.07 | | | $ | 8.39 | |
| Outstanding at end of year | | $ | 7.98 | | | $ | 6.40 | | | $ | 5.71 | |
| Exercisable at end of year | | $ | 8.01 | | | $ | 6.41 | | | $ | 5.72 | |
| | | | | | | | | | | | | |
| Intrinsic value - options outstanding at end of year | | $ | - | | | $ | 423 | | | $ | 547 | |
| Intrinsic value - options exercisable at end of year | | $ | - | | | $ | 420 | | | $ | 544 | |
As of December 31, 2011, substantially all of our options were exercisable. The range of prices and certain other information about our stock options as of December 31, 2011 is presented in the following table: | | | Options Priced Between | |
| | | $ | 1.50- $5.00 | | | $ | 5.01- $8.00 | | | $ | 8.01- $12.00 | | | Total | |
| Number of options outstanding (in thousands) | | | 100 | | | | 87 | | | | 261 | | | 448 | |
| Weighted average remaining contractual life (years) | | | 1.2 | | | | 2.3 | | | | 3.9 | | | 3.0 | |
| Weighted average exercise price | | $ | 2.27 | | | $ | 6.66 | | | $ | 10.60 | | $ | 7.98 | |
Frozen Food Express Industries, Inc. and Subsidiaries
Notes to Consolidated Financial Statements (continued)
The following table summarizes information regarding restricted stock shares for the years ended December 31:
| | | (in thousands, except shares and value per share) | |
| Restricted Stock | | 2011 | | | 2010 | | | 2009 | |
| Outstanding shares at beginning of year | | | 375,681 | | | | 374,348 | | | | 72,918 | |
| Issued | | | 137,001 | | | | 127,640 | | | | 386,532 | |
| Forfeited | | | (14,800 | ) | | | (17,834 | ) | | | (42,371 | ) |
| Vested | | | (129,686 | ) | | | (108,473 | ) | | | (42,731 | ) |
| Outstanding shares at end of year | | | 368,196 | | | | 375,681 | | | | 374,348 | |
| | | | | | | | | | | | | |
| Fair market value of restricted stock | | | | | | | | | | | | |
| Outstanding at beginning of year | | $ | 1,330 | | | $ | 1,468 | | | $ | 603 | |
| Issued | | | 525 | | | | 412 | | | | 1,409 | |
| Forfeited | | | (53 | ) | | | (73 | ) | | | (191 | ) |
| Vested | | | (474 | ) | | | (477 | ) | | | (353 | ) |
| Outstanding at end of year | | $ | 1,328 | | | $ | 1,330 | | | $ | 1,468 | |
| | | | | | | | | | | | | |
| Weighted average value per share | | | | | | | | | | | | |
| Outstanding at beginning of year | | $ | 3.54 | | | $ | 3.93 | | | $ | 8.28 | |
| Issued | | $ | 3.83 | | | $ | 3.23 | | | $ | 3.65 | |
| Forfeited | | $ | 3.56 | | | $ | 4.10 | | | $ | 4.51 | |
| Vested | | $ | 3.65 | | | $ | 4.40 | | | $ | 8.26 | |
| Outstanding at end of year | | $ | 3.61 | | | $ | 3.54 | | | $ | 3.93 | |
The compensation expense associated with the vesting of restricted stock is accounted for as deferred compensation and expensed ratably over the three to five year vesting period of each grant. Total share-based compensation expense was $470,000, $444,000, and $538,000 in 2011, 2010 and 2009, respectively. As of December 31, 2011, the Company had approximately $1.0 million of unrecognized compensation expense related to restricted stock awards, which is probable to be recognized over a weighted average period of approximately thirty-four months.
Supplemental Employee Retirement Plan (“SERP”) – The Company also has a SERP for the benefit of certain "highly compensated" personnel (as determined in accordance with the Employee Retirement Income Security Act of 1974). The SERP's investment income, assets and liabilities, which are contained in a Rabbi Trust, are included in the accompanying consolidated financial statements. As of December 31, 2011, the SERP liability was $597,000 and there were approximately 70,000 shares in the trust. Consistent with US GAAP for accounting for deferred compensation arrangements where amounts earned are held in a Rabbi Trust and invested, the shares of the common stock held in a Rabbi Trust are accounted for as treasury stock until SERP participants elect to liquidate the stock. During 2011, SERP participants purchased 35,000 shares with a value of $100,000 and liquidated 49,000 shares with a value of $142,000 from the Rabbi Trust.
Savings Plan – Participants are able to contribute up to the limit set by law, which in 2011 was $16,500 for participants less than age 50 and $22,000 for participants age 50 and above. The Company may contribute 25% of each participant’s contribution up to a total of 4% of their contribution. Our contribution vests over six years. The Company has not made any contributions to the plan since April 6, 2009, and has not made any stock contributions in 2011, 2010 or 2009.
Rights Agreement – We have in place a rights agreement that authorizes a distribution to our shareholders of one common stock purchase right for each outstanding share of our common stock. The rights agents under the rights agreement was changed in 2010 to the Registrar and Transfer Company. Rights become exercisable if certain events, generally relating to a change of control, occur. Rights initially have an exercise price of $11.00. If such events occur, the rights will be exercisable for a number of shares having a market value equal to two times the exercise price of the rights. We may redeem the rights for $0.001 each. The rights were extended in 2010 until 2013. The rights agreement is subject to review every three years by an independent committee of our Board of Directors.
Frozen Food Express Industries, Inc. and Subsidiaries
Notes to Consolidated Financial Statements (continued)
10. Commitments and contingencies
The Company has revenue equipment leases expiring at various dates through July 2017 and various properties under non-cancelable agreements expiring through May 2024. The aggregate future minimum rentals under non-cancelable operating leases at December 31, 2011 were as follows:
| | | | (in thousands) | |
| | Year Due | | Amount Due | |
| | 2012 | | $ | 35,095 | |
| | 2013 | | | 26,315 | |
| | 2014 | | | 17,741 | |
| | 2015 | | | 9,182 | |
| | 2016 | | | 4,874 | |
| | Thereafter | | | 12,066 | |
| | Total Due | | $ | 105,273 | |
Rent expense for revenue equipment and various properties for 2011, 2010 and 2009 was $39.4 million, $37.9 million and $40.4 million, respectively. As of December 31, 2011, we had partially guaranteed the residual value of certain leased tractors totaling $22.5 million pursuant to leases with remaining lease terms that range from five months to 37 months. Our estimates of the fair market values and our pre-arranged trade-in values based upon future purchases of such tractors exceed the guaranteed values. Consequently, no provision has been made for any losses related to such guarantees. In general, the equipment lease renewal terms include month-to-month extensions of the regular lease terms, purchase options at fair market value or an early buy-out option on certain tractor leases. These lease agreements require us to pay personal property taxes, maintenance, and operating expenses.
The Company is involved in legal actions that arise in the ordinary course of business. Although the outcomes of any such legal actions cannot be predicted, in the opinion of management, the resolution of any currently pending or threatened actions will not have a material adverse effect upon our financial position or results of operations.
The Company accrues for costs related to public liability, cargo, employee health insurance and work-related injury claims. When a loss occurs, we record a reserve for the estimated outcome. As additional information becomes available, adjustments are made. Accrued claims liabilities include all such reserves and our estimate for incidents that have been incurred but not reported.
11. Related Party Transactions
The Company purchases trailers and trailer refrigeration units that are used in our operations from W&B Service Company, L.P. (“W&B”), an entity in which we own a 19.9% equity interest. The Company accounts for that investment under the equity method of accounting. As of December 31, 2011 and 2010, our equity investment in W&B was $1.2 million and $1.9 million, respectively, which is included in "Other Assets" in the accompanying consolidated condensed balance sheets.
For the year ended December 31, 2011, 2010 and 2009, our equity in the earnings of W&B was $0.9 million, $0.8 million and $0.7 million, respectively. Cash distributions to us from W&B’s earnings were $1.6 million, $1.0 million and $0.9 million for the same period in 2011, 2010, and 2009, respectively.
During the twelve month periods ended December 31, 2011, 2010, and 2009, our purchases from W&B for trailers and refrigeration units were $23.1 million, $19.5 million and $5.4 million, respectively. The Company also utilizes W&B to provide routine maintenance and warranty repair of trailers and refrigeration units. During the year ended December 31, 2011, 2010 and 2009, W&B invoiced the Company $1.3 million, $1.6 million and $1.6 million, respectively, for maintenance and repair services, accessories and parts. As of December 31, 2011 and 2010, we had $0.3 million and $1.4 million, respectively, payable to W&B included in our accounts payable balance on the Consolidated Balance Sheets.
Frozen Food Express Industries, Inc. and Subsidiaries
Notes to Consolidated Financial Statements (continued)
12. Recent Accounting Pronouncements
In June 2011, the FASB issued ASU No. 2011-05, “Comprehensive Income (ASC Topic 220): Presentation of Comprehensive Income” (“ASU 2011-05”), which amends current comprehensive income guidance. This accounting update eliminates the option to present the components of other comprehensive income as part of the statement of shareholders’ equity. Instead, the Company must report comprehensive income in either a single continuous statement of comprehensive income which contains two sections, net income and other comprehensive income, or in two separate but consecutive statements. ASU 2011-05 will be effective for public companies during the interim and annual periods beginning after December 15, 2011 with early adoption permitted. The adoption of ASU 2011-05 will not have a material impact on the Company’s consolidated financial statements as it only requires a change in the format of the current presentation, and we currently have only immaterial amounts of other comprehensive loss.
We have reviewed other recently issued accounting pronouncements and determined that they do not have a material impact on our consolidated financial statements.
13. Quarterly Financial Data (unaudited)
The following is a summary of the quarterly results of operations for 2011 and 2010:
| | | (in thousands except per-share amounts) | |
| 2011 | | Year | | | First Quarter | | | Second Quarter | | | Third Quarter | | | Fourth Quarter | |
| Total operating revenue | | $ | 388,461 | | | $ | 92,107 | | | $ | 101,329 | | | $ | 102,834 | | | $ | 92,191 | |
| Loss from operations | | | (38,237 | ) | | | (8,782 | ) | | | (3,767 | ) | | | (13,477 | ) | | | (12,211 | ) |
| Net loss | | | (36,670 | ) | | | (7,937 | ) | | | (3,305 | ) | | | (13,668 | ) | | | (11,760 | ) |
| Net loss per share of common stock | | | | | | | | | | | | | | | | | | | | |
| Basic | | $ | (2.08 | ) | | $ | (0.45 | ) | | $ | (0.19 | ) | | $ | (0.77 | ) | | $ | (0.67 | ) |
| Diluted | | $ | (2.08 | ) | | $ | (0.45 | ) | | $ | (0.19 | ) | | $ | (0.77 | ) | | $ | (0.67 | ) |
| | | | | | | | | | | | | | | | |
| 2010 | | Year | | | First Quarter | | | Second Quarter | | | Third Quarter | | | Fourth Quarter | |
| Total operating revenue | | $ | 368,822 | | | $ | 85,842 | | | $ | 94,957 | | | $ | 93,870 | | | $ | 94,153 | |
| Loss from operations | | | (17,670 | ) | | | (5,562 | ) | | | (3,328 | ) | | | (6,863 | ) | | | (1,917 | ) |
| Net loss | | | (11,930 | ) | | | (3,723 | ) | | | (4,427 | ) | | | (2,281 | ) | | | (1,499 | ) |
| Net loss per share of common stock | | | | | | | | | | | | | | | | | | | | |
| Basic | | $ | (0.69 | ) | | $ | (0.22 | ) | | $ | (0.26 | ) | | $ | (0.13 | ) | | $ | (0.09 | ) |
| Diluted | | $ | (0.69 | ) | | $ | (0.22 | ) | | $ | (0.26 | ) | | $ | (0.13 | ) | | $ | (0.09 | ) |
Net loss per share of common stock is computed independently for each quarter presented and is based on the average number of common and equivalent shares for the quarter. The sum of the quarterly net loss per share of common stock for a year may not equal the total for the year due to rounding differences.
ITEM 9. Changes in and Disagreements with Accountants on Accounting and Financial Disclosure
None.
ITEM 9A. Controls and Procedures
As of the end of the period covered by this report, an evaluation was performed under the supervision and with the participation of our management, including our Chief Executive Officer and Chief Financial Officer of the effectiveness of the design and operation of our disclosure controls and procedures. Based on that evaluation, our management, including our Chief Executive Officer and our Chief Financial Officer concluded that our disclosure controls and procedures were effective as of December 31, 2011. There were no significant changes in our internal control over financial reporting that occurred during the period covered by this report that have materially affected, or that are reasonably likely to materially affect, our internal control over financial reporting.
Management’s Annual Report on Internal Control over Financial Reporting
Management is responsible for establishing and maintaining an adequate system of internal control over financial reporting as defined in Rules 13a-15(f) and 15d-15(f) under the Securities Exchange Act of 1934, as amended, for Frozen Food Express Industries, Inc. and subsidiaries (the “Company”). This system is designed to provide reasonable assurance regarding the reliability of financial reporting and the preparation of financial statements for external purposes in accordance with U.S. generally accepted accounting principles.
The Company’s internal control over financial reporting includes those policies and procedures that (i) pertain to the maintenance of records that, in reasonable detail, accurately and fairly reflect the transactions and dispositions of the assets of the Company; (ii) provide reasonable assurance that transactions are recorded as necessary to permit preparation of financial statements in accordance with generally accepted accounting principles, and that receipts and expenditures of the Company are being made only in accordance with authorizations of management and directors of the Company; and (iii) provide reasonable assurance regarding prevention or timely detection of unauthorized acquisition, use, or disposition of the Company’s assets that could have a material effect on the financial statements.
Because of its inherent limitations, internal control over financial reporting may not prevent or detect misstatements and even when determined to be effective, can only provide reasonable assurance with respect to financial statement preparation and presentation. Also, projection of any evaluation of the effectiveness of internal control over financial reporting to future periods is subject to the risk that controls may become inadequate because of changes in conditions, or that the degree of compliance with the policies or procedures may deteriorate.
Management, with the participation of the Company’s Chief Executive Officer and Chief Financial Officer, evaluated the effectiveness of the Company’s internal control over financial reporting as of December 31, 2011. In making this evaluation, management used the criteria set forth by the Committee of Sponsoring Organizations of the Treadway Commission (COSO) in Internal Control — Integrated Framework. Based on this assessment, management concluded that the Company’s internal control over financial reporting was effective as of December 31, 2011.
March 29, 2012
ITEM 9B. Other Information
None.
ITEM 10. Directors and Executive Officers and Corporate Governance
A. Directors of the Registrant.
The information in the “Outstanding Capital Stock; Principal Shareholders” and “Election of Directors” sections of our proxy statement for the annual meeting of stockholders to be held on May 16, 2012 is incorporated herein by reference.
B. Executive Officers of the Registrant.
The information in the “Election of Directors” section of our proxy statement for the annual meeting of stockholders to be held on May 16, 2012 is incorporated herein by reference.
C. Compliance with Section 16(a) of the Exchange Act.
The information in the “Section 16(a) Beneficial Ownership Reporting Compliance” section of our proxy statement for the annual meeting of stockholders to be held on May 16, 2012 is incorporated herein by reference.
D. Procedure for Director Nominations by Security Holders.
There have been no material changes to the procedures by which security holders may recommend nominees to our board of directors.
E. Audit Committee Financial Expert.
The information in the “Corporate Governance-Audit Committee” section of our proxy statement for the annual meeting of stockholders to be held on May 16, 2012 is incorporated herein by reference.
F. Identification of the Audit Committee.
The information in the “Corporate Governance-Audit Committee” section of our proxy statement for the annual meeting of stockholders to be held on May 16, 2012 is incorporated herein by reference.
G. Code of Business Conduct and Ethics for Senior Financial Management.
Our Code of Business Conduct and Ethics for Senior Financial Management applies to all of our executive officers, including our principal executive officer, principal financial officer and controller, and meets the requirements of the Securities and Exchange Commission. We have posted our Code of Business Conduct and Ethics for Senior Financial Management on our website at www.ffeinc.com. We intend to disclose any amendments to and any waivers from a provision of our Code of Business Conduct and Ethics for Senior Financial Management on our website within five business days following such amendment or waiver.
ITEM 11. Executive Compensation
The information in the “Report of Compensation Committee of the Board of Directors” and “Executive Compensation” sections of our proxy statement for the annual meeting of stockholders to be held on May 16, 2012 is incorporated herein by reference.
ITEM 12. Security Ownership of Certain Beneficial Owners and Management and Related Stockholder Matters
The information in the “Outstanding Capital Stock” and “Executive Compensation” sections of our proxy statement for the annual meeting of stockholders to be held on May 16, 2012 is incorporated herein by reference.
ITEM 13. Certain Relationships and Related Transactions, and Director Independence
The information in the “Corporate Governance” and “Transactions with Management and Directors” sections of our proxy statement for the annual meeting of stockholders to be held on May 16, 2012 is incorporated herein by reference.
ITEM 14. Principal Accountant Fees and Services
The information in the “Audit and Non-Audit Fees” section of our proxy statement for the annual meeting of stockholders to be held on May 16, 2012 is incorporated herein by reference.
ITEM 15. Exhibits and Financial Statement Schedules
(a) 1. Financial Statements, Financial Statement Schedules and Exhibits:
| | | Page |
| | Report of Independent Registered Public Accounting Firm | 32 |
| | Consolidated Balance Sheets as of December 31, 2011 and 2010 | 33 |
| | Consolidated Statements of Operations for the three years ended December 31, 2011 | 34 |
| | Consolidated Statements of Cash Flows for the three years ended December 31, 2011 | 35 |
| | Consolidated Statement of Shareholders' Equity for the three years ended December 31, 2011 | 36 |
| | Notes to Consolidated Financial Statements | 37 |
| | Management’s Annual Report on Internal Control Over Financial Reporting | 47 |
2. Financial Statement Schedules
Financial statement schedules have been omitted since the required information is not applicable or not present in amounts sufficient to require submission of the schedule or because the required information is included in our consolidated financial statements or the notes thereto.
3. Exhibits
The Exhibits filed with this report are listed in the Exhibit Index, which is a separate section of this report, and incorporated in this Item 15(a) by reference.
SIGNATURES
Pursuant to the requirements of Section 13 or 15(d) of the Securities Exchange Act of 1934, Frozen Food Express Industries, Inc., the registrant, has duly caused this report to be signed on our behalf by the undersigned, thereunto duly authorized.
| FROZEN FOOD EXPRESS INDUSTRIES, INC. |
| | | |
| | | |
| Date: March 29, 2012 | /s/ | S. Russell Stubbs |
| | | S. Russell Stubbs President and Chief Executive Officer (Principal Executive Officer) |
| | | |
| Date: March 29, 2012 | /s/ | John McManama |
| | | John McManama Senior Vice President and Chief Financial Officer (Principal Financial and Accounting Officer) |
Pursuant to the requirements of the Securities Exchange Act of 1934, this Report has been signed below by the following persons on behalf of the Registrant and in the capacities and on the dates indicated.
FROZEN FOOD EXPRESS INDUSTRIES, INC. |
| | | |
| Date: March 29, 2012 | /s/ | S. Russell Stubbs |
| | | S. Russell Stubbs President and Chief Executive Officer (Principal Executive Officer) |
| | | |
| Date: March 29, 2012 | /s/ | John McManama |
| | | John McManama Senior Vice President and Chief Financial Officer (Principal Financial and Accounting Officer) |
| | | |
| Date: March 29, 2012 | /s/ | John Hickerson |
| | | John Hickerson Executive Vice President, Chief Operating Officer and Director |
| | | |
| Date: March 29, 2012 | /s/ | Stoney M. Stubbs, Jr. |
| | | Stoney M. Stubbs, Jr. Chairman of the Board and Director |
| | | |
| Date: March 29, 2012 | /s/ | Jerry T. Armstrong |
| | | Jerry T. Armstrong, Director |
| | | |
| Date: March 29, 2012 | /s/ | W. Mike Baggett |
| | | W. Mike Baggett, Director |
| | | |
| Date: March 29, 2012 | /s/ | Brian R. Blackmarr |
| | | Brian R. Blackmarr, Director |
| | | |
| Date: March 29, 2012 | /s/ | Barrett D. Clark |
| | | Barrett D. Clark, Director |
| | | |
| Date: March 29, 2012 | /s/ | Kevin Kilpatrick |
| | | Kevin Kilpatrick, Director |
| | | |
| Date: March 29, 2012 | /s/ | T. Michael O’Connor |
| | | T. Michael O’Connor, Director |
INDEX OF EXHIBITS
| 3.1 | Restated Articles of Incorporation of Frozen Food Express Industries, Inc. (filed as Exhibit 3(i) to Registrant Current Report on Form 8-K filed on May 29, 2007 and incorporated herein by reference). |
| 3.2 | Amended and Restated Bylaws of the Registrant, as amended (filed as Exhibit 99.1 to Registrant's Current Report on Form 8-K filed on March 3, 2011 and incorporated herein by reference). |
| 4.1 | Rights Agreement dated as of June 14, 2000, between the Registrant and Fleet National Bank, which includes as exhibits, the form of the Rights Certificate and the Summary of Rights (filed as Exhibit 4.1 to Registrant's Form 8-A Registration Statement filed on June 19, 2000 and incorporated herein by reference). |
| 4.1(a) | First Amendment to the Rights Agreement dated as of June 14, 2000, between the Registrant and Fleet National Bank (filed as Exhibit 4.1(a) to Registrant’s Annual Report on Form 10-K for the fiscal year ended December 31, 2009 and incorporated herein by reference). |
| 4.1(b) | Second Amendment to the Rights Agreement dated as of April 14, 2010, between the Registrant and Registrar and Transfer Company (filed as Exhibit 4.3 to Registrant’s Amendment No. 1 to Form 8-A filed on April 15, 2010 and incorporated herein by reference). |
| 10.1 | Frozen Food Express Industries, Inc. 1995 Non-Employee Director Stock Plan (filed as Exhibit 4.3 to Registrant's Registration Statement #033-59465 as filed with the Commission and incorporated herein by reference). |
| 10.1 (a) | First Amendment to Frozen Food Express Industries, Inc. 1995 Non-Employee Director Stock Plan (filed as Exhibit 10.1 (a) to Registrant's Annual Report on Form 10-K for the year ended December 31, 2004 and incorporated herein by reference). |
| 10.1 (b) | Second Amendment to Frozen Food Express Industries, Inc. 1995 Non-Employee Director Stock Plan (filed as Exhibit 10.1 (b) to Registrant's Annual Report on Form 10-K for the year ended December 31, 2004 and incorporated herein by reference). |
| 10.1 (c) | Form of Stock Option Agreement for use in connection with the Frozen Food Express Industries, Inc. Non-Employee Director Stock Plan (filed as Exhibit 10.1 (d) to Registrant's Annual Report on Form 10-K for the year ended December 31, 2004 and incorporated herein by reference). |
| 10.2* | Frozen Food Express Industries, Inc., 1992 Incentive and Non-statutory Stock Option Plan (filed as Exhibit 4.3 to Registrant’s Registration Statement #33-48494 as filed with the Commission and incorporated herein by reference). |
| 10.2 (a)* | Amendment No. 1 to Frozen Food Express Industries, Inc. 1992 Incentive and Non-statutory Stock Option Plan (filed as Exhibit 4.4 to Registrant’s Registration Statement #333-38133 and incorporated herein by reference). |
| 10.2 (b)* | Amendment No. 2 to Frozen Food Express Industries, Inc. 1992 Incentive and Stock Option Plan (filed as Exhibit 4.5 to Registrant’s Registration Statement #333-38133 and incorporated herein by reference). |
| 10.2 (c)* | Amendment No. 3 to Frozen Food Express Industries, Inc. 1992 Incentive and Non-statutory Stock Option Plan (filed as Exhibit 4.6 to Registrant’s Registration Statement #333-87913 and incorporated herein by reference). |
| 10.2 (d)* | Form of Stock Option Agreement for use in connection with the Frozen Food Express Industries, Inc. 1992 Incentive and Stock Option Plan (filed as Exhibit 10.3 (d) to Registrant’s Annual Report on Form 10-K for the year ended December 31, 2004 and incorporated herein by reference). |
| 10.3* | FFE Transportation Services, Inc. 1994 Incentive Bonus Plan, as amended (filed as Exhibit 10.6 to Registrant’s Annual Report on Form 10-K for the fiscal year ended December 31, 1994 and incorporated herein by reference). |
| 10.4* | FFE Transportation Services, Inc. 1999 Executive Bonus and Phantom Stock Plan (filed as Exhibit 10.8 to Registrant’s Annual Report on Form 10-K for the fiscal year ended December 31, 1999 and incorporated herein by reference). |
| 10.5* | Frozen Food Express Industries, Inc. 401(k) Savings Plan (filed as Exhibit 10.1 to Registrant’s Current Report on Form 8-K filed on May 17, 2007 and incorporated herein by reference). |
| 10.5 (a)* | First Amendment to Frozen Food Express Industries, Inc. 401(k) Savings Plan (filed as Exhibit 10.1 to Registrant’s Current Report on Form 8-K filed on September 18, 2007 and incorporated herein by reference). |
| 10.5 (b)* | Second Amendment to Frozen Food Express Industries, Inc. 401(k) Savings Plan (filed as Exhibit 10.2 to Registrant’s Current Report on Form 8-K filed on March 4, 2008 and incorporated herein by reference). |
| 10.5 (c)* | Third Amendment to Frozen Food Express Industries, Inc. 401(k) Savings Plan (filed as Exhibit 10.2 to Registrant’s Current Report on Form 8-K filed on March 3, 2009 and incorporated herein by reference). |
| 10.5 (d)* | Fourth Amendment to Frozen Food Express Industries, Inc. 401(k) Savings Plan (filed as Exhibit 10.5 (d) herewith). |
| 10.6* | Frozen Food Express Industries, Inc. Employee Stock Option Plan (filed as Exhibit 4.1 to Registrant’s Registration Statement #333-21831 as filed with the Commission and incorporated herein by reference). |
| 10.6 (a)* | Amendment to the Frozen Food Express Industries, Inc. Employee Stock Option Plan (filed as Exhibit 4.4 to Registrant’s Registration Statement #333-52701 and incorporated by reference). |
| FFE Transportation Services, Inc Restated Wrap Plan (Effective January 1, 2008) (filed as Exhibit 10.1 to Registrant’s Current Report on Form 8-K filed with the Commission on December 24, 2008 and incorporated herein by reference). |
| 10.8* | Form of Amended and Restated Change in Control Agreement (filed as Exhibit 10.1 to Registrant’s Current Report on Form 8-K filed with the Commission on August 11, 2006 and incorporated herein by reference). |
| 10.9* | Frozen Food Express Industries, Inc. 2002 Incentive and Non-statutory Stock Option Plan (filed as Exhibit 10.15 to Registrant’s Annual Report on Form 10-K for the fiscal year ended December 31, 2002 and incorporated herein by reference). |
| 10.9 (a)* | First Amendment to Frozen Food Express Industries, Inc. 2002 Incentive and Non-Statutory Stock Option Plan (filed as exhibit 4.2 to Registrant’s Registration statement #333-120568 and incorporated herein by reference). |
| 10.9 (b)* | Form of Stock Option Agreement used in connection with the Frozen Food Express Industries, Inc. 2002 Incentive and Non-Statutory Stock Option Plan (filed as Exhibit 10.10 (b) to Registrant’s Annual Report on Form 10-K for the year ended December 31, 2004 and incorporated herein by reference). |
| 10.10* | Split Dollar Agreement between Registrant and Stoney Russell Stubbs, as Trustee of the Stubbs Irrevocable 1995 Trust (filed as Exhibit 10.11 to Registrant’s Annual Report on Form 10-K for the year ended December 31, 2004 and incorporated herein by reference). |
| 10.10 (a)* | First Amendment to Split Dollar Agreement between Registrant and Stoney Russell Stubbs, as Trustee of the Stubbs Irrevocable 1995 Trust (filed as Exhibit 10.11 (a) to Registrant’s Annual Report on Form 10-K for the year ended December 31, 2004 and incorporated herein by reference). |
| 10.11* | Amended and Restated Frozen Food Express Industries, Inc. 2005 Non-Employee Director Restricted Stock Plan (filed as Exhibit 10.1 to Registrant’s Current Report on Form 8-K on November 20, 2008, and incorporated herein by reference). |
| 10.11 (a)* | Form of Restricted Stock Agreement for use with Frozen Food Express Industries, Inc. Non-Employee Director Restricted Stock Plan (filed as Exhibit 10.2 (a) to Registrant’s Quarterly Report on Form 10-Q for the period ended June 30, 2005 and incorporated herein by reference). |
| 10.11 (b)* | FFE Transportation Services, Inc. Amended 2005 Executive Bonus and Restricted Stock Plan (filed as Exhibit 10.3 to Registrant’s Current Report on Form 8-K filed March 3, 2009 and incorporated herein by reference). |
| 10.12 (a)* | FFE Transportation Services, Inc. Amended 2005 Executive Bonus Plan, dated as of January 1, 2005, as amended as of July 1, 2010 (filed as Exhibit 10.2 to Registrant’s Current Report on Form 8-K filed with the Commission on August 20, 2010 and incorporated herein by reference). |
| 10.13* | Amended and Restated Frozen Food Express Industries, Inc. 2005 Stock Incentive Plan (filed as Exhibit 10.3 to Registrant’s Quarterly Report on Form 10-Q for the period ended June 30, 2009 and incorporated herein by reference). |
| 10.13 (a)* | Form of Incentive Stock Option Agreement for use with the Frozen Food Express Industries, Inc. 2005 Stock Incentive Plan (filed as Exhibit 10.5 to Registrant’s Quarterly Report on Form 10-Q for the period ended June 30, 2005 and incorporated herein by reference). |
| 10.13 (b)* | Form of Performance Based Restricted Stock Award for use with the Frozen Food Express Industries, Inc. Amended and Restated 2005 Stock Incentive Plan (filed as Exhibit 10.1 to Registrant’s Current Report on Form 8-K filed with the Commission on August 20, 2010 and incorporated herein by reference). |
| 10.14* | Form of Key Employee Supplemental Medical Plan (filed as Exhibit 10.16 to Registrant’s Annual Report on Form 10-K for the period ended December 31, 2005 and incorporated herein by reference). |
| 10.15* | FFE Transportation Services, Inc. Management Phantom Stock Plan (filed as Exhibit 10.1 to Registrant's Current Report on Form 8-K filed February 22, 2006 and incorporated herein by reference). |
| 10.16* | Summary of compensation arrangements with Stoney M. Stubbs, Jr. (filed as Exhibit 10.17 Registrant’s Annual Report on Form 10-K for the period ended December 31, 2009 and incorporated herein by reference). |
| 10.17* | Summary of compensation arrangements with S. Russell Stubbs, effective January 1, 2009 (filed as Item 5.02 to Registrant's Current Report on Form 8-K filed on January 15, 2010 and incorporated herein by reference). |
| 10.18* | Summary of compensation arrangements with John R. McManama, effective November 9, 2009 (filed as Item 5.02 to Registrant's Current Report on Form 8-K filed on November 9, 2009 and incorporated herein by reference). |
| 10.19* | Summary of compensation arrangements with Timothy L. Stubbs effective January 25, 2010 (filed as Exhibit 10.20 Registrant’s Annual Report on Form 10-K for the period ended December 31, 2009 and incorporated herein by reference). |
| 10.20* | Summary of compensation arrangements of certain named executive officers as of March 30, 2011 (filed as Exhibit 10.201 herewith). |
| 10.21* | Summary of compensation arrangements with John T. Hickerson, effective January 1, 2009 (filed as Item 5.02 to Registrant's Current Report on Form 8-K filed on January 15, 2010 and incorporated herein by reference). |
| 10.22 | Credit Agreement among Bank of America, N.A. as Administrative Agent, Collateral Agent and Issuing Bank and FFE Transportation Services, Inc., as borrower, and certain of its affiliates dated as of March 28, 2011 (filed as Exhibit 10.24 Registrant’s Annual Report on Form 10-K for the period ended December 31, 2010 and incorporated herein by reference). |
| 11.1 | Computation of basic and diluted net income or loss per share of common stock (incorporated by reference to Footnote 7 to the financial statements appearing as Item 8 of this Form 10-K). |
| 14.1 | Frozen Food Express Industries, Inc. Code of Business Conduct and Ethics (filed as Exhibit 14.1 to Registrant's Current Report on Form 8-K filed on November 20, 2009 and incorporated herein by reference). |
| 14.2 | Frozen Food Express Industries, Inc. Nominating and Corporate Governance Committee Charter (filed as Exhibit 14.2 to Registrant’s Current Report on Form 8-K filed on March 3, 2009 and incorporated herein by reference). |
14.3 | Frozen Food Express Industries, Inc. Policy Regarding Related Party Transactions (filed as Exhibit 14.2 to Registrant's Current Report on Form 8-K filed on November 20, 2009 and incorporated herein by reference). |
| 21.1 | Subsidiaries of Frozen Food Express Industries, Inc. (filed herewith). |
| 23.1 | Consent of Independent Registered Public Accounting Firm (filed herewith). |
| 31.1 | Certification of Chief Executive Officer Required by Rule 13a-14(a) (17 CFR 240.13a-14(a)) (filed herewith). |
| 31.2 | Certification of Chief Financial Officer Required by Rule 13a-14(a) (17 CFR 240.13a-14(a)) (filed herewith). |
| 32.1 | Certifications of Chief Executive Officer and Chief Financial Officer Pursuant to 18 U.S.C. Section 1350, as Adopted Pursuant to Section 906 of the Sarbanes-Oxley Act of 2002 (filed herewith). |
*Executive Compensation plans and arrangements required to be filed as an Exhibit to this Form 10-K