Independent Bank Corporation
1st Quarter 2008 Earnings Conference Call — April 25, 2008

Overview of 1st Quarter 2008 Results
Michael M. Magee, President and Chief Executive Officer

2
Safe Harbor Statement
This presentation may contain certain forward-looking statements within the meaning of the Private Securities Litigation Reform Act of 1995. Forward-looking statements include expressions such as “expects,” “intends,” “believes” and “should” which are necessarily statements of belief as to expected outcomes of future events. Actual results could materially differ from those contained in, or implied by such statements. Independent Bank Corporation undertakes no obligation to release revisions to these forward-looking statements or reflect events or circumstances after the date of this presentation.

3
Financial Overview
| 1Q08 | 4Q07 | 1Q07 |
|---|
|
| Income from continuing | | | | | | | | | | | |
| operations (millions) | | | | $0.3 | | | $2.3 | | | $3.9 | |
| | | |
| EPS - continuing operations | | | | $0.01 | | | $0.10 | | | $0.17 | |
| | | |
| ROA - continuing operations | | | | 0.04% | | | 0.28% | | | 0.48% | |
| | | |
| ROE - continuing operations | | | | 0.56% | | | 3.68% | | | 6.08% | |
| | | |
| Total assets (billions) at | | |
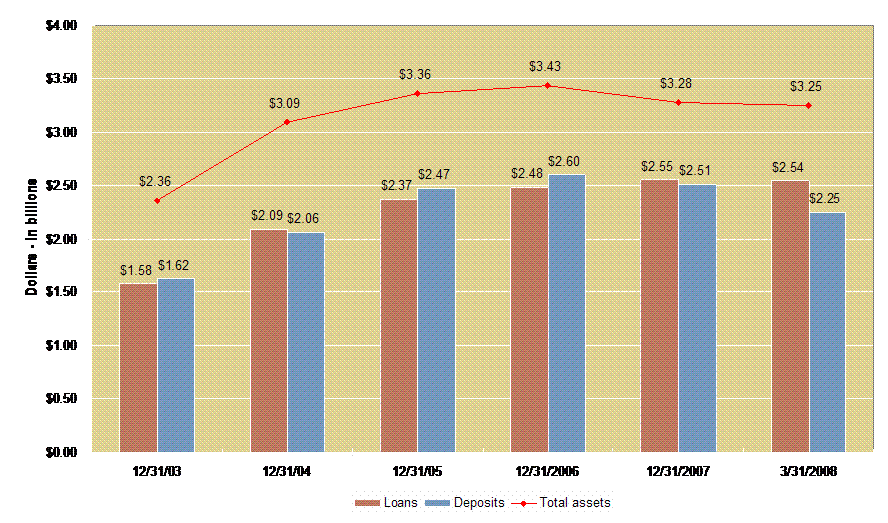
| period end | | | | $3.25 | | | $3.28 | | | $3.36 | |
| | | |
| Stockholders' equity | | |
| (millions) at period end | | | | $238.5 | | | $240.5 | | | $251.8 | |
| | | |
| Common shares | | |
| outstanding (millions) | | |
| at period end | | | | 23.02 | | | 22.65 | | | 22.58 | |

4
1Q:08 — High-Level Overview
| | – | Continued to build a brand presence in existing markets |
| | – | Efforts to improve credit quality remain a top priority – focused on loan monitoring + portfolio management function + resolution of non-performing assets |
| • | Operational Achievements |
| | – | Maintained profitability despite elevated credit costs |
| | – | Continued growth in several categories of non-interest income |
| | – | Michigan economy remains weak; tough competitive environment |
| | – | Decline in commercial + residential real estate value |
| | – | Asset quality and related increase in non-performing loans resulting in an elevated provision for loan losses and higher loan and collection expenses |

5
Economic Headwinds Persist
| • | U.S. economy on the precipice of consumer-led recession ? |
| | – | Household wealth declines in 4Q07 - first time since 2002 |
| | – | Housing starts at 1991-low; residential real estate prices yet to trough; residential inventories remain high |
| | – | A record 6% of borrowers are behind on their mortgage and for the first time ever, nearly nine million households have mortgage debt greater than the value of their home |
| | – | Record-level crude oil and skyrocketing food prices continue to impact consumer balance sheets |
| • | Michigan economy remains one of the weakest in U.S. |
| | – | Decline of manufacturing industry, particularly in SE Michigan |
| | – | Job growth remains stagnant |
| | – | Depreciation of both commercial and residential property values |
| | – | Unfavorable business taxes and stringent labor laws |
• |
Impact on the regional banking industry.Slowing loan growth, weaker credit quality, increased credit costs; net interest margin pressure |

6
Outlook for 2008
| • | Strategic Initiatives – remain focused on our strengths as a leading community bank |
| | – | Review business lines and locations based on performance and return on allocated capital |
| | – | Continued focus on utilizing technology to drive process improvements and greater efficiency |
| | – | Enhanced customer retention initiatives |
| | – | Continued investment in training and professional development |
| • | General Business Outlook |
| | – | Sluggish loan growth, elevated levels of non-performing assets, and loan and collection costs continue to challenge the bottom line |
| | – | Still optimistic that current adverse credit cycle in RE development begins to abate by mid-year leading to lower credit costs |

7
1st Quarter 2008 Financial Review
Robert N. Shuster, Executive Vice President and CFO

8
1st Quarter 2008 Recap
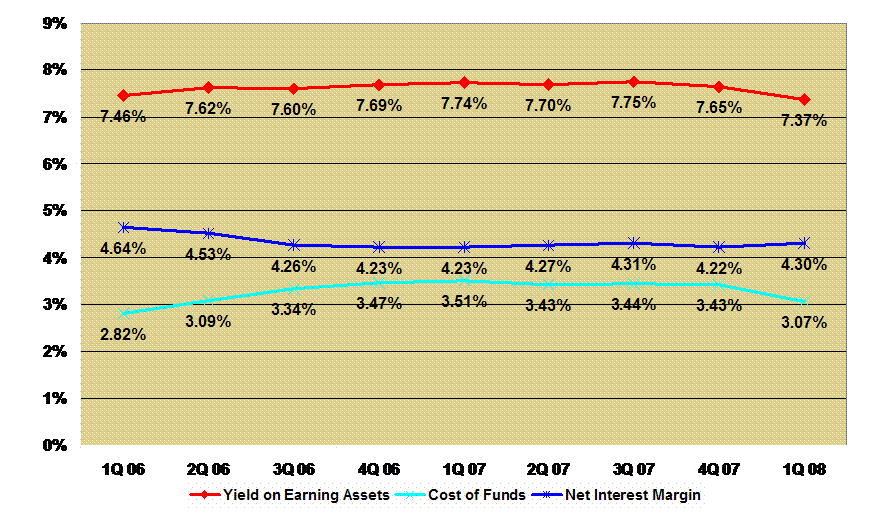
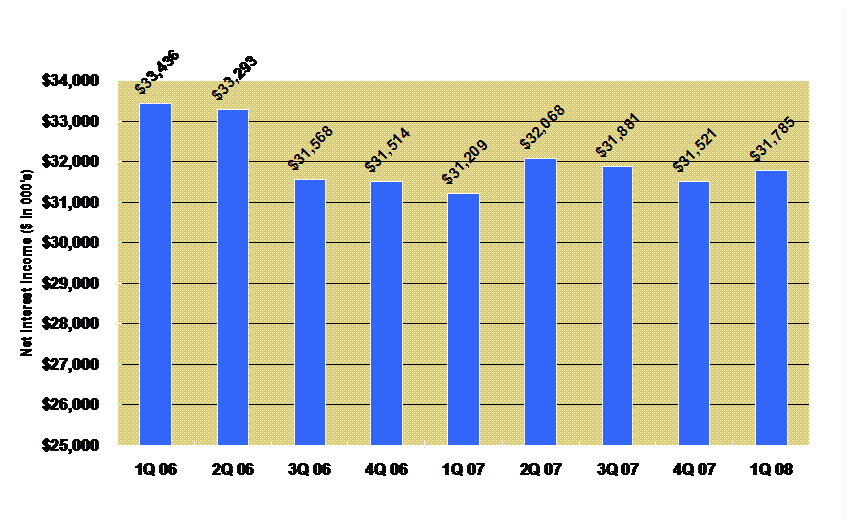
| | – | Net interest income and the net interest margin were up on both a year-over-year and sequential quarterly basis. |
| | – | Certain categories of non-interest income remain strong. |
| | – | Balance sheet structured to benefit from further cuts in short-term rates and/or a steeper yield curve. |
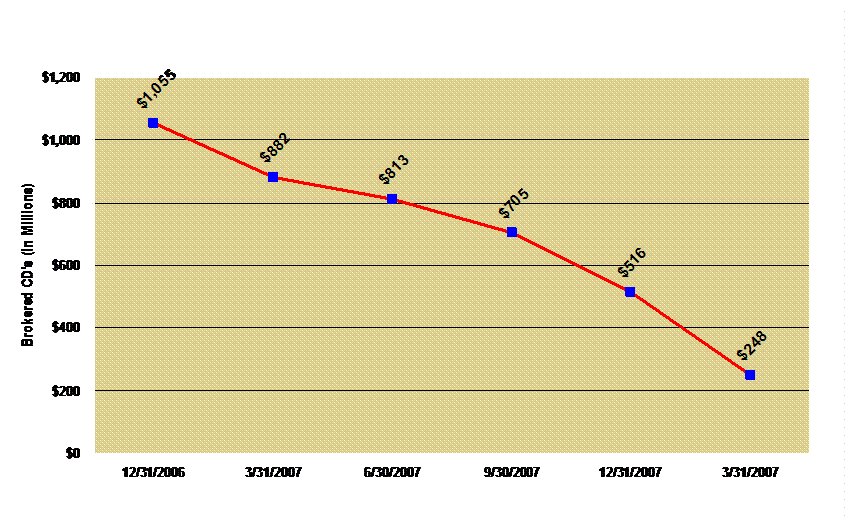
| | – | Successful shift out of higher cost brokered CD's into FHLB and FRB borrowings. |
| | – | Credit costs |
| | – | Asset quality diminished by an elevated level of non-performing assets; largely attributable to non-performing commercial loans and residential mortgage loans |
| | – | Weak Michigan economy |

9
1st Quarter 2008 Recap - Continued
| – | Fair value/FAS 159 election on preferred stocks - $(0.06) per share |
| – | MSR impairment charge - $(0.02) per share |
| – | Reversal of accrued interest on loans placed on non-accrual - $(0.02) per share |
| – | Severance costs - $(0.01) per share |
| – | Visa, Inc. IPO - $0.01 per share |
| – | Fair value/SAB 109 adoption on loans held for sale and commitments to originate mortgage loans - - $0.02 per share |
| | – | Federal income tax adjustment - $0.07 per share |
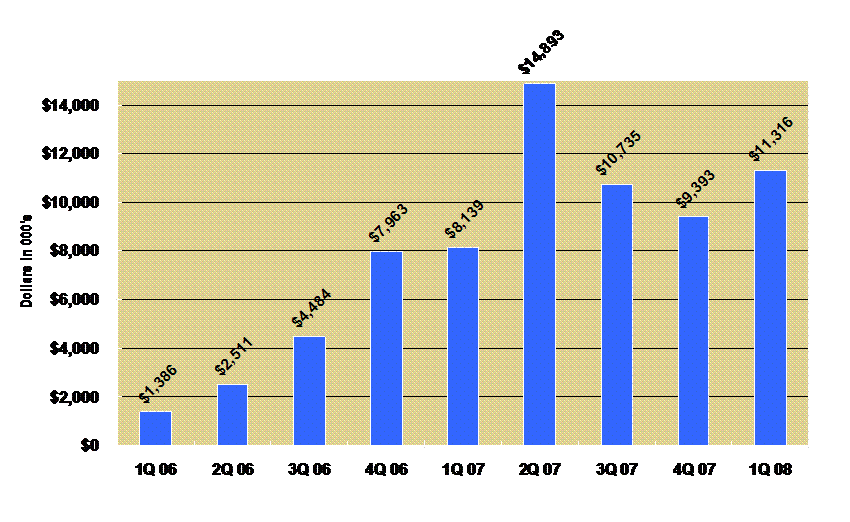
| – | Elevated loan loss provision |
| | – | Increase in FDIC insurance expense |

10
FAS 159 Fair Value Elections/SAB 109
| • | Elected FV accounting for a portfolio of preferred stocks and loans held for sale |
| – | Although FV accounting can add earnings volatility, now we get two way accounting as compared to one-way OTI. |
| – | OTI very challenging to assess on “equity” type securities. |
| | – | $1.5 million re-class from AOCI to retained earnings 1/1/08. |
| – | Fannie Mae - Par value $5.4 million / FV $4.1 million at 3/31/08 |
| – | Freddie Mac - Par value $3.2 million / FV $1.8 million at 3/31/08 |
| – | Goldman Sachs - Par value $5.0 million / FV $3.6 million at 3/31/08 |
| | – | Merrill Lynch - Par value $6.0 million / FV at $3.4 million 3/31/08 |
| – | Loans held for sale were previously accounted for at lower of cost or market, FV accounting (FAS 159) now aligns with accounting for commitments to sell such loans. |
| | – | SAB 109 adopted 1/1/08, results in recording fair value of commitments to originate mortgage loans. |
11
Tax Equivalent Net Interest Margin

12
TE Net Interest Income

13
Shift from Brokered CD's to Lower Cost Funding

14
Non-Interest Income
| Category ($ in 000's) | 1Q08 | | 4Q07 | | 1Q07 | |
|---|
| |
| | | | | | | | | | | | |
| Total non-interest income | | | | $9,492 | | | $11,173 | | | $10,670 | |
| | | |
| Service charges - deposits | | | | 5,647 | | | 6,418 | | | 4,888 | |
| | | |
| VISA check card income | | | | 1,371 | | | 1,376 | | | 950 | |
| | | |
| Gain (loss) on securities | | | | (2,163 | ) | | (964 | ) | | 79 | |
| | | |
| Net gains - mortgage loan sales | | | | 1,867 | | | 904 | | | 1,081 | |
| | | |
| Mortgage loan servicing fees | | | | (323 | ) | | 364 | | | 527 | |
| | | |
| Mutual fund and annuity commissions | | | | 424 | | | 609 | | | 479 | |

15
Non-Interest Expense
| Category ($ in 000's) | 1Q08 | | 4Q07 | | 1Q07 | |
|---|
| |
| | | | | | | | | | | | |
| Total non-interest expense | | | | $30,251 | | | $29,585 | | | $27,966 | |
| | | |
| Compensation & employee benefits | | | | 14,184 | | | 13,438 | | | 13,968 | |
| | | |
| Occupancy | | | | 3,114 | | | 2,754 | | | 2,614 | |
| | | |
| Advertising | | | | 1,100 | | | 1,549 | | | 1,152 | |
| | | |
| Loan and collection | | | | 1,925 | | | 1,437 | | | 1,006 | |
| | | |
| FDIC insurance expense | | | | 833 | | | 268 | | | 87 | |

16
Provision for Loan Losses

17
Asset Quality Measures — Non-Performing Loans
Non-performing loans
by loan type ($ in 000's) | 3/31/08 | | 12/31/07 | | 3/31/07 | |
|---|
| |
| | | | | | | | | | | | |
| Commercial | | | $ | 72,068 | | $ | 48,945 | | $ | 27,537 | |
| | | |
| Mortgage | | | | 24,824 | | | 23,147 | | | 15,691 | |
| | | |
| Consumer | | | | 3,427 | | | 3,435 | | | 2,747 | |
| | | |
| Finance receivables(a) | | | | 1,867 | | | 1,722 | | | 2,096 | |
|
| |
| | | |
| Total | | | $ | 102,186 | | $ | 77,249 | | $ | 48,071 | |
|
| |
| | | |
| As a % of total loans | | | | 4.03 | % | | 3.03 | % | | 1.93 | % |
|
| |
| (a) | Excludes discontinued operations. |

18
Allowance for Loan Losses
| Allocation ($ in 000's) | 3/31/08 | | 12/31/07 | | 3/31/07 | |
|---|
| |
| | | | | | | | | | | | |
| Specific loan allocations | | | $ | 16,166 | | $ | 10,713 | | $ | 4,992 | |
| | | |
| Adversely rated loans | | | | 9,753 | | | 10,804 | | | 5,150 | |
| | | |
| Historical losses | | | | 14,512 | | | 14,668 | | | 12,943 | |
| | | |
| Other factors/subjective | | | | 9,480 | | | 9,109 | | | 7,823 | |
|
| |
| | | |
| Total | | | $ | 49,911 | | $ | 45,294 | | $ | 30,908 | |
|
| |
| | | |
| As a % of portfolio loans | | | | 1.97 | % | | 1.78 | % | | 1.24 | % |
|
| |

19
Asset Quality Measures — Net Loan Charge-Offs
Net loan charge-offs
by loan type ($ in 000's) | 1Q08 | | 4Q07 | | 3Q07 | | 2Q07 | |
|---|
| |
| | | | | | | | | | | | | | | |
| Commercial | | | $ | 3,498 | | $ | 2,637 | | $ | 3,893 | | $ | 5,478 | |
| | | |
| Mortgage | | | | 2,124 | | | 2,739 | | | 1,819 | | | 945 | |
| | | |
| Consumer | | | | 982 | | | 964 | | | 560 | | | 557 | |
| | | |
| Overdrafts | | | | 149 | | | 333 | | | 362 | | | 360 | |
| | | |
| Finance receivables* | | | | 13 | | | 46 | | | 14 | | | 24 | |
| | | |
|
| |
| Total | | | $ | 6,766 | | $ | 6,719 | | $ | 6,648 | | $ | 7,364 | |
|
| |
| | | |
| As a % of average loans | | | | 1.07 | % | | 1.05 | % | | 1.05 | % | | 1.18 | % |
|
| |
*Excludes discontinued operations.

20
Balance Sheet Overview

21
IBCP — Cash Dividend
| • | April 2008 IBCP cash dividend reduced by 47.6% to $0.11 per share. |
| • | 1Q '08 EPS fell short of the reduced cash dividend due primarily to continued elevated credit costs. |
| • | Parent company liquidity strong with $12.5 million in cash at 3/31/08. |
| • | Parent company liquidity will be boosted from $1.8 million cash dividend to be paid by bank up to parent on 4/29/08. |
| • | Our bank subsidiary remains “well capitalized.” Further, because we anticipate no near-term asset growth, the down streaming of additional capital is not expected to be necessary. |
| • | Parent company tangible capital ratio was 4.97% at 3/31/08 (bank tangible capital ratio was 7.46% at 3/31/08). |
| • | We will evaluate and decide on the 7/31/08 dividend in late June 2008. |

22
1st Quarter 2008 Credit Review
Stefanie M. Kimball, Executive Vice President and Chief Lending Officer

23
1st Quarter 2008 Commercial Lending Recap
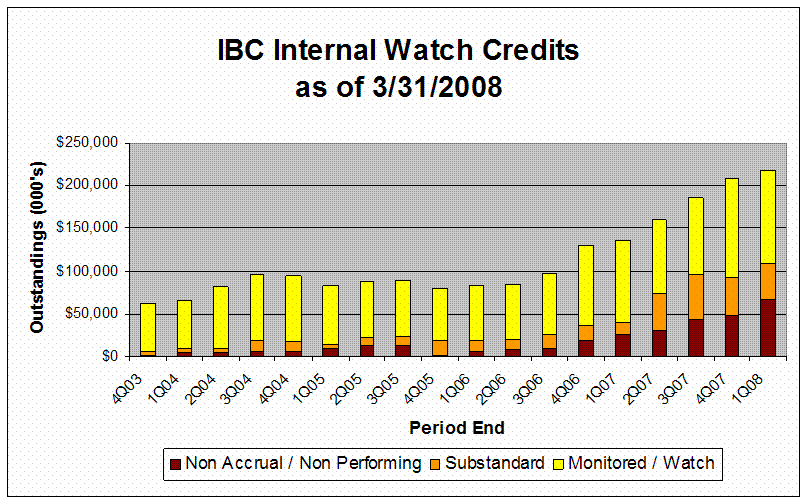
| – | Inflow of watch credits slowed and levels of internal watch and substandard loans declined. |
| – | Strategic shift in target loan types coupled with tighter underwriting criteria provides more diversified and higher quality new loans. |
| | – | New risk based pricing model rolled out, enabling improved risk/return. |
| – | Delinquency and non-accruals increased. |
| – | Elevated charge-offs and collection expenses. |
| | – | Considerable attention required for portfolio management and workout activities. |

24
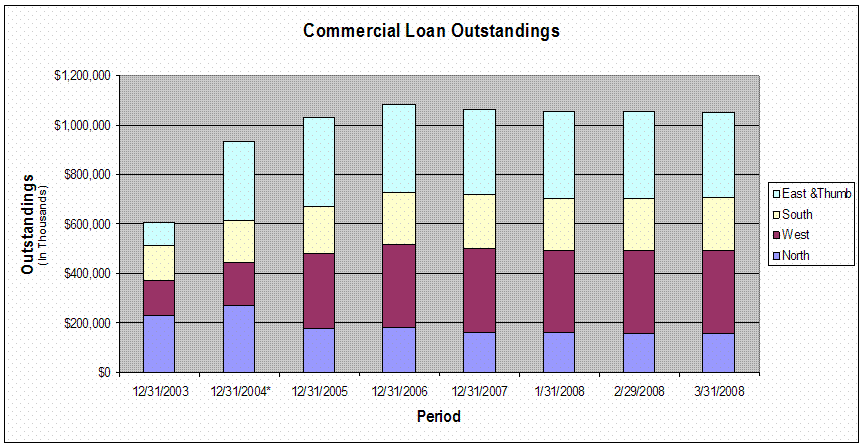
Total Commercial Loan Balances Declined Slightly in First Quarter of 2008

25
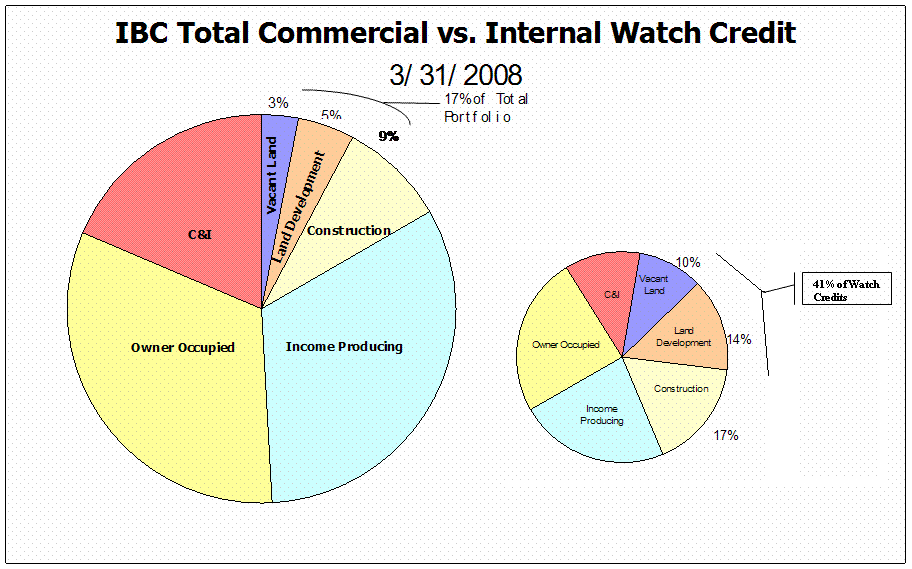
Land/Land Development CRE Segments Continue to Decline and Represent a Relatively Small Portion of the Overall Portfolio


26
Total Watch Credits Continued to Rise, but at a Slower Rate as the Internal Watch and Substandard Categories Declined in the 1st Quarter 2008

27
Select Commercial Real Estate Segments Have
Contributed Disproportionately to the Level of Watch
Credits

28
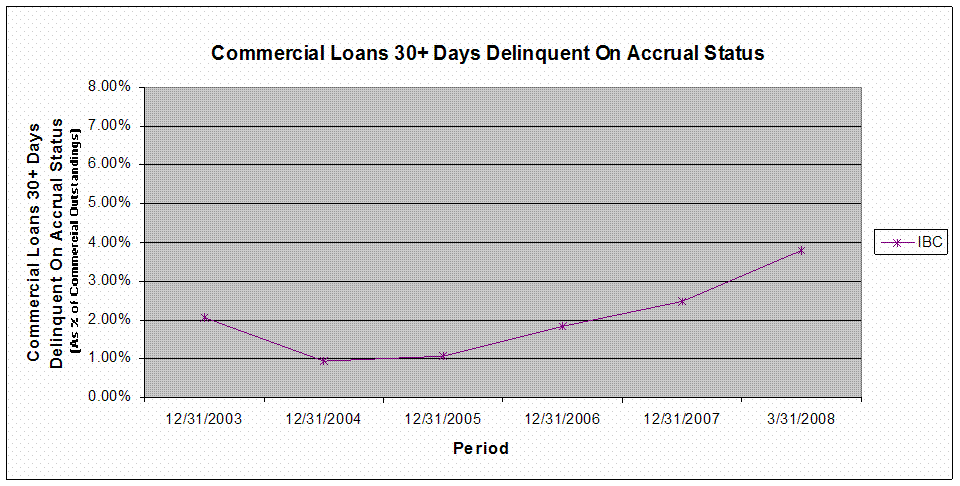
Commercial 30+ Delinquency Decreased in the 1st Quarter of 2008

29
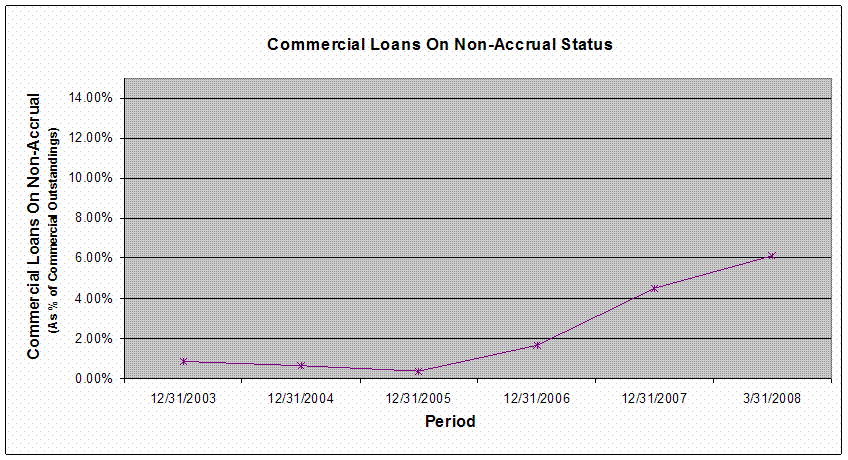
Commercial Non-Accruals Continued to Rise
in the 1st Quarter of 2008

30
Commercial Loan Net Charge-Offs Increased in the 1st Quarter of 2008


31
Economic Headwinds Continue to Challenge Clients
| • | Michigan's prolonged weak economic environment continues to challenge businesses in the State, particularly those dependent upon the sale of residential real estate. |
| • | Record levels of residential real estate inventory may take quite some time to be absorbed in many communities given negative population and job growth trends. |
| • | Significant commercial real estate de-valuations have been experienced. |
| • | Most of IBC's commercial real estate exposure in these segments has already been placed on watch status. |
| • | Geographic diversification within the State mitigates the stress currently experienced in SE Michigan. |

32
Managing Through the Michigan Credit Storm Remains Our Top Priority
| • | Implementation in 2007 of credit quality best practices position Independent Bank to weather the credit storm. |
| • | Significant rise in non-performing commercial loans results from the heavy concentration in CRE with a lengthy workout process. Our special assets team is fully engaged managing these loans with the assistance of select law firms. These loans are reserved based upon updated appraisals reflecting the distressed real estate values. |
| • | Quarterly Credit Quality Review watch process is firmly in place to manage the internal watch credits. Reviewing credits earlier in the workout cycle should improve future collection results. |
| • | Credit officers work closely with commercial lenders to monitor the financial condition of clients. |

33
Credit Quality Best Practices Implemented in 2007
Position Independent Bank to Weather the
"Credit Storm"
| • | Quarterly Watch Process to proactively manage higher risk loans is in place. |
| • | Risk Ratings are independently assigned and structure recommendations made upfront by Credit Officers. |
| • | A Special Assets Group has been established to provide more effective management of our most troubled loans. A select group of law firms supports the team, providing professional advice and systemic feedback. |
| • | Loan Review provides portfolio/individual loan feedback to evaluate the effectiveness of processes by market. |
| • | Accountability is ensured with management by objectives for each Lender and Senior Lender that emphasize credit quality in addition to growth and profitability. |
| • | Risk Based Pricing will be enhanced with improvements underway to our pricing model. |
| • | Collateral Monitoring enhancements are being implemented for both Commercial Real Estate and C & I Lending. |
| • | Portfolio Concentrations are monitored with select loan types encouraged. |

34
1st Quarter 2008 Retail Lending Recap
| – | Tighter underwriting criteria implemented in 2007 provides higher quality loans. |
| | – | Net charge-off levels declined in the 1st Quarter from 4th Quarter 2007 levels. |
| – | Delinquency and non-accruals increased. |
| | – | Considerable attention required for portfolio management and workout activities. |

35
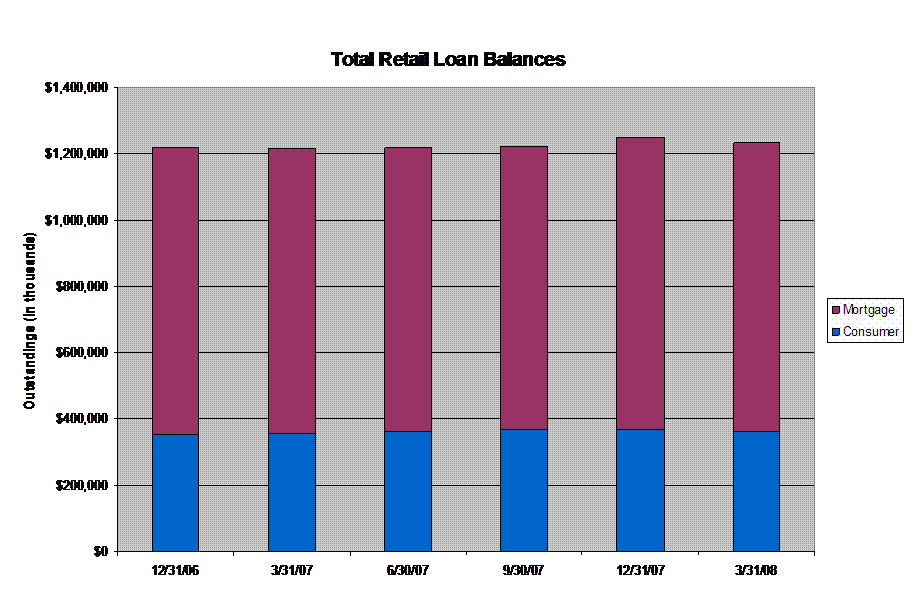
Total Retail Loan Balances Decreased Slightly in 1st Quarter of 2008

36
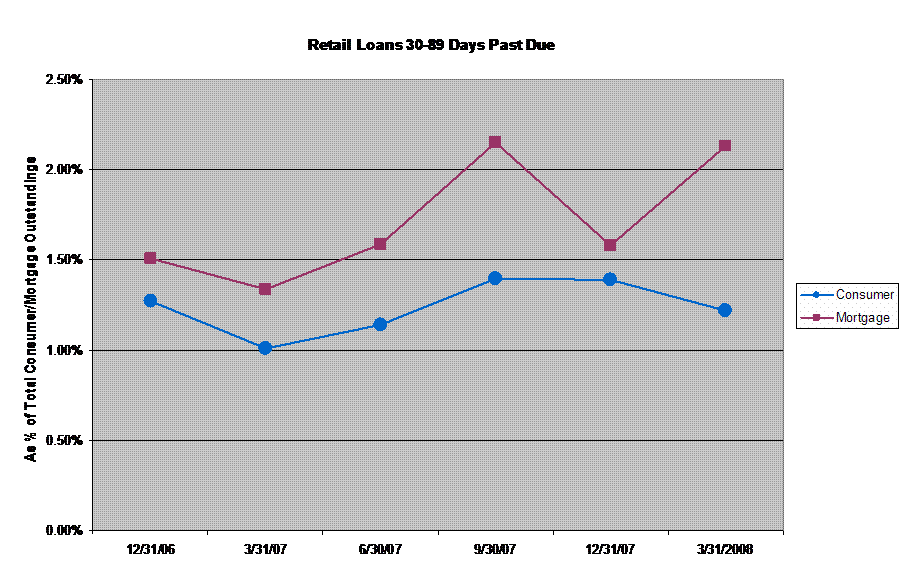
Retail 30-89 Day Delinquency Increased in the 1st Quarter

37
Retail Non-Performing Assets Continued to Rise
in the 1st Quarter

Includes Non-Performing Loans, ORE and Repossessed Assets

38
Total Retail Charge-Offs for 1st Quarter of 2008 Declined from Levels Experienced in 4th Quarter 2007


39
Q & A
Michael M. Magee, Jr.
President and Chief Executive Officer
Robert N. Shuster
Executive Vice President and
Chief Financial Officer
Stefanie M. Kimball
Executive Vice President and
Chief Lending Officer

40
Thank you for participating in the conference call.

41


