Exhibit 99.3
INDEPENDENT BANK CORPORATIONEARNINGS CONFERENCE CALL3RD QUARTER - 2014 October 27, 2014
CAUTIONARY NOTE REGARDING FORWARD-LOOKING STATEMENTS This presentation contains forward-looking statements within the meaning of the Private Securities Litigation Reform Act of 1995, including statements of goals, intentions, and expectations as to future trends, plans, events, or results of Independent Bank Corporation’s operations and policies, including, but not limited to, Independent Bank Corporation’s outlook on earnings and the sufficiency of the allowance for loan losses, and statements regarding asset quality, projections of future revenue, earnings or other measures of economic performance, Independent Bank Corporation’s plans and expectations regarding non-performing assets, business opportunities, and general economic conditions. Forward-looking statements include expressions such as “will,” “may,” “should,” “believe,” “expect,” “forecast,” “anticipate,” “estimate,” “project,” “intend,” “likely,” “optimistic” and “plan,” and similar words or phrases, which are necessarily statements of belief as to expected outcomes of future events. These statements are based on current and anticipated economic conditions, nationally and in Independent Bank Corporation’s markets, interest rates and interest rate policy, competitive factors, and other conditions which by their nature are not susceptible to accurate forecast and are subject to significant uncertainty. Because of these uncertainties and the assumptions on which this presentation and the forward-looking statements are based, actual future operations and results may differ materially from those indicated in this presentation. For a discussion of certain factors, risks and uncertainties which could cause actual future operations and results to differ from estimates and projections discussed in these forward-looking statements, please read the “Risk Factors” section in Independent Bank Corporation’s 2013 Annual Report on Form 10-K. You should not place undue reliance on any such forward-looking statement. These forward-looking statements are not guarantees of future performance. Independent Bank Corporation does not undertake to publicly revise or update forward-looking statements in this presentation to reflect events or circumstances that arise after the date of this presentation. 2

Agenda3rd Quarter 2014 Earnings Conference Call Formal Remarks.William B. (Brad) Kessel, President and Chief Executive OfficerRobert N. Shuster, Executive Vice President and Chief Financial OfficerQuestion and Answer session.Closing Remarks.Note: This presentation is available at www.IndependentBank.com in the Investor Relations area under the “Presentations” tab. 3
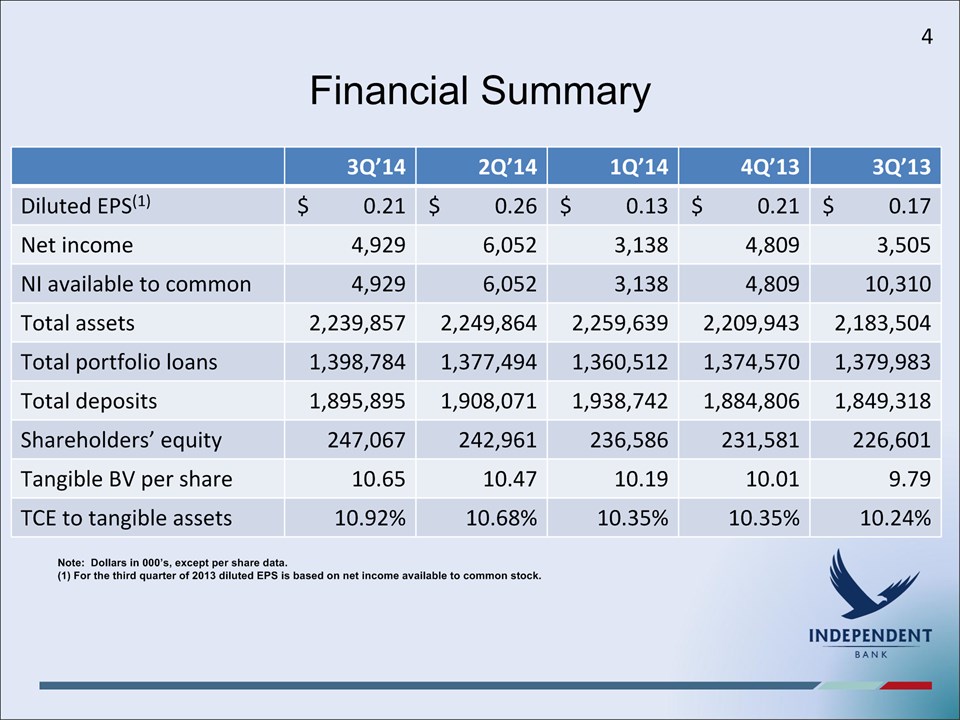
Financial Summary 3Q’14 2Q’14 1Q’14 4Q’13 3Q’13 Diluted EPS(1) $ 0.21 $ 0.26 $ 0.13 $ 0.21 $ 0.17 Net income 4,929 6,052 3,138 4,809 3,505 NI available to common 4,929 6,052 3,138 4,809 10,310 Total assets 2,239,857 2,249,864 2,259,639 2,209,943 2,183,504 Total portfolio loans 1,398,784 1,377,494 1,360,512 1,374,570 1,379,983 Total deposits 1,895,895 1,908,071 1,938,742 1,884,806 1,849,318 Shareholders’ equity 247,067 242,961 236,586 231,581 226,601 Tangible BV per share 10.65 10.47 10.19 10.01 9.79 TCE to tangible assets 10.92% 10.68% 10.35% 10.35% 10.24% Note: Dollars in 000’s, except per share data.(1) For the third quarter of 2013 diluted EPS is based on net income available to common stock. 4
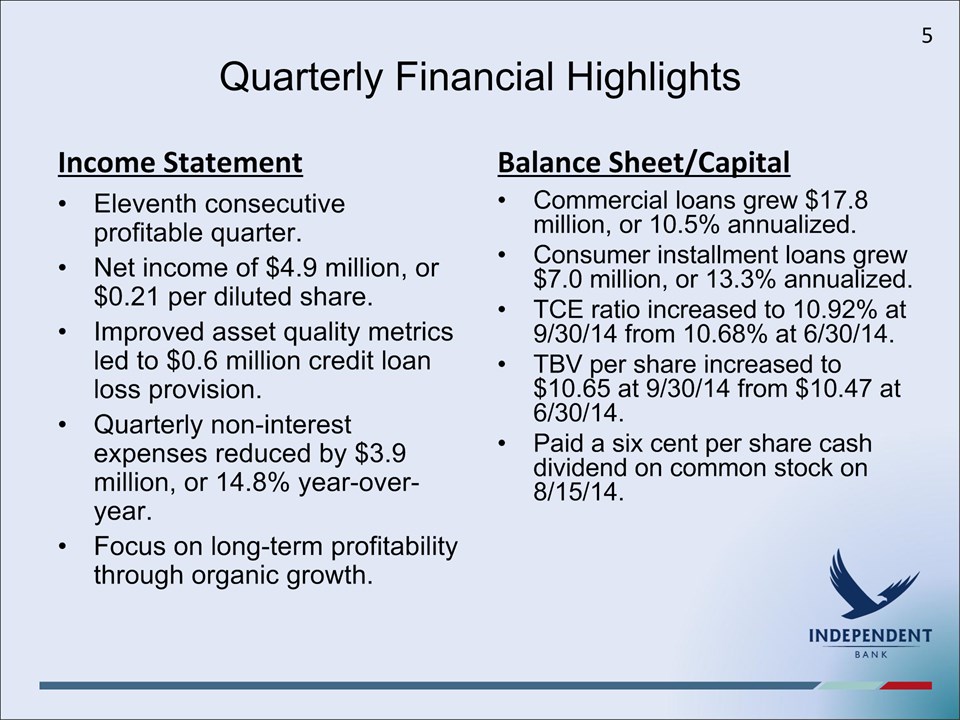
Quarterly Financial Highlights Income Statement Eleventh consecutive profitable quarter.Net income of $4.9 million, or $0.21 per diluted share.Improved asset quality metrics led to $0.6 million credit loan loss provision.Quarterly non-interest expenses reduced by $3.9 million, or 14.8% year-over-year.Focus on long-term profitability through organic growth. Balance Sheet/Capital Commercial loans grew $17.8 million, or 10.5% annualized.Consumer installment loans grew $7.0 million, or 13.3% annualized.TCE ratio increased to 10.92% at 9/30/14 from 10.68% at 6/30/14. TBV per share increased to $10.65 at 9/30/14 from $10.47 at 6/30/14.Paid a six cent per share cash dividend on common stock on 8/15/14. 5
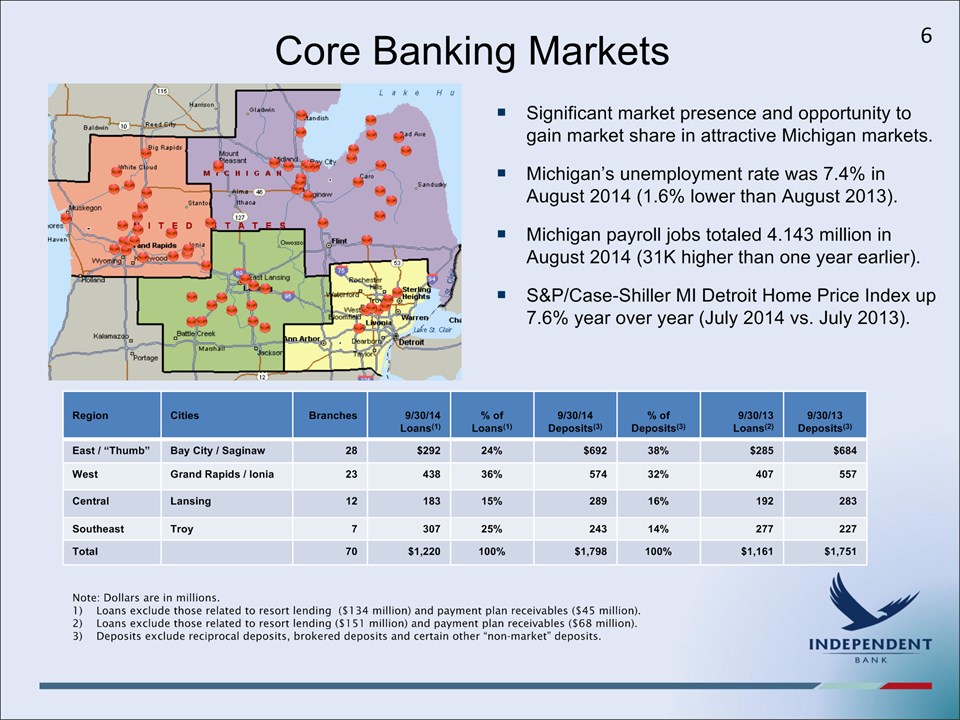
Core Banking Markets Significant market presence and opportunity to gain market share in attractive Michigan markets. Michigan’s unemployment rate was 7.4% in August 2014 (1.6% lower than August 2013).Michigan payroll jobs totaled 4.143 million in August 2014 (31K higher than one year earlier).S&P/Case-Shiller MI Detroit Home Price Index up 7.6% year over year (July 2014 vs. July 2013). Region Cities Branches 9/30/14 Loans(1) % ofLoans(1) 9/30/14Deposits(3) % of Deposits(3) 9/30/13 Loans(2) 9/30/13 Deposits(3) East / “Thumb” Bay City / Saginaw 28 $292 24% $692 38% $285 $684 West Grand Rapids / Ionia 23 438 36% 574 32% 407 557 Central Lansing 12 183 15% 289 16% 192 283 Southeast Troy 7 307 25% 243 14% 277 227 Total 70 $1,220 100% $1,798 100% $1,161 $1,751 Note: Dollars are in millions.Loans exclude those related to resort lending ($134 million) and payment plan receivables ($45 million).Loans exclude those related to resort lending ($151 million) and payment plan receivables ($68 million). Deposits exclude reciprocal deposits, brokered deposits and certain other “non-market” deposits. 6
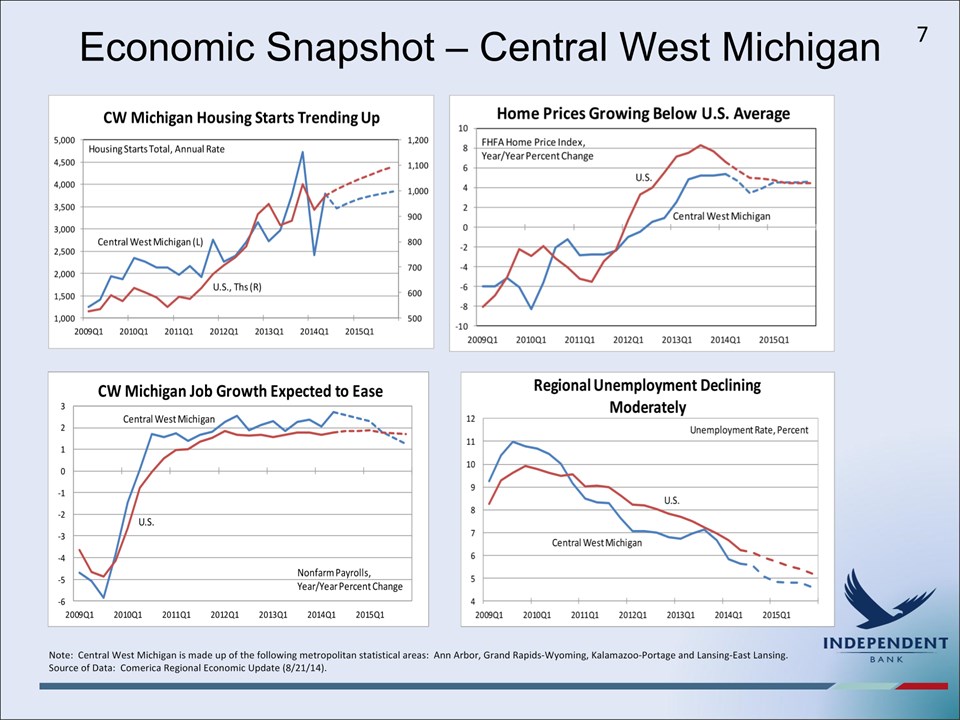
Economic Snapshot – Central West Michigan 7 Note: Central West Michigan is made up of the following metropolitan statistical areas: Ann Arbor, Grand Rapids-Wyoming, Kalamazoo-Portage and Lansing-East Lansing.Source of Data: Comerica Regional Economic Update (8/21/14).
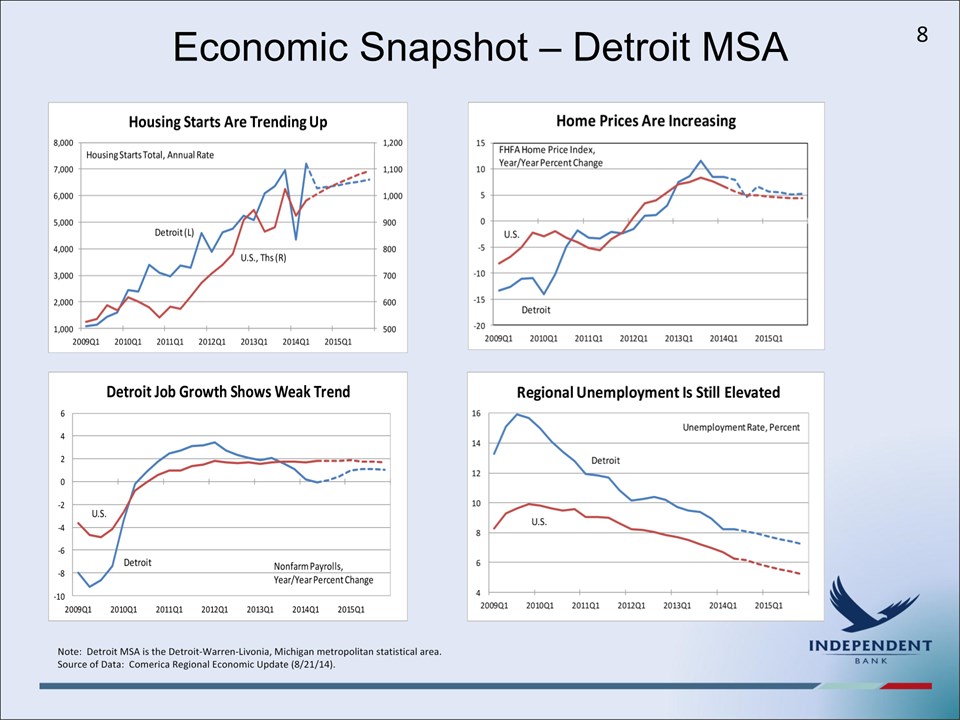
Economic Snapshot – Detroit MSA 8 Note: Detroit MSA is the Detroit-Warren-Livonia, Michigan metropolitan statistical area.Source of Data: Comerica Regional Economic Update (8/21/14).
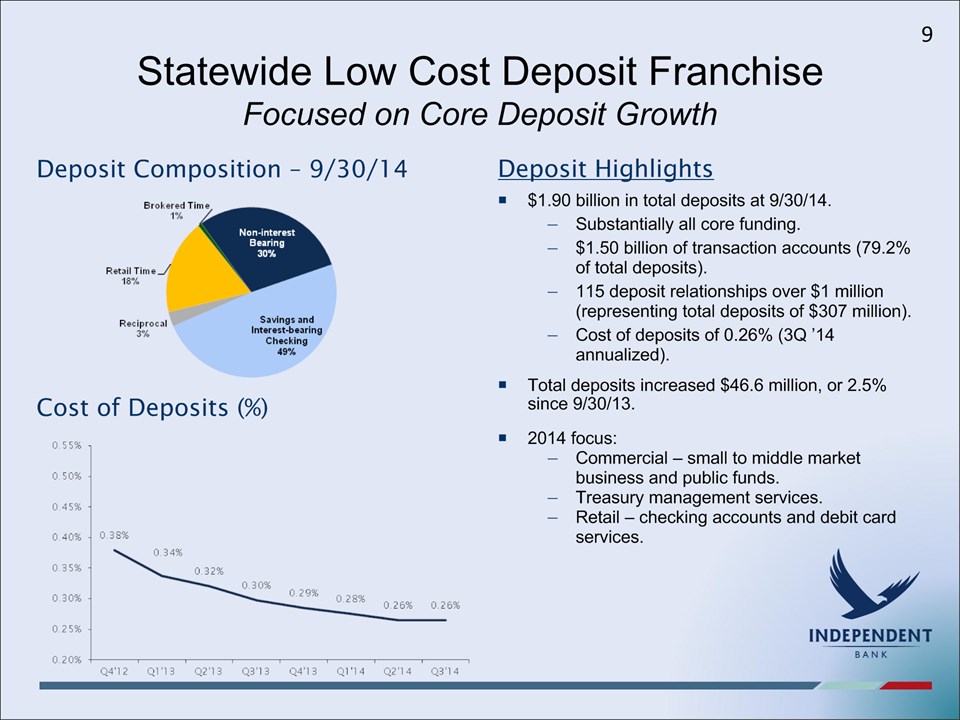
Statewide Low Cost Deposit FranchiseFocused on Core Deposit Growth $1.90 billion in total deposits at 9/30/14.Substantially all core funding.$1.50 billion of transaction accounts (79.2% of total deposits).115 deposit relationships over $1 million (representing total deposits of $307 million).Cost of deposits of 0.26% (3Q ’14 annualized).Total deposits increased $46.6 million, or 2.5% since 9/30/13.2014 focus:Commercial – small to middle market business and public funds.Treasury management services.Retail – checking accounts and debit card services. Cost of Deposits (%) Deposit Composition – 9/30/14 Deposit Highlights 9
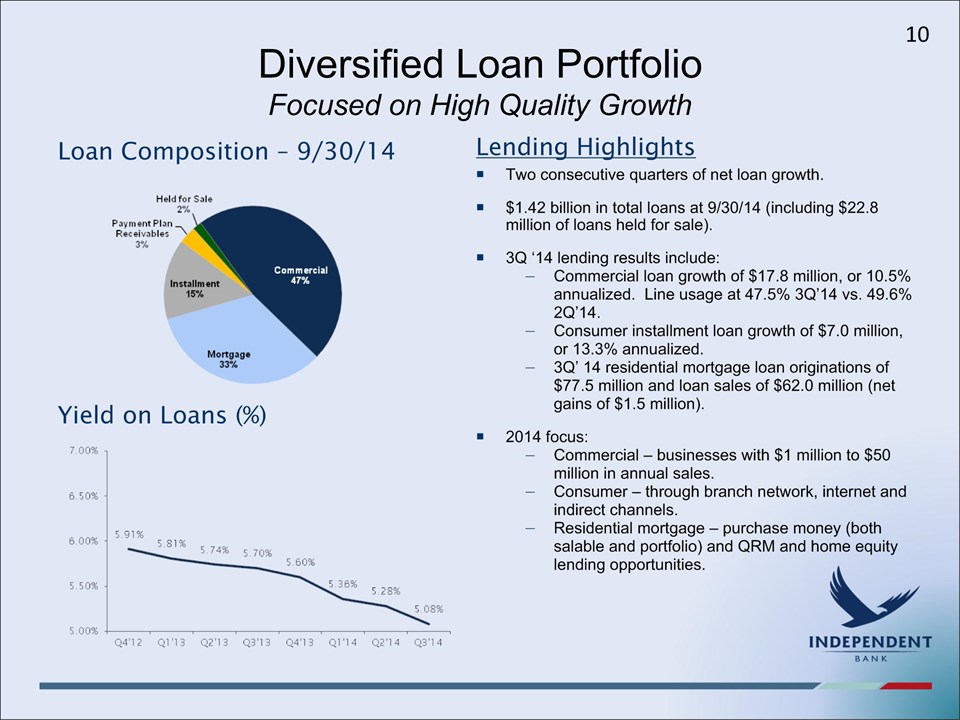
Diversified Loan PortfolioFocused on High Quality Growth Two consecutive quarters of net loan growth.$1.42 billion in total loans at 9/30/14 (including $22.8 million of loans held for sale).3Q ‘14 lending results include:Commercial loan growth of $17.8 million, or 10.5% annualized. Line usage at 47.5% 3Q’14 vs. 49.6% 2Q’14.Consumer installment loan growth of $7.0 million, or 13.3% annualized.3Q’ 14 residential mortgage loan originations of $77.5 million and loan sales of $62.0 million (net gains of $1.5 million).2014 focus:Commercial – businesses with $1 million to $50 million in annual sales.Consumer – through branch network, internet and indirect channels.Residential mortgage – purchase money (both salable and portfolio) and QRM and home equity lending opportunities. Loan Composition – 9/30/14 Yield on Loans (%) Lending Highlights 10
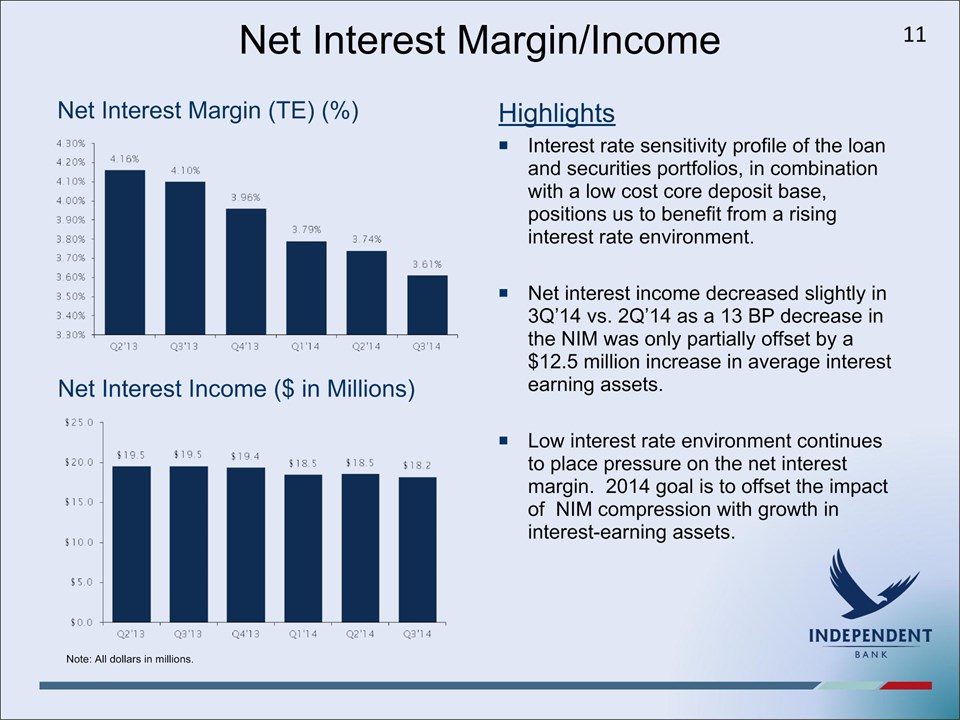
Net Interest Margin/Income Interest rate sensitivity profile of the loan and securities portfolios, in combination with a low cost core deposit base, positions us to benefit from a rising interest rate environment.Net interest income decreased slightly in 3Q’14 vs. 2Q’14 as a 13 BP decrease in the NIM was only partially offset by a $12.5 million increase in average interest earning assets.Low interest rate environment continues to place pressure on the net interest margin. 2014 goal is to offset the impact of NIM compression with growth in interest-earning assets. Net Interest Margin (TE) (%) Highlights Net Interest Income ($ in Millions) Note: All dollars in millions. 11
Net Interest Income and Net Interest MarginAnalysis of Linked Quarter Decline Summary3Q’14 net interest income of $18.183 million down $355K from 2Q’14. Most of the linked quarter decline due to $328K decline in interest and fees on loans. Approximately $100K of this decline was due to lower net recoveries of interest income on loans taken off/placed on non-accrual.Tax equivalent net interest margin (NIM) declined 13 bps (3.61% vs. 3.74%) due to lower average yield on loans. Rates on new commercial loans 3.75% to 4%; rates on new retail loans (mortgage and consumer installment) at about 4%.Loan Portfolio DetailsCommercial loans: interest income flat, a 13 bps decline in average yield (4.83% vs. 4.96%) was offset by a $9.0 million increase in average balance.Mortgage loans (includes loans held for sale): interest income declined $106K, a 9 bps decline in average yield (4.31% vs. 4.40%) was only partially offset by a $0.7 million increase in average balance.Consumer installment loans: interest income flat, a 43 bps decline in average yield (5.75% vs. 6.18%) was offset by a $12.6 million increase in average balance. Payment plan receivables: interest income declined $221K, due to both a 55 bps decline in average yield (13.62% vs. 14.17%) and a $4.9 million decline in average balance. Other FactorsInvestments and securities: interest income up $39K, a 2 bps increase in average yield (1.52% vs. 1.50%) was partially offset by a $4.6 million decline in average balance.Deposits and borrowings: interest expense up $66K. Overall cost of funds (interest expense as a percentage of average interest-earning assets) was relatively flat (0.37% vs. $0.36%). 12
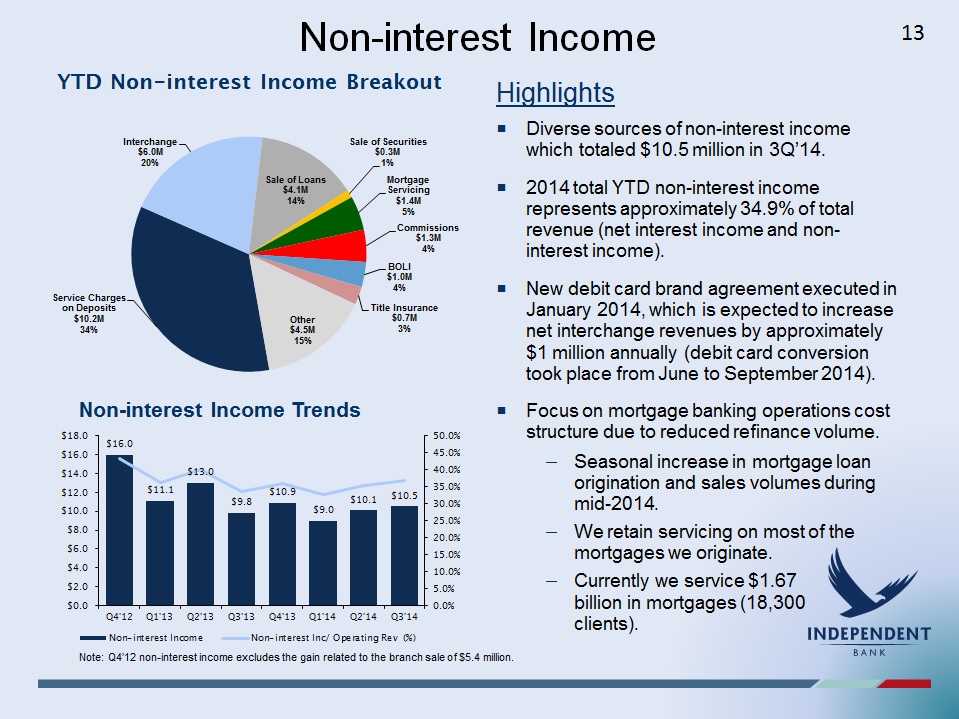
Non-interest Income YTD Non-interest Income Breakout Highlights Diverse sources of non-interest income which totaled $10.5 million in 3Q’14.2014 total YTD non-interest income represents approximately 34.9% of total revenue (net interest income and non-interest income).New debit card brand agreement executed in January 2014, which is expected to increase net interchange revenues by approximately $1 million annually (debit card conversion took place from June to September 2014).Focus on mortgage banking operations cost structure due to reduced refinance volume.Seasonal increase in mortgage loan origination and sales volumes during mid-2014.We retain servicing on most of the mortgages we originate.Currently we service $1.67 billion in mortgages (18,300 clients). Non-interest Income Trends Note: Q4’12 non-interest income excludes the gain related to the branch sale of $5.4 million. 13
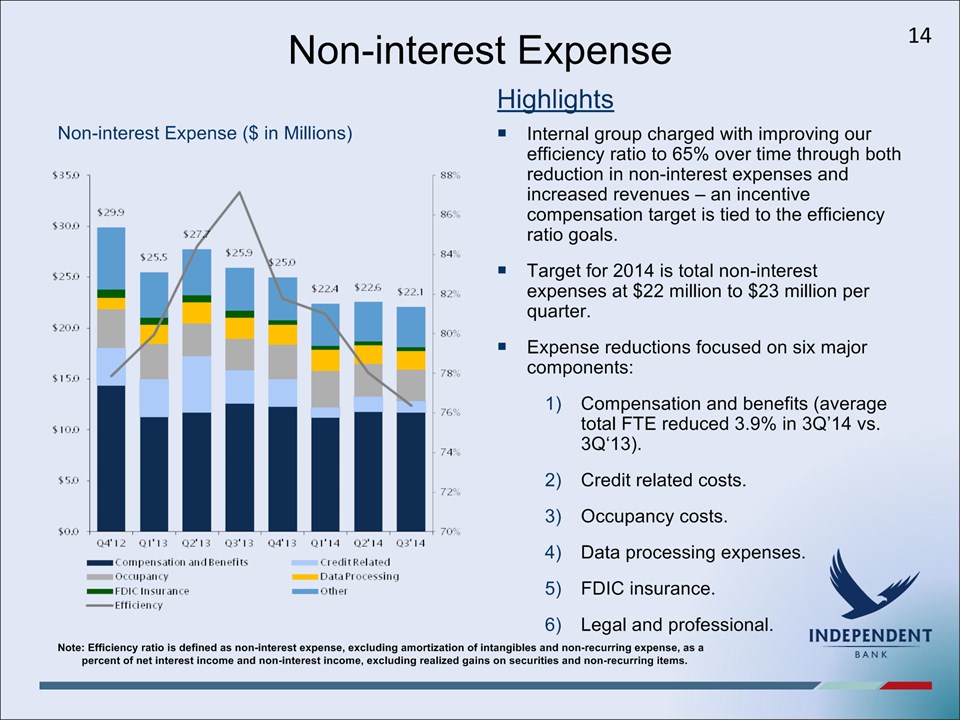
Non-interest Expense Non-interest Expense ($ in Millions) Highlights Internal group charged with improving our efficiency ratio to 65% over time through both reduction in non-interest expenses and increased revenues – an incentive compensation target is tied to the efficiency ratio goals.Target for 2014 is total non-interest expenses at $22 million to $23 million per quarter.Expense reductions focused on six major components:Compensation and benefits (average total FTE reduced 3.9% in 3Q’14 vs. 3Q‘13).Credit related costs.Occupancy costs.Data processing expenses.FDIC insurance.Legal and professional. Note: Efficiency ratio is defined as non-interest expense, excluding amortization of intangibles and non-recurring expense, as a percent of net interest income and non-interest income, excluding realized gains on securities and non-recurring items. 14
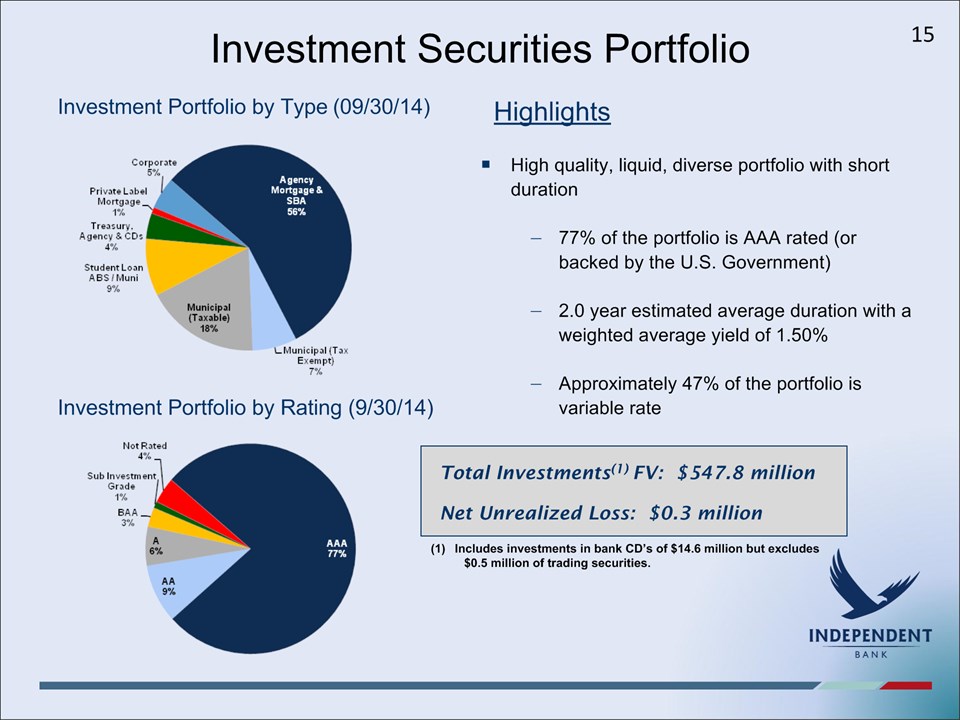
Investment Securities Portfolio High quality, liquid, diverse portfolio with short duration77% of the portfolio is AAA rated (or backed by the U.S. Government)2.0 year estimated average duration with a weighted average yield of 1.50%Approximately 47% of the portfolio is variable rate Total Investments(1) FV : $547.8 millionNet Unrealized Loss: $0.3 million Includes investments in bank CD’s of $14.6 million but excludes $0.5 million of trading securities. Investment Portfolio by Type (09/30/14) Investment Portfolio by Rating (9/30/14) Highlights 15
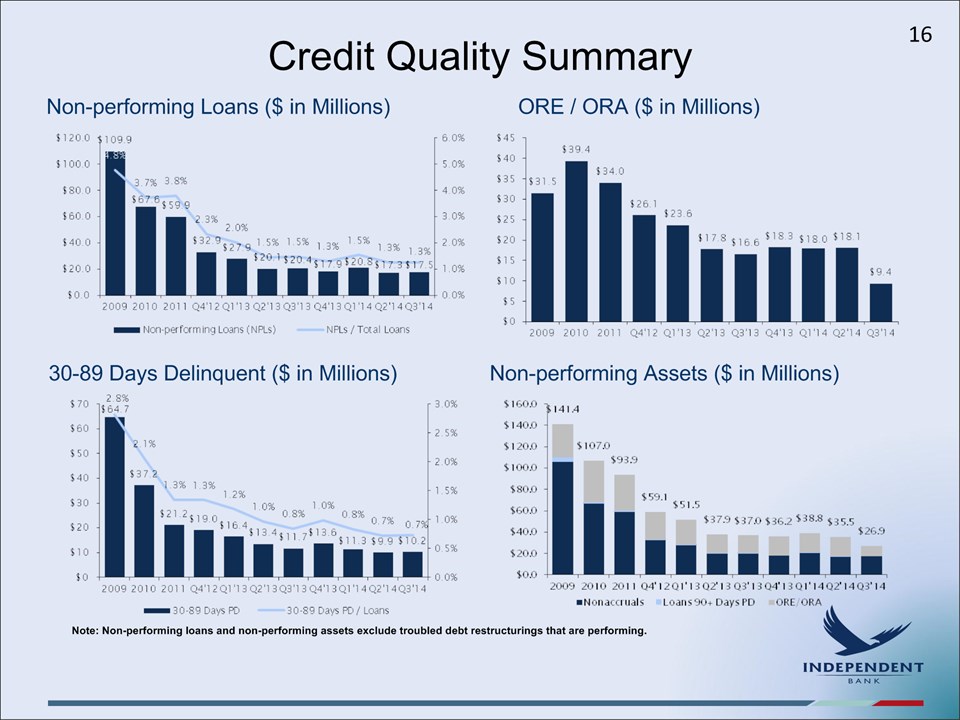
Credit Quality Summary Non-performing Loans ($ in Millions) 30-89 Days Delinquent ($ in Millions) ORE / ORA ($ in Millions) Non-performing Assets ($ in Millions) Note: Non-performing loans and non-performing assets exclude troubled debt restructurings that are performing. 16
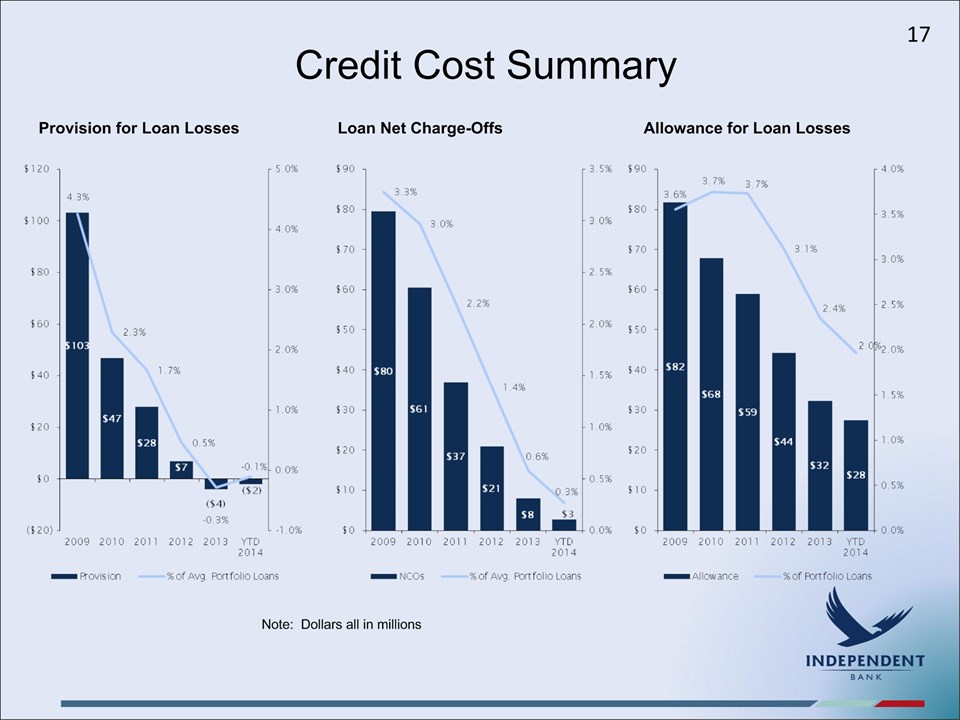
Credit Cost Summary 17 Provision for Loan Losses Loan Net Charge-Offs Allowance for Loan Losses Note: Dollars all in millions
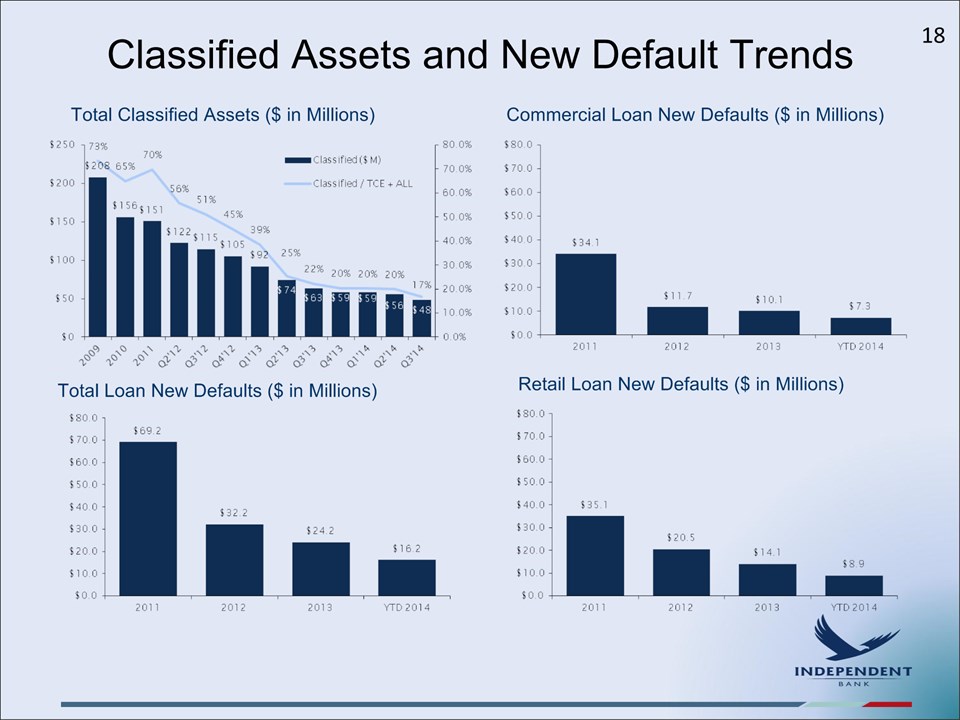
Classified Assets and New Default Trends Total Classified Assets ($ in Millions) Commercial Loan New Defaults ($ in Millions) Total Loan New Defaults ($ in Millions) Retail Loan New Defaults ($ in Millions) 18
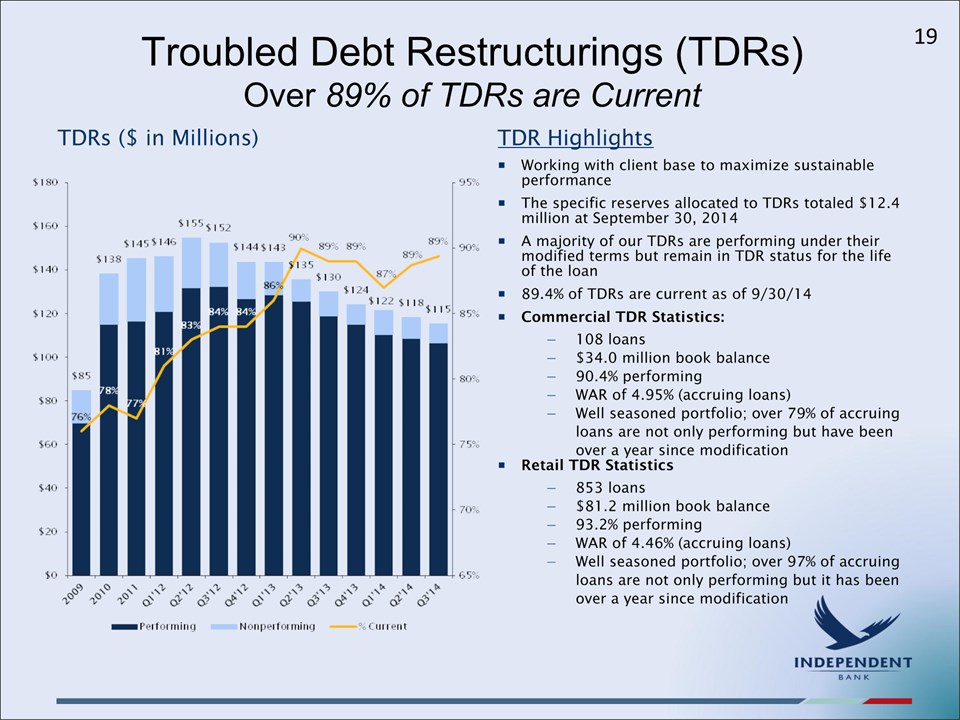
Troubled Debt Restructurings (TDRs)Over 89% of TDRs are Current Working with client base to maximize sustainable performanceThe specific reserves allocated to TDRs totaled $12.4 million at September 30, 2014A majority of our TDRs are performing under their modified terms but remain in TDR status for the life of the loan89.4% of TDRs are current as of 9/30/14Commercial TDR Statistics:108 loans$34.0 million book balance90.4% performingWAR of 4.95% (accruing loans)Well seasoned portfolio; over 79% of accruing loans are not only performing but have been over a year since modificationRetail TDR Statistics853 loans$81.2 million book balance93.2% performingWAR of 4.46% (accruing loans)Well seasoned portfolio; over 97% of accruing loans are not only performing but it has been over a year since modification TDRs ($ in Millions) TDR Highlights 19
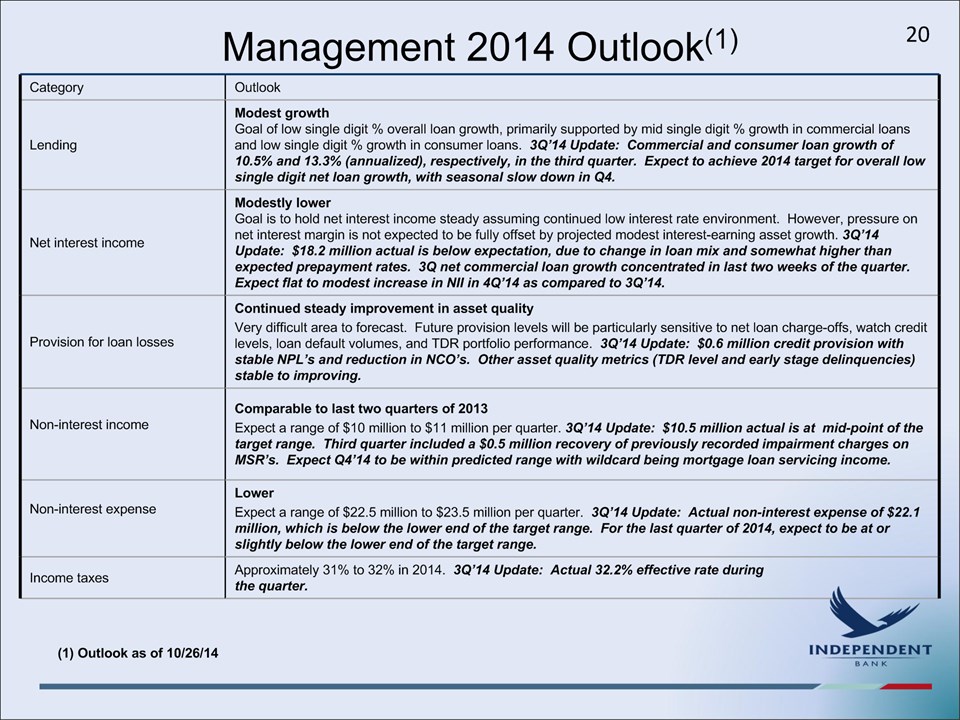
Management 2014 Outlook(1) Category Outlook Lending Modest growthGoal of low single digit % overall loan growth, primarily supported by mid single digit % growth in commercial loans and low single digit % growth in consumer loans. 3Q’14 Update: Commercial and consumer loan growth of 10.5% and 13.3% (annualized), respectively, in the third quarter. Expect to achieve 2014 target for overall low single digit net loan growth, with seasonal slow down in Q4. Net interest income Modestly lowerGoal is to hold net interest income steady assuming continued low interest rate environment. However, pressure on net interest margin is not expected to be fully offset by projected modest interest-earning asset growth. 3Q’14 Update: $18.2 million actual is below expectation, due to change in loan mix and somewhat higher than expected prepayment rates. 3Q net commercial loan growth concentrated in last two weeks of the quarter. Expect flat to modest increase in NII in 4Q’14 as compared to 3Q’14. Provision for loan losses Continued steady improvement in asset qualityVery difficult area to forecast. Future provision levels will be particularly sensitive to net loan charge-offs, watch credit levels, loan default volumes, and TDR portfolio performance. 3Q’14 Update: $0.6 million credit provision with stable NPL’s and reduction in NCO’s. Other asset quality metrics (TDR level and early stage delinquencies) stable to improving. Non-interest income Comparable to last two quarters of 2013Expect a range of $10 million to $11 million per quarter. 3Q’14 Update: $10.5 million actual is at mid-point of the target range. Third quarter included a $0.5 million recovery of previously recorded impairment charges on MSR’s. Expect Q4’14 to be within predicted range with wildcard being mortgage loan servicing income. Non-interest expense LowerExpect a range of $22.5 million to $23.5 million per quarter. 3Q’14 Update: Actual non-interest expense of $22.1 million, which is below the lower end of the target range. For the last quarter of 2014, expect to be at or slightly below the lower end of the target range. Income taxes Approximately 31% to 32% in 2014. 3Q’14 Update: Actual 32.2% effective rate during the quarter. 20 (1) Outlook as of 10/26/14
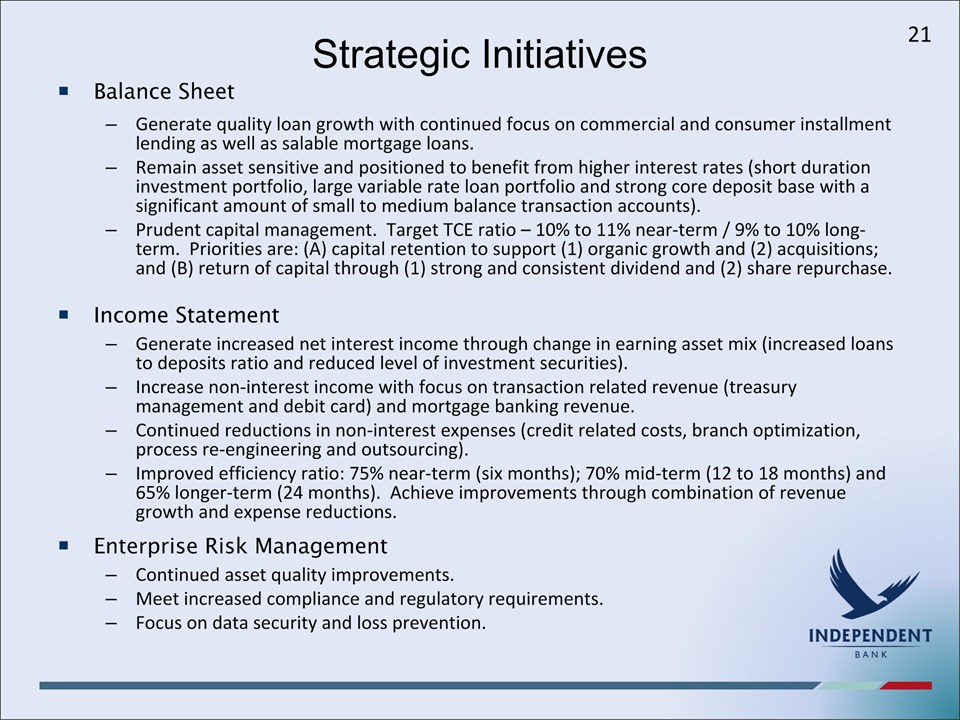
Strategic Initiatives Balance SheetGenerate quality loan growth with continued focus on commercial and consumer installment lending as well as salable mortgage loans.Remain asset sensitive and positioned to benefit from higher interest rates (short duration investment portfolio, large variable rate loan portfolio and strong core deposit base with a significant amount of small to medium balance transaction accounts).Prudent capital management. Target TCE ratio – 10% to 11% near-term / 9% to 10% long- term. Priorities are: (A) capital retention to support (1) organic growth and (2) acquisitions; and (B) return of capital through (1) strong and consistent dividend and (2) share repurchase.Income StatementGenerate increased net interest income through change in earning asset mix (increased loans to deposits ratio and reduced level of investment securities).Increase non-interest income with focus on transaction related revenue (treasury management and debit card) and mortgage banking revenue.Continued reductions in non-interest expenses (credit related costs, branch optimization, process re-engineering and outsourcing).Improved efficiency ratio: 75% near-term (six months); 70% mid-term (12 to 18 months) and 65% longer-term (24 months). Achieve improvements through combination of revenue growth and expense reductions. Enterprise Risk ManagementContinued asset quality improvements.Meet increased compliance and regulatory requirements.Focus on data security and loss prevention. 21
Independent Bank Corporation3rd Quarter 2014 Earnings Conference Call Question and Answer SessionClosing RemarksThank you for attending !NASDAQ: IBCPCelebrating our 150th year in 2014 ! 22