Exhibit 99.3

INDEPENDENT BANK CORPORATIONEarnings conference call2ND quarter - 2015 July 27, 2015

Cautionary note regarding forward-looking statements This presentation contains forward-looking statements within the meaning of the Private Securities Litigation Reform Act of 1995, including statements of goals, intentions, and expectations as to future trends, plans, events, or results of Independent Bank Corporation’s operations and policies, including, but not limited to, Independent Bank Corporation’s outlook on earnings and the sufficiency of the allowance for loan losses, and statements regarding asset quality, projections of future revenue, earnings or other measures of economic performance, Independent Bank Corporation’s plans and expectations regarding non-performing assets, business opportunities, and general economic conditions. Forward-looking statements include expressions such as “will,” “may,” “should,” “believe,” “expect,” “forecast,” “anticipate,” “estimate,” “project,” “intend,” “likely,” “optimistic” and “plan,” and similar words or phrases, which are necessarily statements of belief as to expected outcomes of future events. These statements are based on current and anticipated economic conditions, nationally and in Independent Bank Corporation’s markets, interest rates and interest rate policy, competitive factors, and other conditions which by their nature are not susceptible to accurate forecast and are subject to significant uncertainty. Because of these uncertainties and the assumptions on which this presentation and the forward-looking statements are based, actual future operations and results may differ materially from those indicated in this presentation. For a discussion of certain factors, risks and uncertainties which could cause actual future operations and results to differ from estimates and projections discussed in these forward-looking statements, please read the “Risk Factors” section in Independent Bank Corporation’s 2014 Annual Report on Form 10-K. You should not place undue reliance on any such forward-looking statement. These forward-looking statements are not guarantees of future performance. Independent Bank Corporation does not undertake to publicly revise or update forward-looking statements in this presentation to reflect events or circumstances that arise after the date of this presentation. 2

Agenda2nd Quarter 2015 Earnings Conference Call Formal Remarks.William B. (Brad) Kessel, President and Chief Executive OfficerRobert N. Shuster, Executive Vice President and Chief Financial OfficerQuestion and Answer session.Closing Remarks.Note: This presentation is available at www.IndependentBank.com in the Investor Relations area under the “Presentations” tab. 3
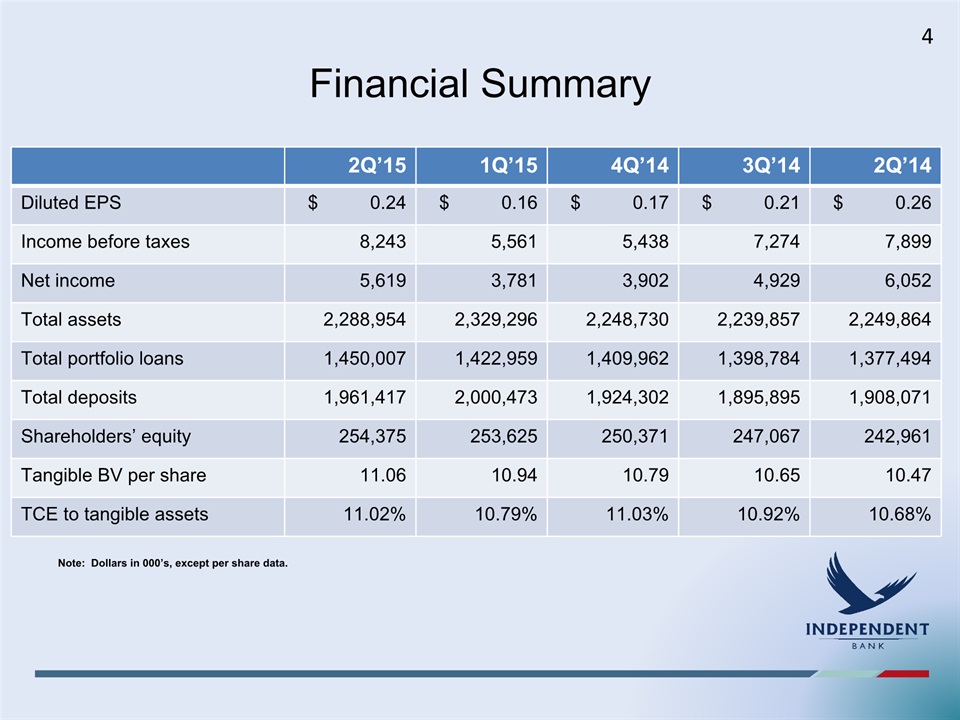
Financial Summary 2Q’15 1Q’15 4Q’14 3Q’14 2Q’14 Diluted EPS $ 0.24 $ 0.16 $ 0.17 $ 0.21 $ 0.26 Income before taxes 8,243 5,561 5,438 7,274 7,899 Net income 5,619 3,781 3,902 4,929 6,052 Total assets 2,288,954 2,329,296 2,248,730 2,239,857 2,249,864 Total portfolio loans 1,450,007 1,422,959 1,409,962 1,398,784 1,377,494 Total deposits 1,961,417 2,000,473 1,924,302 1,895,895 1,908,071 Shareholders’ equity 254,375 253,625 250,371 247,067 242,961 Tangible BV per share 11.06 10.94 10.79 10.65 10.47 TCE to tangible assets 11.02% 10.79% 11.03% 10.92% 10.68% Note: Dollars in 000’s, except per share data. 4
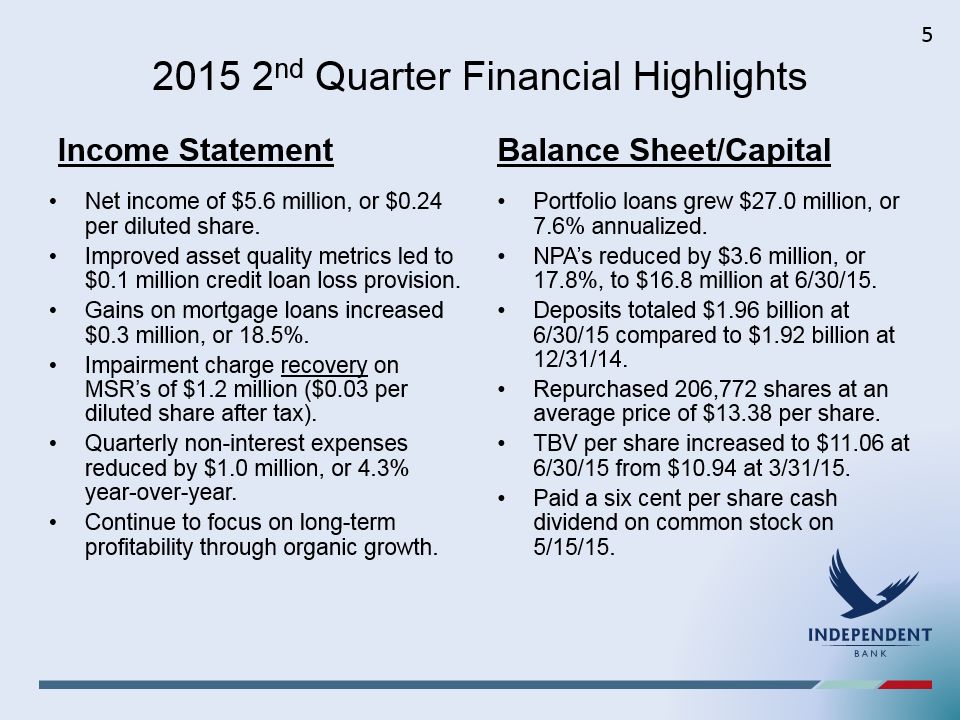
2015 2nd Quarter Financial Highlights Income Statement Net income of $5.6 million, or $0.24 per diluted share.Improved asset quality metrics led to $0.1 million credit loan loss provision.Gains on mortgage loans increased $0.3 million, or 18.5%.Impairment charge recovery on MSR’s of $1.2 million ($0.03 per diluted share after tax).Quarterly non-interest expenses reduced by $1.0 million, or 4.3% year-over-year. Continue to focus on long-term profitability through organic growth. Balance Sheet/Capital Portfolio loans grew $27.0 million, or 7.6% annualized.NPA’s reduced by $3.6 million, or 17.8%, to $16.8 million at 6/30/15.Deposits totaled $1.96 billion at 6/30/15 compared to $1.92 billion at 12/31/14.Repurchased 206,772 shares at an average price of $13.38 per share. TBV per share increased to $11.06 at 6/30/15 from $10.94 at 3/31/15.Paid a six cent per share cash dividend on common stock on 5/15/15. 5

Core Banking Markets Since 2012, substantial changes have been implemented to streamline and optimize our branch delivery network.Significant market presence and opportunity to gain market share in attractive Michigan markets. Michigan’s unemployment rate was 5.5% in May 2015 (1.8% lower than May 2014).Michigan payroll jobs totaled 4.278 million in May 2015 (107K higher than one year earlier).S&P/Case-Shiller MI Detroit Home Price Index up 4.3% year over year (Apr. 2015 vs. Apr. 2014). Region Cities Branches 6/30/15 Loans(1) % ofLoans(1) 6/30/15Deposits(3) % of Deposits(3) 6/30/14 Loans(2) 6/30/14 Deposits(3) East / “Thumb” Bay City / Saginaw 24 $305 24% $725 39% $284 $697 West Grand Rapids / Ionia 22 479 37% 604 33% 422 568 Central Lansing 11 186 14% 284 15% 185 282 Southeast Troy 7 319 25% 248 13% 299 232 Total 64 $1,289 100% $1,861 100% $1,190 $1,779 Note: Dollars are in millions.Loans exclude those related to resort lending ($120 million) and payment plan receivables ($41 million).Loans exclude those related to resort lending ($137 million) and payment plan receivables ($50 million). Deposits exclude reciprocal deposits, brokered deposits and certain other “non-market” deposits. 6
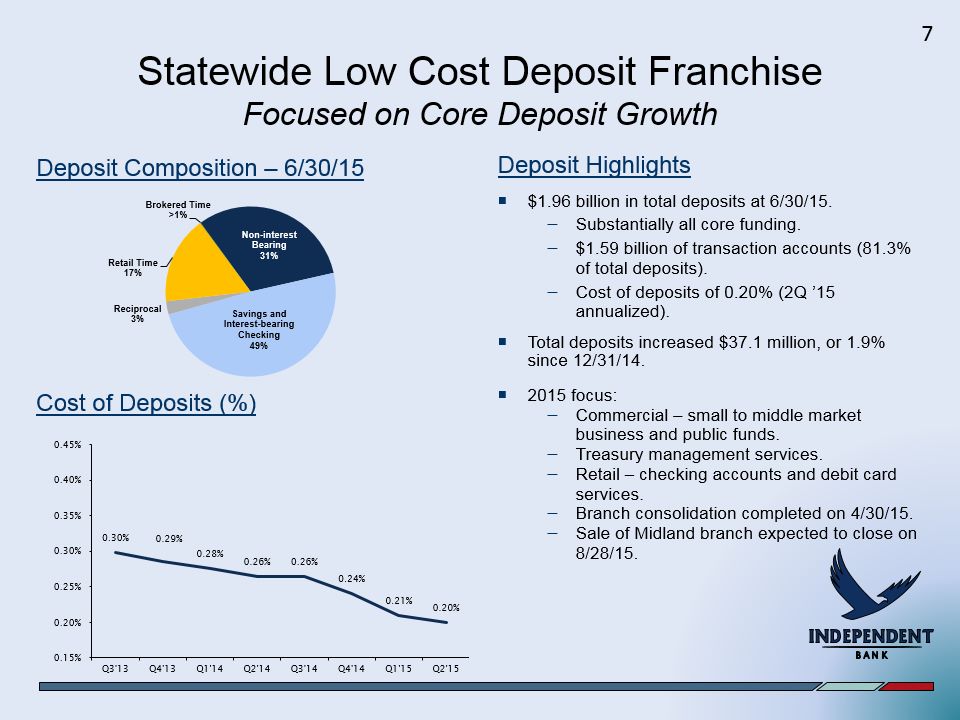
Statewide Low Cost Deposit FranchiseFocused on Core Deposit Growth $1.96 billion in total deposits at 6/30/15.Substantially all core funding.$1.59 billion of transaction accounts (81.3% of total deposits).Cost of deposits of 0.20% (2Q ’15 annualized).Total deposits increased $37.1 million, or 1.9% since 12/31/14.2015 focus:Commercial – small to middle market business and public funds.Treasury management services.Retail – checking accounts and debit card services.Branch consolidation completed on 4/30/15.Sale of Midland branch expected to close on 8/28/15. Cost of Deposits (%) Deposit Composition – 6/30/15 Deposit Highlights 7

Diversified Loan PortfolioFocused on High Quality Growth Five consecutive quarters of net loan growth.$1.48 billion in total loans at 6/30/15 (including $30.5 million of loans held for sale).2Q 2015 lending results include:Commercial loan growth of $0.7 million, or 0.4% annualized. Line usage at 49.6% for both 2Q’15 and 2Q’14.Consumer installment loan growth of $20.8 million, or 40.1%, annualized, reflecting seasonal factors.Residential mortgage loan originations of $101.3 million and loan sales of $82.2 million (net gains of $1.8 million).2015 focus:Commercial – businesses with $1 million to $50 million in annual sales.Consumer – through branch network, internet and indirect channels.Residential mortgage – purchase money (both salable and portfolio) and QRM and home equity lending opportunities. Low interest rates spurred refinance activity in first half of 2015. Loan Composition – 6/30/15 Yield on Loans (%) Lending Highlights 8

Net Interest Margin/Income Interest rate sensitivity profile of the loan and securities portfolios, in combination with a low cost core deposit base, positions us to benefit from a rising interest rate environment.Net interest income increased in 2Q’15 vs. 1Q’15 due to a 5 BP increase in the NIM and a $22.9 million increase in average interest earning assets.Low interest rate environment continues to place some pressure on the net interest margin. 2015 goal is to grow net interest income by 2% to 3% as NIM compression ends and average loans increase. Net Interest Margin (TE) (%) Highlights Net Interest Income ($ in Millions) Note: All dollars in millions. 9

Net Interest Income and Net Interest MarginAnalysis of Linked Quarter Increase Summary2Q’15 net interest income of $18.701 million, up $610K from 1Q’15. The linked quarter increase was due to a $512K increase in interest income and fees on loans, a $67K increase in interest income on securities and investments and a $31K decrease in interest expense on deposits and borrowings. Net interest income was increased by approximately $0.1 million due to one more day in 2Q’15 vs. 1Q’15.The tax equivalent net interest margin (NIM) increased 5 bps (3.62% vs. 3.57%) due to a 4 bps increase in the average yield on interest-earning assets and a 1 bps decline in the cost of funds.Average rates on new commercial loans 4% to 5%; average rates on new retail loans (mortgage and consumer installment) at about 4%.Loan Portfolio DetailsCommercial loans: Interest income increased $320K due to one more day in the quarter ($91K impact), a 3 bps increase in the average yield (4.72% vs. 4.69%) and a $14.6 million increase in the average balance.Mortgage loans (includes loans held for sale): Interest income increased $45K due to a 3 bps increase in the average yield (4.20% vs. 4.17%) and a $307K increase in the average balance.Consumer installment loans: Interest income increased $48K due to one more day in the quarter ($31K impact) and an $11.4 million increase in the average balance that was partially offset by a 26 bps decline in the average yield (5.31% vs. 5.57%). Payment plan receivables: Interest income increased $99K due to a $2.7 million increase in the average balance and a 7 bps increase in the average yield (13.96% vs. 13.89%). Other FactorsSecurities and investments: Interest income increased $67K due to a 6 bps increase in the average yield (1.59% vs. 1.53%) that was partially offset by a $5.9 million decrease in average balance. Deposits and borrowings: Interest expense declined $31K due to a 1 bps decrease in the funding cost (0.41% vs. $0.42%) and a $1.2 million decrease in average interest-bearing liabilities that was partially offset by the impact of one more day in quarter that increased interest expense by $16K. 10
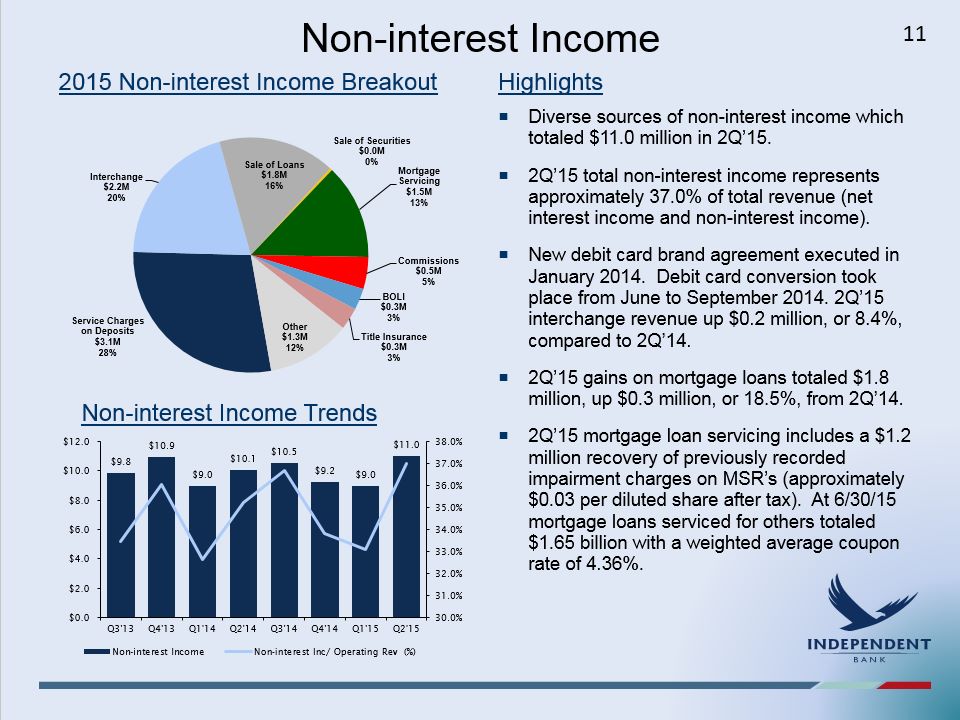
Non-interest Income 2015 Non-interest Income Breakout Highlights Diverse sources of non-interest income which totaled $11.0 million in 2Q’15.2Q’15 total non-interest income represents approximately 37.0% of total revenue (net interest income and non-interest income).New debit card brand agreement executed in January 2014. Debit card conversion took place from June to September 2014. 2Q’15 interchange revenue up $0.2 million, or 8.4%, compared to 2Q’14.2Q’15 gains on mortgage loans totaled $1.8 million, up $0.3 million, or 18.5%, from 2Q’14.2Q’15 mortgage loan servicing includes a $1.2 million recovery of previously recorded impairment charges on MSR’s (approximately $0.03 per diluted share after tax). At 6/30/15 mortgage loans serviced for others totaled $1.65 billion with a weighted average coupon rate of 4.36%. Non-interest Income Trends 11

Non-interest Expense Non-interest Expense ($ in Millions) Highlights Q2’15 non-interest expenses totaled $21.6 million (a decrease from both Q2’14 and Q1’15).Target for 2015 is total non-interest expenses at $21 million to $22 million per quarter (with an average at $21.3 million) – representing a 5.4% reduction over 2014 actual. Actual average for 2015 likely to be above $21.3 million per quarter original estimate due in part to higher performance based compensation that reflects better overall profitability and asset quality metrics.Branch consolidation (six offices) completed on April 30, 2015. Estimated annualized reduction in non-interest expenses of $1.6 million. Note: Efficiency ratio is defined as non-interest expense, excluding amortization of intangibles and non-recurring expense, as a percent of net interest income and non-interest income, excluding realized gains on securities and non-recurring items. 12

Investment Securities Portfolio High quality, liquid, diverse portfolio with short duration.77% of the portfolio is AAA rated (or backed by the U.S. Government).1.8 year estimated average duration with a weighted average yield of 1.58%.Approximately 38% of the portfolio is variable rate. Total Investments(1) FV : $568.6 millionNet Unrealized Gain: $0.7 million Includes investments in bank CD’s of $10.9 million but excludes $0.2 million of trading securities. Investment Portfolio by Type (6/30/15) Investment Portfolio by Rating (6/30/15) Highlights 13

Credit Quality Summary Non-performing Loans ($ in Millions) 30-89 Days Delinquent ($ in Millions) ORE / ORA ($ in Millions) Non-performing Assets ($ in Millions) Note: Non-performing loans and non-performing assets exclude troubled debt restructurings that are performing. 14

Credit Cost Summary 15 Provision for Loan Losses Loan Net Charge-Offs Allowance for Loan Losses Note: Dollars all in millions

Classified Assets and New Default Trends Total Classified Assets ($ in Millions) Commercial Loan New Defaults ($ in Millions) Total Loan New Defaults ($ in Millions) Retail Loan New Defaults ($ in Millions) 16

Troubled Debt Restructurings (TDRs)93% of TDRs are Current Working with client base to maximize sustainable performance.The specific reserves allocated to TDRs totaled $11.1 million at 6/30/15.A majority of our TDRs are performing under their modified terms but remain in TDR status for the life of the loan.92.7% of TDRs are current as of 6/30/15.Commercial TDR Statistics:94 loans with $29.2 million book balance.94.2% performing.WAR of 4.86% (accruing loans).Well seasoned portfolio; over 93% of accruing loans are not only performing but have been for over a year since modification.Retail TDR Statistics794 loans with $75.1 million book balance.94.0% performing.WAR of 4.35% (accruing loans).Well seasoned portfolio; over 93% of accruing loans are not only performing but have been for over a year since modification. TDRs ($ in Millions) TDR Highlights 17

2015 Actual vs. Management Original Outlook Category Outlook Lending Modest growthGoal of mid single digit % overall loan growth, primarily supported by mid single digit % growth in commercial loans and consumer loans with modest increases in mortgage loans and payment plan receivables. Expect much of this growth to occur in the last three quarters of 2015. This growth forecast also assumes a stable to somewhat improving Michigan economy. 2Q’15 Update: YTD net loan growth of $40.0 million, or 5.7% annualized. Growth concentrated in commercial and consumer installment loans. Net interest income Modestly higherGoal of low single digit % increase in net interest income over 2014. Pressure on the net interest margin is expected to abate by mid-2015. Growth in net interest income over 4Q’14 level expected by 2Q’15 with continued acceleration in last half of 2015 due primarily to growth in loans as described above. Forecast assumes short-term interest rates remain at current levels until 4Q’15 (modest 0.25% increase in the federal funds rates expected) and mid- to long-term rates up slightly over year end 2014 levels. 2Q’15 Update: Net interest income of $18.7 million up 3.4% over 1Q’15, also NIM was 3.62% in 2Q’15 vs. 3.57% in 1Q’15. Provision for loan losses Steady to slightly improving asset quality metricsVery difficult area to forecast. Future provision levels will be particularly sensitive to loan net charge-offs, watch credit levels, loan default volumes, and TDR portfolio performance. The allowance as a percentage of total loans was at 1.84% at 12/31/14. Any credit provision in 2015 would largely be a function of recoveries of previously charged-off loans, pay-downs in the TDR portfolio (permitting the release of specific reserves) and low levels of new loan defaults. 2Q’15 Update: Generally improving asset quality metrics led to $0.1 million credit loan loss provision. ALLL stood at 1.70% of portfolio loans at 6/30/15. Non-interest income Forecasted quarterly range of $9.5 million to $10 million with total for the year similar to 2014Expect mortgage-banking revenues and mortgage lending volumes in 2015 to be similar to 2014. Expect modestly lower service charges on deposits (continued decline in NSF occurrences and related fees) and lower other non-interest income (due to decline in rental income on ORE properties). Expect higher interchange revenue (due to full year under new debit card brand agreement). 2Q’15 Update: Actual non-interest income of $11.0 million. Includes $1.2 million impairment charge recovery on MSR’s. Non-interest expense Forecasted quarterly range of $21 to $22 million with full year low to mid-single digit % decline vs. 2014The expected decline in non-interest expenses compared to 2014 is primarily concentrated in compensation and benefits, occupancy and equipment and loan and collection costs. This reflects the branch consolidation, staffing reductions and reduced levels of non-performing assets and watch credits. The reduced expenses are expected to be concentrated in the last three quarters of 2015. 2Q’15 Update: Actual non-interest expense of $21.6 million. Income taxes Approximately 31% to 32% in 2015. 2Q’15 Update: Actual effective income tax rate of 31.8%. 18 (1) Outlook as of 7/26/15
Strategic Initiatives Balance SheetGenerate quality loan growth with continued focus on commercial and consumer installment lending as well as salable mortgage loans.Remain asset sensitive and positioned to benefit from higher interest rates (short duration investment portfolio, large variable rate loan portfolio and strong core deposit base with a significant amount of small to medium balance transaction accounts).Prudent capital management. Target TCE ratio – 10% to 11% near-term / 9% to 10% long- term. Priorities are: (A) capital retention to support (1) organic growth and (2) acquisitions; and (B) return of capital through (1) strong and consistent dividend and (2) share repurchase.Share repurchase plan approved for up to 5% of outstanding common shares. 207K shares repurchased in 2Q’15 (71K shares repurchased in 1Q’15). In total have bought back 1.2% of outstanding common shares.Current cash dividend rate on common stock of six cents per share. Income StatementGenerate increased net interest income through change in earning asset mix (increased loans to deposits ratio and reduced level of investment securities).Increase non-interest income with focus on transaction related revenue (treasury management and debit card) and mortgage banking revenue.Continued reductions in non-interest expenses (credit related costs, branch optimization, process re-engineering and outsourcing).Improved efficiency ratio: 75% near-term (six to12 months); 70% mid-term (18 to 24 months) and 65% longer-term (over 24 months). Achieve improvements through combination of revenue growth and expense reductions. Enterprise Risk ManagementContinued asset quality improvements.Meet increased compliance and regulatory requirements.Focus on data security and loss prevention. 19

Independent Bank Corporation2nd Quarter 2015 Earnings Conference Call Question and Answer SessionClosing RemarksThank you for attending !NASDAQ: IBCP 20