 February 1, 2011 Le Parker Meridien, New York H.B. Fuller Analyst and Investor Day July 14, 2011 Exhibit 99.2 |
 Today’s Agenda 1. Growth Strategy 2 3. Europe Transformation Steve Kenny Sr. VP, EIMEA 4. Financial Targets Jim Giertz Sr. VP & CFO Barry Snyder VP & CTO Traci Jensen VP, North America Adhesives Kevin Gilligan VP, Asia Pacific 2. Innovation and Market Opportunities Jim Owens President & CEO |
 Safe Harbor & Regulation G Safe Harbor Statement Certain matters discussed today may include 'forward looking statements' as that term is defined under the Private Securities Litigation Reform Act of 1995. Since such statements reflect our current expectations, actual results may differ as they are subject to the kinds of risks that are enumerated in the Company’s Securities and Exchange Commission (SEC) filings. The Company disclaims any obligation to subsequently revise any forward-looking statements to reflect actual events or circumstances after the date of such statements. Regulation G During today’s meeting, we will be discussing certain non-GAAP financial measures, specifically, operating income, earnings before interest, taxes, and depreciation and amortization expense (EBITDA), and return on invested capital(ROIC). Operating income is defined as gross profit less SG&A expense; EBITDA is defined as gross profit less SG&A expense, plus depreciation and amortization; adjusted financials are defined according to the earnings release issued; and ROIC is defined as Operating Income less Taxes Plus Equity Earnings divided by Debt plus Equity. Management believes that a discussion of these measures is useful to investors because it assists in understanding the operating performance of the Company and its operating segments and in understanding the comparability of results. The non-GAAP information discussed may not be consistent with the methodologies used by other companies. All non-GAAP information is reconciled with reported GAAP results on the last pages of this presentation. Additional Information For more information, please refer to our 10-Q filings of March 28, 2011, June 24, 2011, and annual report for the year ended November 27, 2010, on form 10K, filed with the Securities and Exchange Commission; all of which are available on our website at www.hbfuller.com under the “Investor Relations” section. 3 |
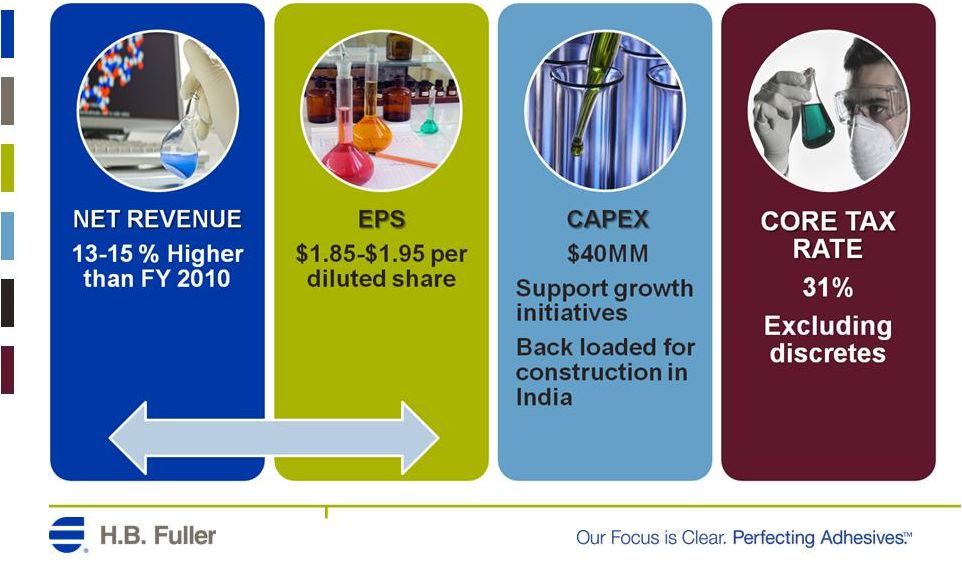
 Our Transformation Continues 4 •2006 – 2007: New pricing tools developed Cost structure addressed Margins improved • 2008 – 2009: New talent acquired Organize for growth Manage through recession Where We Were 2006 - 2009 Where We Are 2010 - 2011 • 2010: Top line up 10% EPS + 9% 2011: Revenue growth of 13-15% Operating income up 25% EPS moves from $1.60 to $1.85-$1.95 Controlled investment continues Profitability improved • Focus Areas: Revenue and profit growth Innovation delivery Continued investment for growth Cash deployment Metrics Defined; Organic Growth 5-8% EBITDA – 14-16% EPS Growth – 15% ROIC – 15% Note: (1) Income from continuing operations before cumulative effect of accounting change per diluted share. (2) EBITDA is a non-GAAP financial measure defined as gross profit less SG&A expense plus depreciation expense plus amortization expense. (3) Return on Invested Capital(ROIC) is defined as gross profit less SG&A expense less (1-tax rate) plus equity earnings divided by Debt plus Equity. Please refer to the Company’s Form 10-K statements for more detailed information. Where We Are Going 2012 – 2015 |
 Stock Price Appreciation Increase revenue from $1.4 billion to $2.0 billion Improve EBITDA margin from 10.9% to 15% 5 Year Revenue EBITDA Margin EBITDA $ EBITDA Multiple Stock Price EPS 2010 $1.4 Billion 10.9% $148 M 7X EBITDA $18-$24 $1.60 EPS 13X EPS 2015 $2.0 Billion 15 % $300 M 7 - 9X EBITDA $44-$52 $3.60 EPS 12-18X EPS $43-$65 |
 Growth Organic growth of 5-8% per year Gain share in targeted market segments Invest in and leverage market and sales expertise Expand geographically in Asia/Middle East/Latin America Commercialize innovative solutions EBITDA Margin Improvement Move from 10.9% to 15% EBITDA margin Execute EIMEA transformation Accelerate growth and leverage infrastructure in Asia Pacific and Latin America 6 Execution of these two priorities doubles EBITDA from $148 million in 2010 to $300 million in 2015. Strategic Priorities |
 $40 Billion global market 80 different market segments H.B. Fuller operates in 22 Segments Market growth rates vary from 1% to 9% Some sub-segments/ applications have much higher rates of growth Global Adhesive Market Summary 7 |
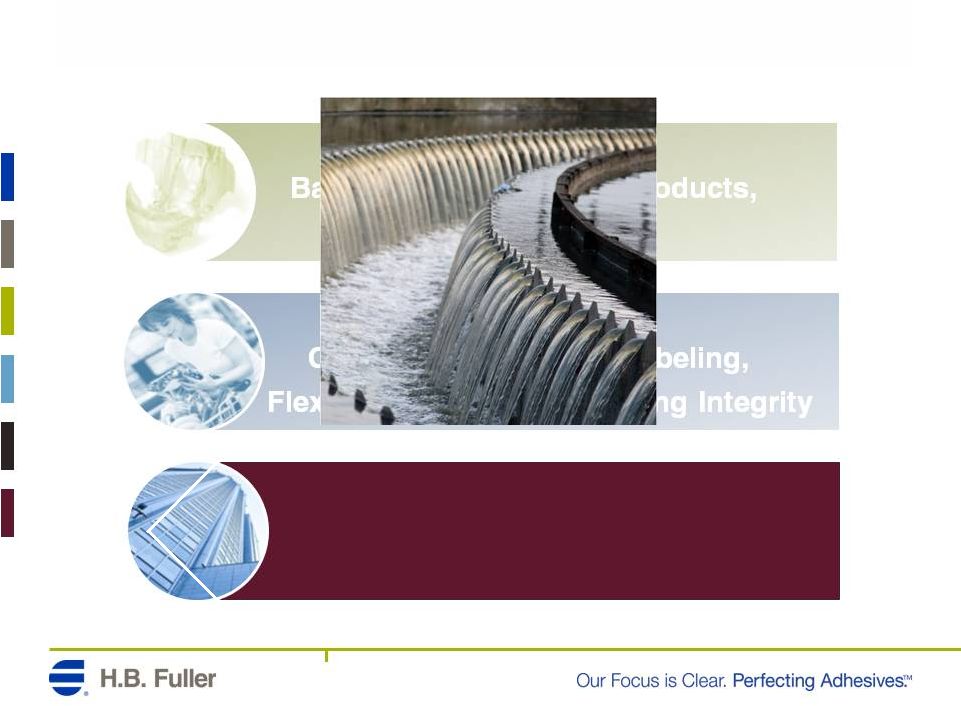
    Targeted Growth: Key Markets – 8 HYGIENE Baby diapers, Feminine products, Adult incontinence PACKAGING Consumer Packaging, Labeling, Flexible Packaging, Packaging Integrity DURABLE ASSEMBLY Water Filters, Panel Assembly, Engineered Textiles, Insulating Glass |
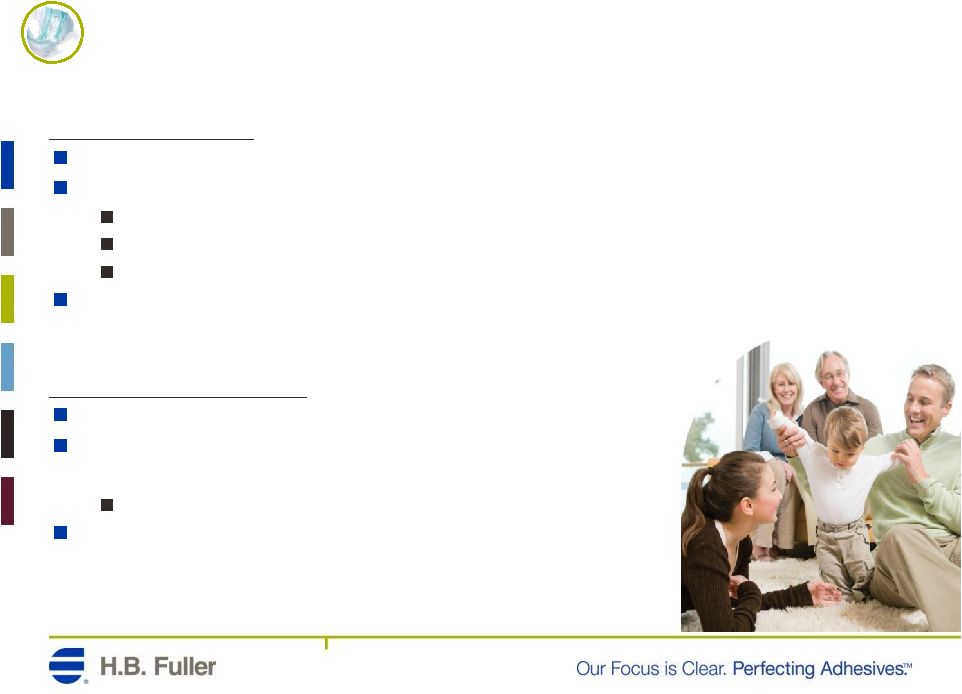 Attractive Market Market growth accelerating and above global GDP Changing product design drives changes in adhesives Stretch materials Thinner products Customized products for low-cost market segments Limited competition capable of delivering product, innovation and technical support H.B. Fuller’s Strength Global alliances with leading multinationals Innovator with broadest platform of adhesive technology A leader in polyolefin adhesive technology Regional expertise supporting regional and local manufacturers 9 Hygiene Opportunity |
 10 Hygiene Capturing the Opportunity China facility Further investments planned “Be where the babies are” Egypt acquisition India plant Product and supply chain innovation Unparalleled support through recent supply shortages Formulating flexibility unmatched in industry Leverage global raw material supply Win through innovation on “Big Opportunities” Work with multi-nationals as platforms and products evolve Align with raw material providers to develop solutions Support start-ups in emerging economies Help customers drive speed and output of their production lines |
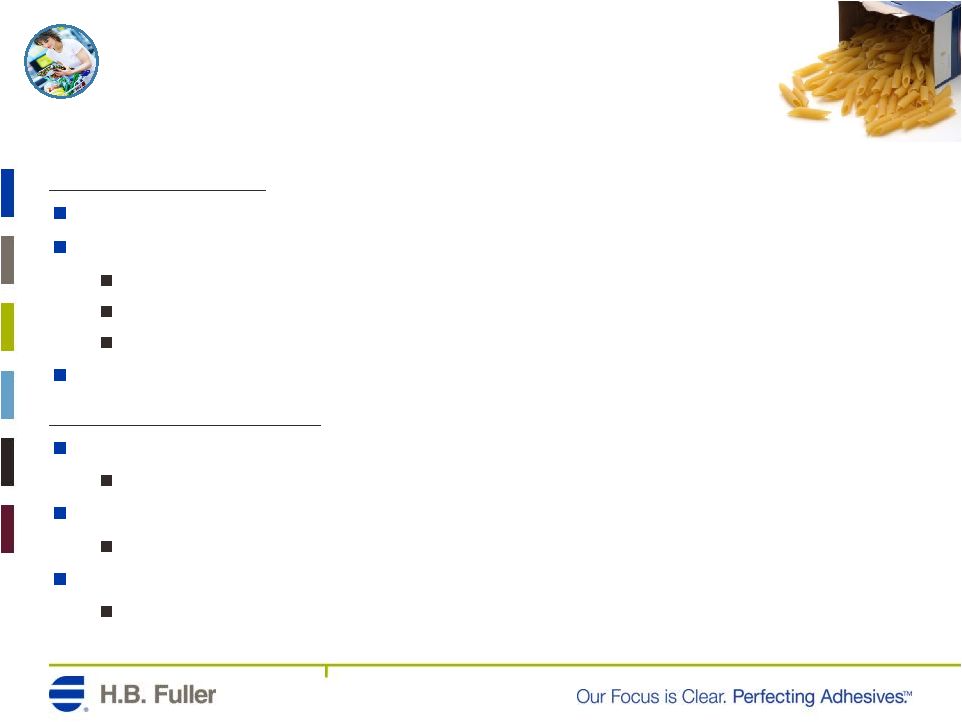 11 Attractive Market Market growth above global GDP as consumers move to packaged goods Changing market demands drive changes in adhesives Sustainable packages Reduced packaging Attractive package design Move toward global, technically superior solutions H.B. Fuller’s Strength End-of-line packaging Technology leader, superior service provider, unparalleled global/local coordination Adalis reinforcement products offer improved performance with less material Reduced packaging amount (sustainability) and cost Market penetration opportunities in labeling and flexible packaging H.B. Fuller has technology and Infrastructure Packaging Opportunity |
 Specialized solution through innovation Liquamelt ® adhesive system Advantra Encore™ adhesive Flextra Quiet™ adhesive EZ open tape Global leverage Global account management Innovation launches OEM relationships Raw material supply Supply chain Service model with local expertise Delivering productivity improvements on our customers’ packaging lines 12 Packaging Capturing the Opportunity |
 Attractive Market Requires high performing, highly specified adhesives Changing product design drives changes in adhesives Lighter weight, more complex composite materials Sustainability trends Environmental trends Strong R&D combined with technical know-how and segment expertise H.B. Fuller’s Strength World leader in reactive hot melt technology Offers strong adhesive performance at high production speeds Market segment expertise Water filters, insulated glass, structural panels, door/floor productivity Broad palette of technological solutions 13 Durable Goods Assembly Opportunity |
 14 Leverage reactive hot melt technology capability Strong patent portfolio Only manufacturer producing on three continents Formulating expertise Identify market trends and specify new innovations Water filter advances North America residential glazing New regulations leading to changes in window design Panel/Door trends Higher throughput on automated lines Reduced use of solvented adhesives Select projects in high growth markets Electronics Solar Durable Goods Assembly Capturing the Opportunity |
 15 2010 Revenue Target 2015 Revenue HBF CAGR 2010 Market Size Value Proposition Hygiene $250 $420 10-12% $1,100 Partner with growing market leaders to enable innovation Packaging $290 $490 10-12% $2,500 Local service through global infrastructure Durable Assembly $300 $500 10-12% $2,000 Specified adhesives for high performing applications Construction Materials and Other Adhesives $516 $590 2-3% $1,356 $2,000 8% H.B. Fuller’s Growth Plan • $40 Billion Market • Targeted focus on attractive market segments that leverage H.B. Fuller’s strengths *All amounts in $ millions, except percentages (1) HBF targeted market, excluding Japan 1 |
 16 2010 EBITDA% 2015 EBITDA% 2010 EBITDA 2015 EBITDA Margin Improvement Actions North America 17% 17% $95 $128 Maintain strong margin in North America Adhesives Europe, India, Middle East, Africa 7% 14% $28 $92 Detailed transformation initiative Asia Pacific 6% 14% $9 $42 Grow into cost structure Latin America 7% 12% $16 $38 Improve GM% in LA Adhesives and manage cost structure in Central America Paints H.B. Fuller 1 10.9% 15% $148 $300 EBITDA Margin Improvement *All amounts in $ millions, except percentages (1) 2010 results adjusted for PS exit |
 17 EBITDA Margin Improvement 2010 EBITDA% 2015 EBITDA% 2010 EBITDA 2015 EBITDA Margin Improvement Actions North America 17% 17% $95 $128 Maintain strong margin in North America Adhesives Europe, India, Middle East, Africa 7% 14% $28 $92 Detailed transformation initiative Asia Pacific 6% 14% $9 $42 Grow into cost structure Latin America 7% 12% $16 $38 Improve GM% in LA Adhesives and manage cost structure in Central America Paints H.B. Fuller 1 10.9% 15% $148 $300 *All amounts in $ millions, except percentages (1) 2010 results adjusted for PS exit North America Strong brands Strong products Strong team |
 18 EBITDA Margin Improvement 2010 EBITDA% 2015 EBITDA% 2010 EBITDA 2015 EBITDA Margin Improvement Actions North America 17% 17% $95 $128 Maintain strong margin in North America Adhesives Europe, India, Middle East, Africa 7% 14% $28 $92 Detailed transformation initiative Asia Pacific 6% 14% $9 $42 Grow into cost structure Latin America 7% 12% $16 $38 Improve GM% in LA Adhesives and manage cost structure in Central America Paints H.B. Fuller 1 10.9% 15% $148 $300 *All amounts in $ millions, except percentages (1) 2010 results adjusted for PS exit EIMEA Multi-year multi-step profit improvement initiative Drive complexity from the business Capital expenditures and other investments for productivity Extend growth momentum |
 19 EBITDA Margin Improvement 2010 EBITDA% 2015 EBITDA% 2010 EBITDA 2015 EBITDA Margin Improvement Actions North America 17% 17% $95 $128 Maintain strong margin in North America Adhesives Europe, India, Middle East, Africa 7% 14% $28 $92 Detailed transformation initiative Asia Pacific 6% 14% $9 $42 Grow into cost structure Latin America 7% 12% $16 $38 Improve GM% in LA Adhesives and manage cost structure in Central America Paints H.B. Fuller 1 10.9% 15% $148 $300 *All amounts in $ millions, except percentages (1) 2010 results adjusted for PS exit Asia Pacific Leverage investments in technical center, ex-pats, Malaysia acquisition and Nanjing plant Grow into cost structure Reduce SG&A by 500 basis points Continued investment in local customer facing resources |
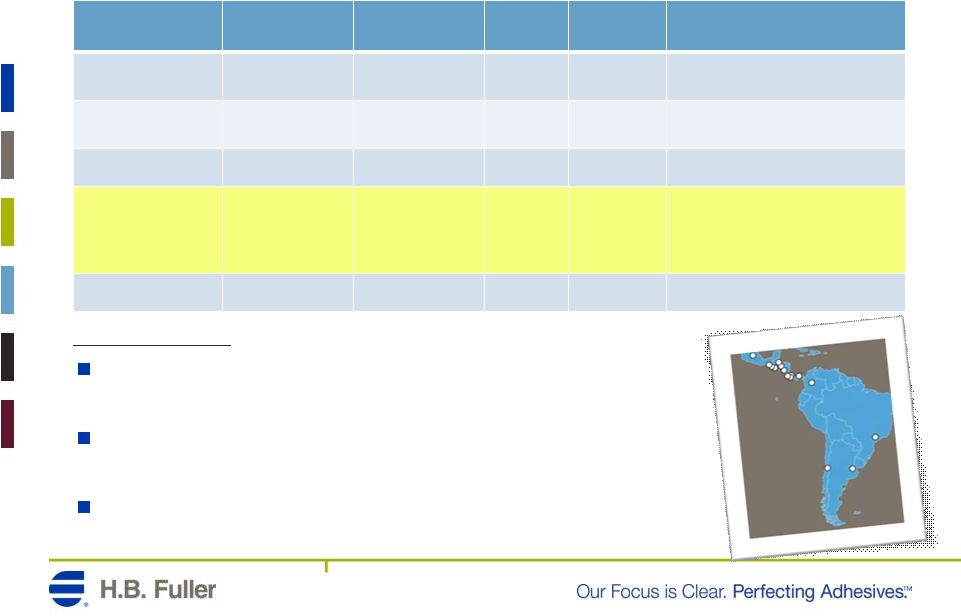 20 EBITDA Margin Improvement 2010 EBITDA% 2015 EBITDA% 2010 EBITDA 2015 EBITDA Margin Improvement Actions North America 17% 17% $95 $128 Maintain strong margin in North America Adhesives Europe, India, Middle East, Africa 7% 14% $28 $92 Detailed transformation initiative Asia Pacific 6% 14% $9 $42 Grow into cost structure Latin America 7% 12% $16 $38 Improve GM% in LA Adhesives and manage cost structure in Central America Paints H.B. Fuller 1 10.9% 15% $148 $300 *All amounts in $ millions, except percentages (1) 2010 results adjusted for PS exit Latin America Improve gross margin in Latin America Adhesives by 300 basis points Reduce operating expenses in Central America Paints by 300 basis points Grow in Brazil and Mexico |
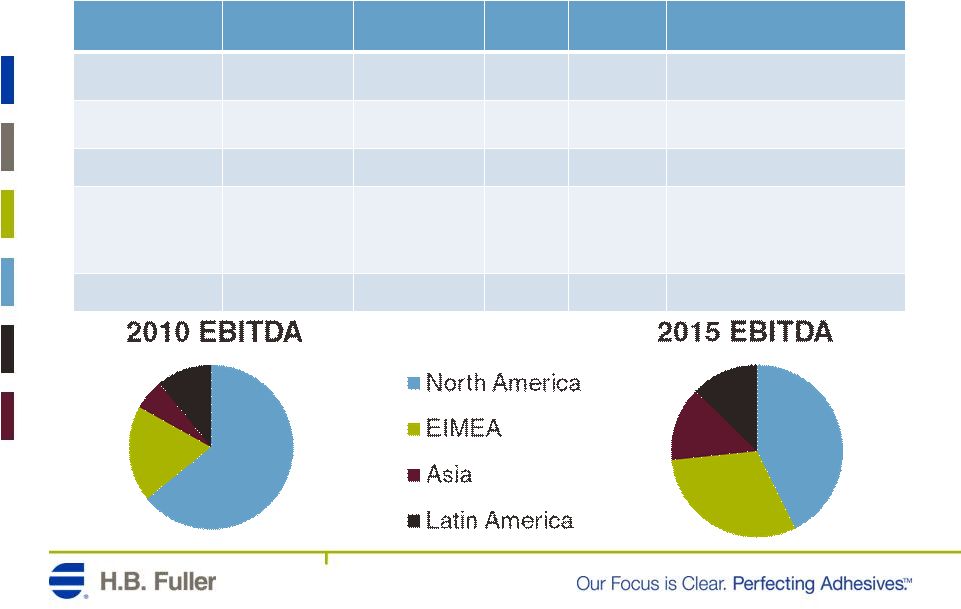 21 2010 EBITDA% 2015 EBITDA% 2010 EBITDA 2015 EBITDA Margin Improvement Actions North America 17% 17% $95 $128 Maintain strong margin in North America Adhesives Europe, India, Middle East, Africa 7% 14% $28 $92 Detailed transformation initiative Asia Pacific 6% 14% $9 $42 Grow into cost structure Latin America 7% 12% $16 $38 Improve GM% in LA Adhesives and manage cost structure in Central America Paints H.B. Fuller 1 10.9% 15% $148 $300 EBITDA Margin Improvement *All amounts in $ millions, except percentages (1) 2010 results adjusted for PS exit |
 Growth Organic growth of 5-8% per year Gain share in targeted market segments Invest in and leverage market and sales expertise Expand geographically in Asia/Middle East/Latin America Commercialize innovative solutions EBITDA Margin Improvement Move from 10.9% to 15% EBITDA margin Execute EIMEA transformation Accelerate growth and leverage infrastructure in Asia Pacific and Latin America 22 Execution of these two priorities doubles EBITDA from $148 million in 2010 to $300 million in 2015. Strategic Priorities |
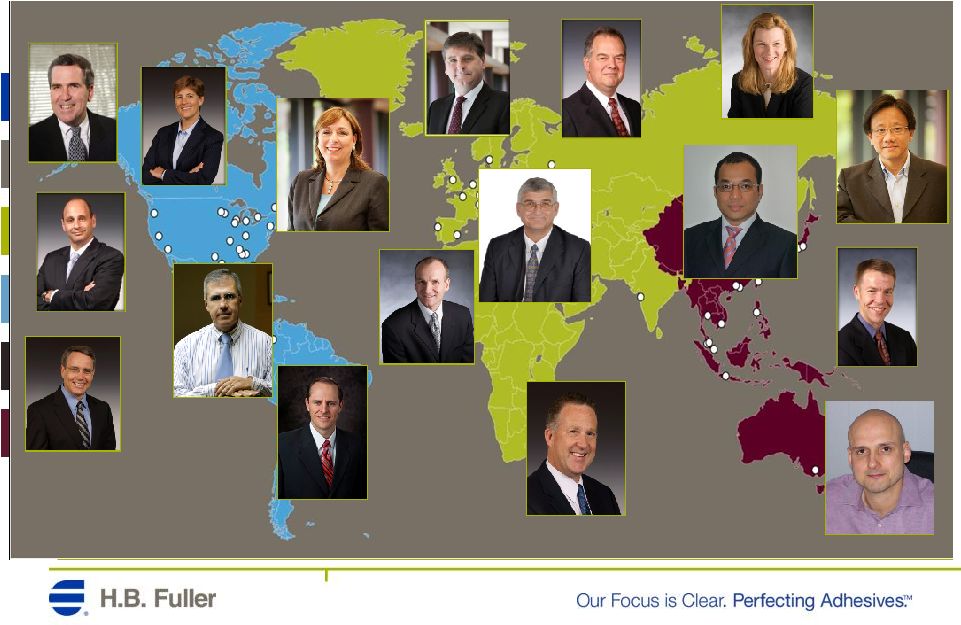 Strong, Experienced Leadership 23 |
 What’s Different? Opportunity clearly identified Solid plan developed Execution capability 24 |
 February 1, 2011 QUESTIONS AND DISCUSSION July 14, 2011 |
 Innovation at H.B. Fuller July 14, 2011 |
 Barry Snyder Vice President and Chief Technology Officer Traci Jensen Vice President, North America Adhesives 2 Kevin Gilligan Vice President, Asia Pacific |
 Innovation at H.B. Fuller Innovation at H.B. Fuller is about leveraging our expertise and market knowledge to commercialize value-added adhesives solutions for our customers. 3 |
 Targeted Growth: Key Markets – 4 HYGIENE Baby diapers, Feminine products, Adult incontinence PACKAGING Consumer Packaging, Labeling, Flexible Packaging, Packaging Integrity DURABLE ASSEMBLY Water Filters, Panel Assembly, Engineered Textiles, Insulating Glass |
 5 PACKAGING Consumer Packaging, Labeling, Flexible Packaging, Packaging Integrity DURABLE ASSEMBLY Water Filters, Panel Assembly, Engineered Textiles, Insulating Glass |
  6 PACKAGING Consumer Packaging, Labeling, Flexible Packaging, Packaging Integrity DURABLE ASSEMBLY Water Filters, Panel Assembly, Engineered Textiles, Insulating Glass |
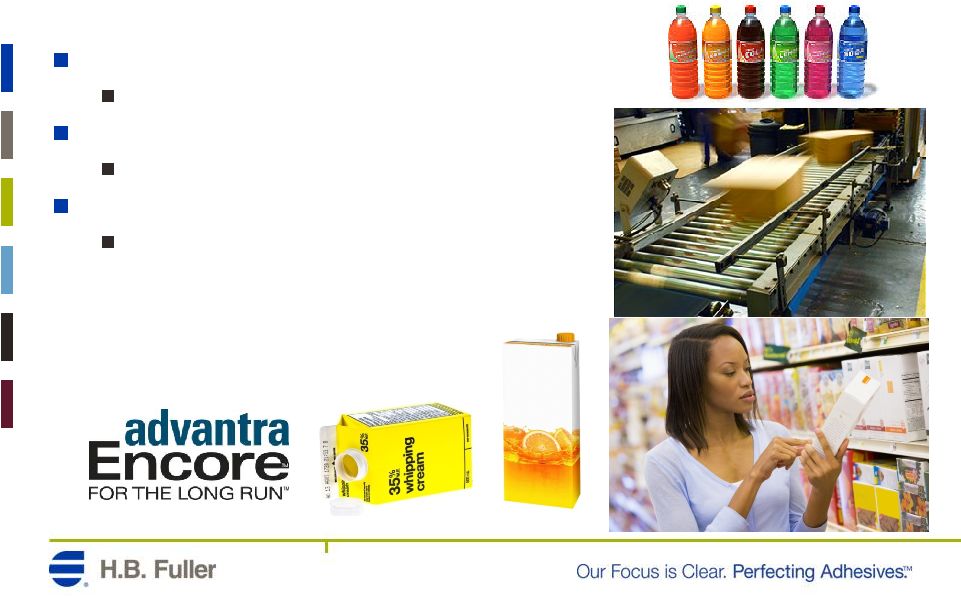 Hot Melt Adhesive Innovation 7 Simplicity Reduce adhesive complexity Security Bond under wide range of conditions Savings Reduce adhesive consumption and inventory |
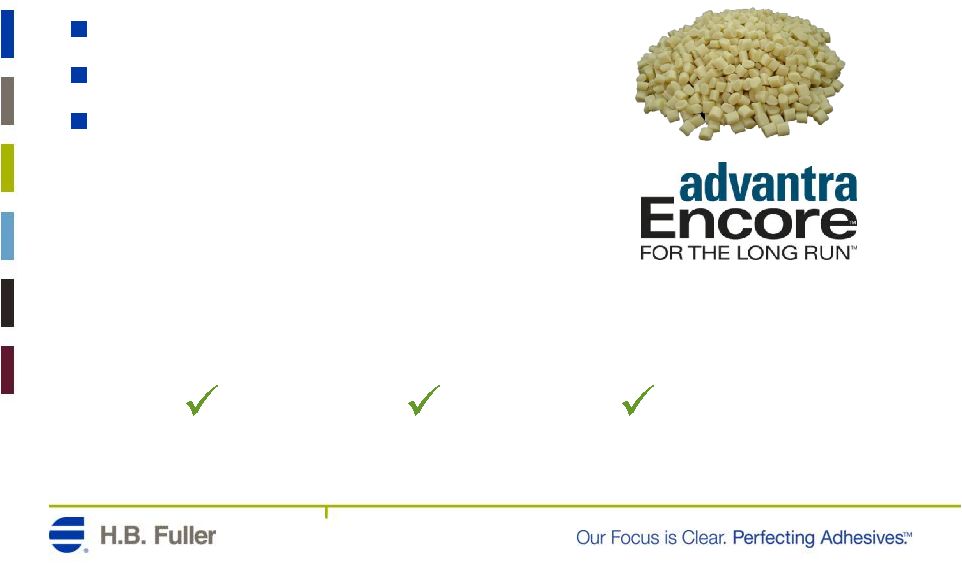 Advantra Encore Adhesive Simplicity Two years in the making Breakthrough polymer technology Reduced reliance on scarce raw materials 8 Security Savings TM |
 9 HYGIENE Baby diapers, Feminine products, Adult incontinence PACKAGING Consumer Packaging, Labeling, Flexible Packaging, Packaging Integrity Engineered Textiles, Insulated Glass |
 10 Cool on Delivery – Hot on Demand Lower Production costs Addresses Sustainability |
 Solving Customers’ Problems 11 Clean vs. Charred Nozzle (not Liquamelt® equipment) Charred Hose |
 12 Cool on Delivery – Hot on Demand Lower Production costs Addresses Sustainability |
 Customer-focused Innovation “Liquamelt ® has great potential for becoming the next step-change in improving performance and optimizing cost above and beyond the performance of the current packaging adhesives and existing dispensing equipment.” 13 |
  14 PACKAGING Consumer Packaging, Labeling, Flexible Packaging, Packaging Integrity DURABLE ASSEMBLY Water Filters, Panel Assembly, Engineered Textiles, Insulated Glass |
 The first compostable flexible package Drive for environmentally friendly packaging Materials usage reduction Sustainable materials Industry Changes Demand Innovation 15 • 2009 : Sun Chips package introduced • Noisy package challenge • Many attempts to reduce noise Polylactic acid films introduced 2003 Plant derived |
 Adhesives Do More Than Bond Flextra Quiet • The Adhesive Shock Absorber • Bonds and reduces noise • Commercialized February 2011 16 TM Film Film Adhesive |
 17 DURABLE ASSEMBLY Water Filters, Panel Assembly, Engineered Textiles, Insulating Glass |
 Insulating Glass (IG) – What is It? What Is IG? An insulating panel that provides a vision space Used in windows, doors, and skylights Elements 1. Float Glass 2. Desiccant 3. Perimeter Seal 4. Barrier Seal 5. Spacer 18 |
 Insulating Glass 19 Energy conservation leading to greater use of insulating glass Developing world in particular accessing trend China’s latest 5 year plan Stronger regulation in developed world supporting differing approaches to insulating glass assembly In US, DOE upgraded Energy Star rating in 2010 In Europe, EU 20-20-20 plan – energy reduction of 20 percent by 2020 |
 Insulating Glass – H.B. Fuller Solutions H.B. Fuller is recognized for enabling more productive and higher thermally efficient IG production Examples of solutions provided by HBF Reactive hot melt sealant – Breakthrough performance capability compared to traditional sealants Intercept technology – Sealant and desiccating matrix system enabled leading process to make residential IG in NA, increased productivity by 100%, warm edge solution Super Spacer – Supported most thermally efficient means of constructing IG Recent development – Collaboration with industry partners to develop a new, structurally sound, lower cost, warm edge spacer system 20 When solutions are required, industry partners come to H.B. Fuller |
 21 DURABLE ASSEMBLY Water Filters, Panel Assembly, Engineered Textiles, Insulating Glass |
 Markets Desalinization/ Municipality Industrial/ Energy Residential Medical Liquid Separation Market Overview 22 |
 Water Filter Adhesive Application Filter bundle (capillaries) Filter housing Potting adhesive location |
 Customer Issues Productivity Faster processing Flexibility for use with multiple filters and process lines Performance Higher heat and chemical resistance Adhesion to new membrane media 24 |
 Liquid Separation Illustration Situation Large desalination filter manufacturer in Asia Looking to increase capacity and improve quality H.B. Fuller solution Productivity – Cycle time improvement increasing capacity by 25% Industry credibility – NSF certification Speed Collaboration – Asia Pacific application engineers working closely with chemists in Shanghai and Saint Paul 25 |
  26 HYGIENE Baby diapers, Feminine products, Adult incontinence |
 Hygiene Market Overview 449 billion units in 2010 Baby Diapers Feminine Care Adult Incontinence Baby Diaper Usage Developed economies 56 billion diapers per year Developing economies Current 65 billion diapers Potential 535 billion 27 |
 Diaper Usage Worldwide 28 2,000 diapers per year in developed economies Babies outside developed economies use less than one diaper per day |
 1 2 3 4 6 7 8 9 10 Deconstruction of a Diaper Core (incl. SAP) “Cotton Ball” Fluff pulp material Outside film “Beads” are suspended within material 10 adhesive applications per diaper Core stabilization drives thinner finished product Core stabilization adhesive |
 Thin Leads to Sustainability Reduction of Carbon Footprint 30 |
    Targeted Growth: Key Markets – 31 PACKAGING Consumer Packaging, Labeling, Flexible Packaging, Packaging Integrity HYGIENE Baby diapers, Feminine products, Adult incontinence DURABLE ASSEMBLY Water Filters, Panel Assembly, Engineered Textiles, Insulating Glass |
 February 1, 2011 QUESTIONS AND DISCUSSION July 14, 2011 |
 February 1, 2011 Europe, India, Middle East and Africa July 14, 2011 |
 EIMEA 2 Steve Kenny Senior Vice President, EIMEA |
 We have a problem in EIMEA . . . . Our foundation is strong We participate in the right market segments We don’t have “non core” businesses We are a pure play in industrial adhesives, aligned with corporate strategy But . . . .We have some portfolio gaps Strong in north Europe, weaker in the south Catching up in emerging markets Need to accelerate growth in core packaging segment But our biggest gap is profitability We are underperforming relative to internal and external benchmarks 3 |
 We’ve already taken some actions Changes since 2008 include: Re-focused our strategy toward value and innovation New leadership team New organization structure with market focus Strengthened the commercial team Organic growth momentum re-established Exited non-strategic business lines Invested in emerging markets But we have much more to do . . . . . 4 |
 Delivering our transformation Goals: Achieve minimum Corporate profitability target of 14% EBITDA margin Create sustainable and scalable platform Strengthen emerging market position and accelerate growth in key market segments Approach: Over the next 2 ½ years, undertake comprehensive overhaul of every core process in the region to achieve scale and efficiency Everything is on the table: Procurement (What we buy) Product lineup (What we make) Production network (Where and how we make it) Commercial strategy (Who we sell to and how we sell) 5 |
 First, a little more background on our business Look at our business relative to our more successful sister organization in North America Some common characteristics: Pursue the same strategy of selling value solutions to customers Identical focus on strategic market segments of hygiene, packaging and durable assembly Sell the same products Primary differences include: Long term growth potential of EIMEA higher due to emerging markets EIMEA region more diverse and complex Profit !! 6 |
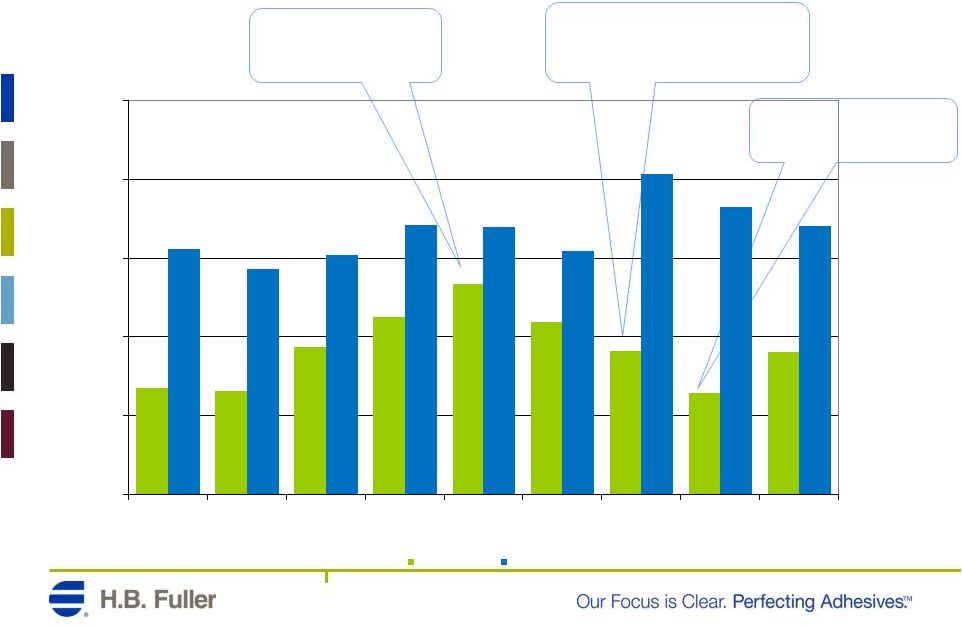 0.0% 5.0% 10.0% 15.0% 20.0% 25.0% 2003 2004 2005 2006 2007 2008 2009 2010 2011 OL EIMEA EBITDA % NAA EBITDA % EBITDA margin progression 7 Price increases and strict cost control Recession and lack of action on costs / Weaker pricing relative to NAA Raw material spikes and SG&A investment |
 In short . . . .. We do all the same things as North America adhesives business at a slightly higher cost and with a suboptimal result Costs more to buy, Costs more to make, Costs more to distribute, Costs more to sell, Costs more to administer. Common theme in EIMEA business structure is complexity Complexity interfered with our ability to respond to raw material inflation spikes and global recession Complexity hindered quick implementation of new strategy 8 |
 So, the FIX . . . . . Avoid superficial improvements in favor of sustainable and scalable change Our approach will have three key areas of focus : 9 How and what we buy How we make and deliver product How we go to market |
 How and what we buy Primary focus today is on raw materials and packaging Excessive complexity hindering purchasing leverage 30% of materials purchased deliver >80% of our profitability Streamline for leverage…..clean up our formulations & SKUs Develop larger scale platform products Alternate solutions for our small item tail 10 -20% -40% |
 How we make and deliver product Less than 20% of the formulations account for over 90% of our margin Excessive complexity Reduced labor and capital efficiency due to frequent changeovers Sub-optimal process cycles Poor service levels Higher freight and logistics costs 11 |
 How we go to market Primary sales channel is direct 80% of margin generated by less than 20% of customers “Standard” offer is effectively full service Differentially deploy where value is reflected in pricing Opportunities to enhance service experienced by customers leveraging alternate channels Distributor partners Tele-servicing 12 |
 Our financial commitments 13 * All amounts in € millions, except percentages (1) Adjusted for PS exit (2) 2011 outlook as base year Actual 1 Estimate Target 2010 2011 2014 CAGR 2 Net Revenue 301 350 425 7% EBIT 12 23 48 28% Depreciation & Amortization 7 7 11 EBITDA 19 30 59 25% EBIT Margin 4% 7% 11% EBITDA Margin 6% 9% 14% |
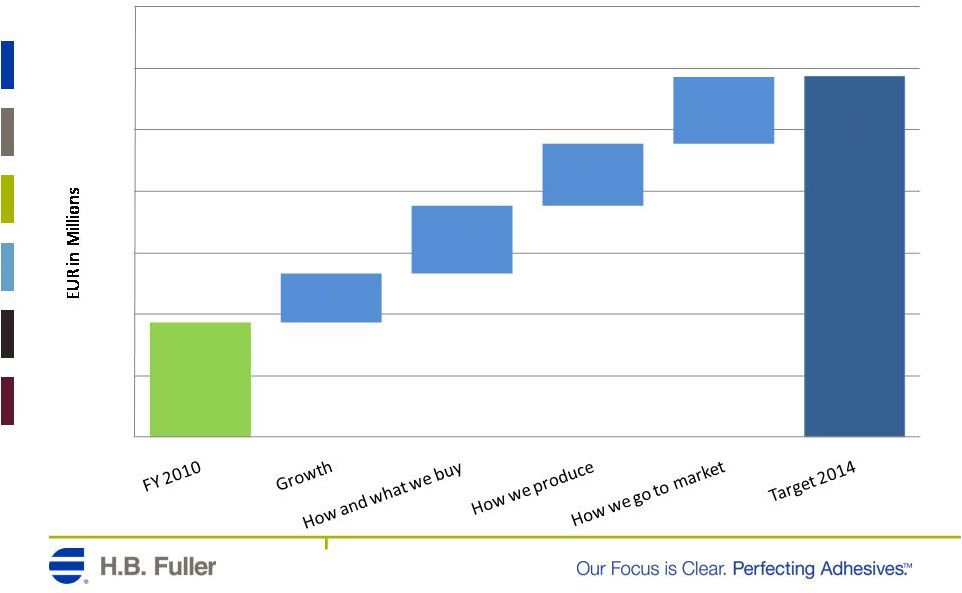 EBITDA bridge to 2014 14 2010 EBITDA is adjusted for PS exit 19 59 8 11 10 11 - 10 20 30 40 50 60 70 |
 Investments to achieve goals Cash investment over next 2 ½ years of about €50 million Capital expenditures and other investments to increase productivity Project staffing and support costs All process work complete by end of 2013 Fiscal year 2014 should be “clean” – new organization and cost structure in place and generating profitable growth at target levels 15 |
 Impact of proposed changes Impact of successful implementation of this transformation proposal is significant Cash investment of approximately €50 million returns incremental pre-tax cash flow of €30 million Profit improvement in EIMEA region is primary initiative to increase corporate consolidated profit profile Even at relatively conservative EBITDA multiples, transformation proposal could generate more than $200 million of incremental market capitalization for HB Fuller Other positive factors: Plan is funded with excess foreign cash that is currently idle Incremental profit in Europe has relatively low tax rate 16 |
 Just a few words about growth . . . We have a couple of significant growth opportunities Accelerating our business in the important emerging markets: The Middle East , Turkey and India Capturing our fair share of the packaging market opportunity across the entire region 17 |
 Emerging market opportunity Growth and demographics of emerging markets drive opportunity The babies are in the emerging markets Income growth drives sales of consumer goods such as diapers and beverages We are well positioned in Middle East and North Africa with our facility and organization in Egypt We have a strong position in Turkey Recently strengthened with integration of commercial team and enhanced logistics support network Greenfield production facility in India ready by end of fiscal year 18 |
 Packaging opportunity We are relatively under-represented in our core market segment of packaging Specific opportunities for EIMEA region include: Leverage the market trend toward flexible packaging Use proprietary technology to solve problems for bottle labeling Leverage global expertise and experience in all packaging segments 19 |
 Next steps . . .. . We have built preliminary, detailed proposals for the various process improvement initiatives of the transformation Need to consult with all key constituencies in the region Several key project initiatives can be pursued now with immediate positive impact We will report each quarter on our progress toward our commitments until our work is complete 20 |
 Summary and Recap Transformation agenda is comprehensive Will touch all core processes – How and what we buy, how we make and deliver product, how we go to market Focus on sustainable and scalable platform for the future Requires significant investment of cash and human resources but the benefit to the region and global organization is significant Commitment to 14% EBITDA margin for 2014 fiscal year At the same time, will continue growth momentum in key market segments and strategic geographies We will report on our progress every quarter as we complete our work 21 |
 QUESTIONS AND DISCUSSION |
 February 1, 2011 Finance Review July 14, 2011 |
 Finance Review 2 Senior Vice President and Chief Financial Officer Jim Giertz |
 Revised Financial Targets 3 Old Targets New* Targets ROIC *Base year is 2010 |
 Our Target Income Statement for 2015 2010 2015 CAGR Net Revenue 1,356 2,000 8% EBIT 106.9 245 18% Margin % 8% 12% EBITDA 148.1 300 15% Margin % 11% 15% EPS $1.60 $3.60 18% 4 |
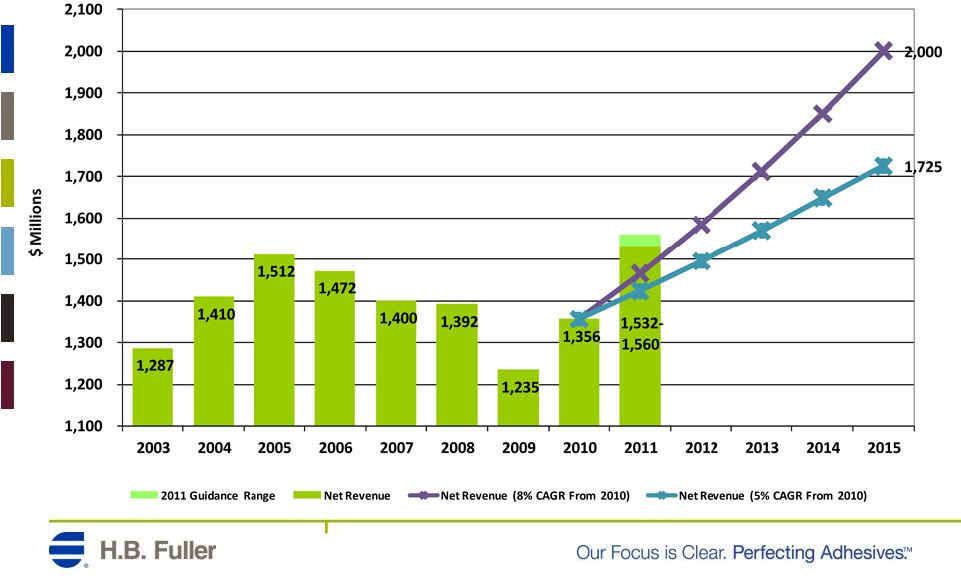 Revenue Growth 5-8% per annum 5 |
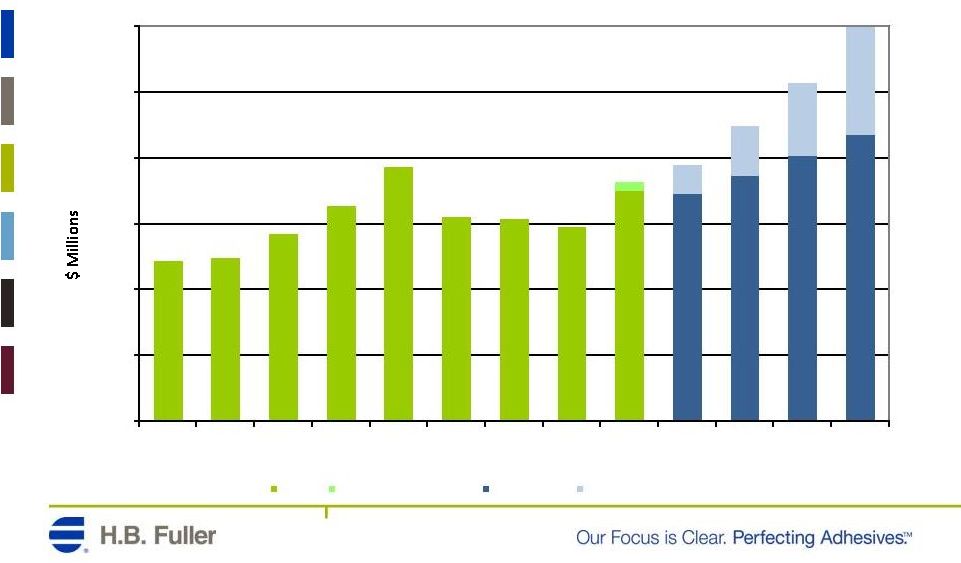
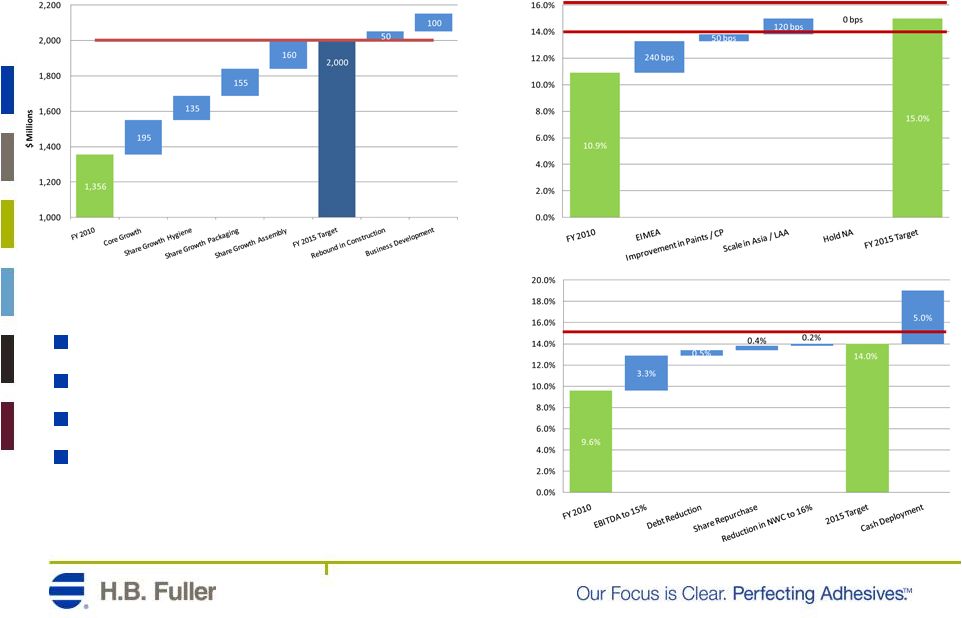
 Revenue Bridge 6 1,356 2,000 2,051 195 135 155 160 50 100 1,000 1,200 1,400 1,600 1,800 2,000 2,200 |
 0.0% 2.0% 4.0% 6.0% 8.0% 10.0% 12.0% 14.0% 16.0% 2003 2004 2005 2006 2007 2008 2009 2010 2011 2012 2013 2014 2015 EBITDA % 2011 Range EBITDA Progression EBITDA Margin History and Targets 15% by 2015 7 15% 0.0% 2.0% 4.0% 6.0% 8.0% 10.0% 12.0% 14.0% 16.0% 2003 2004 2005 2006 2007 2008 2009 2010 2011 2012 2013 2014 2015 EBITDA % 2011 Range EBITDA Progression |
 EBITDA Margin Bridge 8 10.9% 15.0% 240 bps 50 bps 120 bps 0 bps 0.0% 2.0% 4.0% 6.0% 8.0% 10.0% 12.0% 14.0% 16.0% |
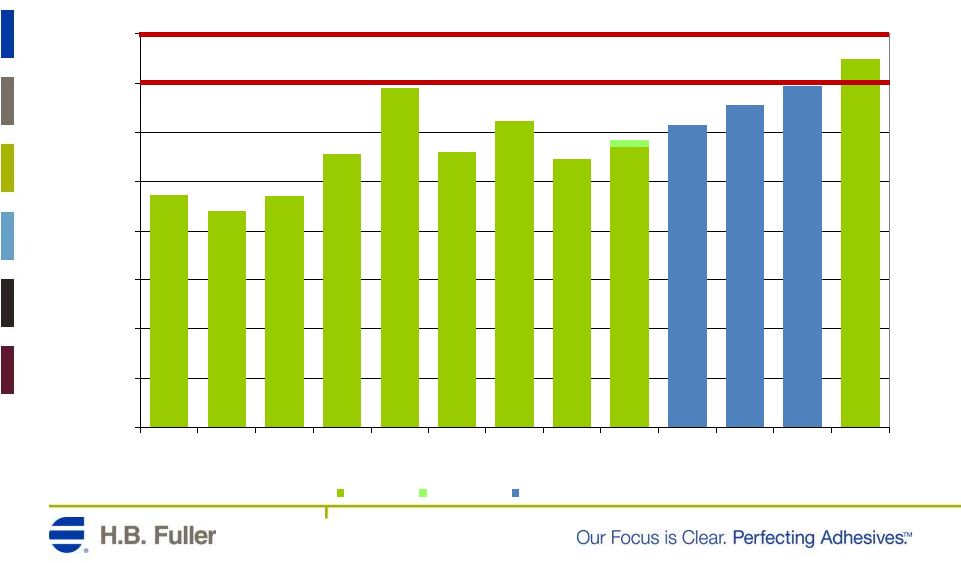
 EBITDA Progression 15% CAGR to 2015 9 218 300 - 50 100 150 200 250 300 2003 2004 2005 2006 2007 2008 2009 2010 2011 2012 2013 2014 2015 EBITDA 2011 EBITDA Guidance Range EBITDA Growth EBITDA Margin Expansion |
 ROIC: New Metric Introduced 10 |
 14.0% 5.0% 0% 2% 4% 6% 8% 10% 12% 14% 16% 18% 20% 2003 2004 2005 2006 2007 2008 2009 2010 2011 2012 2013 2014 2015 ROIC ROIC Estimate Cash Deployment ROIC History and Target 11 |
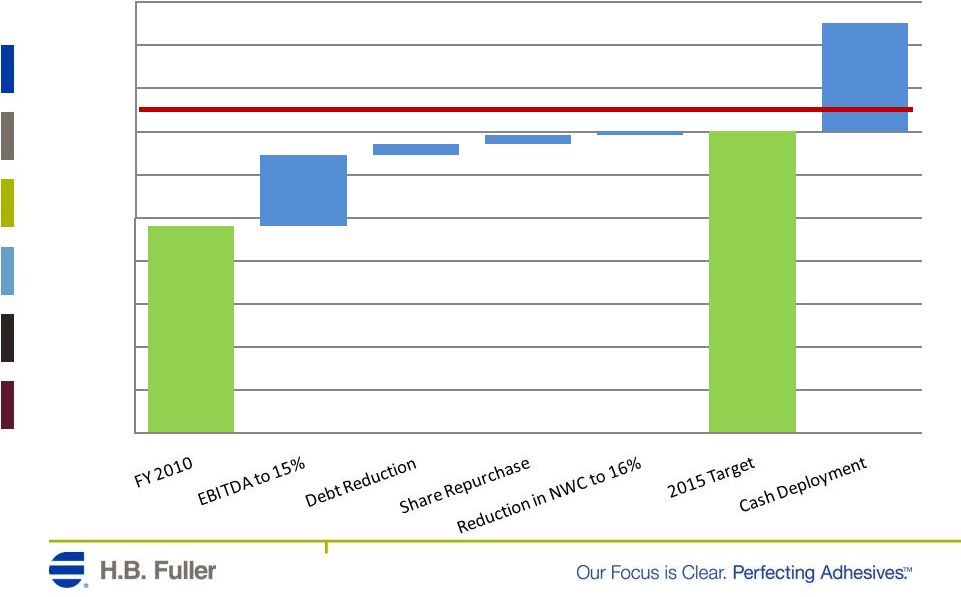 ROIC Improvement Bridge 12 9.6% 14.0% 3.3% 0.5% 0.4% 0.2% 5.0% 0.0% 2.0% 4.0% 6.0% 8.0% 10.0% 12.0% 14.0% 16.0% 18.0% 20.0% |
 Cash Deployment CapEx – 2.5% of net revenue plus $70M for the EIMEA transformation Share Repurchase – Base program to offset dilution from equity compensation Dividends – 20-25% of net income 13 *During the 2009 Fiscal year, HBF contributed $135M to pension plans, primarily in the United States |
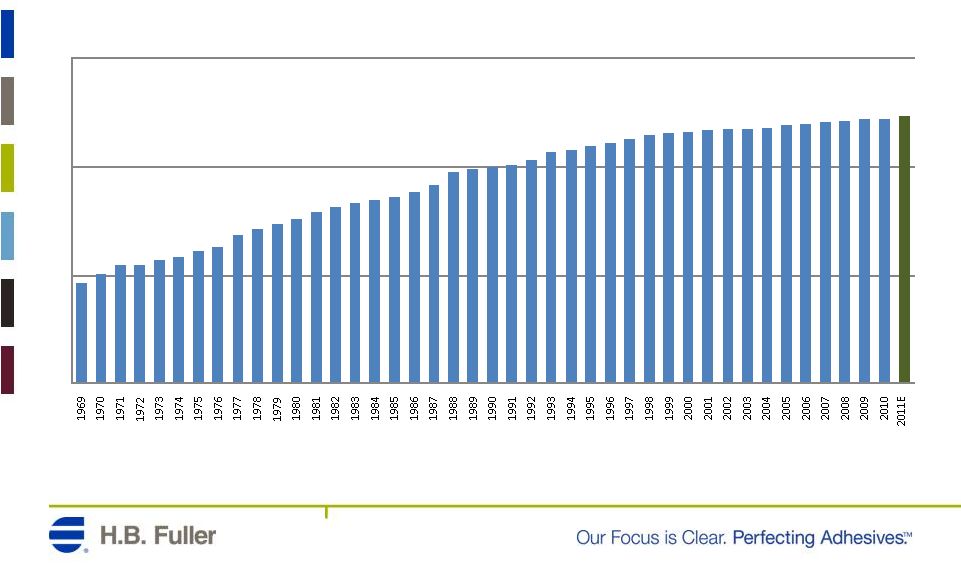 Dividend Target 20% to 25% of Net Income 14 29.5 0.1 1 10 100 Annual Dividends (cents per share) |
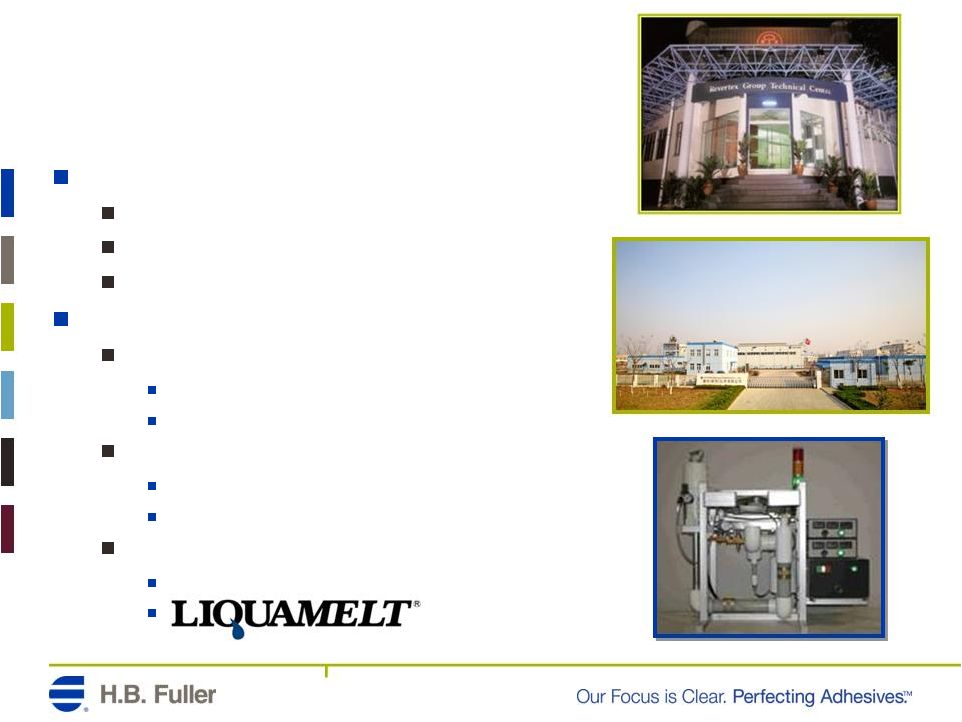 M&A Strategy Strong position to evaluate opportunities Confidence in existing business Avoid “target reaching” deals Enhance sound organic growth strategy Past strategic actions Geographic Egymelt (Egypt) Revertex Finewaters (Malaysia) Organic China (Reactive hot melt facility) India (Construction underway) Technology Nordic 15 Revertex Finewaters, Malaysia Reactive Facility, Nanjing China Liquamelt Adhesive System |
 Current 2011 Guidance 16 Additional Pricing Additional Pricing |
     FY 2011 Guidance 17 *All amounts in $ millions, except per share data 1H 2011 Net Revenue 733 799 826 1,532 1,560 EBIT 56 77 85 134 141 EBITDA 76 97 105 174 181 EPS 0.78 $ 1.07 $ 1.17 $ 1.85 $ 1.95 $ 2H 2011 Range FY 2011 Range |
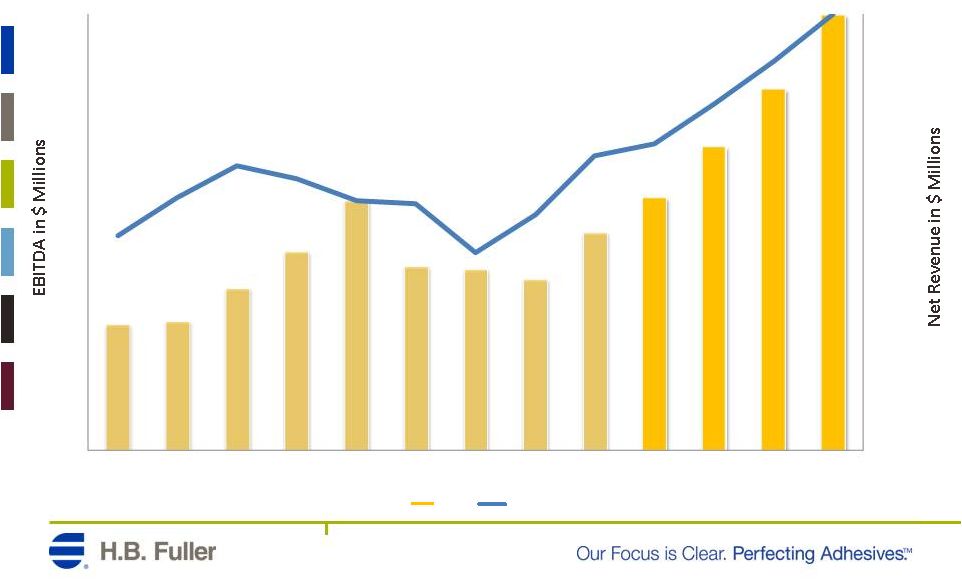 HB Fuller Historical Perspective 18 600 800 1,000 1,200 1,400 1,600 1,800 2,000 50 100 150 200 250 300 2003 2004 2005 2006 2007 2008 2009 2010 2011 2012 2013 2014 2015 EBITDA Net Revenue |
 Step Change Solid Foundation in Place Plans to Execute Fundamentally different HB Fuller Long-Term Commitments 19 |
 QUESTIONS AND DISCUSSION |
 Regulation G - ROIC 21 ROIC Calculation $ Millions except percentages 2003 2004 2005 2006 2007 2008 2009 2010 Net Revenue 1,287,331 1,409,606 1,512,193 1,472,391 1,400,258 1,391,554 1,234,659 1,356,161 Less: Cost of Goods Sold 935,135 1,036,961 1,113,142 1,052,508 981,555 1,027,099 863,358 957,149 Gross Profit 352,196 372,645 399,051 419,883 418,703 364,455 371,301 399,012 Less: SG&A Expense 284,242 304,444 311,711 304,458 275,893 254,898 264,141 292,084 Operating Income 67,954 68,201 87,340 115,425 142,810 109,557 107,160 106,928 Operating Income 67,954 68,201 87,340 115,425 142,810 109,557 107,160 106,928 Effective Tax Rate 28.2% 30.5% 30.3% 23.7% 27.5% 28.1% 32.0% 28.9% Less: Income taxes on Operating Income at Effective Rate 19,135 20,776 26,488 27,326 39,344 30,786 34,338 30,849 Net Operating Profit After Tax 48,819 47,425 60,852 88,099 103,466 78,771 72,822 76,079 Plus: Income from Equity Method Investments 2,105 1,819 3,265 5,989 1,923 2,829 5,794 8,008 Total Return 50,924 49,244 64,117 94,088 105,389 81,600 78,616 84,087 Long Term Debt 161,047 138,149 112,001 224,000 137,000 204,000 162,713 200,978 Plus: Notes Payable and current Installments of Long-Term Debt 12,876 36,235 34,837 34,746 35,608 36,134 51,315 49,743 Plus: Total Stockholder's Equity 509,338 553,059 584,443 777,792 798,993 535,611 591,354 631,934 Total Invested Capital 683,261 727,443 731,281 1,036,538 971,601 775,745 805,382 882,655 Total Return 50,924 49,244 64,117 94,088 105,389 81,600 78,616 84,087 Divided by: Total Invested Capital 683,261 727,443 731,281 1,036,538 971,601 775,745 805,382 882,655 Return on Invested Capital (ROIC) 7.5% 6.8% 8.8% 9.1% 10.8% 10.5% 9.8% 9.5% |
 Regulation G - EBITDA 22 $ Thousands 2003 2004 2005 2006 2007 2008 2009 2010 Net Revenue: 1,287,331 1,409,606 1,512,193 1,472,391 1,400,258 1,391,554 1,234,659 1,356,161 Cost of Goods Sold: (935,135) (1,036,961) (1,113,142) (1,052,508) (981,555) (1,027,099) (863,358) (957,149) Selling, General, and Administrative Expenses: (284,242) (304,444) (311,711) (304,458) (275,893) (254,898) (264,141) (292,084) Operating Income : 67,954 68,201 87,340 115,425 142,810 109,557 107,160 106,928 Depreciation Expense: 51,697 53,437 52,712 39,460 36,349 34,369 34,710 30,360 Amortization Expense: 2,439 2,593 2,763 8,995 14,009 11,803 12,038 10,839 EBITDA: 122,090 124,231 142,815 163,880 193,168 155,729 153,908 148,127 EBITDA Margin 9.5% 8.8% 9.4% 11.1% 13.8% 11.2% 12.5% 10.9% |
 Regulation G – Region EBITDA 23 REGION EBITDA: $ Thousands 2010 Operating Income: North America 73,050 EIMEA 16,544 Latin America 11,339 Asia Pacific 5,996 Total H.B. Fuller 106,929 Depreciation Expense: North America 13,754 EIMEA 9,500 Latin America 4,288 Asia Pacific 2,820 Total H.B. Fuller 30,362 Amortization Expense: North America 8,378 EIMEA 1,625 Latin America 203 Asia Pacific 633 Total H.B. Fuller 10,839 EBITDA: North America 95,182 EIMEA 27,669 Latin America 15,830 Asia Pacific 9,449 Total H.B. Fuller 148,130 |
 Regulation G – Region EBITDA % 24 REGION EBITDA: $ Thousands 2010 Net Revenue: North America 567,223 EIMEA 404,750 Latin America 229,319 Asia Pacific 154,868 Total H.B. Fuller 1,356,161 EBITDA: North America 95,182 EIMEA 27,669 Latin America 15,830 Asia Pacific 9,449 Total H.B. Fuller 148,130 EBITDA Margin: North America 16.8% EIMEA 6.8% Latin America 6.9% Asia Pacific 6.1% Total H.B. Fuller 10.9% |
 25 Regulation G–Pro Forma 2010 P&L 52 Weeks 2nd Quarter Adjusted 52 Weeks Ended Product Line Exit Ended November 27, 2010 Adjustments November 27, 2010 Net revenue 1,356,161 $ - $ 1,356,161 $ Cost of sales (958,980) (1,831) (957,149) Gross profit 397,181 (1,831) 399,012 Selling, general and administrative expenses (292,836) (752) (292,084) Asset impairment charges (8,785) (8,785) - Other income (expense), net 2,572 - 2,572 Interest expense (10,414) - (10,414) Income before income taxes and income from equity investments 87,718 (11,368) 99,086 Income taxes (25,307) 2,928 (28,235) Income from equity investments 8,008 - 8,008 Net income including non-controlling interests 70,419 $ (8,440) $ 78,859 $ Net (income) loss attributable to non-controlling interests 458 - 458 Net income attributable to H.B. Fuller 70,877 $ (8,440) $ 79,317 $ Basic income per common share attributable to H.B. Fuller 1.46 $ (0.17) $ 1.63 $ Diluted income per common share attributable to H.B. Fuller 1.43 $ (0.17) $ 1.60 $ Weighted-average H.B. Fuller common shares outstanding: Basic 48,599 48,599 48,599 Diluted 49,608 49,608 49,608 |
 Regulation G – Selected Segment EBITDA 26 SEGMENT EBITDA: 2003 2004 2005 2006 2007 2008 2009 2010 Net Revenue: North America Adhesives 473,888 491,382 535,474 509,283 469,797 451,647 416,678 445,029 EIMEA 219,521 240,416 272,221 295,671 311,359 290,837 265,206 301,096 Operating Income: North America Adhesives 60,673 57,717 68,542 74,683 64,368 55,963 69,200 70,391 EIMEA 6,608 6,634 16,279 25,268 34,296 24,705 16,464 12,127 Depreciation and Amortization Expense: North America Adhesives 13,373 12,897 12,974 12,717 15,400 14,000 15,581 10,823 EIMEA 8,235 9,168 9,231 7,967 7,421 7,145 7,656 7,299 EBITDA: North America Adhesives 74,046 70,614 81,516 87,400 79,768 69,963 84,781 81,214 EIMEA 14,843 15,802 25,511 33,235 41,718 31,850 24,120 19,426 EBITDA Margin: North America Adhesives 15.6% 14.4% 15.2% 17.2% 17.0% 15.5% 20.3% 18.2% EIMEA 6.8% 6.6% 9.4% 11.2% 13.4% 11.0% 9.1% 6.5% * All amounts regarding NAA are in $ thousands, except percentages and all amounts regarding EIMEA are in € thousands, except percentages. |