UNITED STATES
SECURITIES AND EXCHANGE COMMISSION
Washington, D.C. 20549
FORM N-CSR
Certified Shareholder Report of
Registered Management Investment Companies
Investment Company Act File Number: 811-00032
American Funds Fundamental Investors
(Exact Name of Registrant as Specified in Charter)
6455 Irvine Center Drive
Irvine, California 92618
(Address of Principal Executive Offices)
Registrant's telephone number, including area code: (213) 486-9200
Date of fiscal year end: December 31
Date of reporting period: December 31, 2015
Michael W. Stockton
American Funds Fundamental Investors
333 South Hope Street
Los Angeles, California 90071
(Name and Address of Agent for Service)
ITEM 1 – Reports to Stockholders

Multiple perspectives
create high-conviction
portfolios.
Special feature page 6
| | | |
 | | Fundamental Investors®
Annual report
for the year ended
December 31, 2015 |
Fundamental Investors seeks long-term growth of capital and income.
This fund is one of more than 40 offered by one of the nation’s largest mutual fund families, American Funds, from Capital Group. For more than 80 years, Capital has invested with a long-term focus based on thorough research and attention to risk.
Fund results shown in this report, unless otherwise indicated, are for Class A shares at net asset value. If a sales charge (maximum 5.75%) had been deducted, the results would have been lower. Results are for past periods and are not predictive of results for future periods. Current and future results may be lower or higher than those shown. Share prices and returns will vary, so investors may lose money. Investing for short periods makes losses more likely. Investments are not FDIC-insured, nor are they deposits of or guaranteed by a bank or any other entity, so they may lose value. For current information and month-end results, visit americanfunds.com.
See page 4 for Class A share results with relevant sales charges deducted. For other share class results, visit americanfunds.com and americanfundsretirement.com.
Investment results assume all distributions are reinvested and reflect applicable fees and expenses. When applicable, investment results reflect fee waivers, without which results would have been lower. Visit americanfunds.com for more information.
The fund’s 30-day yield for Class A shares as of January 31, 2016, calculated in accordance with the U.S. Securities and Exchange Commission (SEC) formula, was 1.58%. The fund’s 12-month distribution rate for Class A shares as of that date was 1.44%. Both reflect the 5.75% maximum sales charge. The SEC yield reflects the rate at which the fund is earning income on its current portfolio of securities while the distribution rate reflects the fund’s past dividends paid to shareholders. Accordingly, the fund’s SEC yield and distribution rate may differ.
Investing outside the United States may be subject to risks, such as currency fluctuations, periods of illiquidity and price volatility. These risks may be heightened in connection with investments in developing countries. Refer to the fund prospectus and the Risk Factors section of this report for more information on these and other risks associated with investing in the fund.

Fellow investors:
For the 12 months ended December 31, 2015, shares of Fundamental Investors climbed 3.38% for those who reinvested distributions totaling approximately $3.09 a share. The latter figure includes regular quarterly dividends amounting to 60 cents per share, a 16.6-cents-per-share special dividend and long-term capital gains payments totaling almost $2.32 per share.
The fund’s gain surpassed the 1.38% return of the unmanaged Standard & Poor’s 500 Composite Index, a market capitalization-weighted index based on the results of 500 widely held common stocks. The fund’s return relative to its peers was even better as the Lipper Growth and Income Funds Index finished the period in the red, slipping 1.61%.
Fundamental Investors may invest up to 35% of its assets in companies domiciled outside the United States, allowing the fund’s portfolio managers to invest in a broader set of companies in order to generate investment results.
Thus, we believe it’s important to provide a broader context for fund returns. For the 12 months, the unmanaged MSCI World Index, a measure of stock markets in more than 20 developed countries including the U.S., fell 0.87%.
As of December 31, 2015, the portion of fund assets invested in companies based abroad stood at 9%.
U.S. a bright spot
U.S. markets touched all-time highs in May 2015 on improving job numbers and sound economic fundamentals. However, worries about sluggish global growth, an uncertain interest rate picture and softening corporate profits weighed on U.S. markets in the second half of the year.
Strength in the consumer and information technology areas was largely offset by significant drops in the energy and materials sectors, which suffered from the continuing decline in commodity prices. For the 12 months, crude prices fell more than 30%, copper dropped
Results at a glance
For periods ended December 31, 2015, with all distributions reinvested
| | | Cumulative
total returns | | Average annual
total returns |
| | | | 1 year | | | 5 years | | 10 years | | Lifetime
(since 8/1/78)1 |
| | | | | | | | | | | | | | | | | |
| Fundamental Investors (Class A shares) | | | 3.38 | % | | | 11.23 | % | | | 7.77 | % | | | 12.35 | % |
| Standard & Poor’s 500 Composite Index2 | | | 1.38 | | | | 12.57 | | | | 7.31 | | | | 11.50 | |
| Lipper Growth and Income Funds Index3 | | | –1.61 | | | | 9.00 | | | | 5.50 | | | | 10.48 | |
| MSCI World Index2,4 | | | –0.87 | | | | 7.59 | | | | 4.98 | | | | 9.42 | |
| 1 | Date Capital Research and Management Company began managing the fund. |
| 2 | The indexes are unmanaged and, therefore, have no expenses. Investors cannot invest directly in an index. |
| 3 | Lipper indexes track the largest mutual funds (no more than 30), represented by one share class per fund, in the corresponding Lipper category. |
| 4 | Results reflect dividends net of withholding taxes. |
more than 25% and the price of steel plunged by nearly 60%.
In Europe, continuing stimulus from the European Central Bank served to steady markets. In addition, exporters were helped by the weakening euro.
Japanese markets were among the best in the developed world as quantitative easing by the Bank of Japan, together with a renewed focus on shareholder-friendly corporate governance, bolstered the financial results of many companies. That said, the weakening yen reduced returns for U.S.-based investors in Japanese companies.
The currency factor
In recent reports we have frequently noted the impact of currency on economies, markets and, ultimately, the fund’s results. Recently, the dominant theme has been the strength of the U.S. dollar against most major currencies. In large part, this reflects a consensus in global financial markets that the U.S. Federal Reserve has completed a cycle of monetary easing, and that the economy and political environment are stable relative to other countries and regions.
A strengthening dollar exerts a multifaceted effect on economies and markets. For one, it makes products from non-U.S. manufacturers more affordable to American buyers because fewer dollars are required to purchase them.
Conversely, it hampers U.S. exporters whose goods become pricier for buyers abroad. That said, it can also be a boon to U.S.–based companies that manufacture outside the states as labor and other production costs will generally decline when paid in local currency.
For Fundamental Investors shareholders, however, the most obvious impact of currency fluctuations is on returns for the stock prices of companies domiciled abroad. In a rising dollar environment, returns for these companies may be offset by a weakening currency when converted to U.S. dollars.
Large holdings drive fund returns
Returns for many of the fund’s larger holdings drove its better-than-benchmark returns. Avago Technologies climbed 44.30%, while Home Depot gained 25.99% and General Electric rose 23.27%. Microsoft — the fund’s biggest holding — advanced 19.44%. Other large holdings such as Philip Morris International and JPMorgan Chase gained 7.93% and 5.51%, respectively.
Coca Cola (+1.75%) posted results in line with the broader market, while Wells Fargo (–0.84%) and Comcast (–2.72%) finished in negative territory.
Dividend payers struggle
The solid stock selection illustrated by this group of large holdings becomes even more evident when one looks closely at the composition of return last year in the S&P 500. In a nutshell, the subset of stocks offering above-average dividends didn’t fare nearly as well as the cohort of companies offering no yield. Given Fundamental Investors income objective, the fund’s portfolio managers are consistently seeking to generate reliable income through a balance of higher yielding and lower yielding stocks. While higher yielding areas of the market have recently been a challenging area to invest in, they remain an important contributor to long-term results. For example, all of the companies mentioned above pay healthy dividends.
A flexible approach to income
Fund guidelines specify that each manager must build a portfolio that provides income in the form of dividends, but not every stock must pay a dividend in order to qualify as a potential investment. Rather, a manager must seek to build a portfolio that, overall, meets a certain yield threshold. Managers can pursue this objective by selecting some companies with higher-than-average yields and others whose payouts are smaller or that may not offer a dividend.
This flexibility made possible our investment in Amazon, the fund’s second-largest holding. The web giant gained 117.78% as results in its core eCommerce business grew nicely, while recent disclosure about its Amazon Web Services division revealed a new engine for value creation to shareholders. Like many companies in the high-growth phase of their evolution, Amazon favors investing in its business over returning cash to shareholders in the form of dividends.
Outside the top 10
Elsewhere outside the top 10, companies that were additive to fund returns included Expedia (+45.62%), medical device manufacturer Boston Scientific (+39.17%) and Masco (+12.30%), a manufacturer of household fixtures and building supplies. As a group, consumer companies fared well as falling oil prices put more dollars in shoppers’ wallets.
Among those that weighed on results were railroad Union Pacific (–34.36), and media conglomerates Time Warner (–24.29%) and Twenty-First Century Fox (–29.28%).
More broadly, the fund was hampered by its energy and materials holdings, which mirrored the downturn in their sectors.
To learn the story behind some of these investments from the portfolio managers who chose them, we invite you to read the feature story beginning on page 6.
Volatility rings in the New Year
We enter 2016 in a swirl of volatility, stemming in large part from ongoing uncertainty about the condition of the Chinese economy, tightening monetary conditions in the U.S. and the continuing
slide in oil prices. Such an environment calls for a balance of caution and opportunism: caution in the form of keen attention to risk and assiduous analysis of every investment, and opportunism in our willingness to invest in companies with solid long-term prospects whose stock prices may be struggling due to the market’s instability.
Such periods are highly challenging, but not uncommon for those who have chosen to invest for the long term.
Gratitude for leadership
This year marked a change in leadership for the fund. While Dina Perry will continue to be involved in the fund as a portfolio manager and vice chairman, she has handed responsibility for the day-to-day operations to fellow portfolio manager Brady Enright, who is now the fund’s principal investment officer. We are grateful for her service and dedication. Under Dina’s leadership, Fundamental Investors maintained its record of providing investors with superior long-term results. Brady brings a decade of experience with the fund to his new position.
Thank you for your commitment to Fundamental Investors.
Sincerely,

Dina N. Perry
Vice Chairman

Brady Enright
President
February 10, 2016
For current information about the fund, visit americanfunds.com.
The New Geography of Investing®
While most of the companies that Fundamental Investors invests in are based in the U.S., virtually all of them do business on a global basis. This diversifies their customer base and sources of revenue. The chart below shows where the companies we invest in are headquartered, as well as the sources of their revenue. Active management can help investors with a domestic focus gain exposure to the global marketplace.
Equity portion breakdown by domicile (%)
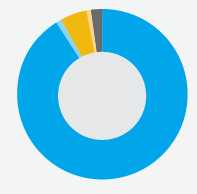
| | Region | | Fund | | Index |
 | United States | | | 91 | % | | | 100 | % |
 | Canada | | | 1 | | | | — | |
 | Europe | | | 5 | | | | — | |
 | Japan | | | 1 | | | | — | |
 | Asia-Pacific ex. Japan | | | — | | | | — | |
 | Emerging markets | | | 2 | | | | — | |
| | Total | | | 100 | % | | | 100 | % |
Equity portion breakdown by revenue (%)
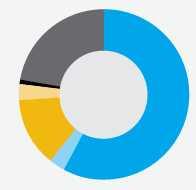
| | Region | | Fund | | Index |
| | United States | | | 58 | % | | | 62 | % |
| | Canada | | | 3 | | | | 2 | |
| | Europe | | | 13 | | | | 13 | |
| | Japan | | | 3 | | | | 3 | |
| | Asia-Pacific ex. Japan | | | 1 | | | | 1 | |
| | Emerging markets | | | 22 | | | | 19 | |
| | Total | | | 100 | % | | | 100 | % |
Compared with the S&P 500 as a percent of net assets. All figures include convertible securities.
Source: Capital Group (as of December 31, 2015).
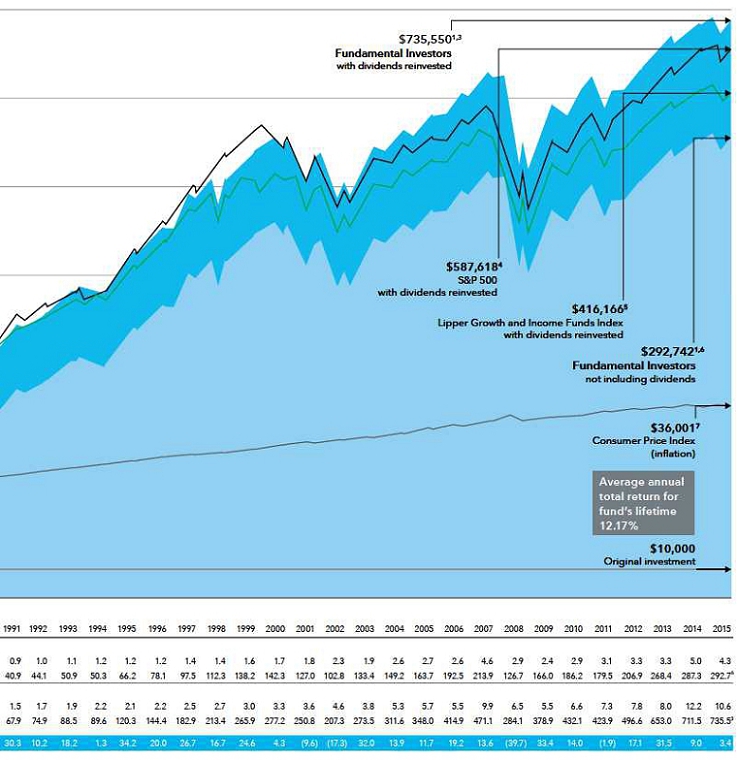
Results of a $10,000 investment in Fundamental Investors
Fund results shown are for Class A shares and reflect deduction of the maximum sales charge of 5.75% on the $10,000 investment.1 Thus, the net amount invested was $9,425.2 Results are for past periods and are not predictive of results for future periods. Current and future results may be lower or higher than those shown. Share prices and returns will vary, so investors may lose money. For current information and month-end results, visit americanfunds.com.
The results shown are before taxes on fund distributions and sale of fund shares.
| 1 | As outlined in the prospectus, the sales charge is reduced for accounts (and aggregated investments) of $25,000 or more and is eliminated for purchases of $1 million or more. There is no sales charge on dividends or capital gain distributions that are reinvested in additional shares. |
| 2 | The maximum initial sales charge was 8.50% prior to July 1, 1988. |
| 3 | Includes reinvested dividends of $137,762 and reinvested capital gain distributions of $259,733. |
| 4 | The S&P 500 is unmanaged and, therefore, has no expenses. Investors cannot invest directly in an index. |
| 5 | Results of the Lipper Growth and Income Funds Index do not reflect any sales charges. |
| 6 | Includes reinvested capital gain distributions of $127,663, but does not reflect income dividends of $67,006 taken in cash. |
| 7 | Computed from data supplied by the U.S. Department of Labor, Bureau of Labor Statistics. |
| 8 | For the period August 1, 1978 (when Capital Research and Management Company became investment adviser), through December 31, 1978. |
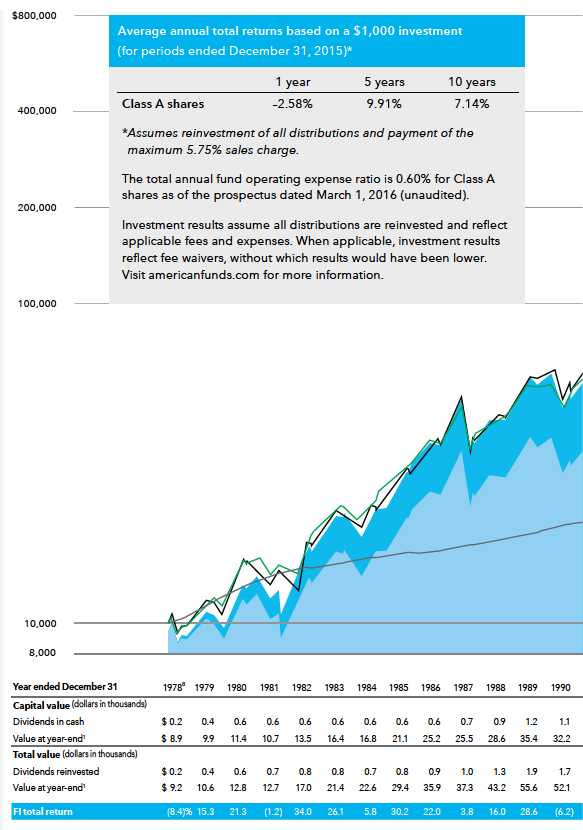
How a $10,000 investment has grown
The chart and the table below it illustrate how a $10,000 investment in the fund grew between August 1, 1978 — when Capital Research and Management Company became Fundamental Investors investment adviser — and December 31, 2015. The chart also shows how the unmanaged Standard & Poor’s 500 Composite Index and the Lipper Growth and Income Funds Index fared over this same period, and what happened to inflation (as measured by the Consumer Price Index).
Multiple perspectives
create high-conviction
portfolios.

To a degree, investment choices present a portrait of the men and women who make them. Their backgrounds, areas of experience, appetite for risk, research habits and priorities inform their decisions. In the following pages, we invite you to learn more about Fundamental Investors portfolio managers by taking a look at companies they feel offer a reflection of their individual investment approaches.
Taking a trip with an online travel company
When portfolio manager and fund president Brady Enright first invested in Expedia, it was beset by challenges. Its technology systems lagged the industry, it was at risk of disruption by Google (which at the time was considering entering the online travel sector), and it meaningfully trailed the biggest player in the market, Priceline. What’s more, as a former subsidiary of a larger company, its financial condition and profitability were difficult to discern. But Brady was not new to analyzing this type of company as he had previously invested in the burgeoning online travel industry as an investment analyst. Moreover, he was able to plumb insight from internet analyst and fellow portfolio manager Mark Casey, who covers the company. Mark had faith in the company’s management team and was able to allay some of Brady’s concerns about Google’s possible entry into the arena.
Importantly, Expedia also fit the profile of a company in the sweet spot of Brady’s investing style. “I like businesses where the downside is that they don’t grow as fast as you had hoped but there is little risk they will fall apart. Online travel was not going to be a ‘winner take all’ proposition. It is a business where capital intensity is low and brands are difficult to displace. In addition, the industry still had considerable room for growth as the conversion to online booking was still in its relatively early stages,” says Brady. “For the investment to work, I didn’t have to believe it was going to supplant Priceline as the leader in the space. In the meantime, the business had strong cash flows and, importantly, the valuation was very attractive as it traded at 12 to 13 times earnings.”
The investment has unfolded favorably for the fund. The company has jettisoned brands ancillary to its core business while also expanding through solid acquisitions such as Orbitz, Travelocity and HomeAway, the parent of VRBO (Vacation Rentals by Owner). Mark Casey’s faith in management and Brady’s faith in his own research, as well as in Mark, has served fund investors well.
Neither fish nor fowl
When a company has widely varying lines of business, the market sometimes gets puzzled. Investors seem to prefer purity, questioning whether management can effectively shepherd the disparate divisions. The byproduct of that uncertainty is known as a “conglomerate discount” — a valuation that may add up to less than the sum of its parts. Portfolio manager Dina Perry’s investment in General Electric stemmed in large part from the belief that the industrial giant was suffering from just such a discount, and that management would eventually take the steps necessary to break free of it.
“When I invested in GE, the company had two primary businesses, an industrials division that manufactured things like turbines and aircraft engines, and a financials business that focused on consumer and corporate lending,” explains Dina.
 | |  | |
| | | | |
| Brady Enright | | Mark Casey | |
Portfolio manager
San Francisco | | Portfolio manager
San Francisco | |
“Under normal circumstances, the market finds it challenging to value these conglomerates. But in the wake of the 2008 financial crisis, the difficulty was further compounded by the fact that GE’s financial division was designated by the government as a systemically important financial institution (SIFI). That brought with it considerable regulation and capped certain types of earnings.”
Dina, an economist who earlier in her career was also a capital goods analyst, wasn’t sure when the company would restructure but was certain it could not continue as is. It took a while — and the share price continued to languish — but eventually GE unveiled its plans. They would focus on growing and expanding the highly profitable industrials business and shed non-core assets including the appliance arm and, most importantly, the finance division.
Thanks to an investment decision grounded in research, deep experience in the sector and real return in the form of the company’s dividend, Dina had the conviction to see the fund’s investment rewarded as the market took notice and the stock price rose.
Defensive investing
In a world where virtually every industry is subject to disruption by upstarts and technological transformation, defense companies offer investors some measure of stability. Global demand for their products is fairly consistent, and there is visibility into their order books. Many of the products they manufacture have long lifecycles. These factors often add up to favorable financials and growth prospects. One of these companies, Lockheed Martin, was among the first investments portfolio manager Ron Morrow made when he started with Fundamental investors more than a decade ago.
“I favor companies with business dynamics I can be comfortable with over a multiyear period,” says Ron. “When I made my initial investment, the company was presented to me as the beneficiary of an increasing defense budget and a growing base of buyers for its products, which included the F-22 Raptor fighter jet. It has proven to be an efficiently managed, shareholder-friendly firm committed to increasing its dividend yield, which currently stands at nearly 3%.”
Defense companies have become a theme in Ron’s portfolio, and the former consumer products analyst has made his penchant for these firms clear to the investment analysts who cover them. “If the valuations are right and business is solid, I will sometimes buy the top two or three companies in a sector, as well as some of the smaller players that are beneficiaries of the theme that prompted my investment.”
To remain abreast of developments in the defense and aerospace areas, Ron attends the Paris Air Show each year with a group of his fellow investment professionals. “It’s a perfect opportunity to stay current and catch up with a number of company managers,” he adds.
Buying chips on a dip
Per Fundamental Investors’ guidelines, only a small portion of assets can be invested in companies domiciled in developing markets, which are often viewed as carrying greater risks than those headquartered in the developed world. While always mindful of these risks, portfolio manager Mark Casey nonetheless has built a sizable stake in Taiwan Semiconductor Manufacturing Company, commonly known as TSMC. “I know our shareholders wouldn’t want
 | |  | |
| | | | |
| Dina Perry | | Ron Morrow | |
Portfolio manager
Washington, D.C. | | Portfolio manager
Los Angeles | |
us to take a chance on a dodgy emerging markets company, and nothing close to that description can be applied to TSMC,” emphasizes Mark, who has also served the fund as a technology analyst. “Rather, it’s a proven business with a solid track record. It has a very strong balance sheet and has consistently had an annual return on equity of 20%.”
Perhaps more important than its past is the enviable competitive position TSMC currently enjoys. “The company is an established, integral player in an industry so capital intensive that new entrants are virtually nonexistent,” he explains. “That’s because these days, building a microchip foundry takes $5 billion. And advancing technology — in particular, the drive to create faster chips with more memory — means that the plant is only considered state of the art for two to three years before it needs to be refitted with a new generation of fabrication equipment.”
TSMC has the resources to purchase that new equipment. It also has a broad, dedicated group of customers that doesn’t necessarily require the very latest chips, which means it can extend the life of its older factories. The firm’s chief rivals, Intel and Samsung, do not enjoy the same customer base and are not able to optimize the output from operations.
“TSMC is an absolutely essential link in the global electronics supply chain,” says Mark. “And in addition to its competitive position, the dividend yield on the company’s stock is above 3%. To get that kind of yield from a high-quality company, you generally have to pay higher valuations and frequently have limited growth prospects. The stock price was relatively flat in 2015, but given the expansion in the sector, I believed TSMC could represent a good long-term investment opportunity.”
Oil’s fluctuating popularity
Suncor Energy should be a familiar name to longtime Fundamental Investors shareholders. A Canadian company whose primary focus is the production of synthetic crude from oil sands (a process that more closely resembles mining than drilling), it has been a portfolio mainstay for over a decade. And for much of that time, portfolio manager Mike Kerr has held it in his portfolio.
Like all energy companies, Suncor has recently faced major challenges. Its fortunes are closely linked to the price of oil, which plunged from over $100 a barrel in June of 2014 to $37 at the close of 2015 on slowing economic growth in the developing world and OPEC’s decision to continue production in the face of falling prices. What’s more, the process of extracting and refining oil from sands is more expensive than traditionally drilled oil. Consequently, margins narrow as falling oil prices approach extraction costs. But Mike’s knowledge of the industry runs deep thanks to his background as a geologist and energy analyst, and his relationship with Suncor dates back more than three decades.
“The very difficult conditions the industry is experiencing are similar to what it went through in 1985 and 1996, when there was excess capacity and the price collapsed. As was the case then, the industry has shuttered projects as financing has become much more difficult to secure. People have been aggressively selling the stocks, including Suncor’s.”
In choosing to invest in Suncor, Mike cites improvements in the company’s cost structure, in particular its labor expenses.
 | |  | |
| | | | |
| Mike Kerr | | Martin Romo | |
Portfolio manager
Los Angeles | | Portfolio manager
San Francisco | |
In addition, low energy costs are actually beneficial from a production standpoint as refining oil sands is highly energy intensive. What’s more, Suncor’s acquisition of Petro-Canada further diversified its business by adding refining, non-oil sands extraction and additional retailing to its portfolio of assets.
He acknowledges that investing under such conditions is not for the faint of heart. “To invest into the teeth of these challenges means you must be willing to tolerate some ugliness, but I believed there was a compelling case for investment in Suncor.”
Investing according to GARP
Martin Romo describes his investing style as “GARPy” (Growth At a Reasonable Price), and it’s that sensibility that led to his interest in a corporate giant he regarded as underappreciated. That company is Microsoft, and it too has had a longstanding presence in Fundamental Investors portfolio.
In truth, the investment community’s lack of appreciation was understandable, as the stock had essentially remained flat since the internet bubble burst at the end of the last century. Martin saw opportunity in a new management team that was shaking off its “Apple envy” and refocusing on its core products: the Windows operating system and Office productivity suites. In addition, through the cluster of analysts known as Tech/Zep, he learned more about Microsoft’s progress in the cloud computing arena. “I rely heavily on our analysts, and I’m sensitive to both their individual and combined conviction,” says Martin. “When the entire Tech/Zep group was talking about the inevitability of companies taking much of their tech operations off-site and onto the cloud, I listened.”
In fact, Microsoft’s initial cloud efforts trailed those of industry leader Amazon (Fundamental Investors’ second-largest holding), but the fund’s analysts felt strongly that the company would become a viable competitor. For a GARP investor, that was the growth. The “At a Reasonable Price” part of the equation was also in place thanks to Microsoft’s low stock valuation.
Another not-to-be-overlooked consideration was the dividend, which provided investors with an incentive to wait for a rebound. “I like to say we’re in the what business, not the when business,” he adds. “Based on the research we’d done, I was fairly confident in the ‘what.’ I believed there would be improvement in the business — I just wasn’t sure exactly when it would happen. That’s where our willingness to take a long-term position can pay off.”
Staying the course
Portfolio manager Greg Johnson has been paying attention to Wells Fargo since his college days, and his view of the financial giant has remained pretty steady. “Wells is a great example of a solid investment for the fund,” says Greg. “It came out of the financial crisis with a stronger franchise, having bought Wachovia in the depths of it. And although it’s one of the world’s biggest banks and is heavily regulated as a result, its management has navigated the regulatory environment exceptionally well, enabling it to consistently pass the ‘stress tests’ regulators use to gauge stability.”
According to Greg, the firm’s competitive advantages exist on two sides of the business that experts watch closely — deposits and lending. On the deposit
 | | | |
 |
| Greg Johnson | | | |
Portfolio manager
Los Angeles | | | |
side, the company has a huge base of consumers with checking and savings accounts. That gives the firm access to a significant pool of capital. And thanks to low interest rates, the bank pays very little interest on those deposits. It’s a virtuous circle because those deposits are grist for the firm’s lending mill. Wells is able to take those deposits and, thanks in part to its focus on cross-selling to its customers, lend them to a broad base of borrowers and gather interest on the loans.
“This large foundation of borrowers helps give them one of the most diversified businesses in the financial services area,” explains Greg. “Their broad revenue base has made the firm less affected by the sector’s cycles and provided the wherewithal to pay and grow their dividend — and buy back stock at attractive valuations.”
Although the bank’s results were down very slightly in 2015, Greg plans to stay the course on a company he’s watched since he was an undergrad. ■
Multiple perspectives strengthen the fund’s portfolio
How do seven portfolio managers with diverse perspectives coexist within a single fund? The answer is The Capital System,SM an investment approach designed to facilitate teamwork while accommodating the strong investment convictions of individual fund managers.
The Capital System divides fund assets into slices, each of which is individually managed — within fund guidelines — by one of Fundamental Investors’ investment professionals. Still another slice is managed by the analysts who research investments. As seen in these pages, a portfolio manager’s background and the framework he or she uses to evaluate and interpret investing opportunities leads to different places. To be sure, managers engage fellow team members; debate is often spirited and disagreements inevitable, but in the end the decision to invest belongs to the individual manager.
Allowing this autonomy rather than making investment choices contingent on the approval of a committee means that each of the fund’s investments is based on the high conviction of one or more of its managers. And because, by design, the portfolio manager lineup represents people with widely varying backgrounds and investing styles, their individual portfolios look very different and meld to form a diverse whole.
This combination of individuality and teamwork that is the hallmark of The Capital System has produced superior outcomes for long-term investors.
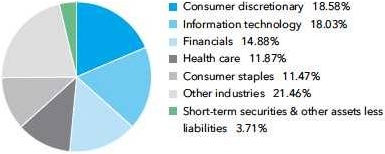
Summary investment portfolio December 31, 2015
| Industry sector diversification | Percent of net assets |
| Country diversification by domicile | | | Percent of
net assets |
| United States | | | 87.31 | % |
| United Kingdom | | | 2.80 | |
| Euro zone* | | | 1.74 | |
| Canada | | | 1.23 | |
| Taiwan | | | 1.16 | |
| Switzerland | | | 0.58 | |
| Japan | | | 0.50 | |
| China | | | 0.49 | |
| South Africa | | | 0.24 | |
| Other countries | | | 0.24 | |
| Short-term securities & other assets less liabilities | | | 3.71 | |
| * | Countries using the euro as a common currency; those represented in the fund’s portfolio are France, Germany, Ireland and the Netherlands. |
| Common stocks 96.29% | | Shares | | | Value
(000) | |
| Consumer discretionary 18.58% | | | | | | | | |
| Amazon.com, Inc.1 | | | 4,906,800 | | | $ | 3,316,457 | |
| Home Depot, Inc. | | | 13,815,000 | | | | 1,827,034 | |
| Comcast Corp., Class A | | | 31,337,000 | | | | 1,768,347 | |
| Twenty-First Century Fox, Inc., Class A | | | 29,125,000 | | | | 791,035 | |
| McDonald’s Corp. | | | 6,351,000 | | | | 750,307 | |
| Walt Disney Co. | | | 7,140,000 | | | | 750,271 | |
| Target Corp. | | | 7,615,000 | | | | 552,925 | |
| Expedia, Inc. | | | 3,980,000 | | | | 494,714 | |
| Time Warner Inc. | | | 7,530,000 | | | | 486,965 | |
| Las Vegas Sands Corp. | | | 10,100,000 | | | | 442,784 | |
| Other securities | | | | | | | 2,341,703 | |
| | | | | | | | 13,522,542 | |
| | | | | | | | | |
| Information technology 18.03% | | | | | | | | |
| Microsoft Corp. | | | 63,465,000 | | | | 3,521,039 | |
| Avago Technologies Ltd. | | | 10,959,632 | | | | 1,590,791 | |
| Texas Instruments Inc. | | | 16,850,300 | | | | 923,565 | |
| Alphabet Inc., Class C1 | | | 754,317 | | | | 572,436 | |
| Alphabet Inc., Class A1 | | | 442,800 | | | | 344,503 | |
| Taiwan Semiconductor Manufacturing Co., Ltd.2 | | | 174,405,000 | | | | 752,571 | |
| Taiwan Semiconductor Manufacturing Co., Ltd. (ADR) | | | 4,009,800 | | | | 91,223 | |
| Intel Corp. | | | 22,130,173 | | | | 762,384 | |
| ASML Holding NV2 | | | 4,555,030 | | | | 405,928 | |
| ASML Holding NV (New York registered) | | | 3,036,000 | | | | 269,506 | |
| Visa Inc., Class A | | | 8,420,000 | | | | 652,971 | |
| Other securities | | | | | | | 3,229,909 | |
| | | | | | | | 13,116,826 | |
| | | | | | | | | |
| Financials 14.88% | | | | | | | | |
| Wells Fargo & Co. | | | 28,680,916 | | | | 1,559,095 | |
| JPMorgan Chase & Co. | | | 19,000,000 | | | | 1,254,570 | |
| Berkshire Hathaway Inc., Class A1 | | | 4,555 | | | | 900,979 | |
| SunTrust Banks, Inc. | | | 14,903,987 | | | | 638,487 | |
| Capital One Financial Corp. | | | 8,712,000 | | | | 628,832 | |
| CME Group Inc., Class A | | | 6,731,437 | | | | 609,868 | |
| Citigroup Inc. | | | 10,000,000 | | | | 517,500 | |
| ACE Ltd. | | | 4,350,000 | | | | 508,298 | |
| American Express Co. | | | 6,495,000 | | | | 451,727 | |
| Other securities | | | | | | | 3,760,994 | |
| | | | | | | | 10,830,350 | |
| | | Shares | | | Value
(000) | |
| Health care 11.87% | | | | | | | | |
| Express Scripts Holding Co.1 | | | 12,050,000 | | | $ | 1,053,291 | |
| Medtronic PLC | | | 12,040,000 | | | | 926,117 | |
| Merck & Co., Inc. | | | 16,710,000 | | | | 882,622 | |
| UnitedHealth Group Inc. | | | 5,501,500 | | | | 647,197 | |
| Bristol-Myers Squibb Co. | | | 8,600,000 | | | | 591,594 | |
| Vertex Pharmaceuticals Inc.1 | | | 4,675,000 | | | | 588,255 | |
| Boston Scientific Corp.1 | | | 25,005,000 | | | | 461,092 | |
| Other securities | | | | | | | 3,487,114 | |
| | | | | | | | 8,637,282 | |
| | | | | | | | | |
| Consumer staples 11.47% | | | | | | | | |
| Philip Morris International Inc. | | | 26,535,000 | | | | 2,332,692 | |
| Coca-Cola Co. | | | 28,435,000 | | | | 1,221,568 | |
| Reynolds American Inc. | | | 15,598,140 | | | | 719,854 | |
| Kroger Co. | | | 15,594,000 | | | | 652,297 | |
| Procter & Gamble Co. | | | 8,175,000 | | | | 649,177 | |
| Walgreens Boots Alliance, Inc. | | | 5,856,000 | | | | 498,668 | |
| Other securities | | | | | | | 2,270,947 | |
| | | | | | | | 8,345,203 | |
| | | | | | | | | |
| Industrials 10.30% | | | | | | | | |
| General Electric Co. | | | 41,830,000 | | | | 1,303,004 | |
| Boeing Co. | | | 8,320,000 | | | | 1,202,989 | |
| Lockheed Martin Corp. | | | 2,953,200 | | | | 641,287 | |
| Union Pacific Corp. | | | 5,890,000 | | | | 460,598 | |
| Parker-Hannifin Corp. | | | 4,550,000 | | | | 441,259 | |
| Other securities | | | | | | | 3,442,761 | |
| | | | | | | | 7,491,898 | |
| | | | | | | | | |
| Energy 6.98% | | | | | | | | |
| ConocoPhillips | | | 14,210,000 | | | | 663,465 | |
| Chevron Corp. | | | 5,476,137 | | | | 492,633 | |
| Other securities | | | | | | | 3,920,554 | |
| | | | | | | | 5,076,652 | |
| | | | | | | | | |
| Materials 2.88% | | | | | | | | |
| Praxair, Inc. | | | 7,035,000 | | | | 720,384 | |
| E.I. du Pont de Nemours and Co. | | | 9,968,525 | | | | 663,904 | |
| Other securities | | | | | | | 712,747 | |
| | | | | | | | 2,097,035 | |
| | | | | | | | | |
| Other 0.91% | | | | | | | | |
| Other securities | | | | | | | 663,486 | |
| | | | | | | | | |
| Miscellaneous 0.39% | | | | | | | | |
| Other common stocks in initial period of acquisition | | | | | | | 284,220 | |
| | | | | | | | | |
| Total common stocks (cost: $48,174,111,000) | | | | | | | 70,065,494 | |
| | | | | | | | | |
| Short-term securities 3.73% | | Principal amount
(000) | | | | | |
| Coca-Cola Co. 0.47% due 5/18/20163 | | $ | 25,000 | | | | 24,955 | |
| Federal Home Loan Bank 0.11%–0.54% due 1/7/2016–6/6/2016 | | | 1,517,205 | | | | 1,516,577 | |
| Google Inc. 0.14% due 1/26/20163 | | | 20,000 | | | | 19,997 | |
| Intel Corp. 0.40% due 2/25/2016 | | | 40,000 | | | | 39,977 | |
| Short-term securities (continued) | Principal amount
(000) | | | Value
(000) | |
| Jupiter Securitization Co., LLC 0.50% due 5/5/20163 | | $ | 50,000 | | | $ | 49,865 | |
| Wells Fargo Bank, N.A. 0.54% due 5/9/2016 | | | 100,000 | | | | 100,091 | |
| Other securities | | | | | | | 960,813 | |
| | | | | | | | | |
| Total short-term securities (cost: $2,712,044,000) | | | | | | | 2,712,275 | |
| Total investment securities 100.02% (cost: $50,886,155,000) | | | | | | | 72,777,769 | |
| Other assets less liabilities (0.02)% | | | | | | | (13,395 | ) |
| | | | | | | | | |
| Net assets 100.00% | | | | | | $ | 72,764,374 | |
This summary investment portfolio is designed to streamline the report and help investors better focus on the fund’s principal holdings. See the inside back cover for details on how to obtain a complete schedule of portfolio holdings.
As permitted by U.S. Securities and Exchange Commission regulations, “Miscellaneous” securities include holdings in their first year of acquisition that have not previously been publicly disclosed.
“Other securities” includes all issues that are not disclosed separately in the summary investment portfolio.
Investments in affiliates
A company is an affiliate of the fund under the Investment Company Act of 1940 if the fund’s holdings in that company represent 5% or more of the outstanding voting shares. The value of the fund’s holdings in affiliated companies is included in “Other securities” under the respective industry sectors in the summary investment portfolio. Further details on these holdings and related transactions during the year ended December 31, 2015, appear below.
| | | Beginning
shares | | | Additions | | | Reductions | | | Ending
shares | | | Dividend
income
(000) | | | Value of
affiliates at
12/31/2015
(000) | |
| FMC Corp. | | | 6,758,000 | | | | — | | | | — | | | | 6,758,000 | | | $ | 4,460 | | | $ | 264,440 | |
| CNO Financial Group, Inc. | | | 11,900,000 | | | | — | | | | — | | | | 11,900,000 | | | | 3,213 | | | | 227,171 | |
| Peyto Exploration & Development Corp. | | | 8,107,500 | | | | 2,224,787 | | | | — | | | | 10,332,287 | | | | 9,818 | | | | 185,708 | |
| Grafton Group PLC, units2 | | | 15,037,000 | | | | — | | | | — | | | | 15,037,000 | | | | 2,615 | | | | 163,642 | |
| Denbury Resources Inc.4 | | | 20,500,000 | | | | — | | | | 20,500,000 | | | | — | | | | 1,956 | | | | — | |
| | | | | | | | | | | | | | | | | | | $ | 22,062 | | | $ | 840,961 | |
The following footnotes apply to either the individual securities noted or one or more of the securities aggregated and listed as a single line item.
| 1 | Security did not produce income during the last 12 months. |
| 2 | Valued under fair value procedures adopted by authority of the board of trustees. The total value of all such securities, including those in “Other securities,” was $4,424,441,000, which represented 6.08% of the net assets of the fund. This entire amount relates to certain securities trading outside the U.S. whose values were adjusted as a result of significant market movements following the close of local trading. |
| 3 | Acquired in a transaction exempt from registration under Section 4(2) of the Securities Act of 1933. May be resold in the U.S. in transactions exempt from registration, normally to qualified institutional buyers. The total value of all such securities, including those in “Other securities,” was $428,539,000, which represented .59% of the net assets of the fund. |
| 4 | Unaffiliated issuer at 12/31/2015. |
Key to abbreviation
ADR = American Depositary Receipts
See Notes to Financial Statements
Financial statements
| Statement of assets and liabilities | |
| at December 31, 2015 | (dollars in thousands) |
| | | | | | | |
| Assets: | | | | | | | | |
| Investment securities, at value: | | | | | | | | |
| Unaffiliated issuers (cost: $50,110,824) | | $ | 71,936,808 | | | | | |
| Affiliated issuers (cost: $775,331) | | | 840,961 | | | $ | 72,777,769 | |
| Cash | | | | | | | 10,848 | |
| Receivables for: | | | | | | | | |
| Sales of investments | | | 69,779 | | | | | |
| Sales of fund’s shares | | | 115,836 | | | | | |
| Dividends and interest | | | 116,842 | | | | | |
| Other | | | 2,974 | | | | 305,431 | |
| | | | | | | | 73,094,048 | |
| Liabilities: | | | | | | | | |
| Payables for: | | | | | | | | |
| Purchases of investments | | | 62,897 | | | | | |
| Repurchases of fund’s shares | | | 227,975 | | | | | |
| Investment advisory services | | | 15,322 | | | | | |
| Services provided by related parties | | | 18,183 | | | | | |
| Trustees’ deferred compensation | | | 3,927 | | | | | |
| Other | | | 1,370 | | | | 329,674 | |
| Net assets at December 31, 2015 | | | | | | $ | 72,764,374 | |
| | | | | | | | | |
| Net assets consist of: | | | | | | | | |
| Capital paid in on shares of beneficial interest | | | | | | $ | 50,072,497 | |
| Undistributed net investment income | | | | | | | 191,802 | |
| Undistributed net realized gain | | | | | | | 608,783 | |
| Net unrealized appreciation | | | | | | | 21,891,292 | |
| Net assets at December 31, 2015 | | | | | | $ | 72,764,374 | |
(dollars and shares in thousands, except per-share amounts)
Shares of beneficial interest issued and outstanding (no stated par value) —
unlimited shares authorized (1,435,371 total shares outstanding)
| | | Net assets | | | Shares
outstanding | | | Net asset value
per share | |
| Class A | | $ | 44,595,752 | | | | 879,343 | | | $ | 50.71 | |
| Class B | | | 190,493 | | | | 3,761 | | | | 50.64 | |
| Class C | | | 2,434,510 | | | | 48,225 | | | | 50.48 | |
| Class F-1 | | | 4,818,505 | | | | 95,056 | | | | 50.69 | |
| Class F-2 | | | 4,389,093 | | | | 86,569 | | | | 50.70 | |
| Class 529-A | | | 1,795,485 | | | | 35,446 | | | | 50.65 | |
| Class 529-B | | | 16,599 | | | | 327 | | | | 50.76 | |
| Class 529-C | | | 451,416 | | | | 8,921 | | | | 50.60 | |
| Class 529-E | | | 72,728 | | | | 1,437 | | | | 50.61 | |
| Class 529-F-1 | | | 82,764 | | | | 1,635 | | | | 50.62 | |
| Class R-1 | | | 151,450 | | | | 3,000 | | | | 50.49 | |
| Class R-2 | | | 734,269 | | | | 14,548 | | | | 50.47 | |
| Class R-2E | | | 1,073 | | | | 21 | | | | 50.56 | |
| Class R-3 | | | 2,237,236 | | | | 44,214 | | | | 50.60 | |
| Class R-4 | | | 2,289,234 | | | | 45,226 | | | | 50.62 | |
| Class R-5E | | | 10 | | | | — | * | | | 50.69 | |
| Class R-5 | | | 1,914,258 | | | | 37,726 | | | | 50.74 | |
| Class R-6 | | | 6,589,499 | | | | 129,916 | | | | 50.72 | |
*Amount less than one thousand.
See Notes to Financial Statements
Statement of operations
for the year ended December 31, 2015 | (dollars in thousands) |
| | | | | | | |
| Investment income: | | | | | | | | |
| Income: | | | | | | | | |
| Dividends (net of non-U.S. taxes of $17,654; also includes $22,062 from affiliates) | | $ | 1,503,298 | | | | | |
| Interest | | | 5,104 | | | $ | 1,508,402 | |
| Fees and expenses*: | | | | | | | | |
| Investment advisory services | | | 179,003 | | | | | |
| Distribution services | | | 178,902 | | | | | |
| Transfer agent services | | | 68,740 | | | | | |
| Administrative services | | | 18,418 | | | | | |
| Reports to shareholders | | | 2,615 | | | | | |
| Registration statement and prospectus | | | 2,114 | | | | | |
| Trustees’ compensation | | | 521 | | | | | |
| Auditing and legal | | | 706 | | | | | |
| Custodian | | | 1,348 | | | | | |
| Other | | | 2,318 | | | | 454,685 | |
| Net investment income | | | | | | | 1,053,717 | |
| | | | | | | | | |
| Net realized gain and unrealized depreciation: | | | | | | | | |
| Net realized gain (loss) on: | | | | | | | | |
| Investments (includes $175,871 net loss from affiliates) | | | 3,180,213 | | | | | |
| Currency transactions | | | (4,075 | ) | | | 3,176,138 | |
| Net unrealized (depreciation) appreciation on: | | | | | | | | |
| Investments | | | (1,817,693 | ) | | | | |
| Currency translations | | | 220 | | | | (1,817,473 | ) |
| Net realized gain and unrealized depreciation | | | | | | | 1,358,665 | |
| Net increase in net assets resulting from operations | | | | �� | | $ | 2,412,382 | |
*Additional information related to class-specific fees and expenses is included in the Notes to Financial Statements.
Statements of changes in net assets
(dollars in thousands)
| | | Year ended December 31 | |
| | | 2015 | | | 2014 | |
| Operations: | | | | | | | | |
| Net investment income | | $ | 1,053,717 | | | $ | 1,255,851 | |
| Net realized gain | | | 3,176,138 | | | | 5,202,676 | |
| Net unrealized depreciation | | | (1,817,473 | ) | | | (489,086 | ) |
| Net increase in net assets resulting from operations | | | 2,412,382 | | | | 5,969,441 | |
| | | | | | | | | |
| Dividends and distributions paid to shareholders: | | | | | | | | |
| Dividends from net investment income | | | (1,043,315 | ) | | | (1,225,000 | ) |
| Distributions from net realized gain on investments | | | (3,203,313 | ) | | | (4,617,443 | ) |
| Total dividends and distributions paid to shareholders | | | (4,246,628 | ) | | | (5,842,443 | ) |
| | | | | | | | | |
| Net capital share transactions | | | 2,915,001 | | | | 3,879,609 | |
| | | | | | | | | |
| Total increase in net assets | | | 1,080,755 | | | | 4,006,607 | |
| | | | | | | | | |
| Net assets: | | | | | | | | |
| Beginning of year | | | 71,683,619 | | | | 67,677,012 | |
| End of year (including undistributed net investment income: $191,802 and $174,637, respectively) | | $ | 72,764,374 | | | $ | 71,683,619 | |
See Notes to Financial Statements
Notes to financial statements
1. Organization
American Funds Fundamental Investors (the “trust”) is registered under the Investment Company Act of 1940 as an open-end, diversified management investment company and has initially issued one series of shares, Fundamental Investors (the “fund”). The fund seeks long-term growth of capital and income.
The fund has 18 share classes consisting of five retail share classes (Classes A, B and C, as well as two F share classes, F-1 and F-2), five 529 college savings plan share classes (Classes 529-A, 529-B, 529-C, 529-E and 529-F-1) and eight retirement plan share classes (Classes R-1, R-2, R-2E, R-3, R-4, R-5E, R-5 and R-6). The 529 college savings plan share classes can be used to save for college education. The retirement plan share classes are generally offered only through eligible employer-sponsored retirement plans. The fund’s share classes are described further in the following table:
| Share class | | Initial sales charge | | Contingent deferred sales charge upon
redemption | | Conversion feature | |
| Classes A and 529-A | | Up to 5.75% | | None (except 1% for certain redemptions within one year of purchase without an initial sales charge) | | None | |
| Classes B and 529-B* | | None | | Declines from 5% to 0% for redemptions within six years of purchase | | Classes B and 529-B convert to Classes A and 529-A, respectively, after eight years | |
| Class C | | None | | 1% for redemptions within one year of purchase | | Class C converts to Class F-1 after 10 years | |
| Class 529-C | | None | | 1% for redemptions within one year of purchase | | None | |
| Class 529-E | | None | | None | | None | |
| Classes F-1, F-2 and 529-F-1 | | None | | None | | None | |
| Classes R-1, R-2, R-2E, R-3, R-4, R-5E, R-5 and R-6 | | None | | None | | None | |
*Class B and 529-B shares of the fund are not available for purchase.
On November 20, 2015, the fund made an additional retirement plan share class (Class R-5E) available for sale pursuant to an amendment to its registration statement filed with the U.S. Securities and Exchange Commission. Refer to the fund’s prospectus for more details.
Holders of all share classes have equal pro rata rights to the assets, dividends and liquidation proceeds of the fund. Each share class has identical voting rights, except for the exclusive right to vote on matters affecting only its class. Share classes have different fees and expenses (“class-specific fees and expenses”), primarily due to different arrangements for distribution, transfer agent and administrative services. Differences in class-specific fees and expenses will result in differences in net investment income and, therefore, the payment of different per-share dividends by each share class.
2. Significant accounting policies
The fund is an investment company that applies the accounting and reporting guidance issued in Topic 946 by the U.S. Financial Accounting Standards Board. The fund’s financial statements have been prepared to comply with U.S. generally accepted accounting principles (“U.S. GAAP“). These principles require the fund’s investment adviser to make estimates and assumptions that affect reported amounts and disclosures. Actual results could differ from those estimates. Subsequent events, if any, have been evaluated through the date of issuance in the preparation of the financial statements. The fund follows the significant accounting policies described in this section, as well as the valuation policies described in the next section on valuation.
Security transactions and related investment income — Security transactions are recorded by the fund as of the date the trades are executed with brokers. Realized gains and losses from security transactions are determined based on the specific identified cost of the securities. In the event a security is purchased with a delayed payment date, the fund will segregate liquid assets sufficient to meet its payment obligations. Dividend income is recognized on the ex-dividend date and interest income is recognized on an accrual basis. Market discounts, premiums and original issue discounts on fixed-income securities are amortized daily over the expected life of the security.
Class allocations — Income, fees and expenses (other than class-specific fees and expenses) and realized and unrealized gains and losses are allocated daily among the various share classes based on their relative net assets. Class-specific fees and expenses, such as distribution, transfer agent and administrative services, are charged directly to the respective share class.
Dividends and distributions to shareholders — Dividends and distributions to shareholders are recorded on the ex-dividend date.
Currency translation — Assets and liabilities, including investment securities, denominated in currencies other than U.S. dollars are translated into U.S. dollars at the exchange rates supplied by one or more pricing vendors on the valuation date. Purchases and sales of investment securities and income and expenses are translated into U.S. dollars at the exchange rates on the dates of such transactions. The effects of changes in exchange rates on investment securities are included with the net realized gain or loss and net unrealized appreciation or depreciation on investments in the fund’s statement of operations. The realized gain or loss and unrealized appreciation or depreciation resulting from all other transactions denominated in currencies other than U.S. dollars are disclosed separately.
3. Valuation
Capital Research and Management Company (“CRMC”), the fund’s investment adviser, values the fund’s investments at fair value as defined by U.S. GAAP. The net asset value of each share class of the fund is generally determined as of approximately 4:00 p.m. New York time each day the New York Stock Exchange is open.
Methods and inputs — The fund’s investment adviser uses the following methods and inputs to establish the fair value of the fund’s assets and liabilities. Use of particular methods and inputs may vary over time based on availability and relevance as market and economic conditions evolve.
Equity securities are generally valued at the official closing price of, or the last reported sale price on, the exchange or market on which such securities are traded, as of the close of business on the day the securities are being valued or, lacking any sales, at the last available bid price. Prices for each security are taken from the principal exchange or market on which the security trades.
Fixed-income securities, including short-term securities, are generally valued at prices obtained from one or more pricing vendors. Vendors value such securities based on one or more of the inputs described in the following table. The table provides examples of inputs that are commonly relevant for valuing particular classes of fixed-income securities in which the fund is authorized to invest. However, these classifications are not exclusive, and any of the inputs may be used to value any other class of fixed-income security.
| Fixed-income class | | Examples of standard inputs |
| All | | Benchmark yields, transactions, bids, offers, quotations from dealers and trading systems, new issues, spreads and other relationships observed in the markets among comparable securities; and proprietary pricing models such as yield measures calculated using factors such as cash flows, financial or collateral performance and other reference data (collectively referred to as “standard inputs”) |
| Corporate bonds & notes; convertible securities | | Standard inputs and underlying equity of the issuer |
| Bonds & notes of governments & government agencies | | Standard inputs and interest rate volatilities |
| Mortgage-backed; asset-backed obligations | | Standard inputs and cash flows, prepayment information, default rates, delinquency and loss assumptions, collateral characteristics, credit enhancements and specific deal information |
When the fund’s investment adviser deems it appropriate to do so (such as when vendor prices are unavailable or deemed to be not representative), fixed-income securities will be valued in good faith at the mean quoted bid and ask prices that are reasonably and timely available (or bid prices, if ask prices are not available) or at prices for securities of comparable maturity, quality and type.
Securities with both fixed-income and equity characteristics, or equity securities traded principally among fixed-income dealers, are generally valued in the manner described above for either equity or fixed-income securities, depending on which method is deemed most appropriate by the fund’s investment adviser.
Securities and other assets for which representative market quotations are not readily available or are considered unreliable by the fund’s investment adviser are fair valued as determined in good faith under fair valuation guidelines adopted by authority of the fund’s board of trustees as further described. The investment adviser follows fair valuation guidelines, consistent with U.S. Securities and Exchange Commission rules and guidance, to consider relevant principles and factors when making fair value determinations. The investment
adviser considers relevant indications of value that are reasonably and timely available to it in determining the fair value to be assigned to a particular security, such as the type and cost of the security; contractual or legal restrictions on resale of the security; relevant financial or business developments of the issuer; actively traded similar or related securities; conversion or exchange rights on the security; related corporate actions; significant events occurring after the close of trading in the security; and changes in overall market conditions. In addition, the closing prices of equity securities that trade in markets outside U.S. time zones may be adjusted to reflect significant events that occur after the close of local trading but before the net asset value of each share class of the fund is determined. Fair valuations and valuations of investments that are not actively trading involve judgment and may differ materially from valuations that would have been used had greater market activity occurred.
Processes and structure — The fund’s board of trustees has delegated authority to the fund’s investment adviser to make fair value determinations, subject to board oversight. The investment adviser has established a Joint Fair Valuation Committee (the “Fair Valuation Committee”) to administer, implement and oversee the fair valuation process, and to make fair value decisions. The Fair Valuation Committee regularly reviews its own fair value decisions, as well as decisions made under its standing instructions to the investment adviser’s valuation teams. The Fair Valuation Committee reviews changes in fair value measurements from period to period and may, as deemed appropriate, update the fair valuation guidelines to better reflect the results of back testing and address new or evolving issues. The Fair Valuation Committee reports any changes to the fair valuation guidelines to the board of trustees with supplemental information to support the changes. The fund’s board and audit committee also regularly review reports that describe fair value determinations and methods.
The fund’s investment adviser has also established a Fixed-Income Pricing Review Group to administer and oversee the fixed-income valuation process, including the use of fixed-income pricing vendors. This group regularly reviews pricing vendor information and market data. Pricing decisions, processes and controls over security valuation are also subject to additional internal reviews, including an annual control self-evaluation program facilitated by the investment adviser’s compliance group.
Classifications — The fund’s investment adviser classifies the fund’s assets and liabilities into three levels based on the inputs used to value the assets or liabilities. Level 1 values are based on quoted prices in active markets for identical securities. Level 2 values are based on significant observable market inputs, such as quoted prices for similar securities and quoted prices in inactive markets. Certain securities trading outside the U.S. may transfer between Level 1 and Level 2 due to valuation adjustments resulting from significant market movements following the close of local trading. Level 3 values are based on significant unobservable inputs that reflect the investment adviser’s determination of assumptions that market participants might reasonably use in valuing the securities. The valuation levels are not necessarily an indication of the risk or liquidity associated with the underlying investment. For example, U.S. government securities are reflected as Level 2 because the inputs used to determine fair value may not always be quoted prices in an active market. The following table presents the fund’s valuation levels as of December 31, 2015 (dollars in thousands):
| | | Investment securities | |
| | | Level 1 | | | Level 2* | | | Level 3 | | | Total | |
| Assets: | | | | | | | | | | | | | | | | |
| Common stocks: | | | | | | | | | | | | | | | | |
| Consumer discretionary | | $ | 13,344,799 | | | $ | 177,743 | | | $ | — | | | $ | 13,522,542 | |
| Information technology | | | 11,786,095 | | | | 1,330,731 | | | | — | | | | 13,116,826 | |
| Financials | | | 10,120,363 | | | | 709,987 | | | | — | | | | 10,830,350 | |
| Health care | | | 8,040,956 | | | | 596,326 | | | | — | | | | 8,637,282 | |
| Consumer staples | | | 7,826,352 | | | | 518,851 | | | | — | | | | 8,345,203 | |
| Industrials | | | 7,091,701 | | | | 400,197 | | | | — | | | | 7,491,898 | |
| Energy | | | 4,574,521 | | | | 502,131 | | | | — | | | | 5,076,652 | |
| Materials | | | 2,097,035 | | | | — | | | | — | | | | 2,097,035 | |
| Other | | | 475,011 | | | | 188,475 | | | | — | | | | 663,486 | |
| Miscellaneous | | | 284,220 | | | | — | | | | — | | | | 284,220 | |
| Short-term securities | | | — | | | | 2,712,275 | | | | — | | | | 2,712,275 | |
| Total | | $ | 65,641,053 | | | $ | 7,136,716 | | | $ | — | | | $ | 72,777,769 | |
| * | Securities with a value of $4,424,441,000, which represented 6.08% of the net assets of the fund, were classified as Level 2 due to significant market movements following the close of local trading. |
4. Risk factors
Investing in the fund may involve certain risks including, but not limited to, those described below.
Market conditions — The prices of, and the income generated by, the common stocks and other securities held by the fund may decline — sometimes rapidly or unpredictably — due to various factors, including events or conditions affecting the general economy or particular industries; overall market changes; local, regional or global political, social or economic instability; governmental or governmental agency responses to economic conditions; and currency exchange rate, interest rate and commodity price fluctuations.
Issuer risks — The prices of, and the income generated by, securities held by the fund may decline in response to various factors directly related to the issuers of such securities, including reduced demand for an issuer’s goods or services, poor management performance and strategic initiatives such as mergers, acquisitions or dispositions and the market response to any such initiatives.
Investing in growth-oriented stocks — Growth-oriented common stocks and other equity-type securities (such as preferred stocks, convertible preferred stocks and convertible bonds) may involve larger price swings and greater potential for loss than other types of investments.
Investing in income-oriented stocks — Income provided by the fund may be reduced by changes in the dividend policies of, and the capital resources available for dividend payments at, the companies in which the fund invests.
Investing outside the U.S. — Securities of issuers domiciled outside the U.S., or with significant operations or revenues outside the U.S., may lose value because of adverse political, social, economic or market developments (including social instability, regional conflicts, terrorism and war) in the countries or regions in which the issuers operate or generate revenue. These securities may also lose value due to changes in foreign currency exchange rates against the U.S. dollar and/or currencies of other countries. Issuers of these securities may be more susceptible to actions of foreign governments, such as the imposition of price controls or punitive taxes, that could adversely impact revenues. Securities markets in certain countries may be more volatile and/or less liquid than those in the U.S. Investments outside the U.S. may also be subject to different accounting practices and different regulatory, legal and reporting standards and practices, and may be more difficult to value, than those in the U.S. In addition, the value of investments outside the U.S. may be reduced by foreign taxes, including foreign withholding taxes on interest and dividends. Further, there may be increased risks of delayed settlement of securities purchased or sold by the fund. The risks of investing outside the U.S. may be heightened in connection with investments in emerging markets.
Management — The investment adviser to the fund actively manages the fund’s investments. Consequently, the fund is subject to the risk that the methods and analyses employed by the investment adviser in this process may not produce the desired results. This could cause the fund to lose value or its investment results to lag relevant benchmarks or other funds with similar objectives.
5. Taxation and distributions
Federal income taxation — The fund complies with the requirements under Subchapter M of the Internal Revenue Code applicable to mutual funds and intends to distribute substantially all of its net taxable income and net capital gains each year. The fund is not subject to income taxes to the extent such distributions are made. Therefore, no federal income tax provision is required.
As of and during the period ended December 31, 2015, the fund did not have a liability for any unrecognized tax benefits. The fund recognizes interest and penalties, if any, related to unrecognized tax benefits as income tax expense in the statement of operations. During the period, the fund did not incur any interest or penalties.
The fund is not subject to examination by U.S. federal tax authorities for tax years before 2012, by state tax authorities for tax years before 2011 and by tax authorities outside the U.S. for tax years before 2008.
Non-U.S. taxation — Dividend and interest income are recorded net of non-U.S. taxes paid. The fund may file withholding tax reclaims in certain jurisdictions to recover a portion of amounts previously withheld. As a result of rulings from European courts, the fund filed for additional reclaims related to prior years. These reclaims are recorded when the amount is known and there are no significant uncertainties on collectability. Gains realized by the fund on the sale of securities in certain countries are subject to non-U.S. taxes. The fund records a liability based on unrealized gains to provide for potential non-U.S. taxes payable upon the sale of these securities.
Distributions — Distributions paid to shareholders are based on net investment income and net realized gains determined on a tax basis, which may differ from net investment income and net realized gains for financial reporting purposes. These differences are due primarily
to different treatment for items such as currency gains and losses; and short-term capital gains and losses. The fiscal year in which amounts are distributed may differ from the year in which the net investment income and net realized gains are recorded by the fund for financial reporting purposes. The fund may also designate a portion of the amount paid to redeeming shareholders as a distribution for tax purposes.
During the year ended December 31, 2015, the fund reclassified $6,835,000 from undistributed net realized gain to undistributed net investment income, $72,000 from undistributed net investment income to capital paid in on shares of beneficial interest and $220,193,000 from undistributed net realized gain to capital paid in on shares of beneficial interest to align financial reporting with tax reporting.
As of December 31, 2015, the tax-basis components of distributable earnings, unrealized appreciation (depreciation) and cost of investment securities were as follows (dollars in thousands):
| Undistributed ordinary income | | $ | 215,856 | |
| Undistributed long-term capital gains | | | 588,153 | |
| Gross unrealized appreciation on investment securities | | | 23,452,162 | |
| Gross unrealized depreciation on investment securities | | | (1,560,045 | ) |
| Net unrealized appreciation on investment securities | | | 21,892,117 | |
| Cost of investment securities | | | 50,885,652 | |
The tax character of distributions paid to shareholders was as follows (dollars in thousands):
| | | Year ended December 31, 2015 | | | Year ended December 31, 2014 | |
| | | | | | | | | Total | | | | | | | | | Total | |
| | | | | | | | | dividends and | | | | | | | | | dividends and | |
| | | Ordinary | | | Long-term | | | distributions | | | Ordinary | | | Long-term | | | distributions | |
| Share class | | income | | | capital gains | | | paid | | | income | | | capital gains | | | paid | |
| Class A | | $ | 648,551 | | | $ | 1,960,261 | | | $ | 2,608,812 | | | $ | 764,791 | | | $ | 2,831,568 | | | $ | 3,596,359 | |
| Class B | | | 1,371 | | | | 9,638 | | | | 11,009 | | | | 3,340 | | | | 22,585 | | | | 25,925 | |
| Class C | | | 16,060 | | | | 107,683 | | | | 123,743 | | | | 23,666 | | | | 157,991 | | | | 181,657 | |
| Class F-1 | | | 66,483 | | | | 211,242 | | | | 277,725 | | | | 84,501 | | | | 315,661 | | | | 400,162 | |
| Class F-2 | | | 70,402 | | | | 189,640 | | | | 260,042 | | | | 69,169 | | | | 243,008 | | | | 312,177 | |
| Class 529-A | | | 24,279 | | | | 78,648 | | | | 102,927 | | | | 28,473 | | | | 111,375 | | | | 139,848 | |
| Class 529-B | | | 89 | | | | 839 | | | | 928 | | | | 248 | | | | 1,972 | | | | 2,220 | |
| Class 529-C | | | 2,633 | | | | 19,903 | | | | 22,536 | | | | 3,983 | | | | 28,643 | | | | 32,626 | |
| Class 529-E | | | 818 | | | | 3,204 | | | | 4,022 | | | | 1,021 | | | | 4,643 | | | | 5,664 | |
| Class 529-F-1 | | | 1,260 | | | | 3,529 | | | | 4,789 | | | | 1,388 | | | | 4,820 | | | | 6,208 | |
| Class R-1 | | | 1,017 | | | | 6,895 | | | | 7,912 | | | | 1,646 | | | | 10,954 | | | | 12,600 | |
| Class R-2 | | | 5,296 | | | | 33,102 | | | | 38,398 | | | | 7,959 | | | | 51,351 | | | | 59,310 | |
| Class R-2E1 | | | 6 | | | | 31 | | | | 37 | | | | — | 2 | | | 1 | | | | 1 | |
| Class R-3 | | | 26,052 | | | | 103,305 | | | | 129,357 | | | | 37,696 | | | | 172,538 | | | | 210,234 | |
| Class R-4 | | | 34,218 | | | | 105,231 | | | | 139,449 | | | | 46,617 | | | | 175,597 | | | | 222,214 | |
| Class R-5E3 | | | — | 2 | | | — | 2 | | | — | 2 | | | | | | | | | | | | |
| Class R-5 | | | 33,213 | | | | 85,152 | | | | 118,365 | | | | 39,475 | | | | 128,126 | | | | 167,601 | |
| Class R-6 | | | 111,567 | | | | 285,010 | | | | 396,577 | | | | 111,027 | | | | 356,610 | | | | 467,637 | |
| Total | | $ | 1,043,315 | | | $ | 3,203,313 | | | $ | 4,246,628 | | | $ | 1,225,000 | | | $ | 4,617,443 | | | $ | 5,842,443 | |
| 1 | Class R-2E shares were offered beginning August 29, 2014. |
| 2 | Amount less than one thousand. |
| 3 | Class R-5E shares were offered beginning November 20, 2015. |
6. Fees and transactions with related parties
CRMC, the fund’s investment adviser, is the parent company of American Funds Distributors,® Inc. (“AFD”), the principal underwriter of the fund’s shares, and American Funds Service Company® (“AFS”), the fund’s transfer agent. CRMC, AFD and AFS are considered related parties to the fund.
Investment advisory services — The fund has an investment advisory and service agreement with CRMC that provides for monthly fees accrued daily. These fees are based on a series of decreasing annual rates beginning with 0.390% on the first $1 billion of daily net assets
and decreasing to 0.230% on such assets in excess of $71 billion. For the year ended December 31, 2015, the investment advisory services fee was $179,003,000, which was equivalent to an annualized rate of 0.246% of average daily net assets.
Class-specific fees and expenses — Expenses that are specific to individual share classes are accrued directly to the respective share class. The principal class-specific fees and expenses are further described below:
Distribution services — The fund has plans of distribution for all share classes, except Class F-2, R-5E, R-5 and R-6 shares. Under the plans, the board of trustees approves certain categories of expenses that are used to finance activities primarily intended to sell fund shares and service existing accounts. The plans provide for payments, based on an annualized percentage of average daily net assets, ranging from 0.25% to 1.00% as noted in this section. In some cases, the board of trustees has limited the amounts that may be paid to less than the maximum allowed by the plans. All share classes with a plan may use up to 0.25% of average daily net assets to pay service fees, or to compensate AFD for paying service fees, to firms that have entered into agreements with AFD to provide certain shareholder services. The remaining amounts available to be paid under each plan are paid to dealers to compensate them for their sales activities.
For Class A and 529-A shares, distribution-related expenses include the reimbursement of dealer and wholesaler commissions paid by AFD for certain shares sold without a sales charge. These share classes reimburse AFD for amounts billed within the prior 15 months but only to the extent that the overall annual expense limit of 0.25% is not exceeded. As of December 31, 2015, there were no unreimbursed expenses subject to reimbursement for Class A or 529-A shares.
| | Share class | | Currently approved limits | | Plan limits |
| | Class A | | | 0.25 | % | | | 0.25 | % |
| | Class 529-A | | | 0.25 | | | | 0.50 | |
| | Classes B and 529-B | | | 1.00 | | | | 1.00 | |
| | Classes C, 529-C and R-1 | | | 1.00 | | | | 1.00 | |
| | Class R-2 | | | 0.75 | | | | 1.00 | |
| | Class R-2E | | | 0.60 | | | | 0.85 | |
| | Classes 529-E and R-3 | | | 0.50 | | | | 0.75 | |
| | Classes F-1, 529-F-1 and R-4 | | | 0.25 | | | | 0.50 | |
Transfer agent services — The fund has a shareholder services agreement with AFS under which the fund compensates AFS for providing transfer agent services to each of the fund’s share classes. These services include recordkeeping, shareholder communications and transaction processing. In addition, the fund reimburses AFS for amounts paid to third parties for performing transfer agent services on behalf of fund shareholders.
Administrative services — The fund has an administrative services agreement with CRMC under which the fund compensates CRMC for providing administrative services to Class A, C, F, 529 and R shares. These services include, but are not limited to, coordinating, monitoring, assisting and overseeing third parties that provide services to fund shareholders. Under the agreement, Class A shares pay an annual fee of 0.01% and Class C, F, 529 and R shares pay an annual fee of 0.05% of their respective average daily net assets.
529 plan services — Each 529 share class is subject to service fees to compensate the Virginia College Savings Plan (“Virginia529”) for its oversight and administration of the 529 college savings plan. The quarterly fee is based on a series of decreasing annual rates beginning with 0.10% on the first $30 billion of the net assets invested in Class 529 shares of the American Funds and decreasing to 0.05% on such assets in excess of $70 billion. The fee for any given calendar quarter is accrued and calculated on the basis of the average net assets of Class 529 shares of the American Funds for the last month of the prior calendar quarter. The fee is included in other expenses in the fund’s statement of operations. Virginia529 is not considered a related party to the fund.
For the year ended December 31, 2015, class-specific expenses under the agreements were as follows (dollars in thousands):
| | | | Distribution | | | Transfer agent | | | Administrative | | | 529 plan |
| | Share class | | services | | | services | | | services | | | services |
| | Class A | | | $105,159 | | | | $45,080 | | | | $4,461 | | | Not applicable |
| | Class B | | | 2,560 | | | | 260 | | | | Not applicable | | | Not applicable |
| | Class C | | | 24,420 | | | | 2,452 | | | | 1,223 | | | Not applicable |
| | Class F-1 | | | 11,956 | | | | 5,452 | | | | 2,391 | | | Not applicable |
| | Class F-2 | | | Not applicable | | | | 4,255 | | | | 2,102 | | | Not applicable |
| | Class 529-A | | | 3,913 | | | | 1,546 | | | | 891 | | | $1,579 |
| | Class 529-B | | | 224 | | | | 22 | | | | 11 | | | 20 |
| | Class 529-C | | | 4,486 | | | | 416 | | | | 226 | | | 401 |
| | Class 529-E | | | 364 | | | | 33 | | | | 37 | | | 65 |
| | Class 529-F-1 | | | — | | | | 69 | | | | 40 | | | 70 |
| | Class R-1 | | | 1,615 | | | | 162 | | | | 81 | | | Not applicable |
| | Class R-2 | | | 5,738 | | | | 2,303 | | | | 384 | | | Not applicable |
| | Class R-2E | | | 1 | | | | — | * | | | — | * | | Not applicable |
| | Class R-3 | | | 12,228 | | | | 3,491 | | | | 1,224 | | | Not applicable |
| | Class R-4 | | | 6,238 | | | | 2,268 | | | | 1,247 | | | Not applicable |
| | Class R-5E† | | | Not applicable | | | | — | * | | | — | * | | Not applicable |
| | Class R-5 | | | Not applicable | | | | 909 | | | | 984 | | | Not applicable |
| | Class R-6 | | | Not applicable | | | | 22 | | | | 3,116 | | | Not applicable |
| | Total class-specific expenses | | | $178,902 | | | | $68,740 | | | | $18,418 | | | $2,135 |
| | | |
| | * | Amount less than one thousand. |
| | † | Class R-5E shares were offered beginning November 20, 2015. |
Trustees’ deferred compensation — Trustees who are unaffiliated with CRMC may elect to defer the cash payment of part or all of their compensation. These deferred amounts, which remain as liabilities of the fund, are treated as if invested in shares of the fund or other American Funds. These amounts represent general, unsecured liabilities of the fund and vary according to the total returns of the selected funds. Trustees’ compensation of $521,000 in the fund’s statement of operations includes $402,000 in current fees (either paid in cash or deferred) and a net increase of $119,000 in the value of the deferred amounts.
Affiliated officers and trustees — Officers and certain trustees of the fund are or may be considered to be affiliated with CRMC, AFD and AFS. No affiliated officers or trustees received any compensation directly from the fund.
7. Capital share transactions
Capital share transactions in the fund were as follows (dollars and shares in thousands):
| | | | | | | | | | | | | | | | | | | |
| | | Sales1 | | | Reinvestments of
dividends and distributions | | | Repurchases1 | | | Net increase
(decrease) | |
| Share class | | Amount | | | Shares | | | Amount | | | Shares | | | Amount | | | Shares | | | Amount | | | Shares | |
| | | | | | | | | | | | | | | | | | | | | | | | | | | | | | |
| Year ended December 31, 2015 | | | | | | | | | | | | | | | | | | |
| | | | | | | | | | | | | | | | | | | | | | | | | | | | | | | | | |
| Class A | | $ | 3,775,879 | | | | 72,112 | | | $ | 2,560,866 | | | | 50,144 | | | $ | (4,548,531 | ) | | | (86,784 | ) | | $ | 1,788,214 | | | | 35,472 | |
| Class B | | | 3,274 | | | | 62 | | | | 10,952 | | | | 215 | | | | (153,198 | ) | | | (2,919 | ) | | | (138,972 | ) | | | (2,642 | ) |
| Class C | | | 351,791 | | | | 6,746 | | | | 122,242 | | | | 2,408 | | | | (418,811 | ) | | | (8,026 | ) | | | 55,222 | | | | 1,128 | |
| Class F-1 | | | 795,630 | | | | 15,159 | | | | 275,791 | | | | 5,404 | | | | (899,255 | ) | | | (17,150 | ) | | | 172,166 | | | | 3,413 | |
| Class F-2 | | | 1,154,329 | | | | 22,042 | | | | 248,911 | | | | 4,876 | | | | (819,817 | ) | | | (15,681 | ) | | | 583,423 | | | | 11,237 | |
| Class 529-A | | | 186,084 | | | | 3,554 | | | | 102,916 | | | | 2,018 | | | | (189,844 | ) | | | (3,623 | ) | | | 99,156 | | | | 1,949 | |
| Class 529-B | | | 446 | | | | 9 | | | | 927 | | | | 18 | | | | (13,717 | ) | | | (261 | ) | | | (12,344 | ) | | | (234 | ) |
| Class 529-C | | | 52,773 | | | | 1,009 | | | | 22,526 | | | | 443 | | | | (57,658 | ) | | | (1,102 | ) | | | 17,641 | | | | 350 | |
| Class 529-E | | | 7,474 | | | | 143 | | | | 4,020 | | | | 79 | | | | (9,211 | ) | | | (176 | ) | | | 2,283 | | | | 46 | |
| Class 529-F-1 | | | 19,418 | | | | 372 | | | | 4,789 | | | | 94 | | | | (15,585 | ) | | | (298 | ) | | | 8,622 | | | | 168 | |
| Class R-1 | | | 24,667 | | | | 474 | | | | 7,900 | | | | 156 | | | | (44,679 | ) | | | (857 | ) | | | (12,112 | ) | | | (227 | ) |
| Class R-2 | | | 158,238 | | | | 3,036 | | | | 38,372 | | | | 756 | | | | (233,513 | ) | | | (4,478 | ) | | | (36,903 | ) | | | (686 | ) |
| Class R-2E | | | 1,070 | | | | 20 | | | | 36 | | | | 1 | | | | (1 | ) | | | — | 2 | | | 1,105 | | | | 21 | |
| Class R-3 | | | 402,063 | | | | 7,693 | | | | 129,235 | | | | 2,536 | | | | (865,867 | ) | | | (16,596 | ) | | | (334,569 | ) | | | (6,367 | ) |
| Class R-4 | | | 438,112 | | | | 8,366 | | | | 139,394 | | | | 2,733 | | | | (883,641 | ) | | | (16,882 | ) | | | (306,135 | ) | | | (5,783 | ) |
| Class R-5E3 | | | 10 | | | | — | 2 | | | — | | | | — | | | | — | | | | — | | | | 10 | | | | — | 2 |
| Class R-5 | | | 343,202 | | | | 6,544 | | | | 118,303 | | | | 2,314 | | | | (479,390 | ) | | | (9,136 | ) | | | (17,885 | ) | | | (278 | ) |
| Class R-6 | | | 1,536,959 | | | | 29,450 | | | | 395,776 | | | | 7,751 | | | | (886,656 | ) | | | (17,020 | ) | | | 1,046,079 | | | | 20,181 | |
| Total net increase (decrease) | | $ | 9,251,419 | | | | 176,791 | | | $ | 4,182,956 | | | | 81,946 | | | $ | (10,519,374 | ) | | | (200,989 | ) | | $ | 2,915,001 | | | | 57,748 | |
| | | | | | | | | | | | | | | | | | | | | | | | | | | | | | | | | |
| Year ended December 31, 2014 | | | | | | | | | | | | | | | | | | |
| | | | | | | | | | | | | | | | | | | | | | | | | | | | | | | | | |
| Class A | | $ | 3,350,182 | | | | 63,503 | | | $ | 3,529,145 | | | | 67,435 | | | $ | (4,850,703 | ) | | | (91,700 | ) | | $ | 2,028,624 | | | | 39,238 | |
| Class B | | | 4,981 | | | | 95 | | | | 25,761 | | | | 494 | | | | (168,496 | ) | | | (3,202 | ) | | | (137,754 | ) | | | (2,613 | ) |
| Class C | | | 313,800 | | | | 5,979 | | | | 179,147 | | | | 3,441 | | | | (408,310 | ) | | | (7,765 | ) | | | 84,637 | | | | 1,655 | |
| Class F-1 | | | 791,791 | | | | 15,055 | | | | 397,300 | | | | 7,599 | | | | (1,779,319 | ) | | | (33,155 | ) | | | (590,228 | ) | | | (10,501 | ) |
| Class F-2 | | | 1,773,938 | | | | 32,939 | | | | 297,943 | | | | 5,689 | | | | (589,626 | ) | | | (11,124 | ) | | | 1,482,255 | | | | 27,504 | |
| Class 529-A | | | 179,223 | | | | 3,397 | | | | 139,822 | | | | 2,675 | | | | (169,583 | ) | | | (3,198 | ) | | | 149,462 | | | | 2,874 | |
| Class 529-B | | | 826 | | | | 16 | | | | 2,219 | | | | 42 | | | | (14,745 | ) | | | (279 | ) | | | (11,700 | ) | | | (221 | ) |
| Class 529-C | | | 51,160 | | | | 971 | | | | 32,617 | | | | 625 | | | | (55,441 | ) | | | (1,048 | ) | | | 28,336 | | | | 548 | |
| Class 529-E | | | 7,578 | | | | 144 | | | | 5,664 | | | | 109 | | | | (8,144 | ) | | | (154 | ) | | | 5,098 | | | | 99 | |
| Class 529-F-1 | | | 15,714 | | | | 296 | | | | 6,198 | | | | 119 | | | | (12,887 | ) | | | (245 | ) | | | 9,025 | | | | 170 | |
| Class R-1 | | | 25,552 | | | | 485 | | | | 12,581 | | | | 242 | | | | (42,697 | ) | | | (808 | ) | | | (4,564 | ) | �� | | (81 | ) |
| Class R-2 | | | 151,803 | | | | 2,890 | | | | 59,273 | | | | 1,139 | | | | (199,925 | ) | | | (3,800 | ) | | | 11,151 | | | | 229 | |
| Class R-2E4 | | | 10 | | | | — | 2 | | | — | | | | — | | | | — | | | | — | | | | 10 | | | | — | 2 |
| Class R-3 | | | 435,871 | | | | 8,287 | | | | 210,119 | | | | 4,026 | | | | (823,455 | ) | | | (15,617 | ) | | | (177,465 | ) | | | (3,304 | ) |
| Class R-4 | | | 483,181 | | | | 9,170 | | | | 222,203 | | | | 4,256 | | | | (907,827 | ) | | | (17,183 | ) | | | (202,443 | ) | | | (3,757 | ) |
| Class R-5 | | | 410,325 | | | | 7,784 | | | | 167,445 | | | | 3,198 | | | | (565,911 | ) | | | (10,759 | ) | | | 11,859 | | | | 223 | |
| Class R-6 | | | 1,288,984 | | | | 24,539 | | | | 467,630 | | | | 8,928 | | | | (563,308 | ) | | | (10,617 | ) | | | 1,193,306 | | | | 22,850 | |
| Total net increase (decrease) | | $ | 9,284,919 | | | | 175,550 | | | $ | 5,755,067 | | | | 110,017 | | | $ | (11,160,377 | ) | | | (210,654 | ) | | $ | 3,879,609 | | | | 74,913 | |
| 1 | Includes exchanges between share classes of the fund. |
| 2 | Amount less than one thousand. |
| 3 | Class R-5E shares were offered beginning November 20, 2015. |
| 4 | Class R-2E shares were offered beginning August 29, 2014. |
8. Investment transactions
The fund made purchases and sales of investment securities, excluding short-term securities and U.S. government obligations, if any, of $18,815,478,000 and $18,417,245,000, respectively, during the year ended December 31, 2015.
Financial highlights
| | | | | | | Income (loss) from
investment operations1 | | | Dividends and distributions | | | | | | | | | | | | | | | | | | | | | |
| | | Net asset
value,
beginning
of period | | | Net
investment
income2 | | | Net gains
(losses) on
securities (both
realized and
unrealized) | | | Total from
investment
operations | | | Dividends
(from net
investment
income) | | | Distributions
(from capital
gains) | | | Total
dividends
and
distributions | | | Net asset
value,
end
of period | | | Total
return3 | | | Net assets,
end of period
(in millions) | | | Ratio of
expenses to
average
net assets | | | Ratio of
net income
to average
net assets2 | |
| Class A: | | | | | | | | | | | | | | | | | | | | | | | | | | | | | | | | | | | | | | | | | | | | | | | | |
| Year ended 12/31/2015 | | $ | 52.06 | | | $ | .77 | | | $ | .97 | | | $ | 1.74 | | | $ | (.77 | ) | | $ | (2.32 | ) | | $ | (3.09 | ) | | $ | 50.71 | | | | 3.38 | % | | $ | 44,596 | | | | .60 | % | | | 1.47 | % |
| Year ended 12/31/2014 | | | 51.97 | | | | .98 | | | | 3.63 | | | | 4.61 | | | | (.96 | ) | | | (3.56 | ) | | | (4.52 | ) | | | 52.06 | | | | 8.96 | | | | 43,929 | | | | .61 | | | | 1.85 | |
| Year ended 12/31/2013 | | | 40.78 | | | | .63 | | | | 12.13 | | | | 12.76 | | | | (.65 | ) | | | (.92 | ) | | | (1.57 | ) | | | 51.97 | | | | 31.49 | | | | 41,820 | | | | .63 | | | | 1.35 | |
| Year ended 12/31/2012 | | | 35.39 | | | | .64 | | | | 5.40 | | | | 6.04 | | | | (.65 | ) | | | — | | | | (.65 | ) | | | 40.78 | | | | 17.14 | | | | 32,568 | | | | .65 | | | | 1.66 | |
| Year ended 12/31/2011 | | | 36.70 | | | | .60 | | | | (1.29 | ) | | | (.69 | ) | | | (.62 | ) | | | — | | | | (.62 | ) | | | 35.39 | | | | (1.89 | ) | | | 30,176 | | | | .63 | | | | 1.62 | |
| Class B: | | | | | | | | | | | | | | | | | | | | | | | | | | | | | | | | | | | | | | | | | | | | | | | | |
| Year ended 12/31/2015 | | | 51.95 | | | | .37 | | | | .97 | | | | 1.34 | | | | (.33 | ) | | | (2.32 | ) | | | (2.65 | ) | | | 50.64 | | | | 2.61 | | | | 190 | | | | 1.36 | | | | .70 | |
| Year ended 12/31/2014 | | | 51.86 | | | | .61 | | | | 3.57 | | | | 4.18 | | | | (.53 | ) | | | (3.56 | ) | | | (4.09 | ) | | | 51.95 | | | | 8.13 | | | | 333 | | | | 1.37 | | | | 1.16 | |
| Year ended 12/31/2013 | | | 40.68 | | | | .27 | | | | 12.11 | | | | 12.38 | | | | (.28 | ) | | | (.92 | ) | | | (1.20 | ) | | | 51.86 | | | | 30.53 | | | | 468 | | | | 1.39 | | | | .59 | |
| Year ended 12/31/2012 | | | 35.30 | | | | .34 | | | | 5.39 | | | | 5.73 | | | | (.35 | ) | | | — | | | | (.35 | ) | | | 40.68 | | | | 16.25 | | | | 465 | | | | 1.41 | | | | .89 | |
| Year ended 12/31/2011 | | | 36.60 | | | | .31 | | | | (1.28 | ) | | | (.97 | ) | | | (.33 | ) | | | — | | | | (.33 | ) | | | 35.30 | | | | (2.64 | ) | | | 545 | | | | 1.40 | | | | .85 | |
| Class C: | | | | | | | | | | | | | | | | | | | | | | | | | | | | | | | | | | | | | | | | | | | | | | | | |
| Year ended 12/31/2015 | | | 51.83 | | | | .35 | | | | .97 | | | | 1.32 | | | | (.35 | ) | | | (2.32 | ) | | | (2.67 | ) | | | 50.48 | | | | 2.56 | | | | 2,435 | | | | 1.40 | | | | .67 | |
| Year ended 12/31/2014 | | | 51.77 | | | | .55 | | | | 3.60 | | | | 4.15 | | | | (.53 | ) | | | (3.56 | ) | | | (4.09 | ) | | | 51.83 | | | | 8.08 | | | | 2,441 | | | | 1.41 | | | | 1.05 | |
| Year ended 12/31/2013 | | | 40.63 | | | | .25 | | | | 12.09 | | | | 12.34 | | | | (.28 | ) | | | (.92 | ) | | | (1.20 | ) | | | 51.77 | | | | 30.44 | | | | 2,352 | | | | 1.43 | | | | .54 | |
| Year ended 12/31/2012 | | | 35.26 | | | | .33 | | | | 5.38 | | | | 5.71 | | | | (.34 | ) | | | — | | | | (.34 | ) | | | 40.63 | | | | 16.21 | | | | 1,852 | | | | 1.45 | | | | .86 | |
| Year ended 12/31/2011 | | | 36.56 | | | | .30 | | | | (1.28 | ) | | | (.98 | ) | | | (.32 | ) | | | — | | | | (.32 | ) | | | 35.26 | | | | (2.67 | ) | | | 1,804 | | | | 1.44 | | | | .82 | |
| Class F-1: | | | | | | | | | | | | | | | | | | | | | | | | | | | | | | | | | | | | | | | | | | | | | | | | |
| Year ended 12/31/2015 | | | 52.03 | | | | .74 | | | | .97 | | | | 1.71 | | | | (.73 | ) | | | (2.32 | ) | | | (3.05 | ) | | | 50.69 | | | | 3.33 | | | | 4,819 | | | | .67 | | | | 1.40 | |
| Year ended 12/31/2014 | | | 51.95 | | | | .96 | | | | 3.60 | | | | 4.56 | | | | (.92 | ) | | | (3.56 | ) | | | (4.48 | ) | | | 52.03 | | | | 8.87 | | | | 4,769 | | | | .66 | | | | 1.81 | |
| Year ended 12/31/2013 | | | 40.76 | | | | .59 | | | | 12.14 | | | | 12.73 | | | | (.62 | ) | | | (.92 | ) | | | (1.54 | ) | | | 51.95 | | | | 31.42 | | | | 5,306 | | | | .70 | | | | 1.27 | |
| Year ended 12/31/2012 | | | 35.37 | | | | .64 | | | | 5.39 | | | | 6.03 | | | | (.64 | ) | | | — | | | | (.64 | ) | | | 40.76 | | | | 17.12 | | | | 4,503 | | | | .66 | | | | 1.65 | |
| Year ended 12/31/2011 | | | 36.68 | | | | .59 | | | | (1.29 | ) | | | (.70 | ) | | | (.61 | ) | | | — | | | | (.61 | ) | | | 35.37 | | | | (1.92 | ) | | | 4,285 | | | | .67 | | | | 1.60 | |
| Class F-2: | | | | | | | | | | | | | | | | | | | | | | | | | | | | | | | | | | | | | | | | | | | | | | | | |
| Year ended 12/31/2015 | | | 52.04 | | | | .88 | | | | .97 | | | | 1.85 | | | | (.87 | ) | | | (2.32 | ) | | | (3.19 | ) | | | 50.70 | | | | 3.61 | | | | 4,389 | | | | .41 | | | | 1.67 | |
| Year ended 12/31/2014 | | | 51.96 | | | | 1.06 | | | | 3.66 | | | | 4.72 | | | | (1.08 | ) | | | (3.56 | ) | | | (4.64 | ) | | | 52.04 | | | | 9.17 | | | | 3,921 | | | | .40 | | | | 1.99 | |
| Year ended 12/31/2013 | | | 40.77 | | | | .74 | | | | 12.13 | | | | 12.87 | | | | (.76 | ) | | | (.92 | ) | | | (1.68 | ) | | | 51.96 | | | | 31.80 | | | | 2,485 | | | | .41 | | | | 1.58 | |
| Year ended 12/31/2012 | | | 35.39 | | | | .76 | | | | 5.37 | | | | 6.13 | | | | (.75 | ) | | | — | | | | (.75 | ) | | | 40.77 | | | | 17.39 | | | | 1,521 | | | | .41 | | | | 1.96 | |
| Year ended 12/31/2011 | | | 36.70 | | | | .68 | | | | (1.29 | ) | | | (.61 | ) | | | (.70 | ) | | | — | | | | (.70 | ) | | | 35.39 | | | | (1.67 | ) | | | 915 | | | | .42 | | | | 1.85 | |
| Class 529-A: | | | | | | | | | | | | | | | | | | | | | | | | | | | | | | | | | | | | | | | | | | | | | | | | |
| Year ended 12/31/2015 | | | 52.00 | | | | .72 | | | | .97 | | | | 1.69 | | | | (.72 | ) | | | (2.32 | ) | | | (3.04 | ) | | | 50.65 | | | | 3.28 | | | | 1,795 | | | | .70 | | | | 1.37 | |
| Year ended 12/31/2014 | | | 51.92 | | | | .93 | | | | 3.62 | | | | 4.55 | | | | (.91 | ) | | | (3.56 | ) | | | (4.47 | ) | | | 52.00 | | | | 8.85 | | | | 1,742 | | | | .70 | | | | 1.75 | |
| Year ended 12/31/2013 | | | 40.74 | | | | .59 | | | | 12.12 | | | | 12.71 | | | | (.61 | ) | | | (.92 | ) | | | (1.53 | ) | | | 51.92 | | | | 31.39 | | | | 1,590 | | | | .72 | | | | 1.26 | |
| Year ended 12/31/2012 | | | 35.36 | | | | .61 | | | | 5.39 | | | | 6.00 | | | | (.62 | ) | | | — | | | | (.62 | ) | | | 40.74 | | | | 17.03 | | | | 1,183 | | | | .73 | | | | 1.59 | |
| Year ended 12/31/2011 | | | 36.67 | | | | .57 | | | | (1.29 | ) | | | (.72 | ) | | | (.59 | ) | | | — | | | | (.59 | ) | | | 35.36 | | | | (1.97 | ) | | | 977 | | | | .71 | | | | 1.55 | |
| Class 529-B: | | | | | | | | | | | | | | | | | | | | | | | | | | | | | | | | | | | | | | | | | | | | | | | | |
| Year ended 12/31/2015 | | | 52.05 | | | | .30 | | | | .98 | | | | 1.28 | | | | (.25 | ) | | | (2.32 | ) | | | (2.57 | ) | | | 50.76 | | | | 2.49 | | | | 17 | | | | 1.49 | | | | .57 | |
| Year ended 12/31/2014 | | | 51.95 | | | | .54 | | | | 3.58 | | | | 4.12 | | | | (.46 | ) | | | (3.56 | ) | | | (4.02 | ) | | | 52.05 | | | | 7.97 | | | | 29 | | | | 1.49 | | | | 1.02 | |
| Year ended 12/31/2013 | | | 40.75 | | | | .21 | | | | 12.13 | | | | 12.34 | | | | (.22 | ) | | | (.92 | ) | | | (1.14 | ) | | | 51.95 | | | | 30.36 | | | | 41 | | | | 1.52 | | | | .46 | |
| Year ended 12/31/2012 | | | 35.36 | | | | .29 | | | | 5.39 | | | | 5.68 | | | | (.29 | ) | | | — | | | | (.29 | ) | | | 40.75 | | | | 16.09 | | | | 41 | | | | 1.54 | | | | .76 | |
| Year ended 12/31/2011 | | | 36.66 | | | | .27 | | | | (1.28 | ) | | | (1.01 | ) | | | (.29 | ) | | | — | | | | (.29 | ) | | | 35.36 | | | | (2.74 | ) | | | 48 | | | | 1.51 | | | | .74 | |
See page 27 for footnotes.
Financial highlights (continued)
| | | | | | | Income (loss) from
investment operations1 | | | Dividends and distributions | | | | | | | | | | | | | | | | | | | | | |
| | | Net asset
value,
beginning
of period | | | Net
investment
income2 | | | Net gains
(losses) on
securities (both
realized and
unrealized) | | | Total from
investment
operations | | | Dividends
(from net
investment
income) | | | Distributions
(from capital
gains) | | | Total
dividends
and
distributions | | | Net asset
value,
end
of period | | | Total
return3 | | | Net assets,
end of period
(in millions) | | | Ratio of
expenses to
average
net assets | | | Ratio of
net income
to average
net assets2 | |
| Class 529-C: | | | | | | | | | | | | | | | | | | | | | | | | | | | | | | | | | | | | | | | | | | | | | | | | |
| Year ended 12/31/2015 | | $ | 51.95 | | | $ | .31 | | | $ | .97 | | | $ | 1.28 | | | $ | (.31 | ) | | $ | (2.32 | ) | | $ | (2.63 | ) | | $ | 50.60 | | | | 2.48 | % | | $ | 451 | | | | 1.48 | % | | | .59 | % |
| Year ended 12/31/2014 | | | 51.88 | | | | .51 | | | | 3.62 | | | | 4.13 | | | | (.50 | ) | | | (3.56 | ) | | | (4.06 | ) | | | 51.95 | | | | 7.99 | | | | 445 | | | | 1.49 | | | | .97 | |
| Year ended 12/31/2013 | | | 40.71 | | | | .22 | | | | 12.11 | | | | 12.33 | | | | (.24 | ) | | | (.92 | ) | | | (1.16 | ) | | | 51.88 | | | | 30.37 | | | | 416 | | | | 1.51 | | | | .47 | |
| Year ended 12/31/2012 | | | 35.34 | | | | .30 | | | | 5.38 | | | | 5.68 | | | | (.31 | ) | | | — | | | | (.31 | ) | | | 40.71 | | | | 16.09 | | | | 319 | | | | 1.53 | | | | .79 | |
| Year ended 12/31/2011 | | | 36.64 | | | | .28 | | | | (1.28 | ) | | | (1.00 | ) | | | (.30 | ) | | | — | | | | (.30 | ) | | | 35.34 | | | | (2.72 | ) | | | 273 | | | | 1.51 | | | | .76 | |
| Class 529-E: | | | | | | | | | | | | | | | | | | | | | | | | | | | | | | | | | | | | | | | | | | | | | | | | |
| Year ended 12/31/2015 | | | 51.96 | | | | .59 | | | | .97 | | | | 1.56 | | | | (.59 | ) | | | (2.32 | ) | | | (2.91 | ) | | | 50.61 | | | | 3.04 | | | | 73 | | | | .94 | | | | 1.13 | |
| Year ended 12/31/2014 | | | 51.89 | | | | .80 | | | | 3.61 | | | | 4.41 | | | | (.78 | ) | | | (3.56 | ) | | | (4.34 | ) | | | 51.96 | | | | 8.58 | | | | 72 | | | | .94 | | | | 1.51 | |
| Year ended 12/31/2013 | | | 40.71 | | | | .47 | | | | 12.13 | | | | 12.60 | | | | (.50 | ) | | | (.92 | ) | | | (1.42 | ) | | | 51.89 | | | | 31.10 | | | | 67 | | | | .96 | | | | 1.02 | |
| Year ended 12/31/2012 | | | 35.34 | | | | .52 | | | | 5.37 | | | | 5.89 | | | | (.52 | ) | | | — | | | | (.52 | ) | | | 40.71 | | | | 16.73 | | | | 50 | | | | .98 | | | | 1.34 | |
| Year ended 12/31/2011 | | | 36.65 | | | | .47 | | | | (1.29 | ) | | | (.82 | ) | | | (.49 | ) | | | — | | | | (.49 | ) | | | 35.34 | | | | (2.23 | ) | | | 42 | | | | .98 | | | | 1.29 | |
| Class 529-F-1: | | | | | | | | | | | | | | | | | | | | | | | | | | | | | | | | | | | | | | | | | | | | | | | | |
| Year ended 12/31/2015 | | | 51.97 | | | | .83 | | | | .97 | | | | 1.80 | | | | (.83 | ) | | | (2.32 | ) | | | (3.15 | ) | | | 50.62 | | | | 3.51 | | | | 83 | | | | .48 | | | | 1.59 | |
| Year ended 12/31/2014 | | | 51.89 | | | | 1.04 | | | | 3.63 | | | | 4.67 | | | | (1.03 | ) | | | (3.56 | ) | | | (4.59 | ) | | | 51.97 | | | | 9.10 | | | | 76 | | | | .48 | | | | 1.96 | |
| Year ended 12/31/2013 | | | 40.71 | | | | .69 | | | | 12.12 | | | | 12.81 | | | | (.71 | ) | | | (.92 | ) | | | (1.63 | ) | | | 51.89 | | | | 31.70 | | | | 67 | | | | .51 | | | | 1.47 | |
| Year ended 12/31/2012 | | | 35.33 | | | | .69 | | | | 5.39 | | | | 6.08 | | | | (.70 | ) | | | — | | | | (.70 | ) | | | 40.71 | | | | 17.25 | | | | 48 | | | | .52 | | | | 1.79 | |
| Year ended 12/31/2011 | | | 36.65 | | | | .65 | | | | (1.30 | ) | | | (.65 | ) | | | (.67 | ) | | | — | | | | (.67 | ) | | | 35.33 | | | | (1.75 | ) | | | 40 | | | | .50 | | | | 1.77 | |
| Class R-1: | | | | | | | | | | | | | | | | | | | | | | | | | | | | | | | | | | | | | | | | | | | | | | | | |
| Year ended 12/31/2015 | | | 51.83 | | | | .35 | | | | .97 | | | | 1.32 | | | | (.34 | ) | | | (2.32 | ) | | | (2.66 | ) | | | 50.49 | | | | 2.55 | | | | 151 | | | | 1.40 | | | | .66 | |
| Year ended 12/31/2014 | | | 51.77 | | | | .56 | | | | 3.60 | | | | 4.16 | | | | (.54 | ) | | | (3.56 | ) | | | (4.10 | ) | | | 51.83 | | | | 8.08 | | | | 167 | | | | 1.41 | | | | 1.06 | |
| Year ended 12/31/2013 | | | 40.62 | | | | .26 | | | | 12.09 | | | | 12.35 | | | | (.28 | ) | | | (.92 | ) | | | (1.20 | ) | | | 51.77 | | | | 30.50 | | | | 171 | | | | 1.41 | | | | .57 | |
| Year ended 12/31/2012 | | | 35.26 | | | | .34 | | | | 5.37 | | | | 5.71 | | | | (.35 | ) | | | — | | | | (.35 | ) | | | 40.62 | | | | 16.22 | | | | 146 | | | | 1.42 | | | | .88 | |
| Year ended 12/31/2011 | | | 36.56 | | | | .31 | | | | (1.28 | ) | | | (.97 | ) | | | (.33 | ) | | | — | | | | (.33 | ) | | | 35.26 | | | | (2.65 | ) | | | 142 | | | | 1.43 | | | | .84 | |
| Class R-2: | | | | | | | | | | | | | | | | | | | | | | | | | | | | | | | | | | | | | | | | | | | | | | | | |
| Year ended 12/31/2015 | | | 51.82 | | | | .37 | | | | .97 | | | | 1.34 | | | | (.37 | ) | | | (2.32 | ) | | | (2.69 | ) | | | 50.47 | | | | 2.61 | | | | 734 | | | | 1.35 | | | | .72 | |
| Year ended 12/31/2014 | | | 51.76 | | | | .57 | | | | 3.60 | | | | 4.17 | | | | (.55 | ) | | | (3.56 | ) | | | (4.11 | ) | | | 51.82 | | | | 8.11 | | | | 790 | | | | 1.38 | | | | 1.08 | |
| Year ended 12/31/2013 | | | 40.62 | | | | .29 | | | | 12.08 | | | | 12.37 | | | | (.31 | ) | | | (.92 | ) | | | (1.23 | ) | | | 51.76 | | | | 30.55 | | | | 777 | | | | 1.36 | | | | .62 | |
| Year ended 12/31/2012 | | | 35.26 | | | | .35 | | | | 5.37 | | | | 5.72 | | | | (.36 | ) | | | — | | | | (.36 | ) | | | 40.62 | | | | 16.24 | | | | 630 | | | | 1.40 | | | | .91 | |
| Year ended 12/31/2011 | | | 36.56 | | | | .31 | | | | (1.28 | ) | | | (.97 | ) | | | (.33 | ) | | | — | | | | (.33 | ) | | | 35.26 | | | | (2.64 | ) | | | 589 | | | | 1.41 | | | | .85 | |
| Class R-2E: | | | | | | | | | | | | | | | | | | | | | | | | | | | | | | | | | | | | | | | | | | | | | | | | |
| Year ended 12/31/2015 | | | 52.03 | | | | .69 | | | | .90 | | | | 1.59 | | | | (.74 | ) | | | (2.32 | ) | | | (3.06 | ) | | | 50.56 | | | | 3.09 | | | | 1 | | | | 1.13 | | | | 1.37 | |
| Period from 8/29/2014 to 12/31/20144,5 | | | 55.04 | | | | .27 | | | | .52 | | | | .79 | | | | (.74 | ) | | | (3.06 | ) | | | (3.80 | ) | | | 52.03 | | | | 1.40 | 6,7 | | | — | 8 | | | .17 | 6,7 | | | .50 | 6,7 |
| Class R-3: | | | | | | | | | | | | | | | | | | | | | | | | | | | | | | | | | | | | | | | | | | | | | | | | |
| Year ended 12/31/2015 | | | 51.94 | | | | .59 | | | | .97 | | | | 1.56 | | | | (.58 | ) | | | (2.32 | ) | | | (2.90 | ) | | | 50.60 | | | | 3.03 | | | | 2,237 | | | | .95 | | | | 1.12 | |
| Year ended 12/31/2014 | | | 51.87 | | | | .80 | | | | 3.60 | | | | 4.40 | | | | (.77 | ) | | | (3.56 | ) | | | (4.33 | ) | | | 51.94 | | | | 8.56 | | | | 2,627 | | | | .96 | | | | 1.51 | |
| Year ended 12/31/2013 | | | 40.70 | | | | .48 | | | | 12.11 | | | | 12.59 | | | | (.50 | ) | | | (.92 | ) | | | (1.42 | ) | | | 51.87 | | | | 31.09 | | | | 2,795 | | | | .96 | | | | 1.02 | |
| Year ended 12/31/2012 | | | 35.32 | | | | .52 | | | | 5.39 | | | | 5.91 | | | | (.53 | ) | | | — | | | | (.53 | ) | | | 40.70 | | | | 16.78 | | | | 2,367 | | | | .96 | | | | 1.35 | |
| Year ended 12/31/2011 | | | 36.63 | | | | .48 | | | | (1.29 | ) | | | (.81 | ) | | | (.50 | ) | | | — | | | | (.50 | ) | | | 35.32 | | | | (2.22 | ) | | | 2,146 | | | | .96 | | | | 1.30 | |
| | | | | | | Income (loss) from
investment operations1 | | | Dividends and distributions | | | | | | | | | | | | | | | | | | | | | |
| | | Net asset
value,
beginning
of period | | | Net
investment
income2 | | | Net gains
(losses) on
securities (both
realized and
unrealized) | | | Total from
investment
operations | | | Dividends
(from net
investment
income) | | | Distributions
(from capital
gains) | | | Total
dividends
and
distributions | | | Net asset
value,
end
of period | | | Total
return3 | | | Net assets,
end of period
(in millions) | | | Ratio of
expenses to
average
net assets | | | Ratio of
net income
to average
net assets2 | |
| Class R-4: | | | | | | | | | | | | | | | | | | | | | | | | | | | | | | | | | | | | | | | | | | | | | | | | |
| Year ended 12/31/2015 | | $ | 51.96 | | | $ | .75 | | | $ | .97 | | | $ | 1.72 | | | $ | (.74 | ) | | $ | (2.32 | ) | | $ | (3.06 | ) | | $ | 50.62 | | | | 3.36 | % | | $ | 2,289 | | | | .65 | % | | | 1.42 | % |
| Year ended 12/31/2014 | | | 51.88 | | | | .96 | | | | 3.61 | | | | 4.57 | | | | (.93 | ) | | | (3.56 | ) | | | (4.49 | ) | | | 51.96 | | | | 8.90 | | | | 2,651 | | | | .66 | | | | 1.82 | |
| Year ended 12/31/2013 | | | 40.71 | | | | .61 | | | | 12.12 | | | | 12.73 | | | | (.64 | ) | | | (.92 | ) | | | (1.56 | ) | | | 51.88 | | | | 31.47 | | | | 2,842 | | | | .66 | | | | 1.32 | |
| Year ended 12/31/2012 | | | 35.33 | | | | .64 | | | | 5.39 | | | | 6.03 | | | | (.65 | ) | | | — | | | | (.65 | ) | | | 40.71 | | | | 17.13 | | | | 2,390 | | | | .66 | | | | 1.65 | |
| Year ended 12/31/2011 | | | 36.64 | | | | .59 | | | | (1.30 | ) | | | (.71 | ) | | | (.60 | ) | | | — | | | | (.60 | ) | | | 35.33 | | | | (1.92 | ) | | | 2,123 | | | | .66 | | | | 1.60 | |
| Class R-5E: | | | | | | | | | | | | | | | | | | | | | | | | | | | | | | | | | | | | | | | | | | | | | | | | |
| Period from 11/20/2015 to 12/31/20154,9 | | | 53.80 | | | | .11 | | | | (1.16 | ) | | | (1.05 | ) | | | (.35 | ) | | | (1.71 | ) | | | (2.06 | ) | | | 50.69 | | | | (1.95 | )7 | | | — | 8 | | | .05 | 7 | | | .21 | 7 |
| Class R-5: | | | | | | | | | | | | | | | | | | | | | | | | | | | | | | | | | | | | | | | | | | | | | | | | |
| Year ended 12/31/2015 | | | 52.08 | | | | .90 | | | | .98 | | | | 1.88 | | | | (.90 | ) | | | (2.32 | ) | | | (3.22 | ) | | | 50.74 | | | | 3.66 | | | | 1,914 | | | | .35 | | | | 1.72 | |
| Year ended 12/31/2014 | | | 51.99 | | | | 1.13 | | | | 3.62 | | | | 4.75 | | | | (1.10 | ) | | | (3.56 | ) | | | (4.66 | ) | | | 52.08 | | | | 9.23 | | | | 1,979 | | | | .35 | | | | 2.12 | |
| Year ended 12/31/2013 | | | 40.79 | | | | .76 | | | | 12.14 | | | | 12.90 | | | | (.78 | ) | | | (.92 | ) | | | (1.70 | ) | | | 51.99 | | | | 31.87 | | | | 1,964 | | | | .36 | | | | 1.62 | |
| Year ended 12/31/2012 | | | 35.40 | | | | .75 | | | | 5.40 | | | | 6.15 | | | | (.76 | ) | | | — | | | | (.76 | ) | | | 40.79 | | | | 17.47 | | | | 1,516 | | | | .36 | | | | 1.95 | |
| Year ended 12/31/2011 | | | 36.71 | | | | .70 | | | | (1.30 | ) | | | (.60 | ) | | | (.71 | ) | | | — | | | | (.71 | ) | | | 35.40 | | | | (1.62 | ) | | | 1,394 | | | | .36 | | | | 1.89 | |
| Class R-6: | | | | | | | | | | | | | | | | | | | | | | | | | | | | | | | | | | | | | | | | | | | | | | | | |
| Year ended 12/31/2015 | | | 52.06 | | | | .93 | | | | .97 | | | | 1.90 | | | | (.92 | ) | | | (2.32 | ) | | | (3.24 | ) | | | 50.72 | | | | 3.71 | | | | 6,590 | | | | .31 | | | | 1.77 | |
| Year ended 12/31/2014 | | | 51.98 | | | | 1.12 | | | | 3.64 | | | | 4.76 | | | | (1.12 | ) | | | (3.56 | ) | | | (4.68 | ) | | | 52.06 | | | | 9.27 | | | | 5,713 | | | | .31 | | | | 2.12 | |
| Year ended 12/31/2013 | | | 40.78 | | | | .79 | | | | 12.13 | | | | 12.92 | | | | (.80 | ) | | | (.92 | ) | | | (1.72 | ) | | | 51.98 | | | | 31.95 | | | | 4,516 | | | | .31 | | | | 1.68 | |
| Year ended 12/31/2012 | | | 35.39 | | | | .79 | | | | 5.38 | | | | 6.17 | | | | (.78 | ) | | | — | | | | (.78 | ) | | | 40.78 | | | | 17.53 | | | | 2,409 | | | | .31 | | | | 2.03 | |
| Year ended 12/31/2011 | | | 36.70 | | | | .72 | | | | (1.30 | ) | | | (.58 | ) | | | (.73 | ) | | | — | | | | (.73 | ) | | | 35.39 | | | | (1.57 | ) | | | 1,421 | | | | .31 | | | | 1.97 | |
| | | Year ended December 31 |
| | | 2015 | | 2014 | | 2013 | | 2012 | | 2011 |
| Portfolio turnover rate for all share classes | | | 27 | % | | | 29 | % | | | 34 | % | | | 28 | % | | | 28 | % |
| 1 | Based on average shares outstanding. |
| 2 | For the year ended December 31, 2014, this column reflects the impact of a corporate action event that resulted in a one-time increase to net investment income. If the corporate action event had not occurred, the Class A net investment income per share and ratio of net income to average net assets would have been lower by $.27 and .51 percentage points, respectively. The impact to the other share classes would have been similar. |
| 3 | Total returns exclude any applicable sales charges, including contingent deferred sales charges. |
| 4 | Based on operations for the period shown and, accordingly, is not representative of a full year. |
| 5 | Class R-2E shares were offered beginning August 29, 2014. |
| 6 | All or a significant portion of assets in this class consisted of seed capital invested by CRMC and/or its affiliates. Certain fees (including, where applicable, fees for distribution services) are not charged or accrued on these seed capital assets. If such fees were paid by the fund on seed capital assets, fund expenses would have been higher and net income and total return would have been lower. |
| 7 | Not annualized. |
| 8 | Amount less than $1 million. |
| 9 | Class R-5E shares were offered beginning November 20, 2015. |
See Notes to Financial Statements
Report of Independent Registered Public Accounting Firm
To the Shareholders and Board of Trustees of American Funds Fundamental Investors — Fundamental Investors:
We have audited the accompanying statement of assets and liabilities of American Funds Fundamental Investors – Fundamental Investors (the “Fund”), including the summary investment portfolio, as of December 31, 2015, and the related statement of operations for the year then ended, the statements of changes in net assets for each of the two years in the period then ended, and the financial highlights for each of the periods presented. These financial statements and financial highlights are the responsibility of the Fund’s management. Our responsibility is to express an opinion on these financial statements and financial highlights based on our audits.
We conducted our audits in accordance with the standards of the Public Company Accounting Oversight Board (United States). Those standards require that we plan and perform the audit to obtain reasonable assurance about whether the financial statements and financial highlights are free of material misstatement. The Fund is not required to have, nor were we engaged to perform, an audit of its internal control over financial reporting. Our audits included consideration of internal control over financial reporting as a basis for designing audit procedures that are appropriate in the circumstances, but not for the purpose of expressing an opinion on the effectiveness of the Fund’s internal control over financial reporting. Accordingly, we express no such opinion. An audit also includes examining, on a test basis, evidence supporting the amounts and disclosures in the financial statements, assessing the accounting principles used and significant estimates made by management, as well as evaluating the overall financial statement presentation. Our procedures included confirmation of securities owned as of December 31, 2015, by correspondence with the custodian and brokers; where replies were not received from brokers, we performed other auditing procedures. We believe that our audits provide a reasonable basis for our opinion.
In our opinion, such financial statements and financial highlights referred to above present fairly, in all material respects, the financial position of American Funds Fundamental Investors — Fundamental Investors as of December 31, 2015, the results of its operations for the year then ended, the changes in its net assets for each of the two years in the period then ended, and the financial highlights for each of the periods presented, in conformity with accounting principles generally accepted in the United States of America.
Deloitte & Touche LLP
Costa Mesa, California
February 10, 2016
As a fund shareholder, you incur two types of costs: (1) transaction costs, such as initial sales charges on purchase payments and contingent deferred sales charges on redemptions (loads), and (2) ongoing costs, including management fees, distribution and service (12b-1) fees, and other expenses. This example is intended to help you understand your ongoing costs (in dollars) of investing in the fund so you can compare these costs with the ongoing costs of investing in other mutual funds. The example is based on an investment of $1,000 invested at the beginning of the period and held for the entire six-month period (July 1, 2015, through December 31, 2015).
Actual expenses:
The first line of each share class in the table on the following page provides information about actual account values and actual expenses. You may use the information in this line, together with the amount you invested, to estimate the expenses that you paid over the period. Simply divide your account value by $1,000 (for example, an $8,600 account value divided by $1,000 = 8.6), then multiply the result by the number in the first line under the heading entitled “Expenses paid during period” to estimate the expenses you paid on your account during this period.
Hypothetical example for comparison purposes:
The second line of each share class in the table on the following page provides information about hypothetical account values and hypothetical expenses based on the actual expense ratio for the share class and an assumed rate of return of 5.00% per year before expenses, which is not the actual return of the share class. The hypothetical account values and expenses may not be used to estimate the actual ending account balance or expenses you paid for the period. You may use this information to compare the ongoing costs of investing in the fund and other funds. To do so, compare this 5.00% hypothetical example with the 5.00% hypothetical examples that appear in the shareholder reports of the other funds.
Notes:
Retirement plan participants may be subject to certain fees charged by the plan sponsor, and Class F-1, F-2 and 529-F-1 shareholders may be subject to fees charged by financial intermediaries, typically ranging from 0.75% to 1.50% of assets annually depending on services offered. You can estimate the impact of these fees by adding the amount of the fees to the total estimated expenses you paid on your account during the period as calculated above. In addition, your ending account value would be lower by the amount of these fees.
Note that the expenses shown in the table on the following page are meant to highlight your ongoing costs only and do not reflect any transactional costs, such as sales charges (loads). Therefore, the second line of each share class in the table is useful in comparing ongoing costs only and will not help you determine the relative total costs of owning different funds. In addition, if these transactional costs were included, your costs would have been higher.
| | | | Beginning
account value
7/1/2015 | | | | Ending
account value
12/31/2015 | | | | Expenses paid
during period* | | | | Annualized
expense ratio | |
| Class A - actual return | | $ | 1,000.00 | | | $ | 1,004.21 | | | $ | 3.03 | | | | .60 | % |
| Class A - assumed 5% return | | | 1,000.00 | | | | 1,022.18 | | | | 3.06 | | | | .60 | |
| Class B - actual return | | | 1,000.00 | | | | 1,000.39 | | | | 6.91 | | | | 1.37 | |
| Class B - assumed 5% return | | | 1,000.00 | | | | 1,018.30 | | | | 6.97 | | | | 1.37 | |
| Class C - actual return | | | 1,000.00 | | | | 1,000.36 | | | | 7.11 | | | | 1.41 | |
| Class C - assumed 5% return | | | 1,000.00 | | | | 1,018.10 | | | | 7.17 | | | | 1.41 | |
| Class F-1 - actual return | | | 1,000.00 | | | | 1,004.12 | | | | 3.38 | | | | .67 | |
| Class F-1 - assumed 5% return | | | 1,000.00 | | | | 1,021.83 | | | | 3.41 | | | | .67 | |
| Class F-2 - actual return | | | 1,000.00 | | | | 1,005.38 | | | | 2.07 | | | | .41 | |
| Class F-2 - assumed 5% return | | | 1,000.00 | | | | 1,023.14 | | | | 2.09 | | | | .41 | |
| Class 529-A - actual return | | | 1,000.00 | | | | 1,003.78 | | | | 3.59 | | | | .71 | |
| Class 529-A - assumed 5% return | | | 1,000.00 | | | | 1,021.63 | | | | 3.62 | | | | .71 | |
| Class 529-B - actual return | | | 1,000.00 | | | | 1,000.02 | | | | 7.56 | | | | 1.50 | |
| Class 529-B - assumed 5% return | | | 1,000.00 | | | | 1,017.64 | | | | 7.63 | | | | 1.50 | |
| Class 529-C - actual return | | | 1,000.00 | | | | 999.91 | | | | 7.51 | | | | 1.49 | |
| Class 529-C - assumed 5% return | | | 1,000.00 | | | | 1,017.69 | | | | 7.58 | | | | 1.49 | |
| Class 529-E - actual return | | | 1,000.00 | | | | 1,002.53 | | | | 4.74 | | | | .94 | |
| Class 529-E - assumed 5% return | | | 1,000.00 | | | | 1,020.47 | | | | 4.79 | | | | .94 | |
| Class 529-F-1 - actual return | | | 1,000.00 | | | | 1,005.01 | | | | 2.48 | | | | .49 | |
| Class 529-F-1 - assumed 5% return | | | 1,000.00 | | | | 1,022.74 | | | | 2.50 | | | | .49 | |
| Class R-1 - actual return | | | 1,000.00 | | | | 1,000.26 | | | | 7.11 | | | | 1.41 | |
| Class R-1 - assumed 5% return | | | 1,000.00 | | | | 1,018.10 | | | | 7.17 | | | | 1.41 | |
| Class R-2 - actual return | | | 1,000.00 | | | | 1,000.52 | | | | 6.96 | | | | 1.38 | |
| Class R-2 - assumed 5% return | | | 1,000.00 | | | | 1,018.25 | | | | 7.02 | | | | 1.38 | |
| Class R-2E - actual return | | | 1,000.00 | | | | 1,001.75 | | | | 5.85 | | | | 1.16 | |
| Class R-2E - assumed 5% return | | | 1,000.00 | | | | 1,019.36 | | | | 5.90 | | | | 1.16 | |
| Class R-3 - actual return | | | 1,000.00 | | | | 1,002.59 | | | | 4.85 | | | | .96 | |
| Class R-3 - assumed 5% return | | | 1,000.00 | | | | 1,020.37 | | | | 4.89 | | | | .96 | |
| Class R-4 - actual return | | | 1,000.00 | | | | 1,004.15 | | | | 3.33 | | | | .66 | |
| Class R-4 - assumed 5% return | | | 1,000.00 | | | | 1,021.88 | | | | 3.36 | | | | .66 | |
| Class R-5E - actual return† | | | 1,000.00 | | | | 980.50 | | | | .51 | | | | .46 | |
| Class R-5E - assumed 5% return† | | | 1,000.00 | | | | 1,022.89 | | | | 2.35 | | | | .46 | |
| Class R-5 - actual return | | | 1,000.00 | | | | 1,005.67 | | | | 1.77 | | | | .35 | |
| Class R-5 - assumed 5% return | | | 1,000.00 | | | | 1,023.44 | | | | 1.79 | | | | .35 | |
| Class R-6 - actual return | | | 1,000.00 | | | | 1,005.83 | | | | 1.57 | | | | .31 | |
| Class R-6 - assumed 5% return | | | 1,000.00 | | | | 1,023.64 | | | | 1.58 | | | | .31 | |
| * | The “expenses paid during period” are equal to the “annualized expense ratio,” multiplied by the average account value over the period, multiplied by the number of days in the period, and divided by 365 (to reflect the one-half year period). |
| † | The period for the “annualized expense ratio” and “actual return” line is based on the number of days since the initial sale of the share class on November 20, 2015. The “assumed 5% return” line is based on 184 days. |
We are required to advise you of the federal tax status of certain distributions received by shareholders during the fiscal year. The fund hereby designates the following amounts for the fund’s fiscal year ended December 31, 2015:
| Long-term capital gains | | $ | 3,423,506,000 |
| Qualified dividend income | | | 100% |
| Corporate dividends received deduction | | $ | 834,013,000 |
| U.S. government income that may be exempt from state taxation | | $ | 1,383,000 |
Individual shareholders should refer to their Form 1099 or other tax information, which was mailed in January 2016, to determine the calendar year amounts to be included on their 2015 tax returns. Shareholders should consult their tax advisors.
Approval of Investment Advisory and Service Agreement
Fundamental Investors board has approved the fund’s Investment Advisory and Service Agreement (the “agreement”) with Capital Research and Management Company (“CRMC”) for an additional one-year term through November 30, 2016. The board approved the agreement following the recommendation of the fund’s Contracts Committee (the “committee”), which is composed of all of the fund’s independent board members. The board and the committee determined that the fund’s advisory fee structure was fair and reasonable in relation to the services provided, and that approving the agreement was in the best interests of the fund and its shareholders.
In reaching this decision, the board and the committee took into account information furnished to them throughout the year and otherwise provided to them, as well as information prepared specifically in connection with their review of the agreement, and were advised by their independent counsel. They considered the following factors, among others, but did not identify any single issue or particular piece of information that, in isolation, was the controlling factor, and each board and committee member did not necessarily attribute the same weight to each factor.
1. Nature, extent and quality of services
The board and the committee considered the depth and quality of CRMC’s investment management process, including its global research capabilities; the experience, capability and integrity of its senior management and other personnel; the low turnover rates of its key personnel; the overall financial strength and stability of CRMC and the Capital Group organization; and the ongoing evolution of CRMC’s organizational structure designed to maintain and strengthen these qualities. The board and the committee also considered the nature, extent and quality of administrative, compliance and shareholder services provided by CRMC to the fund under the agreement and other agreements, as well as the benefits to fund shareholders from investing in a fund that is part of a large family of funds. The board and the committee concluded that the nature, extent and quality of the services provided by CRMC have benefited and should continue to benefit the fund and its shareholders.
2. Investment results
The board and the committee considered the investment results of the fund in light of its objective of pursuing long-term growth of capital and income. They compared the fund’s investment results with those of other funds (including funds that form the basis of the Lipper index for the category in which the fund is included), and data such as relevant market and fund indexes, over various periods through March 31, 2015. This report, including the letter to shareholders and related disclosures, contains certain information about the fund’s investment results. The board and the committee reviewed the fund’s investment results measured against various indexes, including the Lipper Growth and Income Funds Index and the Standard & Poor’s 500 Composite Index. They noted that the investment results of the fund generally compared favorably to those of these indexes for the lifetime period, 20-year period and 10-year period, and were mixed for shorter periods. The board and the committee concluded that the fund’s investment results have been satisfactory for renewal of the agreement, and that CRMC’s record in managing the fund indicated that its continued management should benefit the fund and its shareholders.
3. Advisory fees and total expenses
The board and the committee compared the advisory fees and total expense levels of the fund to those of other relevant funds. They observed that the fund’s advisory fees and expenses generally compared favorably to those of other similar funds included in the Lipper Growth and Income Funds category. The board and the committee also considered the breakpoint discounts in the fund’s advisory fee structure that reduce the level of fees charged by CRMC to the fund as fund assets increase. In addition, they reviewed information regarding the effective advisory fees charged to non-mutual fund clients by CRMC and its affiliates. They noted that, to the extent there were differences between the advisory fees paid by the fund and the advisory fees paid by those clients, the differences appropriately reflected the investment, operational and regulatory differences between advising the fund and the other clients. The board and the committee concluded that the fund’s cost structure was fair and reasonable in relation to the services provided, and that the fund’s shareholders receive reasonable value in return for the advisory fees and other amounts paid to CRMC by the fund.
4. Ancillary benefits
The board and the committee considered a variety of other benefits that CRMC and its affiliates receive as a result of CRMC’s relationship with the fund and the other American Funds, including fees for administrative services provided to certain share classes; fees paid to CRMC’s affiliated transfer agent; sales charges and distribution fees received and retained by the fund’s principal underwriter, an affiliate of CRMC; and possible ancillary benefits to CRMC and its institutional management affiliates in managing other investment vehicles. The board and the committee reviewed CRMC’s portfolio trading practices, noting the benefits CRMC receives from the research obtained with commissions from portfolio transactions made on behalf of the fund. The board and the committee took these ancillary benefits into account in evaluating the reasonableness of the advisory fees and other amounts paid to CRMC by the fund.
5. Adviser financial information
The board and the committee reviewed information regarding CRMC’s costs of providing services to the American Funds, including personnel, systems and resources of investment, compliance, trading, accounting and other administrative operations. They considered CRMC’s costs and related cost allocation methodology as well as its willingness to invest in technology, infrastructure and staff to maintain and expand services and capabilities, respond to industry and regulatory developments, and attract and retain qualified personnel. They noted information regarding the compensation structure for CRMC’s investment professionals. The board and the committee also compared CRMC’s profitability and compensation data to the reported results and data of several large, publicly held investment management companies. The board and the committee noted the competitiveness and cyclicality of both the mutual fund industry and the capital markets, and the importance in that environment of CRMC’s long-term profitability for maintaining its independence, company culture and management continuity. They further considered the breakpoint discounts in the fund’s advisory fee structure. The board and the committee concluded that the fund’s advisory fee structure reflected a reasonable sharing of benefits between CRMC and the fund’s shareholders.
Board of trustees and other officers
Independent trustees1
| Name and year of birth | | Year first
elected
a trustee
of the fund2 | | Principal occupation(s) during past five years | | Number of
portfolios in fund
complex overseen
by trustee | | Other directorships3
held by trustee |
| Ronald P. Badie, 1942 | | 2008 | | Retired; former Vice Chairman, Deutsche Bank Alex. Brown (retired 2002) | | 3 | | Amphenol Corporation; Nautilus, Inc. |
| Joseph C. Berenato, 1946 | | 2003 | | Former Chairman and CEO, Ducommun Incorporated (aerospace components manufacturer) | | 15 | | Ducommun Incorporated |
| Louise H. Bryson, 1944 | | 2008 | | Chair Emerita of the Board of Trustees, J. Paul Getty Trust; former President, Distribution, Lifetime Entertainment Network (retired 2008); former Executive Vice President and General Manager, Lifetime Movie Network (retired 2008) | | 7 | | None |
| Robert J. Denison, 1941 | | 2005 | | Chair, First Security Management (private investment) | | 6 | | None |
Mary Anne Dolan, 1947
Chairman of the Board (Independent and Non-Executive) | | 2010 | | Founder and President, MAD Ink (communications company) | | 10 | | None |
| John G. Freund, 1953 | | 2010 | | Founder and Managing Director, Skyline Ventures (venture capital investor in health care companies) | | 3 | | Collegium Pharmaceutical, Inc.; Proteon Therapeutics, Inc.; Tetraphase Pharmaceuticals, Inc.; XenoPort, Inc. |
| Linda Griego, 1947 | | 2015 | | President and CEO, Griego Enterprises, Inc. (business management company) | | 7 | | AECOM Technology Corporation; CBS Corporation |
| Leonade D. Jones, 1947 | | 1998 | | Retired; former Treasurer, The Washington Post Company (retired 1996) | | 10 | | None |
| William H. Kling, 1942 | | 2010 | | President Emeritus and former CEO, American Public Media | | 10 | | None |
| Christopher E. Stone, 1956 | | 2010 | | President, Open Society Foundations; former Professor of the Practice of Criminal Justice, John F. Kennedy School of Government, Harvard University | | 6 | | None |
Interested trustees4,5
Name, year of birth
and position with fund | | Year first
elected
a trustee
or officer
of the fund2 | | Principal occupation(s) during past five years
and positions held with affiliated entities or
the principal underwriter of the fund | | Number of
portfolios in fund
complex overseen
by trustee | | Other directorships3
held by trustee |
Dina N. Perry, 1945
Vice Chairman of the Board | | 1994 | | Partner – Capital World Investors, Capital Research and Management Company; Director, The Capital Group Companies, Inc.6 | | 1 | | None |
Brady L. Enright, 1967
President | | 2015 | | Partner – Capital World Investors, Capital Research and Management Company | | 1 | | None |
The fund’s statement of additional information includes further details about fund trustees and is available without charge upon request by calling American Funds Service Company at (800) 421-4225 or by visiting the American Funds website at americanfunds.com. The address for all trustees and officers of the fund is 333 South Hope Street, Los Angeles, CA 90071, Attention: Secretary.
Other officers5
Name, year of birth
and position with fund | | Year first
elected
an officer
of the fund2 | | Principal occupation(s) during past five years and positions held with affiliated entities
or the principal underwriter of the fund |
Paul F. Roye, 1953
Executive Vice President | | 2012 | | Director, Capital Research and Management Company; Senior Vice President – Fund Business Management Group, Capital Research and Management Company |
Michael T. Kerr, 1959
Senior Vice President | | 1995 | | Partner – Capital World Investors, Capital Research and Management Company; Director, The Capital Group Companies, Inc.6 |
Martin Romo, 1967
Senior Vice President | | 1999 | | Director, Capital Research and Management Company; Partner – Capital World Investors, Capital Research and Management Company; President and Director, Capital Research Company;6 Director, The Capital Group Companies, Inc.6 |
Walter R. Burkley, 1966
Vice President | | 2010 | | Senior Vice President and Senior Counsel – Fund Business Management Group, Capital Research and Management Company; Director, Capital Research Company6 |
Mark L. Casey, 1970
Vice President | | 2008 | | Partner – Capital World Investors, Capital Research and Management Company |
Ronald B. Morrow, 1945
Vice President | | 2004 | | Partner – Capital World Investors, Capital Research and Management Company |
Michael W. Stockton, 1967
Secretary | | 2014 | | Vice President – Fund Business Management Group, Capital Research and Management Company |
Jeffrey P. Regal, 1971
Treasurer | | 2006 | | Vice President – Investment Operations, Capital Research and Management Company |
Julie E. Lawton, 1973
Assistant Secretary | | 2010 | | Assistant Vice President — Fund Business Management Group, Capital Research and Management Company |
Dori Laskin, 1951
Assistant Treasurer | | 2011 | | Vice President – Investment Operations, Capital Research and Management Company |
Neal F. Wellons, 1971
Assistant Treasurer | | 2010 | | Vice President – Investment Operations, Capital Research and Management Company |
| 1 | The term independent trustee refers to a trustee who is not an “interested person” of the fund within the meaning of the Investment Company Act of 1940. |
| 2 | Trustees and officers of the fund serve until their resignation, removal or retirement. |
| 3 | This includes all directorships/trusteeships (other than those in the American Funds or other funds managed by Capital Research and Management Company or its affiliates) that are held by each trustee as a trustee or director of a public company or a registered investment company. |
| 4 | The term interested trustee refers to a trustee who is an “interested person” within the meaning of the Investment Company Act of 1940, on the basis of their affiliation with the fund’s investment adviser, Capital Research and Management Company, or affiliated entities (including the fund’s principal underwriter). |
| 5 | All of the directors/trustees and/or officers listed, except Mark L. Casey, are officers and/or directors/trustees of one or more of the other funds for which Capital Research and Management Company serves as investment adviser. |
| 6 | Company affiliated with Capital Research and Management Company. |
| Office of the fund |
| 6455 Irvine Center Drive |
| Irvine, CA 92618-4518 |
| |
| Investment adviser |
| Capital Research and Management Company |
| 333 South Hope Street |
| Los Angeles, CA 90071-1406 |
| |
| 6455 Irvine Center Drive |
| Irvine, CA 92618-4518 |
| |
| Transfer agent for shareholder accounts |
| American Funds Service Company |
| (Write to the address near you.) |
| |
| P.O. Box 6007 |
| Indianapolis, IN 46206-6007 |
| |
| P.O. Box 2280 |
| Norfolk, VA 23501-2280 |
| |
| Custodian of assets |
| State Street Bank and Trust Company |
| One Lincoln Street |
| Boston, MA 02111 |
| |
| Counsel |
| Dechert LLP |
| One Bush Street, Suite 1600 |
| San Francisco, CA 94104-4446 |
| |
| Independent registered public accounting firm |
| Deloitte & Touche LLP |
| 695 Town Center Drive |
| Suite 1200 |
| Costa Mesa, CA 92626-7188 |
| |
| Principal underwriter |
| American Funds Distributors, Inc. |
| 333 South Hope Street |
| Los Angeles, CA 90071-1406 |
| |
Investors should carefully consider investment objectives, risks, charges and expenses. This and other important information is contained in the fund prospectus and summary prospectus, which can be obtained from your financial professional and should be read carefully before investing. You may also call American Funds Service Company (AFS) at (800) 421-4225 or visit the American Funds website at americanfunds.com.
“American Funds Proxy Voting Procedures and Principles” — which describes how we vote proxies relating to portfolio securities — is available on the American Funds website or upon request by calling AFS. The fund files its proxy voting record with the U.S. Securities and Exchange Commission (SEC) for the 12 months ended June 30 by August 31. The proxy voting record is available free of charge on the SEC website at sec.gov and on the American Funds website.
A complete December 31, 2015, portfolio of Fundamental Investors’ investments is available free of charge by calling AFS or visiting the SEC website (where it is part of Form N-CSR).
Fundamental Investors files a complete list of its portfolio holdings with the SEC for the first and third quarters of each fiscal year on Form N-Q. This filing is available free of charge on the SEC website. You may also review or, for a fee, copy this filing at the SEC’s Public Reference Room in Washington, D.C. Additional information regarding the operation of the Public Reference Room may be obtained by calling the SEC’s Office of Investor Education and Advocacy at (800) SEC-0330. Additionally, the list of portfolio holdings is available by calling AFS.
This report is for the information of shareholders of Fundamental Investors, but it also may be used as sales literature when preceded or accompanied by the current prospectus or summary prospectus, which gives details about charges, expenses, investment objectives and operating policies of the fund. If used as sales material after March 31, 2016, this report must be accompanied by an American Funds statistical update for the most recently completed calendar quarter.
The American Funds Advantage
Since 1931, American Funds, part of Capital Group, has helped investors pursue long-term investment success. Our consistent approach — in combination with The Capital SystemSM — has resulted in a superior long-term track record.
| | Aligned with investor success |
| | We base our decisions on a long-term perspective, which we believe aligns our goals with the interests of our clients. Our portfolio managers average 27 years of investment experience, including 22 years at our company, reflecting a career commitment to our long-term approach.1 |
| | |
| | The Capital SystemSM |
| | The Capital System combines individual accountability with teamwork. Funds using The Capital System are divided into portions that are managed independently by investment professionals with diverse backgrounds, ages and investment approaches. An extensive global research effort is the backbone of our system. |
| | |
| | Superior long-term track record |
| | Our equity funds have beaten their Lipper peer indexes in 91% of 10-year periods and 95% of 20-year periods. Our fixed-income funds have beaten their Lipper indexes in 58% of 10-year periods and 58% of 20-year periods.2 Our fund management fees have been among the lowest in the industry.3 |
| | |
| | 1 | Portfolio manager experience as of December 31, 2015. |
| | 2 | Based on Class A share results for rolling periods through December 31, 2015. Periods covered are the shorter of the fund’s lifetime or since the comparable Lipper index inception date (except Capital Income Builder and SMALLCAP World Fund, for which the Lipper average was used). |
| | 3 | On average, our management fees were in the lowest quintile 68% of the time, based on the 20-year period ended December 31, 2015, versus comparable Lipper categories, excluding funds of funds. |

ITEM 2 – Code of Ethics
The Registrant has adopted a Code of Ethics that applies to its Principal Executive Officer and Principal Financial Officer. The Registrant undertakes to provide to any person without charge, upon request, a copy of the Code of Ethics. Such request can be made to American Funds Service Company at 800/421-9225 or to the Secretary of the Registrant, 6455 Irvine Center Drive, Irvine, California 92618.
ITEM 3 – Audit Committee Financial Expert
The Registrant’s board has determined that Ronald P. Badie, a member of the Registrant’s audit committee, is an “audit committee financial expert” and "independent," as such terms are defined in this Item. This designation will not increase the designee’s duties, obligations or liability as compared to his or her duties, obligations and liability as a member of the audit committee and of the board, nor will it reduce the responsibility of the other audit committee members. There may be other individuals who, through education or experience, would qualify as "audit committee financial experts" if the board had designated them as such. Most importantly, the board believes each member of the audit committee contributes significantly to the effective oversight of the Registrant’s financial statements and condition.
ITEM 4 – Principal Accountant Fees and Services
| | Registrant: |
| | | a) Audit Fees: |
| | | | 2014 | $93,000 |
| | | | 2015 | $95,000 |
| | | | |
| | | b) Audit-Related Fees: |
| | | | 2014 | $15,000 |
| | | | 2015 | $22,000 |
| | | | The audit-related fees consist of assurance and related services relating to the examination of the Registrant’s investment adviser conducted in accordance with Statement on Standards for Attestation Engagements Number 16 issued by the American Institute of Certified Public Accountants. |
| | | | |
| | | c) Tax Fees: |
| | | | 2014 | $9,000 |
| | | | 2015 | $8,000 |
| | | | The tax fees consist of professional services relating to the preparation of the Registrant’s tax returns including returns relating to the Registrant’s investments in non-U.S. jurisdictions. |
| | | | |
| | | d) All Other Fees: |
| | | | 2014 | None |
| | | | 2015 | None |
| | | | |
| | Adviser and affiliates (includes only fees for non-audit services billed to the adviser and affiliates for engagements that relate directly to the operations and financial reporting of the Registrant and were subject to the pre-approval policies described below): |
| | | a) Audit Fees: |
| | | | Not Applicable |
| | | | |
| | | b) Audit-Related Fees: |
| | | | 2014 | $927,000 |
| | | | 2015 | $1,183,000 |
| | | | The audit-related fees consist of assurance and related services relating to the examination of the Registrant’s transfer agent, principal underwriter and investment adviser conducted in accordance with Statement on Standards for Attestation Engagements Number 16 issued by the American Institute of Certified Public Accountants. |
| | | | |
| | | c) Tax Fees: |
| | | | 2014 | $33,000 |
| | | | 2015 | None |
| | | | The tax fees consist of consulting services relating to the Registrant’s investments. |
| | | | |
| | | d) All Other Fees: |
| | | | 2014 | $3,000 |
| | | | 2015 | $5,000 |
| | | | The other fees consist of subscription services related to an accounting research tool. |
| | | | |
All audit and permissible non-audit services that the Registrant’s audit committee considers compatible with maintaining the independent registered public accounting firm’s independence are required to be pre-approved by the committee. The pre-approval requirement will extend to all non-audit services provided to the Registrant, the investment adviser, and any entity controlling, controlled by, or under common control with the investment adviser that provides ongoing services to the Registrant, if the engagement relates directly to the operations and financial reporting of the Registrant. The committee will not delegate its responsibility to pre-approve these services to the investment adviser. The committee may delegate to one or more committee members the authority to review and pre-approve audit and permissible non-audit services. Actions taken under any such delegation will be reported to the full committee at its next meeting. The pre-approval requirement is waived with respect to non-audit services if certain conditions are met. The pre-approval requirement was not waived for any of the non-audit services listed above provided to the Registrant, adviser and affiliates.
Aggregate non-audit fees paid to the Registrant’s auditors, including fees for all services billed to the Registrant, adviser and affiliates that provide ongoing services to the Registrant, were $1,286,000 for fiscal year 2014 and $1,489,000 for fiscal year 2015. The non-audit services represented by these amounts were brought to the attention of the committee and considered to be compatible with maintaining the auditors’ independence.
ITEM 5 – Audit Committee of Listed Registrants
Not applicable to this Registrant, insofar as the Registrant is not a listed issuer as defined in Rule 10A-3 under the Securities Exchange Act of 1934.
ITEM 6 – Schedule of Investments
Fundamental Investors®
Investment portfolio
December 31, 2015
Common stocks 96.29%
Consumer discretionary 18.58% | Shares | Value
(000) |
| Amazon.com, Inc.1 | 4,906,800 | $3,316,457 |
| Home Depot, Inc. | 13,815,000 | 1,827,034 |
| Comcast Corp., Class A | 31,337,000 | 1,768,347 |
| Twenty-First Century Fox, Inc., Class A | 29,125,000 | 791,035 |
| McDonald’s Corp. | 6,351,000 | 750,307 |
| Walt Disney Co. | 7,140,000 | 750,271 |
| Target Corp. | 7,615,000 | 552,925 |
| Expedia, Inc. | 3,980,000 | 494,714 |
| Time Warner Inc. | 7,530,000 | 486,965 |
| Las Vegas Sands Corp. | 10,100,000 | 442,784 |
| Newell Rubbermaid Inc. | 6,335,000 | 279,247 |
| NIKE, Inc., Class B | 3,560,000 | 222,500 |
| CBS Corp., Class B | 4,480,000 | 211,142 |
| Viacom Inc., Class B | 5,000,000 | 205,800 |
| Johnson Controls, Inc. | 5,000,000 | 197,450 |
| Lowe’s Companies, Inc. | 2,556,800 | 194,419 |
| Macy’s, Inc. | 5,400,000 | 188,892 |
| Starbucks Corp. | 3,070,000 | 184,292 |
| Naspers Ltd., Class N2 | 1,300,000 | 177,743 |
| Charter Communications, Inc., Class A1 | 838,000 | 153,438 |
| Priceline Group Inc.1 | 120,000 | 152,994 |
| Liberty Global PLC, Class C1 | 2,353,511 | 95,953 |
| Liberty Global PLC, Class A1 | 863,679 | 36,585 |
| Ralph Lauren Corp., Class A | 370,000 | 41,248 |
| | | 13,522,542 |
| Information technology 18.03% | | |
| Microsoft Corp. | 63,465,000 | 3,521,039 |
| Avago Technologies Ltd. | 10,959,632 | 1,590,791 |
| Texas Instruments Inc. | 16,850,300 | 923,565 |
| Alphabet Inc., Class C1 | 754,317 | 572,436 |
| Alphabet Inc., Class A1 | 442,800 | 344,503 |
| Taiwan Semiconductor Manufacturing Co., Ltd.2 | 174,405,000 | 752,571 |
| Taiwan Semiconductor Manufacturing Co., Ltd. (ADR) | 4,009,800 | 91,223 |
| Intel Corp. | 22,130,173 | 762,384 |
| ASML Holding NV2 | 4,555,030 | 405,928 |
| ASML Holding NV (New York registered) | 3,036,000 | 269,506 |
| Visa Inc., Class A | 8,420,000 | 652,971 |
| Apple Inc. | 4,150,000 | 436,829 |
| salesforce.com, inc.1 | 4,670,000 | 366,128 |
| Intuit Inc. | 3,760,000 | 362,840 |
| Baidu, Inc., Class A (ADR)1 | 1,890,000 | 357,286 |
| Amphenol Corp., Class A | 6,750,000 | 352,552 |
| Analog Devices, Inc. | 4,999,000 | 276,545 |
| International Business Machines Corp. | 1,800,000 | 247,716 |
| MasterCard Inc., Class A | 2,500,000 | 243,400 |
| Cisco Systems, Inc. | 8,000,000 | 217,240 |
Fundamental Investors — Page 1 of 5
Common stocks
Information technology (continued) | Shares | Value
(000) |
| Murata Manufacturing Co., Ltd.2 | 1,200,000 | $172,232 |
| TE Connectivity Ltd. | 1,955,000 | 126,312 |
| KLA-Tencor Corp. | 825,140 | 57,223 |
| Facebook, Inc., Class A1 | 130,000 | 13,606 |
| | | 13,116,826 |
| Financials 14.88% | | |
| Wells Fargo & Co. | 28,680,916 | 1,559,095 |
| JPMorgan Chase & Co. | 19,000,000 | 1,254,570 |
| Berkshire Hathaway Inc., Class A1 | 4,555 | 900,979 |
| SunTrust Banks, Inc. | 14,903,987 | 638,487 |
| Capital One Financial Corp. | 8,712,000 | 628,832 |
| CME Group Inc., Class A | 6,731,437 | 609,868 |
| Citigroup Inc. | 10,000,000 | 517,500 |
| ACE Ltd. | 4,350,000 | 508,298 |
| American Express Co. | 6,495,000 | 451,727 |
| Goldman Sachs Group, Inc. | 2,438,200 | 439,437 |
| Legal & General Group PLC2 | 109,784,921 | 432,971 |
| PNC Financial Services Group, Inc. | 3,991,000 | 380,382 |
| Crown Castle International Corp. | 3,557,039 | 307,506 |
| Discover Financial Services | 5,730,000 | 307,243 |
| American International Group, Inc. | 4,666,700 | 289,195 |
| BlackRock, Inc. | 795,000 | 270,713 |
| Weyerhaeuser Co.1 | 9,000,107 | 269,823 |
| CNO Financial Group, Inc.3 | 11,900,000 | 227,171 |
| American Tower Corp. | 2,000,000 | 193,900 |
| Svenska Handelsbanken AB, Class A2 | 11,460,000 | 151,271 |
| KeyCorp | 11,100,000 | 146,409 |
| Aegon NV2 | 22,277,585 | 125,745 |
| Equinix, Inc. | 385,174 | 116,477 |
| Iron Mountain Inc. | 2,016,229 | 54,458 |
| HDFC Bank Ltd. (ADR) | 396,000 | 24,394 |
| Moody’s Corp. | 120,000 | 12,041 |
| Arch Capital Group Ltd.1 | 170,000 | 11,858 |
| | | 10,830,350 |
| Health care 11.87% | | |
| Express Scripts Holding Co.1 | 12,050,000 | 1,053,291 |
| Medtronic PLC | 12,040,000 | 926,117 |
| Merck & Co., Inc. | 16,710,000 | 882,622 |
| UnitedHealth Group Inc. | 5,501,500 | 647,197 |
| Bristol-Myers Squibb Co. | 8,600,000 | 591,594 |
| Vertex Pharmaceuticals Inc.1 | 4,675,000 | 588,255 |
| Boston Scientific Corp.1 | 25,005,000 | 461,092 |
| Thermo Fisher Scientific Inc. | 3,100,000 | 439,735 |
| Aetna Inc. | 3,860,000 | 417,343 |
| Regeneron Pharmaceuticals, Inc.1 | 759,000 | 412,038 |
| Gilead Sciences, Inc. | 3,418,790 | 345,947 |
| Johnson & Johnson | 3,100,000 | 318,432 |
| Novartis AG2 | 3,300,000 | 282,073 |
| Pfizer Inc. | 8,565,000 | 276,478 |
| Humana Inc. | 1,190,000 | 212,427 |
| AstraZeneca PLC2 | 2,610,000 | 176,459 |
| Abbott Laboratories | 3,456,771 | 155,244 |
| Baxalta Inc. | 3,751,755 | 146,431 |
Fundamental Investors — Page 2 of 5
Common stocks
Health care (continued) | Shares | Value
(000) |
| Hologic, Inc.1 | 3,565,000 | $137,930 |
| Roche Holding AG, non-registered shares, non-voting2 | 500,000 | 137,794 |
| Baxter International Inc. | 754,457 | 28,783 |
| | | 8,637,282 |
| Consumer staples 11.47% | | |
| Philip Morris International Inc. | 26,535,000 | 2,332,692 |
| Coca-Cola Co. | 28,435,000 | 1,221,568 |
| Reynolds American Inc. | 15,598,140 | 719,854 |
| Kroger Co. | 15,594,000 | 652,297 |
| Procter & Gamble Co. | 8,175,000 | 649,177 |
| Walgreens Boots Alliance, Inc. | 5,856,000 | 498,668 |
| Altria Group, Inc. | 6,310,000 | 367,305 |
| Kraft Heinz Co. | 4,900,000 | 356,524 |
| British American Tobacco PLC2 | 5,905,000 | 327,958 |
| Campbell Soup Co. | 6,000,000 | 315,300 |
| Costco Wholesale Corp. | 1,700,000 | 274,550 |
| CVS Health Corp. | 2,320,000 | 226,826 |
| Diageo PLC2 | 7,000,000 | 190,893 |
| Coca-Cola Enterprises, Inc. | 2,150,000 | 105,866 |
| Pinnacle Foods Inc. | 2,490,000 | 105,725 |
| | | 8,345,203 |
| Industrials 10.30% | | |
| General Electric Co. | 41,830,000 | 1,303,004 |
| Boeing Co. | 8,320,000 | 1,202,989 |
| Lockheed Martin Corp. | 2,953,200 | 641,287 |
| Union Pacific Corp. | 5,890,000 | 460,598 |
| Parker-Hannifin Corp. | 4,550,000 | 441,259 |
| Rockwell Automation | 3,500,000 | 359,135 |
| Northrop Grumman Corp. | 1,640,000 | 309,648 |
| Deere & Co. | 4,000,000 | 305,080 |
| TransDigm Group Inc.1 | 1,310,000 | 299,270 |
| Caterpillar Inc. | 4,275,000 | 290,529 |
| Honeywell International Inc. | 2,400,000 | 248,568 |
| Norfolk Southern Corp. | 1,934,600 | 163,648 |
| Grafton Group PLC, units2,3 | 15,037,000 | 163,642 |
| Masco Corp. | 5,717,235 | 161,798 |
| Ryanair Holdings PLC (ADR) | 1,803,750 | 155,952 |
| Republic Services, Inc. | 3,500,000 | 153,965 |
| Ingersoll-Rand PLC | 2,500,000 | 138,225 |
| KAR Auction Services, Inc. | 3,500,000 | 129,605 |
| Fastenal Co. | 3,100,000 | 126,542 |
| Cummins Inc. | 1,430,300 | 125,881 |
| MTU Aero Engines AG2 | 1,120,089 | 109,187 |
| Waste Management, Inc. | 1,400,000 | 74,718 |
| Airbus Group SE, non-registered shares2 | 975,000 | 65,465 |
| Meggitt PLC2 | 11,223,014 | 61,903 |
| | | 7,491,898 |
| Energy 6.98% | | |
| ConocoPhillips | 14,210,000 | 663,465 |
| Chevron Corp. | 5,476,137 | 492,633 |
| Royal Dutch Shell PLC, Class B (ADR) | 4,663,834 | 214,723 |
| Royal Dutch Shell PLC, Class B2 | 6,500,000 | 148,423 |
Fundamental Investors — Page 3 of 5
Common stocks
Energy (continued) | Shares | Value
(000) |
| Royal Dutch Shell PLC, Class A (ADR) | 89,400 | $4,093 |
| Concho Resources Inc.1 | 3,630,000 | 337,082 |
| Enbridge Inc. (CAD denominated) | 9,721,391 | 323,180 |
| EOG Resources, Inc. | 4,395,000 | 311,122 |
| Schlumberger Ltd. | 4,350,000 | 303,412 |
| Baker Hughes Inc. | 6,458,300 | 298,050 |
| Suncor Energy Inc. | 10,996,034 | 283,861 |
| Helmerich & Payne, Inc. | 4,400,000 | 235,620 |
| BP PLC2 | 40,000,000 | 208,438 |
| Peyto Exploration & Development Corp.3 | 10,332,287 | 185,708 |
| Cimarex Energy Co. | 1,865,000 | 166,694 |
| Phillips 66 | 1,709,488 | 139,836 |
| Murphy Oil Corp. | 6,008,800 | 134,898 |
| TOTAL SA (ADR) | 1,936,028 | 87,024 |
| TOTAL SA2 | 1,047,711 | 46,661 |
| Noble Energy, Inc. | 3,746,400 | 123,369 |
| Cameron International Corp.1 | 1,800,000 | 113,760 |
| BG Group PLC2 | 6,800,000 | 98,609 |
| Halliburton Co. | 1,765,000 | 60,081 |
| Southwestern Energy Co.1 | 8,000,000 | 56,880 |
| Tourmaline Oil Corp.1 | 1,633,800 | 26,390 |
| CONSOL Energy Inc. | 1,600,000 | 12,640 |
| | | 5,076,652 |
| Materials 2.88% | | |
| Praxair, Inc. | 7,035,000 | 720,384 |
| E.I. du Pont de Nemours and Co. | 9,968,525 | 663,904 |
| LyondellBasell Industries NV | 4,270,000 | 371,063 |
| FMC Corp.3 | 6,758,000 | 264,440 |
| Potash Corp. of Saskatchewan Inc. | 3,000,000 | 51,360 |
| HudBay Minerals Inc. | 6,744,900 | 25,884 |
| | | 2,097,035 |
| Telecommunication services 0.73% | | |
| Verizon Communications Inc. | 4,552,004 | 210,393 |
| SoftBank Group Corp.2 | 3,740,000 | 188,475 |
| AT&T Inc. | 3,500,000 | 120,435 |
| Frontier Communications Corp. | 2,400,000 | 11,208 |
| | | 530,511 |
| Utilities 0.18% | | |
| PG&E Corp. | 2,500,000 | 132,975 |
| Miscellaneous 0.39% | | |
| Other common stocks in initial period of acquisition | | 284,220 |
| Total common stocks (cost: $48,174,111,000) | | 70,065,494 |
| Short-term securities 3.73% | Principal amount
(000) | |
| Apple Inc. 0.16%–0.20% due 1/8/2016–1/20/20164 | $70,100 | 70,093 |
| CAFCO, LLC 0.32%–0.33% due 2/22/2016–2/24/2016 | 100,000 | 99,961 |
| Chevron Corp. 0.19%–0.50% due 1/20/2016–3/8/20164 | 93,200 | 93,166 |
| Ciesco LLC 0.50% due 5/2/2016 | 50,000 | 49,925 |
Fundamental Investors — Page 4 of 5
| Short-term securities | Principal amount
(000) | Value
(000) |
| Coca-Cola Co. 0.47% due 5/18/20164 | $25,000 | $24,955 |
| Emerson Electric Co. 0.34% due 3/1/20164 | 40,500 | 40,476 |
| ExxonMobil Corp. 0.14% due 1/21/2016 | 45,000 | 44,991 |
| Fannie Mae 0.17%–0.37% due 1/4/2016–5/11/2016 | 83,500 | 83,469 |
| Federal Farm Credit Banks 0.21% due 2/10/2016 | 50,000 | 49,992 |
| Federal Home Loan Bank 0.11%–0.54% due 1/7/2016–6/6/2016 | 1,517,205 | 1,516,577 |
| Freddie Mac 0.16%–0.27% due 1/5/2016–4/5/2016 | 198,800 | 198,763 |
| Google Inc. 0.14% due 1/26/20164 | 20,000 | 19,997 |
| Honeywell International Inc. 0.37% due 1/8/20164 | 55,000 | 54,997 |
| Intel Corp. 0.40% due 2/25/2016 | 40,000 | 39,977 |
| Jupiter Securitization Co., LLC 0.50% due 5/5/20164 | 50,000 | 49,865 |
| National Rural Utilities Cooperative Finance Corp. 0.37% due 1/27/2016 | 25,000 | 24,993 |
| Parker-Hannifin Corp. 0.35% due 1/22/20164 | 40,000 | 39,991 |
| Qualcomm Inc. 0.18% due 1/5/20164 | 35,000 | 34,999 |
| Regents of the University of California 0.18% due 1/11/2016 | 25,000 | 24,999 |
| U.S. Treasury Bills 0.08% due 1/14/2016 | 50,000 | 49,998 |
| Wells Fargo Bank, N.A. 0.54% due 5/9/2016 | 100,000 | 100,091 |
| Total short-term securities (cost: $2,712,044,000) | | 2,712,275 |
| Total investment securities 100.02% (cost: $50,886,155,000) | | 72,777,769 |
| Other assets less liabilities (0.02)% | | (13,395) |
| Net assets 100.00% | | $72,764,374 |
As permitted by U.S. Securities and Exchange Commission regulations, “Miscellaneous” securities include holdings in their first year of acquisition that have not previously been publicly disclosed.
| 1 | Security did not produce income during the last 12 months. |
| 2 | Valued under fair value procedures adopted by authority of the board of trustees. The total value of all such securities was $4,424,441,000, which represented 6.08% of the net assets of the fund. This entire amount relates to certain securities trading outside the U.S. whose values were adjusted as a result of significant market movements following the close of local trading. |
| 3 | Represents an affiliated company as defined under the Investment Company Act of 1940. |
| 4 | Acquired in a transaction exempt from registration under Section 4(2) of the Securities Act of 1933. May be resold in the U.S. in transactions exempt from registration, normally to qualified institutional buyers. The total value of all such securities was $428,539,000, which represented .59% of the net assets of the fund. |
| Key to abbreviations |
| ADR = American Depositary Receipts |
| CAD = Canadian dollars |
Investments are not FDIC-insured, nor are they deposits of or guaranteed by a bank or any other entity, so they may lose value.
Investors should carefully consider investment objectives, risks, charges and expenses. This and other important information is contained in the fund prospectus and summary prospectus, which can be obtained from your financial professional and should be read carefully before investing. You may also call American Funds Service Company (AFS) at (800) 421-4225 or visit the American Funds website at americanfunds.com.
| MFGEFPX-010-0216O-S49187 | Fundamental Investors — Page 5 of 5 |
REPORT OF INDEPENDENT REGISTERED PUBLIC ACCOUNTING FIRM
To the Shareholders and Board of Trustees of
American Funds Fundamental Investors – Fundamental Investors:
We have audited the accompanying statement of assets and liabilities of American Funds Fundamental Investors – Fundamental Investors (the “Fund”), including the summary schedule of investments, as of December 31, 2015, and the related statements of operations for the year then ended, the statements of changes in net assets for each of the two years in the period then ended (collectively, the “financial statements”), the financial highlights for each of the five years in the period then ended (the financial statements and financial highlights are included in Item 1 of this Form N-CSR), and the schedule of investments in securities as of December 31, 2015 (included in Item 6 of this Form N-CSR). These financial statements, financial highlights, and schedule of investments in securities are the responsibility of the Fund’s management. Our responsibility is to express an opinion on these financial statements, financial highlights, and schedule of investments in securities based on our audits.
We conducted our audits in accordance with the standards of the Public Company Accounting Oversight Board (United States). Those standards require that we plan and perform the audit to obtain reasonable assurance about whether the financial statements, financial highlights, and schedule of investments in securities are free of material misstatement. An audit includes examining, on a test basis, evidence supporting the amounts and disclosures in the financial statements and schedule of investments in securities, assessing the accounting principles used and significant estimates made by management, as well as evaluating the overall financial statement presentation. Our procedures included confirmation of securities owned as of December 31, 2015, by correspondence with the custodian and brokers; where replies were not received from brokers, we performed other auditing procedures. We believe that our audits provide a reasonable basis for our opinion.
In our opinion, the financial statements, financial highlights, and schedule of investments in securities referred to above present fairly, in all material respects, the financial position of American Funds Fundamental Investors – Fundamental Investors as of December 31, 2015, and the results of its operations for the year then ended, the changes in its net assets for each of the two years in the period then ended, and the financial highlights for each of the five years in the period then ended, in conformity with accounting principles generally accepted in the United States of America.
DELOITTE & TOUCHE LLP
Costa Mesa, California
February 10, 2016
ITEM 7 – Disclosure of Proxy Voting Policies and Procedures for Closed-End Management Investment Companies
Not applicable to this Registrant, insofar as the Registrant is not a closed-end management investment company.
ITEM 8 – Portfolio Managers of Closed-End Management Investment Companies
Not applicable to this Registrant, insofar as the Registrant is not a closed-end management investment company.
ITEM 9 – Purchases of Equity Securities by Closed-End Management Investment Company and Affiliated Purchasers
Not applicable to this Registrant, insofar as the Registrant is not a closed-end management investment company.
ITEM 10 – Submission of Matters to a Vote of Security Holders
There have been no material changes to the procedures by which shareholders may recommend nominees to the Registrant’s board of trustees since the Registrant last submitted a proxy statement to its shareholders. The procedures are as follows. The Registrant has a nominating and governance committee comprised solely of persons who are not considered ‘‘interested persons’’ of the Registrant within the meaning of the Investment Company Act of 1940, as amended. The committee periodically reviews such issues as the board’s composition, responsibilities, committees, compensation and other relevant issues, and recommends any appropriate changes to the full board of trustees. While the committee normally is able to identify from its own resources an ample number of qualified candidates, it will consider shareholder suggestions of persons to be considered as nominees to fill future vacancies on the board. Such suggestions must be sent in writing to the nominating and governance committee of the Registrant, c/o the Registrant’s Secretary, and must be accompanied by complete biographical and occupational data on the prospective nominee, along with a written consent of the prospective nominee for consideration of his or her name by the nominating and governance committee.
ITEM 11 – Controls and Procedures
| (a) | The Registrant’s Principal Executive Officer and Principal Financial Officer have concluded, based on their evaluation of the Registrant’s disclosure controls and procedures (as such term is defined in Rule 30a-3 under the Investment Company Act of 1940), that such controls and procedures are adequate and reasonably designed to achieve the purposes described in paragraph (c) of such rule. |
| | |
| (b) | There were no changes in the Registrant’s internal controls over financial reporting (as defined in Rule 30a-3(d) under the Investment Company Act of 1940) that occurred during the Registrant’s second fiscal quarter of the period covered by this report that has materially affected, or is reasonably likely to materially affect, the Registrant’s internal control over financial reporting. |
ITEM 12 – Exhibits
| (a)(1) | The Code of Ethics that is the subject of the disclosure required by Item 2 is attached as an exhibit hereto. |
| | |
| (a)(2) | The certifications required by Rule 30a-2 of the Investment Company Act of 1940 and Sections 302 and 906 of the Sarbanes-Oxley Act of 2002 are attached as exhibits hereto. |
SIGNATURES
Pursuant to the requirements of the Securities Exchange Act of 1934 and the Investment Company Act of 1940, the Registrant has duly caused this report to be signed on its behalf by the undersigned, thereunto duly authorized.
| | AMERICAN FUNDS FUNDAMENTAL INVESTORS |
| | |
| | By /s/ Paul F. Roye |
| | Paul F. Roye, Executive Vice President and Principal Executive Officer |
| | |
| | Date: February 29, 2016 |
Pursuant to the requirements of the Securities Exchange Act of 1934 and the Investment Company Act of 1940, this report has been signed below by the following persons on behalf of the Registrant and in the capacities and on the dates indicated.
| By /s/ Paul F. Roye |
Paul F. Roye, Executive Vice President and Principal Executive Officer |
| |
| Date: February 29, 2016 |
| By /s/ Jeffrey P. Regal |
Jeffrey P. Regal, Treasurer and Principal Financial Officer |
| |
| Date: February 29, 2016 |
