UNITED STATES
SECURITIES AND EXCHANGE COMMISSION
Washington, D.C. 20549
FORM N-CSR
Certified Shareholder Report of
Registered Management Investment Companies
Investment Company Act File Number: 811-00032
American Funds Fundamental Investors
(Exact Name of Registrant as Specified in Charter)
6455 Irvine Center Drive
Irvine, California 92618
(Address of Principal Executive Offices)
Registrant's telephone number, including area code: (949) 975-5000
Date of fiscal year end: December 31
Date of reporting period: December 31, 2020
Hong T. Le
American Funds Fundamental Investors
6455 Irvine Center Drive
Irvine, California 92618
(Name and Address of Agent for Service)
ITEM 1 – Reports to Stockholders
Fundamental Investors® Annual report
for the year ended
December 31, 2020 |  |

Flexibility can help
uncover value in any
market environment
Fundamental Investors seeks long-term growth of capital and income.
This fund is one of more than 40 offered by Capital Group, home of American Funds, one of the nation’s largest mutual fund families. For nearly 90 years, Capital Group has invested with a long-term focus based on thorough research and attention to risk.
Fund results shown in this report, unless otherwise indicated, are for Class A shares at net asset value. If a sales charge (maximum 5.75%) had been deducted, the results would have been lower. Results are for past periods and are not predictive of results for future periods. Current and future results may be lower or higher than those shown. Prices and returns will vary, so investors may lose money. Investing for short periods makes losses more likely. For current information and month-end results, visit capitalgroup.com.
See page 4 for Class A share results with relevant sales charges deducted. For other share class results, visit capitalgroup.com and americanfundsretirement.com.
Investment results assume all distributions are reinvested and reflect applicable fees and expenses. When applicable, investment results reflect fee waivers, without which results would have been lower. Visit capitalgroup.com for more information.
The fund’s 30-day yield for Class A shares as of January 31, 2021, calculated in accordance with the U.S. Securities and Exchange Commission (SEC) formula, was 1.11%. The fund’s 12-month distribution rate for Class A shares as of that date was 1.40%. Both reflect the 5.75% maximum sales charge. The SEC yield reflects the rate at which the fund is earning income on its current portfolio of securities while the distribution rate reflects the fund’s past dividends paid to shareholders. Accordingly, the fund’s SEC yield and distribution rate may differ.
Investing outside the United States may be subject to risks, such as currency fluctuations, periods of illiquidity and price volatility. These risks may be heightened in connection with investments in developing countries. Refer to the fund prospectus and the Risk Factors section of this report for more information on these and other risks associated with investing in the fund.
Investments are not FDIC-insured, nor are they deposits of or guaranteed by a bank or any other entity, so they may lose value.
Contents
| 1 | Letter to investors |
| | |
| 4 | The value of a long-term perspective |
| | |
| 6 | Investment portfolio |
| | |
| 13 | Financial statements |
| | |
| 37 | Board of trustees and other officers |
Fellow investors:
For the 12 months ended December 31, 2020, Fundamental Investors rose 14.95%. This return includes reinvested dividends and capital gain distributions totaling $1.81 per share. Distributions include regular quarterly dividends totaling 68 cents per share, a 35 cents per share special dividend and long-term capital gain payments of 78 cents per share.
The fund’s results trailed its primary benchmark, the unmanaged S&P 500 Composite Index, a market capitalization-weighted index based on the results of approximately 500 widely held common stocks, which climbed 18.40%.
While the fund’s results trailed the return of the S&P 500 in 2020, Fundamental Investors has outpaced the S&P 500 over its lifetime. Although the annual advantages may seem small, when compounded over longer time frames, they have translated into added wealth for long-term investors.
COVID-19 induced uncertainty, but the equity market rose to new highs
At the beginning of 2020, few people could have predicted the events that have led to this becoming one of the most unusual years in decades. The U.S. economy was in the longest period of sustained growth on record, unemployment levels were at 50-year lows and the stock market hit new record highs.
Within three months, the coronavirus-induced economic slowdown stretched across the U.S. and throughout the globe. Millions lost their jobs either permanently or for an extended period. The S&P 500 plunged more than 30% from its peak. The pandemic led some companies to experience dramatic declines in business or even close permanently, while others not only persevered, but thrived during the tumultuous environment.
While many areas of financial markets reeled from pandemic-induced slowdowns, other areas recovered as businesses and industries quickly adapted to the “new normal.” Many of the companies who were quick to adapt or offered products for the increasingly virtual environment reaped the benefits through higher revenues and share prices.
U.S. political uncertainty — largely tied to the 2020 presidential election — had an uneven impact across financial markets and, at times, led to certain stocks and sectors falling out of favor with investors. However, through all of this, the U.S. equity market, as measured by the S&P 500 Index, set new record highs throughout the second half of the year.
Results at a glance
For the 12-month period ended December 31, 2020, with all distributions reinvested
| | | Cumulative
total returns | | Average annual total returns |
| | | 1 year | | 5 years | | 10 years | | Lifetime
(since 8/1/78)1 |
| | | | | | | | | |
| Fundamental Investors (Class A shares) | | | 14.95 | % | | | 13.72 | % | | | 12.47 | % | | | 12.51 | % |
| Standard & Poor’s 500 Composite Index2,3 | | | 18.40 | | | | 15.22 | | | | 13.88 | | | | 11.93 | |
| 1 | The date Capital Research and Management Company began managing the fund. |
| 2 | Source: S&P Dow Jones Indices. |
| 3 | The market index is unmanaged and, therefore, has no expenses. Investors cannot invest directly in an index. |
| Largest equity holdings | | | |
| | | | |
| Company | | Percent of
net assets |
| Microsoft Corp. | | | 4.5 | % |
| Broadcom Inc. | | | 4.3 | |
| Facebook, Inc. | | | 2.7 | |
| Amazon.com, Inc. | | | 2.5 | |
| Comcast Corp. | | | 2.0 | |
| Alphabet Inc. | | | 1.7 | |
| Netflix, Inc. | | | 1.7 | |
| Philip Morris International Inc. | | | 1.7 | |
| UnitedHealth Group Inc. | | | 1.5 | |
| British American Tobacco PLC | | | 1.4 | |
| Altria Group, Inc. | | | 1.4 | |
| JPMorgan Chase & Co. | | | 1.4 | |
| Taiwan Semiconductor Manufacturing Co., Ltd. | | | 1.4 | |
| ASML Holdings | | | 1.3 | |
| Charter Communications, Inc. | | | 1.2 | |
| Advanced Micro Devices, Inc. | | | 1.1 | |
| Honeywell International, Inc. | | | 0.9 | |
| Pfizer, Inc. | | | 0.9 | |
| CSX Corp. | | | 0.9 | |
| Thermo Fisher Scientific, Inc. | | | 0.9 | |
Dividend-payers’ prospects changed dramatically
A relatively unique aspect of 2020’s market volatility was the dramatic change in prospects for dividend-paying companies across several sectors, rather than mostly financial companies, like during the 2008 global financial crisis. Dividend cuts or eliminations were especially prevalent in the energy sector. Companies needed to preserve capital and liquidity as pandemic-induced shutdowns caused sharp declines in business.
It’s with this backdrop that it’s important to emphasize that not all dividend payers are equal, and selectivity may be key when seeking income. Despite this challenging environment, Fundamental Investors’ dividend yield was held intact, even as the total dividends paid by the S&P 500 fell.
Highest convictions reflect the fund’s flexibility
The fund’s portfolio is carefully constructed using bottom-up, fundamental investment research that allows the fund to maintain high-conviction investments across a variety of industries. Eight of the fund’s 10 largest equity holdings contributed positively to the fund, although several lagged the broader market. Returns for Amazon (+76.26%), Netflix (+67.11%), Microsoft (+41.04%), Facebook (+33.09%), Broadcom (+37.94%), Alphabet (+30.99%) and UnitedHealth (+19.29%) outpaced the S&P 500, while Comcast (+16.52%) saw positive returns, but lagged the broader market. Shares of British American Tobacco (–12.70%) and Philip Morris (–2.70%) produced negative returns.
The fund’s top 20 holdings reflect long standing convictions, income-generating companies and once underappreciated businesses that managers felt were undervalued.
Netflix, Advanced Micro Devices and Honeywell are among the largest holdings in the fund, but just several years ago were absent from the portfolio. Other companies with longer track records in the fund such as Pfizer and CSX have become larger holdings as share prices increased and managers maintained their convictions.
Communication services and health care propelled returns, industrials lagged
Investments in communication services and health care companies were among those that contributed to the fund’s results relative to the S&P 500 Index. Meanwhile, industrials investments produced negative returns.
Periods of stay-at-home directives and indefinite work and school from home, as well as changing dynamics in the industry, helped propel shares of communications services companies higher. Netflix, Google-parent Alphabet and Comcast were among the portfolio’s holdings that benefited. Security selection in this sector was key, as the portfolio’s return meaningfully outpaced the S&P 500 sector.
Health care companies were less represented in the fund than in the index, but strategic investments helped relative returns. Shares of Regeneron (+28.66%) and UnitedHealth experienced sizable gains. Managers’ convictions in Regeneron’s scientific capabilities were rewarded, as the company was one of several pharmaceutical companies that reported positive results from antibody therapies to combat COVID-19.
Investments in aerospace and defense firms, along with companies exposed to the severely impacted energy and airline industries, dragged on the fund’s industrial sector results.
The pandemic resulted in a dramatic drop in travel. Many airlines suspended or eliminated service, leading to a wave of delayed or canceled aircraft orders as well as reducing demand for parts and maintenance. Shares of French aircraft manufacturer Airbus (–25.13%) declined significantly.
Aligned with investor success
Despite the unprecedented nature of 2020, we believe Fundamental Investors continued to demonstrate the value of flexible fundamental investing, a long-term perspective and The Capital SystemSM. The fund’s ability to invest outside of the U.S. allows managers to pursue opportunities in market and industry leaders throughout the world, regardless of domicile. Approximately 20% of the portfolio’s holdings are domiciled outside of the U.S., about 4% higher than the 10-year average.
While the sharp decline in equities during the first quarter was painful for many investment portfolios, the volatility created investment opportunities. Particularly, the fund’s ability to invest in undervalued or underappreciated companies allowed managers to initiate positions in what they believe to be great investment opportunities at a discount. We believe that over longer periods, the market will more fairly value these companies, or these shares will appreciate over time.
In 2020, portfolio managers also found many opportunities to deploy some of the fund’s cash holdings. At the end of 2020, Fundamental Investors’ cash holdings were approximately 2%, the lowest level in over 10 years.
At Capital Group, we believe our multi-manager system helps investors pursue better outcomes. 2020 was a year of new beginnings in the fund as we named several new managers and celebrated the contributions of two others.
Three new portfolio managers were named in the fund during the past year, and each brings extensive experience as an investment analyst for the fund. Mathews Cherian, 17 years’ experience at Capital Group; Irfan Furniturewala, 20 years of experience at Capital Group; and Paul Benjamin, 15 years’ experience at Capital Group, assumed portfolio manager roles in 2020.
Mike Kerr, whose investment career spanned over 35 years with 20 of those years on Fundamental Investors, and Greg Johnson, with more than 25 years of experience, retired in 2020. We thank them for their contributions to the fund.
We thank you for your continued support and investment in Fundamental Investors.
Sincerely,

Mark L. Casey
Co-President

Brady L. Enright
Co-President
February 11, 2021
The value of a long-term perspective
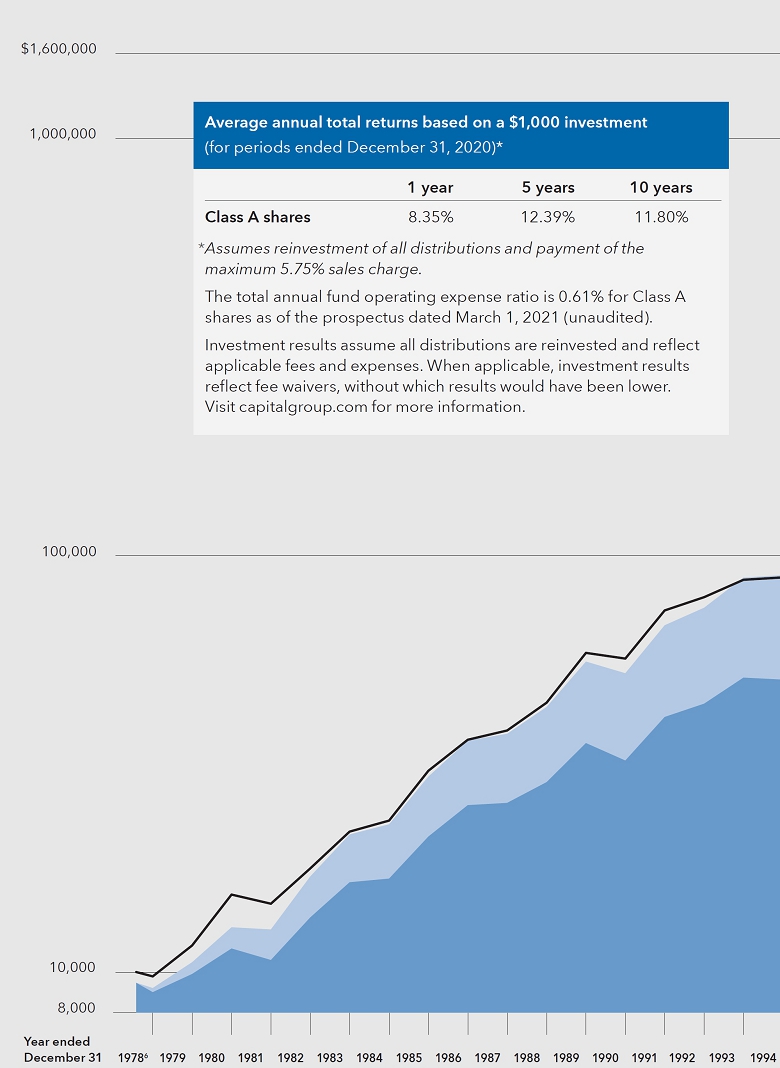
Fund results shown are for Class A shares and reflect deduction of the maximum sales charge of 5.75% on the $10,000 investment.1 Thus, the net amount invested was $9,425.2 Results are for past periods and are not predictive of results for future periods. Current and future results may be lower or higher than those shown. Prices and returns will vary, so investors may lose money. Investing for short periods makes losses more likely. For current information and month-end results, visit capitalgroup.com.
The results shown are before taxes on fund distributions and sale of fund shares.
| 1 | As outlined in the prospectus, the sales charge is reduced for accounts (and aggregated investments) of $25,000 or more and is eliminated for purchases of $1 million or more. There is no sales charge on dividends or capital gain distributions that are reinvested in additional shares. |
| 2 | The maximum initial sales charge was 8.50% prior to July 1, 1988. |
| 3 | Includes reinvested dividends and reinvested capital gain distributions. |
| 4 | Source: S&P Dow Jones Indices LLC. Standard & Poor’s 500 Composite Index is unmanaged and, therefore, has no expenses. Investors cannot invest directly in an index. |
| 5 | Includes reinvested capital gain distributions, but does not reflect income dividends taken in cash. |
| 6 | For the period August 1, 1978 (when Capital Research and Management Company became investment adviser), through December 31, 1978. |
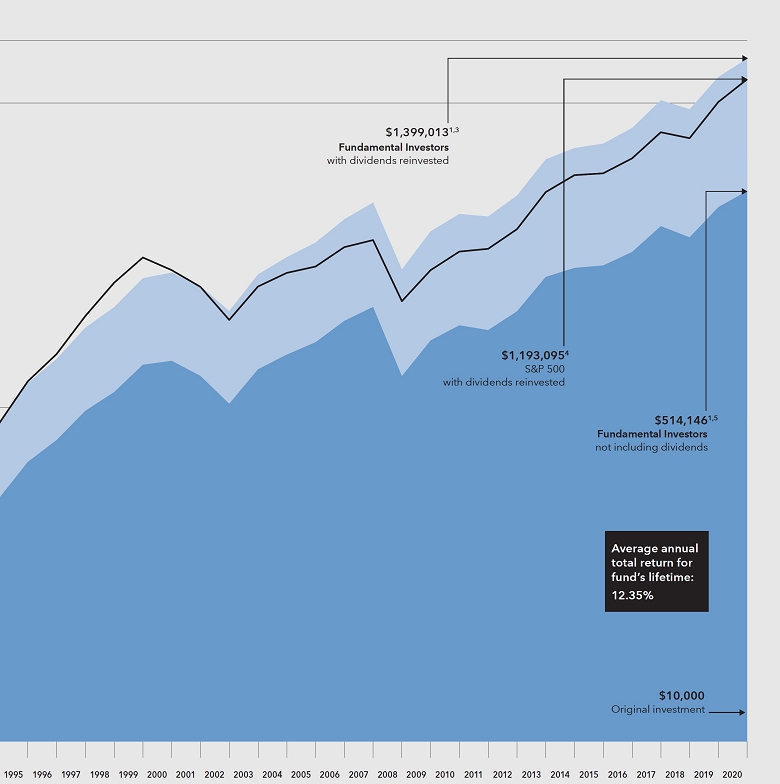
How a hypothetical $10,000 investment has grown
The chart illustrates how a hypothetical $10,000 investment in the fund grew between August 1, 1978 — when Capital Research and Management Company became the investment adviser for Fundamental Investors — and December 31, 2020. The chart also shows how the unmanaged Standard & Poor’s 500 Composite Index fared over this same period.
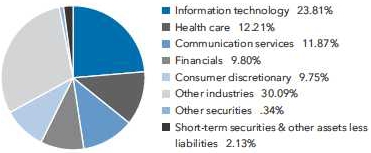
Investment portfolio December 31, 2020
| Industry sector diversification | Percent of net assets |
| Country diversification by domicile | | Percent of
net assets | |
| United States | | | 77.82 | % |
| Eurozone* | | | 5.61 | |
| United Kingdom | | | 3.64 | |
| Canada | | | 2.32 | |
| Taiwan | | | 1.44 | |
| Switzerland | | | .91 | |
| India | | | .81 | |
| Brazil | | | .69 | |
| Japan | | | .69 | |
| Other countries | | | 3.94 | |
| Short-term securities & other assets less liabilities | | | 2.13 | |
| * | Countries using the euro as a common currency; those represented in the fund’s portfolio are Belgium, France, Germany, Ireland, Italy, the Netherlands and Spain. |
| Common stocks 97.53% | | Shares | | | Value
(000) | |
| Information technology 23.81% | | | | | | | | |
| Microsoft Corp. | | | 23,203,942 | | | $ | 5,161,021 | |
| Broadcom Inc. | | | 11,016,500 | | | | 4,823,574 | |
| Taiwan Semiconductor Manufacturing Company, Ltd.1 | | | 73,743,000 | | | | 1,385,003 | |
| Taiwan Semiconductor Manufacturing Company, Ltd. (ADR) | | | 2,544,652 | | | | 277,469 | |
| ASML Holding NV1 | | | 2,368,507 | | | | 1,144,609 | |
| ASML Holding NV (New York registered) (ADR) | | | 726,375 | | | | 354,268 | |
| Advanced Micro Devices, Inc.2 | | | 14,351,091 | | | | 1,316,139 | |
| Mastercard Inc., Class A | | | 2,717,859 | | | | 970,113 | |
| Apple Inc. | | | 6,555,992 | | | | 869,915 | |
| TE Connectivity Ltd. | | | 5,153,553 | | | | 623,941 | |
| Arista Networks, Inc.2 | | | 1,913,000 | | | | 555,860 | |
| NortonLifeLock Inc. | | | 25,632,049 | | | | 532,634 | |
| RingCentral, Inc., Class A2 | | | 1,349,576 | | | | 511,449 | |
| Intel Corp. | | | 10,231,602 | | | | 509,738 | |
| Autodesk, Inc.2 | | | 1,647,965 | | | | 503,190 | |
| HubSpot, Inc.2 | | | 1,228,592 | | | | 487,063 | |
| KLA Corp. | | | 1,812,137 | | | | 469,180 | |
| Fidelity National Information Services, Inc. | | | 3,274,651 | | | | 463,232 | |
| PayPal Holdings, Inc.2 | | | 1,975,138 | | | | 462,577 | |
| Texas Instruments Inc. | | | 2,766,887 | | | | 454,129 | |
| Applied Materials, Inc. | | | 4,843,167 | | | | 417,965 | |
| FleetCor Technologies, Inc.2 | | | 1,474,528 | | | | 402,295 | |
| Paychex, Inc. | | | 3,803,021 | | | | 354,365 | |
| Motorola Solutions, Inc. | | | 2,035,546 | | | | 346,165 | |
| SK hynix, Inc.1 | | | 3,135,100 | | | | 342,972 | |
| Samsung Electronics Co., Ltd.1 | | | 4,568,381 | | | | 341,429 | |
| Visa Inc., Class A | | | 1,406,607 | | | | 307,667 | |
| Square, Inc., Class A2 | | | 1,325,000 | | | | 288,373 | |
| Ceridian HCM Holding Inc.2 | | | 2,644,404 | | | | 281,788 | |
| Adobe Inc.2 | | | 433,965 | | | | 217,035 | |
| Micron Technology, Inc.2 | | | 2,710,166 | | | | 203,750 | |
| Dell Technologies Inc., Class C2 | | | 2,746,910 | | | | 201,321 | |
| VeriSign, Inc.2 | | | 884,713 | | | | 191,452 | |
| STMicroelectronics NV1 | | | 4,130,000 | | | | 153,017 | |
| Cree, Inc.2 | | | 1,274,890 | | | | 135,011 | |
| SAP SE1 | | | 907,709 | | | | 119,281 | |
| MongoDB, Inc., Class A2 | | | 315,000 | | | | 113,098 | |
| ServiceNow, Inc.2 | | | 204,627 | | | | 112,633 | |
| Automatic Data Processing, Inc. | | | 633,695 | | | | 111,657 | |
| EPAM Systems, Inc.2 | | | 303,100 | | | | 108,616 | |
| Smartsheet Inc., Class A2 | | | 1,548,000 | | | | 107,261 | |
| Lam Research Corp. | | | 213,422 | | | | 100,793 | |
| NetApp, Inc. | | | 1,498,514 | | | | 99,262 | |
| ON Semiconductor Corp.2 | | | 2,792,811 | | | | 91,409 | |
| Common stocks (continued) | | Shares | | | Value
(000) | |
| Information technology (continued) | | | | | | | | |
| Edenred SA1 | | | 1,582,671 | | | $ | 89,800 | |
| Amadeus IT Group SA, Class A, non-registered shares1 | | | 1,192,300 | | | | 86,320 | |
| Shopify Inc., Class A, subordinate voting shares2 | | | 76,120 | | | | 86,164 | |
| LiveRamp Holdings, Inc.2 | | | 1,139,660 | | | | 83,412 | |
| Concentrix Corp.2 | | | 514,421 | | | | 50,773 | |
| Snowflake Inc., Class A2,3 | | | 162,500 | | | | 45,727 | |
| SYNNEX Corp. | | | 514,421 | | | | 41,894 | |
| Keyence Corp.1 | | | 65,900 | | | | 37,087 | |
| Dolby Laboratories, Inc., Class A | | | 379,700 | | | | 36,880 | |
| | | | | | | | 27,581,776 | |
| | | | | | | | | |
| Health care 12.21% | | | | | | | | |
| UnitedHealth Group Inc. | | | 5,070,347 | | | | 1,778,069 | |
| Pfizer Inc. | | | 29,786,536 | | | | 1,096,442 | |
| Thermo Fisher Scientific Inc. | | | 2,230,912 | | | | 1,039,114 | |
| Regeneron Pharmaceuticals, Inc.2 | | | 1,937,879 | | | | 936,209 | |
| Centene Corp.2 | | | 14,441,714 | | | | 866,936 | |
| Eli Lilly and Company | | | 3,115,110 | | | | 525,955 | |
| Cigna Corp. | | | 2,471,164 | | | | 514,447 | |
| AstraZeneca PLC1 | | | 4,941,687 | | | | 493,719 | |
| Allakos Inc.2,4 | | | 3,442,464 | | | | 481,945 | |
| Molina Healthcare, Inc.2 | | | 2,178,238 | | | | 463,268 | |
| Abbott Laboratories | | | 4,038,553 | | | | 442,181 | |
| Seagen Inc.2 | | | 2,009,800 | | | | 351,996 | |
| Baxter International Inc. | | | 4,245,000 | | | | 340,619 | |
| Daiichi Sankyo Company, Ltd.1 | | | 9,451,200 | | | | 323,991 | |
| Vertex Pharmaceuticals Inc.2 | | | 1,302,211 | | | | 307,765 | |
| Bristol-Myers Squibb Co. | | | 4,400,000 | | | | 272,932 | |
| Gilead Sciences, Inc. | | | 4,651,382 | | | | 270,990 | |
| Ultragenyx Pharmaceutical Inc.2 | | | 1,874,939 | | | | 259,548 | |
| ResMed Inc. | | | 1,133,725 | | | | 240,985 | |
| Merck & Co., Inc. | | | 2,882,074 | | | | 235,754 | |
| GW Pharmaceuticals PLC (ADR)2,4 | | | 2,000,000 | | | | 230,820 | |
| Edwards Lifesciences Corp.2 | | | 2,429,703 | | | | 221,662 | |
| Illumina, Inc.2 | | | 595,000 | | | | 220,150 | |
| Humana Inc. | | | 521,315 | | | | 213,880 | |
| Novo Nordisk A/S, Class B1 | | | 2,540,140 | | | | 177,671 | |
| Rede D’Or Sao Luiz SA2 | | | 12,348,000 | | | | 162,367 | |
| Teva Pharmaceutical Industries Ltd. (ADR)2 | | | 16,740,428 | | | | 161,545 | |
| GlaxoSmithKline PLC1 | | | 7,400,000 | | | | 135,591 | |
| GlaxoSmithKline PLC (ADR) | | | 399,550 | | | | 14,703 | |
| Danaher Corp. | | | 674,201 | | | | 149,767 | |
| Roche Holding AG, nonvoting, non-registered shares1 | | | 340,000 | | | | 118,629 | |
| Zimmer Biomet Holdings, Inc. | | | 718,575 | | | | 110,725 | |
| Twist Bioscience Corp.2 | | | 723,800 | | | | 102,266 | |
| Anthem, Inc. | | | 255,153 | | | | 81,927 | |
| Incyte Corp.2 | | | 915,254 | | | | 79,609 | |
| Galapagos NV (ADR)2 | | | 710,590 | | | | 70,334 | |
| Notre Dame Intermédica Participações SA | | | 4,645,000 | | | | 70,057 | |
| Viatris Inc.2 | | | 3,600,223 | | | | 67,468 | |
| Neurocrine Biosciences, Inc.2 | | | 688,245 | | | | 65,968 | |
| Applied Molecular Transport Inc.2,3,4 | | | 2,130,060 | | | | 65,542 | |
| AmerisourceBergen Corp. | | | 566,063 | | | | 55,338 | |
| Insulet Corp.2 | | | 207,050 | | | | 52,928 | |
| Bluebird Bio, Inc.2 | | | 1,210,000 | | | | 52,357 | |
| Mettler-Toledo International Inc.2 | | | 44,882 | | | | 51,151 | |
| Oak Street Health, Inc.2 | | | 827,723 | | | | 50,624 | |
| Cortexyme, Inc.2,3 | | | 1,084,854 | | | | 30,137 | |
| Johnson & Johnson | | | 172,000 | | | | 27,069 | |
| Tandem Diabetes Care, Inc.2 | | | 249,823 | | | | 23,903 | |
| Teladoc Health, Inc.2 | | | 94,893 | | | | 18,975 | |
| Bausch Health Companies Inc.2 | | | 749,157 | | | | 15,582 | |
| | | | | | | | 14,141,610 | |
| Common stocks (continued) | | Shares | | | Value
(000) | |
| Communication services 11.87% | | | | | | | | |
| Facebook, Inc., Class A2 | | | 11,519,184 | | | $ | 3,146,580 | |
| Comcast Corp., Class A | | | 44,271,415 | | | | 2,319,822 | |
| Alphabet Inc., Class C2 | | | 876,370 | | | | 1,535,295 | |
| Alphabet Inc., Class A2 | | | 276,257 | | | | 484,179 | |
| Netflix, Inc.2 | | | 3,672,678 | | | | 1,985,927 | |
| Charter Communications, Inc., Class A2 | | | 2,018,768 | | | | 1,335,516 | |
| Walt Disney Company2 | | | 3,500,000 | | | | 634,130 | |
| Activision Blizzard, Inc. | | | 5,010,500 | | | | 465,225 | |
| Sea Ltd., Class A (ADR)2 | | | 2,070,907 | | | | 412,214 | |
| Twitter, Inc.2 | | | 3,890,000 | | | | 210,644 | |
| Snap Inc., Class A2 | | | 4,036,875 | | | | 202,126 | |
| Tencent Holdings Ltd.1 | | | 1,932,700 | | | | 141,217 | |
| T-Mobile US, Inc.2 | | | 899,000 | | | | 121,230 | |
| Verizon Communications Inc. | | | 2,000,000 | | | | 117,500 | |
| New York Times Co., Class A | | | 2,121,000 | | | | 109,804 | |
| JOYY Inc., Class A (ADR)3 | | | 1,363,466 | | | | 109,050 | |
| Pinterest, Inc., Class A2 | | | 1,561,446 | | | | 102,899 | |
| SoftBank Group Corp.1 | | | 1,298,300 | | | | 101,677 | |
| HUYA, Inc. (ADR)2,3 | | | 4,549,740 | | | | 90,676 | |
| Vivendi SA1 | | | 2,355,030 | | | | 75,947 | |
| SoftBank Corp.1 | | | 3,615,200 | | | | 45,323 | |
| | | | | | | | 13,746,981 | |
| | | | | | | | | |
| Financials 9.80% | | | | | | | | |
| JPMorgan Chase & Co. | | | 13,126,849 | | | | 1,668,029 | |
| The Blackstone Group Inc., Class A | | | 12,359,429 | | | | 801,015 | |
| Intercontinental Exchange, Inc. | | | 5,052,507 | | | | 582,504 | |
| CME Group Inc., Class A | | | 3,118,680 | | | | 567,756 | |
| BlackRock, Inc. | | | 730,941 | | | | 527,403 | |
| Truist Financial Corp. | | | 10,009,957 | | | | 479,777 | |
| HDFC Bank Ltd.1,2 | | | 22,825,000 | | | | 449,606 | |
| KKR & Co. Inc. | | | 10,709,411 | | | | 433,624 | |
| Aon PLC, Class A | | | 1,934,971 | | | | 408,801 | |
| Citizens Financial Group, Inc. | | | 11,411,628 | | | | 408,080 | |
| Apollo Global Management, Inc., Class A | | | 8,262,519 | | | | 404,698 | |
| Sberbank of Russia PJSC (ADR)1 | | | 23,573,033 | | | | 339,826 | |
| Kotak Mahindra Bank Ltd.1,2 | | | 11,047,770 | | | | 302,341 | |
| Chubb Ltd. | | | 1,923,117 | | | | 296,006 | |
| Synchrony Financial | | | 8,175,800 | | | | 283,782 | |
| Bank of America Corp. | | | 9,300,000 | | | | 281,883 | |
| AIA Group Ltd.1 | | | 22,455,200 | | | | 276,596 | |
| Citigroup Inc. | | | 4,100,000 | | | | 252,806 | |
| Moody’s Corp. | | | 828,711 | | | | 240,525 | |
| Marsh & McLennan Companies, Inc. | | | 2,044,236 | | | | 239,176 | |
| First Republic Bank | | | 1,523,981 | | | | 223,919 | |
| Arthur J. Gallagher & Co. | | | 1,666,425 | | | | 206,153 | |
| Arch Capital Group Ltd.2 | | | 5,689,250 | | | | 205,211 | |
| Cannae Holdings, Inc.2 | | | 4,176,585 | | | | 184,897 | |
| S&P Global Inc. | | | 503,301 | | | | 165,450 | |
| Zurich Insurance Group AG1 | | | 356,827 | | | | 151,238 | |
| Capital One Financial Corp. | | | 1,453,365 | | | | 143,665 | |
| Discover Financial Services | | | 1,585,863 | | | | 143,568 | |
| Travelers Companies, Inc. | | | 817,810 | | | | 114,796 | |
| Hong Kong Exchanges and Clearing Ltd.1 | | | 1,490,400 | | | | 81,973 | |
| Ares Management Corp., Class A | | | 1,719,987 | | | | 80,925 | |
| Ping An Insurance (Group) Company of China, Ltd., Class H1 | | | 6,441,000 | | | | 79,115 | |
| PNC Financial Services Group, Inc. | | | 449,494 | | | | 66,975 | |
| Brookfield Asset Management Inc., Class A | | | 1,273,567 | | | | 52,560 | |
| London Stock Exchange Group PLC1 | | | 401,300 | | | | 49,466 | |
| Toronto-Dominion Bank (CAD denominated) | | | 809,876 | | | | 45,759 | |
| Willis Towers Watson PLC | | | 180,797 | | | | 38,090 | |
| Progressive Corp. | | | 341,316 | | | | 33,749 | |
| Bank of Nova Scotia (CAD denominated) | | | 599,326 | | | | 32,394 | |
| | | | | | | | 11,344,137 | |
| Common stocks (continued) | | Shares | | | Value
(000) | |
| Consumer discretionary 9.75% | | | | | | | | |
| Amazon.com, Inc.2 | | | 905,011 | | | $ | 2,947,557 | |
| Restaurant Brands International Inc. | | | 11,385,234 | | | | 695,752 | |
| Prosus NV1 | | | 6,363,138 | | | | 684,504 | |
| Booking Holdings Inc.2 | | | 276,977 | | | | 616,903 | |
| Evolution Gaming Group AB1 | | | 5,459,244 | | | | 553,492 | |
| Dollar General Corp. | | | 2,446,207 | | | | 514,437 | |
| Target Corp. | | | 2,798,020 | | | | 493,934 | |
| Home Depot, Inc. | | | 1,657,485 | | | | 440,261 | |
| Domino’s Pizza, Inc. | | | 1,135,317 | | | | 435,349 | |
| Flutter Entertainment PLC (GBP denominated)1 | | | 1,318,017 | | | | 272,882 | |
| Flutter Entertainment PLC (EUR denominated)1 | | | 644,757 | | | | 132,067 | |
| LVMH Moët Hennessy-Louis Vuitton SE1,3 | | | 620,632 | | | | 387,790 | |
| Industria de Diseño Textil, SA1 | | | 10,781,400 | | | | 343,300 | |
| NIKE, Inc., Class B | | | 2,393,700 | | | | 338,637 | |
| Marriott International, Inc., Class A | | | 1,815,068 | | | | 239,444 | |
| Galaxy Entertainment Group Ltd.1 | | | 23,101,000 | | | | 179,682 | |
| Peloton Interactive, Inc., Class A2 | | | 1,173,000 | | | | 177,968 | |
| Burlington Stores, Inc.2 | | | 670,000 | | | | 175,238 | |
| Wynn Resorts, Ltd. | | | 1,398,128 | | | | 157,751 | |
| TJX Companies, Inc. | | | 2,124,020 | | | | 145,049 | |
| Las Vegas Sands Corp. | | | 2,330,571 | | | | 138,902 | |
| Trainline PLC1,2 | | | 20,802,379 | | | | 132,175 | |
| Five Below, Inc.2 | | | 604,320 | | | | 105,744 | |
| YUM! Brands, Inc. | | | 950,000 | | | | 103,132 | |
| Entain PLC1,2 | | | 6,370,000 | | | | 98,879 | |
| Kering SA1 | | | 129,855 | | | | 94,404 | |
| THG Holdings PLC1,2 | | | 7,358,370 | | | | 78,572 | |
| Darden Restaurants, Inc. | | | 650,468 | | | | 77,484 | |
| Floor & Decor Holdings, Inc., Class A2 | | | 799,101 | | | | 74,197 | |
| Cie. Financière Richemont SA, Class A1 | | | 790,000 | | | | 71,386 | |
| Alibaba Group Holding Ltd.1,2 | | | 2,324,700 | | | | 67,922 | |
| Airbnb, Inc., Class A2 | | | 459,100 | | | | 67,396 | |
| Carvana Co., Class A2 | | | 278,300 | | | | 66,664 | |
| Shop Apotheke Europe NV, non-registered shares1,2 | | | 356,940 | | | | 64,638 | |
| Aramark | | | 1,618,179 | | | | 62,268 | |
| MercadoLibre, Inc.2 | | | 35,000 | | | | 58,633 | |
| | | | | | | | 11,294,393 | |
| | | | | | | | | |
| Industrials 9.23% | | | | | | | | |
| Honeywell International Inc. | | | 5,160,382 | | | | 1,097,613 | |
| CSX Corp. | | | 11,736,433 | | | | 1,065,081 | |
| TransDigm Group Inc.2 | | | 1,678,029 | | | | 1,038,448 | |
| Parker-Hannifin Corp. | | | 2,859,455 | | | | 778,944 | |
| Deere & Company | | | 2,407,291 | | | | 647,682 | |
| Airbus SE, non-registered shares1,2 | | | 5,014,226 | | | | 550,810 | |
| Union Pacific Corp. | | | 2,575,676 | | | | 536,307 | |
| Safran SA1,2 | | | 3,077,006 | | | | 436,382 | |
| Norfolk Southern Corp. | | | 1,804,017 | | | | 428,653 | |
| Northrop Grumman Corp. | | | 1,333,415 | | | | 406,318 | |
| Raytheon Technologies Corp. | | | 5,457,848 | | | | 390,291 | |
| Emerson Electric Co. | | | 3,945,560 | | | | 317,105 | |
| Nidec Corp.1 | | | 2,272,000 | | | | 286,261 | |
| Caterpillar Inc. | | | 1,563,388 | | | | 284,568 | |
| Lockheed Martin Corp. | | | 581,250 | | | | 206,332 | |
| Waste Connections, Inc. | | | 1,974,008 | | | | 202,474 | |
| ABB Ltd.1 | | | 7,037,194 | | | | 196,840 | |
| PACCAR Inc. | | | 2,214,802 | | | | 191,093 | |
| Boeing Company | | | 826,000 | | | | 176,814 | |
| Carrier Global Corp. | | | 4,649,517 | | | | 175,380 | |
| Experian PLC1 | | | 4,204,466 | | | | 160,211 | |
| Waste Management, Inc. | | | 1,072,189 | | | | 126,443 | |
| L3Harris Technologies, Inc. | | | 661,809 | | | | 125,095 | |
| BWX Technologies, Inc. | | | 1,774,165 | | | | 106,947 | |
| MTU Aero Engines AG1 | | | 357,530 | | | | 93,155 | |
| Lifco AB, Class B1 | | | 874,186 | | | | 83,816 | |
| AMETEK, Inc. | | | 603,650 | | | | 73,005 | |
| IMCD NV1 | | | 499,438 | | | | 63,458 | |
| Armstrong World Industries, Inc. | | | 825,126 | | | | 61,381 | |
| Common stocks (continued) | | Shares | | | Value
(000) | |
| Industrials (continued) | | | | | | | | |
| Equifax Inc. | | | 281,078 | | | $ | 54,203 | |
| United Rentals, Inc.2 | | | 219,787 | | | | 50,971 | |
| TFI International Inc. (CAD denominated) | | | 948,000 | | | | 48,804 | |
| ASSA ABLOY AB, Class B1 | | | 1,748,876 | | | | 43,016 | |
| Rexnord Corp. | | | 1,000,000 | | | | 39,490 | |
| HEICO Corp. | | | 292,760 | | | | 38,761 | |
| Sweco AB, Class B, non-registered shares1 | | | 1,801,653 | | | | 33,064 | |
| DSV Panalpina A/S1 | | | 194,780 | | | | 32,597 | |
| Uber Technologies, Inc.2 | | | 492,000 | | | | 25,092 | |
| Westinghouse Air Brake Technologies Corp. | | | 305,036 | | | | 22,329 | |
| | | | | | | | 10,695,234 | |
| | | | | | | | | |
| Consumer staples 8.81% | | | | | | | | |
| Philip Morris International Inc. | | | 23,310,447 | | | | 1,929,872 | |
| British American Tobacco PLC1 | | | 43,343,409 | | | | 1,612,154 | |
| British American Tobacco PLC (ADR) | | | 1,677,113 | | | | 62,875 | |
| Altria Group, Inc. | | | 40,832,312 | | | | 1,674,125 | |
| Conagra Brands, Inc. | | | 18,076,983 | | | | 655,471 | |
| Keurig Dr Pepper Inc. | | | 16,985,603 | | | | 543,539 | |
| Nestlé SA1 | | | 4,345,733 | | | | 511,618 | |
| Colgate-Palmolive Company | | | 5,027,743 | | | | 429,922 | |
| Mondelez International, Inc. | | | 6,557,621 | | | | 383,424 | |
| Constellation Brands, Inc., Class A | | | 1,648,334 | | | | 361,068 | |
| Walmart Inc. | | | 2,367,336 | | | | 341,252 | |
| Costco Wholesale Corp. | | | 781,309 | | | | 294,382 | |
| Reckitt Benckiser Group PLC (ADR)3 | | | 6,034,118 | | | | 109,338 | |
| Reckitt Benckiser Group PLC1 | | | 1,190,149 | | | | 106,442 | |
| Anheuser-Busch InBev SA/NV1 | | | 3,078,967 | | | | 215,166 | |
| Archer Daniels Midland Company | | | 4,195,504 | | | | 211,495 | |
| Procter & Gamble Company | | | 950,000 | | | | 132,183 | |
| Kellogg Co. | | | 2,100,000 | | | | 130,683 | |
| ITC Ltd.1 | | | 38,035,066 | | | | 108,936 | |
| Unilever PLC1 | | | 1,797,977 | | | | 108,234 | |
| Estée Lauder Companies Inc., Class A | | | 400,000 | | | | 106,476 | |
| Kraft Heinz Company | | | 2,066,977 | | | | 71,641 | |
| Church & Dwight Co., Inc. | | | 649,146 | | | | 56,625 | |
| General Mills, Inc. | | | 686,028 | | | | 40,339 | |
| | | | | | | | 10,197,260 | |
| | | | | | | | | |
| Materials 5.38% | | | | | | | | |
| Vale SA, ordinary nominative (ADR) | | | 21,416,266 | | | | 358,937 | |
| Vale SA, ordinary nominative | | | 12,174,000 | | | | 204,962 | |
| Grupo México, SAB de CV, Series B | | | 119,606,418 | | | | 505,605 | |
| Eastman Chemical Company | | | 4,912,057 | | | | 492,581 | |
| Dow Inc. | | | 8,294,374 | | | | 460,338 | |
| Westlake Chemical Corp. | | | 5,505,000 | | | | 449,208 | |
| LyondellBasell Industries NV | | | 4,340,053 | | | | 397,809 | |
| Barrick Gold Corp. | | | 17,451,706 | | | | 397,550 | |
| Linde PLC | | | 1,460,325 | | | | 384,810 | |
| First Quantum Minerals Ltd. | | | 18,393,678 | | | | 330,188 | |
| Rio Tinto PLC1 | | | 4,046,695 | | | | 302,789 | |
| Franco-Nevada Corp. | | | 2,298,000 | | | | 288,130 | |
| Wheaton Precious Metals Corp. | | | 6,566,612 | | | | 274,091 | |
| Corteva, Inc. | | | 6,900,000 | | | | 267,168 | |
| Royal Gold, Inc. | | | 2,280,999 | | | | 242,607 | |
| Sherwin-Williams Company | | | 222,000 | | | | 163,150 | |
| Nucor Corp. | | | 2,897,028 | | | | 154,093 | |
| BHP Group PLC1 | | | 4,885,524 | | | | 128,752 | |
| PPG Industries, Inc. | | | 660,157 | | | | 95,208 | |
| Packaging Corp. of America | | | 687,000 | | | | 94,744 | |
| Air Products and Chemicals, Inc. | | | 325,242 | | | | 88,863 | |
| Asian Paints Ltd.1 | | | 2,142,500 | | | | 81,235 | |
| CCL Industries Inc., Class B, nonvoting shares | | | 1,160,694 | | | | 52,696 | |
| Koninklijke DSM NV1 | | | 90,000 | | | | 15,504 | |
| | | | | | | | 6,231,018 | |
| Common stocks (continued) | | Shares | | | Value
(000) | |
| Utilities 3.07% | | | | | | | | |
| Enel SpA1 | | | 100,183,296 | | | $ | 1,011,687 | |
| AES Corp. | | | 23,192,748 | | | | 545,030 | |
| Xcel Energy Inc. | | | 5,743,133 | | | | 382,895 | |
| DTE Energy Company | | | 2,951,723 | | | | 358,369 | |
| Ørsted AS1 | | | 1,689,900 | | | | 345,626 | |
| American Electric Power Company, Inc. | | | 2,694,692 | | | | 224,387 | |
| Sempra Energy | | | 1,728,667 | | | | 220,249 | |
| Exelon Corp. | | | 3,554,709 | | | | 150,080 | |
| CenterPoint Energy, Inc. | | | 5,886,200 | | | | 127,377 | |
| CMS Energy Corp. | | | 1,995,484 | | | | 121,745 | |
| Iberdrola, SA, non-registered shares1 | | | 2,954,600 | | | | 42,255 | |
| Brookfield Infrastructure Partners LP | | | 575,000 | | | | 28,450 | |
| | | | | | | | 3,558,150 | |
| | | | | | | | | |
| Energy 2.25% | | | | | | | | |
| ConocoPhillips | | | 10,598,820 | | | | 423,847 | |
| BP PLC1 | | | 108,427,088 | | | | 373,505 | |
| BP PLC (ADR) | | | 998,876 | | | | 20,497 | |
| Canadian Natural Resources, Ltd. (CAD denominated) | | | 15,506,929 | | | | 372,658 | |
| Valero Energy Corp. | | | 6,424,700 | | | | 363,445 | |
| Chevron Corp. | | | 3,943,097 | | | | 332,995 | |
| EOG Resources, Inc. | | | 4,702,201 | | | | 234,499 | |
| Exxon Mobil Corp. | | | 4,000,000 | | | | 164,880 | |
| Baker Hughes Co., Class A | | | 7,493,869 | | | | 156,247 | |
| Cabot Oil & Gas Corp. | | | 4,905,000 | | | | 79,853 | |
| Equitrans Midstream Corp. | | | 5,732,368 | | | | 46,088 | |
| Cimarex Energy Co. | | | 948,507 | | | | 35,579 | |
| | | | | | | | 2,604,093 | |
| | | | | | | | | |
| Real estate 1.35% | | | | | | | | |
| Crown Castle International Corp. REIT | | | 3,204,170 | | | | 510,072 | |
| Equinix, Inc. REIT | | | 465,646 | | | | 332,555 | |
| Gaming and Leisure Properties, Inc. REIT | | | 5,365,345 | | | | 227,491 | |
| American Tower Corp. REIT | | | 702,030 | | | | 157,578 | |
| AvalonBay Communities, Inc. REIT | | | 908,794 | | | | 145,798 | |
| KE Holdings Inc., Class A (ADR)2 | | | 986,393 | | | | 60,702 | |
| Shimao Group Holdings Ltd.1 | | | 14,598,000 | | | | 46,671 | |
| Digital Realty Trust, Inc. REIT | | | 233,500 | | | | 32,575 | |
| Brookfield Property Partners LP | | | 1,900,000 | | | | 27,493 | |
| K-Fast Holding AB, Class B1,2 | | | 520,385 | | | | 16,846 | |
| | | | | | | | 1,557,781 | |
| | | | | | | | | |
| Total common stocks (cost: $65,756,439,000) | | | | | | | 112,952,433 | |
| | | | | | | | | |
| Preferred securities 0.03% | | | | | | | | |
| Information technology 0.03% | | | | | | | | |
| Samsung Electronics Co., Ltd., nonvoting preferred shares1 | | | 500,000 | | | | 33,941 | |
| | | | | | | | | |
| Total preferred securities (cost: $14,544,000) | | | | | | | 33,941 | |
| | | | | | | | | |
| Rights & warrants 0.00% | | | | | | | | |
| Consumer discretionary 0.00% | | | | | | | | |
| Cie. Financière Richemont SA, Class A, warrants, expire 20232 | | | 180,190 | | | | 47 | |
| | | | | | | | | |
| Total rights & warrants (cost: $0) | | | | | | | 47 | |
| | | | | | | | | |
| Convertible stocks 0.31% | | | | | | | | |
| Information technology 0.17% | | | | | | | | |
| Broadcom Inc., Series A, cumulative convertible preferred shares, 8.00% 2022 | | | 141,713 | | | | 201,583 | |
| | | | | | | | | |
| Utilities 0.07% | | | | | | | | |
| American Electric Power Company, Inc., convertible preferred units, 6.125% 2023 | | | 1,001,281 | | | | 50,695 | |
| NextEra Energy, Inc., convertible preferred units, 6.219% 2023 | | | 612,000 | | | | 31,438 | |
| | | | | | | | 82,133 | |
| Convertible stocks (continued) | | Shares | | | Value
(000) | |
| Financials 0.07% | | | | | | | | |
| KKR & Co. Inc., Series C, convertible preferred shares, 6.00% | | | 1,272,448 | | | $ | 76,703 | |
| | | | | | | | | |
| Total convertible stocks (cost: $290,026,000) | | | | | | | 360,419 | |
| | | | | | | | | |
| Short-term securities 2.08% | | | | | | | | |
| Money market investments 2.08% | | | | | | | | |
| Capital Group Central Cash Fund 0.12%4,5 | | | 23,612,636 | | | | 2,361,500 | |
| Goldman Sachs Financial Square Government Fund, Institutional Shares 0.02%5,6 | | | 50,262,710 | | | | 50,263 | |
| | | | | | | | | |
| Total short-term securities (cost: $2,411,359,000) | | | | | | | 2,411,763 | |
| Total investment securities 99.95% (cost: $68,472,368,000) | | | | | | | 115,758,603 | |
| Other assets less liabilities 0.05% | | | | | | | 61,866 | |
| | | | | | | | | |
| Net assets 100.00% | | | | | | $ | 115,820,469 | |
Investments in affiliates4
| | | Value of
affiliates at
1/1/2020
(000) | | | Additions
(000) | | | Reductions
(000) | | | Net
realized
gain (loss)
(000) | | | Net
unrealized
appreciation
(depreciation)
(000) | | | Value of
affiliates at
12/31/2020
(000) | | | Dividend
income
(000) | |
| Common stocks 0.67% | | | | | | | | | | | | | | | | | | | | | | | | | | | | |
| Health care 0.67% | | | | | | | | | | | | | | | | | | | | | | | | | | | | |
| Allakos Inc.2 | | $ | 118,714 | | | $ | 156,170 | | | $ | 259 | | | $ | 57 | | | $ | 207,263 | | | $ | 481,945 | | | $ | — | |
| GW Pharmaceuticals PLC (ADR)2 | | | — | | | | 235,504 | | | | 170 | | | | 7 | | | | (4,521 | ) | | | 230,820 | | | | — | |
| Applied Molecular Transport Inc.2,3 | | | — | | | | 65,296 | | | | — | | | | — | | | | 246 | | | | 65,542 | | | | — | |
| | | | | | | | | | | | | | | | | | | | | | | | 778,307 | | | | | |
| Industrials 0.00% | | | | | | | | | | | | | | | | | | | | | | | | | | | | |
| Armstrong World Industries, Inc.7 | | | 205,513 | | | | 18,859 | | | | 109,365 | | | | (27,119 | ) | | | (26,507 | ) | | | — | | | | 1,562 | |
| Total common stocks | | | | | | | | | | | | | | | | | | | | | | | 778,307 | | | | | |
| Short-term securities 2.04% | | | | | | | | | | | | | | | | | | | | | | | | | | | | |
| Money market investments 2.04% | | | | | | | | | | | | | | | | | | | | | | | | | | | | |
| Capital Group Central Cash Fund 0.12%5 | | | 2,797,333 | | | | 19,290,605 | | | | 19,728,178 | | | | 4,038 | | | | (2,298 | ) | | | 2,361,500 | | | | 22,513 | |
| Total 2.71% | | | | | | | | | | | | | | $ | (23,017 | ) | | $ | 174,183 | | | $ | 3,139,807 | | | $ | 24,075 | |
| 1 | Valued under fair value procedures adopted by authority of the board of trustees. The total value of all such securities was $17,246,108,000, which represented 14.89% of the net assets of the fund. This entire amount relates to certain securities trading outside the U.S. whose values were adjusted as a result of significant market movements following the close of local trading. |
| 2 | Security did not produce income during the last 12 months. |
| 3 | All or a portion of this security was on loan. The total value of all such securities was $62,180,000, which represented .05% of the net assets of the fund. Refer to Note 5 for more information on securities lending. |
| 4 | Affiliate of the fund or part of the same group of investment companies as the fund, in each case as defined under the Investment Company Act of 1940. |
| 5 | Rate represents the seven-day yield at 12/31/2020. |
| 6 | Security purchased with cash collateral from securities on loan. Refer to Note 5 for more information on securities lending. |
| 7 | Unaffiliated issuer at 12/31/2020. |
Key to abbreviations
ADR = American Depositary Receipts
CAD = Canadian dollars
EUR = Euros
GBP = British pounds
See notes to financial statements.
Financial statements
Statement of assets and liabilities
at December 31, 2020 | (dollars in thousands) |
| Assets: | | | | | | | | |
| Investment securities, at value (includes $62,180 of investment securities on loan): | | | | | | | | |
| Unaffiliated issuers (cost: $65,545,166) | | $ | 112,618,796 | | | | | |
| Affiliated issuers (cost: $2,927,202) | | | 3,139,807 | | | $ | 115,758,603 | |
| Cash | | | | | | | 33,772 | |
| Cash denominated in currencies other than U.S. dollars (cost: $29,490) | | | | | | | 30,199 | |
| Cash collateral received for securities on loan | | | | | | | 5,585 | |
| Receivables for: | | | | | | | | |
| Sales of investments | | | 25,856 | | | | | |
| Sales of fund’s shares | | | 87,668 | | | | | |
| Dividends | | | 172,770 | | | | | |
| Securities lending income | | | 117 | | | | | |
| Other | | | 1,191 | | | | 287,602 | |
| | | | | | | | 116,115,761 | |
| Liabilities: | | | | | | | | |
| Collateral for securities on loan | | | | | | | 55,848 | |
| Payables for: | | | | | | | | |
| Purchases of investments | | | 29,226 | | | | | |
| Repurchases of fund’s shares | | | 122,967 | | | | | |
| Investment advisory services | | | 23,221 | | | | | |
| Services provided by related parties | | | 22,522 | | | | | |
| Trustees’ deferred compensation | | | 4,148 | | | | | |
| Non-U.S. taxes | | | 36,381 | | | | | |
| Other | | | 979 | | | | 239,444 | |
| Net assets at December 31, 2020 | | | | | | $ | 115,820,469 | |
| | | | | | | | | |
| Net assets consist of: | | | | | | | | |
| Capital paid in on shares of beneficial interest | | | | | | $ | 65,024,303 | |
| Total distributable earnings | | | | | | | 50,796,166 | |
| Net assets at December 31, 2020 | | | | | | $ | 115,820,469 | |
See notes to financial statements.
Statement of assets and liabilities
at December 31, 2020 (continued)
(dollars and shares in thousands, except per-share amounts)
Shares of beneficial interest issued and outstanding (no stated par value) —
unlimited shares authorized (1,675,663 total shares outstanding)
| | | Net assets | | | Shares
outstanding | | | Net asset value
per share | |
| Class A | | $ | 60,571,733 | | | | 876,008 | | | $ | 69.15 | |
| Class C | | | 1,671,107 | | | | 24,299 | | | | 68.77 | |
| Class T | | | 12 | | | | — | * | | | 69.12 | |
| Class F-1 | | | 2,521,586 | | | | 36,491 | | | | 69.10 | |
| Class F-2 | | | 11,567,282 | | | | 167,382 | | | | 69.11 | |
| Class F-3 | | | 8,288,036 | | | | 119,931 | | | | 69.11 | |
| Class 529-A | | | 3,218,887 | | | | 46,636 | | | | 69.02 | |
| Class 529-C | | | 144,235 | | | | 2,088 | | | | 69.09 | |
| Class 529-E | | | 96,022 | | | | 1,393 | | | | 68.96 | |
| Class 529-T | | | 16 | | | | — | * | | | 69.13 | |
| Class 529-F-1 | | | 11 | | | | — | * | | | 68.95 | |
| Class 529-F-2 | | | 231,340 | | | | 3,346 | | | | 69.14 | |
| Class 529-F-3 | | | 12 | | | | — | * | | | 69.13 | |
| Class R-1 | | | 112,685 | | | | 1,639 | | | | 68.77 | |
| Class R-2 | | | 729,420 | | | | 10,617 | | | | 68.70 | |
| Class R-2E | | | 99,065 | | | | 1,441 | | | | 68.75 | |
| Class R-3 | | | 1,851,456 | | | | 26,850 | | | | 68.96 | |
| Class R-4 | | | 1,847,453 | | | | 26,785 | | | | 68.97 | |
| Class R-5E | | | 417,905 | | | | 6,057 | | | | 68.99 | |
| Class R-5 | | | 1,252,669 | | | | 18,104 | | | | 69.19 | |
| Class R-6 | | | 21,199,537 | | | | 306,596 | | | | 69.14 | |
| * | Amount less than one thousand. |
See notes to financial statements.
Financial statements (continued)
Statement of operations
for the year ended December 31, 2020 | (dollars in thousands) |
| Investment income: | | | | | | | | |
| Income: | | | | | | | | |
| Dividends (net of non-U.S. taxes of $38,664; also includes $24,075 from affiliates) | | $ | 2,125,509 | | | | | |
| Interest | | | 11,978 | | | | | |
| Securities lending income (net of fees) | | | 160 | | | $ | 2,137,647 | |
| Fees and expenses*: | | | | | | | | |
| Investment advisory services | | | 246,180 | | | | | |
| Distribution services | | | 182,399 | | | | | |
| Transfer agent services | | | 71,295 | | | | | |
| Administrative services | | | 30,613 | | | | | |
| Reports to shareholders | | | 2,815 | | | | | |
| Registration statement and prospectus | | | 1,906 | | | | | |
| Trustees’ compensation | | | 1,082 | | | | | |
| Auditing and legal | | | 347 | | | | | |
| Custodian | | | 3,781 | | | | | |
| Other | | | 2,154 | | | | | |
| Total fees and expenses before reimbursement | | | 542,572 | | | | | |
| Less reimbursement of fees and expenses: | | | | | | | | |
| Transfer agent services reimbursement | | | — | † | | | | |
| Total fees and expenses after reimbursement | | | | | | | 542,572 | |
| Net investment income | | | | | | | 1,595,075 | |
| | | | | | | | | |
| Net realized gain and unrealized appreciation: | | | | | | | | |
| Net realized gain (loss) on: | | | | | | | | |
| Investments: | | | | | | | | |
| Unaffiliated issuers | | | 3,768,819 | | | | | |
| Affiliated issuers | | | (23,017 | ) | | | | |
| In-kind redemptions | | | 55,347 | | | | | |
| Currency transactions | | | (18,281 | ) | | | 3,782,868 | |
| Net unrealized appreciation on: | | | | | | | | |
| Investments (net of non-U.S. taxes of $32,442): | | | | | | | | |
| Unaffiliated issuers | | | 9,299,679 | | | | | |
| Affiliated issuers | | | 174,183 | | | | | |
| Currency translations | | | 1,133 | | | | 9,474,995 | |
| Net realized gain and unrealized appreciation | | | | | | | 13,257,863 | |
| | | | | | | | | |
| Net increase in net assets resulting from operations | | | | | | $ | 14,852,938 | |
| * | Additional information related to class-specific fees and expenses is included in the notes to financial statements. |
| † | Amount less than one thousand. |
See notes to financial statements.
Financial statements (continued)
| Statements of changes in net assets | | |
| | (dollars in thousands) |
| | | Year ended December 31, | |
| | | 2020 | | | 2019 | |
| Operations: | | | | | | | | |
| Net investment income | | $ | 1,595,075 | | | $ | 1,714,614 | |
| Net realized gain | | | 3,782,868 | | | | 6,292,213 | |
| Net unrealized appreciation | | | 9,474,995 | | | | 16,154,786 | |
| Net increase in net assets resulting from operations | | | 14,852,938 | | | | 24,161,613 | |
| | | | | | | | | |
| Distributions paid to shareholders | | | (3,132,095 | ) | | | (7,671,101 | ) |
| | | | | | | | | |
| Net capital share transactions | | | (4,417,779 | ) | | | 3,796,000 | |
| | | | | | | | | |
| Total increase in net assets | | | 7,303,064 | | | | 20,286,512 | |
| | | | | | | | | |
| Net assets: | | | | | | | | |
| Beginning of year | | | 108,517,405 | | | | 88,230,893 | |
| End of year | | $ | 115,820,469 | | | $ | 108,517,405 | |
See notes to financial statements.
Notes to financial statements
1. Organization
American Funds Fundamental Investors (the “trust”) is registered under the Investment Company Act of 1940 as an open-end, diversified management investment company and has initially issued one series of shares, Fundamental Investors (the “fund”). The fund seeks long-term growth of capital and income.
The fund has 21 share classes consisting of six retail share classes (Classes A, C, T, F-1, F-2 and F-3), seven 529 college savings plan share classes (Classes 529-A, 529-C, 529-E, 529-T, 529-F-1, 529-F-2 and 529-F-3) and eight retirement plan share classes (Classes R-1, R-2, R-2E, R-3, R-4, R-5E, R-5 and R-6). The 529 college savings plan share classes can be used to save for college education. The retirement plan share classes are generally offered only through eligible employer-sponsored retirement plans. The fund’s share classes are described further in the following table:
| Share class | | Initial sales charge | | Contingent deferred sales
charge upon redemption | | Conversion feature |
| Classes A and 529-A | | Up to 5.75% for Class A; up to 3.50% for Class 529-A1 | | None (except 1% for certain redemptions within 18 months of purchase without an initial sales charge) | | None |
| Classes C and 529-C | | None | | 1% for redemptions within one year of purchase | | Class C converts to Class A after eight years and Class 529-C converts to Class 529-A after five years2 |
| Class 529-E | | None | | None | | None |
| Classes T and 529-T3 | | Up to 2.50% | | None | | None |
| Classes F-1, F-2, F-3, 529-F-1, 529-F-2 and 529-F-3 | | None | | None | | None |
| Classes R-1, R-2, R-2E, R-3, R-4, R-5E, R-5 and R-6 | | None | | None | | None |
| 1 | Prior to June 30, 2020, the initial sales charge was up to 5.75% for Class 529-A purchases. |
| 2 | Prior to June 30, 2020, Class C converted to Class F-1 and Class 529-C converted to Class 529-A after ten years. |
| 3 | Class T and 529-T shares are not available for purchase. |
Holders of all share classes have equal pro rata rights to the assets, dividends and liquidation proceeds of the fund. Each share class has identical voting rights, except for the exclusive right to vote on matters affecting only its class. Share classes have different fees and expenses (“class-specific fees and expenses”), primarily due to different arrangements for distribution, transfer agent and administrative services. Differences in class-specific fees and expenses will result in differences in net investment income and, therefore, the payment of different per-share dividends by each share class.
2. Significant accounting policies
The fund is an investment company that applies the accounting and reporting guidance issued in Topic 946 by the U.S. Financial Accounting Standards Board. The fund’s financial statements have been prepared to comply with U.S. generally accepted accounting principles (“U.S. GAAP“). These principles require the fund’s investment adviser to make estimates and assumptions that affect reported amounts and disclosures. Actual results could differ from those estimates. Subsequent events, if any, have been evaluated through the date of issuance in the preparation of the financial statements. The fund follows the significant accounting policies described in this section, as well as the valuation policies described in the next section on valuation.
Security transactions and related investment income — Security transactions are recorded by the fund as of the date the trades are executed with brokers. Realized gains and losses from security transactions are determined based on the specific identified cost of the securities. In the event a security is purchased with a delayed payment date, the fund will segregate liquid assets sufficient to meet its payment obligations. Dividend income is recognized on the ex-dividend date and interest income is recognized on an accrual basis. Market discounts, premiums and original issue discounts on fixed-income securities are amortized daily over the expected life of the security.
Class allocations — Income, fees and expenses (other than class-specific fees and expenses), realized gains and losses and unrealized appreciation and depreciation are allocated daily among the various share classes based on their relative net assets. Class-specific fees and expenses, such as distribution, transfer agent and administrative services, are charged directly to the respective share class.
Distributions paid to shareholders — Income dividends and capital gain distributions are recorded on the ex-dividend date.
Currency translation — Assets and liabilities, including investment securities, denominated in currencies other than U.S. dollars are translated into U.S. dollars at the exchange rates supplied by one or more pricing vendors on the valuation date. Purchases and sales of investment securities and income and expenses are translated into U.S. dollars at the exchange rates on the dates of such transactions. The effects of changes in exchange rates on investment securities are included with the net realized gain or loss and net unrealized appreciation or depreciation on investments in the fund’s statement of operations. The realized gain or loss and unrealized appreciation or depreciation resulting from all other transactions denominated in currencies other than U.S. dollars are disclosed separately.
In-kind redemptions — The fund normally redeems shares in cash; however, under certain conditions and circumstances, payment of the redemption price wholly or partly with portfolio securities or other fund assets may be permitted. A redemption of shares in-kind is based upon the closing value of the shares being redeemed as of the trade date. Realized gains/losses resulting from redemptions of shares in-kind are reflected separately in the fund’s statement of operations.
3. Valuation
Capital Research and Management Company (“CRMC”), the fund’s investment adviser, values the fund’s investments at fair value as defined by U.S. GAAP. The net asset value per share is calculated once daily as of the close of regular trading on the New York Stock Exchange, normally 4 p.m. New York time, each day the New York Stock Exchange is open.
Methods and inputs — The fund’s investment adviser uses the following methods and inputs to establish the fair value of the fund’s assets and liabilities. Use of particular methods and inputs may vary over time based on availability and relevance as market and economic conditions evolve.
Equity securities are generally valued at the official closing price of, or the last reported sale price on, the exchange or market on which such securities are traded, as of the close of business on the day the securities are being valued or, lacking any sales, at the last available bid price. Prices for each security are taken from the principal exchange or market on which the security trades.
Fixed-income securities, including short-term securities, are generally valued at prices obtained from one or more pricing vendors. Vendors value such securities based on one or more of the inputs described in the following table. The table provides examples of inputs that are commonly relevant for valuing particular classes of fixed-income securities in which the fund is authorized to invest. However, these classifications are not exclusive, and any of the inputs may be used to value any other class of fixed-income security.
| Fixed-income class | | Examples of standard inputs |
| All | | Benchmark yields, transactions, bids, offers, quotations from dealers and trading systems, new issues, spreads and other relationships observed in the markets among comparable securities; and proprietary pricing models such as yield measures calculated using factors such as cash flows, financial or collateral performance and other reference data (collectively referred to as “standard inputs”) |
| Corporate bonds, notes & loans; convertible securities | | Standard inputs and underlying equity of the issuer |
| Bonds & notes of governments & government agencies | | Standard inputs and interest rate volatilities |
| Mortgage-backed; asset-backed obligations | | Standard inputs and cash flows, prepayment information, default rates, delinquency and loss assumptions, collateral characteristics, credit enhancements and specific deal information |
When the fund’s investment adviser deems it appropriate to do so (such as when vendor prices are unavailable or deemed to be not representative), fixed-income securities will be valued in good faith at the mean quoted bid and ask prices that are reasonably and timely available (or bid prices, if ask prices are not available) or at prices for securities of comparable maturity, quality and type.
Securities with both fixed-income and equity characteristics, or equity securities traded principally among fixed-income dealers, are generally valued in the manner described for either equity or fixed-income securities, depending on which method is deemed most appropriate by the fund’s investment adviser. The Capital Group Central Cash Fund (“CCF”), a fund within the Capital Group Central Fund Series (“Central Funds“), is valued based upon a floating net asset value, which fluctuates with changes in the value of CCF’s portfolio securities. The underlying securities are valued based on the policies and procedures in CCF’s statement of additional information.
Securities and other assets for which representative market quotations are not readily available or are considered unreliable by the fund’s investment adviser are fair valued as determined in good faith under fair valuation guidelines adopted by authority of the fund’s board of trustees as further described. The investment adviser follows fair valuation guidelines, consistent with U.S. Securities and Exchange
Commission rules and guidance, to consider relevant principles and factors when making fair value determinations. The investment adviser considers relevant indications of value that are reasonably and timely available to it in determining the fair value to be assigned to a particular security, such as the type and cost of the security; contractual or legal restrictions on resale of the security; relevant financial or business developments of the issuer; actively traded similar or related securities; conversion or exchange rights on the security; related corporate actions; significant events occurring after the close of trading in the security; and changes in overall market conditions. In addition, the closing prices of equity securities that trade in markets outside U.S. time zones may be adjusted to reflect significant events that occur after the close of local trading but before the net asset value of each share class of the fund is determined. Fair valuations and valuations of investments that are not actively trading involve judgment and may differ materially from valuations that would have been used had greater market activity occurred.
Processes and structure — The fund’s board of trustees has delegated authority to the fund’s investment adviser to make fair value determinations, subject to board oversight. The investment adviser has established a Joint Fair Valuation Committee (the “Fair Valuation Committee”) to administer, implement and oversee the fair valuation process, and to make fair value decisions. The Fair Valuation Committee regularly reviews its own fair value decisions, as well as decisions made under its standing instructions to the investment adviser’s valuation teams. The Fair Valuation Committee reviews changes in fair value measurements from period to period and may, as deemed appropriate, update the fair valuation guidelines to better reflect the results of back testing and address new or evolving issues. The Fair Valuation Committee reports any changes to the fair valuation guidelines to the board of trustees. The fund’s board and audit committee also regularly review reports that describe fair value determinations and methods.
The fund’s investment adviser has also established a Fixed-Income Pricing Review Group to administer and oversee the fixed-income valuation process, including the use of fixed-income pricing vendors. This group regularly reviews pricing vendor information and market data. Pricing decisions, processes and controls over security valuation are also subject to additional internal reviews, including an annual control self-evaluation program facilitated by the investment adviser’s compliance group.
Classifications — The fund’s investment adviser classifies the fund’s assets and liabilities into three levels based on the inputs used to value the assets or liabilities. Level 1 values are based on quoted prices in active markets for identical securities. Level 2 values are based on significant observable market inputs, such as quoted prices for similar securities and quoted prices in inactive markets. Certain securities trading outside the U.S. may transfer between Level 1 and Level 2 due to valuation adjustments resulting from significant market movements following the close of local trading. Level 3 values are based on significant unobservable inputs that reflect the investment adviser’s determination of assumptions that market participants might reasonably use in valuing the securities. The valuation levels are not necessarily an indication of the risk or liquidity associated with the underlying investment. For example, U.S. government securities are reflected as Level 2 because the inputs used to determine fair value may not always be quoted prices in an active market. The following table presents the fund’s valuation levels as of December 31, 2020 (dollars in thousands):
| | | Investment securities | |
| | | Level 1 | | | Level 2 | | | Level 3 | | | Total | |
| Assets: | | | | | | | | | | | | | | | | |
| Common stocks: | | | | | | | | | | | | | | | | |
| Information technology | | $ | 23,882,258 | | | $ | 3,699,518 | | | $ | — | | | $ | 27,581,776 | |
| Health care | | | 12,892,009 | | | | 1,249,601 | | | | — | | | | 14,141,610 | |
| Communication services | | | 13,382,817 | | | | 364,164 | | | | — | | | | 13,746,981 | |
| Financials | | | 9,613,976 | | | | 1,730,161 | | | | — | | | | 11,344,137 | |
| Consumer discretionary | | | 8,132,700 | | | | 3,161,693 | | | | — | | | | 11,294,393 | |
| Industrials | | | 8,715,624 | | | | 1,979,610 | | | | — | | | | 10,695,234 | |
| Consumer staples | | | 7,534,710 | | | | 2,662,550 | | | | — | | | | 10,197,260 | |
| Materials | | | 5,702,738 | | | | 528,280 | | | | — | | | | 6,231,018 | |
| Utilities | | | 2,158,582 | | | | 1,399,568 | | | | — | | | | 3,558,150 | |
| Energy | | | 2,230,588 | | | | 373,505 | | | | — | | | | 2,604,093 | |
| Real estate | | | 1,494,264 | | | | 63,517 | | | | — | | | | 1,557,781 | |
| Preferred securities | | | — | | | | 33,941 | | | | — | | | | 33,941 | |
| Rights & warrants | | | 47 | | | | — | | | | — | | | | 47 | |
| Convertible stocks | | | 360,419 | | | | — | | | | — | | | | 360,419 | |
| Short-term securities | | | 2,411,763 | | | | — | | | | — | | | | 2,411,763 | |
| Total | | $ | 98,512,495 | | | $ | 17,246,108 | | | $ | — | | | $ | 115,758,603 | |
4. Risk factors
Investing in the fund may involve certain risks including, but not limited to, those described below.
Market conditions — The prices of, and the income generated by, the common stocks and other securities held by the fund may decline — sometimes rapidly or unpredictably — due to various factors, including events or conditions affecting the general economy or particular industries; overall market changes; local, regional or global political, social or economic instability; governmental, governmental agency or central bank responses to economic conditions; and currency exchange rate, interest rate and commodity price fluctuations.
Economies and financial markets throughout the world are highly interconnected. Economic, financial or political events, trading and tariff arrangements, wars, terrorism, cybersecurity events, natural disasters, public health emergencies (such as the spread of infectious disease) and other circumstances in one country or region, including actions taken by governmental or quasi-governmental authorities in response to any of the foregoing, could have impacts on global economies or markets. As a result, whether or not the fund invests in securities of issuers located in or with significant exposure to the countries affected, the value and liquidity of the fund’s investments may be negatively affected by developments in other countries and regions.
Issuer risks — The prices of, and the income generated by, securities held by the fund may decline in response to various factors directly related to the issuers of such securities, including reduced demand for an issuer’s goods or services, poor management performance, major litigation, investigations or other controversies related to the issuer, changes in government regulations affecting the issuer or its competitive environment and strategic initiatives such as mergers, acquisitions or dispositions and the market response to any such initiatives.
Investing in growth-oriented stocks — Growth-oriented common stocks and other equity-type securities (such as preferred stocks, convertible preferred stocks and convertible bonds) may involve larger price swings and greater potential for loss than other types of investments.
Investing in income-oriented stocks — The value of the fund’s securities and income provided by the fund may be reduced by changes in the dividend policies of, and the capital resources available for dividend payments at, the companies in which the fund invests.
Investing outside the U.S. — Securities of issuers domiciled outside the U.S., or with significant operations or revenues outside the U.S., may lose value because of adverse political, social, economic or market developments (including social instability, regional conflicts, terrorism and war) in the countries or regions in which the issuers operate or generate revenue. These securities may also lose value due to changes in foreign currency exchange rates against the U.S. dollar and/or currencies of other countries. Issuers of these securities may be more susceptible to actions of foreign governments, such as nationalization, currency blockage or the imposition of price controls or punitive taxes, each of which could adversely impact the value of these securities. Securities markets in certain countries may be more volatile and/or less liquid than those in the U.S. Investments outside the U.S. may also be subject to different accounting practices and different regulatory, legal and reporting standards and practices, and may be more difficult to value, than those in the U.S. In addition, the value of investments outside the U.S. may be reduced by foreign taxes, including foreign withholding taxes on interest and dividends. Further, there may be increased risks of delayed settlement of securities purchased or sold by the fund. The risks of investing outside the U.S. may be heightened in connection with investments in emerging markets.
Management — The investment adviser to the fund actively manages the fund’s investments. Consequently, the fund is subject to the risk that the methods and analyses, including models, tools and data, employed by the investment adviser in this process may be flawed or incorrect and may not produce the desired results. This could cause the fund to lose value or its investment results to lag relevant benchmarks or other funds with similar objectives.
5. Certain investment techniques
Securities lending — The fund has entered into securities lending transactions in which the fund earns income by lending investment securities to brokers, dealers or other institutions. Each transaction involves three parties: the fund, acting as the lender of the securities, a borrower, and a lending agent that acts as an intermediary.
Securities lending transactions are entered into by the fund under a securities lending agent agreement with the lending agent. The lending agent facilitates the exchange of securities between the fund and approved borrowers, ensures that securities loans are properly coordinated and documented, marks-to-market the value of collateral daily, secures additional collateral from a borrower if it falls below preset terms, and may reinvest cash collateral on behalf of the fund according to agreed parameters. The lending agent provides indemnification to the fund against losses resulting from a borrower default. Although risk is mitigated by the collateral and indemnification, the fund could experience a delay in recovering its securities and a potential loss of income or value if a borrower fails to return securities, collateral investments decline in value or the lending agent fails to perform.
The borrower is required to post highly liquid assets, such as cash or U.S. government securities, as collateral for the loan in an amount at least equal to the value of the securities loaned. Investments made with cash collateral are recognized as assets in the fund’s investment portfolio. The same amount is recorded as a liability in the fund’s statement of assets and liabilities. While securities are on loan, the fund will continue to receive the equivalent of the interest, dividends or other distributions paid by the issuer, as well as a portion of the interest on the investment of the collateral. Additionally, although the fund does not have the right to vote on securities while they are on loan, the fund has a right to consent on corporate actions and a right to recall loaned securities to vote. A borrower is obligated to return loaned securities at the conclusion of a loan or, during the pendency of a loan, on demand from the fund.
As of December 31, 2020, the total value of securities on loan was $62,180,000, and the total value of collateral received was $67,866,000. Collateral received includes cash of $55,848,000 and U.S. government securities of $12,018,000. Investment securities purchased from cash collateral are disclosed in the investment portfolio as short-term securities. Securities received as collateral, if any, are not recognized as fund assets. The contractual maturity of cash collateral received under the securities lending agreement is classified as overnight and continuous.
Collateral — The fund receives highly liquid assets, such as cash or U.S. government securities, as collateral in exchange for lending investment securities. The purpose of the collateral is to cover potential losses that could occur in the event the borrower cannot meet its contractual obligation. The lending agent may reinvest cash collateral from securities lending transactions according to agreed parameters. Cash collateral reinvested by the lending agent, if any, is disclosed in the fund’s investment portfolio.
6. Taxation and distributions
Federal income taxation — The fund complies with the requirements under Subchapter M of the Internal Revenue Code applicable to mutual funds and intends to distribute substantially all of its net taxable income and net capital gains each year. The fund is not subject to income taxes to the extent such distributions are made. Therefore, no federal income tax provision is required.
As of and during the year ended December 31, 2020, the fund did not have a liability for any unrecognized tax benefits. The fund recognizes interest and penalties, if any, related to unrecognized tax benefits as income tax expense in the statement of operations. During the period, the fund did not incur any significant interest or penalties.
The fund’s tax returns are not subject to examination by federal, state and, if applicable, non-U.S. tax authorities after the expiration of each jurisdiction’s statute of limitations, which is generally three years after the date of filing but can be extended in certain jurisdictions.
Non-U.S. taxation — Dividend and interest income are recorded net of non-U.S. taxes paid. The fund may file withholding tax reclaims in certain jurisdictions to recover a portion of amounts previously withheld. As a result of rulings from European courts, the fund filed for additional reclaims related to prior years. These reclaims are recorded when the amount is known and there are no significant uncertainties on collectability. During the year ended December 31, 2020, the fund recognized $34,677,000 in reclaims (net of fees and the effect of realized gain or loss from currency translations) and $11,537,000 in interest related to European court rulings, which is included in dividend income and interest income, respectively, in the fund’s statement of operations. Gains realized by the fund on the sale of securities in certain countries, if any, may be subject to non-U.S. taxes. If applicable, the fund records an estimated deferred tax liability based on unrealized gains to provide for potential non-U.S. taxes payable upon the sale of these securities.
Distributions — Distributions paid to shareholders are based on net investment income and net realized gains determined on a tax basis, which may differ from net investment income and net realized gains for financial reporting purposes. These differences are due primarily to different treatment for items such as currency gains and losses; short-term capital gains and losses; capital losses related to sales of certain securities within 30 days of purchase and unrealized appreciation of certain investments in securities outside the U.S.. The fiscal year in which amounts are distributed may differ from the year in which the net investment income and net realized gains are recorded by the fund for financial reporting purposes. The fund may also designate a portion of the amount paid to redeeming shareholders as a distribution for tax purposes.
During the year ended December 31, 2020, the fund reclassified $210,096,000 from total distributable earnings to capital paid in on shares of beneficial interest to align financial reporting with tax reporting.
As of December 31, 2020, the tax basis components of distributable earnings, unrealized appreciation (depreciation) and cost of investments were as follows (dollars in thousands):
| Undistributed ordinary income | | $ | 164,207 | |
| Undistributed long-term capital gains | | | 3,505,019 | |
| Gross unrealized appreciation on investments | | | 47,828,053 | |
| Gross unrealized depreciation on investments | | | (666,421 | ) |
| Net unrealized appreciation on investments | | | 47,161,632 | |
| Cost of investments | | | 68,596,971 | |
Distributions paid were characterized for tax purposes as follows (dollars in thousands):
| | | Year ended December 31, 2020 | | | Year ended December 31, 2019 | |
| Share class | | Ordinary
income | | | Long-term
capital gains | | | Total
distributions
paid | | | Ordinary
income | | | Long-term
capital gains | | | Total
distributions
paid | |
| Class A | | $ | 902,306 | | | $ | 690,446 | | | $ | 1,592,752 | | | $ | 825,499 | | | $ | 3,156,847 | | | $ | 3,982,346 | |
| Class C | | | 14,955 | | | | 23,616 | | | | 38,571 | | | | 15,859 | | | | 116,925 | | | | 132,784 | |
| Class T | | | — | * | | | — | * | | | — | * | | | — | * | | | 1 | | | | 1 | |
| Class F-1 | | | 38,141 | | | | 30,455 | | | | 68,596 | | | | 39,438 | | | | 155,470 | | | | 194,908 | |
| Class F-2 | | | 193,513 | | | | 129,288 | | | | 322,801 | | | | 177,322 | | | | 602,873 | | | | 780,195 | |
| Class F-3 | | | 145,972 | | | | 93,395 | | | | 239,367 | | | | 127,770 | | | | 418,682 | | | | 546,452 | |
| Class 529-A | | | 45,940 | | | | 34,880 | | | | 80,820 | | | | 39,232 | | | | 156,084 | | | | 195,316 | |
| Class 529-C | | | 1,485 | | | | 3,945 | | | | 5,430 | | | | 2,490 | | | | 19,773 | | | | 22,263 | |
| Class 529-E | | | 1,235 | | | | 1,140 | | | | 2,375 | | | | 1,123 | | | | 5,221 | | | | 6,344 | |
| Class 529-T | | | — | * | | | — | * | | | — | * | | | — | * | | | 1 | | | | 1 | |
| Class 529-F-1 | | | 1,930 | | | | 2,506 | | | | 4,436 | | | | 3,057 | | | | 10,659 | | | | 13,716 | |
| Class 529-F-2† | | | 1,814 | | | | — | | | | 1,814 | | | | | | | | | | | | | |
| Class 529-F-3† | | | — | * | | | — | | | | — | * | | | | | | | | | | | | |
| Class R-1 | | | 950 | | | | 1,557 | | | | 2,507 | | | | 1,002 | | | | 7,612 | | | | 8,614 | |
| Class R-2 | | | 6,137 | | | | 8,709 | | | | 14,846 | | | | 5,514 | | | | 41,384 | | | | 46,898 | |
| Class R-2E | | | 1,097 | | | | 1,167 | | | | 2,264 | | | | 910 | | | | 5,056 | | | | 5,966 | |
| Class R-3 | | | 23,128 | | | | 22,756 | | | | 45,884 | | | | 23,675 | | | | 112,751 | | | | 136,426 | |
| Class R-4 | | | 28,378 | | | | 22,602 | | | | 50,980 | | | | 29,564 | | | | 111,644 | | | | 141,208 | |
| Class R-5E | | | 6,904 | | | | 4,744 | | | | 11,648 | | | | 5,800 | | | | 20,720 | | | | 26,520 | |
| Class R-5 | | | 22,874 | | | | 15,677 | | | | 38,551 | | | | 24,473 | | | | 76,552 | | | | 101,025 | |
| Class R-6 | | | 371,495 | | | | 236,958 | | | | 608,453 | | | | 313,476 | | | | 1,016,642 | | | | 1,330,118 | |
| Total | | $ | 1,808,254 | | | $ | 1,323,841 | | | $ | 3,132,095 | | | $ | 1,636,204 | | | $ | 6,034,897 | | | $ | 7,671,101 | |
| * | Amount less than one thousand. |
| † | Class 529-F-2 and 529-F-3 shares began investment operations on October 30, 2020. |
7. Fees and transactions with related parties
CRMC, the fund’s investment adviser, is the parent company of American Funds Distributors®, Inc. (“AFD”), the principal underwriter of the fund’s shares, and American Funds Service Company® (“AFS”), the fund’s transfer agent. CRMC, AFD and AFS are considered related parties to the fund.
Investment advisory services — The fund has an investment advisory and service agreement with CRMC that provides for monthly fees accrued daily. These fees are based on a series of decreasing annual rates beginning with 0.390% on the first $1 billion of daily net assets and decreasing to 0.229% on such assets in excess of $89 billion. For the year ended December 31, 2020, the investment advisory services fee was $246,180,000, which was equivalent to an annualized rate of 0.241% of average daily net assets.
Class-specific fees and expenses — Expenses that are specific to individual share classes are accrued directly to the respective share class. The principal class-specific fees and expenses are further described below:
Distribution services — The fund has plans of distribution for all share classes, except Class F-2, F-3, 529-F-2, 529-F-3, R-5E, R-5 and R-6 shares. Under the plans, the board of trustees approves certain categories of expenses that are used to finance activities primarily intended to sell fund shares and service existing accounts. The plans provide for payments, based on an annualized percentage of average daily net assets, ranging from 0.25% to 1.00% as noted in this section. In some cases, the board of trustees has limited the amounts that may be paid to less than the maximum allowed by the plans. All share classes with a plan may use up to 0.25% of average daily net assets to pay service fees, or to compensate AFD for paying service fees, to firms that have entered into agreements with AFD to provide certain shareholder services. The remaining amounts available to be paid under each plan are paid to dealers to compensate them for their sales activities.
| Share class | | Currently approved limits | | Plan limits | |
| Class A | | | 0.25 | % | | | 0.25 | % | |
| Class 529-A | | | 0.25 | | | | 0.50 | | |
| Classes C, 529-C and R-1 | | | 1.00 | | | | 1.00 | | |
| Class R-2 | | | 0.75 | | | | 1.00 | | |
| Class R-2E | | | 0.60 | | | | 0.85 | | |
| Classes 529-E and R-3 | | | 0.50 | | | | 0.75 | | |
| Classes T, F-1, 529-T, 529-F-1 and R-4 | | | 0.25 | | | | 0.50 | | |
For Class A and 529-A shares, distribution-related expenses include the reimbursement of dealer and wholesaler commissions paid by AFD for certain shares sold without a sales charge. These share classes reimburse AFD for amounts billed within the prior 15 months but only to the extent that the overall annual expense limits are not exceeded. As of December 31, 2020, there were no unreimbursed expenses subject to reimbursement for Class A or 529-A shares.
Transfer agent services — The fund has a shareholder services agreement with AFS under which the fund compensates AFS for providing transfer agent services to each of the fund’s share classes. These services include recordkeeping, shareholder communications and transaction processing. In addition, the fund reimburses AFS for amounts paid to third parties for performing transfer agent services on behalf of fund shareholders. For the year ended December 31, 2020, CRMC reimbursed transfer agent services fees of less than $1,000 for Class 529-F-3 shares. CRMC does not intend to recoup this reimbursement.
Administrative services — The fund has an administrative services agreement with CRMC under which the fund compensates CRMC for providing administrative services to all share classes. Administrative services are provided by CRMC and its affiliates to help assist third parties providing non-distribution services to fund shareholders. These services include providing in-depth information on the fund and market developments that impact fund investments. Administrative services also include, but are not limited to, coordinating, monitoring and overseeing third parties that provide services to fund shareholders. The agreement provides the fund the ability to charge an administrative services fee at the annual rate of 0.05% of the average daily net assets attributable to each share class of the fund. Currently the fund pays CRMC an administrative services fee at the annual rate of 0.03% of the average daily net assets attributable to each share class of the fund for CRMC’s provision of administrative services.
529 plan services — Each 529 share class is subject to service fees to compensate the Virginia College Savings Plan (“Virginia529”) for its oversight and administration of the CollegeAmerica 529 college savings plan. The fee is based on the combined net assets invested in Class 529 and ABLE shares of the American Funds. Class ABLE shares are offered on other American Funds by Virginia529 through ABLEAmerica®, a tax-advantaged savings program for individuals with disabilities. The quarterly fee is based on a series of decreasing annual rates beginning with 0.09% on the first $20 billion of the combined net assets invested in the American Funds and decreasing to 0.03% on such assets in excess of $100 billion. The fee for any given calendar quarter is accrued and calculated on the basis of the average net assets of Class 529 and ABLE shares of the American Funds for the last month of the prior calendar quarter. The fee is included in other expenses in the fund’s statement of operations. Virginia529 is not considered a related party to the fund.
For the year ended December 31, 2020, class-specific expenses under the agreements were as follows (dollars in thousands):
| Share class | | Distribution
services | | | Transfer agent
services | | | Administrative
services | | | | 529 plan
services | |
| Class A | | | $131,037 | | | | $45,100 | | | | $15,981 | | | | Not applicable | |
| Class C | | | 16,708 | | | | 1,447 | | | | 508 | | | | Not applicable | |
| Class T | | | — | | | | — | * | | | — | * | | | Not applicable | |
| Class F-1 | | | 5,979 | | | | 2,981 | | | | 722 | | | | Not applicable | |
| Class F-2 | | | Not applicable | | | | 10,693 | | | | 3,016 | | | | Not applicable | |
| Class F-3 | | | Not applicable | | | | 519 | | | | 2,160 | | | | Not applicable | |
| Class 529-A | | | 6,405 | | | | 2,095 | | | | 823 | | | | $1,690 | |
| Class 529-C | | | 2,188 | | | | 188 | | | | 68 | | | | 140 | |
| Class 529-E | | | 423 | | | | 32 | | | | 26 | | | | 53 | |
| Class 529-T | | | — | | | | — | * | | | — | * | | | — | * |
| Class 529-F-1 | | | — | * | | | 119 | | | | 47 | | | | 97 | |
| Class 529-F-2† | | | Not applicable | | | | 22 | | | | 11 | | | | 22 | |
| Class 529-F-3† | | | Not applicable | | | | — | * | | | — | * | | | — | * |
| Class R-1 | | | 1,162 | | | | 126 | | | | 35 | | | | Not applicable | |
| Class R-2 | | | 4,954 | | | | 2,281 | | | | 198 | | | | Not applicable | |
| Class R-2E | | | 531 | | | | 178 | | | | 27 | | | | Not applicable | |
| Class R-3 | | | 8,674 | | | | 2,598 | | | | 520 | | | | Not applicable | |
| Class R-4 | | | 4,338 | | | | 1,722 | | | | 521 | | | | Not applicable | |
| Class R-5E | | | Not applicable | | | | 537 | | | | 110 | | | | Not applicable | |
| Class R-5 | | | Not applicable | | | | 588 | | | | 356 | | | | Not applicable | |
| Class R-6 | | | Not applicable | | | | 69 | | | | 5,484 | | | | Not applicable | |
| Total class-specific expenses | | | $182,399 | | | | $71,295 | | | | $30,613 | | | | $2,002 | |
| * | Amount less than one thousand. |
| † | Class 529-F-2 and 529-F-3 shares began investment operations on October 30, 2020. |
Trustees’ deferred compensation — Trustees who are unaffiliated with CRMC may elect to defer the cash payment of part or all of their compensation. These deferred amounts, which remain as liabilities of the fund, are treated as if invested in shares of the fund or other American Funds. These amounts represent general, unsecured liabilities of the fund and vary according to the total returns of the selected funds. Trustees’ compensation of $1,082,000 in the fund’s statement of operations reflects $533,000 in current fees (either paid in cash or deferred) and a net increase of $549,000 in the value of the deferred amounts.
Affiliated officers and trustees — Officers and certain trustees of the fund are or may be considered to be affiliated with CRMC, AFD and AFS. No affiliated officers or trustees received any compensation directly from the fund.
Investment in CCF — The fund holds shares of CCF, an institutional prime money market fund managed by CRMC. CCF invests in high-quality, short-term money market instruments. CCF is used as the primary investment vehicle for the fund’s short-term investments. CCF shares are only available for purchase by CRMC, its affiliates, and other funds managed by CRMC or its affiliates, and are not available to the public. CRMC does not receive an investment advisory services fee from CCF.
Security transactions with related funds — The fund purchased securities from, and sold securities to, other funds managed by CRMC (or funds managed by certain affiliates of CRMC) under procedures adopted by the fund’s board of trustees. The funds involved in such transactions are considered related by virtue of having a common investment adviser (or affiliated investment advisers), common trustees and/or common officers. Each transaction was executed at the current market price of the security and no brokerage commissions or fees were paid in accordance with Rule 17a-7 of the 1940 Act. During the year ended December 31, 2020, the fund engaged in such purchase and sale transactions with related funds in the amounts of $2,138,580,000 and $1,649,082,000, respectively, which generated $245,127,000 of net realized losses from such sales.
Interfund lending — Pursuant to an exemptive order issued by the SEC, the fund, along with other CRMC-managed funds (or funds managed by certain affiliates of CRMC), may participate in an interfund lending program. The program provides an alternate credit facility that permits the funds to lend or borrow cash for temporary purposes directly to or from one another, subject to the conditions of the exemptive order. The fund did not lend or borrow cash through the interfund lending program at any time during the year ended December 31, 2020.
8. Capital share transactions
Capital share transactions in the fund were as follows (dollars and shares in thousands):
| | | Sales1 | | | Reinvestments of
distributions | | | Repurchases1 | | | Net (decrease)
increase | |
| Share class | | Amount | | | Shares | | | Amount | | | Shares | | | Amount | | | Shares | | | Amount | | | Shares | |
| | | | | | | | | | | | | | | | | | | | | | | | | |
| Year ended December 31, 2020 | | | | | | | | | | | | | |
| | | | | | | | | | | | | | |
| Class A | | $ | 3,693,583 | | | | 63,532 | | | $ | 1,564,823 | | | | 26,638 | | | $ | (7,476,986 | ) | | | (128,585 | ) | | $ | (2,218,580 | ) | | | (38,415 | ) |
| Class C | | | 194,230 | | | | 3,386 | | | | 38,353 | | | | 652 | | | | (768,266 | ) | | | (13,162 | ) | | | (535,683 | ) | | | (9,124 | ) |
| Class T | | | — | | | | — | | | | — | | | | — | | | | — | | | | — | | | | — | | | | — | |
| Class F-1 | | | 219,773 | | | | 3,791 | | | | 67,464 | | | | 1,155 | | | | (761,519 | ) | | | (13,157 | ) | | | (474,282 | ) | | | (8,211 | ) |
| Class F-2 | | | 2,368,919 | | | | 40,342 | | | | 312,251 | | | | 5,335 | | | | (3,041,000 | ) | | | (52,827 | ) | | | (359,830 | ) | | | (7,150 | ) |
| Class F-3 | | | 1,408,140 | | | | 24,069 | | | | 237,677 | | | | 4,065 | | | | (1,777,869 | ) | | | (30,698 | ) | | | (132,052 | ) | | | (2,564 | ) |
| Class 529-A | | | 416,367 | | | | 7,016 | | | | 80,801 | | | | 1,373 | | | | (426,980 | ) | | | (7,143 | ) | | | 70,188 | | | | 1,246 | |
| Class 529-C | | | 24,042 | | | | 409 | | | | 5,427 | | | | 94 | | | | (240,423 | ) | | | (4,071 | ) | | | (210,954 | ) | | | (3,568 | ) |
| Class 529-E | | | 7,485 | | | | 126 | | | | 2,374 | | | | 41 | | | | (17,205 | ) | | | (289 | ) | | | (7,346 | ) | | | (122 | ) |
| Class 529-T | | | — | | | | — | | | | — | 2 | | | — | 2 | | | — | | | | — | | | | — | 2 | | | — | 2 |
| Class 529-F-1 | | | 31,453 | | | | 542 | | | | 4,436 | | | | 80 | | | | (224,413 | ) | | | (3,785 | ) | | | (188,524 | ) | | | (3,163 | ) |
| Class 529-F-23 | | | 204,994 | | | | 3,419 | | | | 1,814 | | | | 26 | | | | (6,653 | ) | | | (99 | ) | | | 200,155 | | | | 3,346 | |
| Class 529-F-33 | | | 10 | | | | — | 2 | | | — | 2 | | | — | 2 | | | — | | | | — | | | | 10 | | | | — | 2 |
| Class R-1 | | | 13,558 | | | | 240 | | | | 2,513 | | | | 43 | | | | (48,037 | ) | | | (794 | ) | | | (31,966 | ) | | | (511 | ) |
| Class R-2 | | | 118,650 | | | | 2,032 | | | | 14,841 | | | | 251 | | | | (210,277 | ) | | | (3,587 | ) | | | (76,786 | ) | | | (1,304 | ) |
| Class R-2E | | | 19,697 | | | | 341 | | | | 2,263 | | | | 39 | | | | (24,268 | ) | | | (409 | ) | | | (2,308 | ) | | | (29 | ) |
| Class R-3 | | | 234,556 | | | | 4,009 | | | | 45,820 | | | | 780 | | | | (595,894 | ) | | | (10,053 | ) | | | (315,518 | ) | | | (5,264 | ) |
| Class R-4 | | | 221,075 | | | | 3,797 | | | | 50,965 | | | | 872 | | | | (573,960 | ) | | | (9,727 | ) | | | (301,920 | ) | | | (5,058 | ) |
| Class R-5E | | | 82,456 | | | | 1,390 | | | | 11,646 | | | | 199 | | | | (97,877 | ) | | | (1,659 | ) | | | (3,775 | ) | | | (70 | ) |
| Class R-5 | | | 128,184 | | | | 2,165 | | | | 38,534 | | | | 661 | | | | (390,008 | ) | | | (6,533 | ) | | | (223,290 | ) | | | (3,707 | ) |
| Class R-6 | | | 2,683,376 | | | | 47,347 | | | | 606,137 | | | | 10,355 | | | | (2,894,831 | ) | | | (48,648 | ) | | | 394,682 | | | | 9,054 | |
| Total net increase (decrease) | | $ | 12,070,548 | | | | 207,953 | | | $ | 3,088,139 | | | | 52,659 | | | $ | (19,576,466 | ) | | | (335,226 | ) | | $ | (4,417,779 | ) | | | (74,614 | ) |
| | | | | | | | | | | | | | | | | | | | | | | | | | | | | | | | | |
| Year ended December 31, 2019 | | | | | | | | | | | | | | | | | |
| | | | | | | | | | | | | | | | | | |
| Class A | | $ | 2,989,256 | | | | 50,851 | | | $ | 3,915,068 | | | | 64,266 | | | $ | (5,948,240 | ) | | | (100,408 | ) | | $ | 956,084 | | | | 14,709 | |
| Class C | | | 205,991 | | | | 3,531 | | | | 131,826 | | | | 2,172 | | | | (624,128 | ) | | | (10,667 | ) | | | (286,311 | ) | | | (4,964 | ) |
| Class T | | | — | | | | — | | | | — | | | | — | | | | — | | | | — | | | | — | | | | — | |
| Class F-1 | | | 364,116 | | | | 6,223 | | | | 191,924 | | | | 3,152 | | | | (570,891 | ) | | | (9,677 | ) | | | (14,851 | ) | | | (302 | ) |
| Class F-2 | | | 2,259,826 | | | | 38,491 | | | | 754,040 | | | | 12,387 | | | | (2,477,893 | ) | | | (41,907 | ) | | | 535,973 | | | | 8,971 | |
| Class F-3 | | | 1,805,542 | | | | 30,611 | | | | 542,040 | | | | 8,902 | | | | (1,261,328 | ) | | | (21,244 | ) | | | 1,086,254 | | | | 18,269 | |
| Class 529-A | | | 255,240 | | | | 4,327 | | | | 195,208 | | | | 3,209 | | | | (370,282 | ) | | | (6,279 | ) | | | 80,166 | | | | 1,257 | |
| Class 529-C | | | 34,820 | | | | 593 | | | | 22,254 | | | | 365 | | | | (107,220 | ) | | | (1,823 | ) | | | (50,146 | ) | | | (865 | ) |
| Class 529-E | | | 6,718 | | | | 114 | | | | 6,342 | | | | 104 | | | | (16,137 | ) | | | (275 | ) | | | (3,077 | ) | | | (57 | ) |
| Class 529-T | | | — | | | | — | | | | 1 | | | | — | 2 | | | — | | | | — | | | | 1 | | | | — | 2 |
| Class 529-F-1 | | | 38,637 | | | | 656 | | | | 13,710 | | | | 225 | | | | (33,622 | ) | | | (571 | ) | | | 18,725 | | | | 310 | |
| Class R-1 | | | 13,897 | | | | 238 | | | | 8,563 | | | | 141 | | | | (40,618 | ) | | | (690 | ) | | | (18,158 | ) | | | (311 | ) |
| Class R-2 | | | 114,821 | | | | 1,969 | | | | 46,854 | | | | 772 | | | | (202,342 | ) | | | (3,471 | ) | | | (40,667 | ) | | | (730 | ) |
| Class R-2E | | | 25,495 | | | | 440 | | | | 5,966 | | | | 98 | | | | (18,579 | ) | | | (317 | ) | | | 12,882 | | | | 221 | |
| Class R-3 | | | 239,674 | | | | 4,103 | | | | 136,267 | | | | 2,242 | | | | (604,921 | ) | | | (10,292 | ) | | | (228,980 | ) | | | (3,947 | ) |
| Class R-4 | | | 225,579 | | | | 3,859 | | | | 141,194 | | | | 2,326 | | | | (609,728 | ) | | | (10,367 | ) | | | (242,955 | ) | | | (4,182 | ) |
| Class R-5E | | | 109,387 | | | | 1,859 | | | | 26,518 | | | | 437 | | | | (62,175 | ) | | | (1,051 | ) | | | 73,730 | | | | 1,245 | |
| Class R-5 | | | 108,641 | | | | 1,847 | | | | 100,982 | | | | 1,660 | | | | (416,578 | ) | | | (7,035 | ) | | | (206,955 | ) | | | (3,528 | ) |
| Class R-6 | | | 2,308,441 | | | | 39,703 | | | | 1,330,072 | | | | 21,838 | | | | (1,514,228 | ) | | | (25,391 | ) | | | 2,124,285 | | | | 36,150 | |
| Total net increase (decrease) | | $ | 11,106,081 | | | | 189,415 | | | $ | 7,568,829 | | | | 124,296 | | | $ | (14,878,910 | ) | | | (251,465 | ) | | $ | 3,796,000 | | | | 62,246 | |
| | |
| 1 | Includes exchanges between share classes of the fund. |
| 2 | Amount less than one thousand. |
| 3 | Class 529-F-2 and 529-F-3 shares began investment operations on October 30, 2020. |
9. Investment transactions
The fund made purchases and sales of investment securities, excluding short-term securities and U.S. government obligations, if any, of $46,610,986,000 and $52,227,685,000, respectively, during the year ended December 31, 2020.
Financial highlights
| | | | | | Income (loss) from
investment operations1 | | | Dividends and distributions | | | | | | | | | | | | | | | | | | | |
| Period ended | | Net asset
value,
beginning
of period | | | Net
investment
income | | | Net gains
(losses) on
securities
(both
realized and
unrealized) | | | Total from
investment
operations | | | Dividends
(from net
investment
income) | | | Distributions
(from capital
gains) | | | Total
dividends
and
distributions | | | Net asset
value,
end
of period | | | Total
return2,3 | | | Net assets,
end of period
(in millions) | | | Ratio of
expenses to
average net
assets before
reimburse-
ments4 | | | Ratio of
expenses to
average net
assets after
reimburse-
ments3,4 | | | Ratio of
net income
to average
net assets3 | |
| Class A: | | | | | | | | | | | | | | | | | | | | | | | | | | | | | | | | | | | | | | | | | | | | | | | | | | | | |
| 12/31/2020 | | $ | 62.02 | | | $ | .89 | | | $ | 8.05 | | | $ | 8.94 | | | $ | (1.03 | ) | | $ | (.78 | ) | | $ | (1.81 | ) | | $ | 69.15 | | | | 14.95 | % | | $ | 60,572 | | | | .61 | % | | | .61 | % | | | 1.48 | % |
| 12/31/2019 | | | 52.29 | | | | .98 | | | | 13.30 | | | | 14.28 | | | | (.94 | ) | | | (3.61 | ) | | | (4.55 | ) | | | 62.02 | | | | 27.61 | | | | 56,715 | | | | .61 | | | | .61 | | | | 1.65 | |
| 12/31/2018 | | | 62.21 | | | | 1.01 | | | | (5.19 | ) | | | (4.18 | ) | | | (.99 | ) | | | (4.75 | ) | | | (5.74 | ) | | | 52.29 | | | | (6.60 | ) | | | 47,045 | | | | .59 | | | | .59 | | | | 1.61 | |
| 12/31/2017 | | | 54.44 | | | | .93 | | | | 11.65 | | | | 12.58 | | | | (.91 | ) | | | (3.90 | ) | | | (4.81 | ) | | | 62.21 | | | | 23.37 | | | | 53,885 | | | | .60 | | | | .60 | | | | 1.55 | |
| 12/31/2016 | | | 50.71 | | | | .87 | | | | 5.43 | | | | 6.30 | | | | (.87 | ) | | | (1.70 | ) | | | (2.57 | ) | | | 54.44 | | | | 12.54 | | | | 47,308 | | | | .61 | | | | .61 | | | | 1.68 | |
| Class C: | | | | | | | | | | | | | | | | | | | | | | | | | | | | | | | | | | | | | | | | | | | | | | | | | | | | |
| 12/31/2020 | | | 61.66 | | | | .45 | | | | 8.01 | | | | 8.46 | | | | (.57 | ) | | | (.78 | ) | | | (1.35 | ) | | | 68.77 | | | | 14.08 | | | | 1,671 | | | | 1.35 | | | | 1.35 | | | | .76 | |
| 12/31/2019 | | | 52.00 | | | | .52 | | | | 13.23 | | | | 13.75 | | | | (.48 | ) | | | (3.61 | ) | | | (4.09 | ) | | | 61.66 | | | | 26.66 | | | | 2,061 | | | | 1.37 | | | | 1.37 | | | | .89 | |
| 12/31/2018 | | | 61.88 | | | | .50 | | | | (5.15 | ) | | | (4.65 | ) | | | (.48 | ) | | | (4.75 | ) | | | (5.23 | ) | | | 52.00 | | | | (7.35 | ) | | | 1,996 | | | | 1.39 | | | | 1.39 | | | | .81 | |
| 12/31/2017 | | | 54.18 | | | | .45 | | | | 11.58 | | | | 12.03 | | | | (.43 | ) | | | (3.90 | ) | | | (4.33 | ) | | | 61.88 | | | | 22.37 | | | | 2,535 | | | | 1.40 | | | | 1.40 | | | | .75 | |
| 12/31/2016 | | | 50.48 | | | | .45 | | | | 5.40 | | | | 5.85 | | | | (.45 | ) | | | (1.70 | ) | | | (2.15 | ) | | | 54.18 | | | | 11.64 | | | | 2,426 | | | | 1.41 | | | | 1.41 | | | | .87 | |
| Class T: | | | | | | | | | | | | | | | | | | | | | | | | | | | | | | | | | | | | | | | | | | | | | | | | | | | | |
| 12/31/2020 | | | 62.02 | | | | 1.04 | | | | 8.02 | | | | 9.06 | | | | (1.18 | ) | | | (.78 | ) | | | (1.96 | ) | | | 69.12 | | | | 15.22 | 5 | | | — | 6 | | | .36 | 5 | | | .36 | 5 | | | 1.74 | 5 |
| 12/31/2019 | | | 52.28 | | | | 1.12 | | | | 13.32 | | | | 14.44 | | | | (1.09 | ) | | | (3.61 | ) | | | (4.70 | ) | | | 62.02 | | | | 27.95 | 5 | | | — | 6 | | | .37 | 5 | | | .37 | 5 | | | 1.90 | 5 |
| 12/31/2018 | | | 62.20 | | | | 1.14 | | | | (5.19 | ) | | | (4.05 | ) | | | (1.12 | ) | | | (4.75 | ) | | | (5.87 | ) | | | 52.28 | | | | (6.41 | )5 | | | — | 6 | | | .38 | 5 | | | .38 | 5 | | | 1.82 | 5 |
| 12/31/20177,8 | | | 57.85 | | | | .81 | | | | 8.30 | | | | 9.11 | | | | (.86 | ) | | | (3.90 | ) | | | (4.76 | ) | | | 62.20 | | | | 15.96 | 5,9 | | | — | 6 | | | .39 | 5,10 | | | .39 | 5,10 | | | 1.80 | 5,10 |
| Class F-1: | | | | | | | | | | | | | | | | | | | | | | | | | | | | | | | | | | | | | | | | | | | | | | | | | | | | |
| 12/31/2020 | | | 61.98 | | | | .87 | | | | 8.03 | | | | 8.90 | | | | (1.00 | ) | | | (.78 | ) | | | (1.78 | ) | | | 69.10 | | | | 14.89 | | | | 2,522 | | | | .65 | | | | .65 | | | | 1.45 | |
| 12/31/2019 | | | 52.26 | | | | .94 | | | | 13.29 | | | | 14.23 | | | | (.90 | ) | | | (3.61 | ) | | | (4.51 | ) | | | 61.98 | | | | 27.53 | | | | 2,771 | | | | .66 | | | | .66 | | | | 1.60 | |
| 12/31/2018 | | | 62.17 | | | | .96 | | | | (5.18 | ) | | | (4.22 | ) | | | (.94 | ) | | | (4.75 | ) | | | (5.69 | ) | | | 52.26 | | | | (6.67 | ) | | | 2,352 | | | | .67 | | | | .67 | | | | 1.52 | |
| 12/31/2017 | | | 54.41 | | | | .88 | | | | 11.65 | | | | 12.53 | | | | (.87 | ) | | | (3.90 | ) | | | (4.77 | ) | | | 62.17 | | | | 23.27 | | | | 2,970 | | | | .67 | | | | .67 | | | | 1.47 | |
| 12/31/2016 | | | 50.69 | | | | .83 | | | | 5.42 | | | | 6.25 | | | | (.83 | ) | | | (1.70 | ) | | | (2.53 | ) | | | 54.41 | | | | 12.45 | | | | 2,688 | | | | .68 | | | | .68 | | | | 1.61 | |
| Class F-2: | | | | | | | | | | | | | | | | | | | | | | | | | | | | | | | | | | | | | | | | | | | | | | | | | | | | |
| 12/31/2020 | | | 62.00 | | | | 1.02 | | | | 8.03 | | | | 9.05 | | | | (1.16 | ) | | | (.78 | ) | | | (1.94 | ) | | | 69.11 | | | | 15.20 | | | | 11,567 | | | | .39 | | | | .39 | | | | 1.71 | |
| 12/31/2019 | | | 52.27 | | | | 1.10 | | | | 13.30 | | | | 14.40 | | | | (1.06 | ) | | | (3.61 | ) | | | (4.67 | ) | | | 62.00 | | | | 27.87 | | | | 10,821 | | | | .40 | | | | .40 | | | | 1.86 | |
| 12/31/2018 | | | 62.19 | | | | 1.13 | | | | (5.19 | ) | | | (4.06 | ) | | | (1.11 | ) | | | (4.75 | ) | | | (5.86 | ) | | | 52.27 | | | | (6.43 | ) | | | 8,654 | | | | .41 | | | | .41 | | | | 1.80 | |
| 12/31/2017 | | | 54.43 | | | | 1.00 | | | | 11.68 | | | | 12.68 | | | | (1.02 | ) | | | (3.90 | ) | | | (4.92 | ) | | | 62.19 | | | | 23.57 | | | | 7,688 | | | | .42 | | | | .42 | | | | 1.68 | |
| 12/31/2016 | | | 50.70 | | | | .99 | | | | 5.41 | | | | 6.40 | | | | (.97 | ) | | | (1.70 | ) | | | (2.67 | ) | | | 54.43 | | | | 12.77 | | | | 8,424 | | | | .41 | | | | .41 | | | | 1.88 | |
| Class F-3: | | | | | | | | | | | | | | | | | | | | | | | | | | | | | | | | | | | | | | | | | | | | | | | | | | | | |
| 12/31/2020 | | | 62.00 | | | | 1.08 | | | | 8.03 | | | | 9.11 | | | | (1.22 | ) | | | (.78 | ) | | | (2.00 | ) | | | 69.11 | | | | 15.32 | | | | 8,288 | | | | .29 | | | | .29 | | | | 1.81 | |
| 12/31/2019 | | | 52.27 | | | | 1.17 | | | | 13.29 | | | | 14.46 | | | | (1.12 | ) | | | (3.61 | ) | | | (4.73 | ) | | | 62.00 | | | | 28.01 | | | | 7,595 | | | | .30 | | | | .30 | | | | 1.97 | |
| 12/31/2018 | | | 62.19 | | | | 1.19 | | | | (5.19 | ) | | | (4.00 | ) | | | (1.17 | ) | | | (4.75 | ) | | | (5.92 | ) | | | 52.27 | | | | (6.34 | ) | | | 5,448 | | | | .31 | | | | .31 | | | | 1.89 | |
| 12/31/20177,11 | | | 56.55 | | | | 1.11 | | | | 9.52 | | | | 10.63 | | | | (1.09 | ) | | | (3.90 | ) | | | (4.99 | ) | | | 62.19 | | | | 19.08 | 9 | | | 5,541 | | | | .31 | 10 | | | .31 | 10 | | | 1.96 | 10 |
| Class 529-A: | | | | | | | | | | | | | | | | | | | | | | | | | | | | | | | | | | | | | | | | | | | | | | | | | | | | |
| 12/31/2020 | | | 61.92 | | | | .86 | | | | 8.02 | | | | 8.88 | | | | (1.00 | ) | | | (.78 | ) | | | (1.78 | ) | | | 69.02 | | | | 14.88 | | | | 3,219 | | | | .65 | | | | .65 | | | | 1.43 | |
| 12/31/2019 | | | 52.21 | | | | .94 | | | | 13.28 | | | | 14.22 | | | | (.90 | ) | | | (3.61 | ) | | | (4.51 | ) | | | 61.92 | | | | 27.53 | | | | 2,810 | | | | .67 | | | | .67 | | | | 1.60 | |
| 12/31/2018 | | | 62.12 | | | | .96 | | | | (5.18 | ) | | | (4.22 | ) | | | (.94 | ) | | | (4.75 | ) | | | (5.69 | ) | | | 52.21 | | | | (6.68 | ) | | | 2,304 | | | | .67 | | | | .67 | | | | 1.53 | |
| 12/31/2017 | | | 54.37 | | | | .88 | | | | 11.64 | | | | 12.52 | | | | (.87 | ) | | | (3.90 | ) | | | (4.77 | ) | | | 62.12 | | | | 23.28 | | | | 2,533 | | | | .67 | | | | .67 | | | | 1.47 | |
| 12/31/2016 | | | 50.65 | | | | .83 | | | | 5.42 | | | | 6.25 | | | | (.83 | ) | | | (1.70 | ) | | | (2.53 | ) | | | 54.37 | | | | 12.44 | | | | 1,995 | | | | .69 | | | | .69 | | | | 1.60 | |
See end of table for footnotes.
Financial highlights (continued)
| | | | | | Income (loss) from
investment operations1 | | | Dividends and distributions | | | | | | | | | | | | | | | | | | | |
| Period ended | | Net asset
value,
beginning
of period | | | Net
investment
income | | | Net gains
(losses) on
securities
(both
realized and
unrealized) | | | Total from
investment
operations | | | Dividends
(from net
investment
income) | | | Distributions
(from capital
gains) | | | Total
dividends
and
distributions | | | Net asset
value,
end
of period | | | Total
return2,3 | | | Net assets,
end of period
(in millions) | | | Ratio of
expenses to
average net
assets before
reimburse-
ments4 | | | Ratio of
expenses to
average net
assets after
reimburse-
ments3,4 | | | Ratio of
net income
to average
net assets3 | |
| Class 529-C: | | | | | | | | | | | | | | | | | | | | | | | | | | | | | | | | | | | | | | | | | | | | | | | | | | | | |
| 12/31/2020 | | $ | 61.90 | | | $ | .46 | | | $ | 8.03 | | | $ | 8.49 | | | $ | (.52 | ) | | $ | (.78 | ) | | $ | (1.30 | ) | | $ | 69.09 | | | | 14.05 | % | | $ | 144 | | | | 1.40 | % | | | 1.40 | % | | | .78 | % |
| 12/31/2019 | | | 52.19 | | | | .50 | | | | 13.27 | | | | 13.77 | | | | (.45 | ) | | | (3.61 | ) | | | (4.06 | ) | | | 61.90 | | | | 26.59 | | | | 350 | | | | 1.41 | | | | 1.41 | | | | .84 | |
| 12/31/2018 | | | 62.08 | | | | .48 | | | | (5.18 | ) | | | (4.70 | ) | | | (.44 | ) | | | (4.75 | ) | | | (5.19 | ) | | | 52.19 | | | | (7.39 | ) | | | 340 | | | | 1.43 | | | | 1.43 | | | | .76 | |
| 12/31/2017 | | | 54.31 | | | | .41 | | | | 11.62 | | | | 12.03 | | | | (.36 | ) | | | (3.90 | ) | | | (4.26 | ) | | | 62.08 | | | | 22.32 | | | | 430 | | | | 1.45 | | | | 1.45 | | | | .69 | |
| 12/31/2016 | | | 50.60 | | | | .42 | | | | 5.41 | | | | 5.83 | | | | (.42 | ) | | | (1.70 | ) | | | (2.12 | ) | | | 54.31 | | | | 11.57 | | | | 479 | | | | 1.47 | | | | 1.47 | | | | .82 | |
| Class 529-E: | | | | | | | | | | | | | | | | | | | | | | | | | | | | | | | | | | | | | | | | | | | | | | | | | | | | |
| 12/31/2020 | | | 61.85 | | | | .73 | | | | 8.03 | | | | 8.76 | | | | (.87 | ) | | | (.78 | ) | | | (1.65 | ) | | | 68.96 | | | | 14.65 | | | | 96 | | | | .87 | | | | .87 | | | | 1.23 | |
| 12/31/2019 | | | 52.16 | | | | .81 | | | | 13.26 | | | | 14.07 | | | | (.77 | ) | | | (3.61 | ) | | | (4.38 | ) | | | 61.85 | | | | 27.24 | | | | 94 | | | | .89 | | | | .89 | | | | 1.37 | |
| 12/31/2018 | | | 62.06 | | | | .81 | | | | (5.17 | ) | | | (4.36 | ) | | | (.79 | ) | | | (4.75 | ) | | | (5.54 | ) | | | 52.16 | | | | (6.88 | ) | | | 82 | | | | .90 | | | | .90 | | | | 1.29 | |
| 12/31/2017 | | | 54.33 | | | | .74 | | | | 11.62 | | | | 12.36 | | | | (.73 | ) | | | (3.90 | ) | | | (4.63 | ) | | | 62.06 | | | | 22.97 | | | | 93 | | | | .91 | | | | .91 | | | | 1.24 | |
| 12/31/2016 | | | 50.61 | | | | .71 | | | | 5.41 | | | | 6.12 | | | | (.70 | ) | | | (1.70 | ) | | | (2.40 | ) | | | 54.33 | | | | 12.20 | | | | 80 | | | | .93 | | | | .93 | | | | 1.36 | |
| Class 529-T: | | | | | | | | | | | | | | | | | | | | | | | | | | | | | | | | | | | | | | | | | | | | | | | | | | | | |
| 12/31/2020 | | | 62.02 | | | | 1.00 | | | | 8.04 | | | | 9.04 | | | | (1.15 | ) | | | (.78 | ) | | | (1.93 | ) | | | 69.13 | | | | 15.17 | 5 | | | — | 6 | | | .41 | 5 | | | .41 | 5 | | | 1.68 | 5 |
| 12/31/2019 | | | 52.28 | | | | 1.09 | | | | 13.31 | | | | 14.40 | | | | (1.05 | ) | | | (3.61 | ) | | | (4.66 | ) | | | 62.02 | | | | 27.86 | 5 | | | — | 6 | | | .42 | 5 | | | .42 | 5 | | | 1.85 | 5 |
| 12/31/2018 | | | 62.20 | | | | 1.10 | | | | (5.18 | ) | | | (4.08 | ) | | | (1.09 | ) | | | (4.75 | ) | | | (5.84 | ) | | | 52.28 | | | | (6.46 | )5 | | | — | 6 | | | .44 | 5 | | | .44 | 5 | | | 1.76 | 5 |
| 12/31/20177,8 | | | 57.85 | | | | .78 | | | | 8.30 | | | | 9.08 | | | | (.83 | ) | | | (3.90 | ) | | | (4.73 | ) | | | 62.20 | | | | 15.90 | 5,9 | | | — | 6 | | | .45 | 5,10 | | | .45 | 5,10 | | | 1.75 | 5,10 |
| Class 529-F-1: | | | | | | | | | | | | | | | | | | | | | | | | | | | | | | | | | | | | | | | | | | | | | | | | | |
| 12/31/2020 | | | 61.85 | | | | .97 | | | | 8.05 | | | | 9.02 | | | | (1.14 | ) | | | (.78 | ) | | | (1.92 | ) | | | 68.95 | | | | 15.19 | 5 | | | — | 6 | | | .42 | 5 | | | .42 | 5 | | | 1.66 | 5 |
| 12/31/2019 | | | 52.15 | | | | 1.08 | | | | 13.27 | | | | 14.35 | | | | (1.04 | ) | | | (3.61 | ) | | | (4.65 | ) | | | 61.85 | | | | 27.84 | | | | 196 | | | | .43 | | | | .43 | | | | 1.83 | |
| 12/31/2018 | | | 62.07 | | | | 1.10 | | | | (5.19 | ) | | | (4.09 | ) | | | (1.08 | ) | | | (4.75 | ) | | | (5.83 | ) | | | 52.15 | | | | (6.48 | ) | | | 149 | | | | .44 | | | | .44 | | | | 1.76 | |
| 12/31/2017 | | | 54.34 | | | | 1.01 | | | | 11.62 | | | | 12.63 | | | | (1.00 | ) | | | (3.90 | ) | | | (4.90 | ) | | | 62.07 | | | | 23.53 | | | | 137 | | | | .45 | | | | .45 | | | | 1.69 | |
| 12/31/2016 | | | 50.62 | | | | .94 | | | | 5.42 | | | | 6.36 | | | | (.94 | ) | | | (1.70 | ) | | | (2.64 | ) | | | 54.34 | | | | 12.71 | | | | 98 | | | | .48 | | | | .48 | | | | 1.82 | |
| Class 529-F-2: | | | | | | | | | | | | | | | | | | | | | | | | | | | | | | | | | | | | | | | | | | | | | | | | | |
| 12/31/20207,12 | | | 59.63 | | | | .19 | | | | 9.87 | | | | 10.06 | | | | (.55 | ) | | | — | | | | (.55 | ) | | | 69.14 | | | | 16.87 | 9 | | | 231 | | | | .07 | 9 | | | .07 | 9 | | | .29 | 9 |
| Class 529-F-3: | | | | | | | | | | | | | | | | | | | | | | | | | | | | | | | | | | | | | | | | | | | | | | | | | |
| 12/31/20207,12 | | | 59.63 | | | | .20 | | | | 9.86 | | | | 10.06 | | | | (.56 | ) | | | — | | | | (.56 | ) | | | 69.13 | | | | 16.88 | 9 | | | — | 6 | | | .09 | 9 | | | .06 | 9 | | | .30 | 9 |
| Class R-1: | | | | | | | | | | | | | | | | | | | | | | | | | | | | | | | | | | | | | | | | | | | | | | | | | | | | |
| 12/31/2020 | | | 61.65 | | | | .42 | | | | 8.02 | | | | 8.44 | | | | (.54 | ) | | | (.78 | ) | | | (1.32 | ) | | | 68.77 | | | | 14.05 | | | | 113 | | | | 1.39 | | | | 1.39 | | | | .71 | |
| 12/31/2019 | | | 52.00 | | | | .50 | | | | 13.23 | | | | 13.73 | | | | (.47 | ) | | | (3.61 | ) | | | (4.08 | ) | | | 61.65 | | | | 26.60 | | | | 132 | | | | 1.40 | | | | 1.40 | | | | .86 | |
| 12/31/2018 | | | 61.88 | | | | .49 | | | | (5.16 | ) | | | (4.67 | ) | | | (.46 | ) | | | (4.75 | ) | | | (5.21 | ) | | | 52.00 | | | | (7.38 | ) | | | 128 | | | | 1.41 | | | | 1.41 | | | | .78 | |
| 12/31/2017 | | | 54.18 | | | | .44 | | | | 11.59 | | | | 12.03 | | | | (.43 | ) | | | (3.90 | ) | | | (4.33 | ) | | | 61.88 | | | | 22.37 | | | | 160 | | | | 1.41 | | | | 1.41 | | | | .74 | |
| 12/31/2016 | | | 50.49 | | | | .45 | | | | 5.39 | | | | 5.84 | | | | (.45 | ) | | | (1.70 | ) | | | (2.15 | ) | | | 54.18 | | | | 11.65 | | | | 145 | | | | 1.41 | | | | 1.41 | | | | .88 | |
See end of table for footnotes.
Financial highlights (continued)
| | | | | | Income (loss) from
investment operations1 | | | Dividends and distributions | | | | | | | | | | | | | | | | | | | |
| Period ended | | Net asset
value,
beginning
of period | | | Net
investment
income | | | Net gains
(losses) on
securities
(both
realized and
unrealized) | | | Total from
investment
operations | | | Dividends
(from net
investment
income) | | | Distributions
(from capital
gains) | | | Total
dividends
and
distributions | | | Net asset
value,
end
of period | | | Total
return2,3 | | | Net assets,
end of period
(in millions) | | | Ratio of
expenses to
average net
assets before
reimburse-
ments4 | | | Ratio of
expenses to
average net
assets after
reimburse-
ments3,4 | | | Ratio of
net income
to average
net assets3 | |
| Class R-2: | | | | | | | | | | | | | | | | | | | | | | | | | | | | | | | | | | | | | | | | | | | | | | | | | | | | |
| 12/31/2020 | | $ | 61.61 | | | $ | .43 | | | $ | 8.01 | | | $ | 8.44 | | | $ | (.57 | ) | | $ | (.78 | ) | | $ | (1.35 | ) | | $ | 68.70 | | | | 14.06 | % | | $ | 729 | | | | 1.38 | % | | | 1.38 | % | | | .72 | % |
| 12/31/2019 | | | 51.97 | | | | .51 | | | | 13.22 | | | | 13.73 | | | | (.48 | ) | | | (3.61 | ) | | | (4.09 | ) | | | 61.61 | | | | 26.62 | | | | 734 | | | | 1.40 | | | | 1.40 | | | | .87 | |
| 12/31/2018 | | | 61.86 | | | | .49 | | | | (5.15 | ) | | | (4.66 | ) | | | (.48 | ) | | | (4.75 | ) | | | (5.23 | ) | | | 51.97 | | | | (7.37 | ) | | | 658 | | | | 1.41 | | | | 1.41 | | | | .79 | |
| 12/31/2017 | | | 54.16 | | | | .44 | | | | 11.59 | | | | 12.03 | | | | (.43 | ) | | | (3.90 | ) | | | (4.33 | ) | | | 61.86 | | | | 22.39 | | | | 797 | | | | 1.40 | | | | 1.40 | | | | .74 | |
| 12/31/2016 | | | 50.47 | | | | .46 | | | | 5.39 | | | | 5.85 | | | | (.46 | ) | | | (1.70 | ) | | | (2.16 | ) | | | 54.16 | | | | 11.65 | | | | 744 | | | | 1.39 | | | | 1.39 | | | | .89 | |
| Class R-2E: | | | | | | | | | | | | | | | | | | | | | | | | | | | | | | | | | | | | | | | | | | | | | | | | | | | | |
| 12/31/2020 | | | 61.67 | | | | .60 | | | | 8.01 | | | | 8.61 | | | | (.75 | ) | | | (.78 | ) | | | (1.53 | ) | | | 68.75 | | | | 14.39 | | | | 99 | | | | 1.08 | | | | 1.08 | | | | 1.01 | |
| 12/31/2019 | | | 52.02 | | | | .69 | | | | 13.23 | | | | 13.92 | | | | (.66 | ) | | | (3.61 | ) | | | (4.27 | ) | | | 61.67 | | | | 26.99 | | | | 91 | | | | 1.09 | | | | 1.09 | | | | 1.17 | |
| 12/31/2018 | | | 61.92 | | | | .69 | | | | (5.16 | ) | | | (4.47 | ) | | | (.68 | ) | | | (4.75 | ) | | | (5.43 | ) | | | 52.02 | | | | (7.08 | ) | | | 65 | | | | 1.11 | | | | 1.11 | | | | 1.10 | |
| 12/31/2017 | | | 54.24 | | | | .64 | | | | 11.58 | | | | 12.22 | | | | (.64 | ) | | | (3.90 | ) | | | (4.54 | ) | | | 61.92 | | | | 22.74 | | | | 56 | | | | 1.10 | | | | 1.10 | | | | 1.06 | |
| 12/31/2016 | | | 50.56 | | | | .66 | | | | 5.38 | | | | 6.04 | | | | (.66 | ) | | | (1.70 | ) | | | (2.36 | ) | | | 54.24 | | | | 12.04 | | | | 20 | | | | 1.10 | | | | 1.10 | | | | 1.26 | |
| Class R-3: | | | | | | | | | | | | | | | | | | | | | | | | | | | | | | | | | | | | | | | | | | | | | | | | | | | | |
| 12/31/2020 | | | 61.84 | | | | .70 | | | | 8.03 | | | | 8.73 | | | | (.83 | ) | | | (.78 | ) | | | (1.61 | ) | | | 68.96 | | | | 14.58 | | | | 1,851 | | | | .93 | | | | .93 | | | | 1.17 | |
| 12/31/2019 | | | 52.15 | | | | .77 | | | | 13.27 | | | | 14.04 | | | | (.74 | ) | | | (3.61 | ) | | | (4.35 | ) | | | 61.84 | | | | 27.17 | | | | 1,986 | | | | .94 | | | | .94 | | | | 1.31 | |
| 12/31/2018 | | | 62.05 | | | | .78 | | | | (5.18 | ) | | | (4.40 | ) | | | (.75 | ) | | | (4.75 | ) | | | (5.50 | ) | | | 52.15 | | | | (6.95 | ) | | | 1,880 | | | | .96 | | | | .96 | | | | 1.24 | |
| 12/31/2017 | | | 54.31 | | | | .71 | | | | 11.63 | | | | 12.34 | | | | (.70 | ) | | | (3.90 | ) | | | (4.60 | ) | | | 62.05 | | | | 22.93 | | | | 2,360 | | | | .95 | | | | .95 | | | | 1.19 | |
| 12/31/2016 | | | 50.60 | | | | .69 | | | | 5.41 | | | | 6.10 | | | | (.69 | ) | | | (1.70 | ) | | | (2.39 | ) | | | 54.31 | | | | 12.15 | | | | 2,181 | | | | .96 | | | | .96 | | | | 1.33 | |
| Class R-4: | | | | | | | | | | | | | | | | | | | | | | | | | | | | | | | | | | | | | | | | | | | | | | | | | | | | |
| 12/31/2020 | | | 61.87 | | | | .88 | | | | 8.01 | | | | 8.89 | | | | (1.01 | ) | | | (.78 | ) | | | (1.79 | ) | | | 68.97 | | | | 14.92 | | | | 1,847 | | | | .63 | | | | .63 | | | | 1.47 | |
| 12/31/2019 | | | 52.17 | | | | .95 | | | | 13.28 | | | | 14.23 | | | | (.92 | ) | | | (3.61 | ) | | | (4.53 | ) | | | 61.87 | | | | 27.57 | | | | 1,970 | | | | .64 | | | | .64 | | | | 1.62 | |
| 12/31/2018 | | | 62.07 | | | | .96 | | | | (5.17 | ) | | | (4.21 | ) | | | (.94 | ) | | | (4.75 | ) | | | (5.69 | ) | | | 52.17 | | | | (6.65 | ) | | | 1,879 | | | | .65 | | | | .65 | | | | 1.54 | |
| 12/31/2017 | | | 54.33 | | | | .89 | | | | 11.63 | | | | 12.52 | | | | (.88 | ) | | | (3.90 | ) | | | (4.78 | ) | | | 62.07 | | | | 23.30 | | | | 2,523 | | | | .65 | | | | .65 | | | | 1.49 | |
| 12/31/2016 | | | 50.62 | | | | .85 | | | | 5.40 | | | | 6.25 | | | | (.84 | ) | | | (1.70 | ) | | | (2.54 | ) | | | 54.33 | | | | 12.47 | | | | 2,318 | | | | .66 | | | | .66 | | | | 1.63 | |
| Class R-5E: | | | | | | | | | | | | | | | | | | | | | | | | | | | | | | | | | | | | | | | | | | | | | | | | | | | | |
| 12/31/2020 | | | 61.90 | | | | .99 | | | | 8.02 | | | | 9.01 | | | | (1.14 | ) | | | (.78 | ) | | | (1.92 | ) | | | 68.99 | | | | 15.14 | | | | 418 | | | | .43 | | | | .43 | | | | 1.67 | |
| 12/31/2019 | | | 52.19 | | | | 1.09 | | | | 13.28 | | | | 14.37 | | | | (1.05 | ) | | | (3.61 | ) | | | (4.66 | ) | | | 61.90 | | | | 27.85 | | | | 379 | | | | .43 | | | | .43 | | | | 1.84 | |
| 12/31/2018 | | | 62.12 | | | | 1.14 | | | | (5.22 | ) | | | (4.08 | ) | | | (1.10 | ) | | | (4.75 | ) | | | (5.85 | ) | | | 52.19 | | | | (6.45 | ) | | | 255 | | | | .45 | | | | .45 | | | | 1.86 | |
| 12/31/2017 | | | 54.38 | | | | 1.02 | | | | 11.64 | | | | 12.66 | | | | (1.02 | ) | | | (3.90 | ) | | | (4.92 | ) | | | 62.12 | | | | 23.54 | | | | 16 | | | | .44 | | | | .44 | | | | 1.70 | |
| 12/31/2016 | | | 50.69 | | | | 1.03 | | | | 5.30 | | | | 6.33 | | | | (.94 | ) | | | (1.70 | ) | | | (2.64 | ) | | | 54.38 | | | | 12.62 | | | | 10 | | | | .57 | | | | .57 | | | | 1.99 | |
| Class R-5: | | | | | | | | | | | | | | | | | | | | | | | | | | | | | | | | | | | | | | | | | | | | | | | | | | | | |
| 12/31/2020 | | | 62.08 | | | | 1.06 | | | | 8.03 | | | | 9.09 | | | | (1.20 | ) | | | (.78 | ) | | | (1.98 | ) | | | 69.19 | | | | 15.25 | | | | 1,253 | | | | .33 | | | | .33 | | | | 1.77 | |
| 12/31/2019 | | | 52.33 | | | | 1.13 | | | | 13.33 | | | | 14.46 | | | | (1.10 | ) | | | (3.61 | ) | | | (4.71 | ) | | | 62.08 | | | | 27.95 | | | | 1,354 | | | | .34 | | | | .34 | | | | 1.91 | |
| 12/31/2018 | | | 62.25 | | | | 1.16 | | | | (5.19 | ) | | | (4.03 | ) | | | (1.14 | ) | | | (4.75 | ) | | | (5.89 | ) | | | 52.33 | | | | (6.37 | ) | | | 1,326 | | | | .35 | | | | .35 | | | | 1.84 | |
| 12/31/2017 | | | 54.47 | | | | 1.07 | | | | 11.67 | | | | 12.74 | | | | (1.06 | ) | | | (3.90 | ) | | | (4.96 | ) | | | 62.25 | | | | 23.68 | | | | 2,041 | | | | .35 | | | | .35 | | | | 1.79 | |
| 12/31/2016 | | | 50.74 | | | | 1.00 | | | | 5.43 | | | | 6.43 | | | | (1.00 | ) | | | (1.70 | ) | | | (2.70 | ) | | | 54.47 | | | | 12.81 | | | | 1,800 | | | | .35 | | | | .35 | | | | 1.93 | |
| Class R-6: | | | | | | | | | | | | | | | | | | | | | | | | | | | | | | | | | | | | | | | | | | | | | | | | | | | | |
| 12/31/2020 | | | 62.04 | | | | 1.08 | | | | 8.03 | | | | 9.11 | | | | (1.23 | ) | | | (.78 | ) | | | (2.01 | ) | | | 69.14 | | | | 15.30 | | | | 21,200 | | | | .28 | | | | .28 | | | | 1.80 | |
| 12/31/2019 | | | 52.30 | | | | 1.17 | | | | 13.31 | | | | 14.48 | | | | (1.13 | ) | | | (3.61 | ) | | | (4.74 | ) | | | 62.04 | | | | 28.01 | | | | 18,458 | | | | .29 | | | | .29 | | | | 1.98 | |
| 12/31/2018 | | | 62.22 | | | | 1.19 | | | | (5.19 | ) | | | (4.00 | ) | | | (1.17 | ) | | | (4.75 | ) | | | (5.92 | ) | | | 52.30 | | | | (6.33 | ) | | | 13,670 | | | | .30 | | | | .30 | | | | 1.90 | |
| 12/31/2017 | | | 54.45 | | | | 1.10 | | | | 11.66 | | | | 12.76 | | | | (1.09 | ) | | | (3.90 | ) | | | (4.99 | ) | | | 62.22 | | | | 23.72 | | | | 12,701 | | | | .30 | | | | .30 | | | | 1.84 | |
| 12/31/2016 | | | 50.72 | | | | 1.04 | | | | 5.42 | | | | 6.46 | | | | (1.03 | ) | | | (1.70 | ) | | | (2.73 | ) | | | 54.45 | | | | 12.88 | | | | 8,948 | | | | .31 | | | | .31 | | | | 1.99 | |
| | | | |
| | | Year ended December 31, |
| | | 2020 | | 2019 | | 2018 | | 2017 | | 2016 |
| Portfolio turnover rate for all share classes13 | | 48% | | 40% | | 34% | | 29% | | 24% |
| | | | | | | | | | | | | | | | | | | | | |
Financial highlights (continued)
| 1 | Based on average shares outstanding. |
| 2 | Total returns exclude any applicable sales charges, including contingent deferred sales charges. |
| 3 | This column reflects the impact, if any, of certain reimbursements from CRMC. During one of the periods shown, CRMC reimbursed a portion of transfer agent services fees for certain share classes. |
| 4 | Ratios do not include expenses of any Central Funds. The fund indirectly bears its proportionate share of the expenses of any Central Funds. |
| 5 | All or a significant portion of assets in this class consisted of seed capital invested by CRMC and/or its affiliates. Fees for distribution services are not charged or accrued on these seed capital assets. If such fees were paid by the fund on seed capital assets, fund expenses would have been higher and net income and total return would have been lower. |
| 6 | Amount less than $1 million. |
| 7 | Based on operations for a period that is less than a full year. |
| 8 | Class T and 529-T shares began investment operations on April 7, 2017. |
| 9 | Not annualized. |
| 10 | Annualized. |
| 11 | Class F-3 shares began investment operations on January 27, 2017. |
| 12 | Class 529-F-2 and 529-F-3 shares began investment operations on October 30, 2020. |
| 13 | Rates do not include the fund’s portfolio activity with respect to any Central Funds. |
See notes to financial statements.
Report of Independent Registered Public Accounting Firm
To the Shareholders and Board of Trustees of American Funds Fundamental Investors:
Opinion on the Financial Statements and Financial Highlights
We have audited the accompanying statement of assets and liabilities, including the investment portfolio, of Fundamental Investors, the portfolio constituting the American Funds Fundamental Investors (the “Fund”), as of December 31, 2020, the related statement of operations for the year then ended, the statements of changes in net assets for each of the two years in the period then ended, the financial highlights for each of the five years in the period then ended, and the related notes. In our opinion, the financial statements and financial highlights present fairly, in all material respects, the financial position of the Fund as of December 31, 2020, and the results of its operations for the year then ended, the changes in its net assets for each of the two years in the period then ended, and the financial highlights for each of the five years in the period then ended, in conformity with accounting principles generally accepted in the United States of America.
Basis for Opinion
The financial statements and financial highlights are the responsibility of the Fund’s management. Our responsibility is to express an opinion on the Fund’s financial statements and financial highlights based on our audits. We are a public accounting firm registered with the Public Company Accounting Oversight Board (United States) (PCAOB) and are required to be independent with respect to the Fund in accordance with the U.S. federal securities laws and the applicable rules and regulations of the Securities and Exchange Commission and the PCAOB.
We conducted our audits in accordance with the standards of the PCAOB. Those standards require that we plan and perform the audit to obtain reasonable assurance about whether the financial statements and financial highlights are free of material misstatement, whether due to error or fraud. The Fund is not required to have, nor were we engaged to perform, an audit of its internal control over financial reporting. As part of our audits we are required to obtain an understanding of internal control over financial reporting but not for the purpose of expressing an opinion on the effectiveness of the Fund’s internal control over financial reporting. Accordingly, we express no such opinion.
Our audits included performing procedures to assess the risks of material misstatement of the financial statements and financial highlights, whether due to error or fraud, and performing procedures that respond to those risks. Such procedures included examining, on a test basis, evidence regarding the amounts and disclosures in the financial statements and financial highlights. Our audits also included evaluating the accounting principles used and significant estimates made by management, as well as evaluating the overall presentation of the financial statements and financial highlights. Our procedures included confirmation of securities owned as of December 31, 2020, by correspondence with the custodian and brokers; when replies were not received from brokers, we performed other auditing procedures. We believe that our audits provide a reasonable basis for our opinion.
Deloitte & Touche LLP
Costa Mesa, California
February 11, 2021
We have served as the auditor of one or more American Funds investment companies since 1956.
As a fund shareholder, you incur two types of costs: (1) transaction costs, such as initial sales charges on purchase payments and contingent deferred sales charges on redemptions (loads), and (2) ongoing costs, including management fees, distribution and service (12b-1) fees, and other expenses. This example is intended to help you understand your ongoing costs (in dollars) of investing in the fund so you can compare these costs with the ongoing costs of investing in other mutual funds. The example is based on an investment of $1,000 invested at the beginning of the period and held for the entire six-month period (July 1, 2020, through December 31, 2020).
Actual expenses:
The first line of each share class in the table on the following page provides information about actual account values and actual expenses. You may use the information in this line, together with the amount you invested, to estimate the expenses that you paid over the period. Simply divide your account value by $1,000 (for example, an $8,600 account value divided by $1,000 = 8.6), then multiply the result by the number in the first line under the heading titled “Expenses paid during period” to estimate the expenses you paid on your account during this period.
Hypothetical example for comparison purposes:
The second line of each share class in the table on the following page provides information about hypothetical account values and hypothetical expenses based on the actual expense ratio for the share class and an assumed rate of return of 5.00% per year before expenses, which is not the actual return of the share class. The hypothetical account values and expenses may not be used to estimate the actual ending account balance or expenses you paid for the period. You may use this information to compare the ongoing costs of investing in the fund and other funds. To do so, compare this 5.00% hypothetical example with the 5.00% hypothetical examples that appear in the shareholder reports of the other funds.
Notes:
Retirement plan participants may be subject to certain fees charged by the plan sponsor, and Class F-1, F-2, F-3, 529-F-1, 529-F-2 and 529-F-3 shareholders may be subject to fees charged by financial intermediaries, typically ranging from 0.75% to 1.50% of assets annually depending on services offered. You can estimate the impact of these fees by adding the amount of the fees to the total estimated expenses you paid on your account during the period as calculated above. In addition, your ending account value would be lower by the amount of these fees.
Note that the expenses shown in the table on the following page are meant to highlight your ongoing costs only and do not reflect any transactional costs, such as sales charges (loads). Therefore, the second line of each share class in the table is useful in comparing ongoing costs only and will not help you determine the relative total costs of owning different funds. In addition, if these transactional costs were included, your costs would have been higher.
Expense example (continued)
| | | Beginning
account value
7/1/2020 | | | Ending
account value
12/31/2020 | | | Expenses paid
during period* | | | Annualized
expense ratio | |
| Class A – actual return | | $ | 1,000.00 | | | $ | 1,218.98 | | | $ | 3.41 | | | | .61 | % |
| Class A – assumed 5% return | | | 1,000.00 | | | | 1,022.13 | | | | 3.11 | | | | .61 | |
| Class C – actual return | | | 1,000.00 | | | | 1,214.27 | | | | 7.53 | | | | 1.35 | |
| Class C – assumed 5% return | | | 1,000.00 | | | | 1,018.40 | | | | 6.87 | | | | 1.35 | |
| Class T – actual return | | | 1,000.00 | | | | 1,220.38 | | | | 1.96 | | | | .35 | |
| Class T – assumed 5% return | | | 1,000.00 | | | | 1,023.44 | | | | 1.79 | | | | .35 | |
| Class F-1 – actual return | | | 1,000.00 | | | | 1,218.72 | | | | 3.64 | | | | .65 | |
| Class F-1 – assumed 5% return | | | 1,000.00 | | | | 1,021.93 | | | | 3.31 | | | | .65 | |
| Class F-2 – actual return | | | 1,000.00 | | | | 1,220.28 | | | | 2.13 | | | | .38 | |
| Class F-2 – assumed 5% return | | | 1,000.00 | | | | 1,023.29 | | | | 1.94 | | | | .38 | |
| Class F-3 – actual return | | | 1,000.00 | | | | 1,221.04 | | | | 1.62 | | | | .29 | |
| Class F-3 – assumed 5% return | | | 1,000.00 | | | | 1,023.74 | | | | 1.48 | | | | .29 | |
| Class 529-A – actual return | | | 1,000.00 | | | | 1,218.62 | | | | 3.63 | | | | .65 | |
| Class 529-A – assumed 5% return | | | 1,000.00 | | | | 1,021.93 | | | | 3.31 | | | | .65 | |
| Class 529-C – actual return | | | 1,000.00 | | | | 1,214.19 | | | | 7.70 | | | | 1.38 | |
| Class 529-C – assumed 5% return | | | 1,000.00 | | | | 1,018.25 | | | | 7.02 | | | | 1.38 | |
| Class 529-E – actual return | | | 1,000.00 | | | | 1,217.35 | | | | 4.81 | | | | .86 | |
| Class 529-E – assumed 5% return | | | 1,000.00 | | | | 1,020.87 | | | | 4.38 | | | | .86 | |
| Class 529-T – actual return | | | 1,000.00 | | | | 1,220.21 | | | | 2.29 | | | | .41 | |
| Class 529-T – assumed 5% return | | | 1,000.00 | | | | 1,023.14 | | | | 2.09 | | | | .41 | |
| Class 529-F-1 – actual return | | | 1,000.00 | | | | 1,220.48 | | | | 2.29 | | | | .41 | |
| Class 529-F-1 – assumed 5% return | | | 1,000.00 | | | | 1,023.14 | | | | 2.09 | | | | .41 | |
| Class 529-F-2 – actual return† | | | 1,000.00 | | | | 1,220.32 | | | | .74 | | | | .40 | |
| Class 529-F-2 – assumed 5% return† | | | 1,000.00 | | | | 1,023.19 | | | | 2.04 | | | | .40 | |
| Class 529-F-3 – actual return† | | | 1,000.00 | | | | 1,220.56 | | | | .65 | | | | .35 | |
| Class 529-F-3 – assumed 5% return† | | | 1,000.00 | | | | 1,023.44 | | | | 1.79 | | | | .35 | |
| Class R-1 – actual return | | | 1,000.00 | | | | 1,214.13 | | | | 7.70 | | | | 1.38 | |
| Class R-1 – assumed 5% return | | | 1,000.00 | | | | 1,018.25 | | | | 7.02 | | | | 1.38 | |
| Class R-2 – actual return | | | 1,000.00 | | | | 1,214.34 | | | | 7.59 | | | | 1.36 | |
| Class R-2 – assumed 5% return | | | 1,000.00 | | | | 1,018.35 | | | | 6.92 | | | | 1.36 | |
| Class R-2E – actual return | | | 1,000.00 | | | | 1,216.05 | | | | 5.98 | | | | 1.07 | |
| Class R-2E – assumed 5% return | | | 1,000.00 | | | | 1,019.81 | | | | 5.45 | | | | 1.07 | |
| Class R-3 – actual return | | | 1,000.00 | | | | 1,216.94 | | | | 5.14 | | | | .92 | |
| Class R-3 – assumed 5% return | | | 1,000.00 | | | | 1,020.57 | | | | 4.69 | | | | .92 | |
| Class R-4 – actual return | | | 1,000.00 | | | | 1,218.77 | | | | 3.47 | | | | .62 | |
| Class R-4 – assumed 5% return | | | 1,000.00 | | | | 1,022.08 | | | | 3.16 | | | | .62 | |
| Class R-5E – actual return | | | 1,000.00 | | | | 1,220.16 | | | | 2.35 | | | | .42 | |
| Class R-5E – assumed 5% return | | | 1,000.00 | | | | 1,023.09 | | | | 2.14 | | | | .42 | |
| Class R-5 – actual return | | | 1,000.00 | | | | 1,220.51 | | | | 1.85 | | | | .33 | |
| Class R-5 – assumed 5% return | | | 1,000.00 | | | | 1,023.54 | | | | 1.68 | | | | .33 | |
| Class R-6 – actual return | | | 1,000.00 | | | | 1,220.74 | | | | 1.57 | | | | .28 | |
| Class R-6 – assumed 5% return | | | 1,000.00 | | | | 1,023.79 | | | | 1.43 | | | | .28 | |
| * | The “expenses paid during period” are equal to the “annualized expense ratio,” multiplied by the average account value over the period, multiplied by the number of days in the period, and divided by 365 (to reflect the one-half year period). |
| † | The period for the “annualized expense ratio” and “actual return” line is based on the number of days since the share class began investment operations on October 30, 2020. The “assumed 5% return” line is based on 184 days. |
We are required to advise you of the federal tax status of certain distributions received by shareholders during the fiscal year. The fund hereby designates the following amounts for the fund’s fiscal year ended December 31, 2020:
| Long-term capital gains | $1,478,428,000 |
| Qualified dividend income | 100% |
| Section 163(j) interest dividends | $8,587,000 |
| Corporate dividends received deduction | $1,488,451,000 |
| U.S. government income that may be exempt from state taxation | $8,349,000 |
Individual shareholders should refer to their Form 1099 or other tax information, which was mailed in January 2021, to determine the calendar year amounts to be included on their 2020 tax returns. Shareholders should consult their tax advisors.
Approval of Investment Advisory and Service Agreement
The fund’s board has approved the continuation of the fund’s Investment Advisory and Service Agreement (the “agreement”) with Capital Research and Management Company (“CRMC”) for an additional one-year term through November 30, 2021. The board approved the agreement following the recommendation of the fund’s Contracts Committee (the “committee”), which is composed of all the fund’s independent board members. The board and the committee determined in the exercise of their business judgment that the fund’s advisory fee structure was fair and reasonable in relation to the services provided, and that approving the agreement was in the best interests of the fund and its shareholders.
In reaching this decision, the board and the committee took into account their interaction with CRMC as well as information furnished to them throughout the year and otherwise provided to them, as well as information prepared specifically in connection with their review of the agreement, and were advised by their independent counsel with respect to the matters considered. They considered the following factors, among others, but did not identify any single issue or particular piece of information that, in isolation, was the controlling factor, and each board and committee member did not necessarily attribute the same weight to each factor.
1. Nature, extent and quality of services
The board and the committee considered the depth and quality of CRMC’s investment management process, including its global research capabilities; the experience, capability and integrity of its senior management and other personnel; the low turnover rates of its key personnel; the overall financial strength and stability of CRMC and the Capital Group organization; the resources and systems CRMC devotes to investment management (the manner in which the fund’s assets are managed, including liquidity management), financial investment operations, compliance, trading, proxy voting, shareholder communications, and other services; and the ongoing evolution of CRMC’s organizational structure designed to maintain and strengthen these qualities. The board and the committee also considered the nature, extent and quality of administrative and shareholder services provided by CRMC to the fund under the agreement and other agreements, as well as the benefits to fund shareholders from investing in a fund that is part of a large family of funds. The board considered the risks assumed by CRMC in providing services to the fund, including operational, business, financial, reputational, regulatory and litigation risks. The board and the committee concluded that the nature, extent and quality of the services provided by CRMC have benefited and should continue to benefit the fund and its shareholders.
2. Investment results
The board and the committee considered the investment results of the fund in light of its objective. They compared the fund’s investment results with those of other funds (including funds that currently form the basis of the Lipper index for the category in which the fund is included), and data such as relevant market and fund indexes over various periods (including the fund’s lifetime) through March 31, 2020. They generally placed greater emphasis on longer term periods. On the basis of this evaluation and the board’s and the committee’s ongoing review of investment results, and considering the relative market conditions during certain of the reporting periods, the board and the committee concluded that the fund’s investment results have been satisfactory for renewal of the agreement, and that CRMC’s record in managing the fund indicated that its continued management should benefit the fund and its shareholders.
3. Advisory fees and total expenses
The board and the committee compared the advisory fees and total expense levels of the fund to those of other relevant funds. They observed that the fund’s advisory fees and expenses are competitive with those of other similar funds included in the comparable Lipper category. The board and the committee also considered the breakpoint discounts in the fund’s advisory fee structure that reduce the level of fees charged by CRMC to the fund as fund assets increase. In addition, they reviewed information regarding the effective advisory fees charged to non-mutual fund clients by CRMC and its affiliates. They noted that, to the extent there were differences between the advisory fees paid by the fund and the advisory fees paid by those clients, the differences appropriately reflected the investment, operational, regulatory and market differences between advising the fund and the other clients. The board and the committee concluded that the fund’s cost structure was fair and reasonable in relation to the services provided, as well as the risks assumed by the adviser, and that the fund’s shareholders receive reasonable value in return for the advisory fees and other amounts paid to CRMC by the fund.
4. Ancillary benefits
The board and the committee considered a variety of other benefits that CRMC and its affiliates receive as a result of CRMC’s relationship with the fund and other American Funds, including fees for administrative services provided to certain share classes; fees paid to CRMC’s affiliated transfer agent; sales charges and distribution fees received and retained by the fund’s principal underwriter, an affiliate of CRMC; and possible ancillary benefits to CRMC and its institutional management affiliates in managing other investment vehicles. The board and the committee reviewed CRMC’s portfolio trading practices, noting that through December 31, 2018, CRMC benefited from research obtained with commissions from portfolio transactions made on behalf of the fund, and since that time has undertaken to bear the cost of obtaining such research. The board and the committee took these ancillary benefits into account in evaluating the reasonableness of the advisory fees and other amounts paid to CRMC by the fund.
5. Adviser financial information
The board and the committee reviewed information regarding CRMC’s costs of providing services to the American Funds, including personnel, systems and resources of investment, compliance, trading, accounting and other administrative operations. They considered CRMC’s costs and related cost allocation methodology as well as its track record of investing in technology, infrastructure and staff to maintain and expand services and capabilities, respond to industry and regulatory developments, and attract and retain qualified personnel. They noted information regarding the compensation structure for CRMC’s investment professionals. They reviewed information on the profitability of the investment adviser and its affiliates. The board and the committee also compared CRMC’s profitability and compensation data to the reported results and data of several large, publicly held investment management companies. The board and the committee noted the competitiveness and cyclicality of both the mutual fund industry and the capital markets, and the importance in that environment of CRMC’s long-term profitability for maintaining its independence, company culture and management continuity. They further considered the breakpoint discounts in the fund’s advisory fee structure and CRMC’s sharing of potential economies of scale, or efficiencies, through breakpoints and other fee reductions and costs voluntarily absorbed. The board and the committee concluded that the fund’s advisory fee structure reflected a reasonable sharing of benefits between CRMC and the fund’s shareholders.
Liquidity Risk Management Program
The fund has adopted a liquidity risk management program (the “program”). The fund’s board has designated Capital Research and Management Company (“CRMC”) as the administrator of the program. Personnel of CRMC or its affiliates conduct the day-to-day operation of the program pursuant to policies and procedures administered by the Capital Group Liquidity Risk Management Committee.
Under the program, CRMC manages the fund’s liquidity risk, which is the risk that the fund could not meet shareholder redemption requests without significant dilution of remaining shareholders’ interests in the fund. This risk is managed by monitoring the degree of liquidity of the fund’s investments, limiting the amount of the fund’s illiquid investments, and utilizing various risk management tools and facilities available to the fund for meeting shareholder redemptions, among other means. CRMC’s process of determining the degree of liquidity of the fund’s investments is supported by one or more third-party liquidity assessment vendors.
The fund’s board reviewed a report prepared by CRMC regarding the operation and effectiveness of the program for the period October 1, 2019, through September 30, 2020. No significant liquidity events impacting the fund were noted in the report. In addition, CRMC provided its assessment that the program had been effective in managing the fund’s liquidity risk.
Board of trustees and other officers
Independent trustees1
| Name and year of birth | | Year first
elected
a trustee
of the fund2 | | Principal occupation(s) during past five years | | Number of
portfolios in fund
complex overseen
by trustee3 | | Other directorships4
held by trustee |
| Joseph C. Berenato, 1946 | | 2003 | | Former Chairman and CEO, Ducommun Incorporated (aerospace components manufacturer) | | 15 | | None |
| Joseph J. Bonner, 1955 | | 2019 | | President and CEO, Solana Beach Capital LLC (real estate advisory); Global Head of Real Estate, Board Member, The Interlink Group (private merchant bank) | | 3 | | Extra Space Storage |
Mary Anne Dolan, 1947
Chairman of the Board
(Independent and Non-Executive) | | 2010 | | Founder and President, MAD Ink (communications company); former Editor-in-Chief, The Los Angeles Herald Examiner (retired 1989) | | 10 | | None |
| John G. Freund, MD, 1953 | | 2010 | | Founder and Managing Director, Skyline Ventures (a venture capital investor in health care companies) | | 6 | | Collegium Pharmaceutical, Inc.;
SI - Bone, Inc.;
Sutro Biopharma, Inc. |
| Yvonne L. Greenstreet, 1962 | | 2019 | | Chief Operating Officer, Alnylam Pharmaceuticals; Founder and former Managing Director, Highgate LLC (consulting) | | 3 | | Pacira, Inc. (pharmaceuticals) |
| Linda Griego, 1947 | | 2015 | | Former President and CEO, Griego Enterprises, Inc. (business management company) | | 7 | | ViacomCBS Inc. |
| Leonade D. Jones, 1947 | | 1998 | | Retired; former Treasurer, The Washington Post Company (retired 1996) | | 10 | | None |
| Sharon I. Meers, 1965 | | 2017 | | Former Senior Director, Head of Strategic Partnerships, eBay Enterprise | | 3 | | None |
| Kenneth M. Simril, 1965 | | 2016 | | President and CEO, SCI Ingredients Holdings, Inc. (food manufacturing) | | 7 | | At Home Group, Inc. |
| Christopher E. Stone, 1956 | | 2010 | | Professor of Practice of Public Integrity, University of Oxford, Blavatnik School of Government; former President, Open Society Foundations | | 9 | | None |
Interested trustees5,6
Name, year of birth
and position with fund | | Year first
elected
a trustee
or officer
of the fund2 | | Principal occupation(s) during past five years
and positions held with affiliated entities or
the principal underwriter of the fund | | Number of
portfolios in fund
complex overseen
by trustee3 | | Other directorships4
held by trustee |
Brady L. Enright, 1967
Co-President | | 2015 | | Partner — Capital World Investors, Capital Research and Management Company; Partner — Capital World Investors, Capital Bank and Trust Company7; Director, The Capital Group Companies, Inc. | | 3 | | None |
| Anne-Marie Peterson, 1972 | | 2019 | | Partner — Capital World Investors, Capital Research and Management Company; Director, The Capital Group Companies, Inc.7 | | 3 | | None |
The fund’s statement of additional information includes further details about fund trustees and is available without charge upon request by calling American Funds Service Company at (800) 421-4225 or by visiting the Capital Group website at capitalgroup.com. The address for all trustees and officers of the fund is 333 South Hope Street, Los Angeles, CA 90071, Attention: Secretary.
See page 38 for footnotes.
Other officers6
Name, year of birth
and position with fund | | Year first
elected
an officer
of the fund2 | | Principal occupation(s) during past five years and positions held with affiliated entities
or the principal underwriter of the fund |
Mark L. Casey, 1970
Co-President | | 2008 | | Partner — Capital International Investors, Capital Research and Management Company |
Paul F. Roye, 1953
Executive Vice President | | 2012 | | Senior Vice President and Senior Counsel — Fund Business Management Group, Capital Research and Management Company; Director, Capital Research and Management Company |
Julian N. Abdey, 1972
Senior Vice President | | 2019 | | Partner — Capital International Investors, Capital Research and Management Company |
Paul Benjamin, 1979
Senior Vice President | | 2020 | | Partner — Capital World Investors, Capital Research and Management Company; Director, Capital Strategy Research, Inc.7 |
Mathews Cherian, 1967
Senior Vice President | | 2018 | | Partner — Capital World Investors, Capital Research and Management Company |
Irfan M. Furniturewala, 1971
Senior Vice President | | 2020 | | Partner — Capital International Investors, Capital Research and Management Company |
Dina N. Perry, 1945
Senior Vice President | | 1994 | | Partner — Capital World Investors, Capital Research and Management Company |
Walt Burkley, 1966
Vice President | | 2010 | | Senior Vice President and Senior Counsel — Fund Business Management Group, Capital Research and Management Company; Director, Capital Research Company7; Director, Capital Research and Management Company |
Michael W. Stockton, 1967
Secretary | | 2014 | | Senior Vice President — Fund Business Management Group, Capital Research and Management Company |
Hong T. Le, 1978
Treasurer | | 2018 | | Vice President — Investment Operations, Capital Research and Management Company |
Julie E. Lawton, 1973
Assistant Secretary | | 2010 | | Assistant Vice President — Fund Business Management Group, Capital Research and Management Company; Secretary, Capital Research Company7 |
Sandra Chuon, 1972
Assistant Treasurer | | 2019 | | Assistant Vice President — Investment Operations, Capital Research and Management Company |
Brian C. Janssen, 1972
Assistant Treasurer | | 2016-2018, 2020 | | Vice President — Investment Operations, Capital Research and Management Company |
| 1 | The term independent trustee refers to a trustee who is not an “interested person” of the fund within the meaning of the Investment Company Act of 1940. |
| 2 | Trustees and officers of the fund serve until their resignation, removal or retirement. |
| 3 | Funds managed by Capital Research and Management Company or its affiliates. |
| 4 | This includes all directorships/trusteeships (other than those in the American Funds or other funds managed by Capital Research and Management Company or its affiliates) that are held by each trustee as a trustee or director of a public company or a registered investment company. |
| 5 | The term interested trustee refers to a trustee who is an “interested person” within the meaning of the Investment Company Act of 1940, on the basis of their affiliation with the fund’s investment adviser, Capital Research and Management Company, or affiliated entities (including the fund’s principal underwriter). |
| 6 | All of the trustees and/or officers listed are officers and/or directors/trustees of one or more of the other funds for which Capital Research and Management Company serves as investment adviser. |
| 7 | Company affiliated with Capital Research and Management Company. |
This page was intentionally left blank.
Office of the fund
6455 Irvine Center Drive
Irvine, CA 92618-4518
Investment adviser
Capital Research and Management Company
333 South Hope Street
Los Angeles, CA 90071-1406
Transfer agent for shareholder accounts
American Funds Service Company
(Write to the address near you.)
P.O. Box 6007
Indianapolis, IN 46206-6007
P.O. Box 2280
Norfolk, VA 23501-2280
Custodian of assets
State Street Bank and Trust Company
One Lincoln Street
Boston, MA 02111
Counsel
Dechert LLP
One Bush Street, Suite 1600
San Francisco, CA 94104-4446
Independent registered public accounting firm
Deloitte & Touche LLP
695 Town Center Drive
Suite 1000
Costa Mesa, CA 92626-7188
Principal underwriter
American Funds Distributors, Inc.
333 South Hope Street
Los Angeles, CA 90071-1406
Investors should carefully consider investment objectives, risks, charges and expenses. This and other important information is contained in the fund prospectus and summary prospectus, which can be obtained from your financial professional and should be read carefully before investing. You may also call American Funds Service Company (AFS) at (800) 421-4225 or visit the Capital Group website at capitalgroup.com.
“American Funds Proxy Voting Procedures and Principles” — which describes how we vote proxies relating to portfolio securities — is available on our website or upon request by calling AFS. The fund files its proxy voting record with the U.S. Securities and Exchange Commission (SEC) for the 12 months ended June 30 by August 31. The proxy voting record is available free of charge on the SEC website at sec.gov and on our website.
Fundamental Investors files a complete list of its portfolio holdings with the SEC for the first and third quarters of each fiscal year on Form NPORT-P. The list of portfolio holdings is available free of charge on the SEC website and on our website.
This report is for the information of shareholders of Fundamental Investors, but it also may be used as sales literature when preceded or accompanied by the current prospectus or summary prospectus, which gives details about charges, expenses, investment objectives and operating policies of the fund. If used as sales material after March 31, 2021, this report must be accompanied by an American Funds statistical update for the most recently completed calendar quarter.
The Standard & Poor’s 500 Composite Index (“Index”) is a product of S&P Dow Jones Indices LLC and/or its affiliates and has been licensed for use by Capital Group. Copyright © 2021 S&P Dow Jones Indices LLC, a division of S&P Global, and/or its affiliates. All rights reserved. Redistribution or reproduction in whole or in part is prohibited without written permission of S&P Dow Jones Indices LLC.
American Funds Distributors, Inc., member FINRA.
The Capital Advantage®
Since 1931, Capital Group, home of American Funds, has helped investors pursue long-term investment success. Our consistent approach — in combination with The Capital SystemSM — has resulted in superior outcomes.
| | Aligned with investor success |
| | We base our decisions on a long-term perspective, which we believe aligns our goals with the interests of our clients. Our portfolio managers average 28 years of investment industry experience, including 22 years at our company, reflecting a career commitment to our long-term approach.1 |
| | |
| | The Capital System |
| | The Capital System combines individual accountability with teamwork. Funds using The Capital System are divided into portions that are managed independently by investment professionals with diverse backgrounds, ages and investment approaches. An extensive global research effort is the backbone of our system. |
| | |
| | American Funds’ superior outcomes |
| | Equity funds have beaten their Lipper peer indexes in 92% of 10-year periods and 99% of 20-year periods.2 Fixed income funds have helped investors achieve diversification through attention to correlation between bonds and equities.3 Fund management fees have been among the lowest in the industry.4 |
| | 1 | Investment industry experience as of December 31, 2019. |
| | 2 | Based on Class F-2 share results for rolling periods through December 31, 2019. Periods covered are the shorter of the fund’s lifetime or since the comparable Lipper index inception date (except Capital Income Builder and SMALLCAP World Fund, for which the Lipper average was used). Expenses differ for each share class, so results will vary. |
| | 3 | Based on Class F-2 share results as of December 31, 2019. Fifteen of the 17 fixed income American Funds that have been in existence for the three-year period showed a three-year correlation below 0.2. Standard & Poor’s 500 Composite Index was used as an equity market proxy. Correlation based on monthly total returns. Correlation is a statistical measure of how two securities move in relation to each other. A correlation ranges from –1 to 1. A positive correlation close to 1 implies that as one security moves, either up or down, the other security will move in “lockstep,” in the same direction. A negative correlation close to –1 indicates that the securities have moved in the opposite direction. |
| | 4 | On average, our management fees were in the lowest quintile 65% of the time, based on the 20-year period ended December 31, 2019, versus comparable Lipper categories, excluding funds of funds. |
Class F-2 shares were first offered on August 1, 2008. Class F-2 share results prior to the date of first sale are hypothetical based on the results of the original share class of the fund without a sales charge, adjusted for typical estimated expenses. Results for certain funds with an inception date after August 1, 2008, also include hypothetical returns because those funds’ Class F-2 shares sold after the funds’ date of first offering. Please see capitalgroup.com for more information on specific expense adjustments and the actual dates of first sale.
All Capital Group trademarks mentioned are owned by The Capital Group Companies, Inc., an affiliated company or fund. All other company and product names mentioned are the property of their respective companies.

ITEM 2 – Code of Ethics
The Registrant has adopted a Code of Ethics that applies to its Principal Executive Officer and Principal Financial Officer. The Registrant undertakes to provide to any person without charge, upon request, a copy of the Code of Ethics. Such request can be made by calling 800/421-4225 or to the Secretary of the Registrant, 6455 Irvine Center Drive, Irvine, California 92618.
ITEM 3 – Audit Committee Financial Expert
The Registrant’s board has determined that Linda Griego, a member of the Registrant’s audit committee, is an “audit committee financial expert” and "independent," as such terms are defined in this Item. This designation will not increase the designee’s duties, obligations or liability as compared to his or her duties, obligations and liability as a member of the audit committee and of the board, nor will it reduce the responsibility of the other audit committee members. There may be other individuals who, through education or experience, would qualify as "audit committee financial experts" if the board had designated them as such. Most importantly, the board believes each member of the audit committee contributes significantly to the effective oversight of the Registrant’s financial statements and condition.
ITEM 4 – Principal Accountant Fees and Services
| a) Audit Fees: | | |
| Audit | 2019 | 97,000 |
| | 2020 | 206,000 |
| | | |
| b) Audit-Related Fees: | | |
| | 2019 | 21,000 |
| | 2020 | 19,000 |
| | | |
| c) Tax Fees: | | |
| | 2019 | 14,000 |
| | 2020 | 18,000 |
| | The tax fees consist of professional services relating to the preparation of the Registrant’s tax returns. | |
| | | |
| d) All Other Fees: | | |
| | 2019 | None |
| | 2020 | None |
| | | |
| | Adviser and affiliates (includes only fees for non-audit services billed to the adviser and affiliates for engagements that relate directly to the operations and financial reporting of the Registrant and were subject to the pre-approval policies described below): | |
| a) Audit Fees: | | |
| | Not Applicable | |
| | | |
| b) Audit-Related Fees: | | |
| | 2019 | 1,812,000 |
| | 2020 | 1,477,000 |
| | The audit-related fees consist of assurance and related services relating to the examination of the Registrant’s transfer agent, principal underwriter and investment adviser conducted in accordance with Statement on Standards for Attestation Engagements Number 18 issued by the American Institute of Certified Public Accountants. | |
| | | |
| c) Tax Fees: | | |
| | 2019 | 46,000 |
| | 2020 | 40,000 |
| | The tax fees consist of consulting services relating to the Registrant’s investments. | |
| | | |
| | | |
| d) All Other Fees: | | |
| | 2019 | 2,000 |
| | 2020 | None |
| | The other fees consist of subscription services related to an accounting research tool. | |
| | | |
| | | |
| | All audit and permissible non-audit services that the Registrant’s audit committee considers compatible with maintaining the independent registered public accounting firm’s independence are required to be pre-approved by the committee. The pre-approval requirement will extend to all non-audit services provided to the Registrant, the investment adviser, and any entity controlling, controlled by, or under common control with the investment adviser that provides ongoing services to the Registrant, if the engagement relates directly to the operations and financial reporting of the Registrant. The committee will not delegate its responsibility to pre-approve these services to the investment adviser. The committee may delegate to one or more committee members the authority to review and pre-approve audit and permissible non-audit services. Actions taken under any such delegation will be reported to the full committee at its next meeting. The pre-approval requirement is waived with respect to non-audit services if certain conditions are met. The pre-approval requirement was not waived for any of the non-audit services listed above provided to the Registrant, adviser and affiliates. | |
| | | |
| | Aggregate non-audit fees paid to the Registrant’s auditors, including fees for all services billed to the Registrant, adviser and affiliates that provide ongoing services to the Registrant, were $1,896,000 for fiscal year 2019 and $1,554,000 for fiscal year 2020. The non-audit services represented by these amounts were brought to the attention of the committee and considered to be compatible with maintaining the auditors’ independence. | |
ITEM 5 – Audit Committee of Listed Registrants
Not applicable to this Registrant, insofar as the Registrant is not a listed issuer as defined in Rule 10A-3 under the Securities Exchange Act of 1934.
ITEM 6 – Schedule of Investments
Not applicable, insofar as the schedule is included as part of the report to shareholders filed under Item 1 of this Form.
ITEM 7 – Disclosure of Proxy Voting Policies and Procedures for Closed-End Management Investment Companies
Not applicable to this Registrant, insofar as the Registrant is not a closed-end management investment company.
ITEM 8 – Portfolio Managers of Closed-End Management Investment Companies
Not applicable to this Registrant, insofar as the Registrant is not a closed-end management investment company.
ITEM 9 – Purchases of Equity Securities by Closed-End Management Investment Company and Affiliated Purchasers
Not applicable to this Registrant, insofar as the Registrant is not a closed-end management investment company.
ITEM 10 – Submission of Matters to a Vote of Security Holders
There have been no material changes to the procedures by which shareholders may recommend nominees to the Registrant’s board of trustees since the Registrant last submitted a proxy statement to its shareholders. The procedures are as follows. The Registrant has a nominating and governance committee comprised solely of persons who are not considered ‘‘interested persons’’ of the Registrant within the meaning of the Investment Company Act of 1940, as amended. The committee periodically reviews such issues as the board’s composition, responsibilities, committees, compensation and other relevant issues, and recommends any appropriate changes to the full board of trustees. While the committee normally is able to identify from its own resources an ample number of qualified candidates, it will consider shareholder suggestions of persons to be considered as nominees to fill future vacancies on the board. Such suggestions must be sent in writing to the nominating and governance committee of the Registrant, c/o the Registrant’s Secretary, and must be accompanied by complete biographical and occupational data on the prospective nominee, along with a written consent of the prospective nominee for consideration of his or her name by the nominating and governance committee.
ITEM 11 – Controls and Procedures
| (a) | The Registrant’s Principal Executive Officer and Principal Financial Officer have concluded, based on their evaluation of the Registrant’s disclosure controls and procedures (as such term is defined in Rule 30a-3 under the Investment Company Act of 1940), that such controls and procedures are adequate and reasonably designed to achieve the purposes described in paragraph (c) of such rule. |
| | |
| (b) | There were no changes in the Registrant’s internal controls over financial reporting (as defined in Rule 30a-3(d) under the Investment Company Act of 1940) that occurred during the Registrant’s semi-annual period covered by this report that has materially affected, or is reasonably likely to materially affect, the Registrant’s internal control over financial reporting. |
ITEM 12 – Exhibits
| (a)(1) | The Code of Ethics that is the subject of the disclosure required by Item 2 is attached as an exhibit hereto. |
| | |
| (a)(2) | The certifications required by Rule 30a-2 of the Investment Company Act of 1940 and Sections 302 and 906 of the Sarbanes-Oxley Act of 2002 are attached as exhibits hereto. |
SIGNATURES
Pursuant to the requirements of the Securities Exchange Act of 1934 and the Investment Company Act of 1940, the Registrant has duly caused this report to be signed on its behalf by the undersigned, thereunto duly authorized.
| | AMERICAN FUNDS FUNDAMENTAL INVESTORS |
| | |
| | By __/s/ Walter R. Burkley________________ |
| | Walter R. Burkley, Principal Executive Officer |
| | |
| | Date: February 26, 2021 |
Pursuant to the requirements of the Securities Exchange Act of 1934 and the Investment Company Act of 1940, this report has been signed below by the following persons on behalf of the Registrant and in the capacities and on the dates indicated.
| By _ /s/ Walter R. Burkley_____________ |
Walter R. Burkley, Principal Executive Officer |
| |
| Date: February 26, 2021 |
| By ___/s/ Hong T. Le__________________ |
Hong T. Le, Treasurer and Principal Financial Officer |
| |
| Date: February 26, 2021 |