Exhibit 99.2
AV HOMESTM
Investor Presentation
June 2013
Disclaimer
Forward-Looking Statements
Certain statements in this Investor Presentation constitute “forward-looking statements” within the meaning of the U.S. federal securities laws, which statements may include information regarding the plans, intentions, expectations, future financial performance, or future operating performance of AV Homes, Inc. Forward-looking statements are based on the expectations, estimates, or projections of management as of the date of this Investor Presentation. Although our management believes these expectations, estimates, or projections to be reasonable as of the date made, forward-looking statements are inherently subject to significant business risks, economic and competitive uncertainties, or other contingencies which could cause our actual results or performance to differ materially from what may be expressed or implied in the forward-looking statements. Important factors that could cause our actual results or performance to differ materially from our forward-looking statements include the following: (1) the transaction described in this Investor Presentation may not be completed, or completed within the expected timeframe; (2) the costs or difficulties relating to the transaction may be greater than expected and may adversely affect our results of operations and financial condition; (3) the expected benefits of the transaction, including acceleration of the implementation of our strategic plan, may take longer than anticipated to achieve and may not be achieved in the entirety or at all; and (4) the factors set forth in the “Risk Factors” section of our Annual Report on Form 10-K for the year ended December 31, 2012, our Quarterly Report on Form 10-
Q for the quarter ended March 31, 2013 and in our other filings with the Securities and Exchange Commission (the “SEC”), which filings are available on www.sec.gov. Readers are cautioned not to place undue reliance on any forward-looking statements contained herein, which reflect management’s opinions only as of this Investor Presentation. AV Homes disclaims any intention or obligation to update or revise any forward-looking statements to reflect subsequent events and circumstances, except to the extent required by applicable law.
Additional Information
AV Homes will file a proxy statement in connection with a special meeting to approve the convertibility of the preferred stock issued in the transaction. The proxy statement and any other relevant documents filed with the SEC concerning AV Homes are (or will be, when filed) available free of charge at http://www.sec.gov and under the “Financial Information” section of the Investor Relations page at http://www.avhomesinc.com. Stockholders should read carefully the proxy statement and the accompanying proxy card when they become available before making any voting decision.
AV Homes, its directors, and certain of its officers and other employees are participants in the solicitation of proxies from AV
Homes’ stockholders in connection with the special meeting. Important information concerning the identity and any interests of these persons will be available on a Schedule 14A that AV Homes will file with the SEC shortly.
AV HOMESTM
2
AV HOMESTM
Executive Summary
Section One
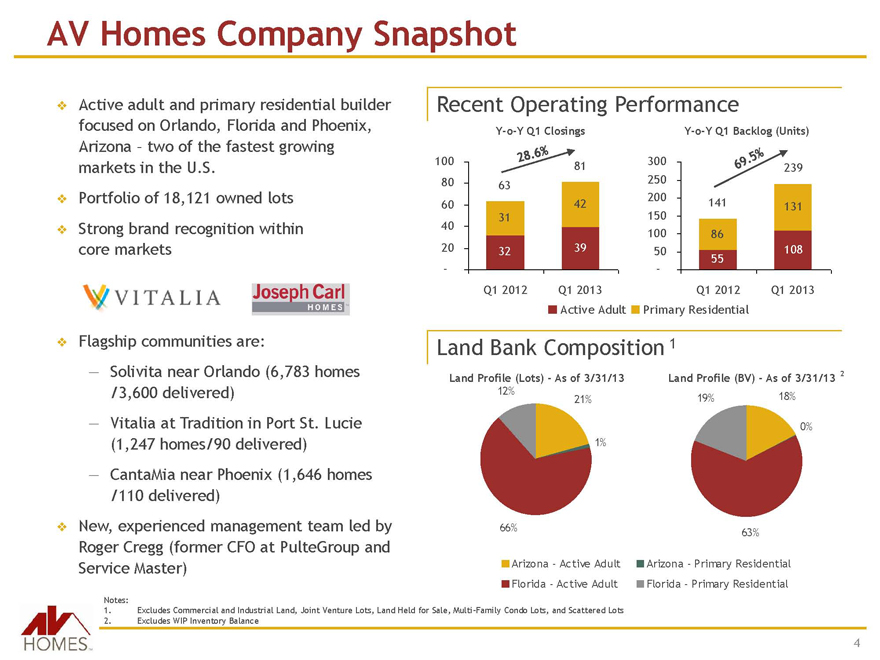
AV Homes Company Snapshot
Active adult and primary residential builder focused on Orlando, Florida and Phoenix, Arizona – two of the fastest growing markets in the U.S.
Portfolio of 18,121 owned lots
Strong brand recognition within core markets
VITALIA Joseph Carl HOMESTM
Flagship communities are:
Solivita near Orlando (6,783 homes /3,600 delivered)
Vitalia at Tradition in Port St. Lucie (1,247 homes/90 delivered)
CantaMia near Phoenix (1,646 homes /110 delivered)
New, experienced management team led by Roger Cregg (former CFO at PulteGroup and Service Master)
Recent Operating Performance
Y-o-Y Q1 Closings
100 80 60 40 20
63
31
32
28.6% 42 81 39 -
Q1 2012
Q1 2013
Y-o-Y Q1 Backlog (Units)
300 250 200 150 100 50 -
69.5%
141
86
55
239 131 108
Q1 2012
Q1 2013
Active Adult
Primary Residential
Land Bank Composition 1
Land Profile (Lots) - As of 3/31/13
12%
21%
1%
66%
Land Profile (BV) - As of 3/31/13 2
19%
18%
0%
63%
Arizona - Active Adult Arizona - Primary Residential
Florida - Active Adult Florida - Primary Residential
Notes:
1. Excludes Commercial and Industrial Land, Joint Venture Lots, Land Held for Sale, Multi-Family Condo Lots, and Scattered Lots
2. Excludes WIP Inventory Balance
AV HOMESTM
4
History of AV Homes
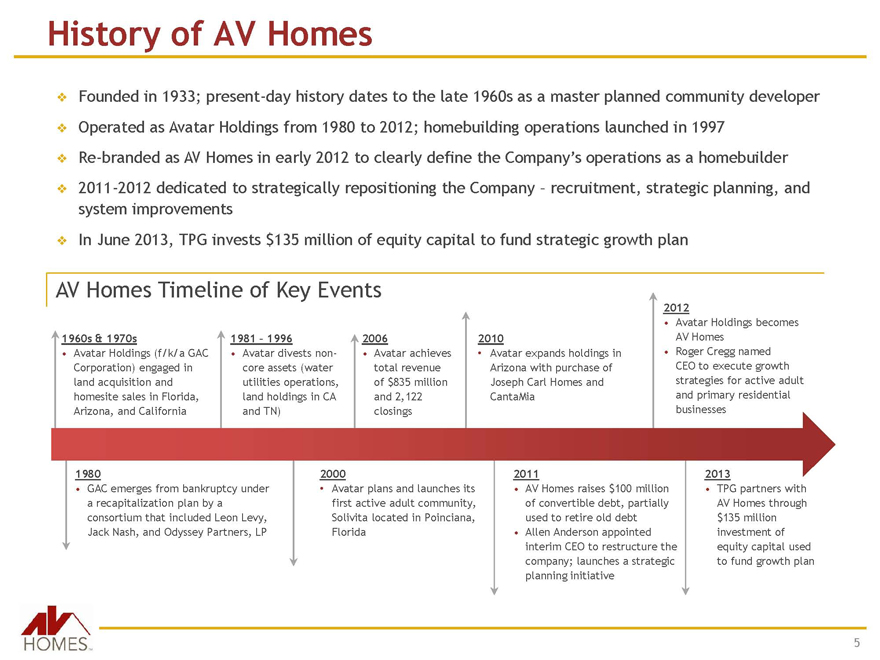
Founded in 1933; present-day history dates to the late 1960s as a master planned community developer
Operated as Avatar Holdings from 1980 to 2012; homebuilding operations launched in 1997
Re-branded as AV Homes in early 2012 to clearly define the Company’s operations as a homebuilder
2011-2012 dedicated to strategically repositioning the Company - recruitment, strategic planning, and system improvements
In June 2013, TPG invests $135 million of equity capital to fund strategic growth plan
AV Homes Timeline of Key Events
1960s & 1970s
• Avatar Holdings (f/k/a GAC Corporation) engaged in land acquisition and homesite sales in Florida, Arizona, and California
1981 - 1996
• Avatar divests non-core assets (water utilities operations, land holdings in CA and TN)
2006
• Avatar achieves total revenue of $835 million and 2,122 closings
2010
• Avatar expands holdings in Arizona with purchase of Joseph Carl Homes and CantaMia
2012
• Avatar Holdings becomes AV Homes
• Roger Cregg named CEO to execute growth strategies for active adult and primary residential businesses
1980
• GAC emerges from bankruptcy under a recapitalization plan by a consortium that included Leon Levy, Jack Nash, and Odyssey Partners, LP
2000
• Avatar plans and launches its first active adult community, Solivita located in Poinciana, Florida
2011
• AV Homes raises $100 million of convertible debt, partially used to retire old debt
• Allen Anderson appointed interim CEO to restructure the company; launches a strategic planning initiative
2013
• TPG partners with AV Homes through $135 million investment of equity capital used to fund growth plan
AV HOMESTM
5
Transaction Overview
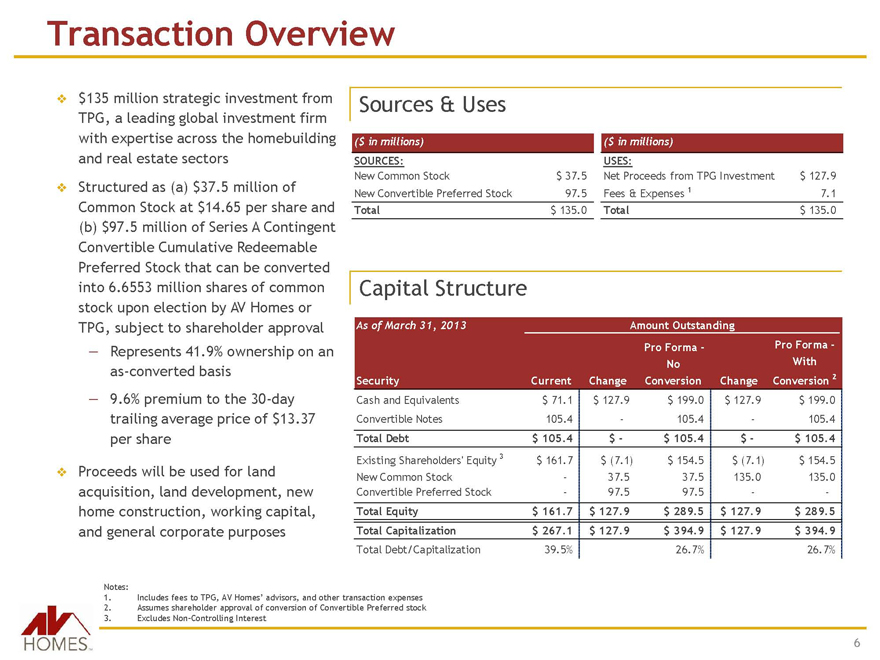
$135 million strategic investment from TPG, a leading global investment firm with expertise across the homebuilding and real estate sectors Structured as (a) $37.5 million of Common Stock at $14.65 per share and (b) $97.5 million of Series A Contingent Convertible Cumulative Redeemable Preferred Stock that can be converted into 6.6553 million shares of common stock upon election by AV Homes or TPG, subject to shareholder approval
- Represents 41.9% ownership on an as-converted basis
- 9.6% premium to the 30-day trailing average price of $13.37 per share
Proceeds will be used for land acquisition, land development, new home construction, working capital, and general corporate purposes
Sources & Uses
($ in millions)
SOURCES:
New Common Stock
$ 37.5
New Convertible Preferred Stock
97.5
Total
$ 135.0
($ in millions)
USES:
Net Proceeds from TPG Investment $ 127.9
Fees & Expenses 1 7.1
Total $ 135.0
Capital Structure
As of March 31, 2013 Amount Outstanding
Pro Forma - Pro Forma -
No With
Security Current Change Conversion Change Conversion 2
Cash and Equivalents $ 71.1 $ 127.9 $ 199.0 $ 127.9 $ 199.0
Convertible Notes 105.4 - 105.4 - 105.4
Total Debt $ 105.4 $ - $ 105.4 $ - $ 105.4
Existing Shareholders’ Equity 3 $ 161.7 $ (7.1) $ 154.5 $ (7.1) $ 154.5
New Common Stock - 37.5 37.5 135.0 135.0
Convertible Preferred Stock - 97.5 97.5 - -
Total Equity $ 161.7 $ 127.9 $ 289.5 $ 127.9 $ 289.5
Total Capitalization $ 267.1 $ 127.9 $ 394.9 $ 127.9 $ 394.9
Total Debt/Capitalization 39.5% 26.7% 26.7%
Notes:
1. Includes fees to TPG, AV Homes’ advisors, and other transaction expenses
2. Assumes shareholder approval of conversion of Convertible Preferred stock
3. Excludes Non-Controlling Interest
AV HOMESTM
6
Transaction Highlights
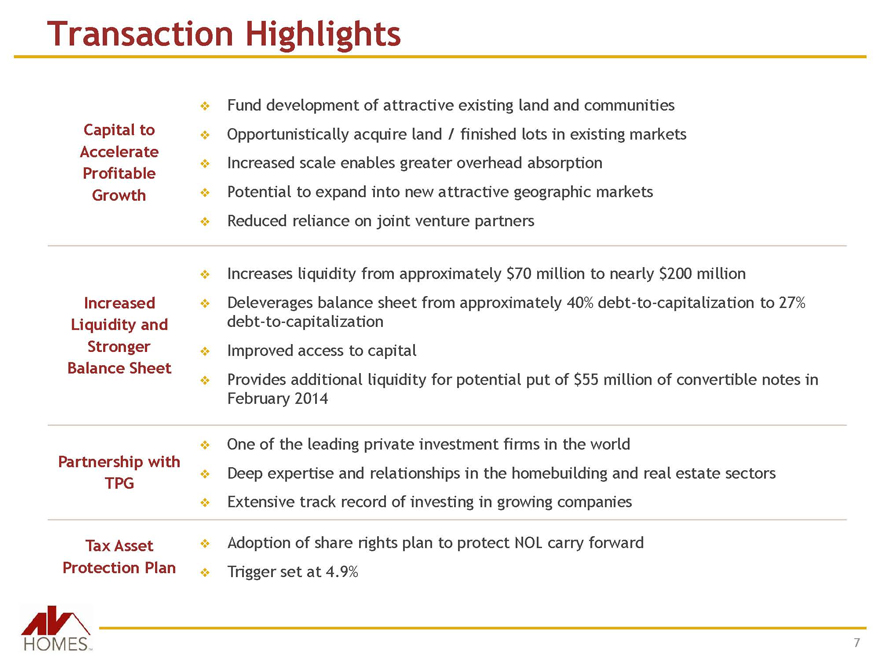
Capital to Accelerate Profitable Growth
Fund development of attractive existing land and communities
Opportunistically acquire land / finished lots in existing markets
Increased scale enables greater overhead absorption
Potential to expand into new attractive geographic markets
Reduced reliance on joint venture partners
Increased Liquidity and Stronger Balance Sheet
Increases liquidity from approximately $70 million to nearly $200 million
Deleverages balance sheet from approximately 40% debt-to-capitalization to 27% debt-to-capitalization
Improved access to capital
Provides additional liquidity for potential put of $55 million of convertible notes in February 2014
Partnership with TPG
One of the leading private investment firms in the world
Deep expertise and relationships in the homebuilding and real estate sectors
Extensive track record of investing in growing companies
Tax Asset Protection Plan
Adoption of share rights plan to protect NOL carry forward
Trigger set at 4.9%
HOMESTM
7
Overview of TPG
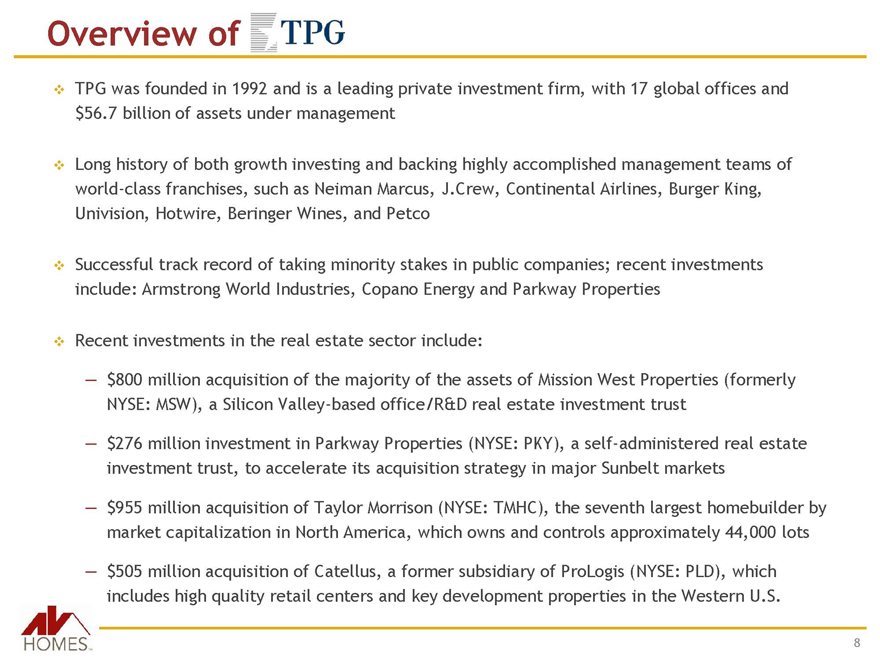
TPG was founded in 1992 and is a leading private investment firm, with 17 global offices and $56.7 billion of assets under management
Long history of both growth investing and backing highly accomplished management teams of world-class franchises, such as Neiman Marcus, J.Crew, Continental Airlines, Burger King, Univision, Hotwire, Beringer Wines, and Petco
Successful track record of taking minority stakes in public companies; recent investments include: Armstrong World Industries, Copano Energy and Parkway Properties
Recent investments in the real estate sector include:
- $800 million acquisition of the majority of the assets of Mission West Properties (formerly NYSE: MSW), a Silicon Valley-based office/R&D real estate investment trust
- $276 million investment in Parkway Properties (NYSE: PKY), a self-administered real estate investment trust, to accelerate its acquisition strategy in major Sunbelt markets
- $955 million acquisition of Taylor Morrison (NYSE: TMHC), the seventh largest homebuilder by market capitalization in North America, which owns and controls approximately 44,000 lots
- $505 million acquisition of Catellus, a former subsidiary of ProLogis (NYSE: PLD), which includes high quality retail centers and key development properties in the Western U.S.
HOMESTM
8

HOMESTM
Investment Highlights
Section Two
Investment Highlights
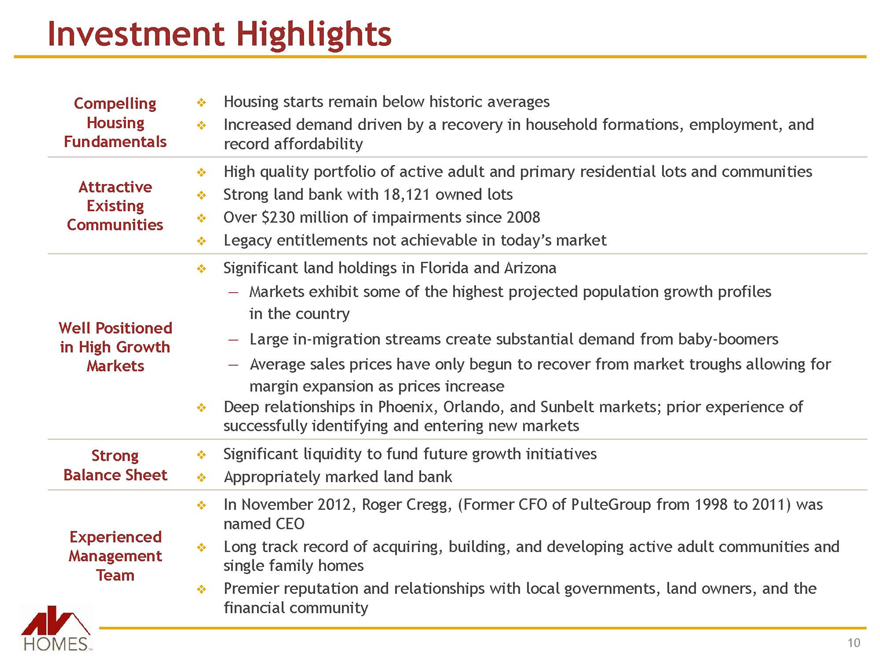
Compelling Housing Fundamentals
Housing starts remain below historic averages
Increased demand driven by a recovery in household formations, employment, and record affordability
Attractive Existing Communities
High quality portfolio of active adult and primary residential lots and communities
Strong land bank with 18,121 owned lots
Over $230 million of impairments since 2008
Legacy entitlements not achievable in today’s market
Well Positioned in High Growth Markets
Significant land holdings in Florida and Arizona
— Markets exhibit some of the highest projected population growth profiles in the country
— Large in-migration streams create substantial demand from baby-boomers
— Average sales prices have only begun to recover from market troughs allowing for margin expansion as prices increase
Deep relationships in Phoenix, Orlando, and Sunbelt markets; prior experience of successfully identifying and entering new markets
Strong Balance Sheet
Significant liquidity to fund future growth initiatives
Appropriately marked land bank
Experienced Management Team
In November 2012, Roger Cregg, (Former CFO of PulteGroup from 1998 to 2011) was named CEO
Long track record of acquiring, building, and developing active adult communities and single family homes
Premier reputation and relationships with local governments, land owners, and the financial community
HOMESTM
10
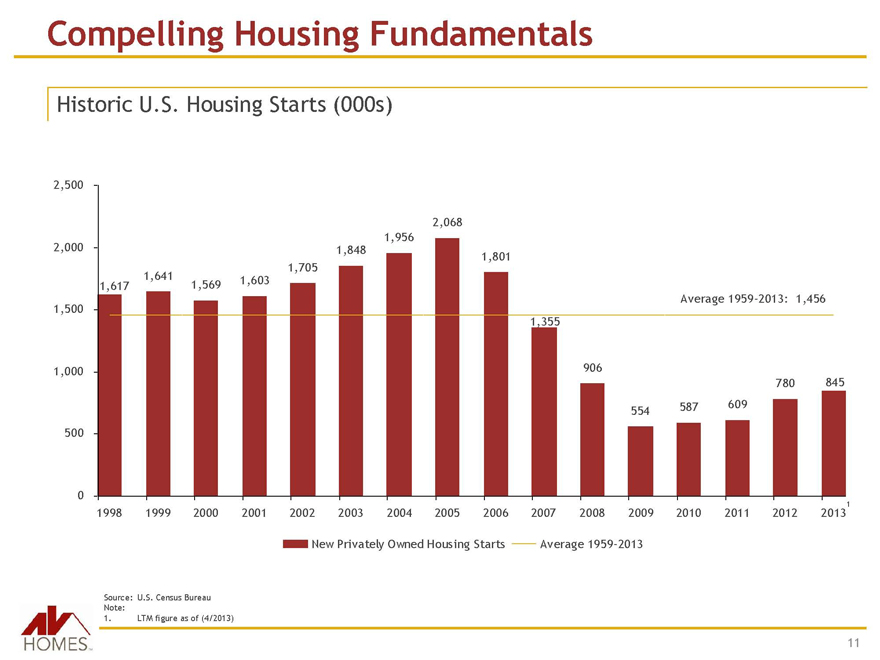
Compelling Housing Fundamentals
Historic U.S. Housing Starts (000s)
2,500 2,000 1,500 1,000 500 0
1,617 1,641 1,569 1,603 1,705 1,848 1,956 2,068 1,801 1,355 906 554 587 609 780 845
Average 1959-2013: 1,456
1998 1999 2000 2001 2002 2003 2004 2005 2006 2007 2008 2009 2010 2011 2012 20131
New Privately Owned Housing Starts — Average 1959-2013
Source: U.S. Census Bureau
Note:
1. LTM figure as of (4/2013)
HOMESTM
11
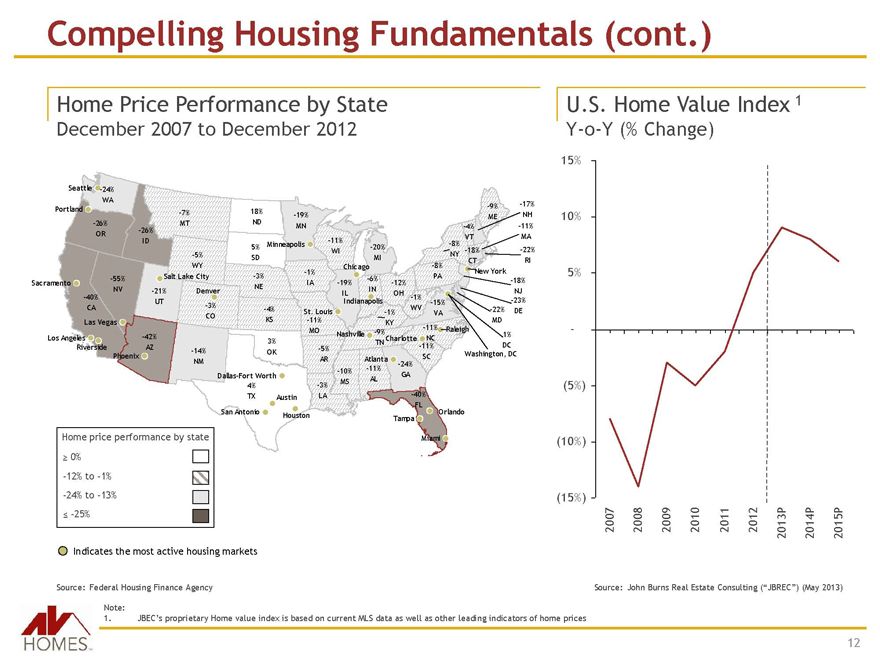
Compelling Housing Fundamentals (cont.)
Home Price Performance by State December 2007 to December 2012
Seattle -24% WA Portland -26% OR Sacramento -40% -55% NV CA Las Vegas Los Angeles Riverside -42% AZ Phoenix
-26% ID -7% MT -5% WY Salt Lake City -21% UT Denver -3% CO -14% NM
18% ND 5% SD -3% NE -4% KS 3% OK Dallas-Fort Worth 4% TX Austin San Antonio Houston
-19% MN Minneapolis -1% IA St. Louis -11% MO -5% AR -3% LA
-11% WI Chicago -19% IL -6% IN Indianapolis Nashville -10% MS
-20% MI -12% OH -1% KY -9% TN Charlotte Atlanta -11% AL -24% GA
-8% PA -1% WV -15% VA -11% NC Raleigh -11% SC -40% FL Tampa Orlando Miami
-9% ME -4% VT -8% NY -18% CT New York -17% NH -11% MA -22% RI -18% NJ -23% DE -22% MD 1% DC Washington, DC
Home price performance by state
³ 0%
-12% to -1%
-24% to -13%
£ -25%
Indicates the most active housing markets
Source: Federal Housing Finance Agency
U.S. Home Value Index 1
Y-o-Y (% Change)
15% 10% 5% - (5%) (10%) (15%)
2007 2008 2009 2010 2011 2012 2013P 2014P 2015P
Source: John Burns Real Estate Consulting (“JBREC”) (May 2013)
Note:
1. JBEC’s proprietary Home value index is based on current MLS data as well as other leading indicators of home prices
HOMESTM
12
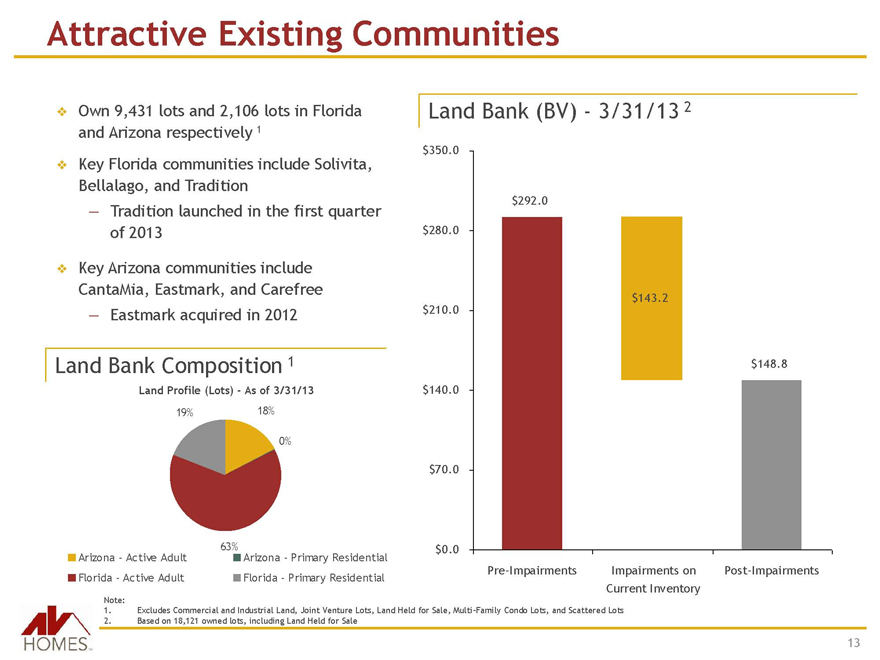
Attractive Existing Communities
Own 9,431 lots and 2,106 lots in Florida and Arizona respectively 1
Key Florida communities include Solivita, Bellalago, and Tradition
— Tradition launched in the first quarter of 2013
Key Arizona communities include CantaMia, Eastmark, and Carefree
— Eastmark acquired in 2012
Land Bank Composition 1
Land Profile (Lots) - As of 3/31/13
19% 18% 0% 63%
Arizona - Active Adult
Florida - Active Adult
Arizona - Primary Residential
Florida - Primary Residential
Land Bank (BV) - 3/31/13 2
$350.0 $280.0 $210.0 $140.0 $70.0 $0.0
$292.0 $143.2 $148.8
Pre-Impairments
Impairments on Current Inventory
Post-Impairments
Note:
1. Excludes Commercial and Industrial Land, Joint Venture Lots, Land Held for Sale, Multi-Family Condo Lots, and Scattered Lots
2. Based on 18,121 owned lots, including Land Held for Sale
HOMESTM
13
Well Positioned in High Growth Markets
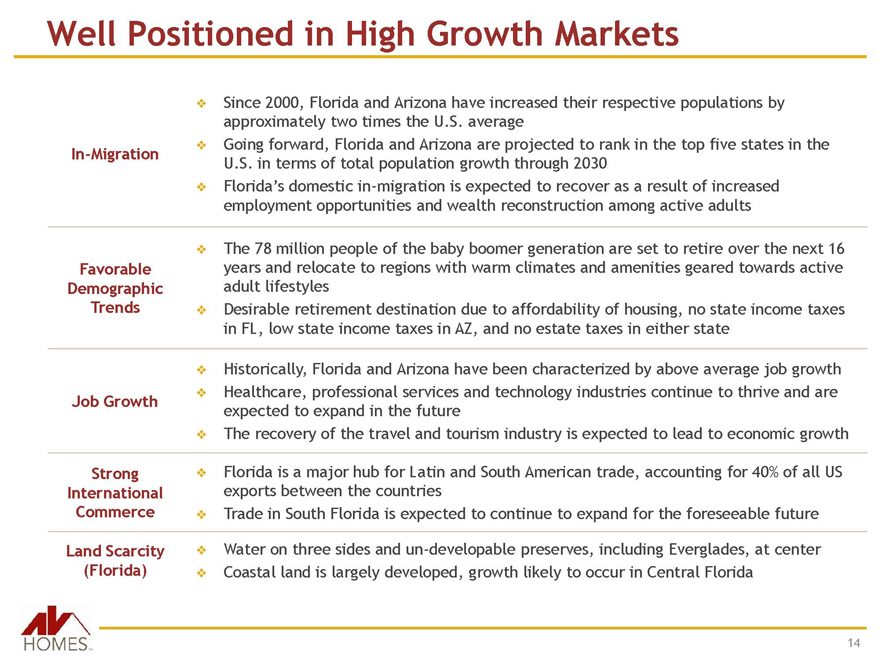
In-Migration
Since 2000, Florida and Arizona have increased their respective populations by approximately two times the U.S. average
Going forward, Florida and Arizona are projected to rank in the top five states in the U.S. in terms of total population growth through 2030
Florida’s domestic in-migration is expected to recover as a result of increased employment opportunities and wealth reconstruction among active adults
Favorable Demographic Trends
The 78 million people of the baby boomer generation are set to retire over the next 16 years and relocate to regions with warm climates and amenities geared towards active adult lifestyles
Desirable retirement destination due to affordability of housing, no state income taxes in FL, low state income taxes in AZ, and no estate taxes in either state
Job Growth
Historically, Florida and Arizona have been characterized by above average job growth
Healthcare, professional services and technology industries continue to thrive and are expected to expand in the future
The recovery of the travel and tourism industry is expected to lead to economic growth
Strong International Commerce
Florida is a major hub for Latin and South American trade, accounting for 40% of all US exports between the countries
Trade in South Florida is expected to continue to expand for the foreseeable future
Land Scarcity (Florida)
Water on three sides and un-developable preserves, including Everglades, at center
Coastal land is largely developed, growth likely to occur in Central Florida
AV HOMESTM
14
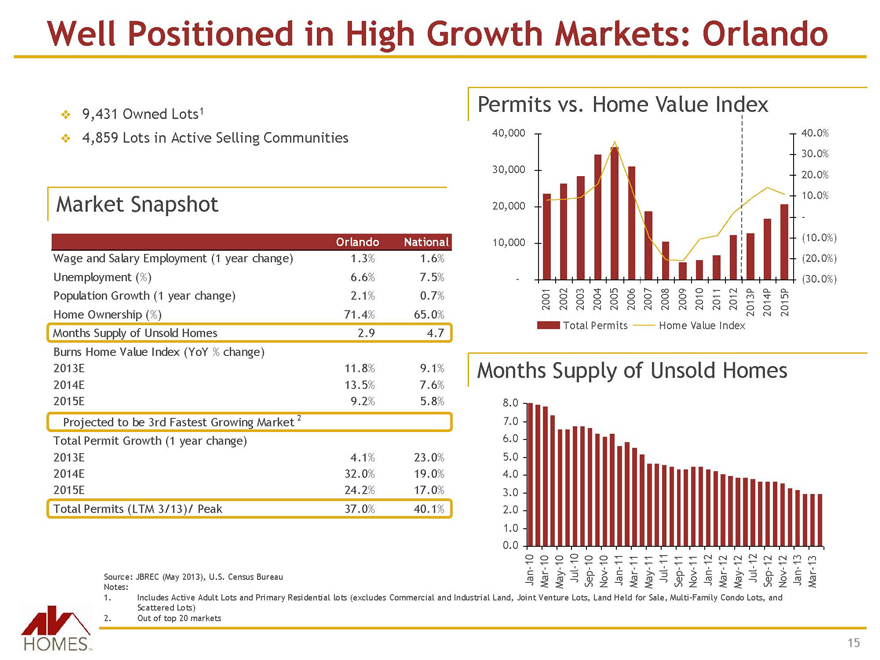
Well Positioned in High Growth Markets: Orlando
9,431 Owned Lots1
4,859 Lots in Active Selling Communities
Market Snapshot
Orlando National
Wage and Salary Employment (1 year change) 1.3% 1.6%
Unemployment (%) 6.6% 7.5%
Population Growth (1 year change) 2.1% 0.7%
Home Ownership (%) 71.4% 65.0%
Months Supply of Unsold Homes 2.9 4.7
Burns Home Value Index (YoY % change)
2013E 11.8% 9.1%
2014E 13.5% 7.6%
2015E 9.2% 5.8%
Projected to be 3rd Fastest Growing Market 2
Total Permit Growth (1 year change)
2013E 4.1% 23.0%
2014E 32.0% 19.0%
2015E 24.2% 17.0%
Total Permits (LTM 3/13)/ Peak 37.0% 40.1%
Permits vs. Home Value Index
40,000 30,000 20,000 10,000 -
40.0% 30.0% 20.0% 10.0% - (10.0%) (20.0%) (30.0%)
2001 2002 2003 2004 2005 2006 2007 2008 2009 2010 2011 2012 2013P 2014P 2015P
Total Permits Home Value Index
Months Supply of Unsold Homes
8.0 7.0 6.0 5.0 4.0 3.0 2.0 1.0 0.0
Jan-10 Mar-10 May-10 Jul-10 Sep-10 Nov-10 Jan-11 Mar-11 May-11 Jul-11 Sep-11 Nov-11 Jan-12 Mar-12 May-12 Jul-12 Sep-12 Nov-12 Jan-13 Mar-13
Source: JBREC (May 2013), U.S. Census Bureau
Notes:
1. Includes Active Adult Lots and Primary Residential lots (excludes Commercial and Industrial Land, Joint Venture Lots, Land Held for Sale, Multi-Family Condo Lots, and Scattered Lots)
2. Out of top 20 markets
AV HOMESTM
15
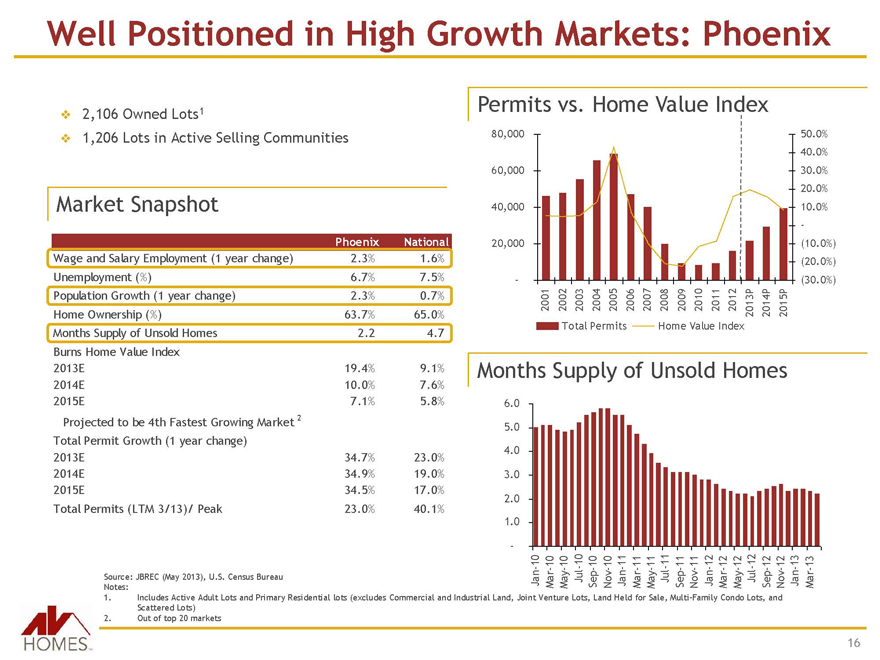
Well Positioned in High Growth Markets: Phoenix
2,106 Owned Lots1
1,206 Lots in Active Selling Communities
Market Snapshot
Phoenix National
Wage and Salary Employment (1 year change) 2.3% 1.6%
Unemployment (%) 6.7% 7.5%
Population Growth (1 year change) 2.3% 0.7%
Home Ownership (%) 63.7% 65.0%
Months Supply of Unsold Homes 2.2 4.7
Burns Home Value Index
2013E 19.4% 9.1%
2014E 10.0% 7.6%
2015E 7.1% 5.8%
Projected to be 4th Fastest Growing Market 2
Total Permit Growth (1 year change)
2013E 34.7% 23.0%
2014E 34.9% 19.0%
2015E 34.5% 17.0%
Total Permits (LTM 3/13)/ Peak 23.0% 40.1%
Permits vs. Home Value Index
80,000 60,000 40,000 20,000 -
50.0% 40.0% 30.0% 20.0% 10.0% - (10.0%) (20.0%) (30.0%)
2001 2002 2003 2004 2005 2006 2007 2008 2009 2010 2011 2012 2013P 2014P 2015P
Total Permits Home Value Index
Months Supply of Unsold Homes
6.0 5.0 4.0 3.0 2.0 1.0 -
Jan-10 Mar-10 May-10 Jul-10 Sep-10 Nov-10 Jan-11 Mar-11 May-11 Jul-11 Sep-11 Nov-11 Jan-12 Mar-12 May-12 Jul-12 Sep-12 Nov-12 Jan-13 Mar-13
Source: JBREC (May 2013), U.S. Census Bureau
Notes:
1. Includes Active Adult Lots and Primary Residential lots (excludes Commercial and Industrial Land, Joint Venture Lots, Land Held for Sale, Multi-Family Condo Lots, and Scattered Lots)
2. Out of top 20 markets
AV HOMESTM
16
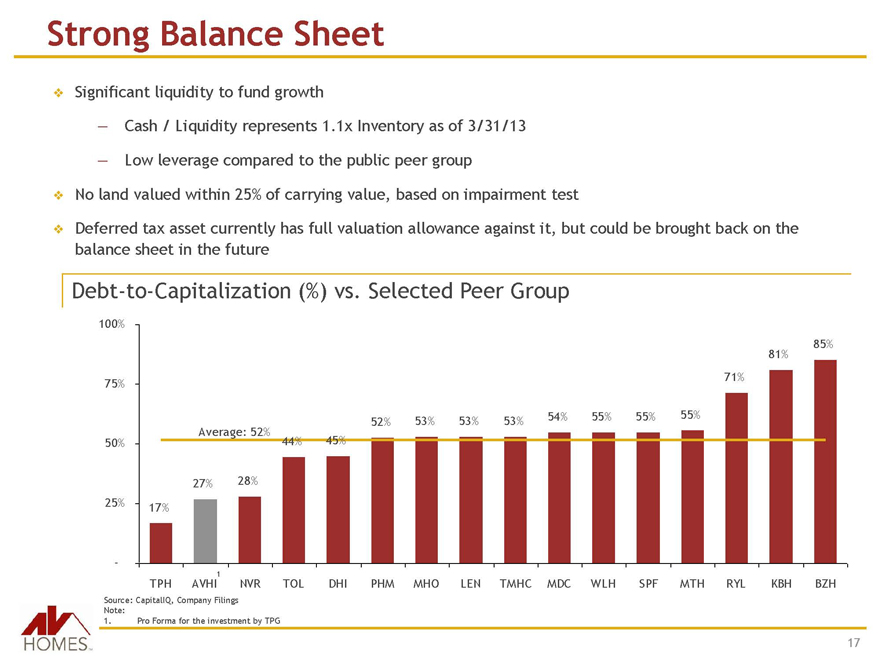
Strong Balance Sheet
Significant liquidity to fund growth
– Cash / Liquidity represents 1.1x Inventory as of 3/31/13
– Low leverage compared to the public peer group
No land valued within 25% of carrying value, based on impairment test
Deferred tax asset currently has full valuation allowance against it, but could be brought back on the balance sheet in the future
Debt-to-Capitalization (%) vs. Selected Peer Group
100% 75% 50% 25% -
Average: 52%
17% 27% 28% 44% 45% 52% 53% 53% 53% 54% 55% 55% 55% 71% 81% 85%
TPH AVHI1 NVR TOL DHI PHM MHO LEN TMHC MDC WLH SPF MTH RYL KBH BZH
Source: CapitalIQ, Company Filings
Note:
1. Pro Forma for the investment by TPG
AV HOMESTM
17
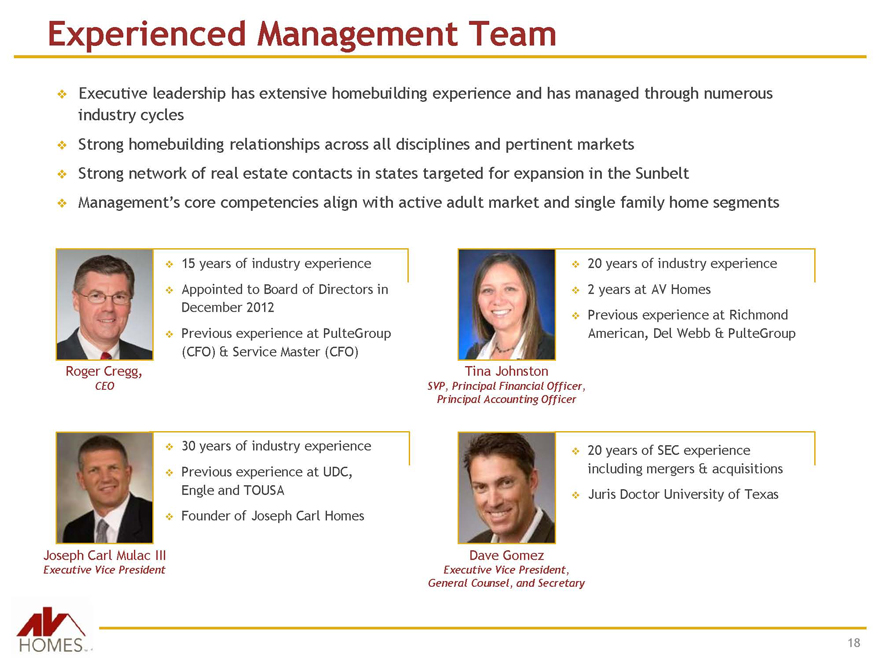
Experienced Management Team
Executive leadership has extensive homebuilding experience and has managed through numerous industry cycles
Strong homebuilding relationships across all disciplines and pertinent markets
Strong network of real estate contacts in states targeted for expansion in the Sunbelt
Management’s core competencies align with active adult market and single family home segments
Roger Cregg,
CEO
15 years of industry experience
Appointed to Board of Directors in December 2012
Previous experience at PulteGroup (CFO) & Service Master (CFO)
Joseph Carl Mulac III
Executive Vice President
30 years of industry experience
Previous experience at UDC, Engle and TOUSA
Founder of Joseph Carl Homes
Tina Johnston
SVP, Principal Financial Officer, Principal Accounting Officer
20 years of industry experience
2 years at AV Homes
Previous experience at Richmond American, Del Webb & PulteGroup
Dave Gomez
Executive Vice President, General Counsel, and Secretary
20 years of SEC experience including mergers & acquisitions
Juris Doctor University of Texas
AV HOMES TM
18

AV HOMESTM
Select Communities
Section Three
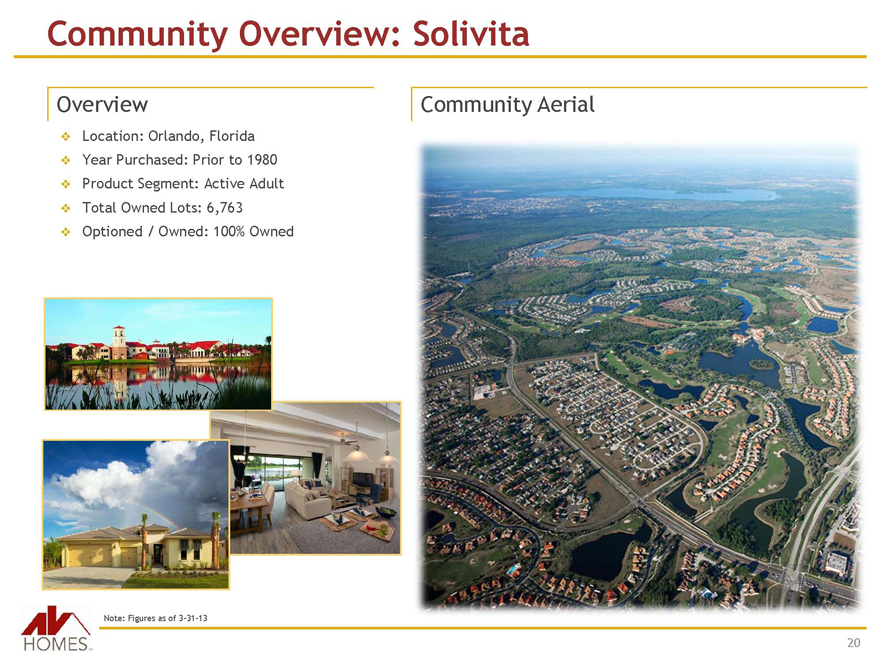
Community Overview: Solivita
Overview
v Location: Orlando, Florida
v Year Purchased: Prior to 1980
v Product Segment: Active Adult
v Total Owned Lots: 6,763
v Optioned / Owned: 100% Owned
Community Aerial
Note: Figures as of 3-31-13
AV HOMESTM
20
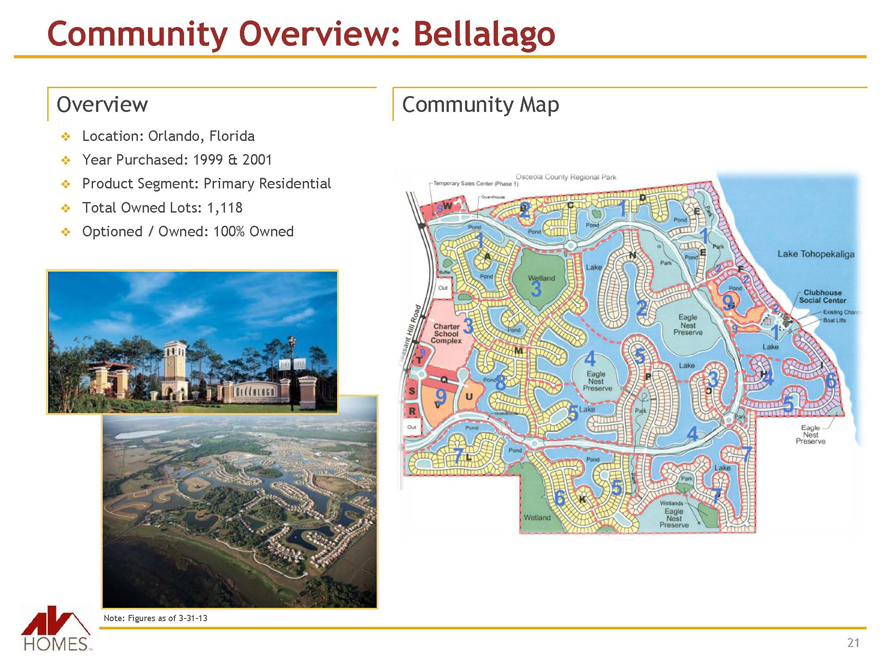
Community Overview: Bellalago
Overview
v Location: Orlando, Florida
v Year Purchased: 1999 & 2001
v Product Segment: Primary Residential
v Total Owned Lots: 1,118
v Optioned / Owned: 100% Owned
Community Map
Note: Figures as of 3-31-13
HOMES TM
21
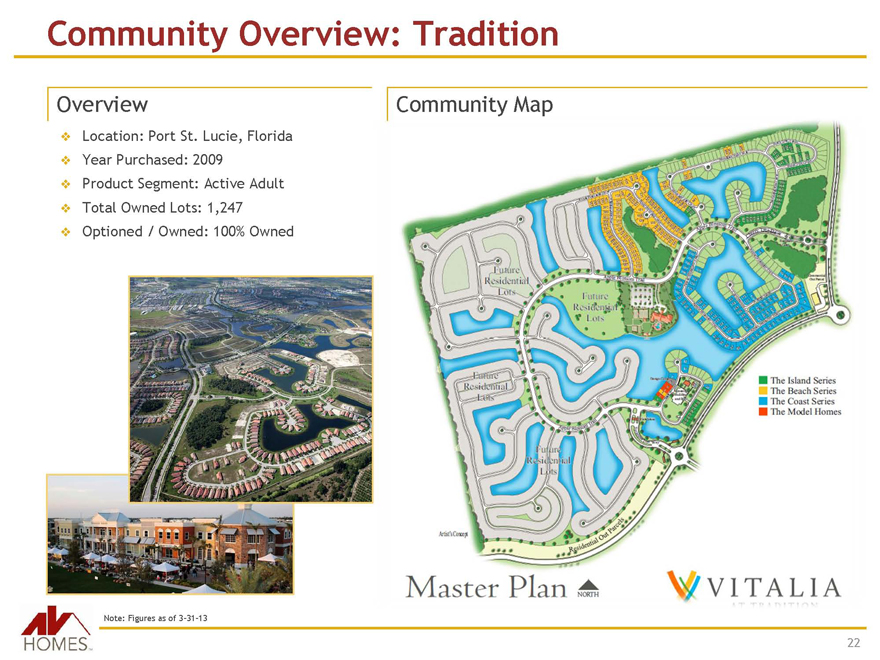
Community Overview: Tradition
Overview
v Location: Port St. Lucie, Florida
v Year Purchased: 2009
v Product Segment: Active Adult
v Total Owned Lots: 1,247
v Optioned / Owned: 100% Owned
Community Map
The Island Series
The Beach Series
The Coast Series
The Model Homes
Master Plan NORTH
VITALIA
Note: Figures as of 3-31-13
HOMES TM
22
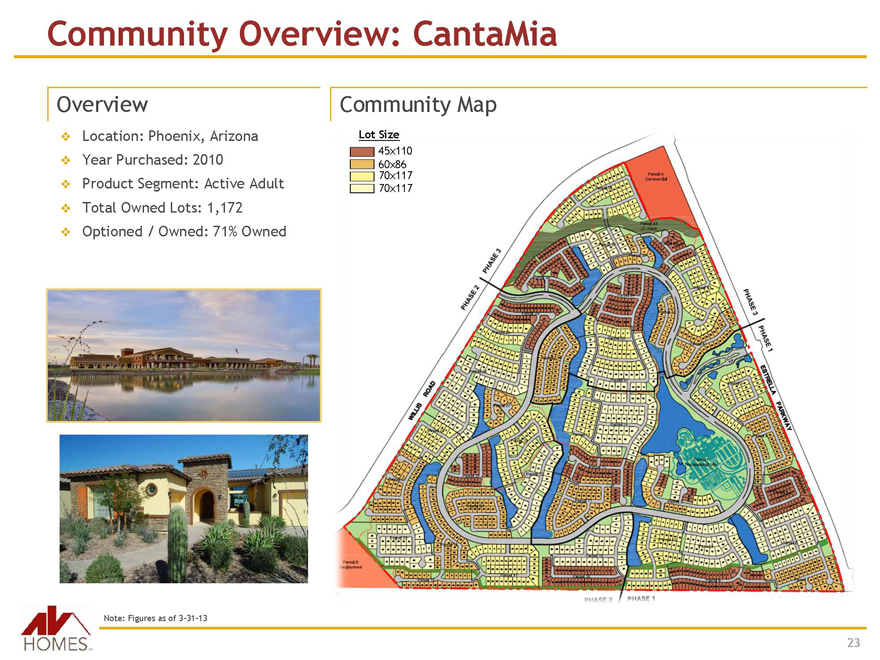
Community Overview: CantaMia
Overview
v Location: Phoenix, Arizona
v Year Purchased: 2010
v Product Segment: Active Adult
v Total Owned Lots: 1,172
v Optioned / Owned: 71% Owned
Community Map
Lot Size
45x110
60x86
70x117
70x117
Note: Figures as of 3-31-13
HOMES TM
23
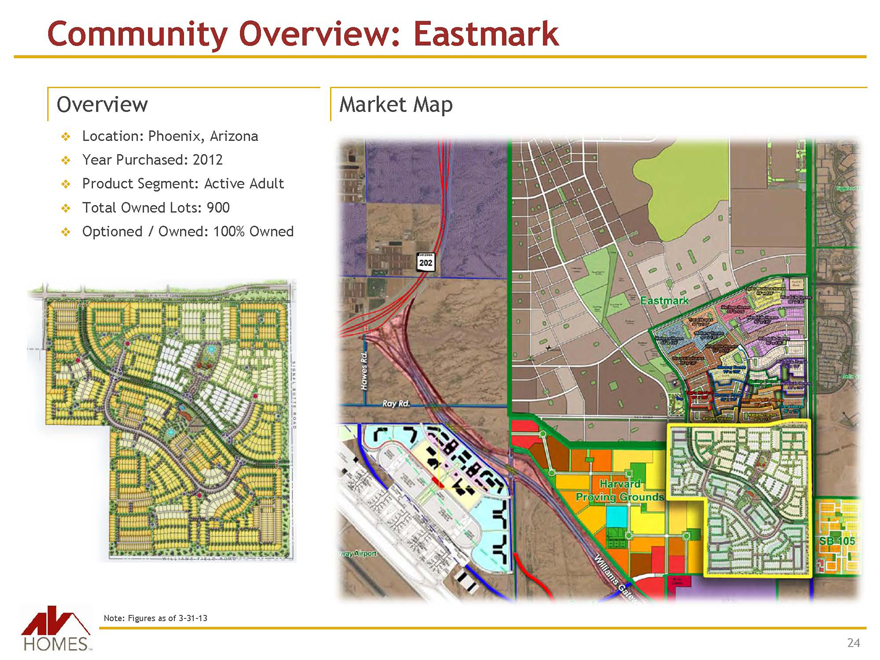
Community Overview: Eastmark
Overview
v Location: Phoenix, Arizona
v Year Purchased: 2012
v Product Segment: Active Adult
v Total Owned Lots: 900
v Optioned / Owned: 100% Owned
Market Map
Note: Figures as of 3-31-13
HOMES TM
24
HOMES TM
Appendix
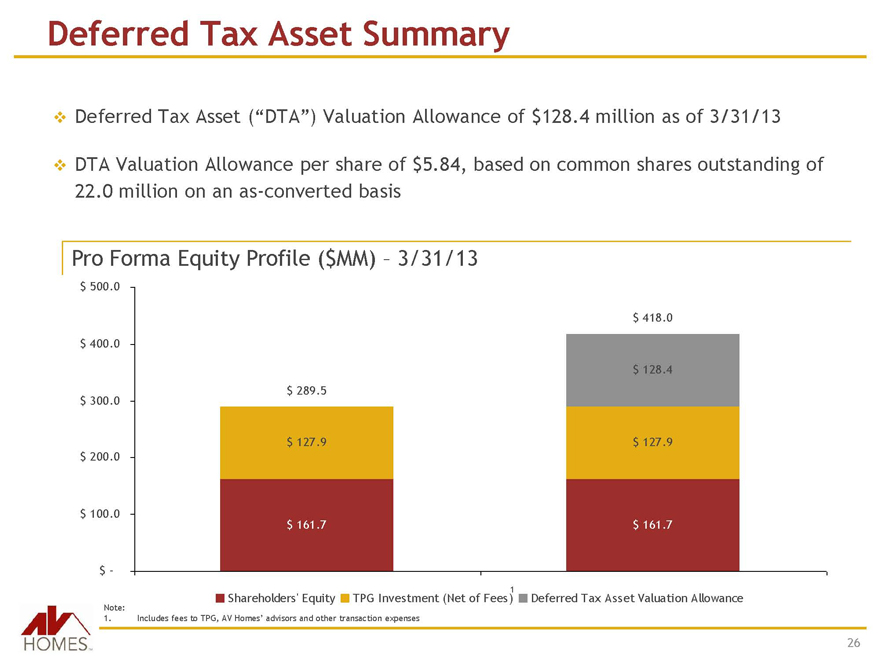
Deferred Tax Asset Summary
Deferred Tax Asset (“DTA”) Valuation Allowance of $128.4 million as of 3/31/13
DTA Valuation Allowance per share of $5.84, based on common shares outstanding of 22.0 million on an as-converted basis
Pro Forma Equity Profile ($MM) – 3/31/13
$ 500.0
$ 400.0
$ 300.0
$ 200.0
$ 100.0
$ -
$ 289.5
$ 127.9
$ 161.7
$ 418.0
$ 128.4
$ 127.9
$ 161.7
1
Shareholders’ Equity TPG Investment (Net of Fees) Deferred Tax Asset Valuation Allowance
Note:
1. Includes fees to TPG, AV Homes’ advisors and other transaction expenses
HOMES TM
26

HOMES TM