|
Exhibit 99.1 
|
Exhibit 99.1
Investor Presentation
June 2014
CONFIDENTIAL
Disclaimer
Forward-Looking Statements
Certain statements discussed in this Presentation constitute “forward-looking statements” within the meaning of the Private Securities Litigation Reform Act of 1995. Such forward-looking statements involve known and unknown risks, uncertainties and other important factors that could cause the actual results, performance or achievements of results to differ materially from any future results, performance or achievements expressed or implied by such forward-looking statements. Such risks, uncertainties and other important factors include, among others: the duration and ultimate speed of the current housing recovery remains uncertain; competition in the homebuilding markets in which AV Homes (“AVHI” or “Company”) operates; AVHI’s access to financing; concentrated ownership structure; the stability of certain financial markets; disruption of the credit markets and reduced availability and more stringent financing requirements for commercial and residential mortgages of all types; the number of investor and speculator resale homes for sale and homes in foreclosure in AVHI’s communities and in the geographic areas in which AVHI develops and sells homes; the increased level of unemployment; the decline in net worth and/or of income of potential buyers; the decline in consumer confidence; the failure to successfully implement AVHI’s business strategy; shifts in demographic trends affecting demand for active adult and primary housing; the level of immigration and migration into the areas in which AVHI conducts real estate activities; construction defect and home warranty claims; changes in, or the failure or inability to comply with, government regulations; the failure to successfully integrate acquisitions into AVHI’s business, including AVHI’s acquisition of Royal Oak Homes, LLC; recognition of contingent development liabilities in advance of anticipated timeframes and other factors as are described in AVHI’s Annual Report on Form 10-K for the year ended December 31, 2013. Readers are cautioned not to place undue reliance on any forward-looking statements contained herein, which reflect management’s opinions only as of the date hereof.
*Information in this Investor Presentation is as of March 31, 2014 unless otherwise stated
CONFIDENTIAL
Executive Summary
AV Homes (“AVHI” or “Company”) is a leading homebuilder with a balanced portfolio of active adult and primary residential communities in high growth housing markets
The Company owns or controls ~15,8001 residential lots in 33 communities strategically located in Phoenix, Arizona; Orlando, Florida; and Charlotte and Raleigh, North Carolina
Over the past two years, AVHI has executed numerous operational, strategic and financial initiatives
Industry veteran Roger Cregg joined the Company as CEO in December 2012 Partnered with TPG Capital on a $135 million equity raise in June 2013 Established a $65 million secured revolving credit facility in April 2014
The additional capital has been efficiently deployed in repositioning many of the Company’s existing communities, funding land acquisitions and the acquisition of Royal Oak Homes in Orlando, FL
1 | | Includes ~800 lots that are not included in management’s near term development plan |
Management Presenters
CONFIDENTIAL
Roger Cregg
— Director, President and Chief Executive Officer
— Over 35 years of experience
— Former CFO at PulteGroup from 1998 to 2011
— Current Director of Comerica Inc. and former Director and Chair of the Federal Reserve Bank of Chicago, Detroit Branch
Michael Burnett
— Chief Financial Officer and Executive Vice President
— Over 20 years of experience in accounting / corporate finance
— Former CFO of American Traffic Solutions
— Former Senior Vice President, Finance, Treasury and Investor Relations at JDA Software
— Previously served in various financial roles at Allied Waste Industries and as a certified public accountant with Arthur Andersen LLP
Company Overview
CONFIDENTIAL
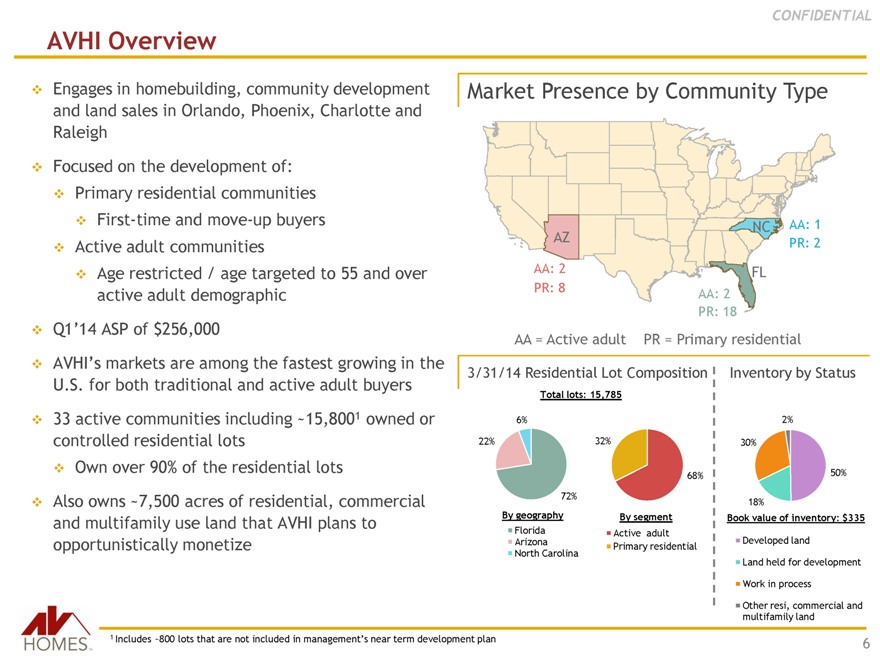
AVHI Overview
Engages in homebuilding, community development and land sales in Orlando, Phoenix, Charlotte and Raleigh
Focused on the development of:
Primary residential communities
First-time and move-up buyers
Active adult communities
Age restricted/age targeted to 55 and over active adult demographic
Q1’14 ASP of $256,000
AVHI’s markets are among the fastest growing in the U.S. for both traditional and active adult buyers
33 active communites including ~15,8001 owned or controlled residential lots
Own over 90% of the residential lots
Also owns ~ 7,500 acres of residential, commercial and multifamily use land that AVHI plans to opportunistically monetize
Market Presence by Community Type
AA: 2
PR: 8
AA: 2
PR: 18
AA: 1
PR: 2
AA = Active adult
PR = Primary residential
3/31/14 Residential Lot Composition
Total lots: 15,785
6%
22%
72%
32%
68%
By geography
Florida
Arizona
North Carolina
By segment
Active adult
Primary residential
Inventory by Status
2%
30%
18%
50%
Book value of inventory: $335
Developed land
Land Held for development
Work in process
Other resi, commercial and multifamily land
1 includes~800 lots that are not included in managent’s near term development plan
CONFIDENTIAL
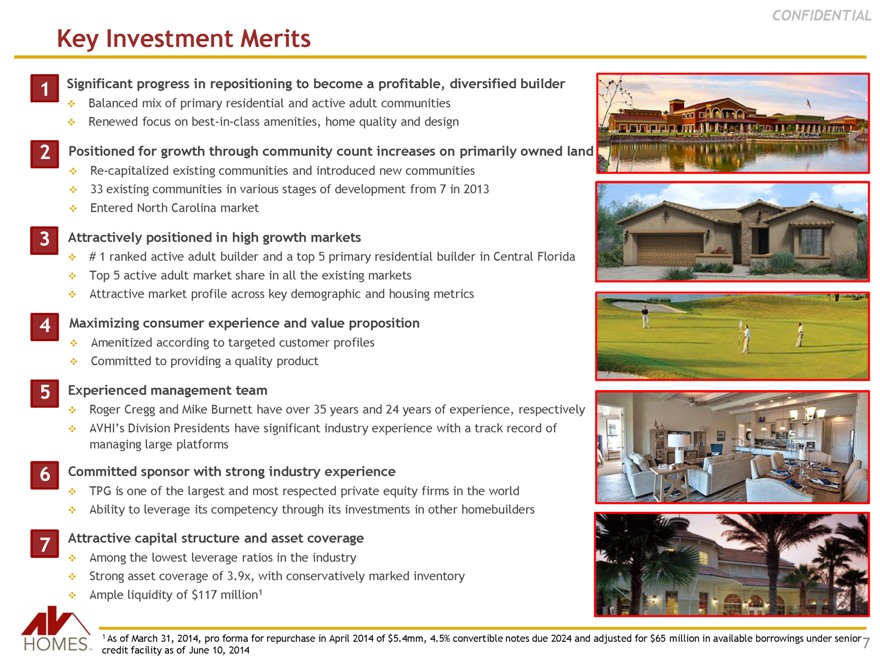
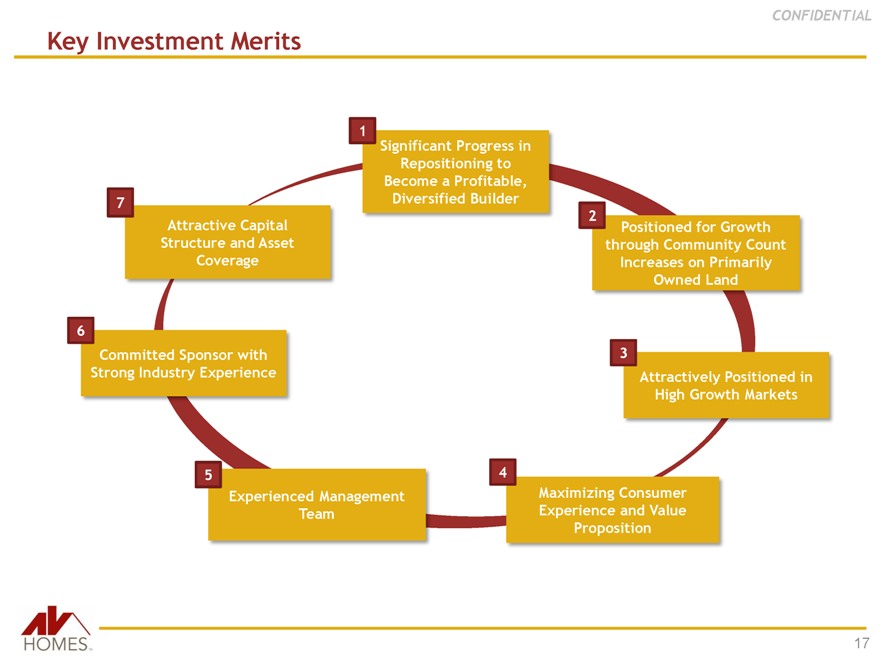
Key Investment Merits
1 | | Significant progress in repositioning to become a profitable, diversified builder |
Balanced mix of primary residential and active adult communities Renewed focus on best-in-class amenities, home quality and design
2 | | Positioned for growth through community count increases on primarily owned land |
Re-capitalized existing communities and introduced new communities 33 existing communities in various stages of development from 7 in 2013 Entered North Carolina market
3 | | Attractively positioned in high growth markets |
# 1 ranked active adult builder and a top 5 primary residential builder in Central Florida Top 5 active adult market share in all the existing markets Attractive market profile across key demographic and housing metrics
4 | | Maximizing consumer experience and value proposition |
Amenitized according to targeted customer profiles Committed to providing a quality product
5 | | Experienced management team |
Roger Cregg and Mike Burnett have over 35 years and 24 years of experience, respectively
AVHI’s Division Presidents have significant industry experience with a track record of managing large platforms
6 | | Committed sponsor with strong industry experience |
TPG is one of the largest and most respected private equity firms in the world Ability to leverage its competency through its investments in other homebuilders
7 | | Attractive capital structure and asset coverage |
Among the lowest leverage ratios in the industry
Strong asset coverage of 3.9x, with conservatively marked inventory Ample liquidity of $117 million1
1 As of March 31, 2014, pro forma for repurchase in April 2014 of $5.4mm, 4.5% convertible notes due 2024 and adjusted for $65 million in available borrowings under senior credit facility as of June 10, 2014
CONFIDENTIAL
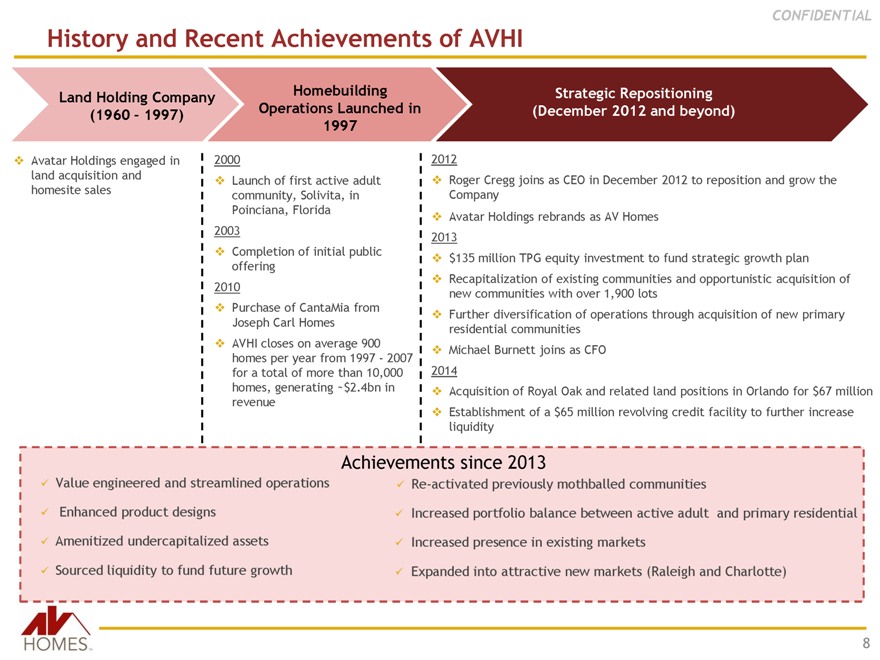
History and Recent Achievements of AVHI
Land Holding Company (1960 – 1997)
Avatar Holdings engaged in land acquisition and homesite sales
Homebuilding Operations Launched in 1997
2000
Launch of first active adult community, Solivita, in Poinciana, Florida 2003 Completion of initial public offering 2010 Purchase of CantaMia from Joseph Carl Homes AVHI closes on average 900 homes per year from 1997—2007 for a total of more than 10,000 homes, generating ~$2.4bn in revenue
Strategic Repositioning (December 2012 and beyond)
2012
Roger Cregg joins as CEO in December 2012 to reposition and grow the Company Avatar Holdings rebrands as AV Homes 2013 $135 million TPG equity investment to fund strategic growth plan Recapitalization of existing communities and opportunistic acquisition of new communities with over 1,900 lots Further diversification of operations through acquisition of new primary residential communities Michael Burnett joins as CFO
2014
Acquisition of Royal Oak and related land positions in Orlando for $67 million Establishment of a $65 million revolving credit facility to further increase liquidity
Achivement since 2013
Value engineered and streamlined operations Re-activated previously mothballed communities
Enhanced product designs Increased portfolio balance between active adult and primary residential Amenitized undercapitalized assets Increased presence in existing markets Sourced liquidity to fund future growth Expanded into attractive new markets (Raleigh and Charlotte)
CONFIDENTIAL
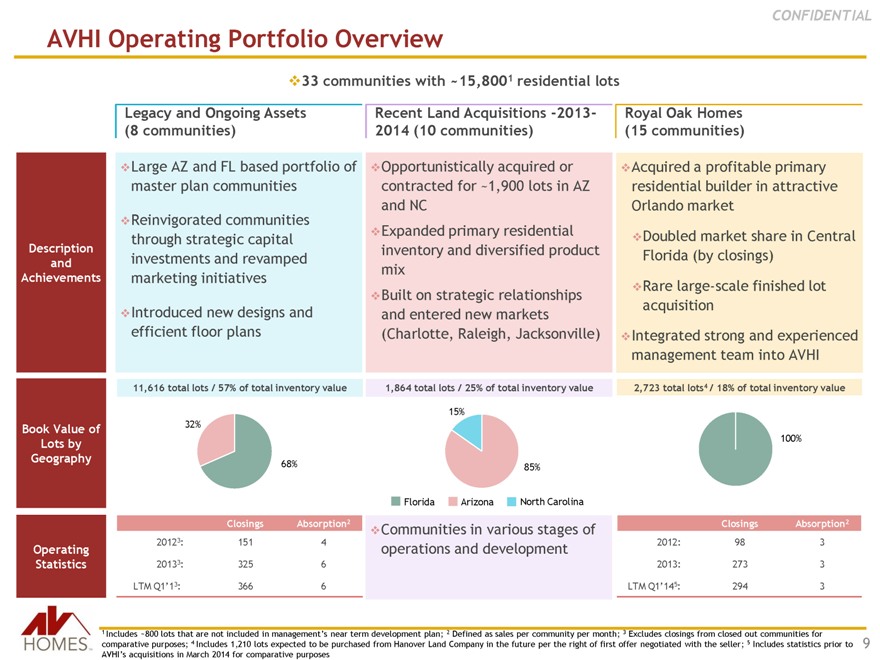
AVHI Operating Portfolio Overview
33 communities with ~15,8001 residential lots
Legacy and Ongoing Assets (8 communities)
AZ and FL based portfolio of master plan communities
Reinvigorated communities
through strategic capital investments and revamped marketing initiatives
Introduced new designs and efficient floor plans
11,616 total lots / 57% of total inventory value
Recent Land Acquisitions -2013-2014 (10 communities)
Opportunistically acquired or
contracted for ~1,900 lots in AZ and NC
Expanded primary residential inventory and diversified product mix
Build on strategic relationships and entered new markets (Charlotte, Raleigh, Jacksonville)
1,864 total lots / 25% of total inventory value
Royal Oak Homes
(15 communities)
Acquired a profitable primary residential builder in attractive Orlando market Doubled market share in Central Florida (by closings) Rare large-scale finished lot acquisition Integrated strong and experienced management team into AVHI
2,723 total lots4 / 18% of total inventory value
Description and Achievements
Book Value of Lots by Geography
Operating Statistics
32%
68%
Closings Absorption2
20123: 151 4
20133: 325 6
LTM Q1’13: 366 6
15%
85%
Florida Arizona North Carolina
Communities in various stages of operations and development
100%
Closings Absorption2
2012: 98 3 2013: 273 3 LTM Q1’145: 294 3
1 Includes ~800 lots that are not included in management’s near term development plan; 2 Defined as sales per community per month; 3 Excludes closings from closed out communities for comparative purposes; 4 Includes 1,210 lots expected to be purchased from Hanover Land Company in the future per the right of first offer negotiated with the seller; 5 Includes statistics prior to
AVHI’s acquisitions in March 2014 for comparative purposes
9
CONFIDENTIAL
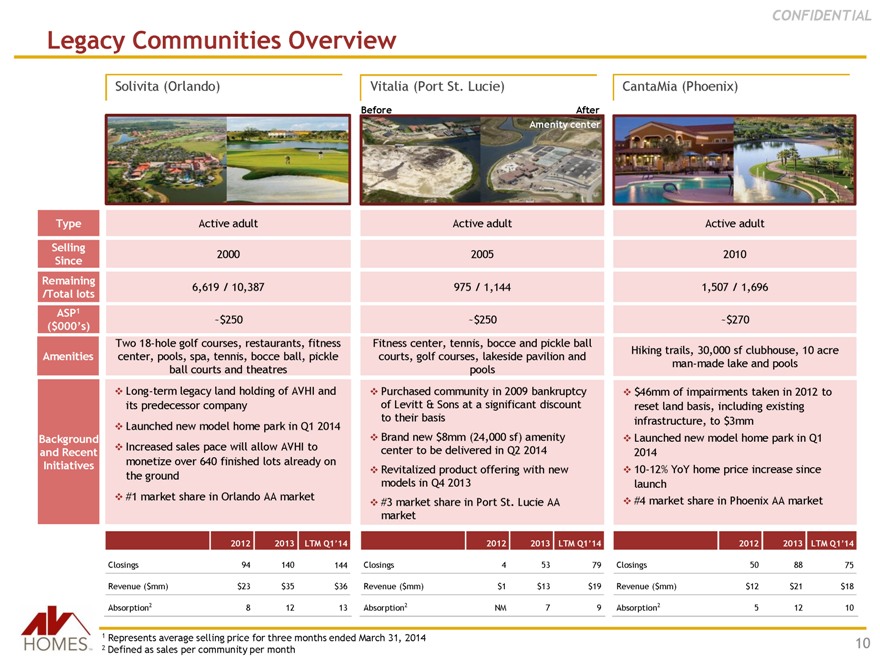
Legacy Communities Overview
Solivita (Orlando)
Active adult
2000
6,619 / 10,387
~$250
Two 18-hole golf courses, restaurants, fitness center, pools, spa, tennis, bocce ball, pickle ball courts and theatres Long-term legacy land holding of AVHI and its predecessor company Launched new model home park in Q1 2014 Increased sales pace will allow AVHI to monetize over 640 finished lots already on the ground #1 market share in Orlando AA market
Vitalia (Port St. Lucie)
Before After Amenity center
Active adult
2005
975 / 1,144
~$250
Fitness center, tennis, bocce and pickle ball courts, golf courses, lakeside pavilion and pools Purchased community in 2009 bankruptcy of Levitt & Sons at a significant discount to their basis Brand new $8mm (24,000 sf) amenity center to be delivered in Q2 2014 Revitalized product offering with new models in Q4 2013 #3 market share in Port St. Lucie AA market
CantaMia (Phoenix)
Active adult
2010
1,507 / 1,696
~$270
Hiking trails, 30,000 sf clubhouse, 10 acre man-made lake and pools
$46mm of impairments taken in 2012 to reset land basis, including existing infrastructure, to $3mm Launched new model home park in Q1 2014 10-12% YoY home price increase since launch #4 market share in Phoenix AA market
Type
Selling Since Remaining /Total lots ASP1
($000’s)
Amenities
Background and Recent Initiatives
2012 2013 LTM Q1’14
Closings 94 140 144 Revenue ($mm) $23 $35 $36 Absorption2 8 12 13
2012 2013 LTM Q1’14
Closings 4 53 79 Revenue ($mm) $1 $13 $19 Absorption2 NM 7 9
2012 2013 LTM Q1’14
Closings 50 88 75 Revenue ($mm) $12 $21 $18 Absorption2 5 12 10
1 | | Represents average selling price for three months ended March 31, 2014 |
2 | | Defined as sales per community per month |
10
CONFIDENTIAL
Legacy Communities Overview
Eastmark (Phoenix)
Active adult
2015
905
NA
15,000 sf activity center offering exercise machines, yoga, pools, spa and tennis courts Acquired Eastmark for $60,000 per acre in 2014 from DMB, the master planned developer Highly desirable location adjacent to the new 202 loop interchange AVHI has exclusive rights to offer AA homes in Eastmark
Began land development in Q1’14 with plan to launch home sales in
Q1’15
Bellalago and IOB (Orlando)
Primary residential
2002 / 2004
1,033 / 2,328
Bellalago: ~$260, IOB: ~$200 Access to Lake Toho, boat ramps, piers, water complex, fitness centers and sports complex ~1,559 acre master planned community developed in 2002
408 finished lots with a significant concentration of premier lake front lots remaining
Waterview (Orlando)
Before After Aerial shot
Primary residential
2014
527
NA
Pools with cabanas, community playgrounds and close proximity to schools Waterview was a long-term raw land holding located right on the main intersection and across from a school
Prior to TPG’s investment, AVHI did not have the capital to begin development at Waterview
Given improving sub-market fundamentals, AVHI began land development in 2014
AVHI pre-sold 28 homes in Q1’14
2012 2013 LTM Q1’14
Closings 3 32 43 Revenue ($mm) $1 $10 $12 Absorption2 1 2 2
Type Selling Since
Remaining / Total lots
ASP1
($000’s)
Amenities
Recent Initiatives
1 | | Represents average selling price for three months ended March 31, 2014 |
2 | | Defined as sales per community per month |
11
CONFIDENTIAL
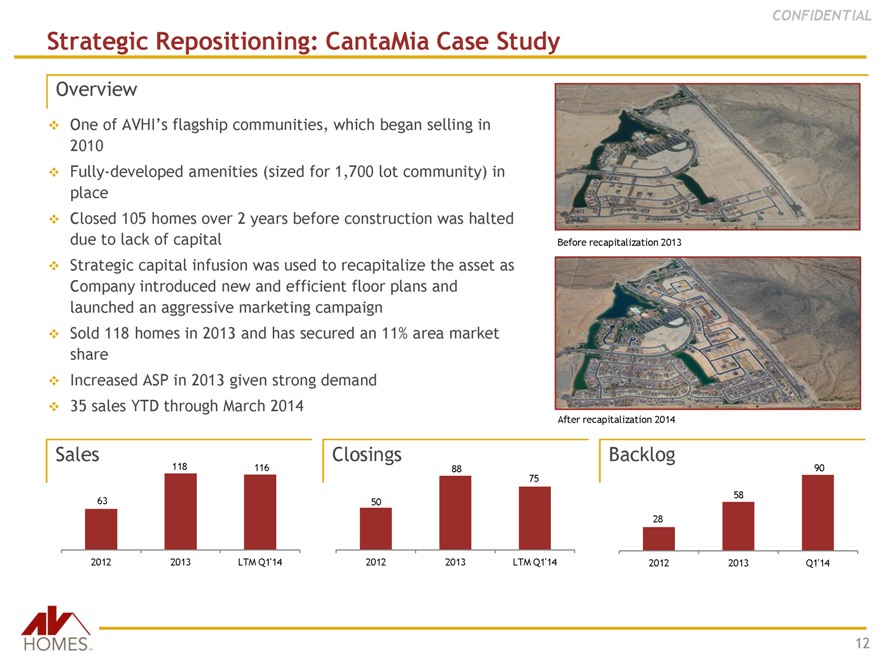
Strategic Repositioning: CantaMia Case Study
Overview
One of AVHI’s flagship communities, which began selling in
2010
Fully-developed amenities (sized for 1,700 lot community) in place Closed 105 homes over 2 years before construction was halted due to lack of capital Strategic capital infusion was used to recapitalize the asset as Company introduced new and efficient floor plans and launched an aggressive marketing campaign Sold 118 homes in 2013 and has secured an 11% area market share Increased ASP in 2013 given strong demand 35 sales YTD through March 2014
Before recapitalization 2013
After recapitalization 2014
Sales 118
116
63
2012 2013 LTM Q1’14
Closings
88 75 50
2012 2013 LTM Q1’14
Backlog
90 58 28
2012 2013 Q1’14
12
CONFIDENTIAL
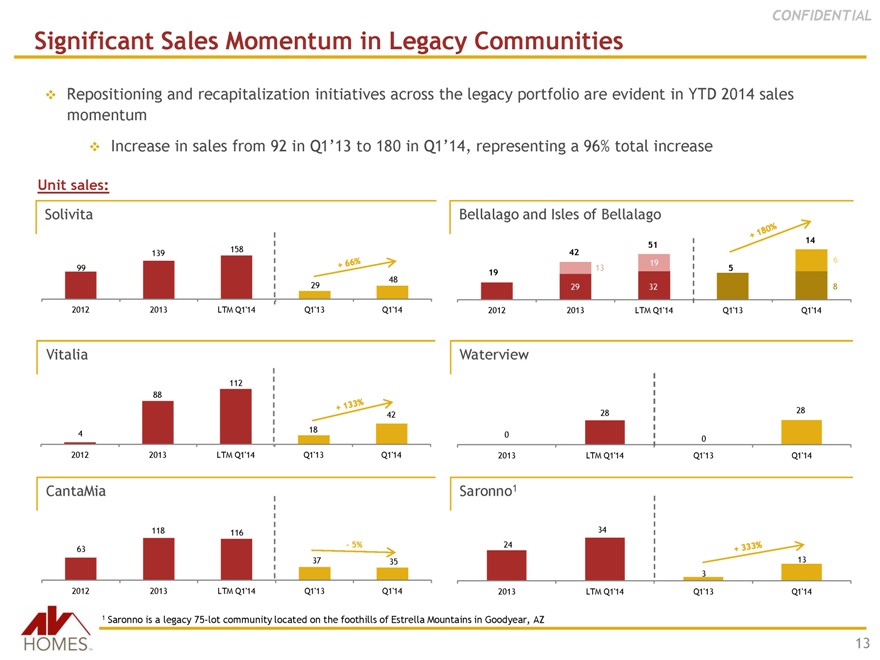
Significant Sales Momentum in Legacy Communities
Repositioning and recapitalization initiatives across the legacy portfolio are evident in YTD 2014 sales momentum
Increase in sales from 92 in Q1’13 to 180 in Q1’14, representing a 96% total increase
Unit sales:
Solivita Bellalago and Isles of Bellalago
14 51
139 158 42
99 13 19 5 6
19
+66%
+180%
+133%
48
29 29 32 8 2012 2013 LTM Q1’14 Q1’13 Q1’14 2012 2013 LTM Q1’14 Q1’13 Q1’14
Vitalia Waterview
112 88
28 28 42
0
0
2012 2013 LTM Q1’14 Q1’13 Q1’14 2013 LTM Q1’14 Q1’13 Q1’14
CantaMia Saronno1
118 116 34
- 5% 24
63
37 35 13 3 2012 2013 LTM Q1’14 Q1’13 Q1’14 2013 LTM Q1’14 Q1’13 Q1’14
1 | | Saronno is a legacy 75-lot community located on the foothills of Estrella Mountains in Goodyear, AZ |
13
CONFIDENTIAL
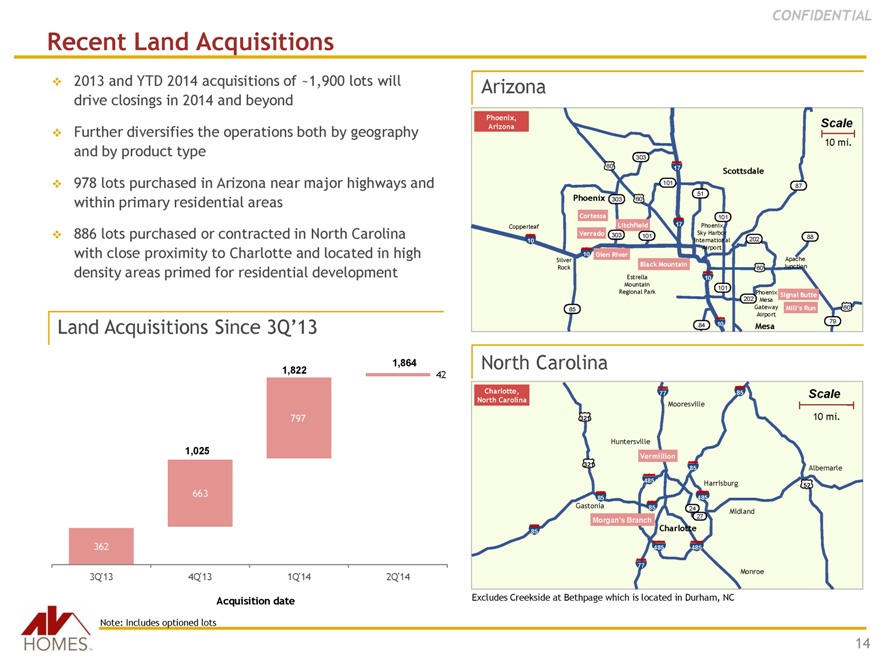
Recent Land Acquisitions
2013 and YTD 2014 acquisitions of ~1,900 lots will drive closings in 2014 and beyond
Further diversifies the operations both by geography and by product type
978 lots purchased in Arizona near major highways and within primary residential areas
886 lots purchased or contracted in North Carolina with close proximity to Charlotte and located in high density areas primed for residential development
Land Acquisitions Since 3Q’13
1,864 1,822 42
797
1,025
663
362
3Q’13 4Q’13 1Q’14 2Q’14
Acquisition date
Arizona
Phoenix,
Arizona Scale
10 mi.
303
60 17
Scottsdale
101
87
Phoenix 303 60 51
Cortessa 101
Copperleaf Litchfield 17 Phoenix Verrado 303 Sky Harbor
101 88
10 International 202 Airport
10 Glen River
Silver Apache
Rock Black Mountain Junction
60
Estrella 10 Mountain
101
Regional Park Phoenix Signal Butte 202 Mesa
85 Gateway Mill’s Run 60
Airport
79
84 10 Mesa
North Carolina
Charlotte, 77 85 Scale North Carolina
Mooresville
321 10 mi.
Huntersville
Vermillion
321
85 Albemarle 485 Harrisburg
52
85 485
Gastonia 85 24
27 Midland
Morgan’s Branch Charlotte
85
485 485
77 Monroe
Excludes Creekside at Bethpage which is located in Durham, NC
Note: Includes optioned lots
14
CONFIDENTIAL
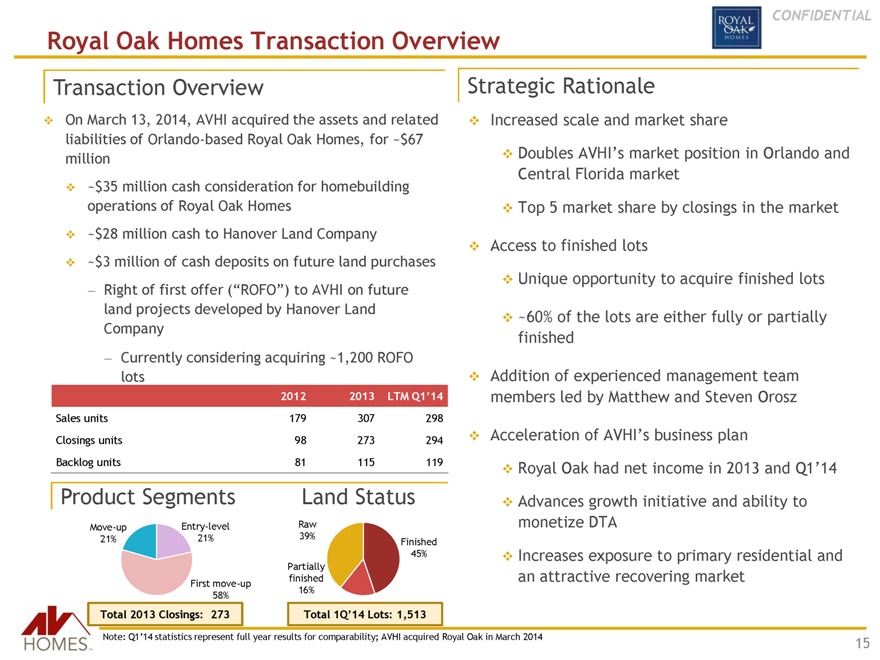
Royal Oak Homes Transaction Overview
Transaction Overview
On March 13, 2014, AVHI acquired the assets and related liabilities of Orlando-based Royal Oak Homes, for ~$67 million ~$35 million cash consideration for homebuilding operations of Royal Oak Homes ~$28 million cash to Hanover Land Company ~$3 million of cash deposits on future land purchases
— Right of first offer (“ROFO”) to AVHI on future land projects developed by Hanover Land Company
— Currently considering acquiring ~1,200 ROFO lots
2012 2013 LTM Q1’14
Sales units 179 307 298 Closings units 98 273 294 Backlog units 81 115 119
Strategic Rationale
Increased scale and market share
Doubles AVHI’s market position in Orlando and
Central Florida market
Top 5 market share by closings in the market
Access to finished lots
Unique opportunity to acquire finished lots
~60% of the lots are either fully or partially finished
Addition of experienced management team members led by Matthew and Steven Orosz
Acceleration of AVHI’s business plan
Royal Oak had net income in 2013 and Q1’14
Advances growth initiative and ability to monetize DTA
Increases exposure to primary residential and an attractive recovering market
Product Segments
Move-up Entry-level 21% 21%
First move-up 58%
Total 2013 Closings: 273
Land Status
Raw 39%
Finished 45% Partially finished 16%
Total 1Q’14 Lots: 1,513
Note: Q1’14 statistics represent full year results for comparability; AVHI acquired Royal Oak in March 2014
15
Key Investment Merits
CONFIDENTIAL
Key Investment Merits
Significant Progress in Repositioning to Become a Profitable, Diversified Builder
Attractive Capital Structure and Asset Coverage
Positioned for Growth through Community Count Increases on Primarily Owned Land
Attractively Positioned in High Growth Markets
Maximizing Consumer Experience and Value Proposition
Experienced Management Team
Committed Sponsor with Strong Industry Experience
17
CONFIDENTIAL
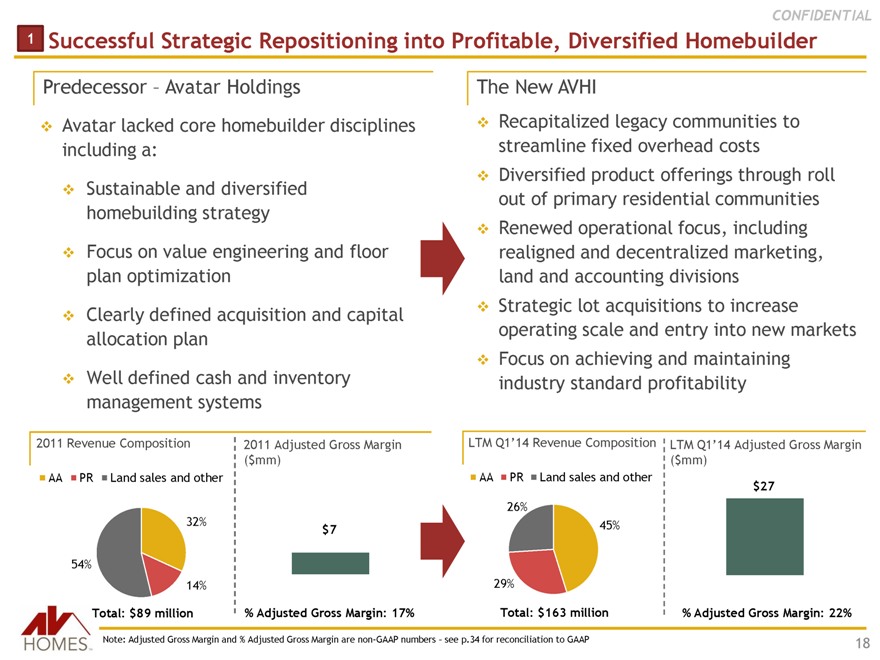
1 | | Successful Strategic Repositioning into Profitable, Diversified Homebuilder |
Predecessor – Avatar Holdings
Avatar lacked core homebuilder disciplines including a:
Sustainable and diversified homebuilding strategy
Focus on value engineering and floor plan optimization
Clearly defined acquisition and capital allocation plan
Well defined cash and inventory management systems
The New AVHI
Recapitalized legacy communities to streamline fixed overhead costs Diversified product offerings through roll out of primary residential communities Renewed operational focus, including realigned and decentralized marketing, land and accounting divisions
Strategic lot acquisitions to increase operating scale and entry into new markets Focus on achieving and maintaining industry standard profitability
2011 Revenue Composition
AA PR Land sales and other
32%
54%
14%
Total: $89 million
2011 Adjusted Gross Margin ($mm)
$7
% Adjusted Gross Margin: 17%
LTM Q1’14 Revenue Composition
AA PR Land sales and other
26%
45%
29%
Total: $163 million
LTM Q1’14 Adjusted Gross Margin
($mm) $27
% Adjusted Gross Margin: 22%
Note: Adjusted Gross Margin and % Adjusted Gross Margin are non-GAAP numbers – see p.34 for reconciliation to GAAP
18
CONFIDENTIAL
2 | | Positioned for Growth through Community Count Increases on Primarily Owned Land |
Attractive mix of finished land positions for near-term homebuilding operations and longer-term strategic land positions to support future growth
Substantially all of 2014 and 2015 closings come from existing land inventory
Legacy Closed out communities Recent land acquisitions Royal Oak
Significant community count growth through acquisition of Royal Oak and additional communities from recent land acquisitions to come on-line over the next 12-18 months
Active Community count
33
15
10
~5x increase
2012
Active adult focus
Lack of capital hindered maximizing the full potential of AVHI’s communities
2013
Diversification into PR communities through land acquisitions Reinforced efforts in building and marketing flagship AA communities
2014 / 2015
Integration of Royal Oak communities Expansion into North Carolina markets Addition of new communities through recent land acquisitions Addition of 2 AA communities: Eastmark in Phoenix and Creekside in Durham, NC
19
CONFIDENTIAL
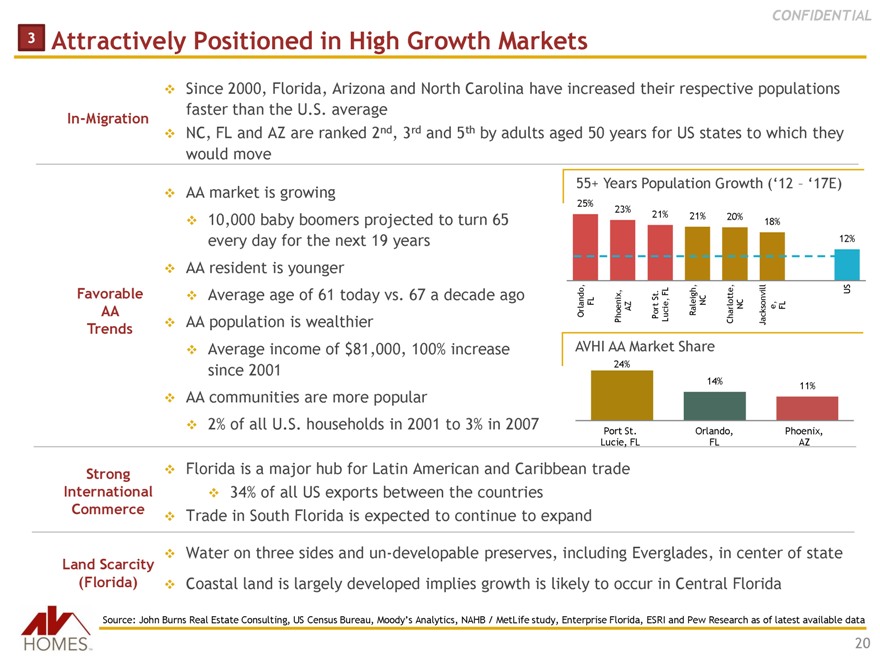
3 | | Attractively Positioned in High Growth Markets |
Since 2000, Florida, Arizona and North Carolina have increased their respective populations faster than the U.S. average
In-Migration and AZ nd rd th
NC, FL are ranked 2 , 3 and 5 by adults aged 50 years for US states to which they would move
AA market is growing
10,000 baby boomers projected to turn 65 every day for the next 19 years AA resident is younger Average age of 61 today vs. 67 a decade ago AA population is wealthier Average income of $81,000, 100% increase since 2001 AA communities are more popular 2% of all U.S. households in 2001 to 3% in 2007
Florida is a major hub for Latin American and Caribbean trade 34% of all US exports between the countries Trade in South Florida is expected to continue to expand
Water on three sides and un-developable preserves, including Everglades, in center of state Coastal land is largely developed implies growth is likely to occur in Central Florida
Favorable AA
Trends
Strong International Commerce
Land Scarcity (Florida)
Source: John Burns Real Estate Consulting, US Census Bureau, Moody’s Analytics, NAHB / MetLife study, Enterprise Florida, ESRI and Pew Research as of latest available data
55+ Years Population Growth (‘12 – ‘17E)
25%
23%
21% 21% 20%
18%
12%
US FL
St.
Orlando, FL Phoenix, AZ Port Lucie, Raleigh, NC Charlotte, NC Jacksonvill e, FL
AVHI AA Market Share
24%
14%
11%
Port St. Orlando, Phoenix, Lucie, FL FL AZ
20
3
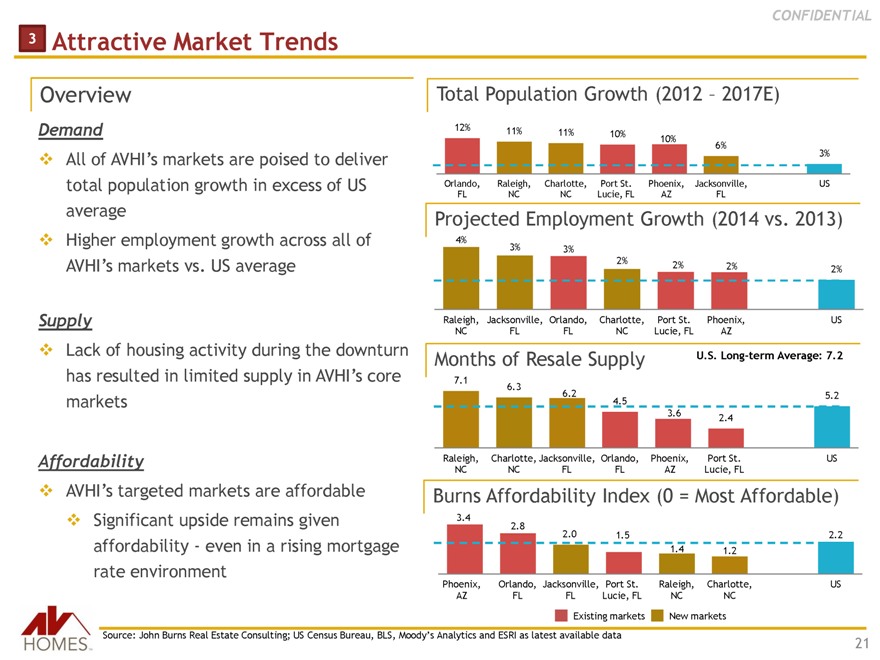
Attractive Market Trends
CONFIDENTIAL
Overview
Demand
All of AVHI’s markets are poised to deliver total population growth in excess of US average Higher employment growth across all of
AVHI’s markets vs. US average
Supply
Lack of housing activity during the downturn has resulted in limited supply in AVHI’s core markets
Affordability
AVHI’s targeted markets are affordable
Significant upside remains given affordability—even in a rising mortgage rate environment
Total Population Growth (2012 – 2017E)
12% 11%
11% 10%
10%
6%
3%
Orlando, Raleigh, Charlotte, Port St. Phoenix, Jacksonville, US FL NC NC Lucie, FL AZ FL
Projected Employment Growth (2014 vs. 2013)
4%
3% 3%
2% 2%
2% 2%
Raleigh, Jacksonville, Orlando, Charlotte, Port St. Phoenix, US NC FL FL NC Lucie, FL AZ
Months of Resale Supply U.S. Long-term Average: 7.2
7.1
6.3
6.2 5.2 4.5 3.6 2.4
Raleigh, Charlotte, Jacksonville, Orlando, Phoenix, Port St. US NC NC FL FL AZ Lucie, FL
Burns Affordability Index (0 = Most Affordable)
3.4 2.8
2.0 1.5 2.2 1.4 1.2
Phoenix, Orlando, Jacksonville, Port St. Raleigh, Charlotte, US AZ FL FL Lucie, FL NC NC
Existing markets New markets
Source: John Burns Real Estate Consulting; US Census Bureau, BLS, Moody’s Analytics and ESRI as latest available data
21
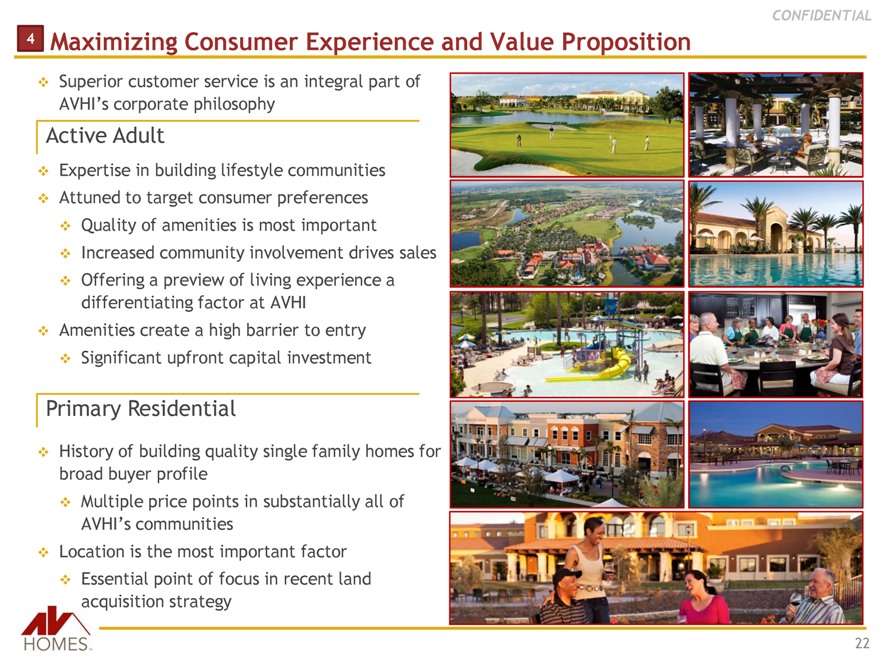
4 Maximizing Consumer Experience and Value Proposition
CONFIDENTIAL
Superior customer service is an integral part of
AVHI’s corporate philosophy
Active Adult
Expertise in building lifestyle communities Attuned to target consumer preferences Quality of amenities is most important Increased community involvement drives sales Offering a preview of living experience a differentiating factor at AVHI
Amenities create a high barrier to entry Significant upfront capital investment
Primary Residential
History of building quality single family homes for broad buyer profile Multiple price points in substantially all of
AVHI’s communities
Location is the most important factor Essential point of focus in recent land acquisition strategy
22
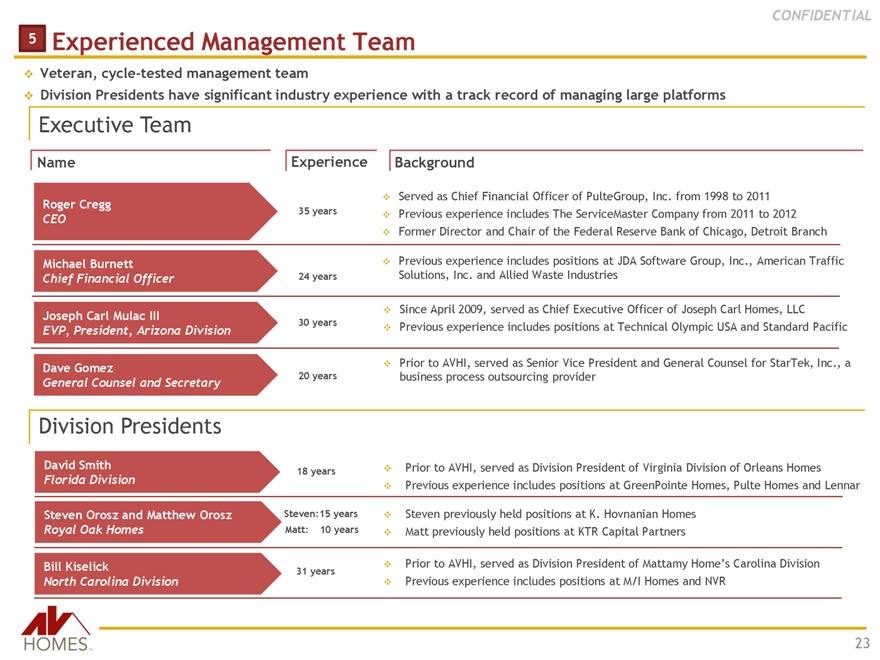
5 Experienced Management Team
CONFIDENTIAL
Veteran, cycle-tested management team
Division Presidents have significant industry experience with a track record of managing large platforms
Executive Team
Name
Roger Cregg
CEO
Michael Burnett
Chief Financial Officer
Joseph Carl Mulac III
EVP, President, Arizona Division
Dave Gomez
General Counsel and Secretary
Experience
35 years 24 years 30 years 20 years
Background
Served as Chief Financial Officer of PulteGroup, Inc. from 1998 to 2011 Previous experience includes The ServiceMaster Company from 2011 to 2012 Former Director and Chair of the Federal Reserve Bank of Chicago, Detroit Branch
Previous experience includes positions at JDA Software Group, Inc., American Traffic Solutions, Inc. and Allied Waste Industries
Since April 2009, served as Chief Executive Officer of Joseph Carl Homes, LLC
Previous experience includes positions at Technical Olympic USA and Standard Pacific
Prior to AVHI, served as Senior Vice President and General Counsel for StarTek, Inc., a business process outsourcing provider
Division Presidents
David Smith
Florida Division
Steven Orosz and Matthew Orosz
Royal Oak Homes
Bill Kiselick
North Carolina Division
18 years
Steven:15 years Matt: 10 years
31 years
Prior to AVHI, served as Division President of Virginia Division of Orleans Homes
Previous experience includes positions at GreenPointe Homes, Pulte Homes and Lennar
Steven previously held positions at K. Hovnanian Homes Matt previously held positions at KTR Capital Partners
Prior to AVHI, served as Division President of Mattamy Home’s Carolina Division
Previous experience includes positions at M/I Homes and NVR
23
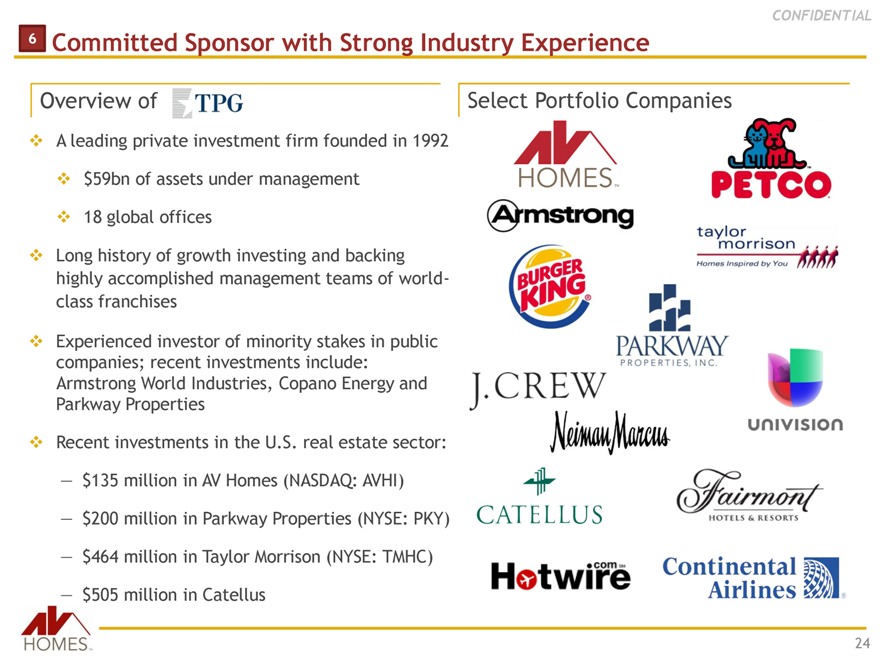
6 Committed Sponsor with Strong Industry Experience
CONFIDENTIAL
Overview of
A leading private investment firm founded in 1992 $59bn of assets under management 18 global offices
Long history of growth investing and backing highly accomplished management teams of world-class franchises
Experienced investor of minority stakes in public companies; recent investments include: Armstrong World Industries, Copano Energy and Parkway Properties
Recent investments in the U.S. real estate sector:
— $135 million in AV Homes (NASDAQ: AVHI)
— $200 million in Parkway Properties (NYSE: PKY)
— $464 million in Taylor Morrison (NYSE: TMHC)
— $505 million in Catellus
24
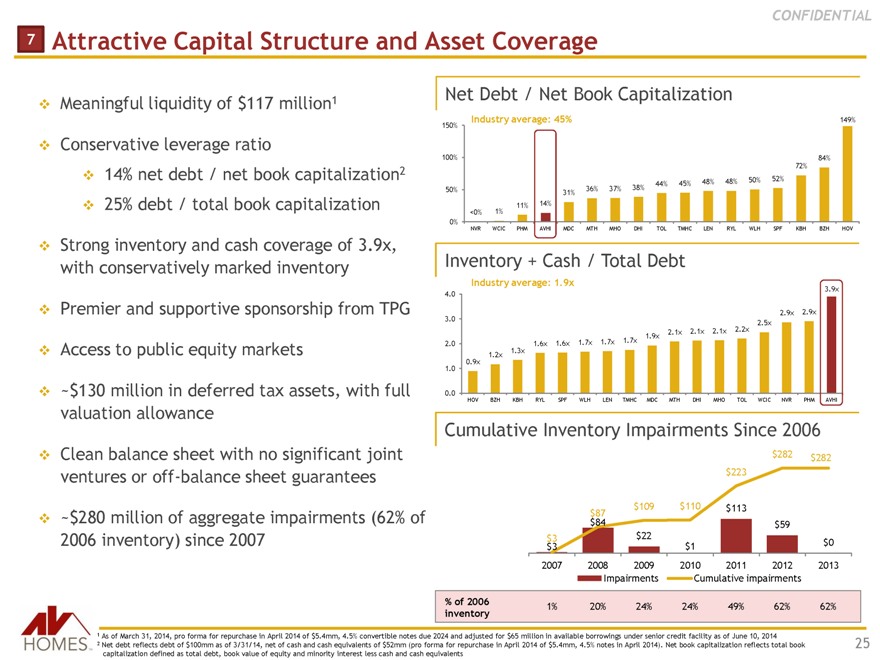
7 Attractive Capital Structure and Asset Coverage
CONFIDENTIAL
Meaningful liquidity of $117 million 1
Conservative leverage ratio
14% net debt / net book capitalization 2
25% debt / total book capitalization
Strong inventory and cash coverage of 3.9x, with conservatively marked inventory
Premier and supportive sponsorship from TPG
Access to public equity markets
~$130 million in deferred tax assets, with full valuation allowance
Clean balance sheet with no significant joint ventures or off-balance sheet guarantees
~$280 million of aggregate impairments (62% of 2006 inventory) since 2007
Net Debt / Net Book Capitalization
Industry average: 45% 149%
150%
100% 84% 72% 48% 48% 50% 52% 44% 45% 50% 36% 37% 38% 31% 11% 14% <0% 1% 0%
NVR WCIC PHM AVHI MDC MTH MHO DHI TOL TMHC LEN RYL WLH SPF KBH BZH HOV
Inventory + Cash / Total Debt
Industry average: 1.9x
3.9x 4.0
3.0 2.9x 2.9x 2.2x 2.5x 2.1x 2.1x 2.1x 1.9x 2.0 1.6x 1.6x 1.7x 1.7x 1.7x 1.3x 0.9x 1.2x 1.0
0.0
HOV BZH KBH RYL SPF WLH LEN TMHC MDC MTH DHI MHO TOL WCIC NVR PHM AVHI
Cumulative Inventory Impairments Since 2006
$282 $282 $223
$109 $110 $113 $ $84 87 $59
$3 $22
$3 $1 $0 2007 2008 2009 2010 2011 2012 2013 Impairments Cumulative impairments
% of 2006
1% 20% 24% 24% 49% 62% 62% inventory
1 As of March 31, 2014, pro forma for repurchase in April 2014 of $5.4mm, 4.5% convertible notes due 2024 and adjusted for $65 million in available borrowings under senior credit facility as of June 10, 2014
2 Net debt reflects debt of $100mm as of 3/31/14, net of cash and cash equivalents of $52mm (pro forma for repurchase in April 2014 of $5.4mm, 4.5% notes in April 2014). Net book capitalization reflects total book capitalization defined as total debt, book value of equity and minority interest less cash and cash equivalents
25
CONFIDENTIAL
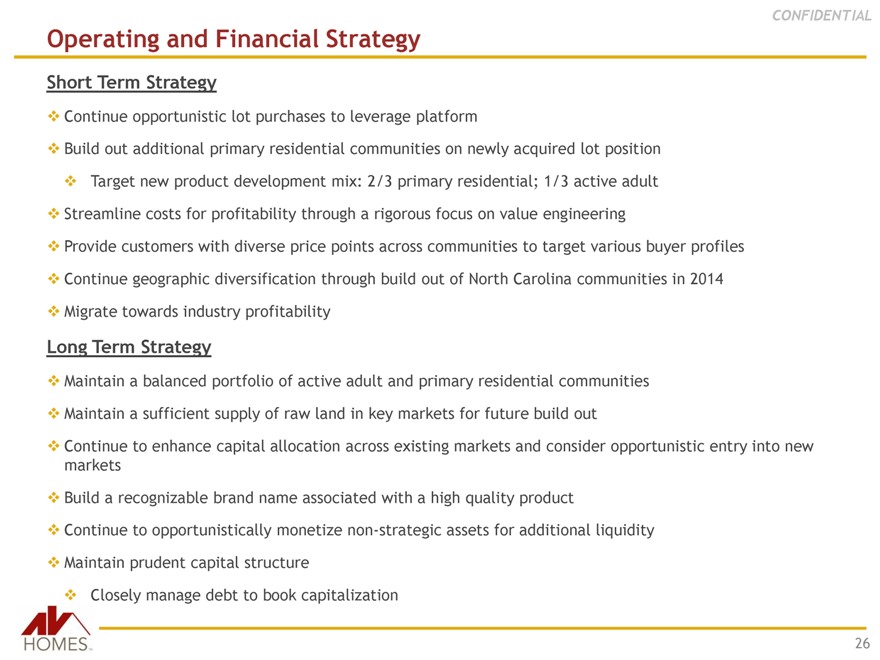
Operating and Financial Strategy
Short Term Strategy
Continue opportunistic lot purchases to leverage platform
Build out additional primary residential communities on newly acquired lot position Target new product development mix: 2/3 primary residential; 1/3 active adult Streamline costs for profitability through a rigorous focus on value engineering
Provide customers with diverse price points across communities to target various buyer profiles Continue geographic diversification through build out of North Carolina communities in 2014 Migrate towards industry profitability
Long Term Strategy
Maintain a balanced portfolio of active adult and primary residential communities Maintain a sufficient supply of raw land in key markets for future build out
Continue to enhance capital allocation across existing markets and consider opportunistic entry into new markets Build a recognizable brand name associated with a high quality product Continue to opportunistically monetize non-strategic assets for additional liquidity Maintain prudent capital structure Closely manage debt to book capitalization
26
Financial Overview
CONFIDENTIAL
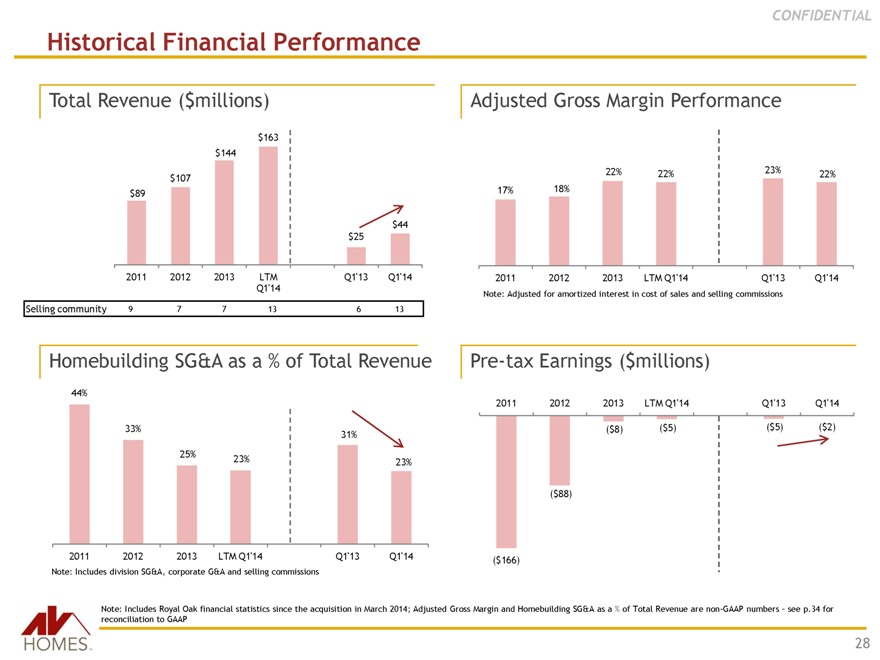
Historical Financial Performance
Total Revenue ($millions)
$163 $144
$107 $89
$44 $25
2011 2012 2013 LTM Q1’13 Q1’14 Q1’14
Adjusted Gross Margin Performance
22% 22% 23% 22% 17% 18%
2011 2012 2013 LTM Q1’14 Q1’13 Q1’14
Note: Adjusted for amortized interest in cost of sales and selling commissions
Selling community 9 7 7 13 6 13
Homebuilding SG&A as a % of Total Revenue
44%
33%
31% 25%
23% 23%
2011 2012 2013 LTM Q1’14 Q1’13 Q1’14
Pre-tax Earnings ($millions)
2011 2012 2013 LTM Q1’14 Q1’13 Q1’14
($8) ($5) ($5) ($2)
($88)
($166)
Note: Includes division SG&A, corporate G&A and selling commissions
Note: Includes Royal Oak financial statistics since the acquisition in March 2014; Adjusted Gross Margin and Homebuilding SG&A as a % of Total Revenue are non-GAAP numbers – see p.34 for reconciliation to GAAP
28
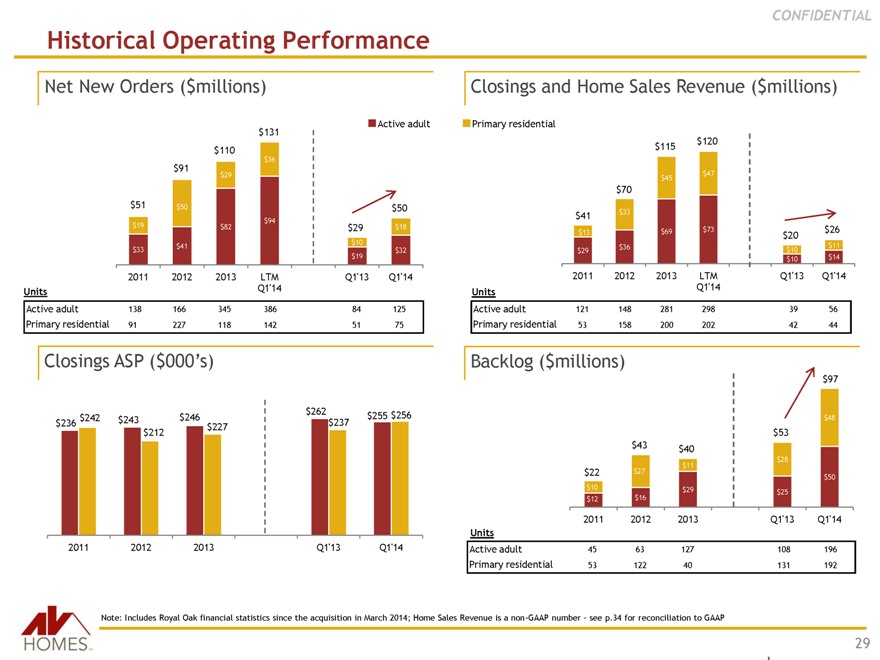
Historical Operating Performance
CONFIDENTIAL
Net New Orders ($millions)
Active adult $131 $110
$91 $36
$29
$51 $50 $50
$94
$19 $82 $29 $18 $10 $41
$33 $19 $32
2011 2012 2013 LTM Q1’13 Q1’14 Q1’14
Units Q1’14
Active adult 138 166 345 386 84 125
Primary residential 91 227 118 142 51 75
Closings and Home Sales Revenue ($millions)
Primary residential $120 $115
$47 $45
$70
$41 $33
$13 $69 $73 $26
$20
$36 $11
$29 $10
$10 $14
2011 2012 2013 LTM Q1’13 Q1’14 Q1’14
Units
Active adult 121 148 281 298 39 56
Primary residential 53 158 200 202 42 44
Closings ASP ($000’s)
$262 $255 $256 $242 $243 $246 $236 $227 $237 $212
2011 2012 2013 Q1’13 Q1’14
Backlog ($millions)
$43 $40
$11
$22 $27
$10 $29
$12 $16
2011 2012 2013
$97
$48
$53
$28
$50 $25
Q1’13 Q1’14
Units
Active adult 45 63 127 108 196
Primary residential 53 122 40 131 192
Note: Includes Royal Oak financial statistics since the acquisition in March 2014; Home Sales Revenue is a non-GAAP number – see p.34 for reconciliation to GAAP
29
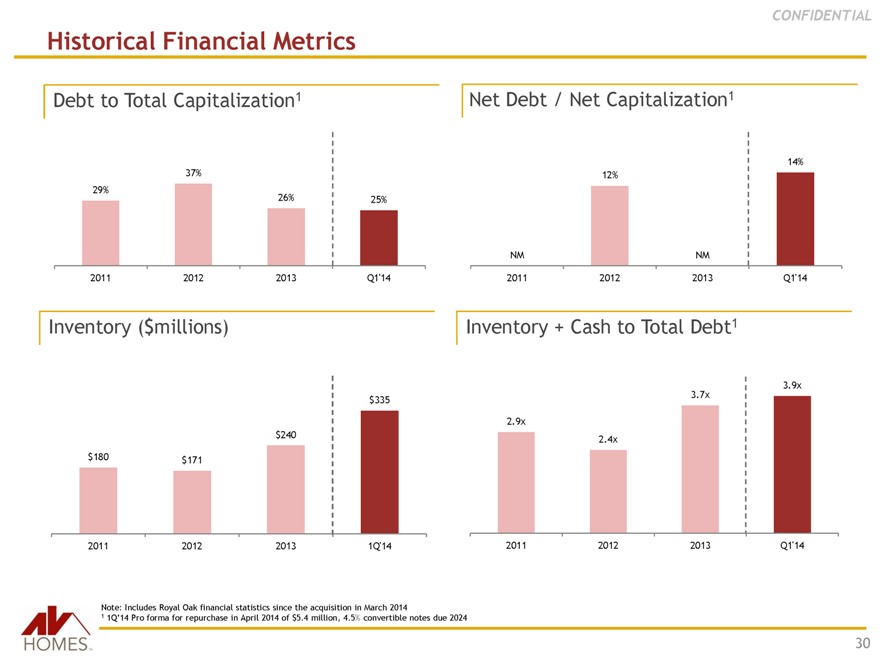
Historical Financial Metrics
CONFIDENTIAL
Debt to Total Capitalization1
37% 29%
26% 25%
2011 2012 2013 Q1’14
Net Debt / Net Capitalization1
14% 12%
NM NM
2011 2012 2013 Q1’14
Inventory ($millions)
$335
$240
$180 $171
2011 2012 2013 1Q’14
Inventory + Cash to Total Debt1
3.7x 3.9x
2.9x
2.4x
2011 2012 2013 Q1’14
Note: Includes Royal Oak financial statistics since the acquisition in March 2014
1 1Q’14 Pro forma for repurchase in April 2014 of $5.4 million, 4.5% convertible notes due 2024
30
AVHI Comparison to Homebuilding Industry
CONFIDENTIAL
Communities
Profitability
Balance Sheet
2013 – 2014: +371%
33
7 7
2012 2013 2014+
2013 – 2014 growth
13%
Industry average1
Adjusted Gross Margin 2
Homebuilding SG&A Margin 2
Adjusted EBITDA Margin2
22% 25% 18%
2012 LTM Q1’14 Industry3 average
33%
23%
12%
2012 LTM Q1’14 Industry 3 average
13.0%
1.0%
(13.0%)
2013 LTM Q1’14 Industry 3 average
Net debt / Net Book Capitalization
14%Q1’14
45%
Industry average 4
Inventory + Cash / Total Debt
3.9x
Q1’14
1.9x
Industry average 4
1 Represents 2013 to 2014 community count growth for PHM, MDC, TOL, TMHC, LEN, RYL, KBH, BZR, WCIC and WLH; 2014 community count sourced from latest guidance
2 Adjusted Gross Margin, Homebuilding SG&A Margin and Adjusted EBITDA Margin are non-GAAP numbers – see p.34 for a reconciliation to GAAP
3 Includes NVR, PHM, MDC, MTH, MHO, DHI, TOL, TMHC, LEN, RYL, SPF, KBH, BZR, WCIC, WLH and HOV; adjusted gross margins defined as homebuilding revenues, less homebuilding cost of sales, adjusted for capitalized interest and selling commissions as relevant; Homebuilding SG&A margin defined as selling, general and administrative expenses (including selling commissions) divided by homebuilding revenue and other revenue (excludes revenue and costs from financial services segment)
4 Includes NVR, PHM, MDC, MTH, MHO, DHI, TOL, TMHC, LEN, RYL, SPF, KBH, BZR, WCIC, WLH and HOV
31
CONFIDENTIAL
Key takeaways
Significant progress in repositioning to become a profitable, diversified builder Well positioned for growth through increased community count, principally on already owned land
Attractively positioned in high growth markets
Maximizing consumer experience and value proposition Experienced management team Committed sponsor with strong industry expertise Attractive capital structure and asset coverage
32
Appendix
Adjusted Gross Margin, Homebuilding SG&A, Adjusted EBITDA and Home Sales Revenue Reconciliation
CONFIDENTIAL
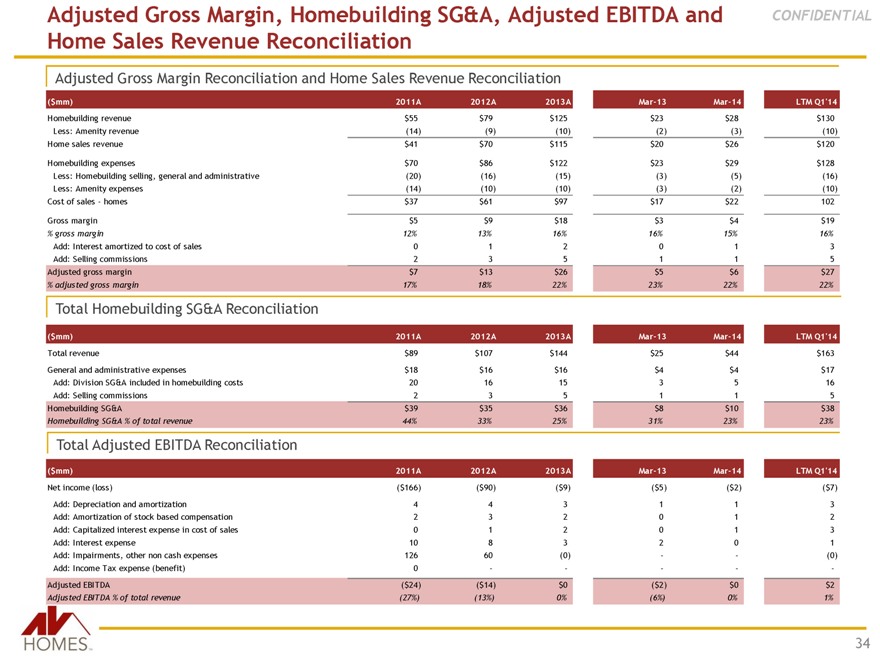
Adjusted Gross Margin Reconciliation and Home Sales Revenue Reconciliation
($mm) 2011A 2012A 2013A Mar-13 Mar-14 LTM Q1’14
Homebuilding revenue $55 $79 $125 $23 $28 $130
Less: Amenity revenue(14)(9)(10)(2)(3)(10)
Home sales revenue $41 $70 $115 $20 $26 $120
Homebuilding expenses $70 $86 $122 $23 $29 $128
Less: Homebuilding selling, general and administrative(20)(16)(15)(3)(5)(16)
Less: Amenity expenses(14)(10)(10)(3)(2)(10)
Cost of sales—homes $37 $61 $97 $17 $22 102
Gross margin $5 $9 $18 $3 $4 $19
% gross margin 12% 13% 16% 16% 15% 16%
Add: Interest amortized to cost of sales 0 1 2 0 1 3
Add: Selling commissions 2 3 5 1 1 5
Adjusted gross margin $7 $13 $26 $5 $6 $27
% adjusted gross margin 17% 18% 22% 23% 22% 22%
Total Homebuilding SG&A Reconciliation
($mm) 2011A 2012A 2013A Mar-13 Mar-14 LTM Q1’14
Total revenue $89 $107 $144 $25 $44 $163
General and administrative expenses $18 $16 $16 $4 $4 $17
Add: Division SG&A included in homebuilding costs 20 16 15 3 5 16
Add: Selling commissions 2 3 5 1 1 5
Homebuilding SG&A $39 $35 $36 $8 $10 $38
Homebuilding SG&A % of total revenue 44% 33% 25% 31% 23% 23%
Total Adjusted EBITDA Reconciliation
($mm) 2011A 2012A 2013A Mar-13 Mar-14 LTM Q1’14
Net income (loss)($166)($90)($9)($5)($2)($7)
Add: Depreciation and amortization 4 4 3 1 1 3
Add: Amortization of stock based compensation 2 3 2 0 1 2
Add: Capitalized interest expense in cost of sales 0 1 2 0 1 3
Add: Interest expense 10 8 3 2 0 1
Add: Impairments, other non cash expenses 126 60(0) —(0)
Add: Income Tax expense (benefit) 0 — — -
Adjusted EBITDA($24)($14) $0($2) $0 $2
Adjusted EBITDA % of total revenue(27%)(13%) 0%(6%) 0% 1%
34
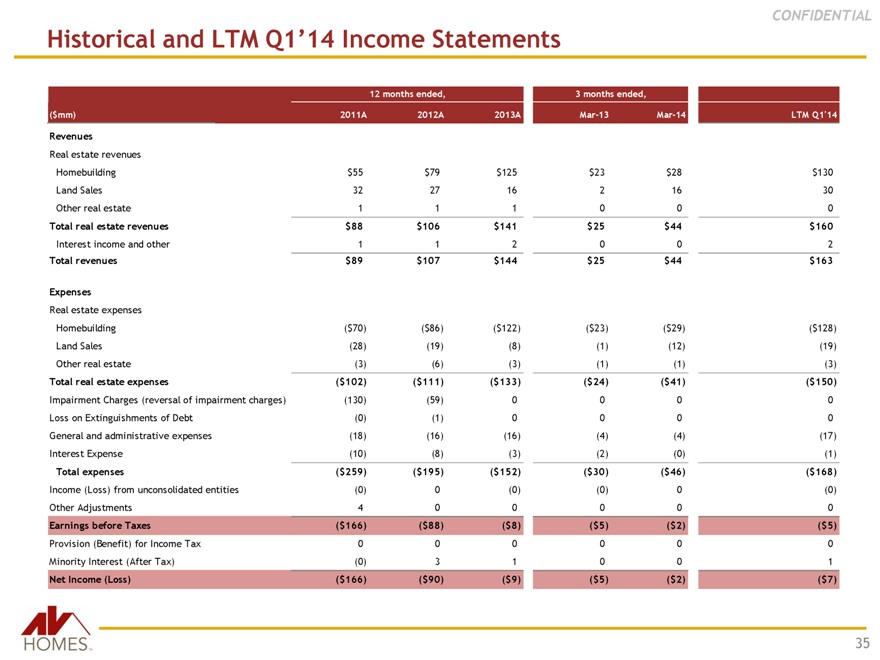
Historical and LTM Q1’14 Income Statements
CONFIDENTIAL
12 months ended, 3 months ended,
($mm) 2011A 2012A 2013A Mar-13 Mar-14 LTM Q1’14
Revenues
Real estate revenues
Homebuilding $55 $79 $125 $23 $28 $130
Land Sales 32 27 16 2 16 30
Other real estate 1 1 1 0 0 0
Total real estate revenues $88 $106 $141 $25 $44 $160
Interest income and other 1 1 2 0 0 2
Total revenues $89 $107 $144 $25 $44 $163
Expenses
Real estate expenses
Homebuilding ($70) ($86) ($122) ($23) ($29) ($128)
Land Sales (28) (19) (8) (1) (12) (19)
Other real estate (3) (6) (3) (1) (1) (3)
Total real estate expenses ($102) ($111) ($133) ($24) ($41) ($150)
Impairment Charges (reversal of impairment charges) (130) (59) 0 0 0 0
Loss on Extinguishments of Debt (0) (1) 0 0 0 0
General and administrative expenses (18) (16) (16) (4) (4) (17)
Interest Expense (10) (8) (3) (2) (0) (1)
Total expenses ($259) ($195) ($152) ($30) ($46) ($168)
Income (Loss) from unconsolidated entities (0) 0 (0) (0) 0 (0)
Other Adjustments 4 0 0 0 0 0
Earnings before Taxes ($166) ($88) ($8) ($5) ($2) ($5)
Provision (Benefit) for Income Tax 0 0 0 0 0 0
Minority Interest (After Tax) (0) 3 1 0 0 1
Net Income (Loss) ($166) ($90) ($9) ($5) ($2) ($7)
35
Historical Balance Sheets
CONFIDENTIAL
($mm) 2011A 2012A 2013A Mar-14
Assets
Cash and Cash Equivalents $124 $80 $145 $57 Restricted Cash 8 5 4 8 Receivables, Net 8 7 4 2 Land Other Inventories 180 171 240 335 Property, Plant and Equipment, Net 38 37 38 38 Investment in Unconsolidated Entities 1 1 1 1 Prepaid Expenses and Other Assets 12 12 11 11 Goodwill — — — 6 Deferred Tax Assets — — — -Assets Held for Sale 30 26 24 12
Total Assets $409 $338 $467 $470 Liabilities
Accounts Payable $3 $5 $10 $13 Accrued and Other Liabilities 10 13 14 14 Deposits and Deferred Revenues 2 2 2 4 Estimated Development Liability 34 33 33 33 Credit Facility — — — -Notes Payable 105 105 105 105 Minority Interest 0 14 16 16
Total Liabilities $155 $172 $181 $185 Equity
Common Stock 14 $13 $22 $22 Additional Paid in Capital 283 262 395 395 Treasury Stock (46) (3) (3) (3) Retained Earnings (Deficit) 3 (106) (127) (129)
Total Equity $254 $166 $286 $285 Total Liabilities and Equity $409 $338 $467 $470
36
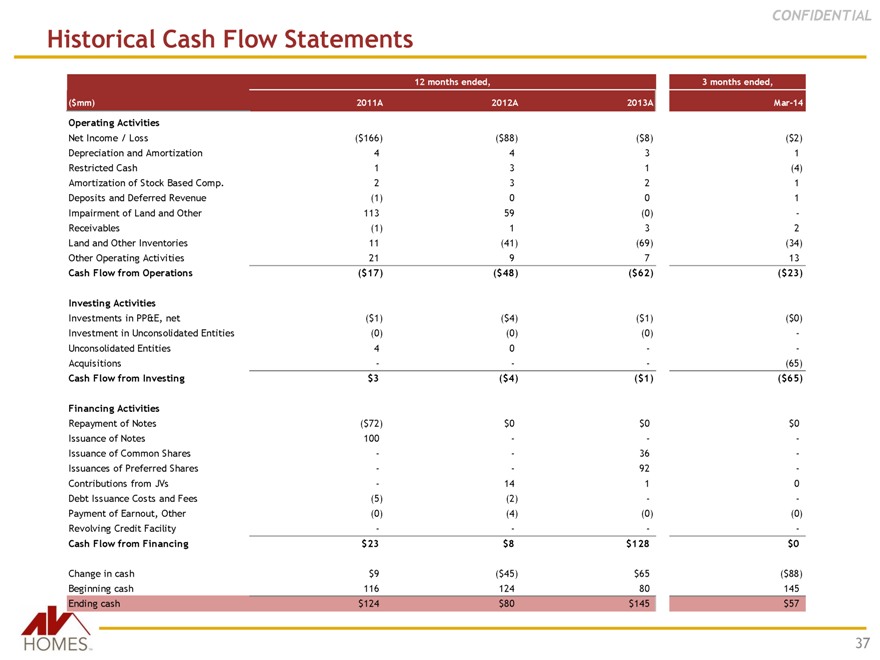
Historical Cash Flow Statements
CONFIDENTIAL
12 months ended, 3 months ended,
($mm) 2011A 2012A 2013A Mar-14
Operating Activities
Net Income / Loss($166)($88)($8)($2)
Depreciation and Amortization 4 4 3 1
Restricted Cash 1 3 1(4)
Amortization of Stock Based Comp. 2 3 2 1
Deposits and Deferred Revenue(1) 0 0 1
Impairment of Land and Other 113 59(0) -
Receivables(1) 1 3 2
Land and Other Inventories 11(41)(69)(34)
Other Operating Activities 21 9 7 13
Cash Flow from Operations($17)($48)($62)($23)
Investing Activities
Investments in PP&E, net($1)($4)($1)($0)
Investment in Unconsolidated Entities(0)(0)(0) -
Unconsolidated Entities 4 0 —
Acquisitions — -(65)
Cash Flow from Investing $3($4)($1)($65)
Financing Activities
Repayment of Notes($72) $0 $0 $0
Issuance of Notes 100 — -
Issuance of Common Shares — 36 -
Issuances of Preferred Shares — 92 -
Contributions from JVs—14 1 0
Debt Issuance Costs and Fees(5)(2) —
Payment of Earnout, Other(0)(4)(0)(0)
Revolving Credit Facility — —
Cash Flow from Financing $23 $8 $128 $0
Change in cash $9($45) $65($88)
Beginning cash 116 124 80 145
Ending cash $124 $80 $145 $57
37
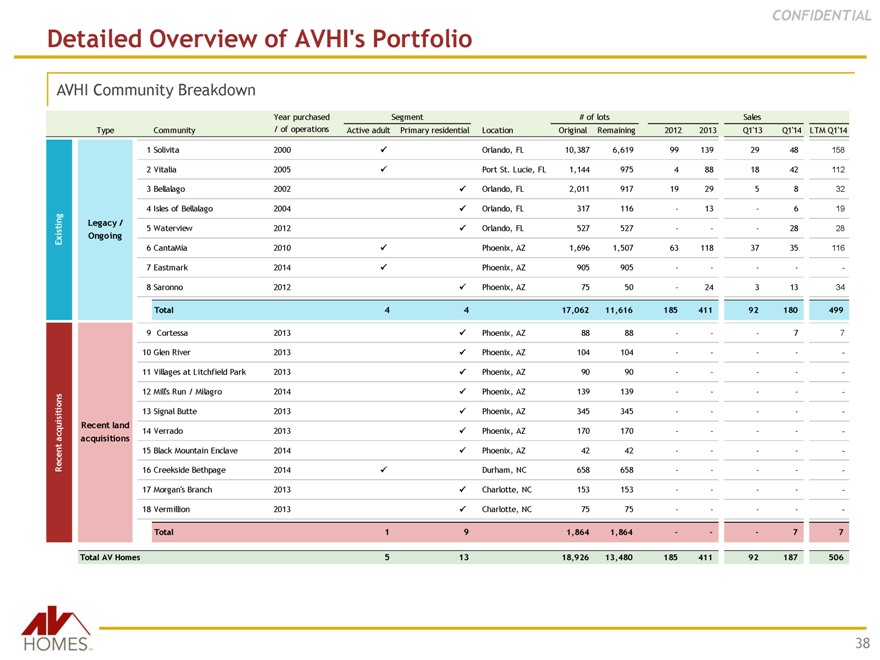
Detailed Overview of AVHI’s Portfolio
CONFIDENTIAL
AVHI Community Breakdown
Year purchased Segment # of lots Sales
Type Community / of operations Active adult Primary residential Location Original Remaining 2012 2013 Q1’13 Q1’14 LTM Q1’14
1 Solivita 2000 Orlando, FL 10,387 6,619 99 139 29 48 158
2 Vitalia 2005 Port St. Lucie, FL 1,144 975 4 88 18 42 112
3 Bellalago 2002 Orlando, FL 2,011 917 19 29 5 8 32
4 Isles of Bellalago 2004 Orlando, FL 317 116—13—6 19
Existing
Legacy / Ongoing
5 Waterview 2012 Orlando, FL 527 527 ——28 28
6 CantaMia 2010 Phoenix, AZ 1,696 1,507 63 118 37 35 116
7 Eastmark 2014 Phoenix, AZ 905 905 — — -
8 Saronno 2012 Phoenix, AZ 75 50—24 3 13 34
Total 4 4 17,062 11,616 185 411 92 180 499
9 Cortessa 2013 Phoenix, AZ 88 88 ——7 7
10 Glen River 2013 Phoenix, AZ 104 104 — — -
11 Villages at Litchfield Park 2013 Phoenix, AZ 90 90 — — -
12 Mill’s Run / Milagro 2014 Phoenix, AZ 139 139 — — -
13 Signal Butte 2013 Phoenix, AZ 345 345 — — -
Recent Acquistions
Recent land acquisitions
14 Verrado 2013 Phoenix, AZ 170 170 — — -
15 Black Mountain Enclave 2014 Phoenix, AZ 42 42 — — -
16 Creekside Bethpage 2014 Durham, NC 658 658 — — -
17 Morgan’s Branch 2013 Charlotte, NC 153 153 — — -
18 Vermillion 2013 Charlotte, NC 75 75 — — -
Total 1 9 1,864 1,864 ——7 7
Total AV Homes 5 13 18,926 13,480 185 411 92 187 506
38
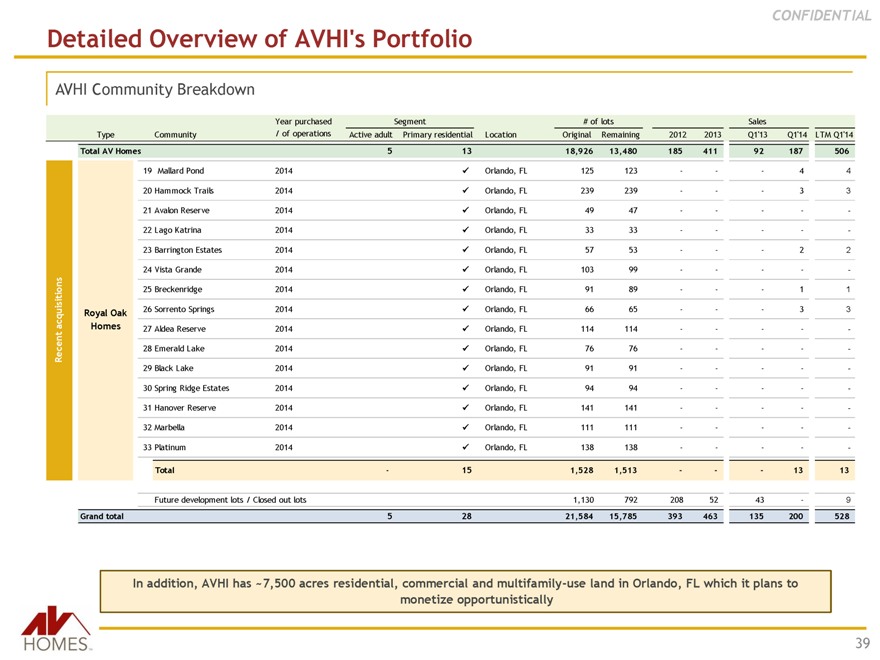
Detailed Overview of AVHI’s Portfolio
CONFIDENTIAL
AVHI Community Breakdown
Year purchased Segment # of lots Sales
Type Community / of operations Active adult Primary residential Location Original Remaining 2012 2013 Q1’13 Q1’14 LTM Q1’14
Total AV Homes 5 13 18,926 13,480 185 411 92 187 506
19 Mallard Pond 2014 Orlando, FL 125 123 ——4 4
20 Hammock Trails 2014 Orlando, FL 239 239 ——3 3
21 Avalon Reserve 2014 Orlando, FL 49 47 — — -
22 Lago Katrina 2014 Orlando, FL 33 33 — — -
23 Barrington Estates 2014 Orlando, FL 57 53 ——2 2
24 Vista Grande 2014 Orlando, FL 103 99 — — -
Recent acquisitions
25 Breckenridge 2014 Orlando, FL 91 89 ——1 1
Royal Oak Homes
26 Sorrento Springs 2014 Orlando, FL 66 65 ——3 3
27 Aldea Reserve 2014 Orlando, FL 114 114 — — -
28 Emerald Lake 2014 Orlando, FL 76 76 — — -
29 Black Lake 2014 Orlando, FL 91 91 — — -
30 Spring Ridge Estates 2014 Orlando, FL 94 94 — — -
31 Hanover Reserve 2014 Orlando, FL 141 141 — — -
32 Marbella 2014 Orlando, FL 111 111 — — -
33 Platinum 2014 Orlando, FL 138 138 — — -
Total—15 1,528 1,513 ——13 13
Future development lots / Closed out lots 1,130 792 208 52 43—9
Grand total 5 28 21,584 15,785 393 463 135 200 528
In addition, AVHI has ~7,500 acres residential, commercial and multifamily-use land in Orlando, FL which it plans to monetize opportunistically
39