Exhibit 99.1
Investor Presentation
September 2015
HOMESTM
CONFIDENTIAL
Disclaimer
Forward-Looking Statements
This Investor Presentation contains “forward-looking statements” within the meaning of the U.S. federal securities laws, which statements may include information regarding the plans, intentions, expectations, future financial performance, or future operating performance of the Company. Forward-looking statements are based on the expectations, estimates, or projections of management as of the date of this Investor Presentation. Although our management believes these expectations, estimates, or projections to be reasonable as the date hereof, forward-looking statements are inherently subject to significant business risks, economic and competitive uncertainties, and other contingencies which could cause our actual results or performance to differ materially from what may be expressed or implied in the forward-looking statements. Such factors include, among others: the cyclical nature of the homebuilding industry and its dependence on broader economic conditions; competition for home buyers, properties, financing, raw materials and skilled labor; overall market supply and demand for new homes; our ability to successfully integrate acquired businesses; conflicts of interest involving our largest stockholder; contractual restrictions under a stockholders agreement with our largest stockholder; our ability to access sufficient capital; our ability to generate sufficient cash to service our indebtedness and potential need for additional financing; terms of our financing documents that may restrict our operations and corporate actions; fluctuations in interest rates; contingent liabilities that may affect our liquidity; the availability of mortgage financing for home buyers; cancellations of home sale orders; declines in home prices in our primary regions; inflation affecting homebuilding costs; elimination or reduction of tax benefits associated with home ownership; warrant and construction defect claims; availability and suitability of undeveloped land and improved lots; ability to develop communities within expected timeframes; the seasonal nature of our business; impacts of weather conditions and natural disasters; our ability to recover our costs in the event of reduced home sales; dependence on our senior management; effect of our expansion efforts on our cash flows and profitability; effects of government regulation of development and homebuilding projects; our ability to realize our deferred income tax asset; costs of environmental compliance; and potential dilution related to future financing activities. Other important factors that could cause our actual results or performance to differ materially from our forward-looking statements include those set forth in the “Risk Factors” section of our Annual Report on Form 10-K for the year ended December 31, 2014, and in our other filings with the Securities and Exchange Commission (the “SEC”), which filings are available on www.sec.gov. Readers are cautioned not to place undue reliance on any forward-looking statements contained herein, which reflect management’s opinions only as of the date hereof. The Company disclaims any intention or obligation to update or revise any forward-looking statements to reflect subsequent events and circumstances, except to the extent required by applicable law.
Incorporation by Reference
This Investor Presentation should be read in conjunction with our filings with the SEC described below, which are hereby “incorporated by reference” into this Investor Presentation. Our SEC filings are available to the public over the Internet at the SEC’s website at www.sec.gov. Some information contained in this Investor Presentation updates the information incorporated by reference, and information that we file subsequently with the SEC will automatically update this Investor Presentation. In other words, in the case of a conflict or inconsistency between information set forth in this Investor Presentation and/or information incorporated by reference into this Investor Presentation, you should rely on the information contained in the most recently dated document.
We incorporate by reference into this Investor Presentation the following documents filed with the SEC (other than, in each case, documents or information deemed furnished and not filed in accordance with the SEC rules, including pursuant to Item 2.02 or Item 7.01 of Form 8 K, and no such information shall be deemed specifically incorporated by reference hereby):
our Annual Report on Form 10-K for the year ended December 31, 2014, filed with the SEC on February 27, 2015;
our Quarterly Reports on Form 10-Q for the quarters ended March 31, 2015 and June 30, 2015, filed with the SEC on April 21, 2015 and July 31, 2015, respectively;
our Current Reports on Form 8-K filed during fiscal 2015; and
All documents filed by us under Sections 13(a), 13(c), 14 or 15(d) of the Securities Exchange Act of 1934, as amended, on or after the date of this Investor Presentation.
*Information in this Investor Presentation is as of June 30, 2015 unless otherwise stated
HOMESTM
2
CONFIDENTIAL
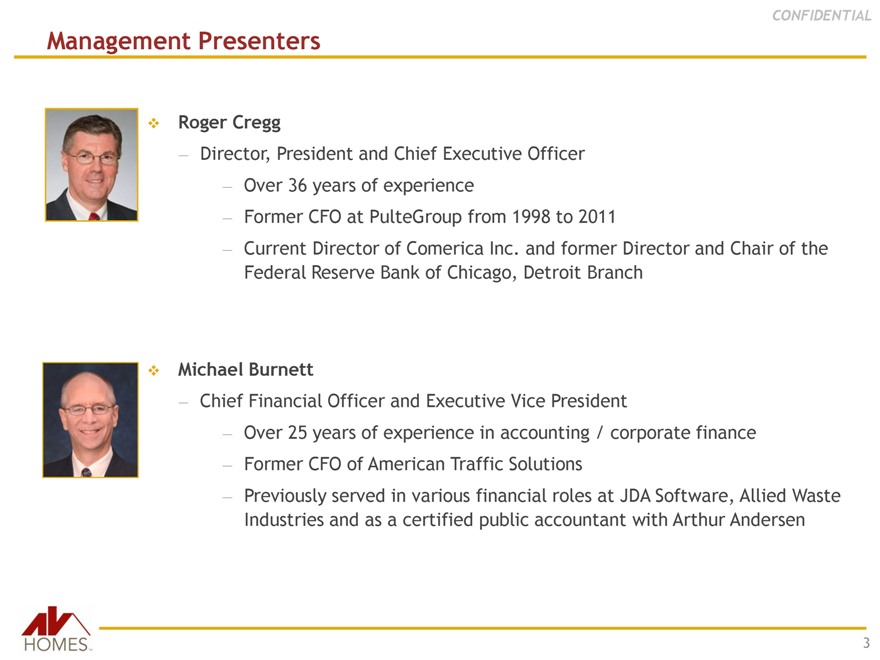
Management Presenters
Roger Cregg
Director, President and Chief Executive Officer
Over 36 years of experience
Former CFO at PulteGroup from 1998 to 2011
Current Director of Comerica Inc. and former Director and Chair of the Federal Reserve Bank of Chicago, Detroit Branch
Michael Burnett
Chief Financial Officer and Executive Vice President
Over 25 years of experience in accounting / corporate finance
Former CFO of American Traffic Solutions
Previously served in various financial roles at JDA Software, Allied Waste Industries and as a certified public accountant with Arthur Andersen
HOMESTM
3
AV Homes Company Update
HOMESTM
CONFIDENTIAL
AV Homes Overview
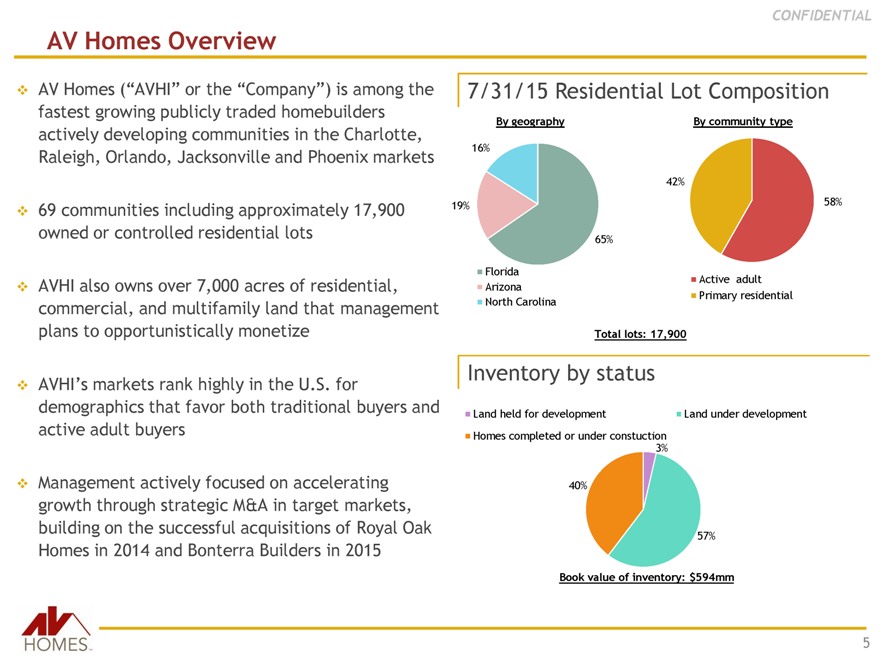
AV Homes (“AVHI” or the “Company”) is among the fastest growing publicly traded homebuilders actively developing communities in the Charlotte, Raleigh, Orlando, Jacksonville and Phoenix markets
69 communities including approximately 17,900 owned or controlled residential lots
AVHI also owns over 7,000 acres of residential, commercial, and multifamily land that management plans to opportunistically monetize
AVHI’s markets rank highly in the U.S. for demographics that favor both traditional buyers and active adult buyers
Management actively focused on accelerating growth through strategic M&A in target markets, building on the successful acquisitions of Royal Oak Homes in 2014 and Bonterra Builders in 2015
7/31/15 Residential Lot Composition
By geography
16%
19%
65%
Florida
Arizona
North Carolina
By community type
42%
58%
Active adult
Primary residential
Total lots: 17,900
Inventory by status
Land held for development
Homes completed or under constuction
Land under development
3%
40%
57%
Book value of inventory: $594mm
HOMESTM
5
CONFIDENTIAL
Attractively Positioned in High Growth Markets
In-Migration
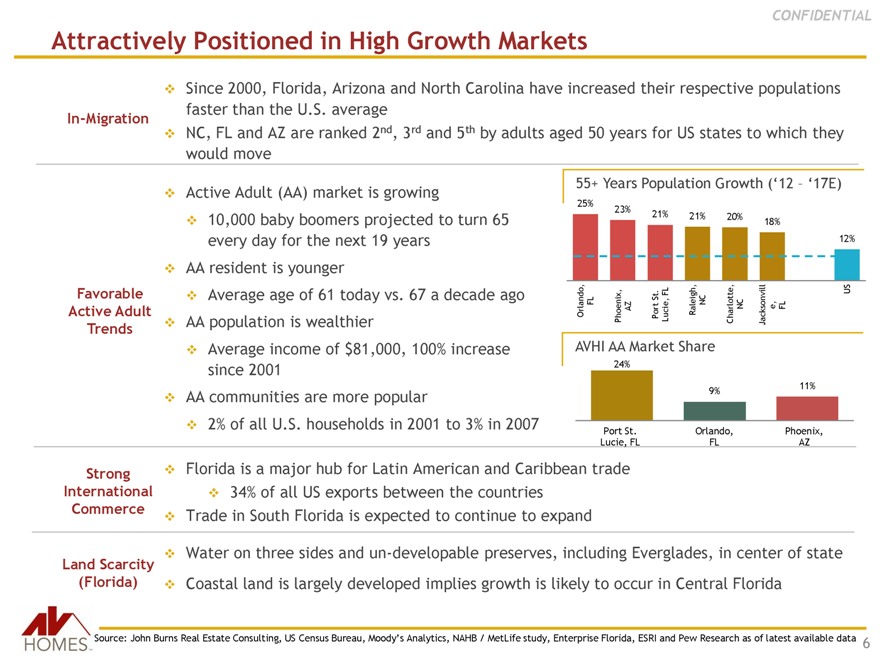
Since 2000, Florida, Arizona and North Carolina have increased their respective populations faster than the U.S. average
NC, FL and AZ are ranked 2nd, 3rd and 5th by adults aged 50 years for US states to which they would move
Favorable
Active Adult
Trends
Active Adult (AA) market is growing
10,000 baby boomers projected to turn 65 every day for the next 19 years
AA resident is younger
Average age of 61 today vs. 67 a decade ago
AA population is wealthier
Average income of $81,000, 100% increase since 2001
AA communities are more popular
2% of all U.S. households in 2001 to 3% in 2007
55+ Years Population Growth (‘12 – ‘17E)
25% 23% 21% 21% 20% 18% 12%
Orlando, FL
Phoenix, AZ
Port St. Lucie, FL
Raleigh, NC
Charlotte, NC
Jacksonville, FL
US
AVHI AA Market Share
24% 11% 9%
Port St. Lucie, FL
Orlando, FL
Phoenix,
AZ
Strong
International
Commerce
Land Scarcity
(Florida)
Florida is a major hub for Latin American and Caribbean trade
34% of all US exports between the countries
Trade in South Florida is expected to continue to expand
Water on three sides and un-developable preserves, including Everglades, in center of state
Coastal land is largely developed implies growth is likely to occur in Central Florida
Source: John Burns Real Estate Consulting, US Census Bureau, Moody’s Analytics, NAHB / MetLife study, Enterprise Florida, ESRI and Pew Research as of latest available data
HOMESTM
6
CONFIDENTIAL
Maximizing Consumer Experience and Value Proposition
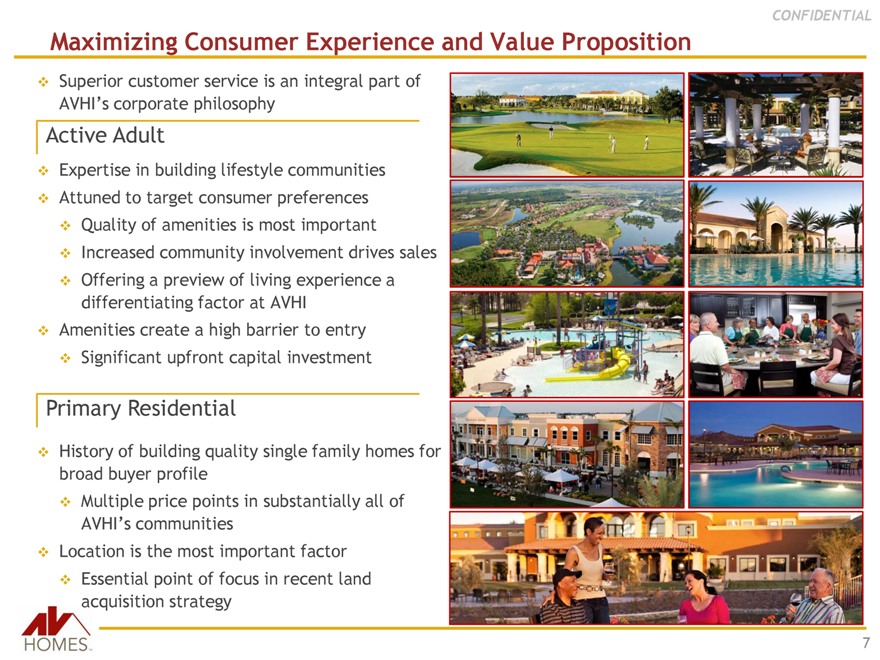
Superior customer service is an integral part of AVHI’s corporate philosophy
Active Adult
Expertise in building lifestyle communities
Attuned to target consumer preferences
Quality of amenities is most important
Increased community involvement drives sales
Offering a preview of living experience a differentiating factor at AVHI
Amenities create a high barrier to entry
Significant upfront capital investment
Primary Residential
History of building quality single family homes for broad buyer profile
Multiple price points in substantially all of AVHI’s communities
Location is the most important factor
Essential point of focus in recent land acquisition strategy
HOMESTM
7
CONFIDENTIAL
Investment Thesis
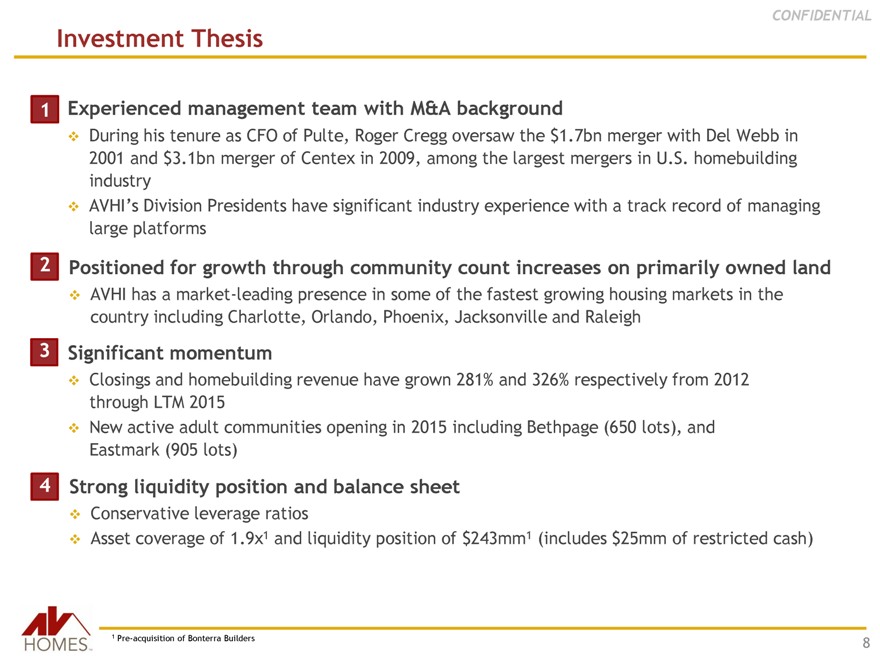
1 Experienced management team with M&A background
During his tenure as CFO of Pulte, Roger Cregg oversaw the $1.7bn merger with Del Webb in 2001 and $3.1bn merger of Centex in 2009, among the largest mergers in U.S. homebuilding industry
AVHI’s Division Presidents have significant industry experience with a track record of managing large platforms
2 Positioned for growth through community count increases on primarily owned land
AVHI has a market-leading presence in some of the fastest growing housing markets in the country including Charlotte, Orlando, Phoenix, Jacksonville and Raleigh
3 Significant momentum
Closings and homebuilding revenue have grown 281% and 326% respectively from 2012 through LTM 2015
New active adult communities opening in 2015 including Bethpage (650 lots), and Eastmark (905 lots)
4 Strong liquidity position and balance sheet
Conservative leverage ratios
Asset coverage of 1.9x1 and liquidity position of $243mm1 (includes $25mm of restricted cash)
1 Pre-acquisition of Bonterra Builders
HOMESTM
8
CONFIDENTIAL
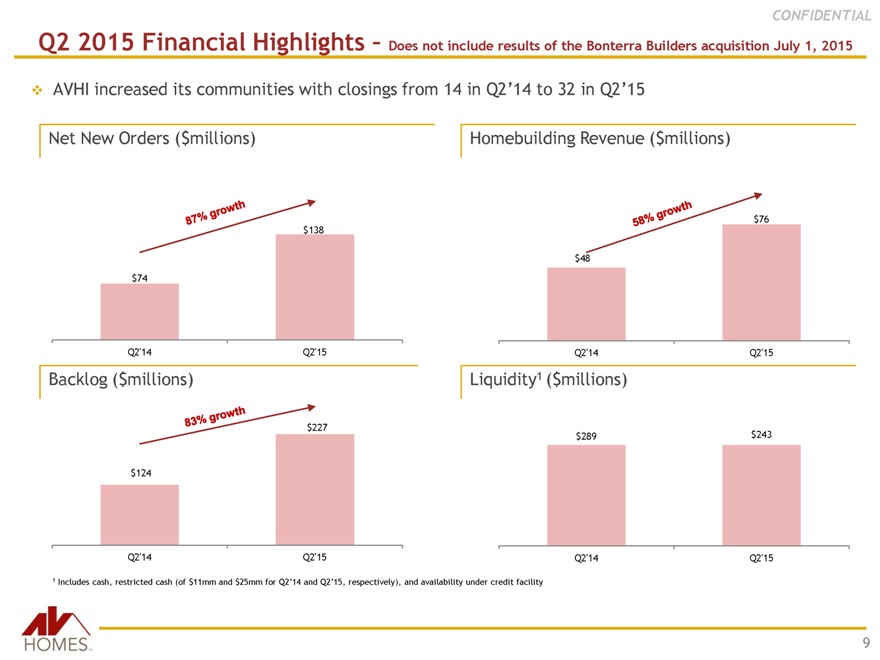
Q2 2015 Financial Highlights – Does not include results of the Bonterra Builders acquisition July 1, 2015
AVHI increased its communities with closings from 14 in Q2’14 to 32 in Q2’15
Net New Orders ($millions)
87% growth
$74
$138
Q2’14
Q2’15
Backlog ($millions)
83% growth
$124
$227
Q2’14
Q2’15
Homebuilding Revenue ($millions)
58% growth
$48
$76
Q2’14
Q2’15
Liquidity1 ($millions)
$289
$243
Q2’14
Q2’15
1 Includes cash, restricted cash (of $11mm and $25mm for Q2’14 and Q2’15, respectively), and availability under credit facility
HOMESTM
9
CONFIDENTIAL
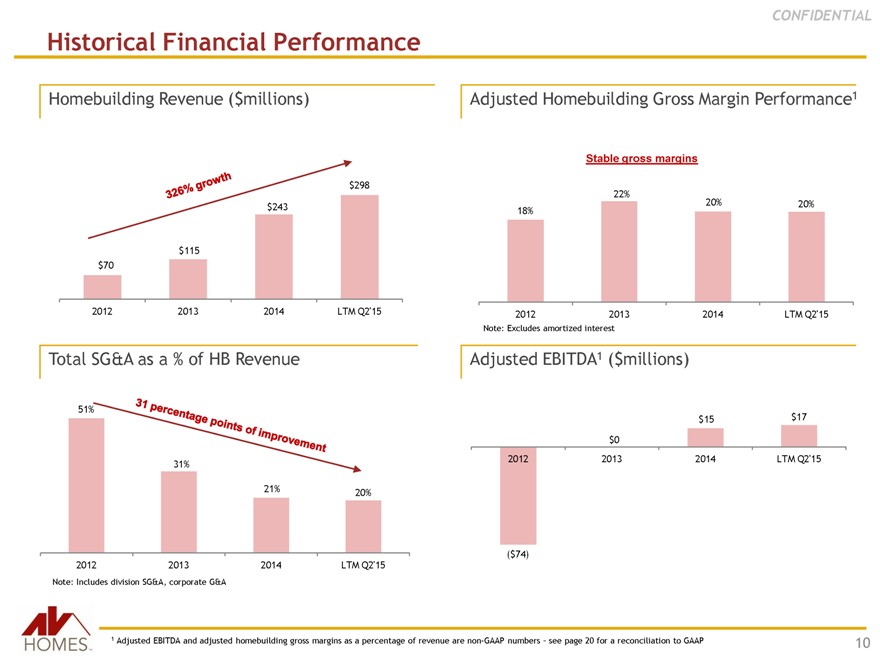
Historical Financial Performance
Homebuilding Revenue ($millions)
326% growth
$70
$115
$243
$298
2012
2013
2014
LTM Q2’15
Total SG&A as a % of HB Revenue
31 percentage points of improvement
51%
31%
21%
20%
2012
2013
2014
LTM Q2’15
Note: Includes division SG&A, corporate G&A
Adjusted Homebuilding Gross Margin Performance1
Stable gross margins
18%
22%
20%
20%
2012
2013
2014
LTM Q2’15
Note: Excludes amortized interest
Adjusted EBITDA1 ($millions)
$0
$15
$17
2012
2013
2014
LTM Q2’15
($74)
1 Adjusted EBITDA and adjusted homebuilding gross margins as a percentage of revenue are non-GAAP numbers – see page 20 for a reconciliation to GAAP
HOMESTM
10
CONFIDENTIAL
AVHI 2015 Full Year Outlook Reaffirmed1
Communities with closings to increase from 24 in 2014 to approximately 40 in 2015
Closings to increase approximately 68% from 953 units in 2014 to approximately 1,600 units in 2015
ASP on homes closed to increase approximately 6.5% to approximately $272,000 in 2015
Homebuilding Gross Margins to be approximately 17% in 2015 (18.2% in 2014)
Division SG&A to improve to approximately 11.5% of homebuilding revenue in 2015 (14.1% in 2014)
Corporate G&A to improve to approximately 3% of homebuilding revenue in 2015, from 6.6% in 2014
Land Sales to generate approximately $6 million of revenue and approximately $4 million of profit in 2015
Interest expense is expected to be approximately $10 million, after capitalization in 2015
Net income is expected to be approximately $4 million in 2015 compared to a loss of $2 million in 2014
1Guidance does not include impact of the acquisition of Bonterra and, as a result, may be considered non-GAAP because it does not include future results of Bonterra
HOMESTM
11
CONFIDENTIAL
Bonterra Builders Acquisition
HOMESTM
CONFIDENTIAL
Bonterra Builders Overview
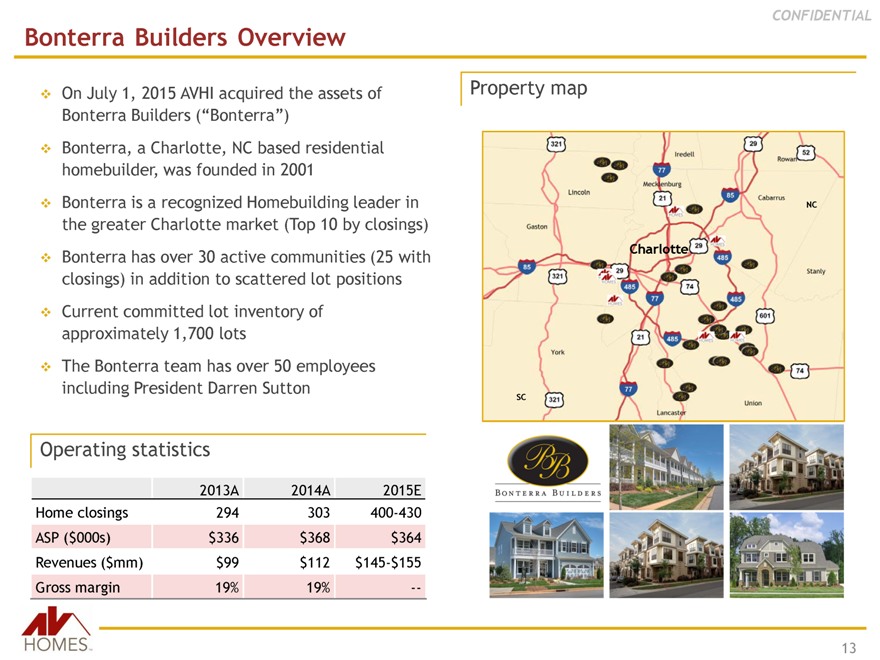
On July 1, 2015 AVHI acquired the assets of Bonterra Builders (“Bonterra”)
Bonterra, a Charlotte, NC based residential homebuilder, was founded in 2001
Bonterra is a recognized Homebuilding leader in the greater Charlotte market (Top 10 by closings)
Bonterra has over 30 active communities (25 with closings) in addition to scattered lot positions
Current committed lot inventory of approximately 1,700 lots
The Bonterra team has over 50 employees including President Darren Sutton
Operating statistics
2013A 2014A 2015E
Home closings 294 303 400-430
ASP ($000s) $336 $368 $364
Revenues ($mm) $99 $112 $145-$155
Gross margin 19% 19% --
Property map
321
29
52
Iredell
Rowan
77
Lincoln
Mecklenburg
21
85
Cabarrus
NC
Gaston
Charlotte
29
485
85
321
29
74
Stanly
485
77
485
601
21
485
York
74
77
SC
321
Lancaster
Union
BB
BONTERRA BUILDERS
HOMESTM
13
CONFIDENTIAL
Strategic Rationale
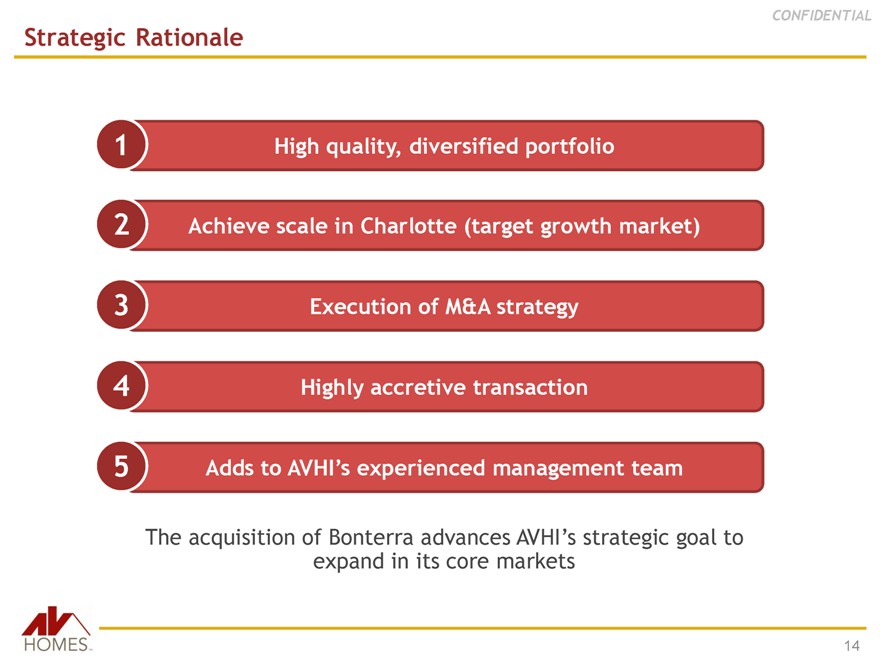
1 High quality, diversified portfolio
2 Achieve scale in Charlotte (target growth market)
3 Execution of M&A strategy
4 Highly accretive transaction
5 Adds to AVHI’s experienced management team
The acquisition of Bonterra advances AVHI’s strategic goal to expand in its core markets
HOMESTM
14
CONFIDENTIAL
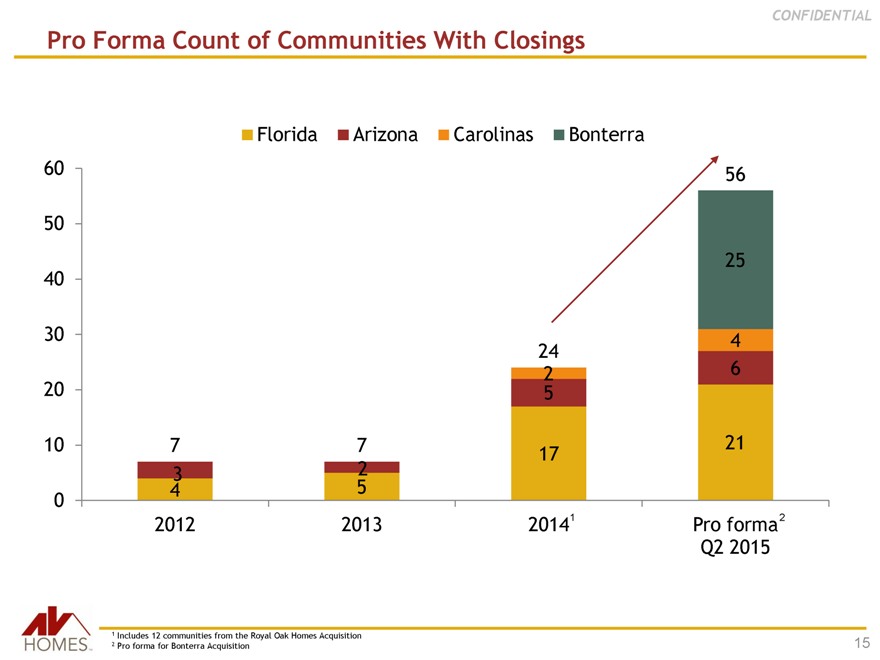
Pro Forma Count of Communities With Closings
Florida
Arizona
Carolinas
Bonterra
60
50
40
30
20
10
0
56
25
4
24
2
6
5
7
7
17
21
3
2
4
5
2012
2013
2014 1
Pro forma 2
Q2 2015
1 Includes 12 communities from the Royal Oak Homes Acquisition
2 Pro forma for Bonterra Acquisition
HOMESTM
15
CONFIDENTIAL
Charlotte Market Overview
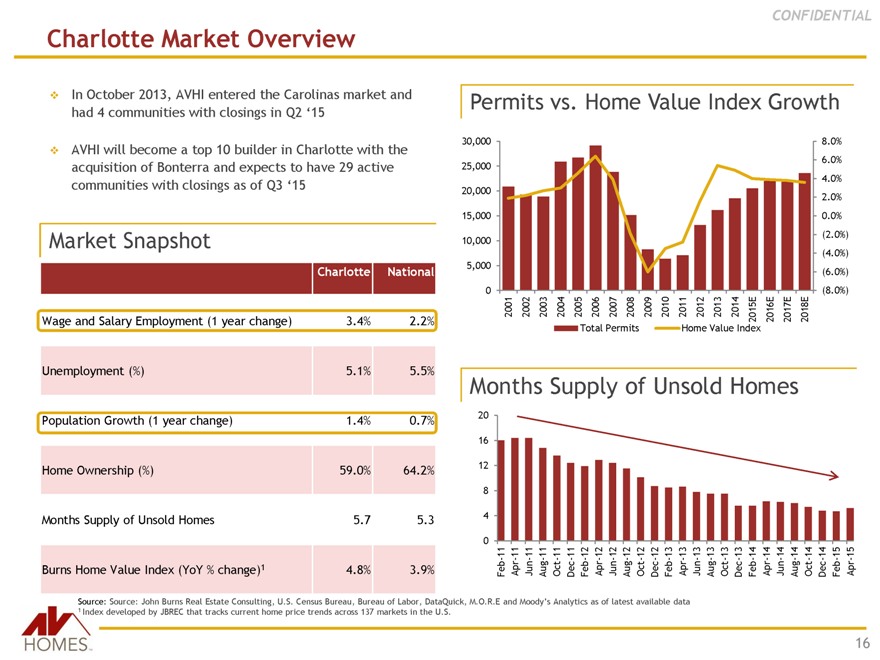
In October 2013, AVHI entered the Carolinas market and had 4 communities with closings in Q2 ‘15
AVHI will become a top 10 builder in Charlotte with the acquisition of Bonterra and expects to have 29 active communities with closings as of Q3 ‘15
Market Snapshot
Charlotte National
Wage and Salary Employment (1 year change) 3.4% 2.2%
Unemployment (%) 5.1% 5.5%
Population Growth (1 year change) 1.4% 0.7%
Home Ownership (%) 59.0% 64.2%
Months Supply of Unsold Homes 5.7 5.3
Burns Home Value Index (YoY % change)1 4.8% 3.9%
Permits vs. Home Value Index Growth
30,000
25,000
20,000
15,000
10,000
5,000
0
8.0%
6.0%
4.0%
2.0%
0.0%
(2.0%)
(4.0%)
(6.0%)
(8.0%)
2001
2002
2003
2004
2005
2006
2007
2008
2009
2010
2011
2012
2013
2014
2015E
2016E
2017E
2018E
Total Permits
Home Value Index
Months Supply of Unsold Homes
20
16
12
8
4
0
Feb-11 Apr-11 Jun-11 Aug-11 Oct-11 Dec-11 Feb-12 Apr-12 Jun-12 Aug-12
Oct-12 Dec-12 Feb-13 Apr-13 Jun-13 Aug-13 Oct-13 Dec-13 Feb-14 Apr-14 Jun-14 Aug-14 Oct-14 Dec-14 Feb-15 Apr-15
Source: Source: John Burns Real Estate Consulting, U.S. Census Bureau, Bureau of Labor, DataQuick, M.O.R.E and Moody’s Analytics as of latest available data
1 Index developed by JBREC that tracks current home price trends across 137 markets in the U.S.
HOMESTM
16

CONFIDENTIAL
Execution of M&A Strategy
Builder
NEXT
100
THE
FASTEST-GROWING
BULDER 2014 *
By Builder Magazine
1 Royal Oak Homes 176% Closed March 2014
2 Bonterra Builders, LLC 99% Closed July 2015
3 Anglia Homes, LP 86%
4 Streetman Homes, Ltd. LLP 79%
AVHI has acquired two of the fastest growing homebuilders within an 18 month time frame
Charlotte, North Carolina Homebuilder Acquisition
BB
BONTERRA BUILDERS
Central Florida Homebuilder Acquisition
ROYAL
OAK
HOMES
* Builders Magazine’s “Next 100 List” ranks the Country’s top 101 to 200 building firms by sales volume. This ranking was based on year over year closing growth from 2012 to 2013.
HOMESTM
17
CONFIDENTIAL
Conclusion
AVHI is among the fastest growing homebuilders in US
Positioned for further growth and profitability
Attractive markets
Commitment to quality product and service
Experienced management team
We believe the acquisition of Bonterra
Increases our scale and market share in Charlotte
Improves our geographic and customer segment diversification
Increases exposure to primary residential market
Accelerates potential monetization of deferred tax assets
Solidifies AVHI’s position as a leading homebuilder
HOMESTM
18
Non-GAAP reconciliations
HOMESTM
CONFIDENTIAL
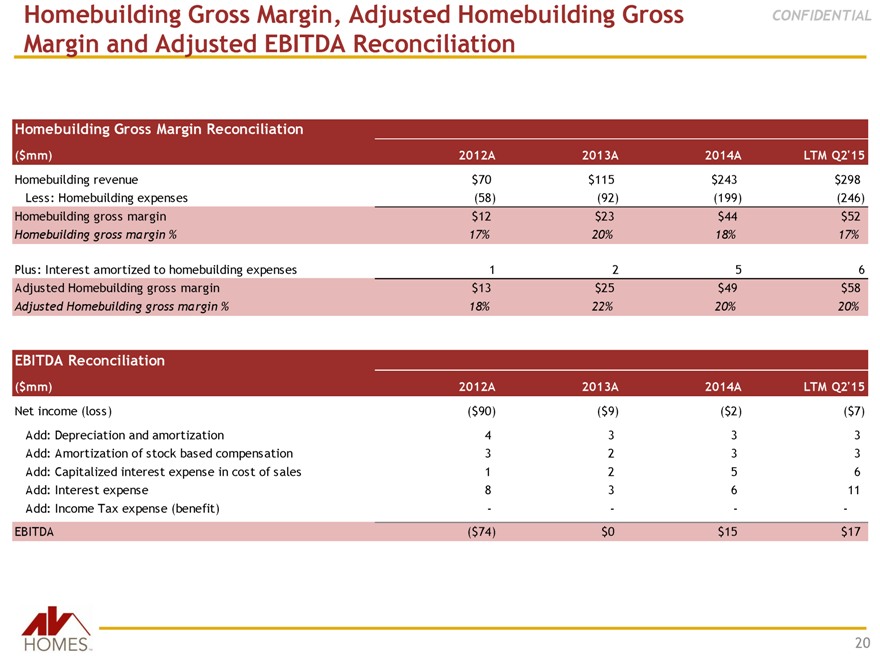
Homebuilding Gross Margin, Adjusted Homebuilding Gross
Margin and Adjusted EBITDA Reconciliation
Homebuilding Gross Margin Reconciliation
($ mm) 2012A 2013A 2014A LTM Q2’15
Homebuilding revenue $70 $115 $243 $298
Less: Homebuilding expenses (58) (92) (199) (246)
Homebuilding gross margin $12 $23 $44 $52
Homebuilding gross margin % 17% 20% 18% 17%
Plus: Interest amortized to homebuilding expenses 1 2 5 6
Adjusted Homebuilding gross margin $13 $25 $49 $58
Adjusted Homebuilding gross margin % 18% 22% 20% 20%
EBITDA Reconciliation
($ mm) 2012A 2013A 2014A LTM Q2’15
Net income (loss) ($90) ($9) ($2) ($7)
Add: Depreciation and amortization 4 3 3 3
Add: Amortization of stock based compensation 3 2 3 3
Add: Capitalized interest expense in cost of sales 1 2 5 6
Add: Interest expense 8 3 6 11
Add: Income Tax expense (benefit) - - - -
EBITDA ($74) $0 $15 $17
HOMESTM
20