ITEM 7. MANAGEMENT'S DISCUSSION AND ANALYSIS OF FINANCIAL CONDITION AND RESULTS OF OPERATIONS
The following discussion and analysis of our financial condition and results of operations should be read in conjunction with Item 6, Selected Financial Data, and the audited consolidated financial statements and accompanying notes included elsewhere in this Annual Report.
Overview
We are engaged in the business of homebuilding and community development in Florida, Arizona and the Carolinas. We also engage to a limited degree in other real estate activities, such as the operation of amenities and the sale of land for third-party development. We manage our business through three reportable segments: Florida, Arizona and the Carolinas.
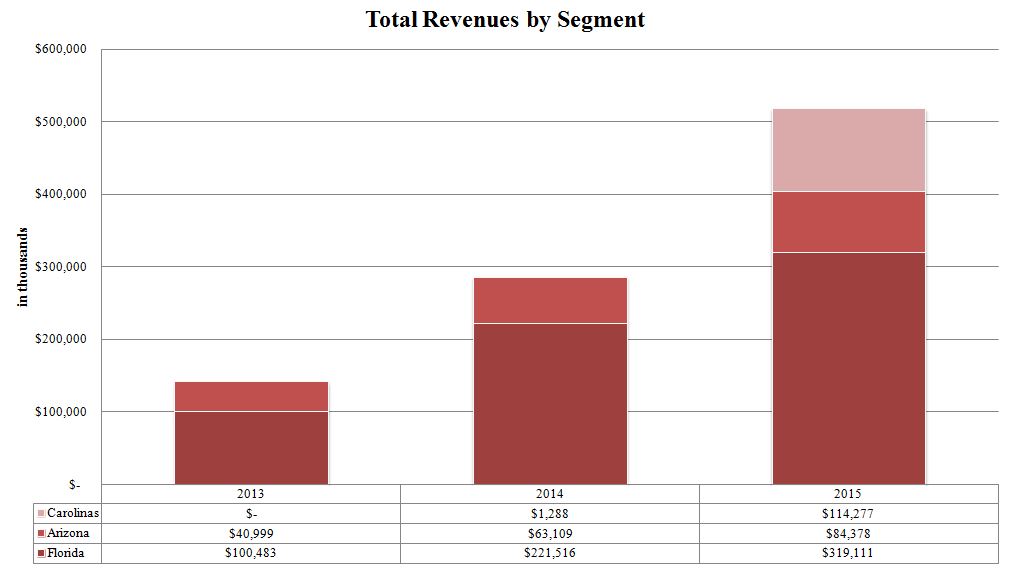
For the year ended December 31, 2015, we derived 62% of our revenues from Florida, 16% of our revenues from Arizona, and 22% of our revenues from the Carolinas. The following is a summary of our revenues by segment for the years ended December 31, 2015, 2014 and 2013.
Our primary business is the development of land and the construction and sale of homes for people of all ages, including active adults (55 years and older). Our current homebuilding sales activities include locations in Florida, Arizona and the Carolinas, with additional communities in the pipeline for each state. Within each geographical segment, we build both active adult communities, which are restricted to homeowners that are age 55 and older, and primary residential communities, which are open to all ages. This geographic and product segment diversification helps mitigate our overall business risks. We generate a smaller portion of our revenues from the sale of land from our portfolio of legacy land holdings that we will sell in favorable market conditions. While we have in the past acquired land with the intention to resell to developers and other third parties, we now purchase land for the purpose of developing communities. We also opportunistically sell existing non-core commercial and industrial land assets, as well as scattered lot positions and land assets, that are in excess of our needed supply in a given market.
As of December 31, 2015, our selling community count includes 62 locations, 26 in Florida, 10 in Arizona, and 26 in the Carolinas, with additional communities in the pipeline for each region. Our count of communities with closings includes 57 locations, 24 in Florida, eight in Arizona, and 25 in the Carolinas.
Solivita and Vitalia, our active adult communities in Central Florida; CantaMia and Encore in Arizona; and Creekside at Bethpage in Raleigh, North Carolina currently serve as our flagship communities in the active adult segment. These
communities broaden our geographic footprint and product offering, and should provide us with market participation in the longer term growth of demand from the wave of Baby Boomers entering their retirement years.
We continue to invest in the primary residential market to create a more diversified portfolio that mitigates cyclical impact over time. Through homebuilder acquisitions and by acquiring new land and lot positions, we have and continue to expand within our existing markets in Central Florida, Charlotte and the greater Phoenix area. We have also expanded into the Jacksonville, Florida market through the acquisition and development of land and lot positions in that market. Replacement lot positions require new acquisitions of developed lots or platted or unplatted undeveloped land, or we may decide to develop current land holdings, depending on market conditions within the submarket of these assets.
2015 Highlights
During 2015, we continued to execute our strategic and operational business plan through (i) the acquisition of Bonterra Builders, (ii) the continued deployment of existing capital into land and lot acquisitions, (iii) the development of existing land and lot positions, in addition to the construction of homes for sale, (iv) the increase in the number of homes sold and closed, and (v) the profitable sale of non-core asset positions.
The following table provides a comparison of certain financial data related to our operations in each of our geographic segments (in thousands):
| | | | | | | | | | |
| | For the Year Ended | |
| | 2015 | | 2014 | | 2013 | |
Operating income (loss): | | | | | | | | | | |
Florida | | | | | | | | | | |
Revenues: | | | | | | | | | | |
Homebuilding | | $ | 300,260 | | $ | 193,218 | | $ | 81,440 | |
Amenity and other | | | 12,385 | | | 10,140 | | | 9,786 | |
Land sales | | | 6,466 | | | 18,158 | | | 9,257 | |
Total revenues | | $ | 319,111 | | $ | 221,516 | | $ | 100,483 | |
Expenses: | | | | | | | | | | |
Homebuilding cost of revenues | | | 239,001 | | | 156,439 | | | 64,726 | |
Homebuilding selling, general and administrative | | | 38,500 | | | 24,388 | | | 14,004 | |
Amenity and other | | | 10,587 | | | 10,524 | | | 11,663 | |
Land sales | | | 823 | | | 10,316 | | | 5,369 | |
Segment operating income | | $ | 30,200 | | $ | 19,849 | | $ | 4,721 | |
| | | | | | | | | | |
Arizona | | | | | | | | | | |
Revenues: | | | | | | | | | | |
Homebuilding | | $ | 84,378 | | $ | 48,665 | | $ | 33,533 | |
Amenity and other | | | — | | | 6 | | | 420 | |
Land sales | | | — | | | 14,438 | | | 7,046 | |
Total revenues | | | 84,378 | | | 63,109 | | | 40,999 | |
Expenses: | | | | | | | | | | |
Homebuilding cost of revenues | | | 71,305 | | | 41,261 | | | 27,073 | |
Homebuilding selling, general and administrative | | | 11,981 | | | 7,747 | | | 5,561 | |
Amenity and other | | | 115 | | | 425 | | | 2,110 | |
Land sales | | | — | | | 11,688 | | | 2,744 | |
Segment operating income | | $ | 977 | | $ | 1,988 | | $ | 3,511 | |
| | | | | | | | | | |
Carolinas | | | | | | | | | | |
Revenues: | | | | | | | | | | |
Homebuilding | | $ | 114,277 | | $ | 1,288 | | $ | — | |
Total revenues | | | 114,277 | | | 1,288 | | | — | |
Expenses: | | | | | | | | | | |
Homebuilding cost of revenues | | | 95,232 | | | 1,183 | | | — | |
Homebuilding selling, general and administrative | | | 12,205 | | | 2,230 | | | 97 | |
Segment operating income (loss) | | $ | 6,840 | | $ | (2,125) | | $ | (97) | |
| | | | | | | | | | |
Operating income | | $ | 38,017 | | $ | 19,712 | | $ | 8,135 | |
| | | | | | | | | | |
Unallocated income (expenses): | | | | | | | | | | |
Interest income and other | | | 154 | | | 447 | | | 2,499 | |
Equity in earnings (loss) from unconsolidated entities | | | 154 | | | (16) | | | (101) | |
Corporate general and administrative expenses | | | (16,900) | | | (15,941) | | | (15,975) | |
Interest expense | | | (9,039) | | | (5,805) | | | (2,830) | |
Income (loss) before income taxes | | | 12,386 | | | (1,603) | | | (8,272) | |
Income tax expense | | | (436) | | | — | | | — | |
Net income attributable to non-controlling interests | | | — | | | 329 | | | 1,205 | |
Net income (loss) attributable to AV Homes | | $ | 11,950 | | $ | (1,932) | | $ | (9,477) | |
Data from closings for the Florida, Arizona and the Carolinas segments for the years ended December 31, 2015, 2014 and 2013 is summarized as follows (dollars in thousands):
| | | | | | | | | |
| | | | | | | Average | |
| | Number | | | | | Price | |
Years Ended December 31, | | of Units | | Revenues | | Per Unit | |
2015 | | | | | | | | | |
Florida | | 1,124 | | $ | 300,260 | | $ | 267 | |
Arizona | | 298 | | | 84,378 | | | 283 | |
Carolinas | | 328 | | | 114,277 | | | 348 | |
Total | | 1,750 | | $ | 498,915 | | | 285 | |
| | | | | | | | | |
2014 | | | | | | | | | |
Florida | | 755 | | $ | 193,218 | | $ | 256 | |
Arizona | | 193 | | | 48,665 | | | 252 | |
Carolinas | | 5 | | | 1,288 | | | 258 | |
Total | | 953 | | $ | 243,171 | | | 255 | |
| | | | | | | | | |
2013 | | | | | | | | | |
Florida | | 349 | | $ | 81,440 | | $ | 233 | |
Arizona | | 132 | | | 33,533 | | | 254 | |
Carolinas | | — | | | — | | | — | |
Total | | 481 | | $ | 114,973 | | | 239 | |
Fiscal Year 2015 Compared to Fiscal Year 2014
Selling, general and administrative expenses related to homebuilding previously included in Homebuilding expenses have been combined with corporate general and administrative expenses and reclassified into a separate new line item called "Selling, general and administrative expenses" to enhance the visibility to our core homebuilding operations and conform with standard industry presentation. The selling, general and administrative expenses reclassified include commissions, other selling expenses and overhead incurred at the divisional level. For the years ended December 31, 2015, 2014 and 2013, selling, general and administrative costs of $62.7 million, $34.4 million, and $19.7 million, that were previously presented in Homebuilding expenses are now included in Selling, general and administrative expenses. In addition, in accordance with adoption of Accounting Standards Update No. 2015-03, Interest-Imputation of Interest, our debt issuance costs are now presented as a deduction from the corresponding debt liability. This guidance was applied retrospectively and had the effect of reducing our Prepaid expenses and other assets and Senior notes, net balances in our consolidated balance sheets. As of December 31, 2015 and 2014, unamortized deferred debt issuance costs of $5.9 million and $5.7 million, respectively were previously presented in Prepaid expenses and other assets on the consolidated balance sheet and are now included as a reduction to Senior notes, net.
Consolidated Results
Overall revenue increased by $231.9 million or 81.1% to $517.8 million during the year ended December 31, 2015 compared to the year ended December 31, 2014. Homebuilding revenue increased by $255.7 million or 105.2% to $498.9 million and amenity and other revenue increased by $2.2 million or 22.1% to $12.4 million compared to the year ended December 31, 2014. The increase in homebuilding and amenity and other revenue was driven by an 83.6% increase in units closed and an 11.7% increase in the average sales price for homes closed. Revenue from land sales decreased by $26.1 million or 80.2% during the year ended December 31, 2015 compared to the year ended December 31, 2014. This decrease is primarily due to large non-recurring sales of non-core assets in Florida and Arizona in 2014. Land sales are highly variable from quarter to quarter and large fluctuations may occur.
Homebuilding Operations
Homebuilding revenue increased 105.2% from $243.2 million to $498.9 million for the year ended December 31, 2015 compared to the same period in 2014 due to an 83.6% increase in closings and an 11.7% increase in average sales price for homes closed. In the Florida segment, revenues increased $107.0 million or 55.4% for the year ended December 31, 2015 compared to the same period in 2014 driven by a 48.9% increase in units closed due to an increase in the number of communities in which we had closings from 17 to 24. In the Arizona segment, revenues increased $35.7 million or 73.4% for the year ended December 31, 2015 compared to the same period in 2014 driven by a 54.4% increase in units closed due to an increase in the number of communities in which we had closings from five to eight. In the Carolinas segment, revenues
increased by $113.0 million to $114.3 million for the year ended December 31, 2015 compared to $1.3 million in the same period in 2014 due to an increase in the number of communities in which we had closings from two to 25, primarily as a result of the Bonterra Builders acquisition. Additionally, the average selling prices increased 4.4% and 12.3% for the Florida and Arizona segments, respectively.
Gross margin from combined home closings increased by 50 basis points to 18.7% from 18.2% for the year ended December 31, 2015 compared to the same period in 2014. Gross margin from the Florida segment increased by 140 basis points to 20.4% from 19.0% for the year ended December 31, 2015 compared to the same period in 2014, primarily due to cost reduction initiatives favorably impacting our construction costs and selective price increases. Gross margin from the Arizona segment increased by 30 basis points to 15.5% from 15.2% for the year ended December 31, 2015 compared to the same period in 2014, primarily due to addition of higher margin communities and reduced warranty costs from older communities exiting the warranty period. Gross margin from the Carolinas segment increased by 850 basis points to 16.7% from 8.2% for the year ended December 31, 2015 compared to the same period in 2014 due to the acquisition of Bonterra Builders and lower margins in 2014 due to the start up of new communities. Capitalized interest included in cost of sales for the Florida, Arizona and Carolinas segments was $6.7 million, $2.7 million and $1.7 million, respectively, for the year ended December 31, 2015 and was $3.4 million, $1.2 million and less than $0.1 million, respectively, for the same period in 2014.
Combined homebuilding selling, general and administrative expenses as a percentage of homebuilding revenue improved to 12.6% for the year ended December 31, 2015 from 14.1% for the same period in 2014 as we were able to continue to leverage the cost base over our increased revenues, primarily driven by the Bonterra Builders acquisition. Homebuilding selling, general and administrative expenses for the Florida segment as a percentage of homebuilding revenue for the Florida segment was 12.8% for the year ended December 31, 2015 compared to 12.6% for the same period in 2014. Homebuilding selling, general and administrative expenses for the Arizona segment as a percentage of homebuilding revenue for the Arizona segment decreased to 14.2% for the year ended December 31, 2015 compared to 15.9% for the same period in 2014, primarily due to a significant increase in revenue while containing our costs. Homebuilding selling, general and administrative expenses for the Carolinas segment as a percentage of homebuilding revenue for the Carolinas segment decreased to 13.5% for year ended December 31, 2015 compared to 173.1% for the same period in 2014, primarily due to a significant increase in revenue while containing our costs.
Corporate general and administrative expenses increased by $1.0 million to $16.9 million for the year ended December 31, 2015 compared to the same period in 2014. As a percentage of total revenue, corporate general and administrative expenses improved to 3.3% for the year ended December 31, 2015 compared to 5.6% for the same period in 2014. The decrease as a percentage of revenue was driven by the significant increase in revenue while containing our costs.
Interest expense increased $3.2 million or 55.7% for the year ended December 31, 2015 compared to the same period in 2014. The increase in interest expense is primarily attributable to the $200.0 million issuance of 8.50% Senior Notes on June 30, 2014, partially offset by an increase in capitalized interest due to an expansion of inventory under development in 2015 as compared to 2014. Interest costs incurred, prior to capitalization, increased to $28.2 million for the year ended December 31, 2015 as compared to $18.1 million for the same period in 2014.
Net income for the year ended December 31, 2015 was $12.0 million or $0.54 per share compared to a net loss of $1.9 million or ($0.09) per share for the year ended December 31, 2014. The increase in net income for the year ended December 31, 2015 compared to the same period in 2014 was primarily due to (i) the higher volume of closings, and increases in average selling price, driving leverage in our cost base, and (ii) improved gross margins, partially offset by a decrease of $5.0 million in land sale gains and increased interest expense of $3.2 million.
Data from contracts signed for the Florida, Arizona and Carolinas segments for the years ended December 31, 2015, 2014 and 2013 is summarized as follows (dollars in thousands):
| | | | | | | | | | | | | |
| | Gross | | | | | | | | | | |
| | Number | | | | Contracts | | | | | Average | |
| | of Contracts | | | | Signed, Net of | | Dollar | | Price Per | |
Years Ended December 31, | | Signed | | Cancellations | | Cancellations | | Value | | Unit | |
2015 | | | | | | | | | | | | | |
Florida | | 1,509 | | (242) | | 1,267 | | $ | 344,171 | | $ | 272 | |
Arizona | | 590 | | (111) | | 479 | | | 142,004 | | | 296 | |
Carolinas | | 331 | | (42) | | 289 | | | 102,851 | | | 356 | |
Total | | 2,430 | | (395) | | 2,035 | | $ | 589,026 | | | 289 | |
| | | | | | | | | | | | | |
2014 | | | | | | | | | | | | | |
Florida | | 929 | | (121) | | 808 | | $ | 206,503 | | $ | 256 | |
Arizona | | 216 | | (41) | | 175 | | | 45,012 | | | 257 | |
Carolinas | | 13 | | (2) | | 11 | | | 3,212 | | | 292 | |
Total | | 1,158 | | (164) | | 994 | | $ | 254,727 | | | 256 | |
| | | | | | | | | | | | | |
2013 | | | | | | | | | | | | | |
Florida | | 412 | | (97) | | 315 | | $ | 75,895 | | $ | 241 | |
Arizona | | 178 | | (30) | | 148 | | | 34,471 | | | 233 | |
Carolinas | | — | | — | | — | | | — | | | — | |
Total | | 590 | | (127) | | 463 | | $ | 110,366 | | | 238 | |
The total number of net housing contracts signed during the year ended December 31, 2015 compared to the same period in 2014 increased by 1,041 or 104.7%. The dollar value of housing contracts signed increased by $334.3 million or 131.2% over the same period. The increase in units and value were driven by improvements in all segments. The number of net housing contracts signed for the Florida segment during the year ended December 31, 2015 increased by 459 or 56.8%, while the dollar value of housing contracts signed increased by $137.7 million or 66.7% over the same period, due to an increase in the number of selling communities from 18 to 26. The number of net housing contracts signed for the Arizona segment during the year ended December 31, 2015 increased by 304 or 173.7%, while the dollar value of housing contracts signed increased by $97.0 million or 215.5% over the same period, due to an increase in the number of selling communities from six to 10, including the opening of our new active adult community. The number of net housing contracts signed for the Carolinas segment during the year ended December 31, 2015 increased by 278 to 289, while the dollar value of housing contracts signed increased by $99.6 million to $102.9 million over the same period, due to an increase in the number of selling communities from three to 26, primarily as a result of the Bonterra Builders acquisition. The overall increase reflects an increase in the number of selling communities from 27 to 62 as well as higher average selling prices.
The cancellation rate increased to 16.3% from 14.2% for the years ended December 31, 2015 and 2014, respectively. The cancellation rate within the Florida segment increased to 16.0% from 13.0% for the years ended December 31, 2015 and 2014, respectively. The cancellation rate in the Arizona segment improved to 18.8% from 19.0% for the years ended December 31, 2015 and 2014, respectively. The cancellation rate in the Carolinas segment improved to 12.7% compared to 15.4% for the years ended December 31, 2015 and 2014, respectively.
Backlog for the Florida, Arizona and the Carolinas segments as of December 31, 2015, 2014 and 2013 is summarized as follows (dollars in thousands):
| | | | | | | | | |
| | | | | | | Average | |
| | Number | | Dollar | | Price | |
As of December 31, | | of Units | | Volume | | Per Unit | |
2015 | | | | | | | | | |
Florida | | 416 | | $ | 116,061 | | $ | 279 | |
Arizona | | 233 | | | 71,459 | | | 307 | |
Carolinas | | 150 | | | 56,427 | | | 376 | |
Total | | 799 | | $ | 243,947 | | | 305 | |
| | | | | | | | | |
2014 | | | | | | | | | |
Florida | | 273 | | $ | 70,194 | | $ | 257 | |
Arizona | | 52 | | | 13,635 | | | 262 | |
Carolinas | | 6 | | | 1,924 | | | 321 | |
Total | | 331 | | $ | 85,753 | | | 259 | |
| | | | | | | | | |
2013 | | | | | | | | | |
Florida | | 97 | | $ | 23,113 | | $ | 238 | |
Arizona | | 70 | | | 16,749 | | | 239 | |
Carolinas | | — | | | — | | | — | |
Total | | 167 | | $ | 39,862 | | | 239 | |
The backlog of housing contracts as of December 31, 2015 compared to 2014 increased by 468 or 141.4%, and the dollar value of backlog increased by $158.2 million or 184.5% over the same period. The increase in units of backlog was driven by increased sales of new orders due to higher community counts in all segments, as well as increases in the average price per unit sold due to price increases and the sales mix of product sold. The backlog of housing contracts in the Florida segment as of December 31, 2015 compared to 2014 increased by 143 or 52.4%, and the dollar value increased by $45.9 million or 65.3% over the same period, driven by the increase in selling communities. The backlog of housing contracts in the Arizona segment as of December 31, 2015 compared to 2014 increased by 181 or 348.1%, and the dollar value increased by $57.8 million or 424.1% over the same period, driven by an increase in the number of selling communities including our new active adult community. The backlog of housing contracts in the Carolinas segment as of December 31, 2015 compared to 2014 increased by 144 to 150 and the dollar value increased by $54.5 million to $56.4 million over the same period, driven by the increase in selling communities, primarily as a result of the Bonterra Builders acquisition.
As of December 31, 2015, our inventory of unsold (speculative) homes, both completed and under construction, was 421 units, as compared to 258 units as of December 31, 2014. As of December 31, 2015, approximately 40% of unsold homes were completed compared to approximately 49% as of December 31, 2014. The increase in speculative homes is consistent with the growth in the number of communities.
The following is a breakdown of our land holdings as of December 31, 2015 and 2014:
| | | | | | | | | | | | | | | | | |
| | December 31, 2015 | | December 31, 2014 | |
| | | | Partially | | | | Total | | | | Partially | | | | Total | |
| | Developed | | Developed | | Raw | | Remaining | | Developed | | Developed | | | | Remaining | |
| | Lots | | Lots | | Lots | | Lots | | Lots | | Lots | | Raw Lots | | Lots | |
Florida | | | | | | | | | | | | | | | | | |
Active adult | | 737 | | 143 | | 5,898 | | 6,778 | | 588 | | 897 | | 5,817 | | 7,302 | |
Primary residential | | 2,111 | | 637 | | 1,040 | | 3,788 | | 1,651 | | 1,195 | | 1,233 | | 4,079 | |
| | 2,848 | | 780 | | 6,938 | | 10,566 | | 2,239 | | 2,092 | | 7,050 | | 11,381 | |
Arizona | | | | | | | | | | | | | | | | | |
Active adult | | 432 | | 1,238 | | 452 | | 2,122 | | 304 | | 288 | | 1,691 | | 2,283 | |
Primary residential | | 550 | | — | | 345 | | 895 | | 593 | | 95 | | 345 | | 1,033 | |
| | 982 | | 1,238 | | 797 | | 3,017 | | 897 | | 383 | | 2,036 | | 3,316 | |
Carolinas | | | | | | | | | | | | | | | | | |
Active adult | | 148 | | 79 | | 408 | | 635 | | — | | 166 | | 487 | | 653 | |
Primary residential | | 533 | | 886 | | 478 | | 1,897 | | 96 | | 15 | | 375 | | 486 | |
| | 681 | | 965 | | 886 | | 2,532 | | 96 | | 181 | | 862 | | 1,139 | |
Total principal communities | | 4,511 | | 2,983 | | 8,621 | | 16,115 | | 3,232 | | 2,656 | | 9,948 | | 15,836 | |
| (1) | | Estimated planned lots are based on historical densities for our land. New projects may ultimately be developed into more or less than the number of lots stated. |
The Company also has approximately 1,731 acres of commercial and industrial land, approximately 5,600 acres of unplatted scattered mixed-use land, and 690 platted scattered lots not reflected in the above lot counts.
Fiscal Year 2014 Compared to Fiscal Year 2013
Consolidated Results
Overall revenue increased by $144.4 million or 102.1% to $285.9 million during the year ended December 31, 2014 compared to the year ended December 31, 2013. Homebuilding revenue increased by $128.2 million or 111.5% to $243.2 million compared to the year ended December 31, 2013. The increase in homebuilding revenue was driven by a 98.1% increase in units closed and a 6.8% increase in the average sales price for homes closed. Revenue from land sales increased by $16.3 million or 99.9% during the year ended December 31, 2014 compared to the year ended December 31, 2013. This increase is primarily due to the sale of a multi-family property in Arizona for $13.9 million resulting in a gain of $2.3 million in the first quarter of 2014 and the sale of a land position in Florida in the third quarter of 2014 for $11.5 million resulting in a gain of $3.3 million. Homebuilding expenses increased by $122.1 million or 109.8%, consistent with the increase in revenue.
Homebuilding Operations
Homebuilding revenue increased 111.5% from $115.0 million to $243.2 million for the year ended December 31, 2014 compared to the same period in 2013 due to a 98.1% increase in closings and a 6.8% increase in average sales price. In the Florida segment, revenues increased $111.8 million or 137.3% for the year ended December 31, 2014 compared to the same period in 2013 driven by a 116.3% increase in units closed due to an increase in the number of communities in which we had closings from four to 17, primarily due to the acquisition of Royal Oak Homes. In the Arizona segment, revenues increased $15.1 million or 45.1% for the year ended December 31, 2014 compared to the same period in 2013 driven by a 46.2% increase in units closed due to an increase in the number of communities in which we had closings from three to five. In the Carolinas segment, revenues increased by $1.3 million for the year ended December 31, 2014 compared to the same period in 2013 because we recorded our first closings for the Carolinas segment in the fourth quarter of 2014. Additionally, the average selling price increased 9.7% in our Florida segment, which was partially offset by a 0.7% decrease in our Arizona segment.
Gross margin from combined home closings decreased by 200 basis points to 18.2% from 20.2% for the year ended December 31, 2014 compared to the same period in 2013. Gross margin from the Florida segment decreased by 150 basis points to 19.0% from 20.5% for the year ended December 31, 2014 compared to the same period in 2013, primarily due to the 2014 acquisition of Royal Oak Homes, which has lower gross margins. Gross margin from the Arizona segment decreased by 410 basis points to 15.2% from 19.3% for the year ended December 31, 2014 compared to the same period in 2013, primarily due to a mix of homes closed in 2014 that had higher than average lot costs at some of our newer communities. Gross margin from the Carolinas segment was 8.2% for the year ended December 31, 2014. Capitalized interest included in cost of sales for
the Florida, Arizona and Carolinas segments was $3.4 million, $1.2 million and less than $0.1 million, respectively, for the year ended December 31, 2014 and was $1.7 million, $0.8 million and $0.0 million, respectively, for the same period in 2013.
Combined homebuilding selling, general and administrative expenses as a percentage of homebuilding revenue improved to 14.1% for the year ended December 31, 2014 from 17.1% for the same period in 2013, primarily driven by increasing revenue while containing our costs, partially offset by costs incurred to start up new selling communities that are not yet generating revenue. Homebuilding selling, general and administrative expenses for the Florida segment as a percentage of homebuilding revenue for the Florida segment improved to 12.6% for the year ended December 31, 2014, from 17.2% for the same period in 2013. Homebuilding selling, general and administrative expenses for the Arizona segment as a percentage of homebuilding revenue for the Arizona segment improved to 15.9% for the year ended December 31, 2014 from 16.6% for the same period in 2013. Homebuilding selling, general and administrative expenses for the Carolinas segment as a percentage of homebuilding revenue for the Carolinas segment was 173.1% for year ended December 31, 2014 due to the startup of the division. Overall improvements in cost leverage from the increased revenue were partially offset by the costs incurred to start up new selling communities that are not yet generating revenue.
Corporate general and administrative expenses decreased by less than $0.1 million or 0.2% to $15.9 million for the year ended December 31, 2014 compared to the same period in 2013. As a percentage of total revenue, corporate general and administrative expenses improved to 5.6% for the year ended December 31, 2014 compared to 11.3% for the same period in 2013. The decrease as a percentage of revenue was driven by the significant increase in revenue while containing our costs.
Interest expense increased $3.0 million or 105.1% for the year ended December 31, 2014 compared to the same period in 2013. The increase in interest expense is primarily attributable to the $200.0 million issuance of 8.50% Senior Notes on June 30, 2014, partially offset by an increase in capitalized interest due to an expansion of inventory under development in 2014 as compared to 2013. Interest costs incurred, prior to capitalization, increased from the prior year to $18.1 million for the year ended December 31, 2014 as compared to $9.3 million for the same period in 2013.
Net loss for the year ended December 31, 2014 was $1.9 million or ($0.09) per share compared to $9.5 million or ($1.34) per share for the year ended December 31, 2013. The net loss per share in 2013 includes a non-cash charge of ($0.75) per share for deemed dividends related to the recognition of a beneficial conversion feature embedded in the convertible preferred stock issued in the second quarter of 2013 and converted to common stock in the third quarter of 2013. The decrease in net loss for the year ended December 31, 2014 compared to the same period in 2013 was primarily due to leveraging our overhead cost base with a significant increase in revenues, a decrease in other real estate expenses, and an increase in the profits from the sale of assets held for sale.
Contracts Signed
The total number of net housing contracts signed during the year ended December 31, 2014 compared to the same period in 2013 increased by 531 or 114.7%. The dollar value of housing contracts signed increased by $144.4 million or 130.8% over the same period. The increase in units and value were driven by improvements in all segments. The number of net housing contracts signed for the Florida segment during the year ended December 31, 2014 increased by 493 or 156.5%, while the dollar value of housing contracts signed increased by $130.6 million or 172.1% over the same period, due to an increase in the number of selling communities from five to 18. The number of net housing contracts signed for the Arizona segment during the year ended December 31, 2014 increased by 27 or 18.2%, while the dollar value of housing contracts signed increased by $10.5 million or 30.6% over the same period, due to an increase in the number of selling communities from five to six. The number of net housing contracts signed for the Carolinas segment during the year ended December 31, 2014 increased by 11, while the dollar value of housing contracts signed increased by $3.2 million. The overall increase reflects an increase in the number of selling communities from 10 to 27 as well as higher average selling prices.
The cancellation rate decreased to 14.2% from 21.5% for the years ended December 31, 2014 and 2013, respectively. The cancellation rate within the Florida segment decreased to 13.0% from 23.5% for the years ended December 31, 2014 and 2013, respectively. The cancellation rate in the Arizona segment increased to 19.0% from 16.9% for the years ended December 31, 2014 and 2013, respectively. The cancellation rate in the Carolinas segment was 15.4% for the year ended December 31, 2014.
Backlog
The backlog of housing contracts as of December 31, 2014 compared to 2013 increased by 164 or 98.2%, and the dollar value of backlog increased by $45.9 million or 115.1% over the same period. The increase in units of backlog was driven by increased sales of new orders due to higher community counts in all segments, as well as increases in the average price per unit sold due to price increases and the sales mix of product sold. The backlog of housing contracts in the Florida
segment as of December 31, 2014 compared to 2013 increased by 176 or 181.4%, and the dollar value increased by $47.1 million or 203.7% over the same period, driven by the increase in selling communities from five to 18. The backlog of housing contracts in the Arizona segment as of December 31, 2014 compared to 2013 decreased by 18 or 25.7%, and the dollar value decreased by $3.1 million or 18.6% over the same period, driven by slower sales in third and fourth quarters of 2014. The backlog of housing contracts in the Carolinas segment as of December 31, 2014 was six and the dollar value was $1.9 million.
As of December 31, 2014, our inventory of unsold (speculative) homes, both completed and under construction, was 258 units, as compared to 60 units as of December 31, 2013. As of December 31, 2014, approximately 49% of unsold homes were completed compared to approximately 22% as of December 31, 2013. The increase in speculative homes is consistent with the growth in the number of communities.
Income Taxes
Income taxes have been provided for using the liability method under Accounting Standards Codification ("ASC") 740, Income Taxes (“ASC 740”). The liability method is used in accounting for income taxes where deferred income tax assets and liabilities are determined based on differences between financial reporting and tax basis of assets and liabilities and are measured using the enacted tax rates and laws that are expected to be in effect when the differences reverse.
The Company evaluates its deferred tax assets quarterly to determine if valuation allowances are required. ASC 740 requires that companies assess whether valuation allowances should be established based on the consideration of all available evidence using a “more likely than not” standard. The realization of the deferred tax assets ultimately depends upon the existence of sufficient taxable income in future periods. The Company continues to analyze all available positive and negative evidence in determining the continuing need for a valuation allowance with respect to its deferred tax assets. This evaluation considers, among other factors, historical operating results, forecasts of future profitability, and the duration of statutory carryforward periods. A significant part of the evidence the Company considers is its position with respect to a three year cumulative profit or loss. This position combined with the other evidence described above has continued to support the need for a valuation allowance. We earned a profit before income taxes for the year ended December 31, 2015 and have seen significant increases in community count, new orders, and backlog. If homebuilding industry conditions and the Company’s business remain stable and additional positive evidence develops, the Company believes there could be sufficient positive evidence to support a conclusion that the Company will generate sufficient taxable income in future periods to realize its deferred tax asset, which would allow the company to significantly reduce the valuation allowance at some point during 2016.
During the year ended December 31, 2015, we recognized a decrease of $5.3 million in the deferred tax valuation allowance against net deferred tax assets generated from the pre-tax income for the year. As of December 31, 2015, our deferred tax asset valuation allowance was $124.5 million.
Liquidity and Capital Resources
Our primary business activities are capital intensive in nature. Significant capital resources are required to finance planned residential communities, homebuilding construction in process, community infrastructure, selling expenses, new projects and working capital needs, including funding of debt service requirements, operating deficits and the carrying costs of land.
Cash Flows
As of December 31, 2015, our cash and cash equivalents totaled $46.9 million compared to $180.3 million as of December 31, 2014. As of December 31, 2015, total consolidated indebtedness was $326.8 million compared to $300.0 million as of December 31, 2014. The decrease in cash and cash equivalents as of December 31, 2015 is primarily due to (i) the purchase and development of land, and the increase in homes under construction due to new orders and (ii) the purchase of Bonterra Builders. Additionally, as of December 31, 2015, we had $26.9 million in restricted cash, which is comprised primarily of cash on deposit as an interest reserve to comply with the terms of our senior secured credit facility, as compared to $16.4 million in restricted cash as of December 31, 2014. We were in compliance with all debt covenants as of December 31, 2015 and December 31, 2014.
Our operating cash flows fluctuate relative to the status of development within existing communities, expenditures for land, new developments and other real estate activities, sales of various homebuilding product lines within those communities and other developments and to fund operating deficits.
For the year ended December 31, 2015, net cash used in operating activities was $59.0 million. The operating cash outflow was primarily due to the increase in land and other inventories of $83.8 million and an increase in restricted cash of
$10.5 million related to a covenant requirement in our senior secured credit facility. Using the proceeds from our 8.50% Senior Notes issued in June 2014 and our 6.00% Notes issued in June 2015, we purchased land and lots for the expansion of all our homebuilding segments and increased the number of homes under construction commensurate with the increase in our new orders. These outflows were partially offset by cash inflow of $19.1 million from increased customer deposits and accrued liabilities. Net cash used in investing activities was $97.8 million, primarily due to the purchase of Bonterra Builders in the third quarter of 2015. Net cash provided by financing activities was $23.4 million, primarily due to the issuance of $80.0 million of the 6.00% Notes, partially offset by the aggregate redemption and repurchase of the 7.50% Exchange Notes and portions of the 7.50% Notes for $53.2 million.
For the year ended December 31, 2014, net cash used in operating activities was $81.4 million. The operating cash outflow was primarily due to an increase in restricted cash of $12.5 million related to a covenant requirement in our senior secured credit facility and the increase in land and other inventories of $111.7 million. Using portions of the proceeds from our equity issuance in June 2013 and the issuance of our 8.50% Senior Notes in 2014, we purchased land and lots for the expansion of our primary residential segment and increased the number of homes under construction commensurate with the increase in our new orders. These outflows were partially offset by cash inflow of $19.8 million from assets held for sale and an increase in accounts payable and accrued liabilities of $15.6 million as a result of the increase in the number of homes under construction. Net cash used by investing activities amounted to $68.1 million primarily due to the purchase of Royal Oak Homes in the first quarter of 2014. Net cash provided by financing activities was $185.1 million, primarily due to the issuance of the $200.0 million 8.50% Senior Notes in the second quarter of 2014, partially offset by $9.2 million of debt issue costs related to the senior secured credit facility and 8.50% Senior Notes, as well as the repayment of $5.4 million of the 4.50% Notes.
Surety Bonds
Surety bonds, issued by third-party entities, are used primarily to guarantee our performance to construct improvements in our various communities. As of December 31, 2015, and 2014, we had outstanding surety bonds of approximately $30.9 million and $21.5 million, respectively. The amount of outstanding surety bonds could fluctuate depending on the level of development activity. We do not believe that it is likely any of these outstanding surety bonds will be drawn upon.
Other
Assuming that no additional significant adverse changes in our business occur, we anticipate the aggregate cash on hand, cash flow generated through homebuilding and related operations, our senior secured credit facility, and sales of commercial and industrial and other land will provide sufficient liquidity to fund our business for 2016.
Off-balance Sheet Arrangements
When we are either deemed to hold the controlling interest in a voting interest entity or deemed to be the primary beneficiary of a variable interest entity (“VIE”), we are required to consolidate the investment. The primary beneficiary of a VIE is the entity that has both of the following characteristics: (a) the power to direct the activities of a VIE that most significantly impact the VIE’s economic performance and (b) the obligation to absorb the majority of losses of the VIE or the right to receive the majority of benefits from the VIE. Investments where we do not hold the controlling interest and we are not the primary beneficiary are accounted for under the equity method.
Our variable interests may be in the form of (1) equity ownership, (2) contracts to purchase assets and/or (3) loans provided by us to the investor. We examine specific criteria and use judgment when determining if we are the primary beneficiary of a VIE. Factors considered in determining whether we are the primary beneficiary include risk and reward sharing, experience and financial condition of other partner(s), voting rights, involvement in day-to-day capital and operating decisions, level of economic disproportionality between us and the other partner(s) and contracts to purchase assets from VIEs.
We participate in entities with equity interests ranging from 20% to 58% for the purpose of acquiring and/or developing land in which we may or may not have a controlling interest or be the primary beneficiary. These entities, along with other arrangements, may represent variable interests, depending on the contractual terms of the arrangement. We determine the method for accounting for our investments at inception or upon a reconsideration event.
We share in the profits and losses of the unconsolidated entities generally in accordance with our ownership interests. We and our equity partners make initial and ongoing capital contributions to these unconsolidated entities on a pro rata basis. The obligation to make capital contributions is governed by each unconsolidated entity’s respective operating agreement.
As of December 31, 2015, these unconsolidated entities were financed by partner equity and do not have third-party debt. In addition, we have not provided any guarantees to these entities or our equity partners.
Effects of Inflation and Economic Conditions
We may be adversely affected during periods of inflation because of higher land and construction costs. Inflation may also increase our financing costs. In addition, higher mortgage interest rates affect the affordability of our products to prospective homebuyers. While we attempt to pass on to our customers increases in our costs through increased sales prices, market forces may limit our ability to do so. If we are unable to raise sales prices enough to compensate for higher costs, or if mortgage interest rates increase significantly, our revenues, gross margins, and net income could be adversely affected.
Various housing indices have shown improvement in recent periods. While we believe that higher interest rates are inevitable and may have a moderating effect on demand and pricing, we believe this impact will be outweighed by the other factors driving increased sales activity as overall new orders remain low compared with historical levels. We believe that any sustained rise in interest rates will be indicative of a stronger macroeconomic environment that will support a continued recovery in the homebuilding industry.
Seasonality
Our business is affected to some extent by the seasonality of home sales which generally produce higher levels of sales contracts during the months of November through April for active adult communities in the geographic areas in which we conduct our business. This pattern typically produces increased closings in the latter half of the year.
Contractual Obligations and Commercial Commitments
The following table reflects contractual obligations as of December 31, 2015 (in thousands):
| | | | | | | | | | | | | | | | |
| | Payments Due by Period | | | | |
| | | | | | | | | | | More | | | | |
| | Less than | | 1 – 3 | | 3 – 5 | | Than | | | | |
| | 1 Year | | Years | | Years | | 5 Years | | Total | |
Long-term debt obligations (1) | | $ | 46,793 | | $ | — | | $ | 280,000 | | $ | — | | $ | 326,793 | |
Interest obligations on long-term debt | | | 22,239 | | | 43,600 | | | 15,700 | | | — | | | 81,539 | |
Operating lease obligations | | | 1,493 | | | 2,128 | | | 609 | | | 71 | | | 4,301 | |
Capital lease obligations | | | 612 | | | 624 | | | 24 | | | — | | | 1,260 | |
Purchase obligations - residential development (2) | | | 120,371 | | | — | | | — | | | — | | | 120,371 | |
Other long-term liabilities (3) | | | 2,418 | | | 1,851 | | | 721 | | | 32,051 | | | 37,041 | |
Total | | $ | 193,926 | | $ | 48,203 | | $ | 297,054 | | $ | 32,122 | | $ | 571,305 | |
| (1) | | Long-term debt obligations represent: |
| (i) | | $46,793 outstanding under the 7.50% Notes (see Note 6, Debt, to the consolidated financial statements included in Part II of this report) due February 15, 2016; |
| (ii) | | $200,000 outstanding under the 8.50% Senior Notes due July 1, 2019; and |
| (iii) | | $80,000 outstanding under the 6.00% Senior Convertible Notes due July 1, 2020. |
| (2) | | Purchase obligations-residential development represent purchase commitments for land development and construction expenditures, substantially for homebuilding operations that relate to contracts for services, materials and supplies, which obligations generally relate to corresponding contracts for sales of homes. |
| (3) | | Other long-term liabilities represent the estimated cost-to-complete of certain utilities improvements in areas within Poinciana, Florida and Rio Rico, Arizona where home sites have been sold and certain development obligations associated with CantaMia. |
Critical Accounting Policies and Estimates
The accompanying consolidated financial statements were prepared in conformity with U.S. generally accepted accounting principles. When more than one accounting principle, or the method of its application, is generally accepted, we select the principle or method that is appropriate in our specific circumstances (see Note 1, Basis of Financial Statement Presentation and Summary of Significant Accounting Policies, to the consolidated financial statements included in Part II of
this report). Application of these accounting principles requires us to make estimates about the future resolution of existing uncertainties; as a result, actual results could differ from these estimates. In preparing these consolidated financial statements, we have made our best estimates and judgments of the amounts and disclosures included in the consolidated financial statements, giving due regard to materiality.
The accounting policies that we deem most critical to us and involve the most difficult, subjective or complex judgments are as follows:
Revenue Recognition
Homebuilding revenue and related profit are generally recognized when title to and possession of the property are transferred to the buyer. Sales are closed when all of the following conditions are met: a sale is consummated, a sufficient down payment is received, the earnings process is complete and the collection of any remaining receivables is reasonably assured. Concurrent with the recognition of revenues in our consolidated statements of operations and comprehensive income (loss), sales incentives in the form of price concessions on the selling price of a home are recorded as a reduction of revenues, while the cost of sales incentives in the form of free products or services to homebuyers, including option upgrades and closing cost allowances used to cover a portion of the fees and costs charged to a homebuyer, is reflected as construction and land costs.
Land and Other Inventories
Land and other inventories are stated at cost unless the asset is determined to be impaired, in which case the asset is written to its fair value. Land and other inventories include expenditures for land acquisition, construction, land development and direct and allocated indirect costs. Land and other inventories owned and constructed by us also include interest cost and real estate taxes capitalized until development and construction are substantially completed. Land and development costs, construction and direct and allocated indirect costs are assigned to components of land and other inventories based on specific identification, relative sales value, or area allocation methods.
Our inventories include land we are holding for future development, which is comprised of land where development activity has been suspended or has not yet begun but is expected to occur in the future. These assets held for future development are located in various submarkets where conditions do not presently support further investment or development, or are subject to a building permit moratorium or regulatory restrictions, or are portions of larger land parcels that we plan to build out over several years and/or that have not yet been entitled. We may also suspend development activity if we believe it will result in greater returns and/or maximize the economic performance of a particular community by delaying improvements for a period of time to, for instance, allow earlier phases of a long-term, multi-phase community or a neighboring community to generate sales momentum or for market conditions to improve. In some instances, we may activate or resume development activity for this inventory to accelerate sales and/or our return on investment. We have activated assets previously held for future development in certain markets as part of our strategic growth initiatives. Interest and real estate taxes are not capitalized on land held for future development or for land or communities for which construction and development activities have been idled.
In accordance with ASC 360-10, Property, Plant and Equipment ("ASC 360-10"), we review our land and other inventories for indicators of impairment.
For assets held and used, if indicators are present, we perform an impairment test in which the asset is reviewed for impairment by comparing the estimated future undiscounted cash flows to be generated by the asset to its carrying value. If such cash flows are less than the asset’s carrying value, the carrying value is written down to its estimated fair value. Generally, fair value is determined by discounting the estimated cash flows at a rate commensurate with the inherent risks associated with the asset and related estimated cash flow streams. The discount rate used in the determination of fair value would vary, depending on the state of development. Assumptions and estimates used in the determination of the estimated future cash flows are based on expectations of future operations and economic conditions and certain factors described below. Changes to these assumptions could significantly affect the estimates of future cash flows, which could affect the potential for future impairments. Due to the uncertainties of the estimation process, actual results could differ significantly from such estimates.
We evaluate our land and other inventories for impairment on a quarterly basis to reflect market conditions, which may include a significant oversupply of homes available for sale, higher foreclosure activity and significant competition. During the years ended December 31, 2015, 2014 and 2013 there were no significant impairment charges that related to homes completed or under construction. During 2013, we recorded impairment charges of $0.7 million related to land developed and/or held for future development or sale.
As of December 31, 2015, we had no other land and other inventories that had estimated undiscounted cash flows that were less than their carrying values. However, we can give no assurance that any future evaluations will not result in further impairments given the real estate market, the likelihood of increased competition within the age-restricted segment as conditions improve, and other factors as more fully described below.
Land and other inventories that are subject to a review for indicators of impairment include our: (i) housing communities (active adult and primary residential, including scattered lots) and (ii) land developed and/or held for future development or sale. A discussion of the factors that impact our impairment assessment for these categories follows.
Housing communities: Homebuilding activities include the development of active adult and primary residential communities and the operation of amenities. The operating results generated from active adult and primary residential communities during the years ended December 31, 2015 and 2014 include operating expenses relating to the operation of the amenities in our communities as well as divisional overhead allocated among several communities.
Our active adult and primary residential communities range from small to large master-planned communities in Florida, Arizona and the Carolinas. Several of these communities are long-term projects on land we have owned for many years. In reviewing each of our communities, we determine if potential impairment indicators exist by reviewing various factors such as actual margins on homes closed in recent months, projected margins on homes in backlog, projected margins on speculative homes, average selling prices, sales activities and local market conditions. If indicators are present, the asset is reviewed for impairment. In determining estimated future cash flows for purposes of the impairment test, the estimated future cash flows are significantly impacted by specific community factors such as: (i) sales absorption rates; (ii) estimated sales prices and sales incentives; and (iii) estimated cost of home construction, estimated land development costs, interest costs, indirect construction and overhead costs, and selling and marketing costs. In addition, our estimated future cash flows are also impacted by general economic and local market conditions, competition from other homebuilders, foreclosures and depressed home sales in the areas in which we build and sell homes, product desirability in our local markets and the buyers’ ability to obtain mortgage financing. The build-out of our active adult residential communities generally exceeds five years. Our assumptions are based on current activity and recent trends at our active adult and primary residential communities. There are a significant number of assumptions with respect to each analysis. Many of these assumptions extend over a significant number of years. The substantial number of variables related to these assumptions could significantly affect the potential for future impairments.
Land developed and/or held for future development or sale: Our land developed and/or held for future development or sale represents land holdings for the potential development of future active adult and/or primary residential communities, commercial and industrial uses. For land developed and/or held for future development or sale, indicators of potential impairment include changes in use, changes in local market conditions, declines in the selling prices of similar assets and increases in costs. If indicators are present, the asset is reviewed for impairment. In determining estimated future cash flows for purposes of the impairment test, the estimated future cash flows could be significantly impacted by specific community factors such as: (i) sales absorption rates; (ii) estimated sales prices and sales incentives; and (iii) estimated costs of home construction, estimated land and land development costs, interest costs, indirect construction and overhead costs, and selling and marketing costs. In addition, our estimated future cash flows could also be impacted by general economic and local market conditions, competition from other homebuilders, foreclosures and depressed home sales in the areas where we own land for future development, product desirability in our local markets and the buyers’ ability to obtain mortgage financing. Factors that we consider in determining the appropriateness of moving forward with land development or whether to write-off the related amounts capitalized include: our current inventory levels, local market economic conditions, availability of adequate resources and the estimated future net cash flows to be generated from the project.
Assets Held for Sale
We account for assets held for sale in accordance with ASC 360-10. In order for an asset to be classified as held for sale, it must meet the following criteria:
| · | | Management, having the authority to approve the action, commits to a plan to sell the asset; |
| · | | The asset is available for immediate sale in its present condition subject only to terms that are usual and customary for sales of such assets; |
| · | | An active program to locate a buyer and other actions required to complete the plan to sell the asset (disposal group) have been initiated; |
| · | | The sale of the asset is probable, and transfer of the asset is expected to qualify for recognition as a completed sale, within one year; |
| · | | The asset is being actively marketed for sale at a price that is reasonable in relation to its current fair value; and |
| · | | Actions required to complete the plan indicate that it is unlikely that significant changes to the plan will be made or that the plan will be withdrawn. |
We continue to opportunistically sell non-core commercial and industrial assets, as well as scattered lot positions and land assets that are in excess of our needed supply in a given market. Under this plan, assets that meet the criteria above are classified as held for sale. During the year ended December 31, 2015, we changed our plans to sell assets that were previously classified as held for sale, or the assets no longer met the held-for-sale criteria, resulting in a reclassification of $4.1 million of land positions to land and other inventories. There was no change in the carrying value in these assets due to this reclassification. Approximately $19.8 million of assets held for sale were sold during 2014.
For assets held for sale (such as homes completed or under construction or vacant land parcels available for sale), we perform an impairment test in which the asset is reviewed for impairment by comparing the fair value (estimated sales price) less cost to sell the asset to its carrying value. If such fair value less cost to sell is less than the asset’s carrying value, the carrying value is written down to its estimated fair value less cost to sell.
Homebuilding Cost of Revenues
Homebuilding cost of revenues includes the specific construction costs of each home and all applicable land acquisition, land development and related costs, both incurred and estimated to be incurred, warranty costs, capitalized interest costs, and closing costs. The construction cost of the home includes amounts paid through the closing date of the home, plus an appropriate accrual for costs incurred but not yet paid, based on an analysis of budgeted construction costs. This accrual is reviewed for accuracy based on actual payments made after closing compared with the amount accrued, and adjustments are made, if needed.
In determining a portion of the construction and land costs recognized for each period, we rely on project budgets that are based on a variety of assumptions, including future construction schedules and costs to be incurred. It is possible that actual results could differ from budgeted amounts for various reasons, including construction delays, construction resource shortages, increases in costs that have not yet been committed, changes in governmental requirements, unforeseen environmental hazard discoveries or other unanticipated issues encountered during construction and other factors beyond our control. While the actual results for a particular construction project are accurately reported over time, variances between the budgeted and actual costs of a project could result in the understatement or overstatement of construction and land costs and homebuilding gross profits in a particular reporting period. To reduce the potential for this occurring, we have set forth procedures that collectively comprise a critical accounting policy. These procedures, which we have applied on a consistent basis, include assessing, updating and revising project budgets on a quarterly basis, obtaining commitments from independent subcontractors and vendors for future costs to be incurred, reviewing the adequacy of warranty accruals and historical warranty claims experience, and utilizing the most current information available to estimate construction and land costs to be charged to expense.
The development cycles for our communities range from under one year to in excess of ten years for certain master-planned communities. Adjustments to estimated total land acquisition and development costs for the community affects the costs of the community’s remaining lots. We believe that our policies provide for reasonably dependable estimates to be used in the calculation and reporting of construction and land costs.
Goodwill
We evaluate goodwill for possible impairment in accordance with ASC Topic 350, Intangibles-Goodwill and Other, on an annual basis, or more frequently if events or changes in circumstances indicate that the carrying amount of such assets may not be recoverable. We use a three step process to assess whether or not goodwill can be realized. The first step is a qualitative assessment that analyzes current economic indicators associated with a particular reporting unit. For example, we analyze changes in economic, market and industry conditions, business strategy, cost factors, and financial performance, among others, to determine if there would be a significant decline to the fair value of a particular reporting unit. If the qualitative assessment indicates a stable or improved fair value, no further testing is required.
If a qualitative assessment indicates that a significant decline to fair value of a reporting unit is more likely than not, or if a reporting unit’s fair value has historically been closer to its carrying value, we will proceed to the second step where we calculate the fair value of a reporting unit based on discounted future cash flows. If this step indicates that the carrying value of a reporting unit is in excess of its fair value, we will proceed to the third step where the fair value of the reporting unit will be
allocated to assets and liabilities as they would in a business combination. Impairment occurs when the carrying amount of goodwill exceeds its estimated fair value calculated in the third step.
Business Combinations
The Company accounts for business combinations in accordance with ASC Topic 850, Business Combinations, if the acquired assets assumed and liabilities incurred constitute a business. For acquired companies constituting a business, we recognize the identifiable assets acquired and liabilities assumed at their acquisition-date fair values and recognize any excess of total consideration paid over the fair value of the identifiable assets as goodwill.
The estimated fair value of the acquired assets and assumed liabilities requires significant judgments by management which are outlined below:
Inventories: The fair value of acquired inventories largely depends on the stage of production of the acquired land and work in process inventory. For acquired land inventory, we typically utilize, with the assistance of a third party appraiser, a forecasted cash flow approach for the development, marketing, and sale of each community acquired. Significant assumptions included in our estimates include future per lot development costs, construction and overhead costs, mix of products sold in each community, as well as average sales price. For work in process inventories, we estimate the fair value based upon the stage of production of each unit and a gross margin that we believe a market participant would require to complete the remaining development and requisite selling efforts. For the acquisitions that we completed in the current year, we estimated a market participant would require a gross margin of 20%.
Intangible assets: The fair value of the acquired intangible assets largely depends on the nature of the intangible asset acquired. During the years ended 2015 and 2014 we have identified intangible assets acquired in our business combinations for non-compete agreements and trade names. With the assistance of a third party valuation firm, we estimate the value of each intangible asset based on a combination of approaches. The fair value of acquired intangible assets is largely a factor of our forecasted future results of each acquisition and is dependent on similar assumptions as those outlined above for “Inventories.”
If forecasts and estimates utilized in our purchase price allocation differ significantly from actual results in future periods, impairments of inventory, amortizable intangible assets, and goodwill could arise.
Income Taxes
We account for income taxes in accordance with ASC 740, Income Taxes. The provision for, or benefit from, income taxes is calculated using the asset and liability method, under which deferred tax assets and liabilities are recognized by identifying the temporary differences arising from the different treatment of items for tax and accounting purposes. In assessing the ability to realize the value of deferred tax assets, we consider whether it is more likely than not that some portion or all of the deferred tax assets may not be realized. Deferred tax assets are evaluated on a quarterly basis to determine if adjustments to the valuation allowance are required. The ultimate realization of deferred tax assets is primarily dependent upon the generation of future taxable income during the periods in which those temporary differences become deductible.
In determining the future tax consequences of events that have been recognized in the financial statements or tax returns, judgment is required. We evaluate our uncertain tax positions quarterly based on various factors, including changes in facts or circumstances, tax laws or the status of audits by tax authorities. Differences between the anticipated and actual outcomes of these future tax consequences could have a material impact on the consolidated results of operations or financial position. As of December 31, 2015, our deferred tax asset and valuation allowance was $124.5 million.
Warranty Costs
Warranty reserves for houses are established to cover estimated costs for materials and labor with regard to warranty-type claims to be incurred subsequent to the closing of a house. We estimate the costs to be incurred under these warranties and record a liability in the amount of such costs at the time product revenue is recognized. Our primary assumption in estimating the amounts we accrue for warranty costs is that historical claims experience is a strong indicator of future claims experience. Factors that affect our warranty liability include the number of homes sold, historical and anticipated rates of warranty claims, and the cost per claim. We periodically assess the adequacy of our recorded warranty liability for each geographic market in which we operate and adjust the amounts as necessary. Actual warranty costs in the future could differ from our estimates. Warranty reserves are included in accrued and other liabilities in the consolidated balance sheets.