
GAP INC. FISCAL 2017 TERI LIST‐STOLL E X E C U T I V E V I C E P R E S I D E N T & C H I E F F I N A N C I A L O F F I C E R THIRD QUARTER EARNINGS RESULTS ART PECK P R E S I D E N T & C H I E F E X E C U T I V E O F F I C E R Exhibit 99.2
This conference call and webcast contain forward‐looking statements within the "safe harbor" provisions of the Private Securities Litigation Reform Act of 1995. All statements other than those that are purely historical are forward‐looking statements. Forward‐looking statements include statements identified as such in our November 16, 2017 press release. Because these forward‐looking statements involve risks and uncertainties, there are important factors that could cause our actual results to differ materially from those in the forward‐looking statements. Information regarding factors that could cause results to differ can be found in our November 16, 2017 earnings press release, our Annual Report on Form 10‐K for the fiscal year ended January 28, 2017, and our subsequent filings with the U.S. Securities and Exchange Commission, all of which are available on gapinc.com. These forward‐looking statements are based on information as of November 16, 2017. We assume no obligation to publicly update or revise our forward‐looking statements even if experience or future changes make it clear that any projected results expressed or implied therein will not be realized. This presentation includes the non‐GAAP measures adjusted net income, adjusted earnings per share, adjusted earnings per share growth excluding the year‐over‐year impacts of foreign exchange, adjusted gross profit, adjusted gross margin, adjusted operating expenses, adjusted operating expenses as a percent of net sales, adjusted operating income, adjusted operating income as a percent of net sales (operating margin), adjusted capital expenditures, and free cash flow. The description and reconciliation of these measures from GAAP is included in our November 16, 2017 earnings press release, which is available on gapinc.com. F O R W A R D L O O K I N G S T A T E M E N T S DISCLOSURE STATEMENT S E C R E GU L A T I O N G
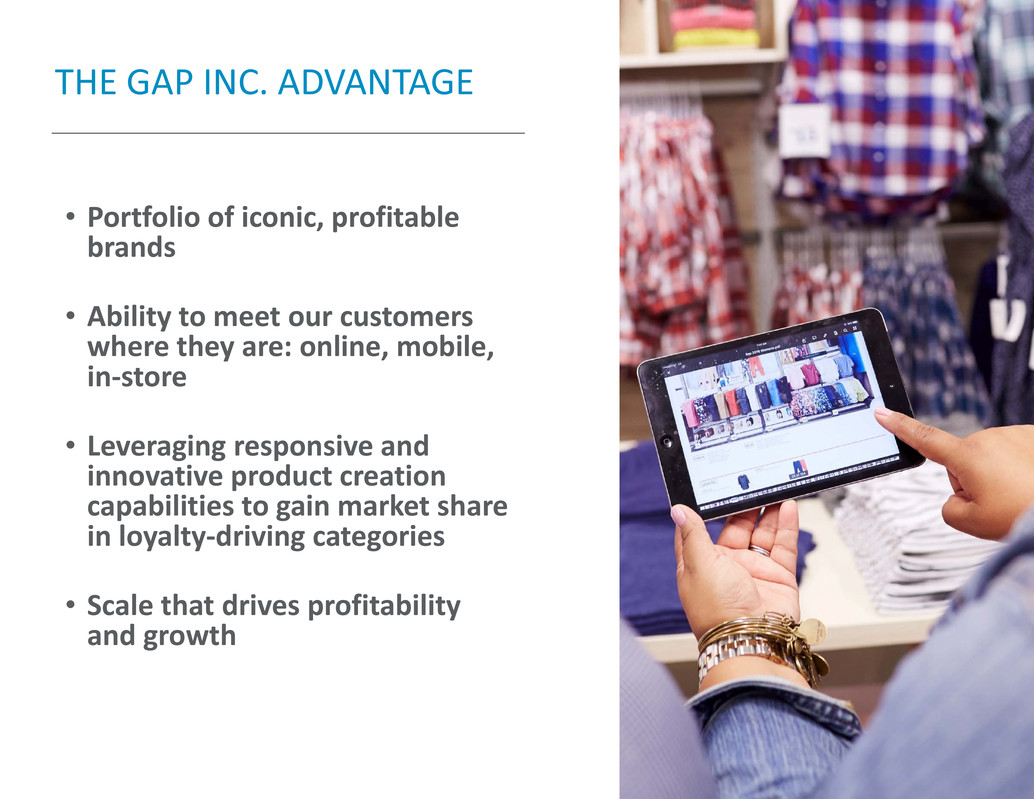
THE GAP INC. ADVANTAGE • Portfolio of iconic, profitable brands • Ability to meet our customers where they are: online, mobile, in‐store • Leveraging responsive and innovative product creation capabilities to gain market share in loyalty‐driving categories • Scale that drives profitability and growth
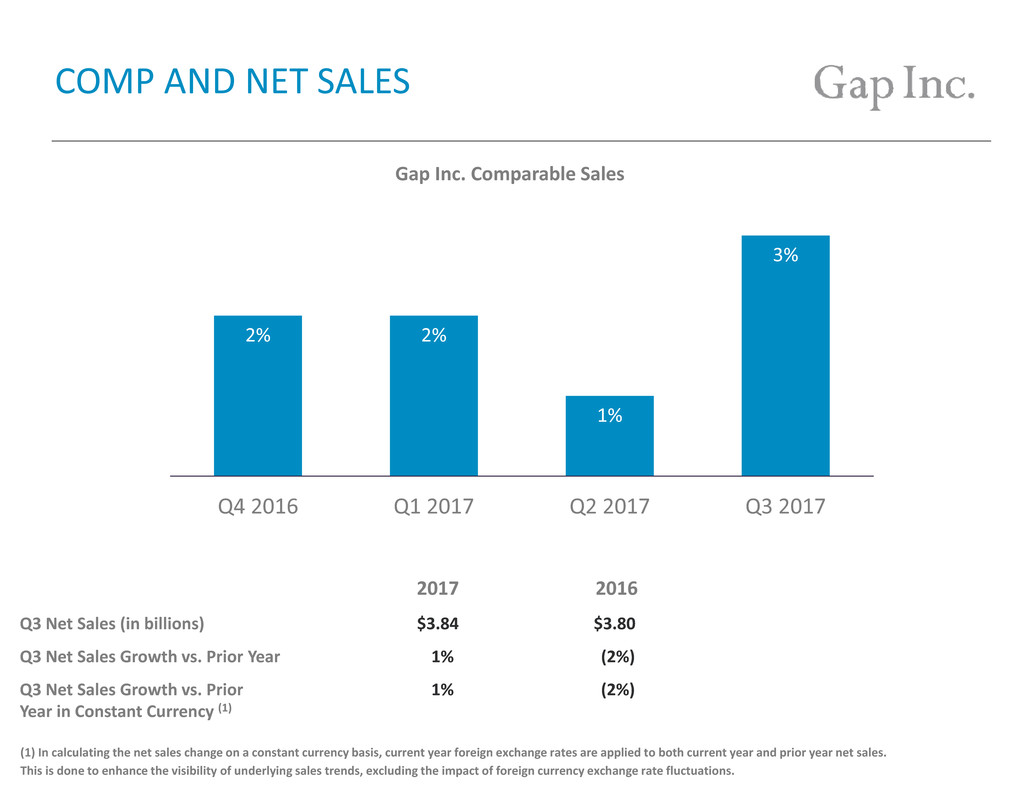
(1) In calculating the net sales change on a constant currency basis, current year foreign exchange rates are applied to both current year and prior year net sales. This is done to enhance the visibility of underlying sales trends, excluding the impact of foreign currency exchange rate fluctuations. COMP AND NET SALES Q3 Net Sales (in billions) $3.84 $3.80 Q3 Net Sales Growth vs. Prior Year 1% (2%) Q3 Net Sales Growth vs. Prior 1% (2%) Year in Constant Currency (1) 2% 2% 1% 3% Q4 2016 Q1 2017 Q2 2017 Q3 2017 Gap Inc. Comparable Sales 2017 2016
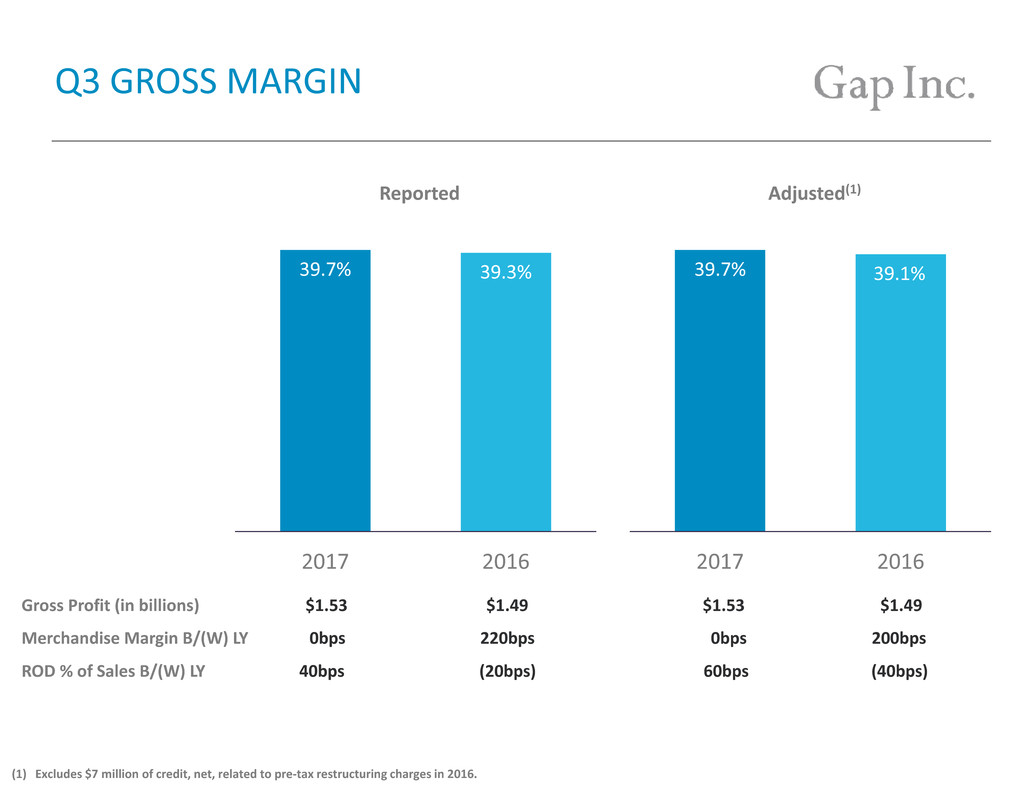
Q3 GROSS MARGIN Gross Profit (in billions) $1.53 $1.49 $1.53 $1.49 Merchandise Margin B/(W) LY 0bps 220bps 0bps 200bps ROD % of Sales B/(W) LY 40bps (20bps) 60bps (40bps) 39.7% 39.3% 2017 2016 Reported 39.7% 39.1% 2017 2016 Adjusted(1) (1) Excludes $7 million of credit, net, related to pre‐tax restructuring charges in 2016.
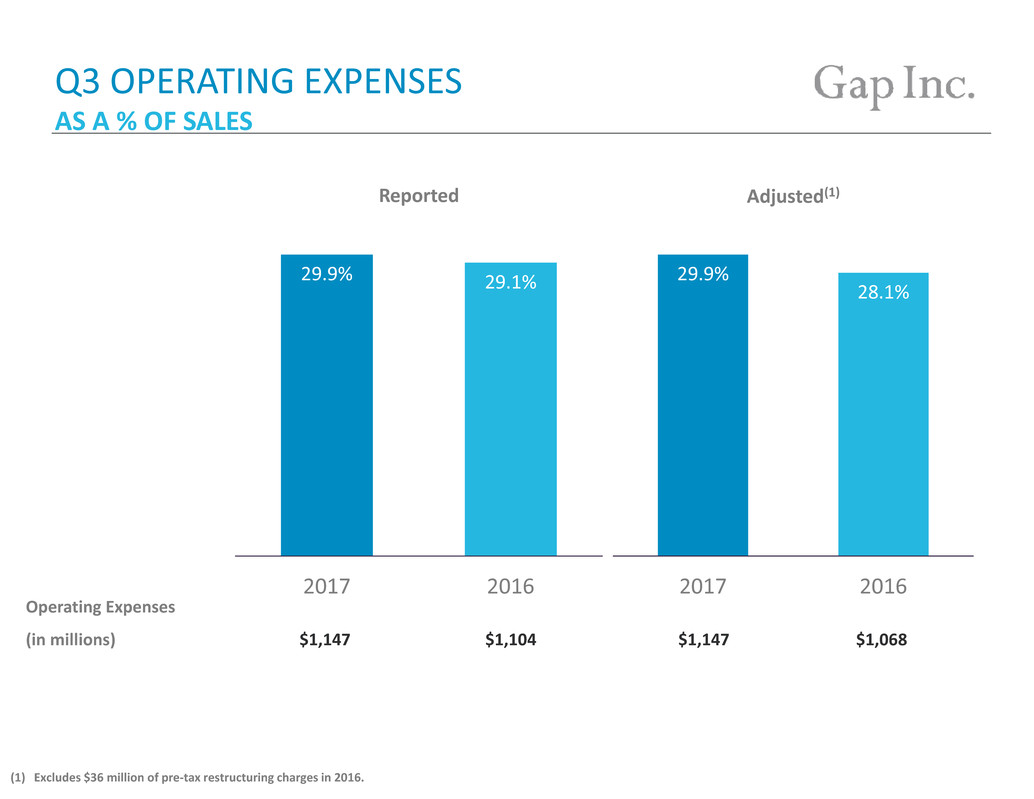
Q3 OPERATING EXPENSES Operating Expenses (in millions) $1,147 $1,104 $1,147 $1,068 29.9% 29.1% 2017 2016 Reported 29.9% 28.1% 2017 2016 Adjusted(1) (1) Excludes $36 million of pre‐tax restructuring charges in 2016. AS A % OF SALES
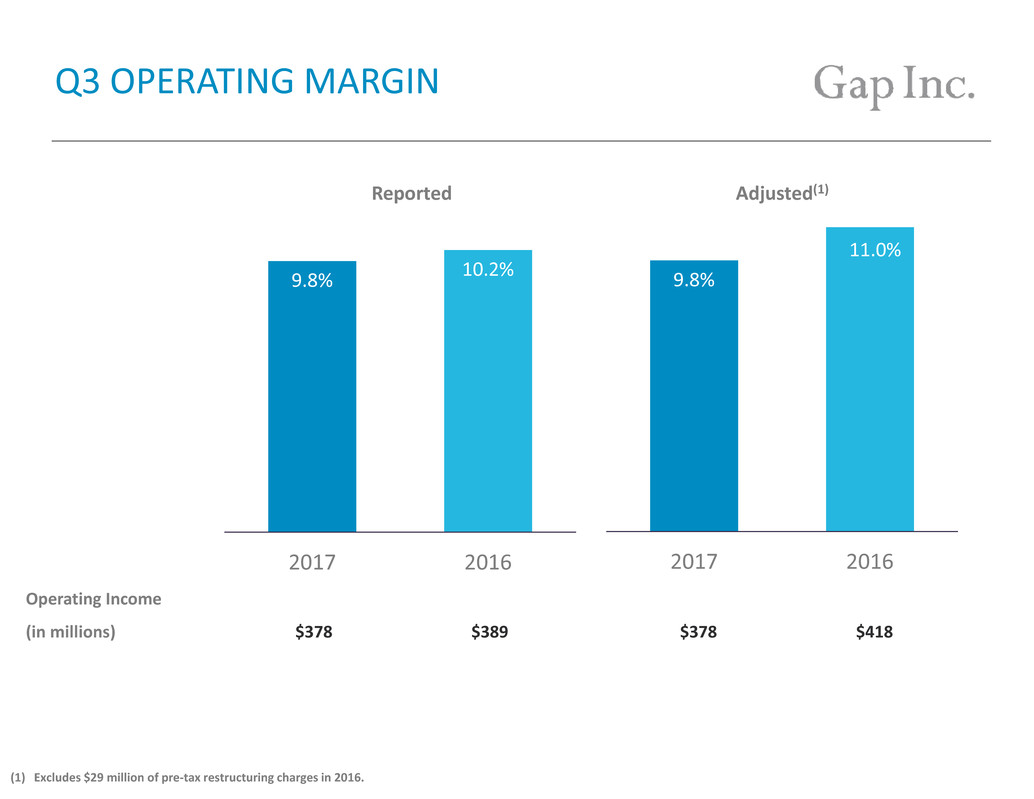
Q3 OPERATING MARGIN 9.8% 10.2% 2017 2016 Reported 9.8% 11.0% 2017 2016 Operating Income (in millions) $378 $389 $378 $418 Adjusted(1) (1) Excludes $29 million of pre‐tax restructuring charges in 2016.
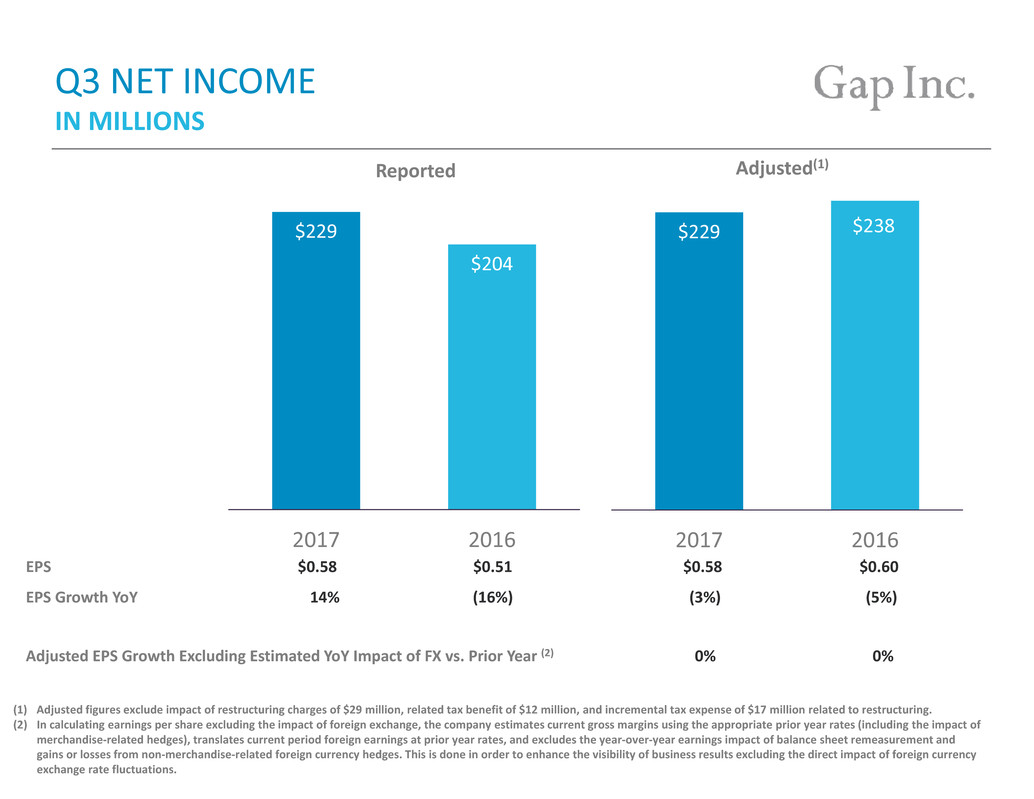
Q3 NET INCOME IN MILLIONS $229 $204 2017 2016 Reported $229 $238 2017 2016 EPS $0.58 $0.51 $0.58 $0.60 EPS Growth YoY 14% (16%) (3%) (5%) Adjusted EPS Growth Excluding Estimated YoY Impact of FX vs. Prior Year (2) 0% 0% Adjusted(1) (1) Adjusted figures exclude impact of restructuring charges of $29 million, related tax benefit of $12 million, and incremental tax expense of $17 million related to restructuring. (2) In calculating earnings per share excluding the impact of foreign exchange, the company estimates current gross margins using the appropriate prior year rates (including the impact of merchandise‐related hedges), translates current period foreign earnings at prior year rates, and excludes the year‐over‐year earnings impact of balance sheet remeasurement and gains or losses from non‐merchandise‐related foreign currency hedges. This is done in order to enhance the visibility of business results excluding the direct impact of foreign currency exchange rate fluctuations.
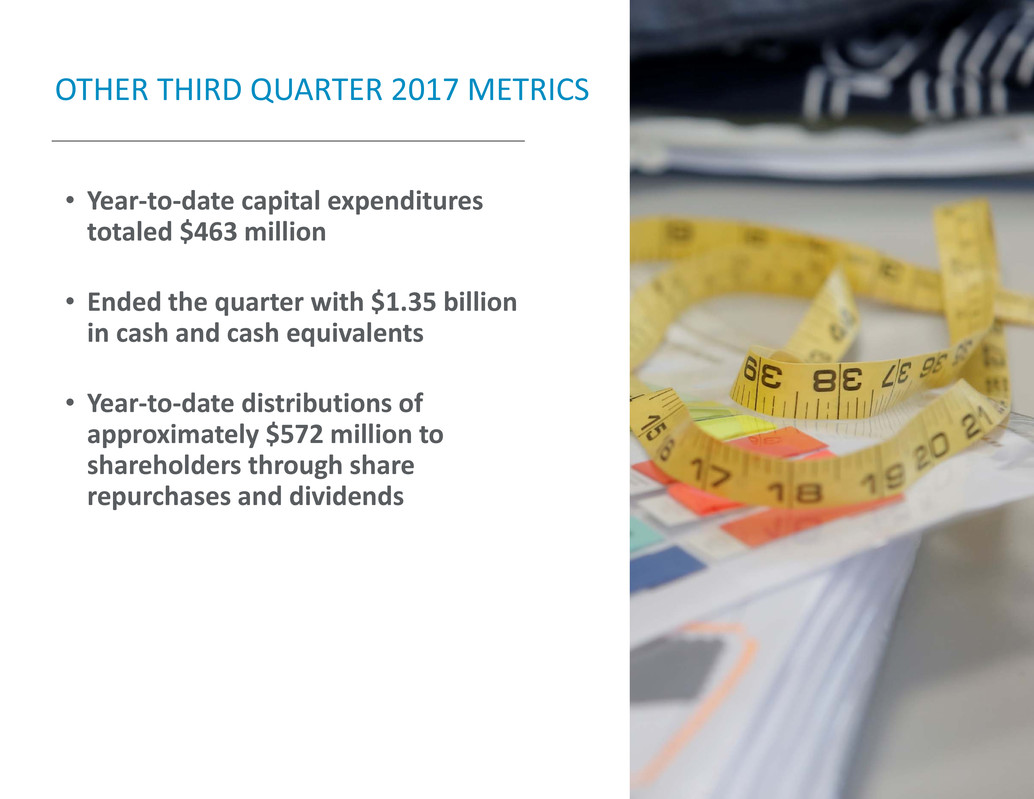
OTHER THIRD QUARTER 2017 METRICS • Year‐to‐date capital expenditures totaled $463 million • Ended the quarter with $1.35 billion in cash and cash equivalents • Year‐to‐date distributions of approximately $572 million to shareholders through share repurchases and dividends
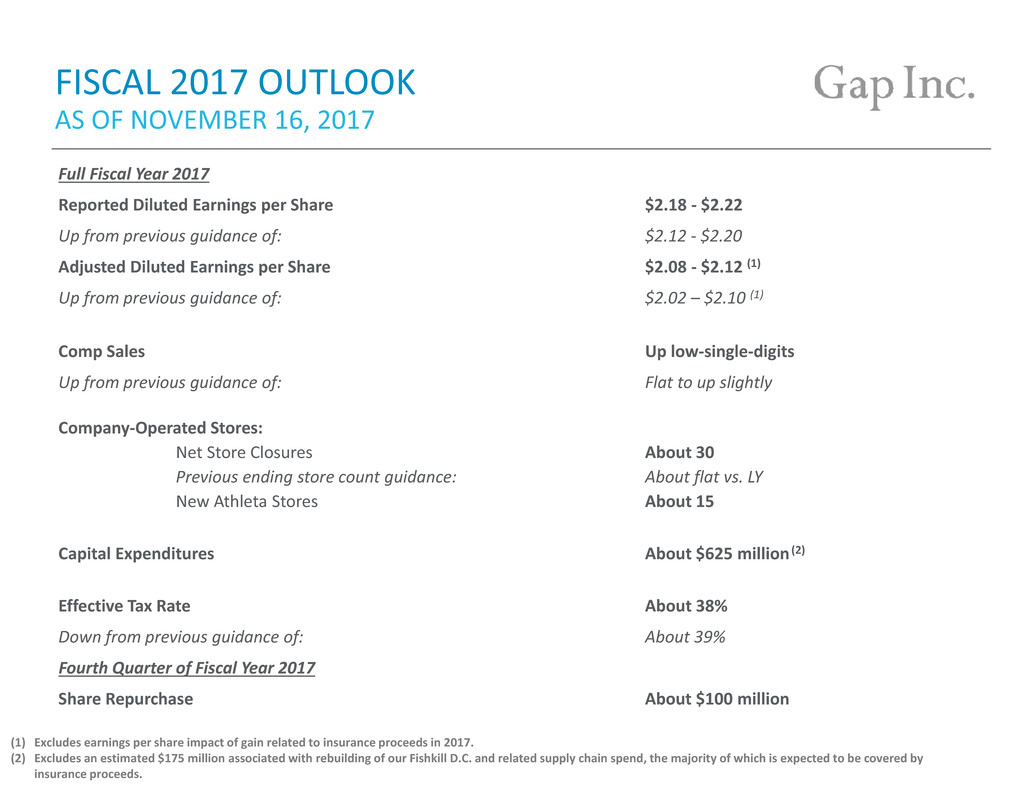
FISCAL 2017 OUTLOOK Full Fiscal Year 2017 Reported Diluted Earnings per Share $2.18 ‐ $2.22 Up from previous guidance of: $2.12 ‐ $2.20 Adjusted Diluted Earnings per Share $2.08 ‐ $2.12 (1) Up from previous guidance of: $2.02 – $2.10 (1) Comp Sales Up low‐single‐digits Up from previous guidance of: Flat to up slightly Company‐Operated Stores: Net Store Closures About 30 Previous ending store count guidance: About flat vs. LY New Athleta Stores About 15 Capital Expenditures About $625 million(2) Effective Tax Rate About 38% Down from previous guidance of: About 39% Fourth Quarter of Fiscal Year 2017 Share Repurchase About $100 million AS OF NOVEMBER 16, 2017 (1) Excludes earnings per share impact of gain related to insurance proceeds in 2017. (2) Excludes an estimated $175 million associated with rebuilding of our Fishkill D.C. and related supply chain spend, the majority of which is expected to be covered by insurance proceeds.


