
GAP INC. FISCAL 2018 SECOND QUARTER EARNINGS RESULTS ART PECK PRESIDENT & CHIEF EXECUTIVE OFFICER TERI LIST-STOLL EXECUTIVE VICE PRESIDENT & CHIEF FINANCIAL OFFICER
DISCLOSURE STATEMENT FORWARD LOOKING STATEMENTS This conference call and webcast contain forward-looking statements within the "safe harbor" provisions of the Private Securities Litigation Reform Act of 1995. All statements other than those that are purely historical are forward-looking statements. Forward-looking statements include statements identified as such in our August 23, 2018 press release. Because these forward-looking statements involve risks and uncertainties, there are important factors that could cause our actual results to differ materially from those in the forward-looking statements. Information regarding factors that could cause results to differ can be found in our August 23, 2018 earnings press release, our Annual Report on Form 10-K for the fiscal year ended February 3, 2018, and our subsequent filings with the U.S. Securities and Exchange Commission, all of which are available on gapinc.com. These forward-looking statements are based on information as of August 23, 2018. We assume no obligation to publicly update or revise our forward-looking statements even ifSEC experience REGULATION or future G changes make it clear that any projected results expressed or implied therein will not be realized. This presentation includes the non-GAAP measures adjusted net income, adjusted earnings per share, adjusted operating income, adjusted operating income as a percent of net sales, adjusted operating expenses, adjusted operating expenses as a percent of net sales, and free cash flow. The descriptions and reconciliations of these measures from GAAP are included in our August 23, 2018 earnings press release, which is available on gapinc.com. 2
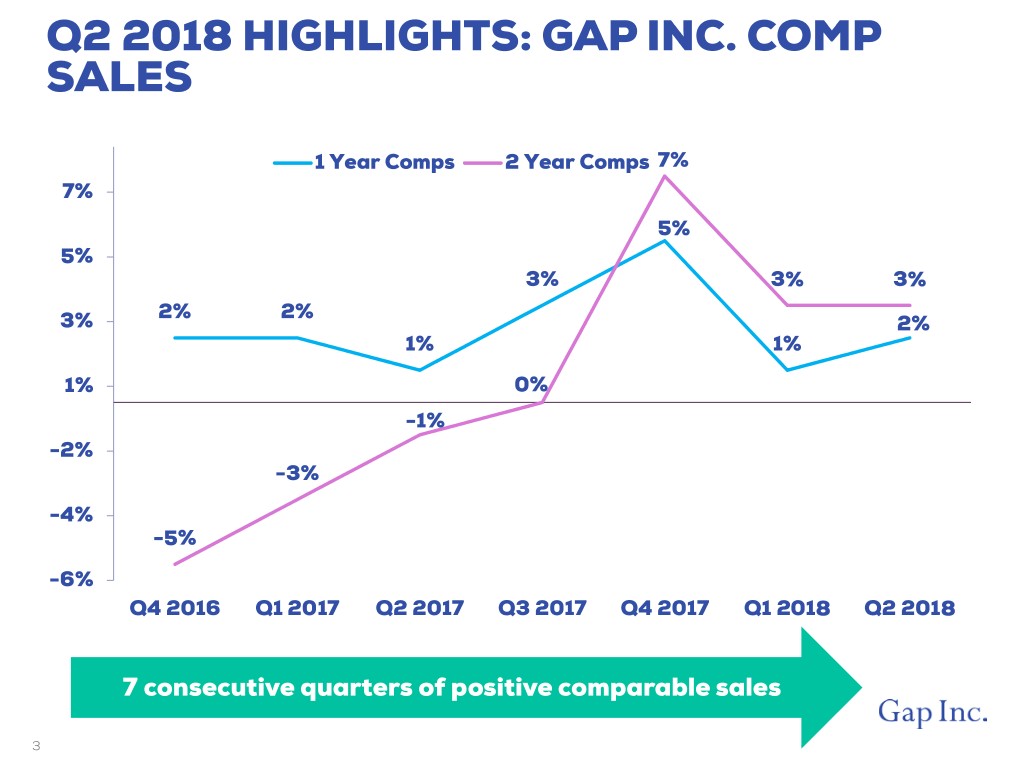
Q2 2018 HIGHLIGHTS: GAP INC. COMP SALES 1 Year Comps 2 Year Comps 7% 7% 5% 5% 3% 3% 3% 2% 2% 3% 2% 1% 1% 1% 0% -1% -2% -3% -4% -5% -6% Q4 2016 Q1 2017 Q2 2017 Q3 2017 Q4 2017 Q1 2018 Q2 2018 7 consecutive quarters of positive comparable sales 3
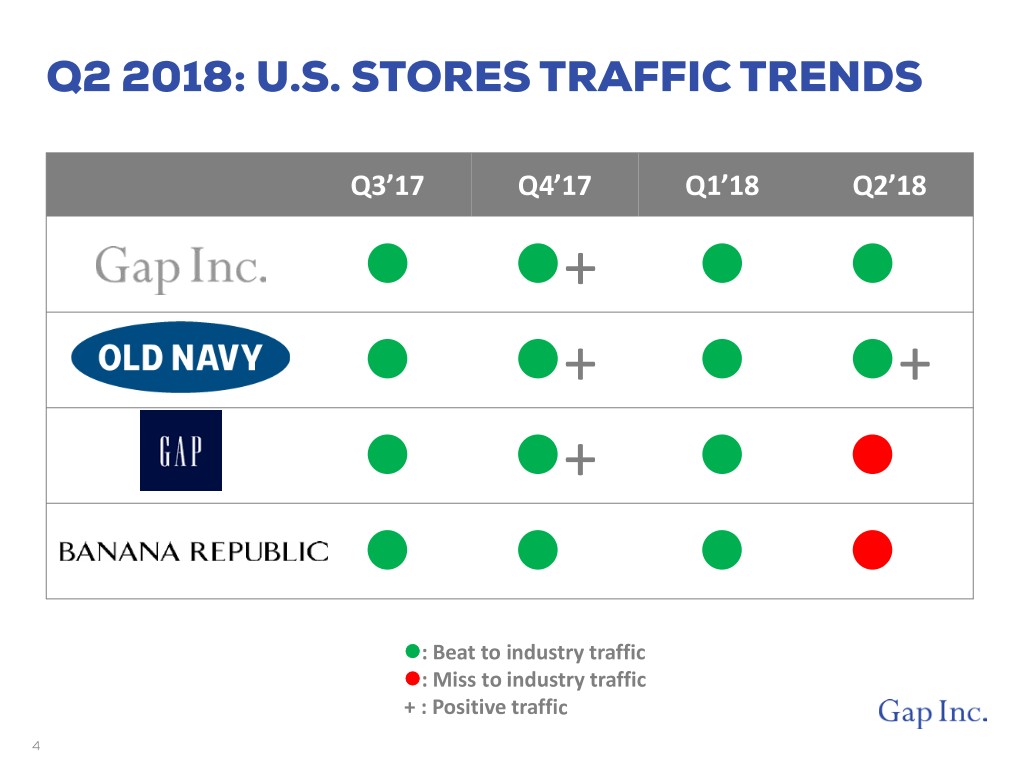
Q2 2018: U.S. STORES TRAFFIC TRENDS Q3’17 Q4’17 Q1’18 Q2’18 + _ + + + _ _ _ : Beat to industry traffic : Miss to industry traffic + : Positive traffic 4
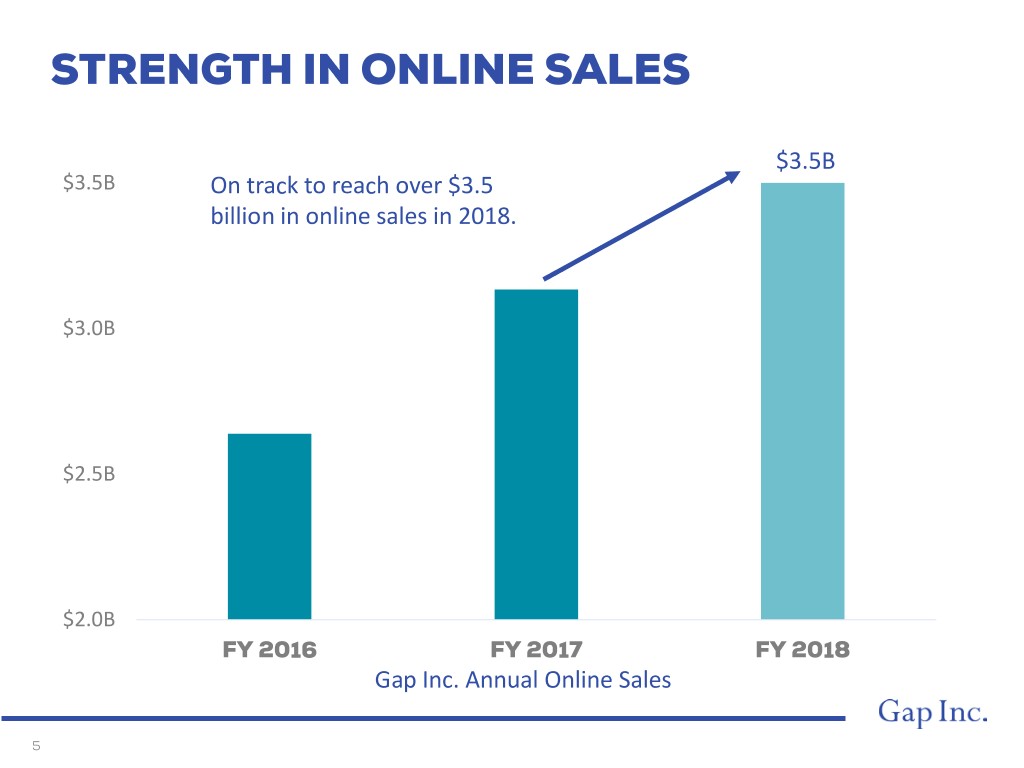
STRENGTH IN ONLINE SALES $3.5B $3.5B On track to reach over $3.5 billion in online sales in 2018. $3.0B $2.5B $2.0B FY 2016 FY 2017 FY 2018 Gap Inc. Annual Online Sales 5
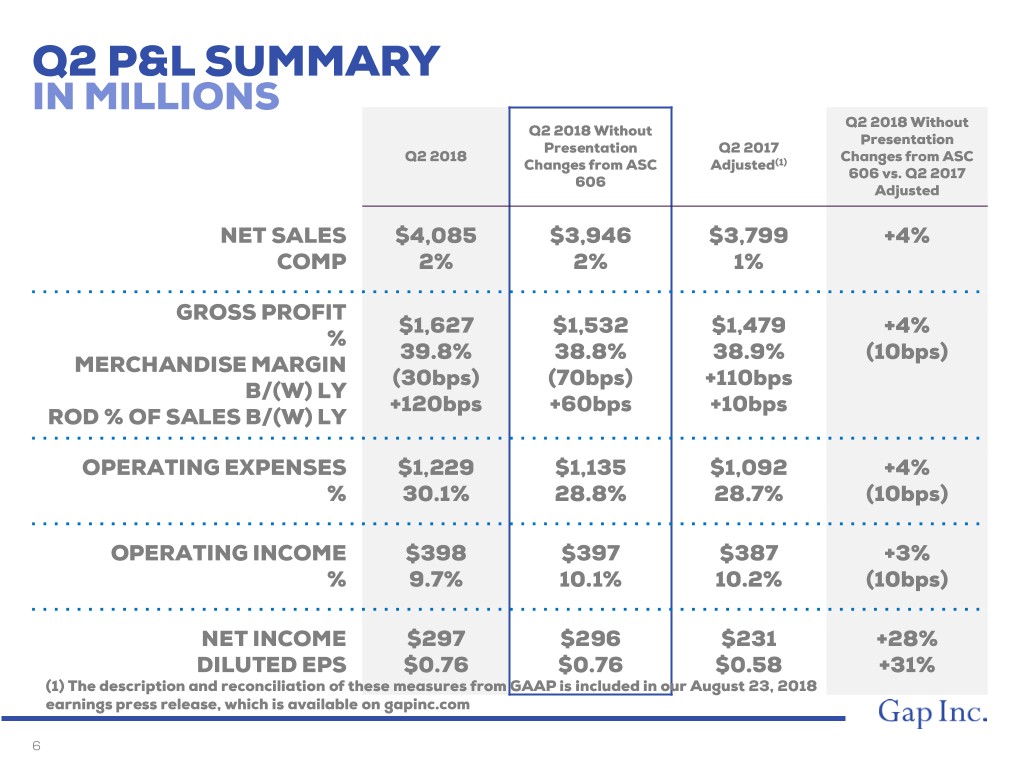
Q2 P&L SUMMARY IN MILLIONS Q2 2018 Without Q2 2018 Without Presentation Presentation Q2 2017 Q2 2018 Changes from ASC Changes from ASC Adjusted(1) 606 vs. Q2 2017 606 Adjusted NET SALES $4,085 $3,946 $3,799 +4% COMP 2% 2% 1% GROSS PROFIT $1,627 $1,532 $1,479 +4% % 39.8% 38.8% 38.9% (10bps) MERCHANDISE MARGIN (30bps) (70bps) +110bps B/(W) LY +120bps +60bps +10bps ROD % OF SALES B/(W) LY OPERATING EXPENSES $1,229 $1,135 $1,092 +4% % 30.1% 28.8% 28.7% (10bps) OPERATING INCOME $398 $397 $387 +3% % 9.7% 10.1% 10.2% (10bps) NET INCOME $297 $296 $231 +28% DILUTED EPS $0.76 $0.76 $0.58 +31% (1) The description and reconciliation of these measures from GAAP is included in our August 23, 2018 earnings press release, which is available on gapinc.com 6
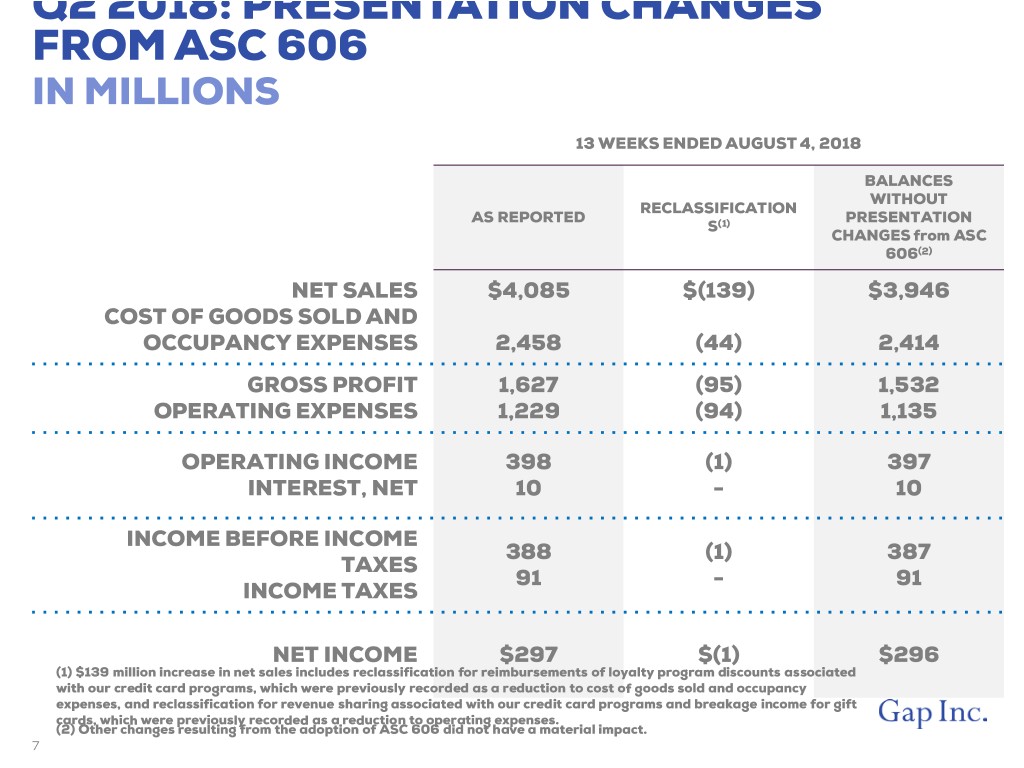
Q2 2018: PRESENTATION CHANGES FROM ASC 606 IN MILLIONS 13 WEEKS ENDED AUGUST 4, 2018 BALANCES WITHOUT RECLASSIFICATION AS REPORTED PRESENTATION S(1) CHANGES from ASC 606(2) NET SALES $4,085 $(139) $3,946 COST OF GOODS SOLD AND OCCUPANCY EXPENSES 2,458 (44) 2,414 GROSS PROFIT 1,627 (95) 1,532 OPERATING EXPENSES 1,229 (94) 1,135 OPERATING INCOME 398 (1) 397 INTEREST, NET 10 - 10 INCOME BEFORE INCOME 388 (1) 387 TAXES 91 - 91 INCOME TAXES NET INCOME $297 $(1) $296 (1) $139 million increase in net sales includes reclassification for reimbursements of loyalty program discounts associated with our credit card programs, which were previously recorded as a reduction to cost of goods sold and occupancy expenses, and reclassification for revenue sharing associated with our credit card programs and breakage income for gift cards, which were previously recorded as a reduction to operating expenses. (2) Other changes resulting from the adoption of ASC 606 did not have a material impact. 7
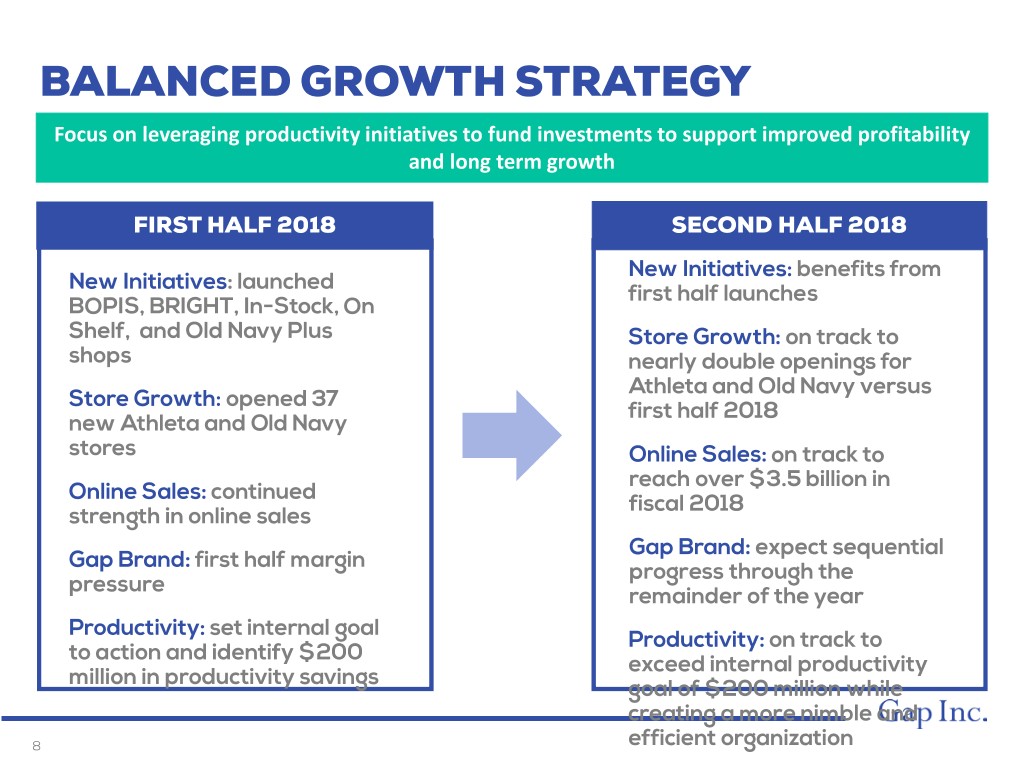
BALANCED GROWTH STRATEGY Focus on leveraging productivity initiatives to fund investments to support improved profitability and long term growth FIRST HALF 2018 SECOND HALF 2018 New Initiatives: benefits from New Initiatives: launched first half launches BOPIS, BRIGHT, In-Stock, On Shelf, and Old Navy Plus Store Growth: on track to shops nearly double openings for Athleta and Old Navy versus Store Growth: opened 37 first half 2018 new Athleta and Old Navy stores Online Sales: on track to reach over $3.5 billion in Online Sales: continued fiscal 2018 strength in online sales Gap Brand: expect sequential Gap Brand: first half margin progress through the pressure remainder of the year Productivity: set internal goal Productivity: on track to to action and identify $200 exceed internal productivity million in productivity savings goal of $200 million while creating a more nimble and 8 efficient organization
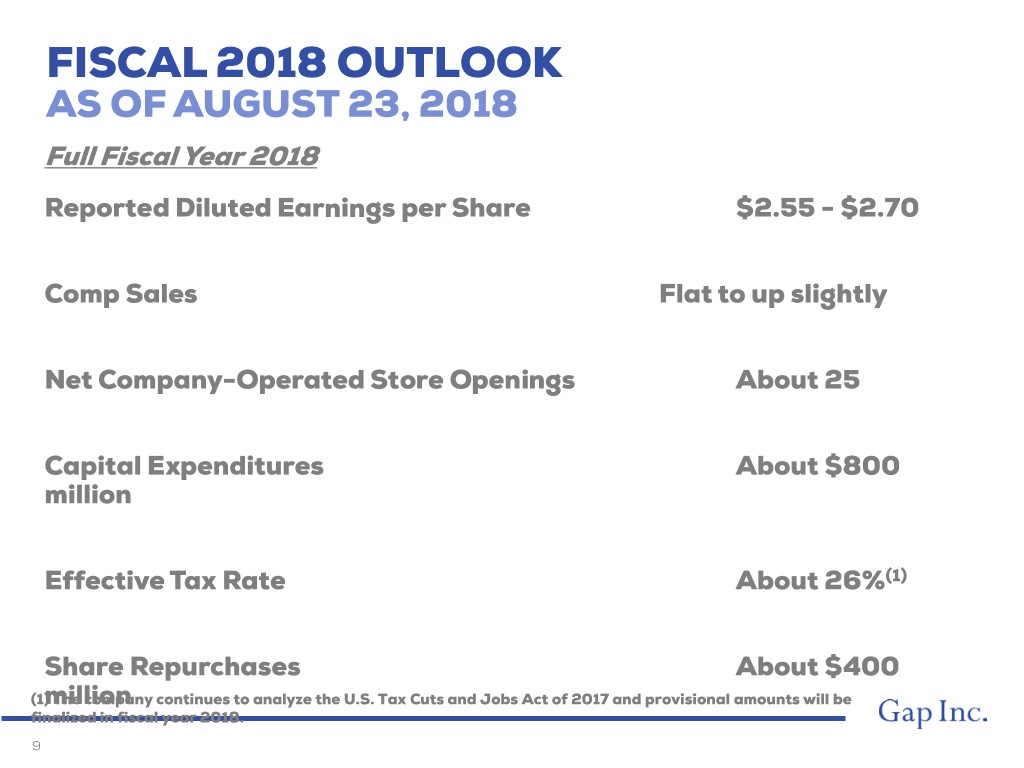
FISCAL 2018 OUTLOOK AS OF AUGUST 23, 2018 Full Fiscal Year 2018 Reported Diluted Earnings per Share $2.55 - $2.70 Comp Sales Flat to up slightly Net Company-Operated Store Openings About 25 Capital Expenditures About $800 million Effective Tax Rate About 26%(1) Share Repurchases About $400 (1)million The company continues to analyze the U.S. Tax Cuts and Jobs Act of 2017 and provisional amounts will be finalized in fiscal year 2018. 9


