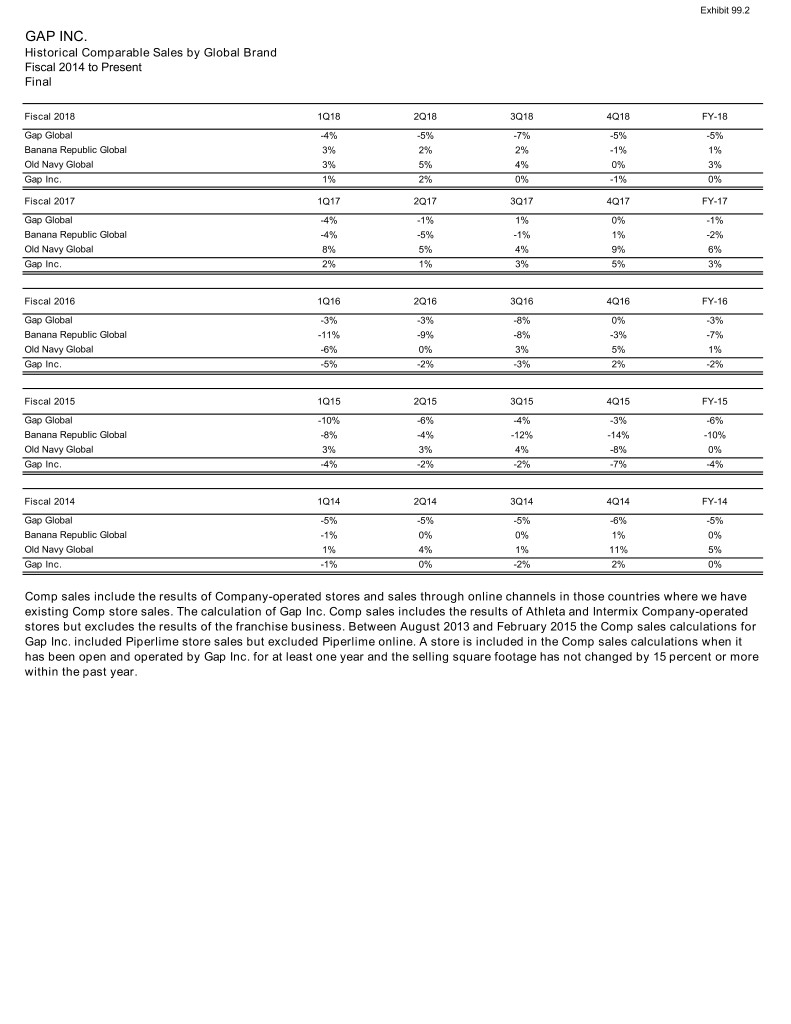
Exhibit 99.2 GAP INC. Historical Comparable Sales by Global Brand Fiscal 2014 to Present Final Fiscal 2018 1Q18 2Q18 3Q18 4Q18 FY-18 Gap Global -4% -5% -7% -5% -5% Banana Republic Global 3% 2% 2% -1% 1% Old Navy Global 3% 5% 4% 0% 3% Gap Inc. 1% 2% 0% -1% 0% Fiscal 2017 1Q17 2Q17 3Q17 4Q17 FY-17 Gap Global -4% -1% 1% 0% -1% Banana Republic Global -4% -5% -1% 1% -2% Old Navy Global 8% 5% 4% 9% 6% Gap Inc. 2% 1% 3% 5% 3% Fiscal 2016 1Q16 2Q16 3Q16 4Q16 FY-16 Gap Global -3% -3% -8% 0% -3% Banana Republic Global -11% -9% -8% -3% -7% Old Navy Global -6% 0% 3% 5% 1% Gap Inc. -5% -2% -3% 2% -2% Fiscal 2015 1Q15 2Q15 3Q15 4Q15 FY-15 Gap Global -10% -6% -4% -3% -6% Banana Republic Global -8% -4% -12% -14% -10% Old Navy Global 3% 3% 4% -8% 0% Gap Inc. -4% -2% -2% -7% -4% Fiscal 2014 1Q14 2Q14 3Q14 4Q14 FY-14 Gap Global -5% -5% -5% -6% -5% Banana Republic Global -1% 0% 0% 1% 0% Old Navy Global 1% 4% 1% 11% 5% Gap Inc. -1% 0% -2% 2% 0% Comp sales include the results of Company-operated stores and sales through online channels in those countries where we have existing Comp store sales. The calculation of Gap Inc. Comp sales includes the results of Athleta and Intermix Company-operated stores but excludes the results of the franchise business. Between August 2013 and February 2015 the Comp sales calculations for Gap Inc. included Piperlime store sales but excluded Piperlime online. A store is included in the Comp sales calculations when it has been open and operated by Gap Inc. for at least one year and the selling square footage has not changed by 15 percent or more within the past year.
The Gap, Inc. (GAP) 8-KGap Inc. Reports Fourth Quarter and Fiscal Year 2018 Results
Filed: 28 Feb 19, 4:18pm