
Company and Industry Profile MARCH 2015 GATX Corporation Unless otherwise noted, GATX is the source for data provided
2 NYSE: GMT Forward-Looking Statements Forward-looking statements in this presentation that are not historical facts are “forward-looking statements” within the meaning of the Private Securities Litigation Reform Act of 1995. These include statements that reflect our current views with respect to, among other things, future events, financial performance and market conditions. In some cases, you can identify forward-looking statements by the use of words such as “may,” “could,” “expect,” “intend,” “plan,” “seek,” “anticipate,” “believe,” “estimate,” “predict,” “potential,” “continue,” “likely,” “will,” “would” and variations of these terms and similar expressions, or the negative of these terms or similar expressions. Specific risks and uncertainties include, but are not limited to, (1) changes in regulatory requirements for tank cars carrying crude, ethanol, and other flammable liquids, (2) competitive factors in our primary markets (3) weak economic conditions, financial market volatility, and other factors that may decrease demand for our assets and services, (4) inability to maintain our assets on lease at satisfactory rates, (5) changes to, or failure to comply with, laws, rules, and regulations applicable to our assets and operations, (6) operational disruption and increased costs associated with compliance maintenance programs and other maintenance initiatives, (7) financial and operational risks associated with long-term railcar purchase commitments, (8) deterioration of conditions in the capital markets, reductions in our credit ratings, or increases in our financing costs, (9) events having an adverse impact on assets, customers, or regions where we have a large investment, (10) decreased demand for certain railcars used in the petroleum industry due to sustained low crude oil prices, (11) risks related to international operations and expansion into new geographic markets, (12) inadequate allowances to cover credit losses in our portfolio, (13) asset impairment charges we may be required to recognize, (14) environmental remediation costs or a negative outcome in pending or threatened litigation, (15) inability to obtain cost-effective insurance, (16) fluctuations in foreign exchange rates, (17) operational and financial risks related to our affiliate investments, (18) reduced opportunities to generate asset remarketing income, (19) failure to successfully negotiate collective bargaining agreements with the unions representing a substantial portion of our employees, and (20) other risks discussed in our filings with the US Securities and Exchange Commission (“SEC”), including our Form 10-K for the year ended December 31, 2014, and our subsequently filed Form 10-Q reports, all of which are available on the SEC’s website (www.sec.gov). You should not place undue reliance on forward-looking statements, which speak only as of the date they are made and are not guarantees of future performance. The Company undertakes no obligation to publicly update or revise any forward-looking statements.

3 GATX Corporation Clear vision and rich history Vision We strive to be recognized as the finest railcar leasing company in the world by our customers, our shareholders, our employees and the communities where we operate. History 1898 1919 2015 Founded as a railcar lessor Initiated quarterly dividends • Railcar leasing remains primary business • 96th consecutive year of uninterrupted dividends • Recently raised quarterly dividend by more than 15%

4 Leading Market Positions Rail North America 66% Other 3% Asset Mix $7.6 billion NBV (assets on- and off-balance sheet) as of 12/31/14 Rail International 16% Portfolio Management 11% ASC(2) 4% Rail North America • Largest independent railcar lessor in North America • 2nd largest tank car lessor • Diversified fleet and customer mix • Extensive maintenance network Rail International • 2nd largest European tank car lessor • Largest railcar lessor in India American Steamship Company • Largest US-flagged vessel operator on the Great Lakes Portfolio Management • RRPF affiliates(1) own one of the largest spare aircraft engine portfolios in the industry (1) Rolls-Royce & Partners Finance affiliates; a collection of 50%-owned joint ventures with Rolls-Royce plc (2) American Steamship Company See the Appendix for a reconciliation of non-GAAP measures
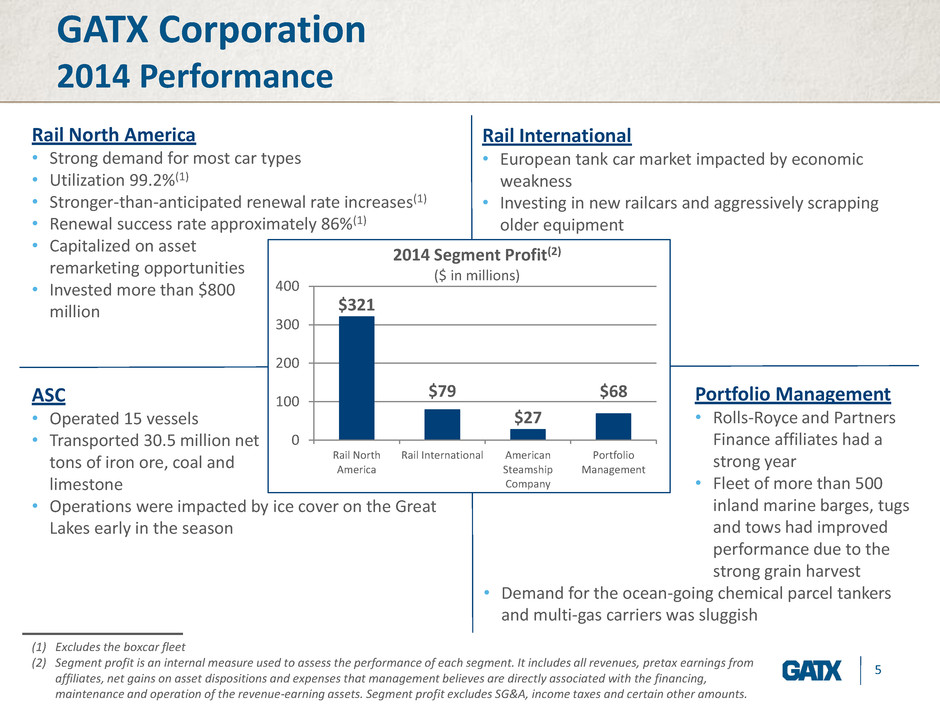
5 GATX Corporation 2014 Performance Portfolio Management • Rolls-Royce and Partners Finance affiliates had a strong year • Fleet of more than 500 inland marine barges, tugs and tows had improved performance due to the strong grain harvest • Demand for the ocean-going chemical parcel tankers and multi-gas carriers was sluggish Rail North America • Strong demand for most car types • Utilization 99.2%(1) • Stronger-than-anticipated renewal rate increases(1) • Renewal success rate approximately 86%(1) • Capitalized on asset remarketing opportunities • Invested more than $800 million Rail International • European tank car market impacted by economic weakness • Investing in new railcars and aggressively scrapping older equipment ASC • Operated 15 vessels • Transported 30.5 million net tons of iron ore, coal and limestone • Operations were impacted by ice cover on the Great Lakes early in the season (1) Excludes the boxcar fleet (2) Segment profit is an internal measure used to assess the performance of each segment. It includes all revenues, pretax earnings from affiliates, net gains on asset dispositions and expenses that management believes are directly associated with the financing, maintenance and operation of the revenue-earning assets. Segment profit excludes SG&A, income taxes and certain other amounts. $321 $79 $27 $68 0 100 200 300 400 Rail North America Rail International American Steamship Company Portfolio Management 2014 Segment Profit(2) ($ in millions)

6 GATX’s Worldwide Railcar Fleet

7 Owned 126,000 Affiliate 3,000 Managed 2,000 Total 131,000 Owned 22,000 GATX owns, manages or has an interest in approximately 154,000 railcars worldwide, making it the largest global railcar lessor. Strong Global Presence Fleet data as of 12/31/14 Early stage presence in India

8 GATX Worldwide Railcar Fleet Refiners & Other Petroleum 30% Chemicals & Plastics 28% Railroads & Other Transports 17% Food & Agriculture 9% Mining, Minerals & Aggregates 6% Other 10% Industries Served Based on 2014 Rail North America & Rail International revenues of approximately $1.1 billion General- Service Tank Cars 37% High- Pressure Tank Cars 10% Specialty & Acid Tank Cars 7% Gravity Covered Hoppers 11% Pneumatic & Specialty Covered Hoppers 9% Boxcars 13% Open-Top Cars 9% Other 4% Car Types Approximately 149,000 wholly owned railcars as of 12/31/14
9 Railcar Leasing
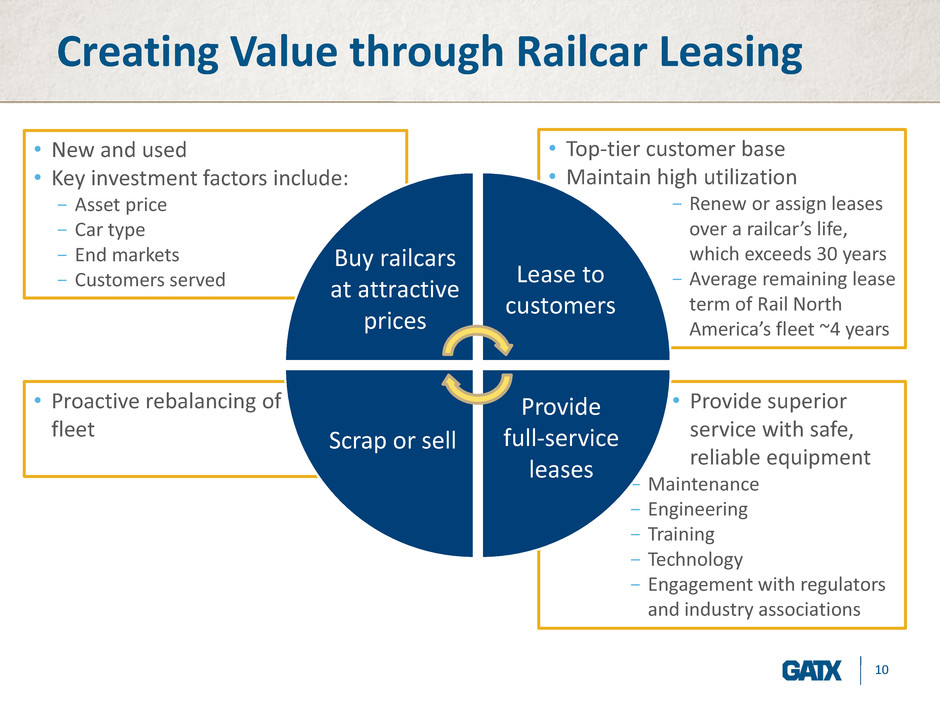
10 • Provide superior service with safe, reliable equipment − Maintenance − Engineering − Training − Technology − Engagement with regulators and industry associations • Top-tier customer base • Maintain high utilization − Renew or assign leases over a railcar’s life, which exceeds 30 years − Average remaining lease term of Rail North America’s fleet ~4 years • New and used • Key investment factors include: − Asset price − Car type − End markets − Customers served • Proactive rebalancing of fleet Buy railcars at attractive prices Lease to customers Provide full-service leases Creating Value through Railcar Leasing Scrap or sell

11 Creating Value through Railcar Leasing Buy railcars at attractive prices

12 Opportunistic Investments NEW RAILCARS Committed new railcar orders ensure a supply of new cars to meet customer needs in North America • Order for up to 8,950 railcars to deliver over a four-year period beginning in 2016 • Order for 12,500 railcars to deliver over a five-year period placed in early 2011 Investing in new tank cars in Europe as customers are focused on modernizing their rail fleets SECONDARY MARKET Acquired a fleet of more than 18,500 boxcars for $340 million in 2014 Acquired attractively priced railcars in North America during the downturn (late 2008 through 2010) • Invested nearly $1 billion for more than 18,000 cars • Achieving high returns when leases are repriced or cars are sold

13 Creating Value through Railcar Leasing Lease to customers

14* Customer families sometimes include more than one customer account, therefore the S&P or equivalent ratings noted generally reflect the credit quality of the rated parent entity. Lease obligations of subsidiaries are not necessarily guaranteed by the rated parent entity. Approximately 950 Rail North America and Rail International customers • No customer exceeds 3% of GATX’s total revenues Long-standing relationships • Average relationship tenure among top ten customers is 49 years Impressive Worldwide Customer Base AAA & AA 12% A 20% BBB 32% BB or < 16% Not rated / Private 20% Credit Ratings of Top 50 Customer Families* 26% 16% 9% 2% 0% 10% 20% 30% Top 20 Top 10 Top 5 Top 1

15 Managing Through Cycles 2005 2006 2007 2008 2009 2010 2011 2012 2013 2014 2015 Approximate # of railcars(1) scheduled for renewal 23,000 20,000 20,000 17,500 15,000 17,000 21,000 20,000 21,000 20,000 17,000 LP I(2 ) d at a Rate change 9.9% 16.8% 13.5% 5.2% -11.0% -15.8% 6.9% 25.6% 34.5% 38.8% mid- 30% Term (months) 50 64 67 63 41 35 45 60 62 66 Renewal success rate 81% 77% 73% 60% 54% 62% 77% 82% 81% 86% In favorable environments, GATX increases lease rates and stretches lease terms In weak environments, GATX shortens lease terms (1) Excludes the boxcar fleet (2) LPI = Lease Price Index: The average renewal lease rate change is reported as the % change between the average renewal lease rate and the average expiring lease rate, weighted by GATX’s North American fleet composition, excluding boxcars. North American railcar fleet(1): • Leases are typically fixed rate, paid monthly • The average remaining lease term is approximately four years

16 Rail North America Managing Through Cycles • GATX used the up market (2004 – early 2008) to prepare for the downturn • GATX maintained solid utilization throughout the downturn (late 2008 – 2010) • When the market improved, GATX increased lease rates and extended lease terms while maintaining high utilization (2011 – 2014) Rail North America Fleet Utilization* 80% 82% 84% 86% 88% 90% 92% 94% 96% 98% 100% 1 9 9 8 1 9 9 9 2 0 0 0 2 0 0 1 2 0 0 2 2 0 0 3 2 0 0 4 2 0 0 5 2 0 0 6 2 0 0 7 2 0 0 8 2 0 0 9 2 0 1 0 2 0 1 1 2 0 1 2 2 0 1 3 2 0 1 4 95% 90% 99% * Excludes the boxcar fleet
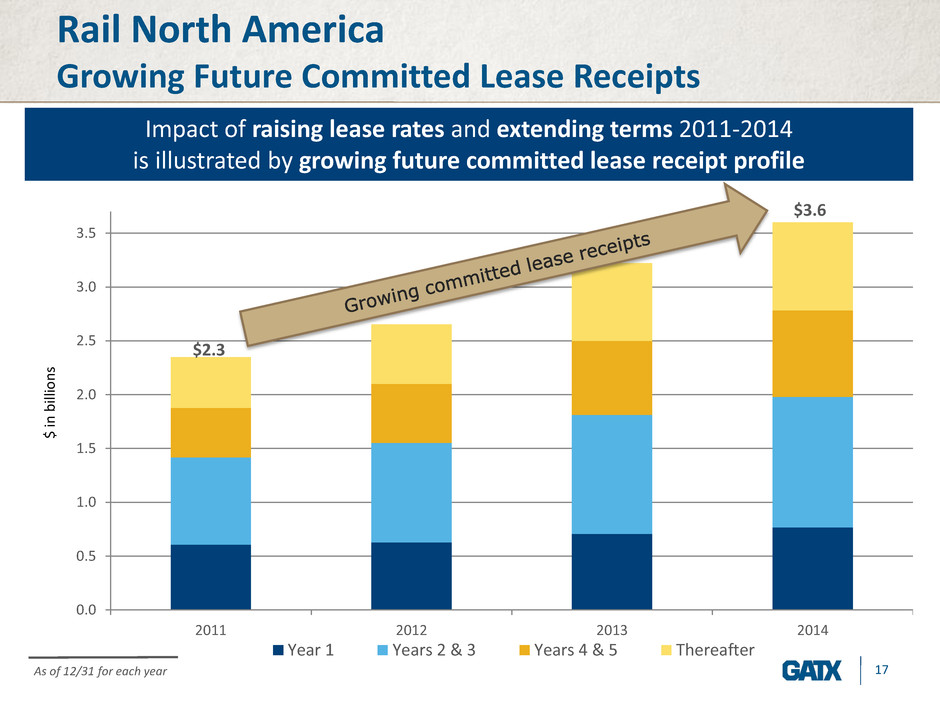
17 Rail North America Growing Future Committed Lease Receipts 0.0 0.5 1.0 1.5 2.0 2.5 3.0 3.5 2011 2012 2013 2014 $ in b illi o n s Year 1 Years 2 & 3 Years 4 & 5 Thereafter Impact of raising lease rates and extending terms 2011-2014 is illustrated by growing future committed lease receipt profile As of 12/31 for each year $2.3 $3.6
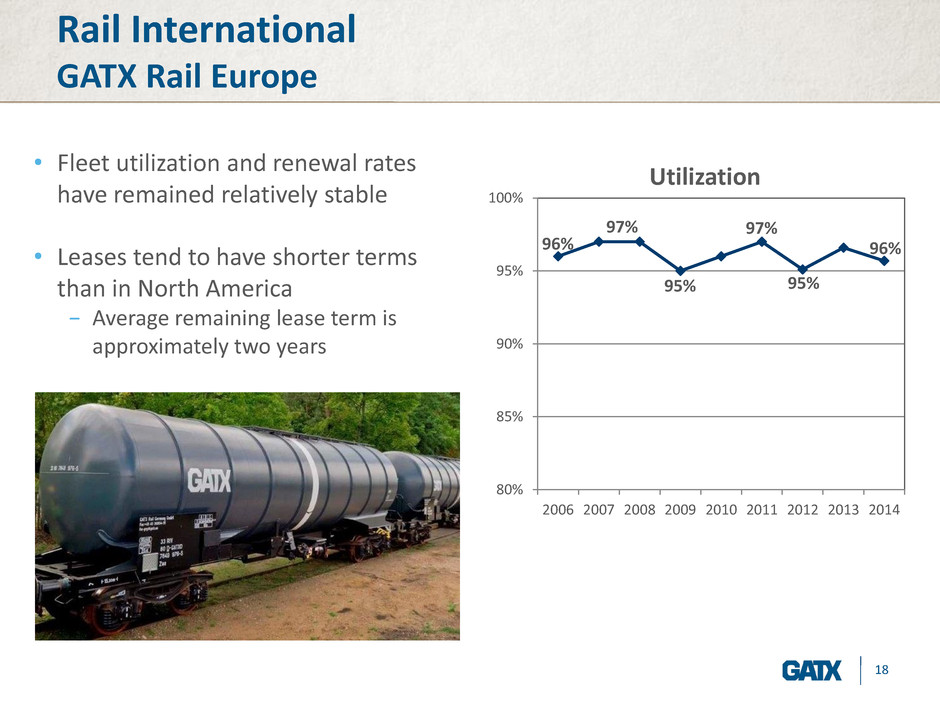
18 Rail International GATX Rail Europe 96% 97% 95% 97% 95% 96% 80% 85% 90% 95% 100% 2006 2007 2008 2009 2010 2011 2012 2013 2014 Utilization • Fleet utilization and renewal rates have remained relatively stable • Leases tend to have shorter terms than in North America − Average remaining lease term is approximately two years

19 Creating Value through Railcar Leasing Provide full-service leases

20 Premium Customer Service • GATX has built and maintained a strong market position by focusing on full-service leasing • GATX consistently provides safe, reliable equipment and superior service to help our customers achieve their business objectives − Maintenance − Engineering − Training − Technology • As a full-service railcar leasing provider, GATX takes an active role in the complex regulatory landscape

21 • Maintaining railcars and locomotives is a complex, continuous process − Customers rely on GATX to manage the maintenance process • Extensive maintenance network in North America − Six major service centers − Five field repair centers − Twenty mobile units − Six customer site locations − Third party-owned shops • In 2014, GATX performed an aggregate of 81,000 service events in its owned and third-party maintenance network in North America • In Europe, GATX has major service centers in Germany and Poland Extensive Maintenance Network
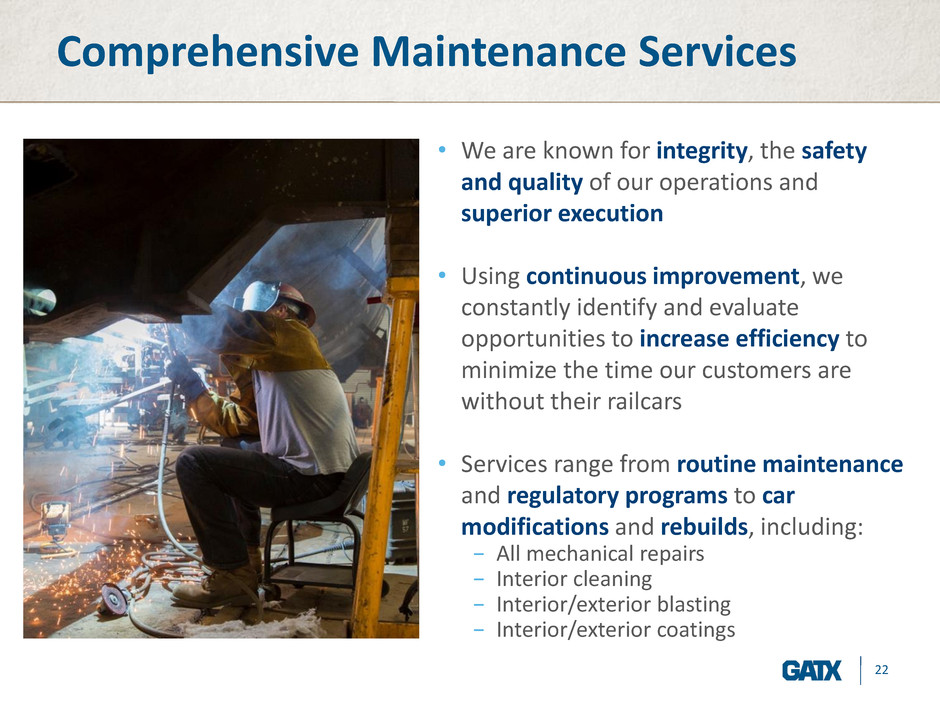
22 Comprehensive Maintenance Services • We are known for integrity, the safety and quality of our operations and superior execution • Using continuous improvement, we constantly identify and evaluate opportunities to increase efficiency to minimize the time our customers are without their railcars • Services range from routine maintenance and regulatory programs to car modifications and rebuilds, including: − All mechanical repairs − Interior cleaning − Interior/exterior blasting − Interior/exterior coatings

23 Engineering Expertise • GATX’s engineering team communicates regularly with customers − Includes experienced mechanical, structural and chemical engineers • GATX’s engineers tailor solutions to meet customer needs − Customers have unique transportation challenges − Factors such as customers’ commodity focus or the location and layout of their facilities are considered • The engineering group supports GATX’s effort to provide quality equipment as GATX continues to grow in emerging rail markets • Examples of engineering support − Preventative maintenance/inspection plans − Car design/specifications − Chemical engineering − Customer-specific enhancements

24 Training • GATX provides important training − Customers need to be well-versed in the equipment and related regulations − First responders learn the proper handling and important features of railcars • GATX offers training at its headquarters and through its TankTrainerTM mobile classroom − This rolling classroom is used to provide training across North America − 21,000+ participants in this hands-on training since its inception in 1993 GATX’s commitment to provide safe, reliable assets goes beyond maintenance and engineering

25 Fleet Management Technology MyGATXRail.com provides real-time maintenance data and fleet management capability to our customers
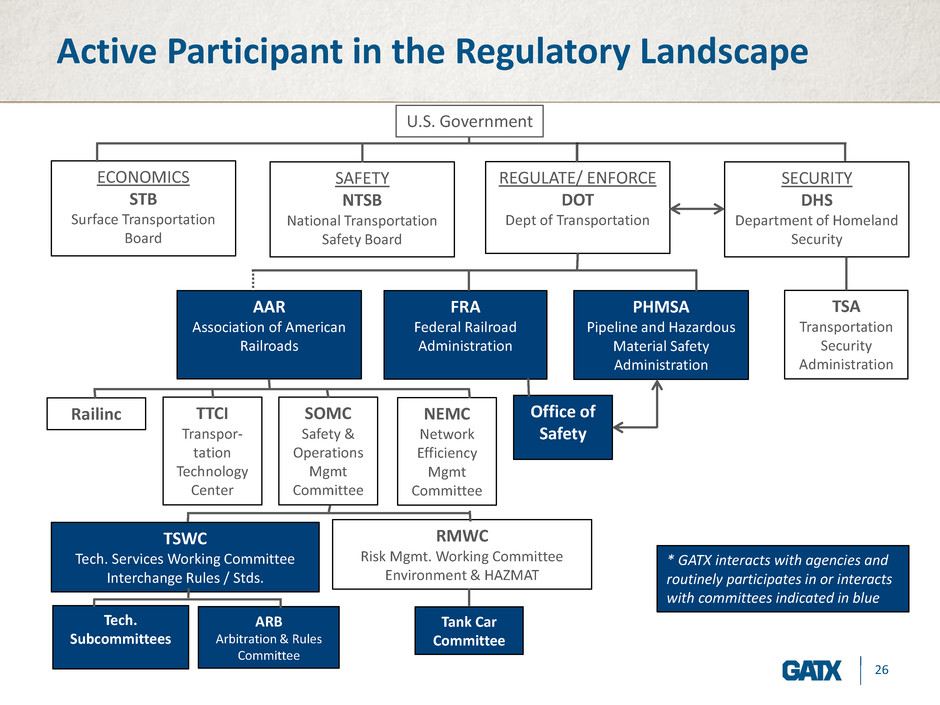
26 Active Participant in the Regulatory Landscape ECONOMICS STB Surface Transportation Board SAFETY NTSB National Transportation Safety Board REGULATE/ ENFORCE DOT Dept of Transportation SECURITY DHS Department of Homeland Security TSA Transportation Security Administration AAR Association of American Railroads FRA Federal Railroad Administration PHMSA Pipeline and Hazardous Material Safety Administration Office of Safety SOMC Safety & Operations Mgmt Committee Railinc TTCI Transpor- tation Technology Center NEMC Network Efficiency Mgmt Committee TSWC Tech. Services Working Committee Interchange Rules / Stds. RMWC Risk Mgmt. Working Committee Environment & HAZMAT Tech. Subcommittees ARB Arbitration & Rules Committee Tank Car Committee * GATX interacts with agencies and routinely participates in or interacts with committees indicated in blue U.S. Government

27 Regulatory Agencies & Industry Groups GATX actively participates in or interacts with several committees within various industry groups in the United States • GATX employees have roles on boards and committees within the AAR: − Associates Advisory Board − Advanced Safety & Efficiency Committee − Arbitration & Rules Committee − Car Repair Billing Committee − Equipment Assets Committee − Equipment Health Monitoring Committee − Locomotive Committee − Tank Car Committee − UMLER Committee − Wheels, Axles, Bearings & Lubrication Committee • GATX employees are involved with various Trade and Supplier Associations: − American Chemistry Council − American Petroleum Institute − Chlorine Institute − Equipment Leasing & Finance Association − The Fertilizer Institute − North American Freight Car Association − Railway Supply Institute − Renewable Fuels Association − Sulfur Institute
28 Creating Value through Railcar Leasing Scrap or sell

29 Maximizing Value GATX continually rebalances and optimizes its railcar fleet • Capitalizes on market dynamics • Maintains a well-balanced railcar portfolio • Optimizes the performance of the railcar fleet GATX typically realizes gains when railcars are scrapped at the end of their useful lives Rail North America 2005 2006 2007 2008 2009 2010 2011 2012 2013 2014 Approximate # of railcars sold 2,000 2,200 1,700 2,900 1,100 1,400 1,800 2,000 3,700 2,100 Asset remarketing income (millions) $12.9 $19.7 $32.2 $31.4 $13.8 $17.4 $27.4 $45.7 $54.5 $62.6 Rail North America & Rail International 2005 2006 2007 2008 2009 2010 2011 2012 2013 2014 Approximate # of railcars scrapped 2,100 2,800 2,500 4,300 4,400 3,800 3,700 2,700 3,200 3,300 Scrapping gains (millions) $9.8 $14.4 $15.4 $29.4 $9.7 $18.0 $27.0 $19.2 $20.7 $16.1

30 Rail North America
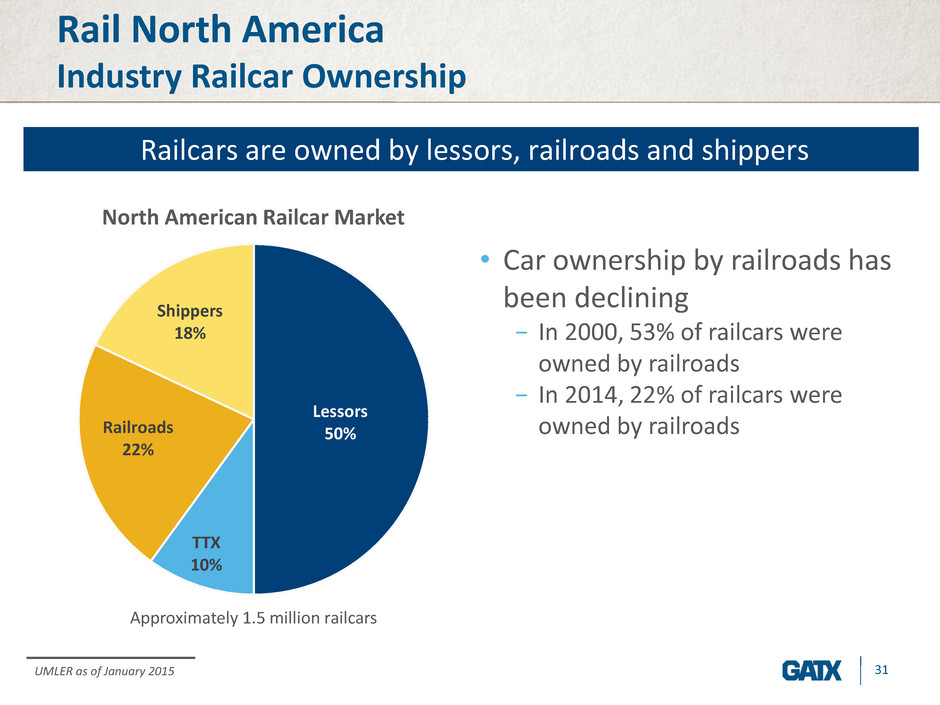
31 Rail North America Industry Railcar Ownership Lessors 50% TTX 10% Railroads 22% Shippers 18% Railcars are owned by lessors, railroads and shippers UMLER as of January 2015 North American Railcar Market Approximately 1.5 million railcars • Car ownership by railroads has been declining − In 2000, 53% of railcars were owned by railroads − In 2014, 22% of railcars were owned by railroads
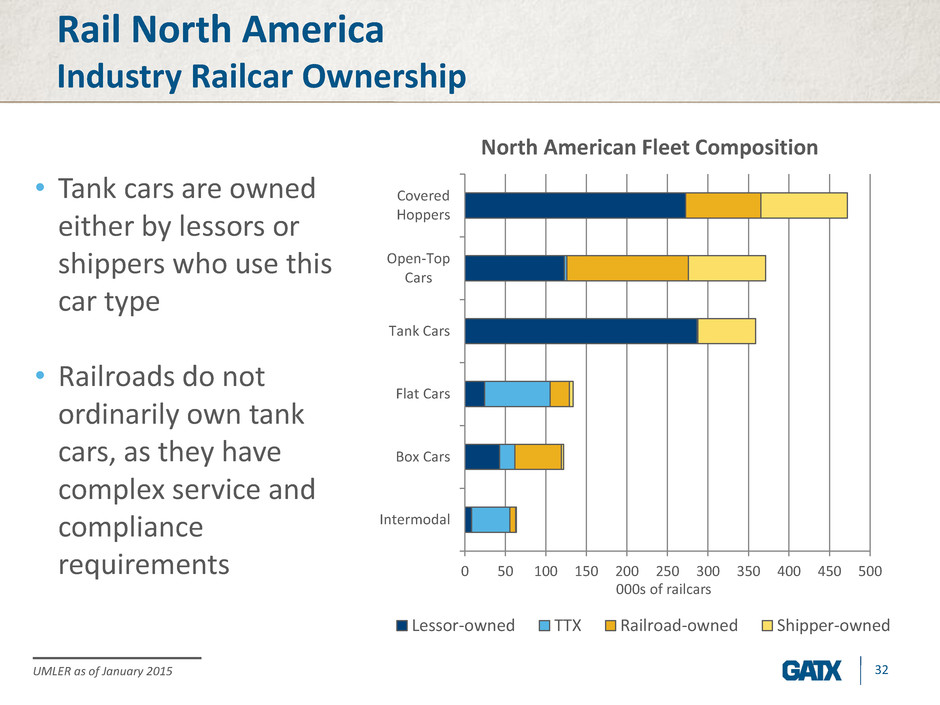
32 Rail North America Industry Railcar Ownership 0 50 100 150 200 250 300 350 400 450 500 Intermodal Box Cars Flat Cars Tank Cars Open-Top Cars Covered Hoppers Lessor-owned TTX Railroad-owned Shipper-owned 000s of railcars • Tank cars are owned either by lessors or shippers who use this car type • Railroads do not ordinarily own tank cars, as they have complex service and compliance requirements North American Fleet Composition UMLER as of January 2015

33 Rail North America Industry Shipments Coal 20% Chemicals 14% Intermodal 13% Food/ Kindred 8% Farm Products 7% Auto 8% Metals 4% All Other 26% • Key commodity markets for North American Class I railroads include − Coal − Chemicals − Intermodal • The chart at the left is based on Class I US revenues − The same chart based on tons originated would show a much higher percentage for coal, reflecting the high-volume of this commodity Shipment Composition Based on 2013 industry revenues of approximately $72.1 billion Association of American Railroads, July 2014

34 Rail North America Industry Carloading Trends 15,000 16,000 17,000 18,000 19,000 20,000 21,000 22,000 2 00 0 2 00 1 2 00 2 2 00 3 2 00 4 2 00 5 2 00 6 2 00 7 2 00 8 2 00 9 2 01 0 2 01 1 2 01 2 2 01 3 2 01 4 17,061 • 2004-2006 rail traffic was driven by increased demand across most major commodity types • Decline in 2007-2008 carloads reflect difficulties in nearly every sector • Carloadings in 2009 down 16.4% from 2008 − Chemical and petroleum products carloads decreased 12.4% and 10.2%, respectively, in 2009 • Decline in carloadings from 2011 to 2013 was due to decreased shipments of coal • Increase in 2014 carloads reflects improvement in nearly every sector Carloads Originated – United States & Canada Railway Supply Institute 21,225 19,374

35 Rail North America Railcar Manufacturing Backlog Railway Supply Institute North American Railcar Manufacturing Backlog 0 20,000 40,000 60,000 80,000 100,000 120,000 140,000 160,000 • Cyclicality of the industry is illustrated by the backlog of orders at the railcar manufacturers • The recent increase in tank car backlog is primarily due to growth in energy markets 1998 1999 2000 2001 2002 2003 2004 2005 2006 2007 2008 2009 2010 2011 2012 2013 2014 Tank Freight

36 Rail North America Tank Car Market • Approximately 360,000 tank cars in North America • About 80% of tank cars are owned by lessors, with the balance owned by shippers GATX 21% Union Tank Car 32% GE Railcar 9% Trinity 13% CIT 8% ARL 8% Other 9% Tank Car Leasing North American Market Share UMLER as of January 2015 Approximately 287,000 tank cars

37 2% 15% 12% 10% 8% 5% 8% 7% 3% 15% 10% 5% Rail North America GATX’s Fleet by Car Type 1 2 3 4 5 6 7 8 9 11 General-Service Tank Cars: 13K - 19K gallon General-Service Tank Cars: 20K – 25K gallon General-Service Tank Cars: >25K gallon High-Pressure Tank Cars Other Specialty Tank Cars Gravity Covered Hoppers: <4K cubic feet Gravity Covered Hoppers: >4K cubic feet Pneumatic Covered Hoppers Specialty Covered Hoppers Boxcars Open-Top Cars Other 1 2 3 4 5 6 7 8 9 11 12 12 Approximately 126,000 wholly owned cars 10 10

38 Rail North America GATX’s Car Types & Typical Commodities General-Service 13K-19K gallon 20K–25K gallon >25K gallon High-Pressure Other Specialty Covered Hoppers Gravity >4K cf Specialty Boxcars <4K cf Pneumatic OtherOpen-Top Cars sand cement roofing granules fly ash dry chemicals grain sugar fertilizer lime soda ash bentonite plastic pellets flour corn starch mineral powder lime clay cement aggregates coal pet coke met coke woodchips scrap metal steel coils flat cars intermodal automotive paper products lumber canned goods food and beverages molten sulfur clay slurry caustic soda corn syrup liquid fertilizers fuel oils asphalt food-grade oils chemicals (styrene, glycols, etc.) LPG VCM propylene carbon dioxide acids (sulfuric, hydrochloric, phosphoric, acetic, nitric, etc.) coal tar pitch dyes & inks specialty chemicals ethanol & methanol food-grade oils lubricating oils light chemicals (solvents, isopentane, alkylates, etc.) light petroleum products (crude oil, fuel oils, diesel, gasoline, etc.) Ta n k Ca rs Fr eig h t C ar s

39 Rulemaking Status Tank Cars in Flammable Liquid Service United States • NPRM released in July 2014 − Introduction of “High-Hazard Flammable Train” (HHFT) concept − Three options for new tank car standards used in HHFT − Aggressive timeline to retrofit or remove existing cars from HHFT service − Speed restrictions, routing and braking − Classification and testing program for certain commodities − Notification to local emergency responders • Comment period ended September 30, 2014 • Expect final rule in May 2015 Canada • Proposal released in July 2014 − Crude oil and ethanol must move in new standard cars or CPC-1232 cars by May 1, 2017 − Existing cars (including CPC-1232s) must be retrofitted or removed from dangerous goods service between 2020 and 2025 depending on packing group • Comments were due September 1, 2014

40 Energy-related Railcar Demand Railcars • We are monitoring demand for small cube covered hoppers to transport frac sand and large tank cars to transport crude oil − Total manufacturing backlog of about 143,000 railcars(1), including approximately − 40,000 small cube covered hoppers − 58,000 tank cars The Market • Approximately 49,000 tank cars in crude service(2) • Crude-carrying cars face regulatory uncertainty • Potential oversupply of energy-related railcar types may be impacted by: − Crude-oil price − Regulatory issues − Pipeline capacity (1) Railway Supply Institute as of 12/31/14 (2) Railway Supply Institute as of 6/30/14

41 GATX’s Prudent Approach to serving customers in the energy industry Limited exposure • Approximately 3,100 cars in frac sand service • Approximately 2,500 cars in crude service • GATX’s railcars serving these markets are: − Leased to customers with high credit ratings − On long-term leases Focus on safety • Safety is GATX’s top priority − GATX will continue to work with regulators and shippers to proactively identify options for providing safe railcars Diverse customer base • GATX seeks a mix of growth opportunities in petroleum products, chemicals, food, agriculture and other industries

42 Rail North America Locomotive Leasing GATX owns, manages or has an interest in approximately 600 locomotives − Mostly high-quality, four-axle locomotives leased to: − Class I railroads − regional and short-line railroads − industrial users $34 $36 $34 $32 $35 0 10 20 30 40 2010 2011 2012 2013 2014 $ in milli o n s Lease Income
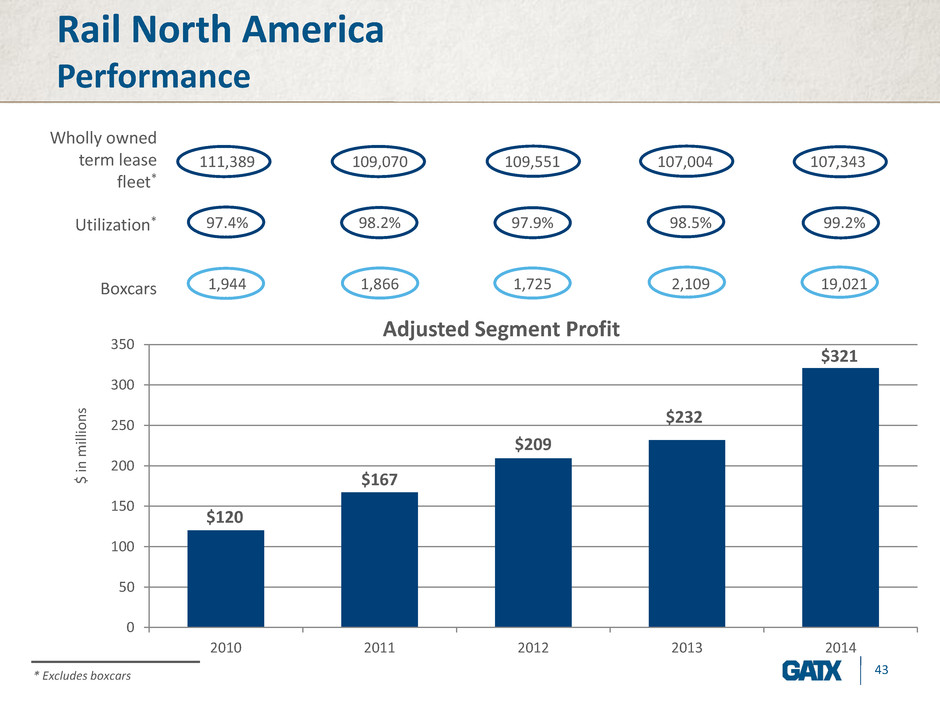
43 Rail North America Performance 111,389 109,070 109,551 107,004 107,343 97.4% 98.2% 97.9% 98.5% 99.2% 1,944 1,866 1,725 2,109 19,021 $120 $167 $209 $232 $321 0 50 100 150 200 250 300 350 2010 2011 2012 2013 2014 $ in milli o n s Adjusted Segment Profit Wholly owned term lease fleet* Utilization* * Excludes boxcars Boxcars

44 Rail International

45 Rail International European Railcar Fleet Dry Bulk Wagons 31% Flat Wagons 29% Tank Wagons 16% Covered Wagons 15% Other 9% Car Types Approximately 705,000 railcars in standard-gauge countries Leasing Companies ~30% Others ~70% Railcar Ownership GATX management estimate

46 Rail International European Tank Car Market • The structure of the tank car leasing market in Europe is similar to the tank car leasing market in North America − Lessors own the majority of the tank cars in Europe – approximately 68% − A few large leasing companies lead the market GATX Rail Europe 26% VTG 36% Ermewa 19% Other 19% Tank Car Leasing Market* Approximately 77,000 tank cars * GATX management estimate

47 Rail International GATX Rail Europe (GRE) Petroleum Wagons 66% LPG Wagons 13% Chemical Wagons 13% Bulk Wagons 8% Fleet Structure Approximately 22,000 railcars as of 12/31/14 Germany 47% Poland 22% Austria 11% Hungary 3% Czech Republic 3% Slovakia 2% Other 8% Geographies Served Based on 2014 GRE revenues Switzerland 4%
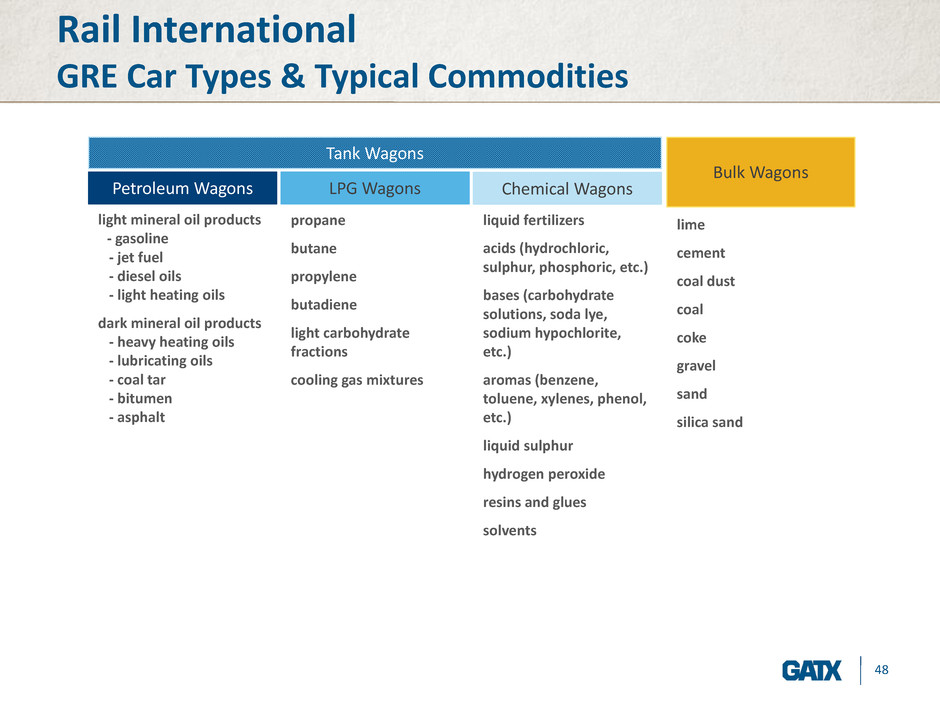
48 Rail International GRE Car Types & Typical Commodities Tank Wagons Chemical WagonsLPG Wagons Bulk Wagons Petroleum Wagons light mineral oil products - gasoline - jet fuel - diesel oils - light heating oils dark mineral oil products - heavy heating oils - lubricating oils - coal tar - bitumen - asphalt propane butane propylene butadiene light carbohydrate fractions cooling gas mixtures liquid fertilizers acids (hydrochloric, sulphur, phosphoric, etc.) bases (carbohydrate solutions, soda lye, sodium hypochlorite, etc.) aromas (benzene, toluene, xylenes, phenol, etc.) liquid sulphur hydrogen peroxide resins and glues solvents lime cement coal dust coal coke gravel sand silica sand

49 Rail International GATX India Private Ltd (GIPL) The Market • World’s 4th largest rail network • Government initiative to invite private participation in rail sector generating further investment opportunities • Continued construction of Dedicated Freight Corridors to further expand rail network GATX’s progress • First ever wagon leasing license issued to GIPL in 2012 • Market leader in railcar leasing − Owns fleet of about 500 container flat wagons − GIPL will continue to seek attractive investment opportunities to grow the fleet − Recognized as a key rail industry stakeholder Fleet data as of 2/28/15
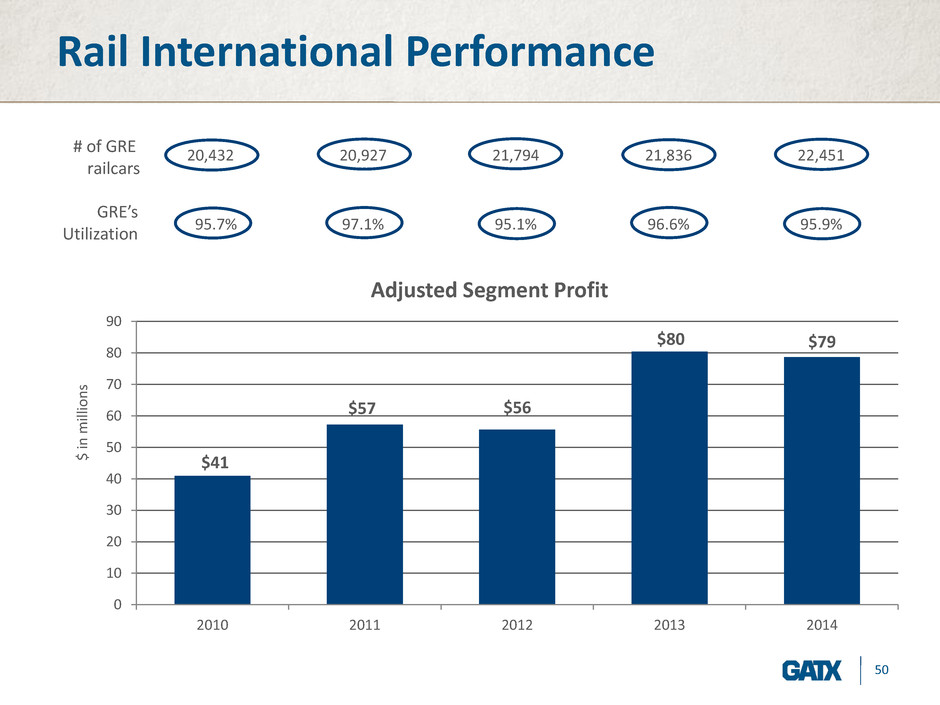
50 Rail International Performance 20,432 20,927 21,794 21,836 22,451 95.7% 97.1% 95.1% 96.6% 95.9% $41 $57 $56 $80 $79 0 10 20 30 40 50 60 70 80 90 2010 2011 2012 2013 2014 $ in milli o n s Adjusted Segment Profit # of GRE railcars GRE’s Utilization

51 American Steamship Company

52 • Shipping industry on the Great Lakes is mature • The fresh-water vessels are long-lived − ASC operates the youngest US-flagged fleet • High barriers to entry − New-build vessel costs have risen sharply in recent years • Sailing season generally runs from late March through the end of December Great Lakes Shipping Industry Overview

53 American Steamship Company Industry Cargo Carriage and Capacity 0 20 40 60 80 100 120 US-flagged Net Tons Carried ASC Net Tons Carried US-flagged Dry Bulk Cargo Carriage (1) Capacity of US-flagged Vessel Operators(2) • Weather conditions impact operating efficiencies, especially in the early spring and early winter (1) Lake Carriers’ Association (2) GATX management estimate ASC 35% Interlake Steamship Company 23% Great Lakes Fleet, Inc. 20% Grand River Navigation 11% Central Marine Logistics 7% Other 4% Total annual industry capacity 105 million net tons

54 American Steamship Company • ASC provides transportation of dry bulk commodities on the Great Lakes − ASC has been operating for more than 100 years, joining GATX in 1973 − ASC operates with an emphasis on safety and environmental stewardship • Fleet of 17 self-unloading vessels − No shore-side assistance required − Can operate 24 hours a day, seven days a week • Customer base is highly concentrated − ASC served 29 customers in 2014 − Top five customers composed 79% of ASC’s total revenue in 2014 • Composition of fleet enhances ability to meet varying levels of demand − Range in length from 635’ to 1,000’
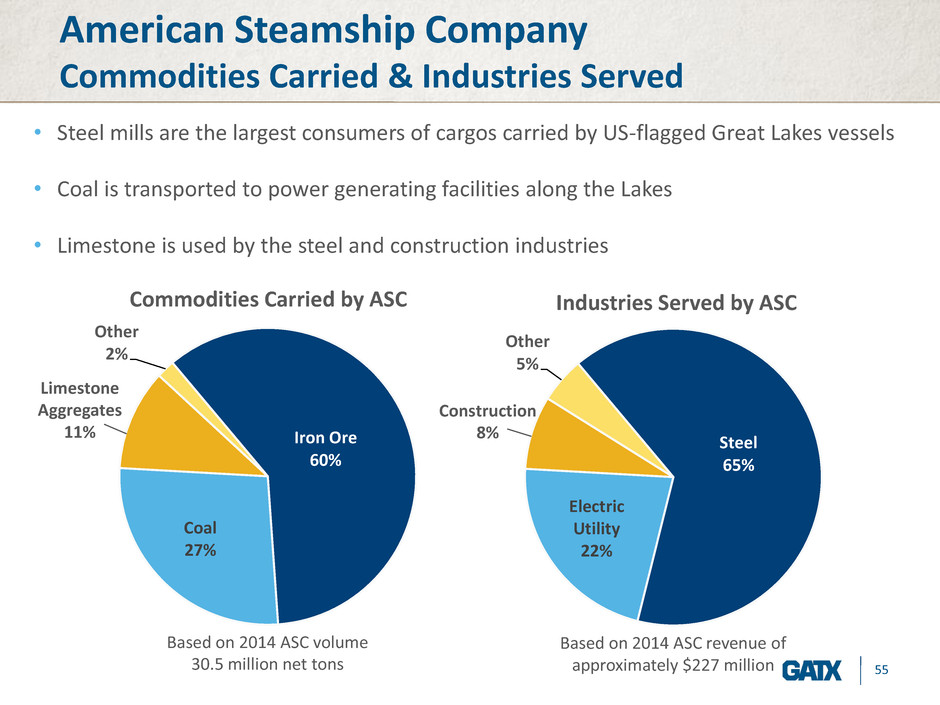
55 American Steamship Company Commodities Carried & Industries Served • Steel mills are the largest consumers of cargos carried by US-flagged Great Lakes vessels • Coal is transported to power generating facilities along the Lakes • Limestone is used by the steel and construction industries Iron Ore 60% Coal 27% Other 2% Commodities Carried by ASC Based on 2014 ASC volume 30.5 million net tons Steel 65% Electric Utility 22% Other 5% Industries Served by ASC Based on 2014 ASC revenue of approximately $227 million Limestone Aggregates 11% Construction 8%
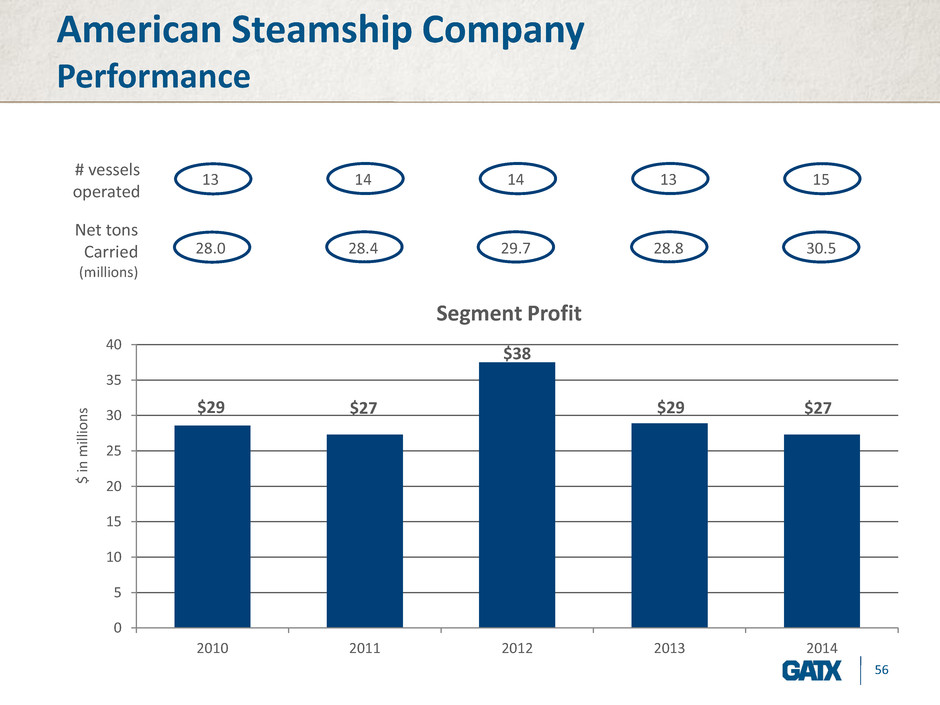
56 American Steamship Company Performance 13 14 14 13 15 28.0 28.4 29.7 28.8 30.5 $29 $27 $38 $29 $27 0 5 10 15 20 25 30 35 40 2010 2011 2012 2013 2014 $ in milli o n s Segment Profit # vessels operated Net tons Carried (millions)

57 Portfolio Management

58 Portfolio Management Affiliates • Spare aircraft engine leasing − Partner with Rolls-Royce plc − One of the largest spare aircraft engine portfolios in the industry • Marine − Partner with IMC Group − Five ocean-going, chemical parcel tankers Wholly owned marine assets • 500+ barges, tugs and tows • Six ocean-going, handy-size, chemical parcel tankers • Five ocean-going, multi-gas carriers Marine 54% Marine Affiliate 6% Aircraft Engine Leasing Affiliates 36% Other 4% Owned Portfolio $813 million NBV as of 12/31/14

59 Portfolio Management Rolls-Royce and Partners Finance affiliates (RRPF) • GATX established its first partnership with Rolls-Royce plc in 1998 • Lease spare aircraft engines to commercial airlines and Rolls- Royce plc − One of the largest spare aircraft engine portfolios in the industry, with more than 430 engines Trent 700 29% V2500 23% Trent 900 15% Trent 800 11% Trent 500 8% Other 14% Engine Types A330 Based on NBV of approximately $3 billion 100% of RRPF’s portfolio as of 12/31/14 A320 B777 A340 – 500/600 A380

60 RRPF affiliates Performance $253 $267 $302 $2,671 $2,771 $3,134 $37 $42 $0 $10 $20 $30 $40 $50 2012 2013 2014 GATX's share of after-tax income Lease Revenues* Total Assets* • Spare aircraft engines have characteristics similar to railcars: − Long-lived − Widely used − Service component − Unique asset knowledge • RRPF affiliates contribute meaningfully to GATX’s financial results: In millions $47 * Reflects 100% of RRPF affiliates’ results
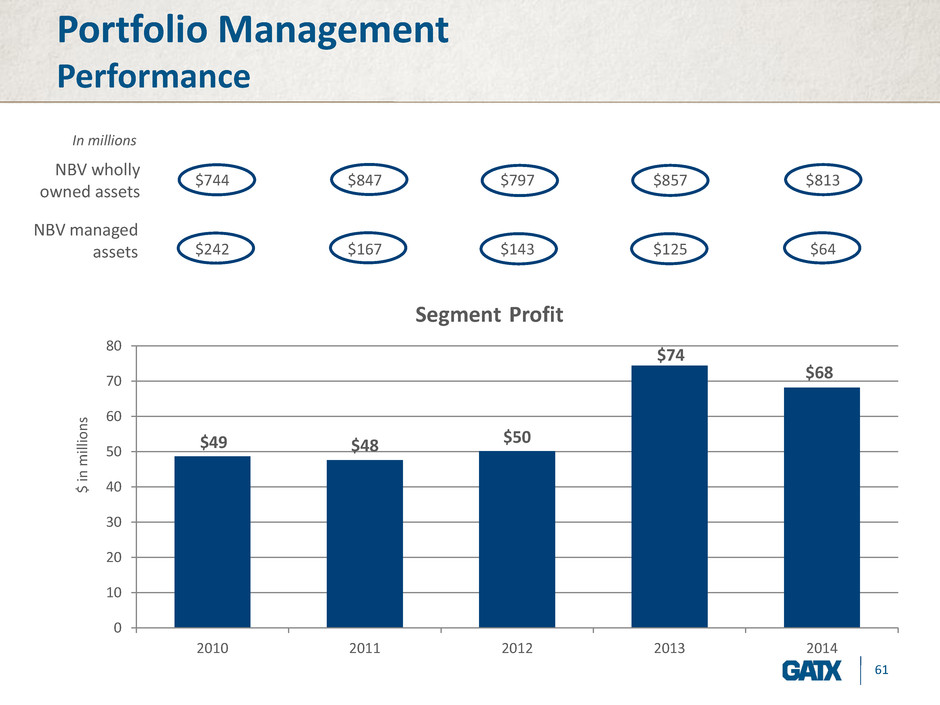
61 Portfolio Management Performance $744 $847 $797 $857 $813 $242 $167 $143 $125 $64 $49 $48 $50 $74 $68 0 10 20 30 40 50 60 70 80 2010 2011 2012 2013 2014 $ in milli o n s Segment Profit NBV wholly owned assets NBV managed assets In millions

62 Financial Highlights
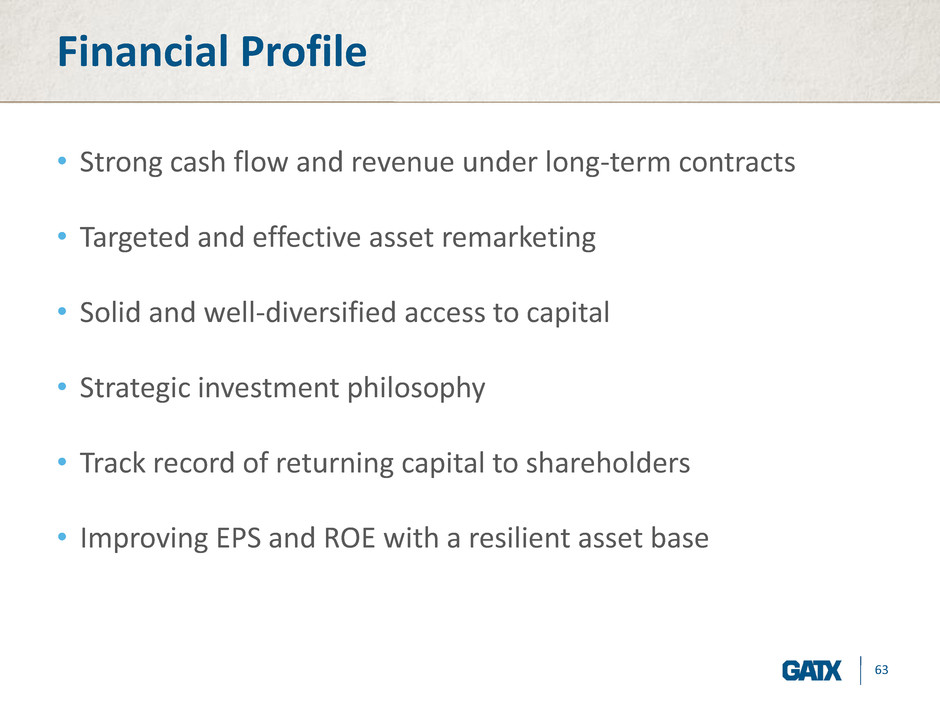
63 Financial Profile • Strong cash flow and revenue under long-term contracts • Targeted and effective asset remarketing • Solid and well-diversified access to capital • Strategic investment philosophy • Track record of returning capital to shareholders • Improving EPS and ROE with a resilient asset base

64 Cash Flow Strength Nearly $4.2 billion in committed future lease and loan receipts $1,036 $770 $610 $492 $382 $866 0 200 400 600 800 1,000 1,200 2015 2016 2017 2018 2019 Thereafter $ in m ill io n s As of 12/31/14
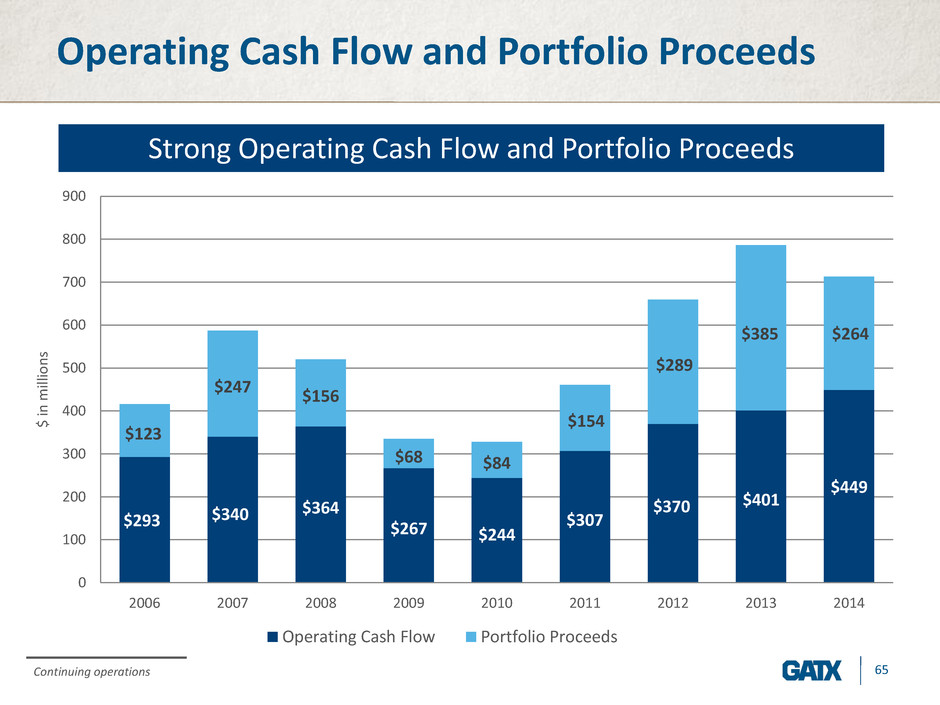
65 Operating Cash Flow and Portfolio Proceeds Strong Operating Cash Flow and Portfolio Proceeds $293 $340 $364 $267 $244 $307 $370 $401 $449 $123 $247 $156 $68 $84 $154 $289 $385 $264 0 100 200 300 400 500 600 700 800 900 2006 2007 2008 2009 2010 2011 2012 2013 2014 $ in milli o n s Operating Cash Flow Portfolio Proceeds Continuing operations

66 Committed Receipts vs. Payments $1,036 $770 $610 $492 $382 $866 $679 $548 $427 $408 $483 $329 0 200 400 600 800 1,000 1,200 2015 2016 2017 2018 2019 Thereafter $ in mi lli o n s Committed receipts Committed Capex & Op Lease Payments $4.2 billion in committed future lease and loan receipts vs. $2.9 billion in committed future capex and lease payments

67 Strong Balance Sheet 0% 5% 10% 15% 20% 25% 30% 35% 40% 45% 50% 0.0x 1.0x 2.0x 3.0x 4.0x 5.0x 6.0x 2002 2003 2004 2005 2006 2007 2008 2009 2010 2011 2012 2013 2014 BBB-/Baa3 BBB/Baa2 Total Recourse Debt = On-Balance-Sheet Recourse Debt + Off-Balance-Sheet Recourse Debt + Capital Lease Obligations + Commercial Paper and Bank Credit Facilities, Net of Unrestricted Cash GATX primarily issues unsecured debt, leaving its assets largely unencumbered Sold aircraft leasing business & reduced leverage and secured assets

68 Future Debt Obligations GATX’s debt maturity schedule is well balanced $529 $639 $455 $508 $592 $1,480 0 200 400 600 800 1,000 1,200 1,400 1,600 2015 2016 2017 2018 2019 Thereafter $ in milli o n s As of 12/31/14

69 GATX’s Declining Cost of Debt GATX issued $1.1 billion of public unsecured debt in 2014 3-year (March) 5.5-year (March) 30-year (March) 5.5-year (October) Size $300 million $250 million $300 million $250 million Reoffer spread T+60 bps T+105 bps T+160 bps T+120 bps Coupon 1.25% 2.50% 5.20% 2.60% 6.4% 4.0% 5.0 3.3 5.6 - 1.0 2.0 3.0 4.0 5.0 6.0 7.0 0.0% 1.0% 2.0% 3.0% 4.0% 5.0% 6.0% 7.0% 2006 2007 2008 2009 2010 2011 2012 2013 2014 Effective Cost of Debt Average Life (years) GATX’s decreased borrowing costs and increased term
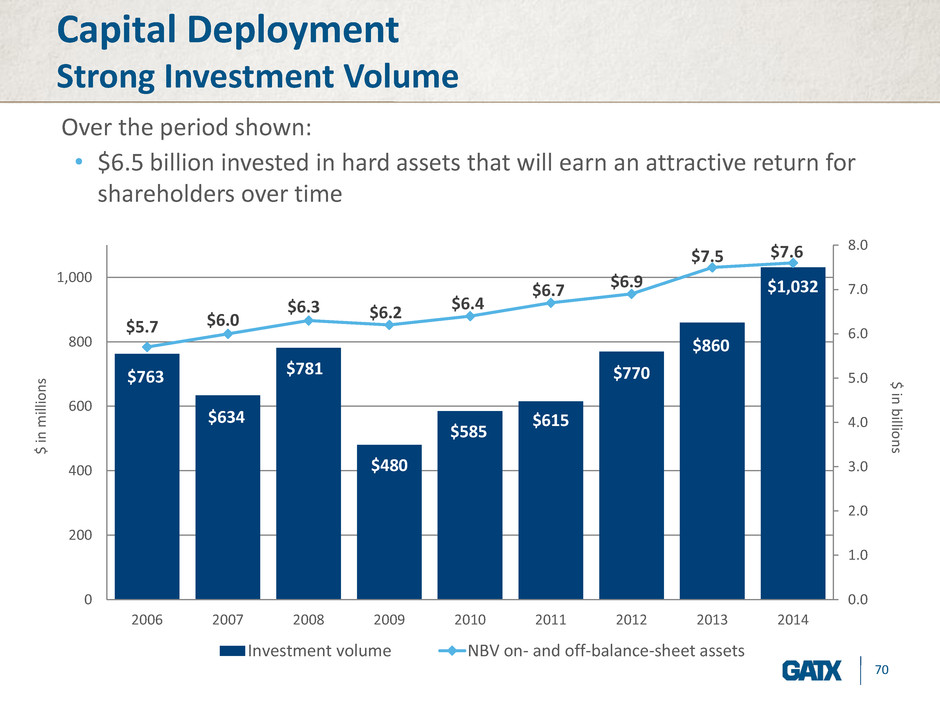
70 • $6.5 billion invested in hard assets that will earn an attractive return for shareholders over time Capital Deployment Strong Investment Volume $763 $634 $781 $480 $585 $615 $770 $860 $1,032 $5.7 $6.0 $6.3 $6.2 $6.4 $6.7 $6.9 $7.5 $7.6 0.0 1.0 2.0 3.0 4.0 5.0 6.0 7.0 8.0 0 200 400 600 800 1,000 2006 2007 2008 2009 2010 2011 2012 2013 2014 $ in b illi o n s$ in millio n s Investment volume NBV on- and off-balance-sheet assets Over the period shown:

71 Capital Deployment Track Record of Shareholder Return $43 $391 $519 $628 $682 $738 $796 $926 $1,112 0 200 400 600 800 1,000 1,200 2006 2007 2008 2009 2010 2011 2012 2013 2014 $ in milli o n s Cumulative Dividends Cumulative Share Repurchase Consistent dividends • 2.8% average yield • $487 million paid to shareholders Share repurchases • 14.5 million shares • $625 million Over the period shown, GATX returned more than $1.1 billion to shareholders
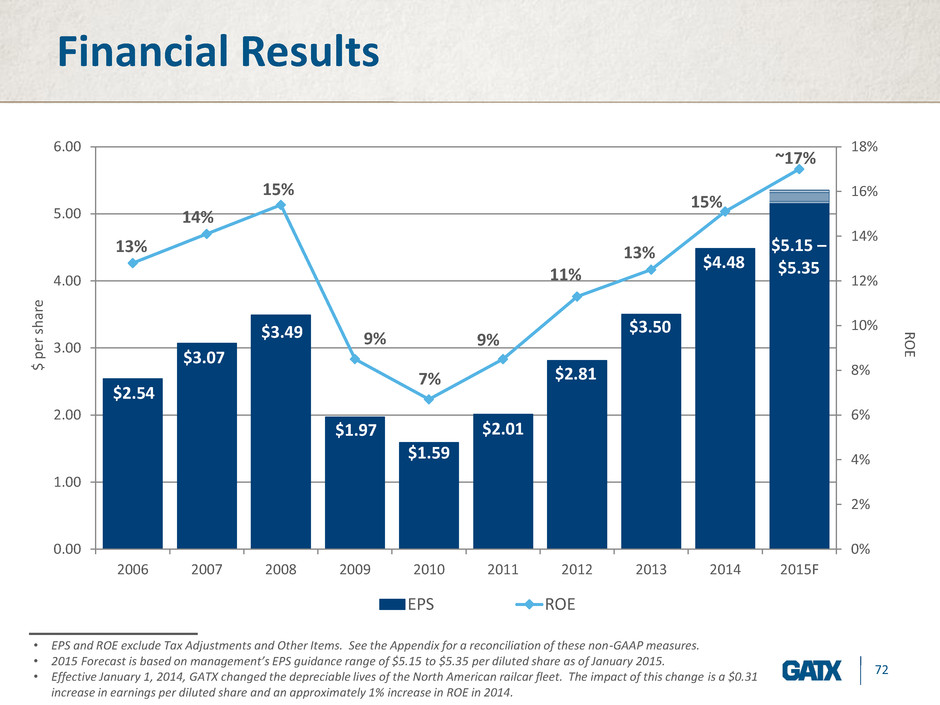
72 $2.54 $3.07 $3.49 $1.97 $1.59 $2.01 $2.81 $3.50 $4.48 $5.15 – $5.35 13% 14% 15% 9% 7% 9% 11% 13% 15% ~17% 0% 2% 4% 6% 8% 10% 12% 14% 16% 18% 0.00 1.00 2.00 3.00 4.00 5.00 6.00 2006 2007 2008 2009 2010 2011 2012 2013 2014 2015F R O E $ p er s h ar e EPS ROE Financial Results • EPS and ROE exclude Tax Adjustments and Other Items. See the Appendix for a reconciliation of these non-GAAP measures. • 2015 Forecast is based on management’s EPS guidance range of $5.15 to $5.35 per diluted share as of January 2015. • Effective January 1, 2014, GATX changed the depreciable lives of the North American railcar fleet. The impact of this change is a $0.31 increase in earnings per diluted share and an approximately 1% increase in ROE in 2014.

73 Summary and Opportunity • GATX has been a market force in the rail industry for more than 115 years • GATX provides premium assets and services to a high-quality customer base • GATX is benefitting from strength in the tank and freight car markets • GATX is making disciplined investments in North America and in International rail markets • GATX is focused on generating attractive, risk-adjusted returns for our shareholders
74 Appendix
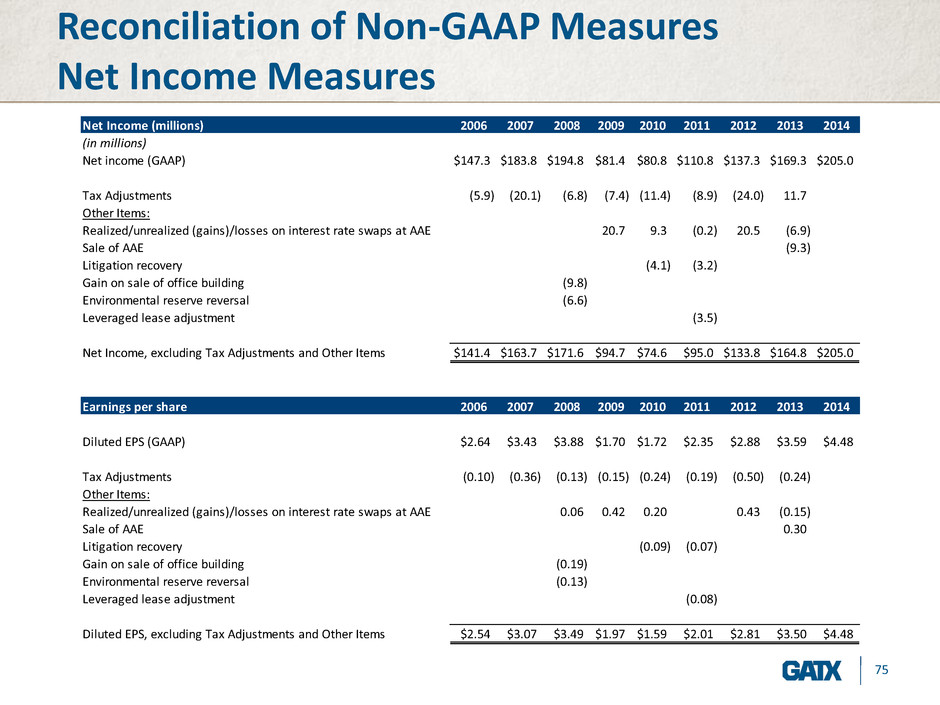
75 Reconciliation of Non-GAAP Measures Net Income Measures Net Income (millions) 2006 2007 2008 2009 2010 2011 2012 2013 2014 (in millions) Net income (GAAP) $147.3 $183.8 $194.8 $81.4 $80.8 $110.8 $137.3 $169.3 $205.0 Tax Adjustments (5.9) (20.1) (6.8) (7.4) (11.4) (8.9) (24.0) 11.7 Other Items: Realized/unrealized (gains)/losses on interest rate swaps at AAE 20.7 9.3 (0.2) 20.5 (6.9) Sale of AAE (9.3) Litigation recovery (4.1) (3.2) Gain on sale of office building (9.8) Environmental reserve reversal (6.6) Leveraged lease adjustment (3.5) Net Income, excluding Tax Adjustments and Other Items $141.4 $163.7 $171.6 $94.7 $74.6 $95.0 $133.8 $164.8 $205.0 Earnings per share 2006 2007 2008 2009 2010 2011 2012 2013 2014 Diluted EPS (GAAP) $2.64 $3.43 $3.88 $1.70 $1.72 $2.35 $2.88 $3.59 $4.48 Tax Adjustments (0.10) (0.36) (0.13) (0.15) (0.24) (0.19) (0.50) (0.24) Other Items: Realized/unrealized (gains)/losses on interest rate swaps at AAE 0.06 0.42 0.20 0.43 (0.15) Sale of AAE 0.30 Litigation recovery (0.09) (0.07) Gain on sal of office building (0.19) Environmental reserve reversal (0.13) Leveraged lease adjustment (0.08) Diluted EPS, excluding Tax Adjustments and Other Items $2.54 $3.07 $3.49 $1.97 $1.59 $2.01 $2.81 $3.50 $4.48

76 Reconciliation of Non-GAAP Measures Balance Sheet MeasuresOn- and off-balance-sheet assets 2006 2007 2008 2009 2010 2011 2012 2013 2014 (in millions) Consolidated on-balance-sheet assets $4,414.4 $4,723.2 $5,190.5 $5,206.4 $5,442.4 $5,857.5 $6,055.4 $6,549.6 $6,937.5 Off-balance-sheet assets 1,321.0 1,235.9 1,061.2 1,016.1 971.5 887.1 884.5 904.4 617.8 Total on- and off-balance-sheet assets $5,735.4 $5,959.1 $6,251.7 $6,222.5 $6,413.9 $6,744.6 $6,939.9 $7,454.0 $7,555.3

For additional financial information, please see the SUPPLEMENTAL FINANCIAL DATA part of the Investor Relations Section of www.gatx.com GATX Corporation


