Stifel 2019 Transportation & Logistics Conference | February 12, 2019
Forward-Looking Statements Statements in this Presentation not based on historical facts are “forward-looking statements” within the meaning of the Private Securities Litigation Reform Act of 1995 and, accordingly, involve known and unknown risks and uncertainties that are difficult to predict and could cause our actual results, performance, or achievements to differ materially from those discussed. These include statements as to our future expectations, beliefs, plans, strategies, objectives, events, conditions, financial performance, prospects, or future events. In some cases, forward-looking statements can be identified by the use of words such as “may,” “could,” “expect,” “intend,” “plan,” “seek,” “anticipate,” “believe,” “estimate,” “predict,” “potential,” ”outlook,” “continue,” “likely,” “will,” “would”, and similar words and phrases. Forward-looking statements are necessarily based on estimates and assumptions that, while considered reasonable by us and our management, are inherently uncertain. Accordingly, you should not place undue reliance on forward-looking statements, which speak only as of the date they are made, and are not guarantees of future performance. We do not undertake any obligation to publicly update or revise these forward-looking statements. The following factors, in addition to those discussed in our other filings with the SEC, including our Form 10-K for the year ended December 31, 2017 and subsequent reports on Form 10-Q, could cause actual results to differ materially from our current expectations expressed in forward-looking statements: o exposure to damages, fines, criminal and civil penalties, and reputational harm arising o reduced opportunities to generate asset remarketing income from a negative outcome in litigation, including claims arising from an accident involving o operational and financial risks related to our affiliate investments, including the Rolls-Royce & Partners Finance our railcars joint ventures (collectively the "RRPF affiliates") o inability to maintain our assets on lease at satisfactory rates due to oversupply of railcars o fluctuations in foreign exchange rates in the market or other changes in supply and demand o failure to successfully negotiate collective bargaining agreements with the unions representing a substantial o a significant decline in customer demand for our railcars or other assets or services, portion of our employees including as a result of: o asset impairment charges we may be required to recognize • weak macroeconomic conditions o deterioration of conditions in the capital markets, reductions in our credit ratings, or increases in our financing • weak market conditions in our customers' businesses costs • declines in harvest or production volumes o Uncertainty relating to the LIBOR calculation process and potential phasing out of LIBOR after 2021 • adverse changes in the price of, or demand for, commodities o competitive factors in our primary markets, including competitors with a significantly lower cost of capital than • changes in railroad operations or efficiency GATX • changes in supply chains o risks related to our international operations and expansion into new geographic markets, including the • availability of pipelines, trucks, and other alternative modes of transportation imposition of new or additional tariffs, quotas, or trade barriers • other operational or commercial needs or decisions of our customers o changes in, or failure to comply with, laws, rules, and regulations o higher costs associated with increased railcar assignments following non-renewal of o inability to obtain cost-effective insurance leases, customer defaults, and compliance maintenance programs or other maintenance o environmental remediation costs initiatives o inadequate allowances to cover credit losses in our portfolio o events having an adverse impact on assets, customers, or regions where we have a o inability to maintain and secure our information technology infrastructure from cybersecurity threats and concentrated investment exposure related disruption of our business o financial and operational risks associated with long-term railcar purchase commitments, including increased costs due to tariffs or trade disputes 2
HISTORY AND 121 BUSINESS YEARS OF OPERATIONAL OVERVIEW EXPERIENCE The following presentation contains unaudited financial information 3
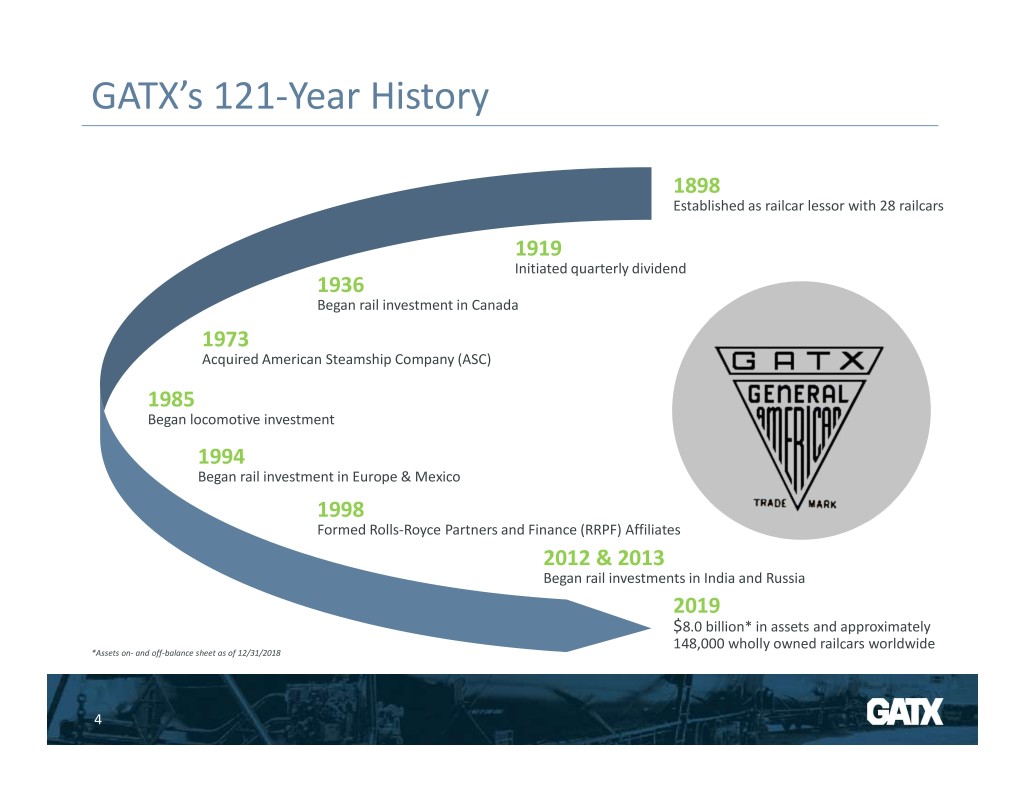
GATX’s 121-Year History 1898 Established as railcar lessor with 28 railcars 1919 Initiated quarterly dividend 1936 Began rail investment in Canada 1973 Acquired American Steamship Company (ASC) 1985 Began locomotive investment 1994 Began rail investment in Europe & Mexico 1998 Formed Rolls-Royce Partners and Finance (RRPF) Affiliates 2012 & 2013 Began rail investments in India and Russia 2019 $8.0 billion* in assets and approximately 148,000 wholly owned railcars worldwide *Assets on- and off-balance sheet as of 12/31/2018 4
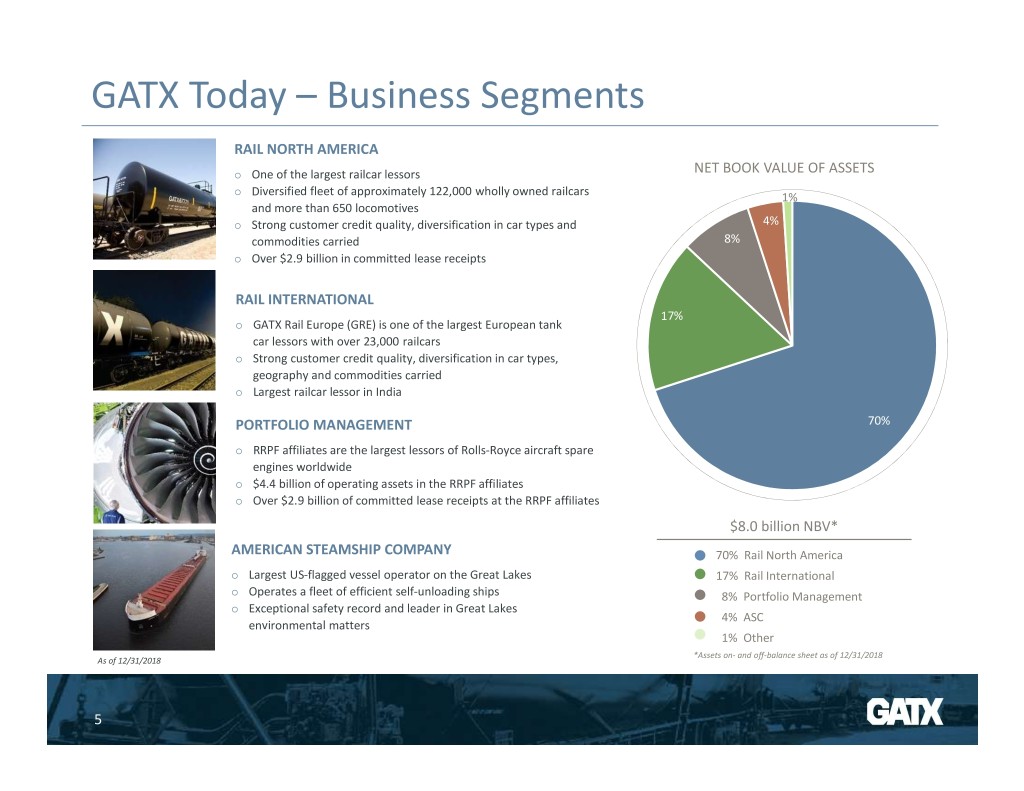
GATX Today – Business Segments RAIL NORTH AMERICA NET BOOK VALUE OF ASSETS One of the largest railcar lessors Diversified fleet of approximately 122,000 wholly owned railcars 1% and more than 650 locomotives Strong customer credit quality, diversification in car types and 4% commodities carried 8% Over $2.9 billion in committed lease receipts RAIL INTERNATIONAL 17% GATX Rail Europe (GRE) is one of the largest European tank car lessors with over 23,000 railcars Strong customer credit quality, diversification in car types, geography and commodities carried Largest railcar lessor in India PORTFOLIO MANAGEMENT 70% RRPF affiliates are the largest lessors of Rolls-Royce aircraft spare engines worldwide $4.4 billion of operating assets in the RRPF affiliates Over $2.9 billion of committed lease receipts at the RRPF affiliates $8.0 billion NBV* AMERICAN STEAMSHIP COMPANY 70% Rail North America Largest US-flagged vessel operator on the Great Lakes 17% Rail International Operates a fleet of efficient self-unloading ships 8% Portfolio Management Exceptional safety record and leader in Great Lakes 4% ASC environmental matters 1% Other *Assets on- and off-balance sheet as of 12/31/2018 As of 12/31/2018 5

Straightforward and Proven Business Model BUY LEASE SERVICE MAXIMIZE the railcar at an the railcar to a quality the railcar in a manner the value of the economically attractive customer at an that maximizes safety, railcar by selling or and competitively attractive rate for a in-use time and scrapping at the advantaged price term that reflects the customer satisfaction optimal time business cycle 6
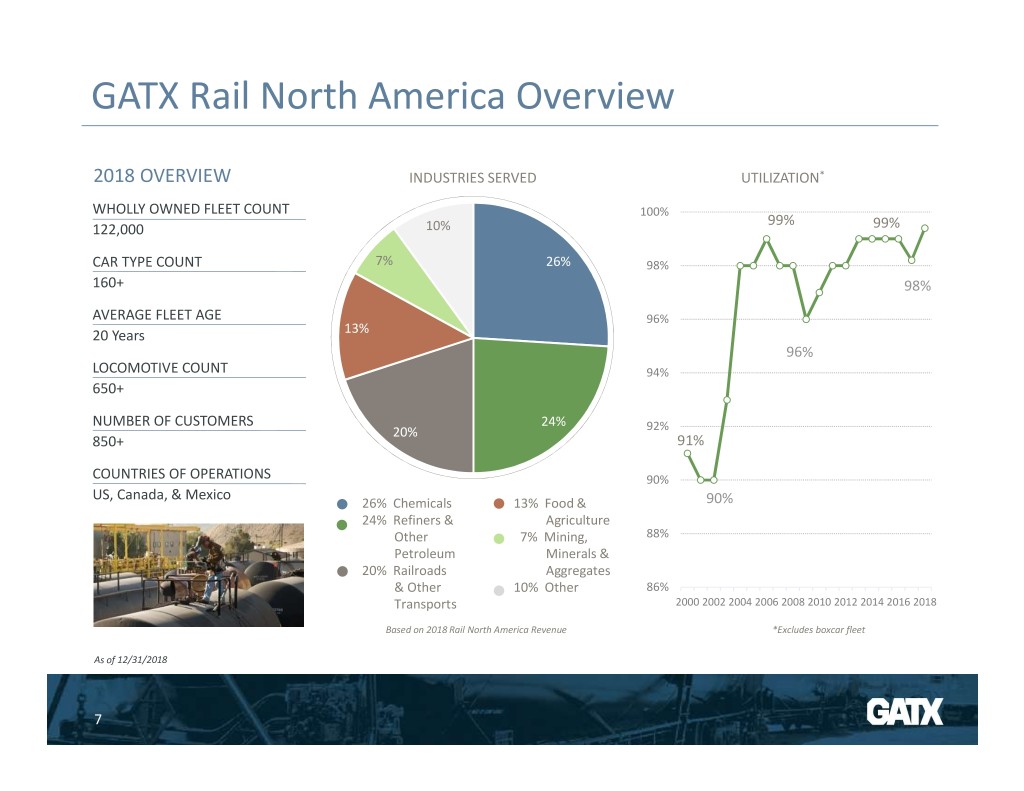
GATX Rail North America Overview 2018 OVERVIEW INDUSTRIES SERVED UTILIZATION* WHOLLY OWNED FLEET COUNT 100% 99% 122,000 10% 99% CAR TYPE COUNT 7% 26% 98% 160+ 98% AVERAGE FLEET AGE 96% 20 Years 13% 96% LOCOMOTIVE COUNT 94% 650+ NUMBER OF CUSTOMERS 24% 20% 92% 850+ 91% COUNTRIES OF OPERATIONS 90% US, Canada, & Mexico 26% Chemicals 13% Food & 90% 24% Refiners & Agriculture Other 7% Mining, 88% Petroleum Minerals & 20% Railroads Aggregates & Other 10% Other 86% Transports 2000 2002 2004 2006 2008 2010 2012 2014 2016 2018 Based on 2018 Rail North America Revenue *Excludes boxcar fleet As of 12/31/2018 7
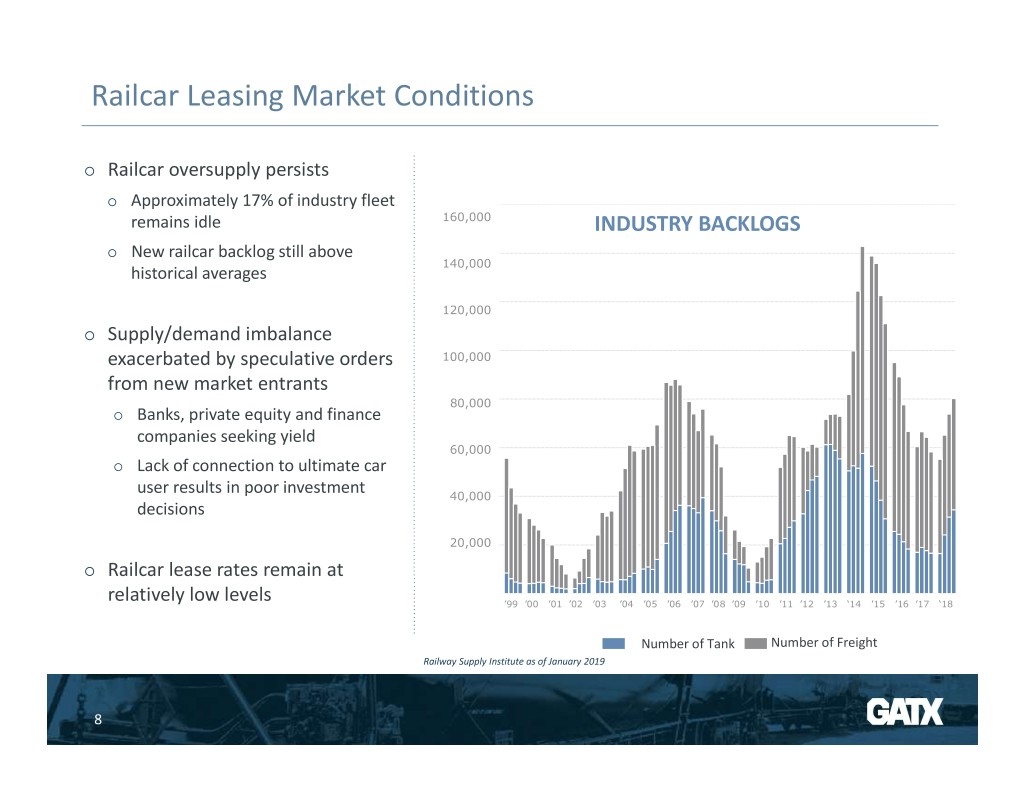
Railcar Leasing Market Conditions Railcar oversupply persists Approximately 17% of industry fleet remains idle 160,000 INDUSTRY BACKLOGS New railcar backlog still above 140,000 historical averages 120,000 Supply/demand imbalance exacerbated by speculative orders 100,000 from new market entrants 80,000 Banks, private equity and finance companies seeking yield 60,000 Lack of connection to ultimate car user results in poor investment 40,000 decisions 20,000 Railcar lease rates remain at relatively low levels ’99 ’00 ’01 ’02 ’03 ’04 ’05 ’06 ’07 ’08 ’09 ’10 ’11 ’12 ’13 ‘14 ’15 ’16 ’17 ‘18 Number of Tank Number of Freight Railway Supply Institute as of January 2019 8
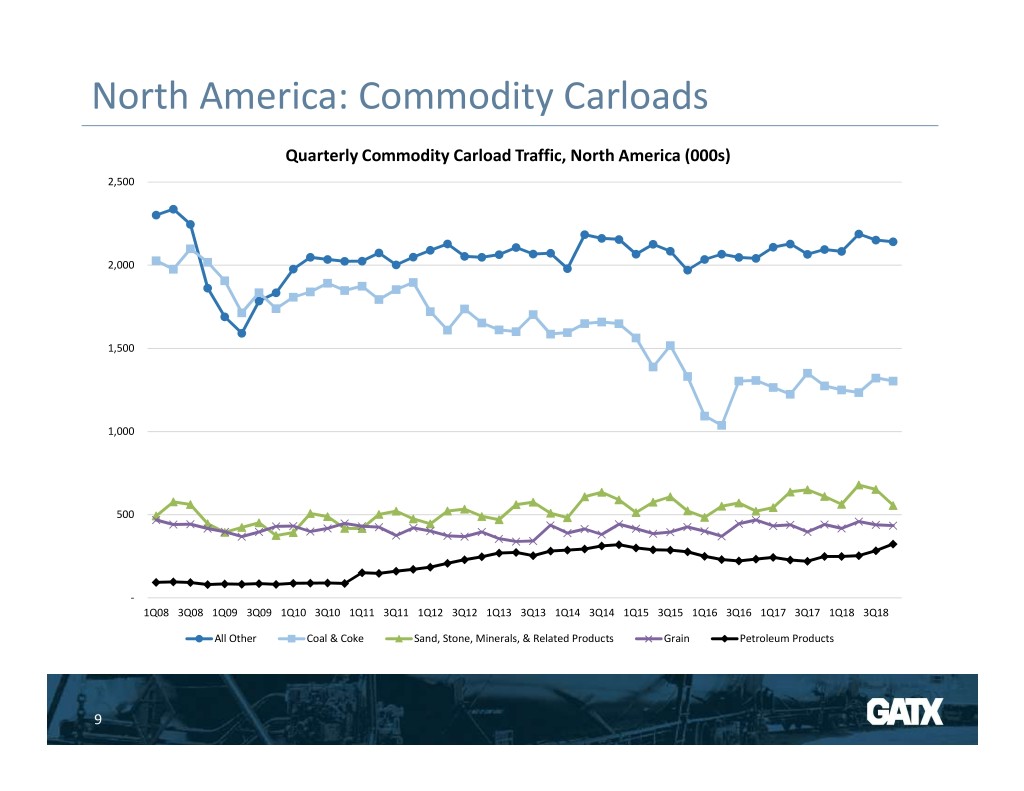
North America: Commodity Carloads Quarterly Commodity Carload Traffic, North America (000s) 2,500 2,000 1,500 1,000 500 - 1Q08 3Q08 1Q09 3Q09 1Q10 3Q10 1Q11 3Q11 1Q12 3Q12 1Q13 3Q13 1Q14 3Q14 1Q15 3Q15 1Q16 3Q16 1Q17 3Q17 1Q18 3Q18 All Other Coal & Coke Sand, Stone, Minerals, & Related Products Grain Petroleum Products 9
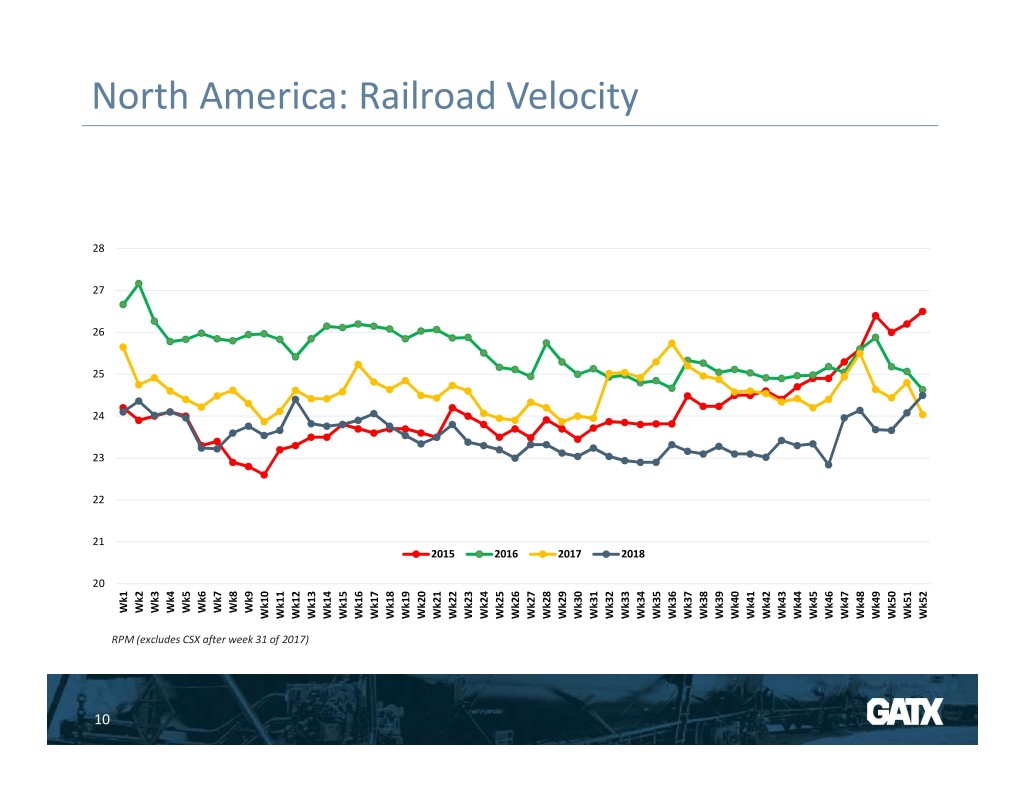
North America: Railroad Velocity 28 27 26 25 24 23 22 21 2015 2016 2017 2018 20 Wk1 Wk2 Wk3 Wk4 Wk5 Wk6 Wk7 Wk8 Wk9 Wk10 Wk11 Wk12 Wk13 Wk14 Wk15 Wk16 Wk17 Wk18 Wk19 Wk20 Wk21 Wk22 Wk23 Wk24 Wk25 Wk26 Wk27 Wk28 Wk29 Wk30 Wk31 Wk32 Wk33 Wk34 Wk35 Wk36 Wk37 Wk38 Wk39 Wk40 Wk41 Wk42 Wk43 Wk44 Wk45 Wk46 Wk47 Wk48 Wk49 Wk50 Wk51 Wk52 RPM (excludes CSX after week 31 of 2017) 10
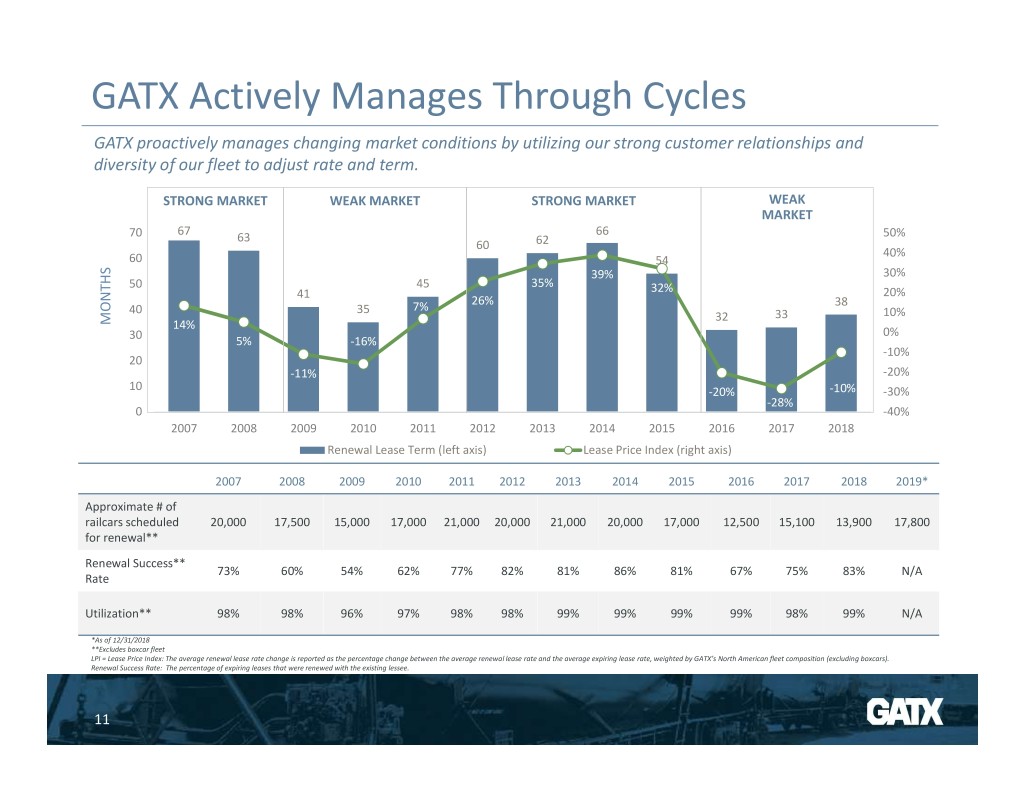
GATX Actively Manages Through Cycles GATX proactively manages changing market conditions by utilizing our strong customer relationships and diversity of our fleet to adjust rate and term. STRONG MARKET WEAK MARKET STRONG MARKET WEAK MARKET 67 66 70 63 50% 60 62 40% 60 54 39% 30% 50 45 35% 41 32% 20% 26% 38 40 35 7% 32 33 10% MONTHS 14% 30 0% 5% -16% -10% 20 -11% -20% 10 -20% -10% -30% -28% 0 -40% 2007 2008 2009 2010 2011 2012 2013 2014 2015 2016 2017 2018 Renewal Lease Term (left axis) Lease Price Index (right axis) 2007 2008 2009 2010 2011 2012 2013 2014 2015 2016 2017 2018 2019* Approximate # of railcars scheduled 20,000 17,500 15,000 17,000 21,000 20,000 21,000 20,000 17,000 12,500 15,100 13,900 17,800 for renewal** Renewal Success** 73% 60% 54% 62% 77% 82% 81% 86% 81% 67% 75% 83% N/A Rate Utilization** 98% 98% 96% 97% 98% 98% 99% 99% 99% 99% 98% 99% N/A *As of 12/31/2018 **Excludes boxcar fleet LPI = Lease Price Index: The average renewal lease rate change is reported as the percentage change between the average renewal lease rate and the average expiring lease rate, weighted by GATX’s North American fleet composition (excluding boxcars). Renewal Success Rate: The percentage of expiring leases that were renewed with the existing lessee. 11

GATX Strategy in this Environment Execute cyclically aware management of lease terms and assets by car-type – Some opportunities to increase lease rates Continue to practice a disciplined capital allocation strategy – Place new cars from long-term supply agreements – Pursue attractive incremental investments Outperform the competition – Maintain focus on utilization; highest reported utilization in North America – Leverage the strength of our full service offering, diversity of our fleet and depth of customer relationships – Displace competitors 12
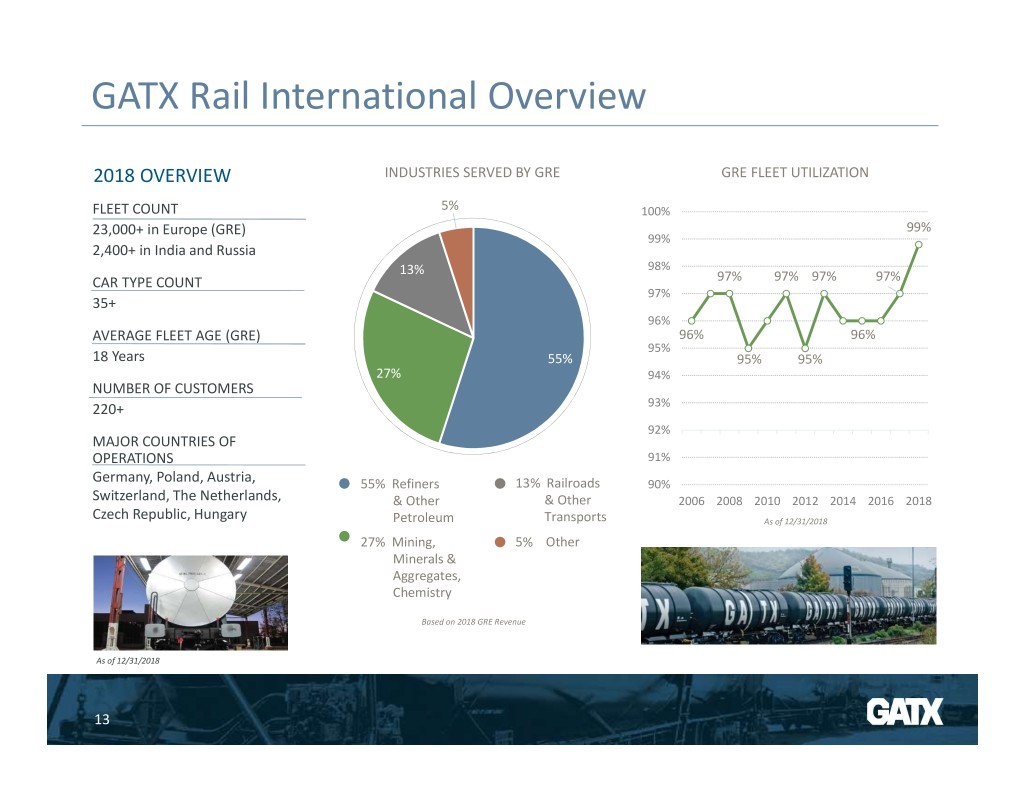
GATX Rail International Overview 2018 OVERVIEW INDUSTRIES SERVED BY GRE GRE FLEET UTILIZATION FLEET COUNT 5% 100% 23,000+ in Europe (GRE) 99% 99% 2,400+ in India and Russia 13% 98% CAR TYPE COUNT 97% 97% 97% 97% 97% 35+ 96% AVERAGE FLEET AGE (GRE) 96% 96% 95% 18 Years 55% 95% 95% 27% 94% NUMBER OF CUSTOMERS 220+ 93% 92% MAJOR COUNTRIES OF OPERATIONS 91% Germany, Poland, Austria, 55% Refiners 13% Railroads 90% Switzerland, The Netherlands, & Other & Other 2006 2008 2010 2012 2014 2016 2018 Czech Republic, Hungary Petroleum Transports As of 12/31/2018 27% Mining, 5% Other Minerals & Aggregates, Chemistry Based on 2018 GRE Revenue As of 12/31/2018 13
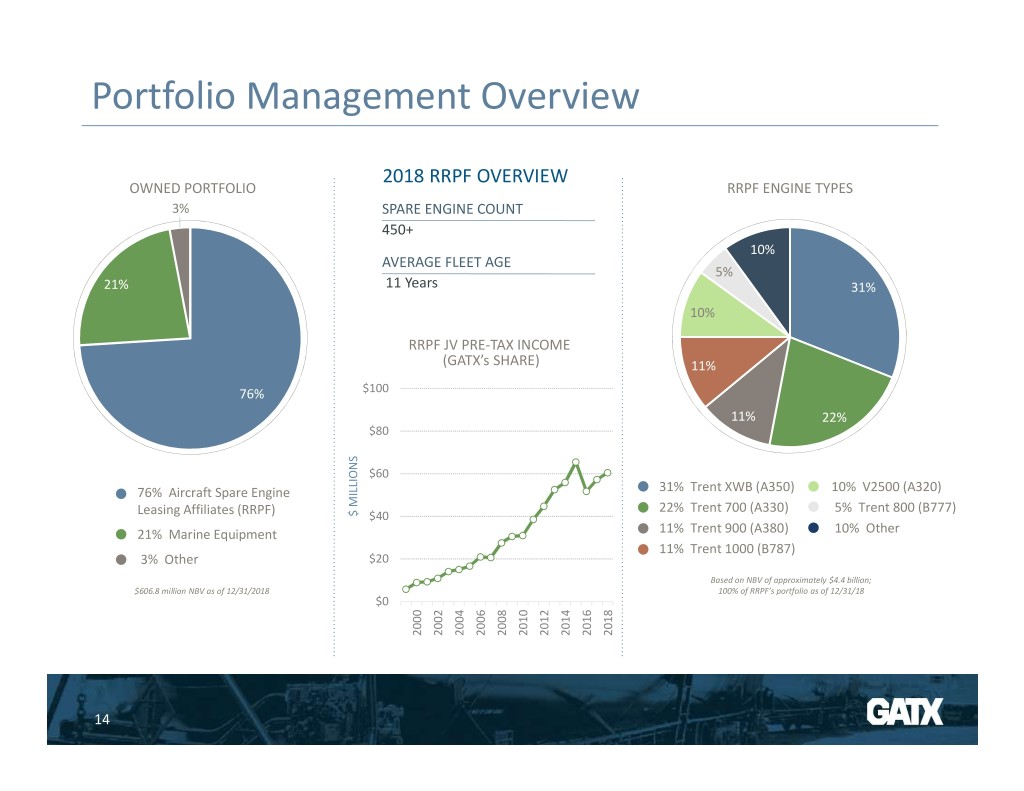
Portfolio Management Overview 2018 RRPF OVERVIEW OWNED PORTFOLIO RRPF ENGINE TYPES 3% SPARE ENGINE COUNT 450+ 10% AVERAGE FLEET AGE 5% 21% 11 Years 31% 10% RRPF JV PRE-TAX INCOME (GATX’s SHARE) 11% 76% $100 11% 22% $80 $60 76% Aircraft Spare Engine 31% Trent XWB (A350) 10% V2500 (A320) 22% Trent 700 (A330) 5% Trent 800 (B777) Leasing Affiliates (RRPF) $ MILLIONS $40 21% Marine Equipment 11% Trent 900 (A380) 10% Other 11% Trent 1000 (B787) 3% Other $20 Based on NBV of approximately $4.4 billion; $606.8 million NBV as of 12/31/2018 100% of RRPF’s portfolio as of 12/31/18 $0 2000 2002 2004 2006 2008 2010 2012 2014 2016 2018 14
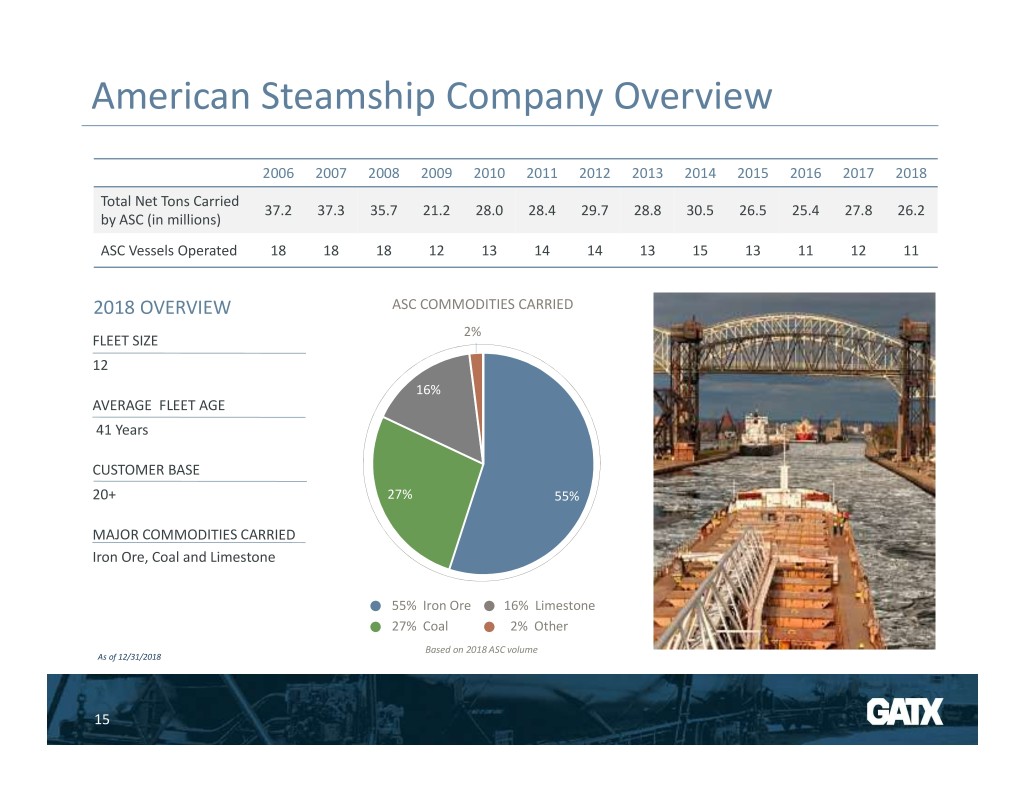
American Steamship Company Overview 2006 2007 2008 2009 2010 2011 2012 2013 2014 2015 2016 2017 2018 Total Net Tons Carried 37.2 37.3 35.7 21.2 28.0 28.4 29.7 28.8 30.5 26.5 25.4 27.8 26.2 by ASC (in millions) ASC Vessels Operated 18 18 18 12 13 14 14 13 15 13 11 12 11 2018 OVERVIEW ASC COMMODITIES CARRIED 2% FLEET SIZE 12 16% AVERAGE FLEET AGE 41 Years CUSTOMER BASE 20+ 27% 55% MAJOR COMMODITIES CARRIED Iron Ore, Coal and Limestone 55% Iron Ore 16% Limestone 27% Coal 2% Other Based on 2018 ASC volume As of 12/31/2018 15
FINANCIAL 121 DISCUSSION YEARS OF OPERATIONAL EXPERIENCE 16
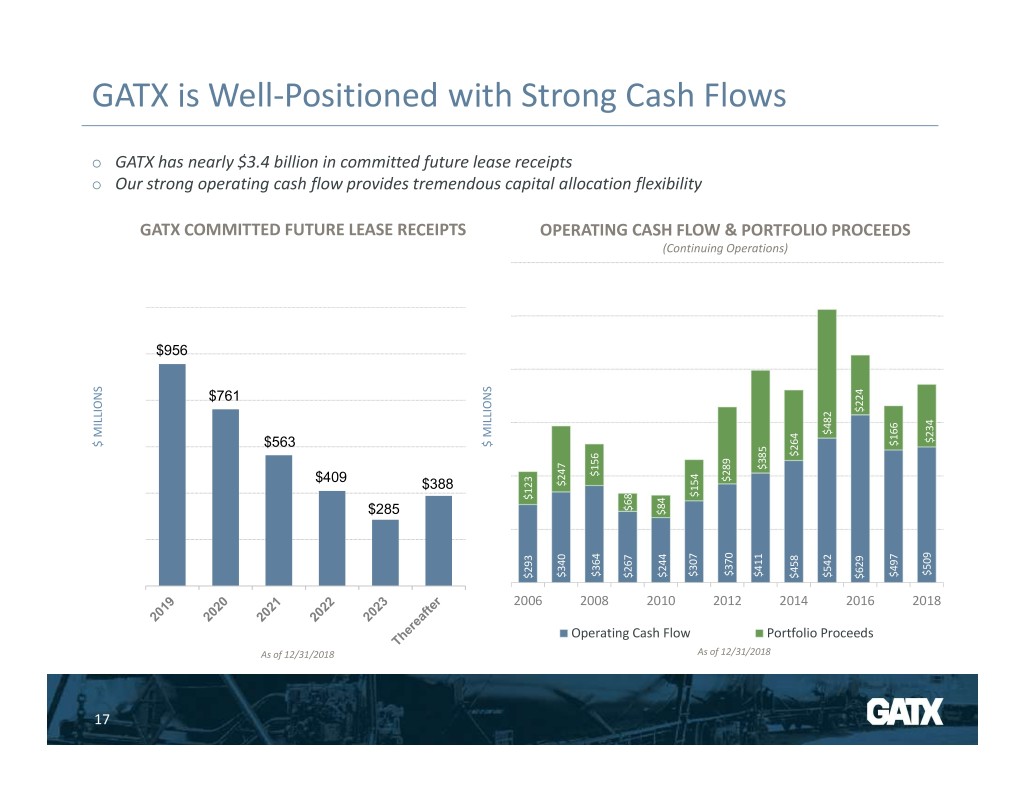
GATX is Well-Positioned with Strong Cash Flows GATX has nearly $3.4 billion in committed future lease receipts Our strong operating cash flow provides tremendous capital allocation flexibility GATX COMMITTED FUTURE LEASE RECEIPTS OPERATING CASH FLOW & PORTFOLIO PROCEEDS (Continuing Operations) $956 $224 $761 $224 $224 $482 $482 $234 $234 $166 $166 $ $ MILLIONS $563 $ MILLIONS $264 $264 $156 $247 $385 $385 $156 $156 $409 $289 $388 $247 $68 $154 $154 $123 $123 $68 $68 $285 $84 $509 $509 $370 $370 $307 $307 $364 $364 $411 $411 $497 $497 $244 $244 $340 $340 $542 $542 $267 $267 $293 $293 $458 $629 $629 2006 2008 2010 2012 2014 2016 2018 Operating Cash Flow Portfolio Proceeds As of 12/31/2018 As of 12/31/2018 17
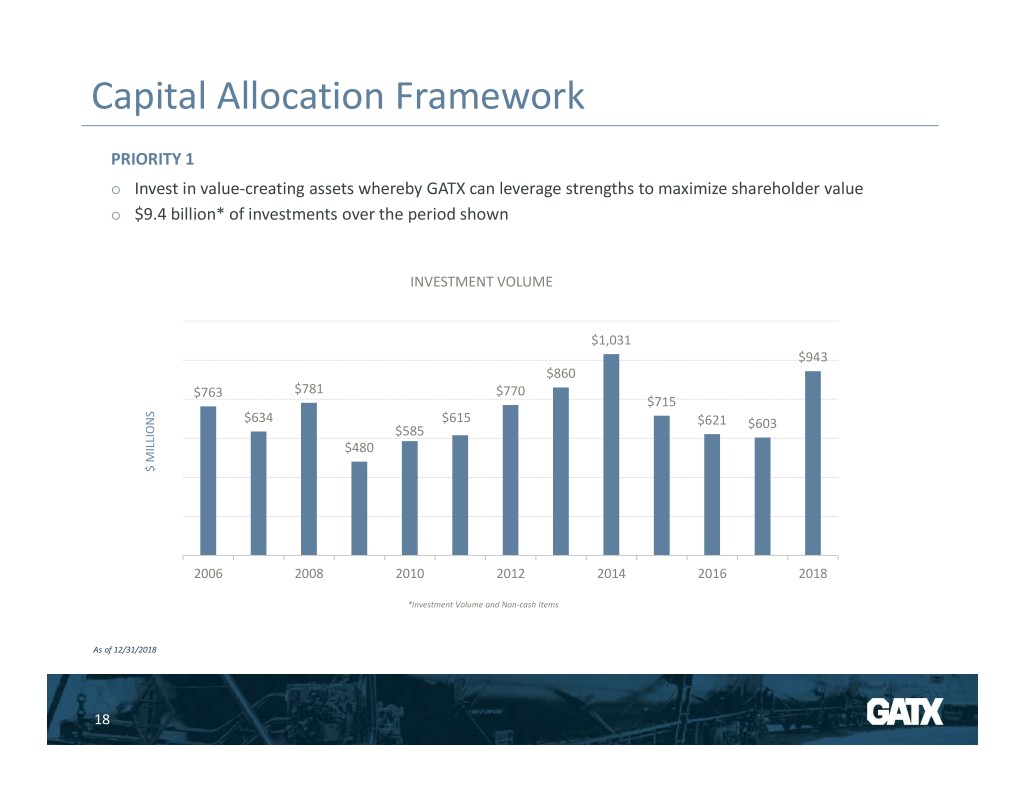
Capital Allocation Framework PRIORITY 1 Invest in value-creating assets whereby GATX can leverage strengths to maximize shareholder value $9.4 billion* of investments over the period shown INVESTMENT VOLUME $1,031 $943 $860 $763 $781 $770 $715 $634 $615 $621 $603 $585 $480 $ $ MILLIONS 2006 2008 2010 2012 2014 2016 2018 *Investment Volume and Non-cash Items As of 12/31/2018 18
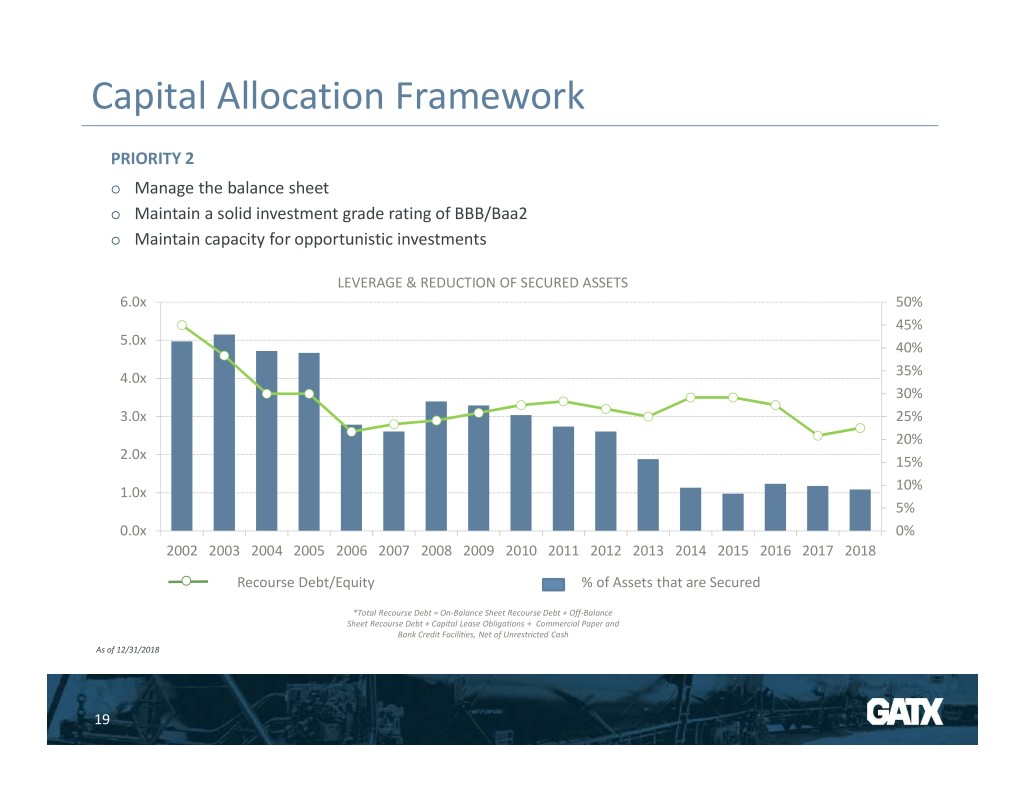
Capital Allocation Framework PRIORITY 2 Manage the balance sheet Maintain a solid investment grade rating of BBB/Baa2 Maintain capacity for opportunistic investments LEVERAGE & REDUCTION OF SECURED ASSETS 6.0x 50% 45% 5.0x 40% 4.0x 35% 30% 3.0x 25% 20% 2.0x 15% 1.0x 10% 5% 0.0x 0% 2002 2003 2004 2005 2006 2007 2008 2009 2010 2011 2012 2013 2014 2015 2016 2017 2018 Recourse Debt/Equity % of Assets that are Secured *Total Recourse Debt = On-Balance Sheet Recourse Debt + Off-Balance Sheet Recourse Debt + Capital Lease Obligations + Commercial Paper and Bank Credit Facilities, Net of Unrestricted Cash As of 12/31/2018 19
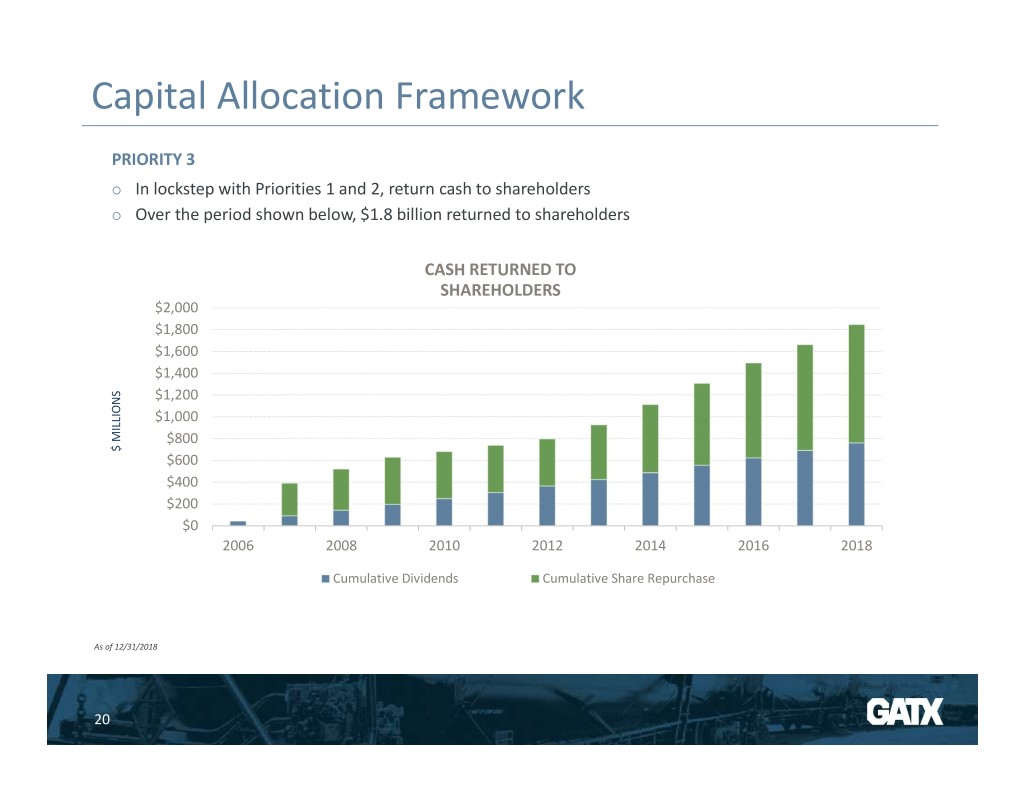
Capital Allocation Framework PRIORITY 3 In lockstep with Priorities 1 and 2, return cash to shareholders Over the period shown below, $1.8 billion returned to shareholders CASH RETURNED TO SHAREHOLDERS $2,000 $1,800 $1,600 $1,400 $1,200 $1,000 $800 $ $ MILLIONS $600 $400 $200 $0 2006 2008 2010 2012 2014 2016 2018 Cumulative Dividends Cumulative Share Repurchase As of 12/31/2018 20
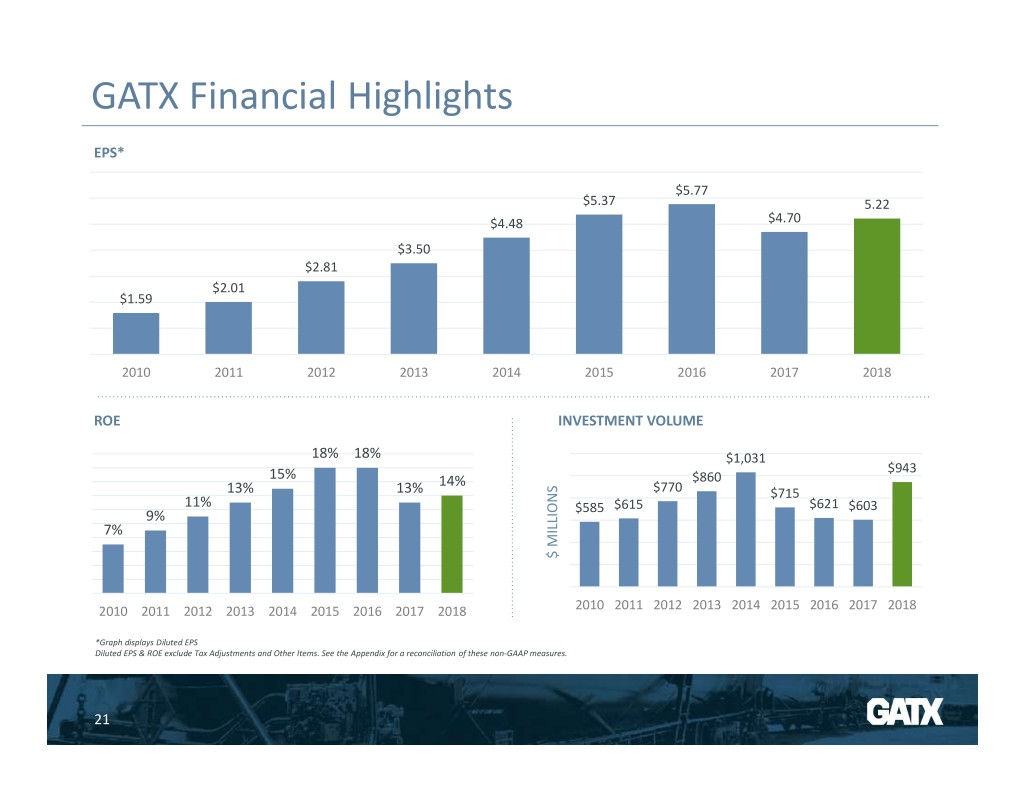
GATX Financial Highlights EPS* $5.77 $5.37 5.22 $4.48 $4.70 $3.50 $2.81 $2.01 $1.59 2010 2011 2012 2013 2014 2015 2016 2017 2018 ROE INVESTMENT VOLUME 18% 18% $1,031 $943 15% 14% $860 13% 13% $770 $715 11% $585 $615 $621 $603 9% 7% $ MILLIONS $ 2010 2011 2012 2013 2014 2015 2016 2017 2018 2010 2011 2012 2013 2014 2015 2016 2017 2018 *Graph displays Diluted EPS Diluted EPS & ROE exclude Tax Adjustments and Other Items. See the Appendix for a reconciliation of these non-GAAP measures. 21
APPENDIX 121 YEARS OF OPERATIONAL EXPERIENCE 22
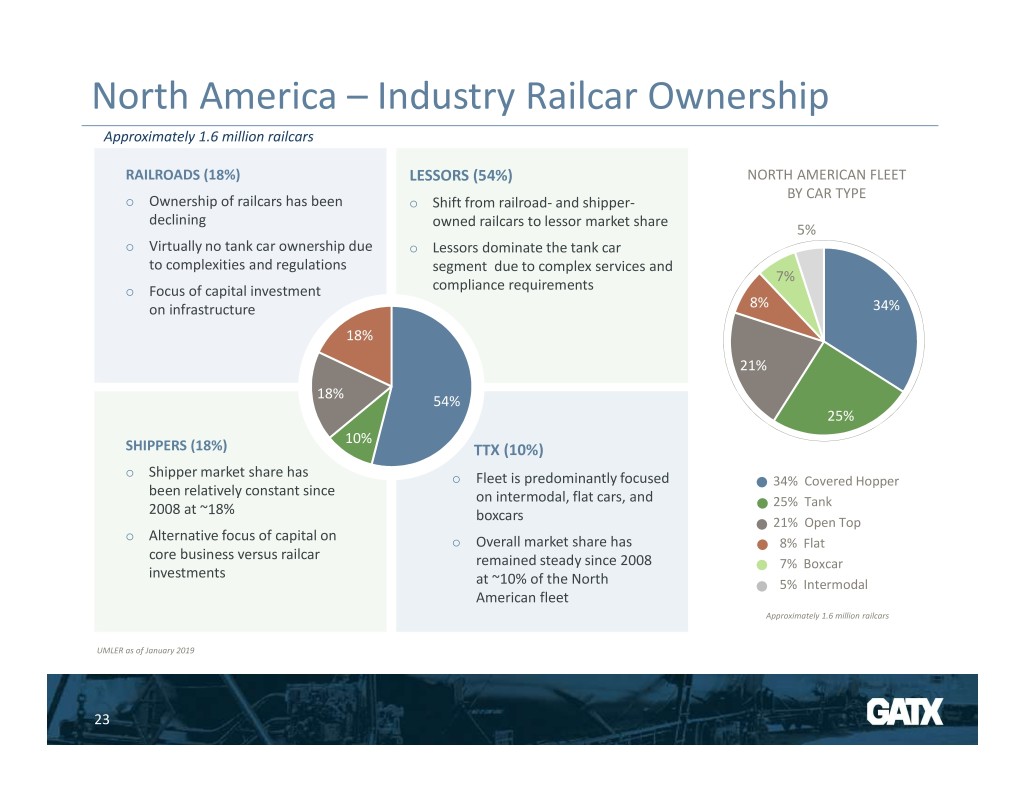
North America – Industry Railcar Ownership Approximately 1.6 million railcars RAILROADS (18%) LESSORS (54%) NORTH AMERICAN FLEET BY CAR TYPE Ownership of railcars has been Shift from railroad- and shipper- declining owned railcars to lessor market share 5% Virtually no tank car ownership due Lessors dominate the tank car to complexities and regulations segment due to complex services and 7% compliance requirements Focus of capital investment on infrastructure 8% 34% 18% 21% 18% 54% 25% 10% SHIPPERS (18%) TTX (10%) Shipper market share has Fleet is predominantly focused 34% Covered Hopper been relatively constant since on intermodal, flat cars, and 2008 at ~18% 25% Tank boxcars 21% Open Top Alternative focus of capital on Overall market share has 8% Flat core business versus railcar remained steady since 2008 7% Boxcar investments at ~10% of the North 5% Intermodal American fleet Approximately 1.6 million railcars UMLER as of January 2019 23
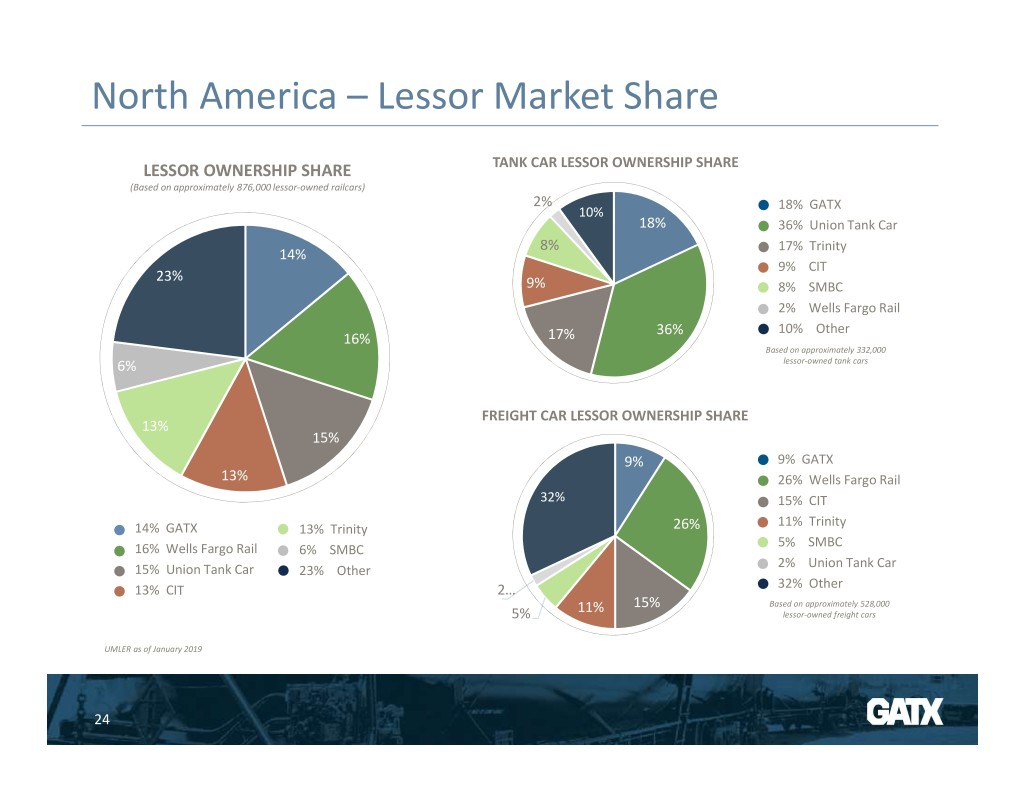
North America – Lessor Market Share LESSOR OWNERSHIP SHARE TANK CAR LESSOR OWNERSHIP SHARE (Based on approximately 876,000 lessor-owned railcars) 2% 18% GATX 10% 18% 36% Union Tank Car 8% 17% Trinity 14% 9% CIT 23% 9% 8% SMBC 2% Wells Fargo Rail 36% 10% Other 16% 17% Based on approximately 332,000 6% lessor-owned tank cars FREIGHT CAR LESSOR OWNERSHIP SHARE 13% 15% 9% 9% GATX 13% 26% Wells Fargo Rail 32% 15% CIT 11% Trinity 14% GATX 13% Trinity 26% 5% SMBC 16% Wells Fargo Rail 6% SMBC 2% Union Tank Car 15% Union Tank Car 23% Other 13% CIT 2… 32% Other 11% 15% Based on approximately 528,000 5% lessor-owned freight cars UMLER as of January 2019 24
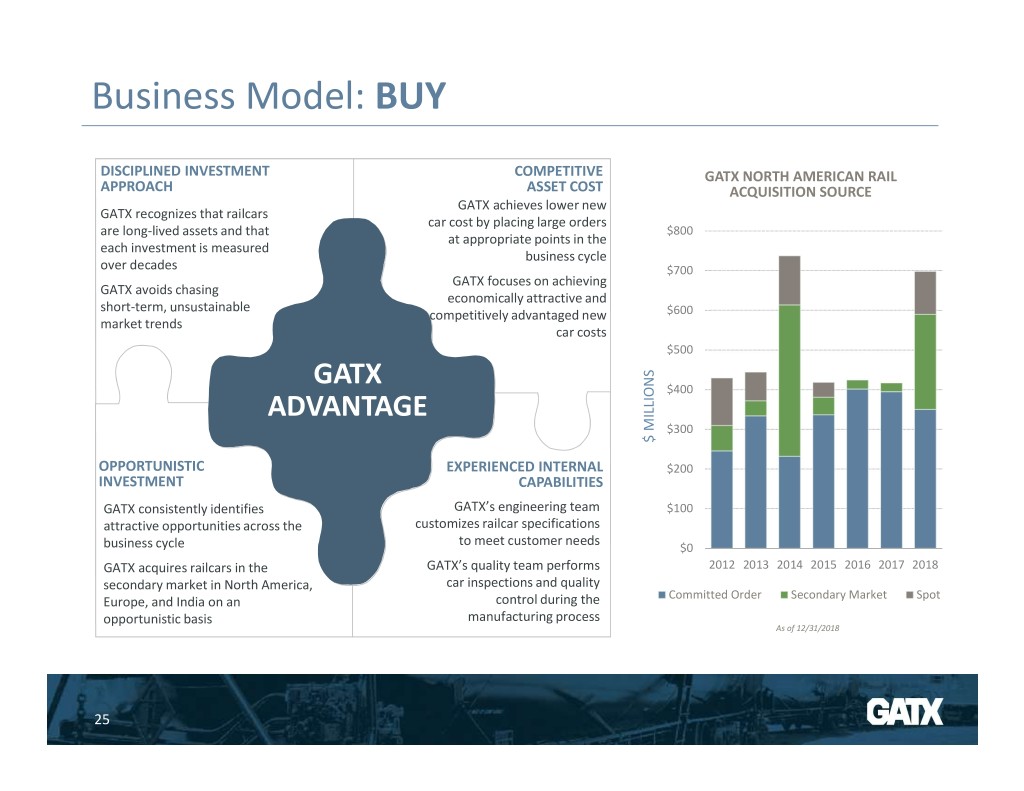
Business Model: BUY DISCIPLINED INVESTMENT COMPETITIVE GATX NORTH AMERICAN RAIL APPROACH ASSET COST ACQUISITION SOURCE GATX achieves lower new GATX recognizes that railcars car cost by placing large orders are long-lived assets and that $800 at appropriate points in the each investment is measured business cycle over decades $700 GATX focuses on achieving GATX avoids chasing economically attractive and short-term, unsustainable competitively advantaged new $600 market trends car costs $500 GATX $400 ADVANTAGE $300 $ MILLIONS $ OPPORTUNISTIC EXPERIENCED INTERNAL $200 INVESTMENT CAPABILITIES GATX consistently identifies GATX’s engineering team $100 attractive opportunities across the customizes railcar specifications to meet customer needs business cycle $0 GATX acquires railcars in the GATX’s quality team performs 2012 2013 2014 2015 2016 2017 2018 secondary market in North America, car inspections and quality Committed Order Secondary Market Spot Europe, and India on an control during the opportunistic basis manufacturing process As of 12/31/2018 25
Business Model: BUY Railcar Supply Strategy GATX’s strategy is to secure railcars from a variety of sources as opposed to also being a railcar manufacturer; combining railcar manufacturing with a railcar leasing business: o Adds significant volatility leading to a higher cost of capital o Can result in poor asset allocation within the lease fleet as cars are added simply to optimize the manufacturing line GATX’s sources of railcar supply o Large, multi-year orders for new cars from manufacturers during the down cycle o Spot orders for new cars to meet specific customer demand o Fleet acquisitions of existing cars from other lessors and customers Benefits of railcar supply strategy o Access to attractively priced railcars o Ability to grow our high quality fleet and reliably meet customer demand 26
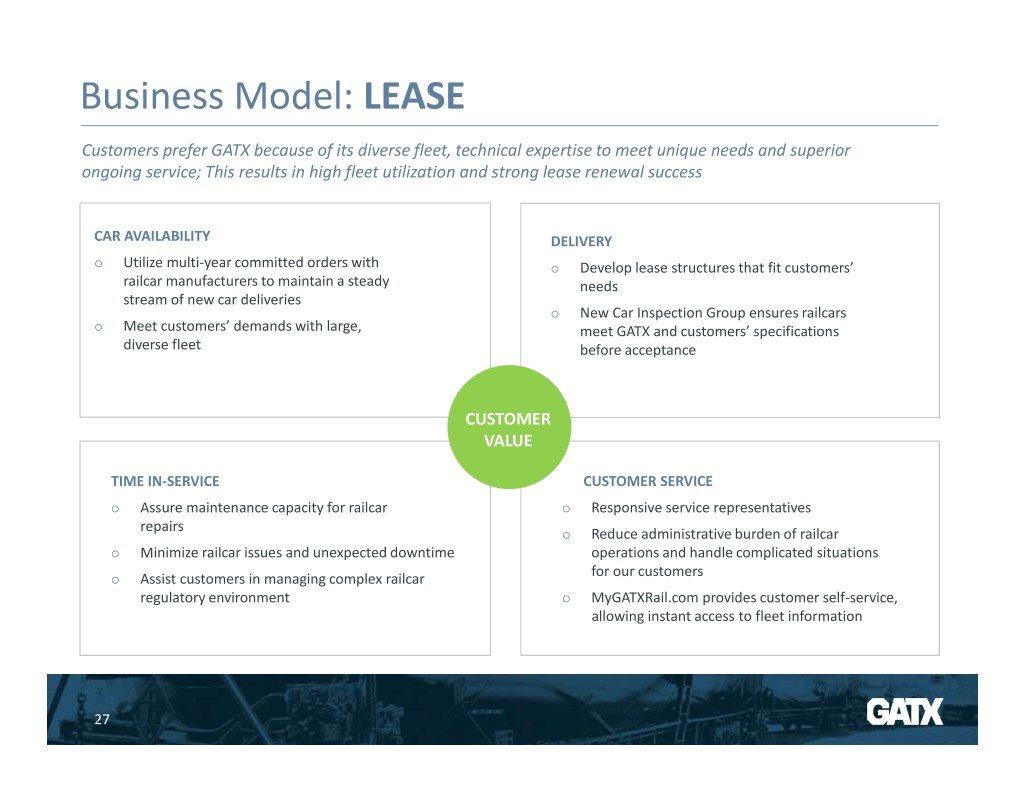
Business Model: LEASE Customers prefer GATX because of its diverse fleet, technical expertise to meet unique needs and superior ongoing service; This results in high fleet utilization and strong lease renewal success CAR AVAILABILITY DELIVERY Utilize multi-year committed orders with Develop lease structures that fit customers’ railcar manufacturers to maintain a steady needs stream of new car deliveries New Car Inspection Group ensures railcars Meet customers’ demands with large, meet GATX and customers’ specifications diverse fleet before acceptance CUSTOMER VALUE TIME IN-SERVICE CUSTOMER SERVICE Assure maintenance capacity for railcar Responsive service representatives repairs Reduce administrative burden of railcar Minimize railcar issues and unexpected downtime operations and handle complicated situations for our customers Assist customers in managing complex railcar regulatory environment MyGATXRail.com provides customer self-service, allowing instant access to fleet information 27
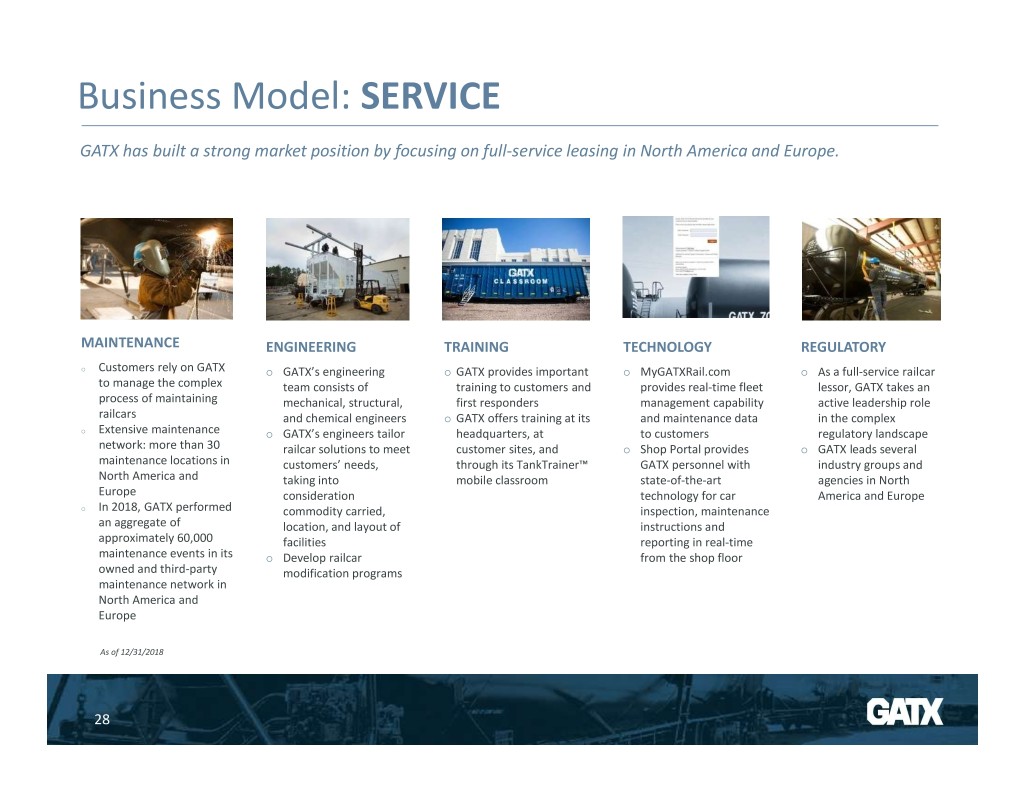
Business Model: SERVICE GATX has built a strong market position by focusing on full-service leasing in North America and Europe. MAINTENANCE ENGINEERING TRAINING TECHNOLOGY REGULATORY o Customers rely on GATX GATX’s engineering GATX provides important MyGATXRail.com As a full-service railcar to manage the complex team consists of training to customers and provides real-time fleet lessor, GATX takes an process of maintaining mechanical, structural, first responders management capability active leadership role railcars and chemical engineers GATX offers training at its and maintenance data in the complex o Extensive maintenance GATX’s engineers tailor headquarters, at to customers regulatory landscape network: more than 30 railcar solutions to meet customer sites, and Shop Portal provides GATX leads several maintenance locations in customers’ needs, through its TankTrainer™ GATX personnel with industry groups and North America and taking into mobile classroom state-of-the-art agencies in North Europe consideration technology for car America and Europe o In 2018, GATX performed commodity carried, inspection, maintenance an aggregate of location, and layout of instructions and approximately 60,000 facilities reporting in real-time maintenance events in its Develop railcar from the shop floor owned and third-party modification programs maintenance network in North America and Europe As of 12/31/2018 28
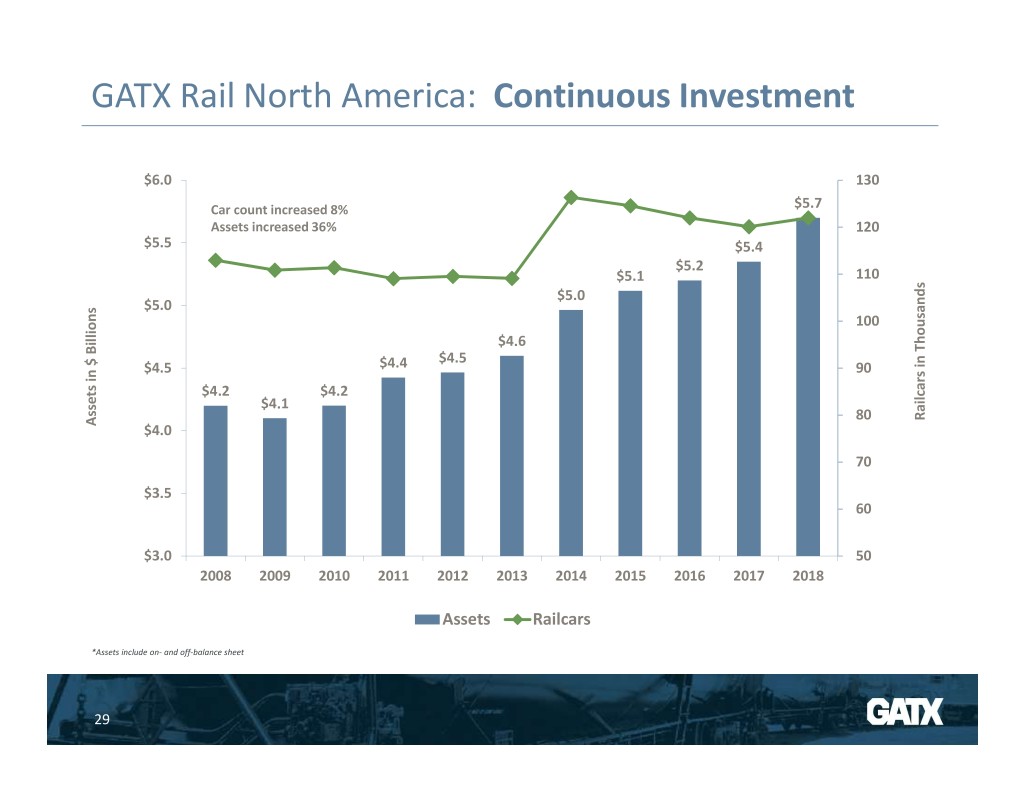
GATX Rail North America: Continuous Investment $6.0 130 Car count increased 8% $5.7 Assets increased 36% 120 $5.5 $5.4 $5.2 $5.1 110 $5.0 $5.0 100 $4.6 $4.5 $4.5 $4.4 90 $4.2 $4.2 $4.1 80 RailcarsThousands in Assets in $ Billions Assets $ in $4.0 70 $3.5 60 $3.0 50 2008 2009 2010 2011 2012 2013 2014 2015 2016 2017 2018 Assets Railcars *Assets include on- and off-balance sheet 29
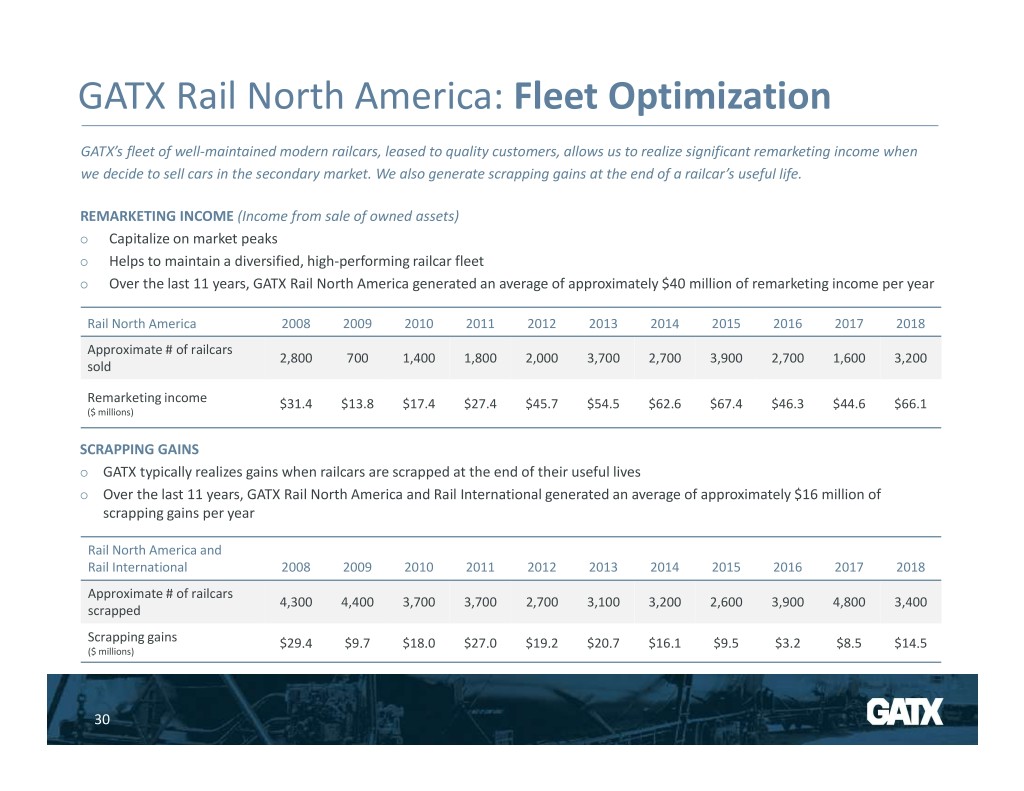
GATX Rail North America: Fleet Optimization GATX’s fleet of well-maintained modern railcars, leased to quality customers, allows us to realize significant remarketing income when we decide to sell cars in the secondary market. We also generate scrapping gains at the end of a railcar’s useful life. REMARKETING INCOME (Income from sale of owned assets) Capitalize on market peaks Helps to maintain a diversified, high-performing railcar fleet Over the last 11 years, GATX Rail North America generated an average of approximately $40 million of remarketing income per year Rail North America 2008 2009 2010 2011 2012 2013 2014 2015 2016 2017 2018 Approximate # of railcars 2,800 700 1,400 1,800 2,000 3,700 2,700 3,900 2,700 1,600 3,200 sold Remarketing income $31.4 $13.8 $17.4 $27.4 $45.7 $54.5 $62.6 $67.4 $46.3 $44.6 $66.1 ($ millions) SCRAPPING GAINS GATX typically realizes gains when railcars are scrapped at the end of their useful lives Over the last 11 years, GATX Rail North America and Rail International generated an average of approximately $16 million of scrapping gains per year Rail North America and Rail International 2008 2009 2010 2011 2012 2013 2014 2015 2016 2017 2018 Approximate # of railcars 4,300 4,400 3,700 3,700 2,700 3,100 3,200 2,600 3,900 4,800 3,400 scrapped Scrapping gains $29.4 $9.7 $18.0 $27.0 $19.2 $20.7 $16.1 $9.5 $3.2 $8.5 $14.5 ($ millions) 30

GATX Rail North America: Railcar Supply Strategy GATX’s strategy is to secure railcars from a variety of sources as opposed to also being a railcar manufacturer; combining railcar manufacturing with a railcar leasing business: o Adds significant volatility leading to a higher cost of capital o Can result in poor asset allocation within the lease fleet as cars are added simply to optimize the manufacturing line GATX’s sources of railcar supply o Large, multi-year orders for new cars from manufacturers during the down cycle o Spot orders for new cars to meet specific customer demand o Fleet acquisitions of existing cars from other lessors and customers Benefits of railcar supply strategy o Access to attractively priced railcars o Ability to grow our high quality fleet and reliably meet customer demand 31
GATX Rail North America: Summary Attractive economic returns in railcar leasing are driven by: Access to efficiently priced capital and appropriate financial leverage Acquiring the right railcars at the right time at the right price Fleet diversification across railcar types, commodities carried, and customers served Continuous fleet optimization through secondary market purchases and sales Superior sales, customer service, engineering, and maintenance efforts A commitment to safety 32
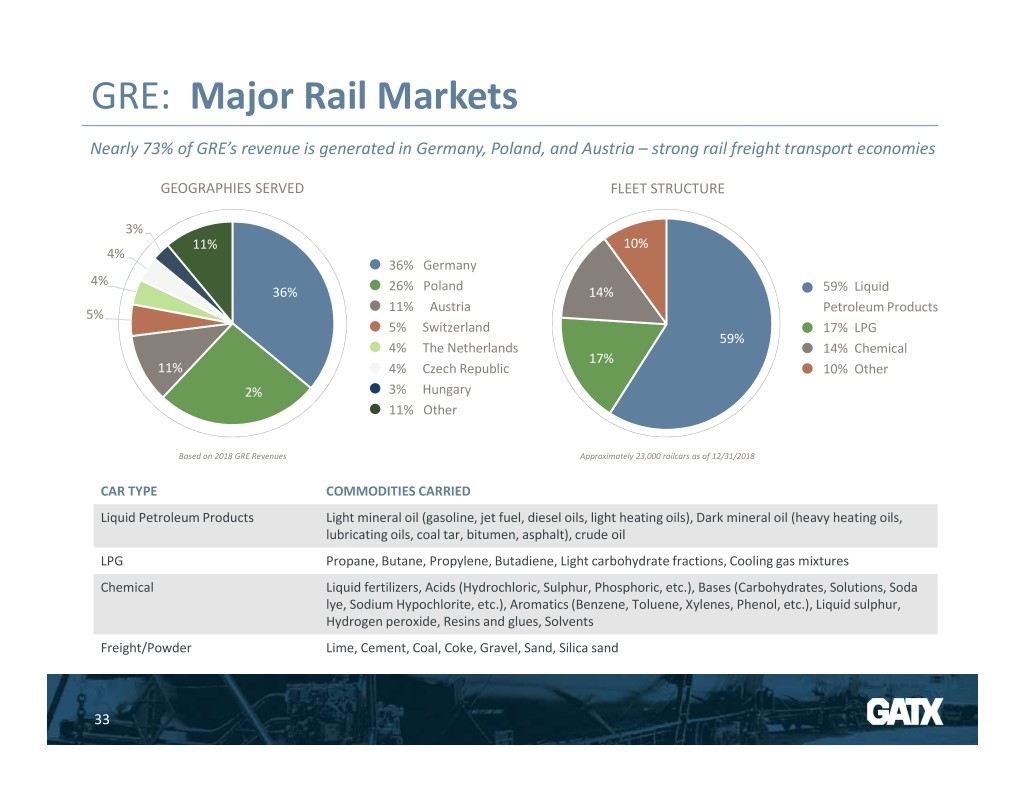
GRE: Major Rail Markets Nearly 73% of GRE’s revenue is generated in Germany, Poland, and Austria – strong rail freight transport economies GEOGRAPHIES SERVED FLEET STRUCTURE 3% 11% 10% 4% 36% Germany 4% 36% 26% Poland 14% 59% Liquid 11% Austria Petroleum Products 5% 5% Switzerland 17% LPG 59% 4% The Netherlands 14% Chemical 17% 11% 4% Czech Republic 10% Other 2% 3% Hungary 11% Other Based on 2018 GRE Revenues Approximately 23,000 railcars as of 12/31/2018 CAR TYPE COMMODITIES CARRIED Liquid Petroleum Products Light mineral oil (gasoline, jet fuel, diesel oils, light heating oils), Dark mineral oil (heavy heating oils, lubricating oils, coal tar, bitumen, asphalt), crude oil LPG Propane, Butane, Propylene, Butadiene, Light carbohydrate fractions, Cooling gas mixtures Chemical Liquid fertilizers, Acids (Hydrochloric, Sulphur, Phosphoric, etc.), Bases (Carbohydrates, Solutions, Soda lye, Sodium Hypochlorite, etc.), Aromatics (Benzene, Toluene, Xylenes, Phenol, etc.), Liquid sulphur, Hydrogen peroxide, Resins and glues, Solvents Freight/Powder Lime, Cement, Coal, Coke, Gravel, Sand, Silica sand 33
RECONCILIATION 121 YEARS OF OF NON-GAAP OPERATIONAL MEASURES EXPERIENCE 34
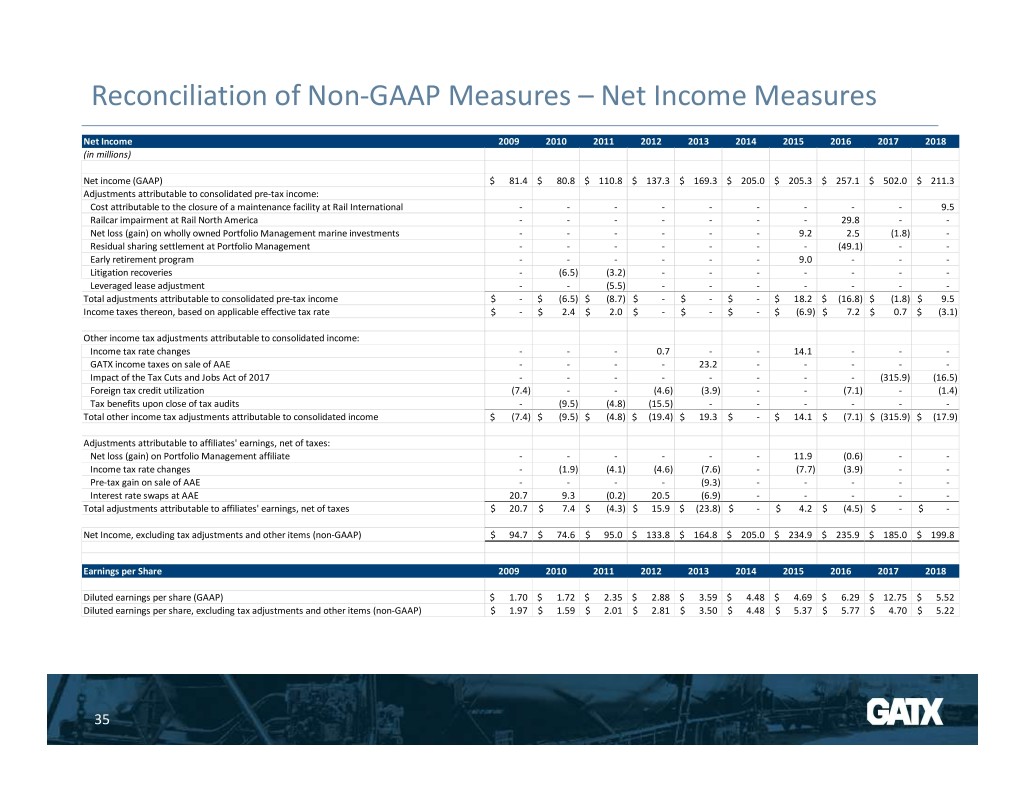
Reconciliation of Non-GAAP Measures – Net Income Measures Net Income 2009 2010 2011 2012 2013 2014 2015 2016 2017 2018 (in millions) Net income (GAAP)$ 81.4 $ 80.8 $ 110.8 $ 137.3 $ 169.3 $ 205.0 $ 205.3 $ 257.1 $ 502.0 $ 211.3 Adjustments attributable to consolidated pre-tax income: Cost attributable to the closure of a maintenance facility at Rail International - - - - - - - - - 9.5 Railcar impairment at Rail North America - - - - - - - 29.8 - - Net loss (gain) on wholly owned Portfolio Management marine investments - - - - - - 9.2 2.5 (1.8) - Residual sharing settlement at Portfolio Management - - - - - - - (49.1) - - Early retirement program - - - - - - 9.0 - - - Litigation recoveries - (6.5) (3.2) - - - - - - - Leveraged lease adjustment - - (5.5) - - - - - - - Total adjustments attributable to consolidated pre-tax income$ - $ (6.5) $ (8.7) $ - $ - $ - $ 18.2 $ (16.8) $ (1.8) $ 9.5 Income taxes thereon, based on applicable effective tax rate$ - $ 2.4 $ 2.0 $ - $ - $ - $ (6.9) $ 7.2 $ 0.7 $ (3.1) Other income tax adjustments attributable to consolidated income: Income tax rate changes - - - 0.7 - - 14.1 - - - GATX income taxes on sale of AAE - - - - 23.2 - - - - - Impact of the Tax Cuts and Jobs Act of 2017 - - - - - - - - (315.9) (16.5) Foreign tax credit utilization (7.4) - - (4.6) (3.9) - - (7.1) - (1.4) Tax benefits upon close of tax audits - (9.5) (4.8) (15.5) - - - - - - Total other income tax adjustments attributable to consolidated income$ (7.4) $ (9.5) $ (4.8) $ (19.4) $ 19.3 $ - $ 14.1 $ (7.1) $ (315.9) $ (17.9) Adjustments attributable to affiliates' earnings, net of taxes: Net loss (gain) on Portfolio Management affiliate - - - - - - 11.9 (0.6) - - Income tax rate changes - (1.9) (4.1) (4.6) (7.6) - (7.7) (3.9) - - Pre-tax gain on sale of AAE - - - - (9.3) - - - - - Interest rate swaps at AAE 20.7 9.3 (0.2) 20.5 (6.9) - - - - - Total adjustments attributable to affiliates' earnings, net of taxes$ 20.7 $ 7.4 $ (4.3) $ 15.9 $ (23.8) $ - $ 4.2 $ (4.5) $ - $ - Net Income, excluding tax adjustments and other items (non-GAAP)$ 94.7 $ 74.6 $ 95.0 $ 133.8 $ 164.8 $ 205.0 $ 234.9 $ 235.9 $ 185.0 $ 199.8 Earnings per Share 2009 2010 2011 2012 2013 2014 2015 2016 2017 2018 Diluted earnings per share (GAAP)$ 1.70 $ 1.72 $ 2.35 $ 2.88 $ 3.59 $ 4.48 $ 4.69 $ 6.29 $ 12.75 $ 5.52 Diluted earnings per share, excluding tax adjustments and other items (non-GAAP)$ 1.97 $ 1.59 $ 2.01 $ 2.81 $ 3.50 $ 4.48 $ 5.37 $ 5.77 $ 4.70 $ 5.22 35
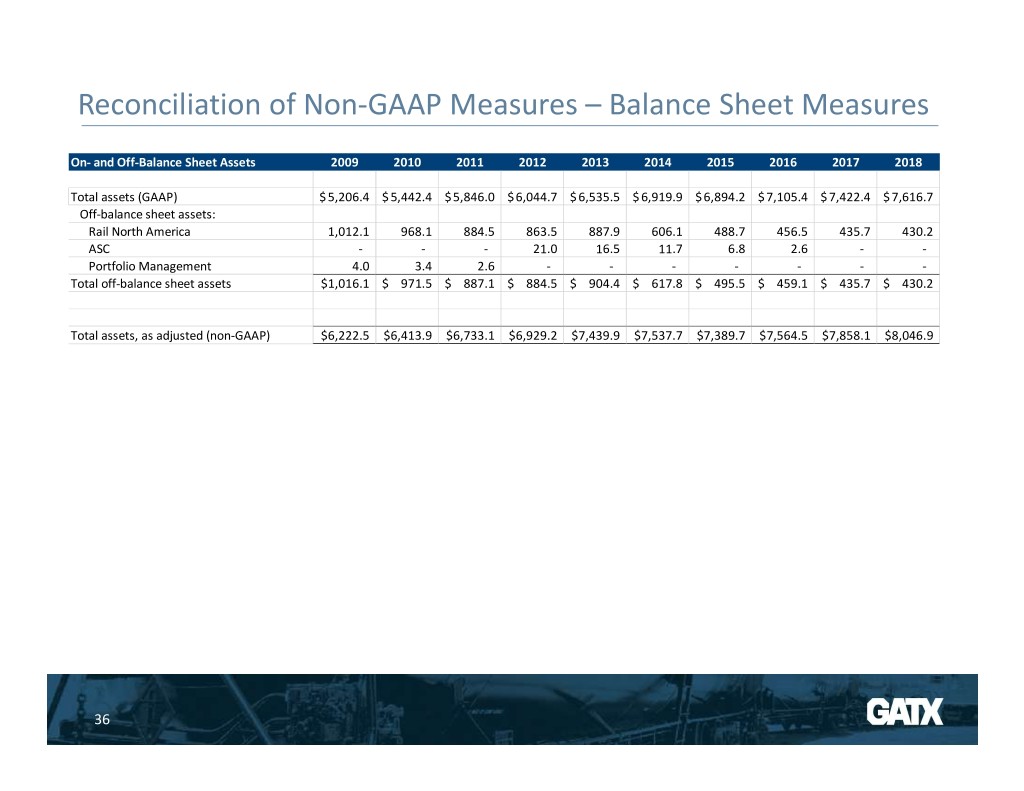
Reconciliation of Non-GAAP Measures – Balance Sheet Measures On- and Off-Balance Sheet Assets 2009 2010 2011 2012 2013 2014 2015 2016 2017 2018 Total assets (GAAP)$ 5,206.4 $ 5,442.4 $ 5,846.0 $ 6,044.7 $ 6,535.5 $ 6,919.9 $ 6,894.2 $ 7,105.4 $ 7,422.4 $ 7,616.7 Off-balance sheet assets: Rail North America 1,012.1 968.1 884.5 863.5 887.9 606.1 488.7 456.5 435.7 430.2 ASC - - - 21.0 16.5 11.7 6.8 2.6 - - Portfolio Management 4.0 3.4 2.6 - - - - - - - Total off-balance sheet assets$ 1,016.1 $ 971.5 $ 887.1 $ 884.5 $ 904.4 $ 617.8 $ 495.5 $ 459.1 $ 435.7 $ 430.2 Total assets, as adjusted (non-GAAP)$ 6,222.5 $ 6,413.9 $ 6,733.1 $ 6,929.2 $ 7,439.9 $ 7,537.7 $ 7,389.7 $ 7,564.5 $ 7,858.1 $ 8,046.9 36


