Alpha Partners Leasing Limited Consolidated Financial Statements for the Year Ended 31 December 2019

Alpha Partners Leasing Limited Contents Statement of Directors’ Responsibilities in respect of the Consolidated Financial Statements ..................................... 4 Report of Independent Auditors .................................................................................................................................... 5 Consolidated Income Statement for the Year Ended 31 December 2019 ...................................................................... 7 Consolidated Statement of Comprehensive Income for the Year Ended 31 December 2019 ........................................ 8 Consolidated Balance Sheet as at 31 December 2019 ................................................................................................... 9 Consolidated Statement of Changes in Equity ............................................................................................................. 10 Consolidated Statement of Cash Flows for the Year Ended 31 December 2019 ......................................................... 11 Notes to the Financial Statements for the Year Ended 31 December 2019 ................................................................. 12 1 General information and business overview ................................................................................................... 12 2 Accounting policies ........................................................................................................................................ 13 3 Recent accounting standards adopted during the year ended 31 December 2019 .......................................... 19 4 Future application of accounting standards .................................................................................................... 19 5 Critical accounting estimates and judgements ................................................................................................ 19 6 Revenue .......................................................................................................................................................... 20 7 Other operating income .................................................................................................................................. 21 8 Operating profit .............................................................................................................................................. 21 9 Asset impairments .......................................................................................................................................... 21 10 Staff number and costs ................................................................................................................................... 22 11 Directors' remuneration .................................................................................................................................. 22 12 Auditors’ remuneration .................................................................................................................................. 22 13 Interest expense .............................................................................................................................................. 23 14 Taxation .......................................................................................................................................................... 23 15 Dividends........................................................................................................................................................ 24 16 Inventories ...................................................................................................................................................... 24 17 Property plant and equipment ......................................................................................................................... 25 18 Investments in associate ................................................................................................................................. 26 19 Other financial assets ...................................................................................................................................... 26 20 Financial instruments ...................................................................................................................................... 26 21 Receivables, net .............................................................................................................................................. 28 22 Leases ............................................................................................................................................................. 28 23 Current liabilities ............................................................................................................................................ 30 24 Non-current liabilities ..................................................................................................................................... 30 25 Borrowings ..................................................................................................................................................... 31 26 Security ........................................................................................................................................................... 32

27 Covenants ....................................................................................................................................................... 32 28 Analysis of changes in net debt ...................................................................................................................... 33 29 Provisions for liabilities .................................................................................................................................. 33 30 Pension and other schemes ............................................................................................................................. 33 31 Share capital ................................................................................................................................................... 34 32 Capital reserve ................................................................................................................................................ 34 33 Commitments ................................................................................................................................................. 34 34 Financial guarantee contracts ......................................................................................................................... 35 35 Related party transactions ............................................................................................................................... 35 36 Subsidiaries .................................................................................................................................................... 36 37 Post balance sheet events ................................................................................................................................ 38 38 Parent and ultimate parent undertaking .......................................................................................................... 38 39 US GAAP information ................................................................................................................................... 39
Alpha Partners Leasing Limited Statement of Directors’ Responsibilities in respect of the Consolidated Financial Statements The Directors present the consolidated financial statements for the years ended 31 December 2019, 31 December 2018 and 31 December 2017. The Directors are responsible for the preparation of the consolidated financial statements in accordance with Financial Reporting Standard 102 'The Financial Reporting Standard applicable in the UK and Republic of Ireland' as issued in August 2014 (United Kingdom Accounting Standards and applicable law). The consolidated financial statements have been prepared by the Directors with the purpose of providing financial information to GATX Corporation to assist it satisfy its reporting responsibilities under Regulation S-X, Rule 3-09. The Directors are satisfied that these consolidated financial statements present fairly the state of affairs of the Company and its subsidiary undertakings and of the profit and cash flows of the Company and its subsidiary undertakings for the years ended 31 December 2019, 31 December 2018 and 31 December 2017. In preparing the consolidated financial statements the Directors have: • selected an appropriate basis of preparation given the intended purpose of the consolidated financial statements, as set out in Note 2, and applied that basis of preparation to all periods presented; • selected suitable accounting policies, as set out in Note 2, and then applied them consistently to all periods presented; • made judgements and accounting estimates that are reasonable and prudent; and • prepared the financial statements on the going concern basis unless it is inappropriate to presume that the Company will continue in business. The factors taken into consideration by the Directors in forming their conclusions in relation to going concern are set out in Note 2. These consolidated financial statements have not been prepared under section 394 of the Companies Act 2006 and are not the company’s statutory financial statements. Provision of Information to Auditors As far as the Directors are aware, there is no relevant audit information of which the Company’s auditors are unaware, and the Directors have taken all the steps that ought to have been taken as Directors in order to make themselves aware of any relevant audit information and to establish that the Company’s auditors are aware of that information. Authorised by the Board on 30 March 2020 and signed on its behalf by: /s/ James Harvey James Harvey Director, Alpha Partners Leasing Limited Page 4

Alpha Partners Leasing Limited Report of Independent Auditors To the Directors Alpha Partners Leasing Limited We have audited the accompanying consolidated financial statements of Alpha Partners Leasing Limited and its subsidiaries, which comprise the consolidated balance sheet as of December 31, 2019, and the related consolidated income statement, consolidated statement of comprehensive income, consolidated statement of changes in equity and the consolidated statement of cash flows for the year then ended. Management's Responsibility for the Consolidated Financial Statements Management is responsible for the preparation and fair presentation of the consolidated financial statements in accordance with United Kingdom Generally Accepted Accounting Practice (United Kingdom Accounting Standards, comprising FRS 102 "The Financial Reporting Standard applicable in the UK and Republic of Ireland", hereafter referred to as “accounting principles generally accepted in the United Kingdom”); this includes the design, implementation, and maintenance of internal control relevant to the preparation and fair presentation of consolidated financial statements that are free from material misstatement, whether due to fraud or error. Auditors’ Responsibility Our responsibility is to express an opinion on the consolidated financial statements based on our audit. We conducted our audits in accordance with auditing standards generally accepted in the United States of America. Those standards require that we plan and perform the audit to obtain reasonable assurance about whether the consolidated financial statements are free from material misstatement. An audit involves performing procedures to obtain audit evidence about the amounts and disclosures in the consolidated financial statements. The procedures selected depend on our judgment, including the assessment of the risks of material misstatement of the consolidated financial statements, whether due to fraud or error. In making those risk assessments, we consider internal control relevant to the Company's preparation and fair presentation of the consolidated financial statements in order to design audit procedures that are appropriate in the circumstances, but not for the purpose of expressing an opinion on the effectiveness of the Company's internal control. Accordingly, we express no such opinion. An audit also includes evaluating the appropriateness of accounting policies used and the reasonableness of significant accounting estimates made by management, as well as evaluating the overall presentation of the consolidated financial statements. We believe that the audit evidence we have obtained is sufficient and appropriate to provide a basis for our audit opinion. Opinion In our opinion, the consolidated financial statements referred to above present fairly, in all material respects, the financial position of Alpha Partners Leasing Limited and its subsidiaries as of December 31, 2019, and the results of their operations and their cash flows for the year then ended in accordance with accounting principles generally accepted in the United Kingdom. Page 5
Emphasis of matter – Basis of Preparation In forming our opinion on the consolidated financial statements, which is not modified, we draw attention to the basis of preparation set out in Note 2. Accounting principles generally accepted in the United Kingdom vary in certain significant respects from accounting principles generally accepted in the United States of America. Information relating to the nature and effect of such differences is presented in Note 2 and Note 38 to the consolidated financial statements. In addition, these consolidated financial statements are not the statutory financial statements of the Alpha Partners Leasing Limited and its subsidiaries prepared in accordance with section 394 of the Companies Act 2006. Accordingly, these consolidated financial statements do not present information on the Company as a separate legal entity. Other Matter The accompanying consolidated balance sheets as of December 31, 2019, and the related consolidated income statement, consolidated statement of comprehensive income, consolidated statement of changes in equity and the consolidated statement of cash flows for the year then ended are presented for purposes of complying with Rule 3-09 of SEC Regulation S-X; however, Rule 3-09 does not require the 2018 and 2017 financial statements to be audited and they are therefore not covered by this report. /s/ PricewaterhouseCoopers LLP PricewaterhouseCoopers LLP London, United Kingdom 30 March 2020 Page 6
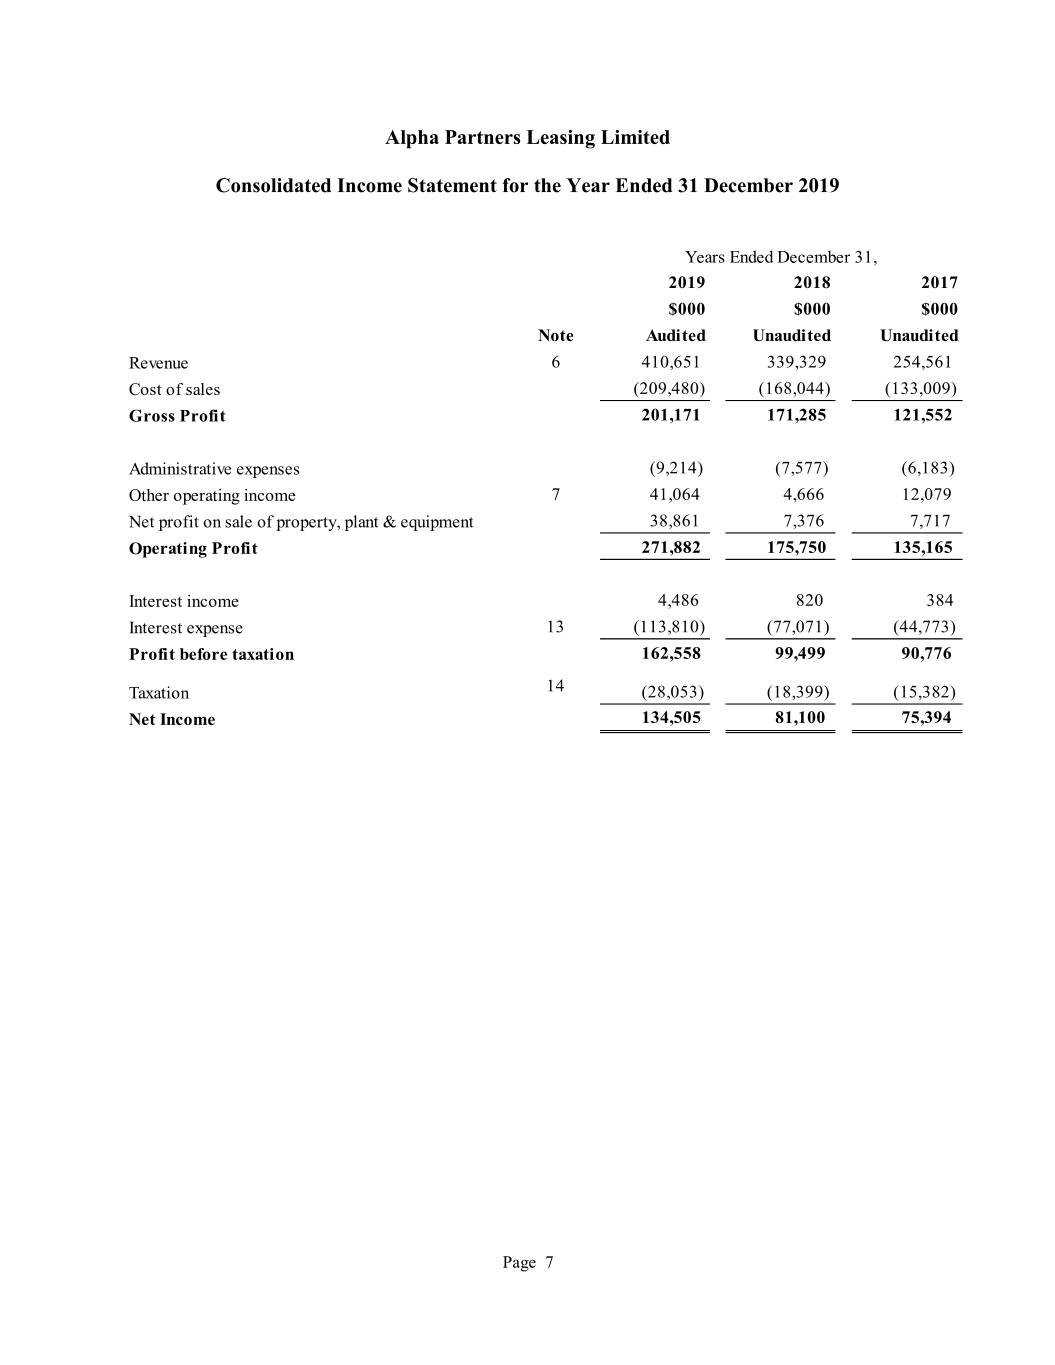
Alpha Partners Leasing Limited Consolidated Income Statement for the Year Ended 31 December 2019 Years Ended December 31, 2019 2018 2017 $000 $000 $000 Note Audi ted Unaudited Unaudited Revenue 6 410,651 339,329 254,561 Cost of sales (209,480) (168,044) (133,009) Gross Profit 201,171 171,285 121,552 Administrative expenses (9,214) (7,577) (6,183) Other operating income 7 41,064 4,666 12,079 Net profit on sale of property, plant & equipment 38,861 7,376 7,717 Operating Profit 271,882 175,750 135,165 Interest income 4,486 820 384 Interest expense 13 (113,810) (77,071) (44,773) Profit before taxation 162,558 99,499 90,776 Taxation 14 (28,053) (18,399) (15,382) Net Income 134,505 81,100 75,394 Page 7

Alpha Partners Leasing Limited Consolidated Statement of Comprehensive Income for the Year Ended 31 December 2019 Years Ended December 31, 2019 2018 2017 $000 $000 $000 Audi ted Unaudited Unaudited Net Income 134,505 81,100 75,394 Cash flow hedging reserve movements (3,407) 929 1,621 Impact of tax (37) - - Total comprehensive income 131,061 82,029 77,015 Page 8
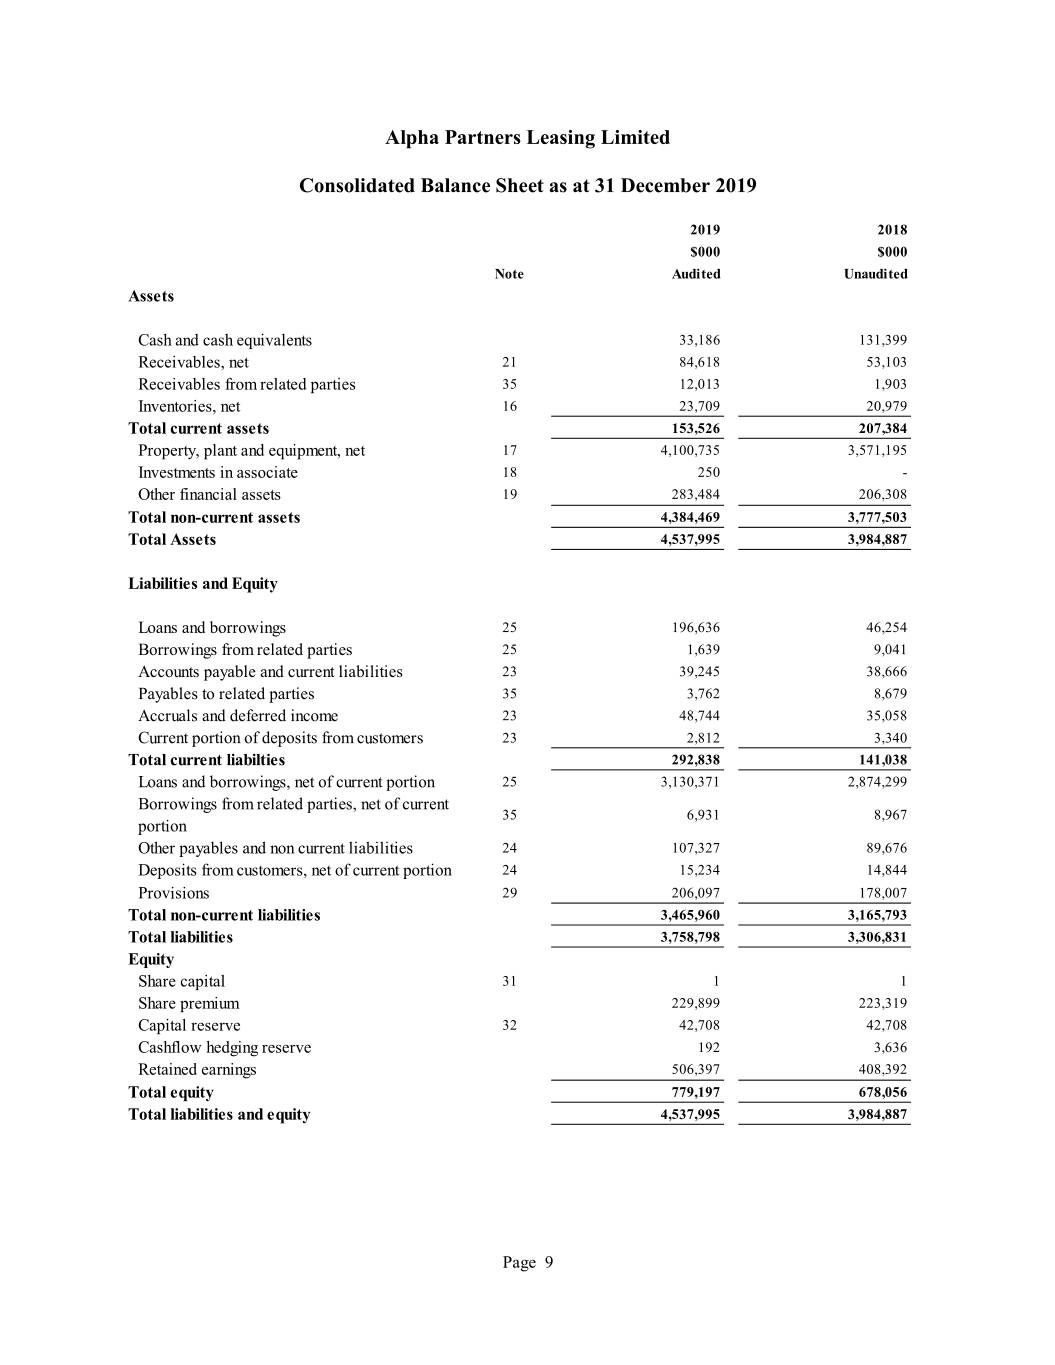
Alpha Partners Leasing Limited Consolidated Balance Sheet as at 31 December 2019 2019 2018 $000 $000 Note Audi ted Unaudited Assets Cash and cash equivalents 33,186 131,399 Receivables, net 21 84,618 53,103 Receivables from related parties 35 12,013 1,903 Inventories, net 16 23,709 20,979 Total current assets 153,526 207,384 Property, plant and equipment, net 17 4,100,735 3,571,195 Investments in associate 18 250 - Other financial assets 19 283,484 206,308 Total non-current assets 4,384,469 3,777,503 Total Assets 4,537,995 3,984,887 Liabilities and Equity Loans and borrowings 25 196,636 46,254 Borrowings from related parties 25 1,639 9,041 Accounts payable and current liabilities 23 39,245 38,666 Payables to related parties 35 3,762 8,679 Accruals and deferred income 23 48,744 35,058 Current portion of deposits from customers 23 2,812 3,340 Total current liabilties 292,838 141,038 Loans and borrowings, net of current portion 25 3,130,371 2,874,299 Borrowings from related parties, net of current 35 6,931 8,967 portion Other payables and non current liabilities 24 107,327 89,676 Deposits from customers, net of current portion 24 15,234 14,844 Provisions 29 206,097 178,007 Total non-current liabilities 3,465,960 3,165,793 Total liabilities 3,758,798 3,306,831 Equity Share capital 31 1 1 Share premium 229,899 223,319 Capital reserve 32 42,708 42,708 Cashflow hedging reserve 192 3,636 Retained earnings 506,397 408,392 Total equity 779,197 678,056 Total liabilities and equity 4,537,995 3,984,887 Page 9
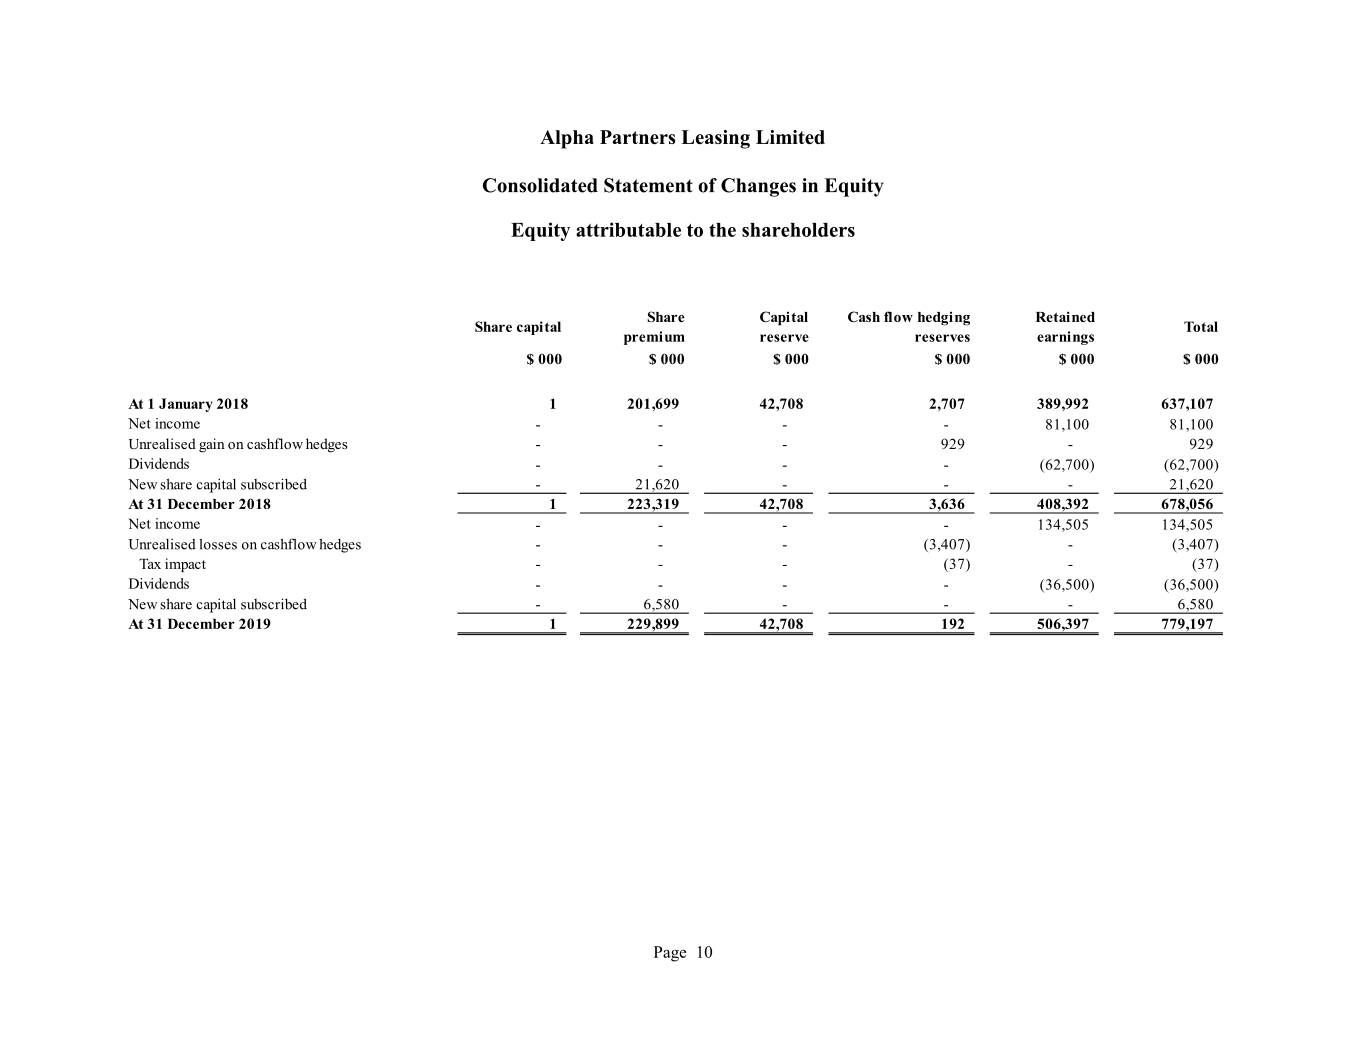
Alpha Partners Leasing Limited Consolidated Statement of Changes in Equity Equity attributable to the shareholders Share Capital Cash flow hedging Retained Share capital Total premium reserve reserves earnings $ 000 $ 000 $ 000 $ 000 $ 000 $ 000 At 1 January 2018 1 201,699 42,708 2,707 389,992 637,107 Net income - - - - 81,100 81,100 Unrealised gain on cashflow hedges - - - 929 - 929 Dividends - - - - (62,700) (62,700) New share capital subscribed - 21,620 - - - 21,620 At 31 December 2018 1 223,319 42,708 3,636 408,392 678,056 Net income - - - - 134,505 134,505 Unrealised losses on cashflow hedges - - - (3,407) - (3,407) Tax impact - - - (37) - (37) Dividends - - - - (36,500) (36,500) New share capital subscribed - 6,580 - - - 6,580 At 31 December 2019 1 229,899 42,708 192 506,397 779,197 Page 10
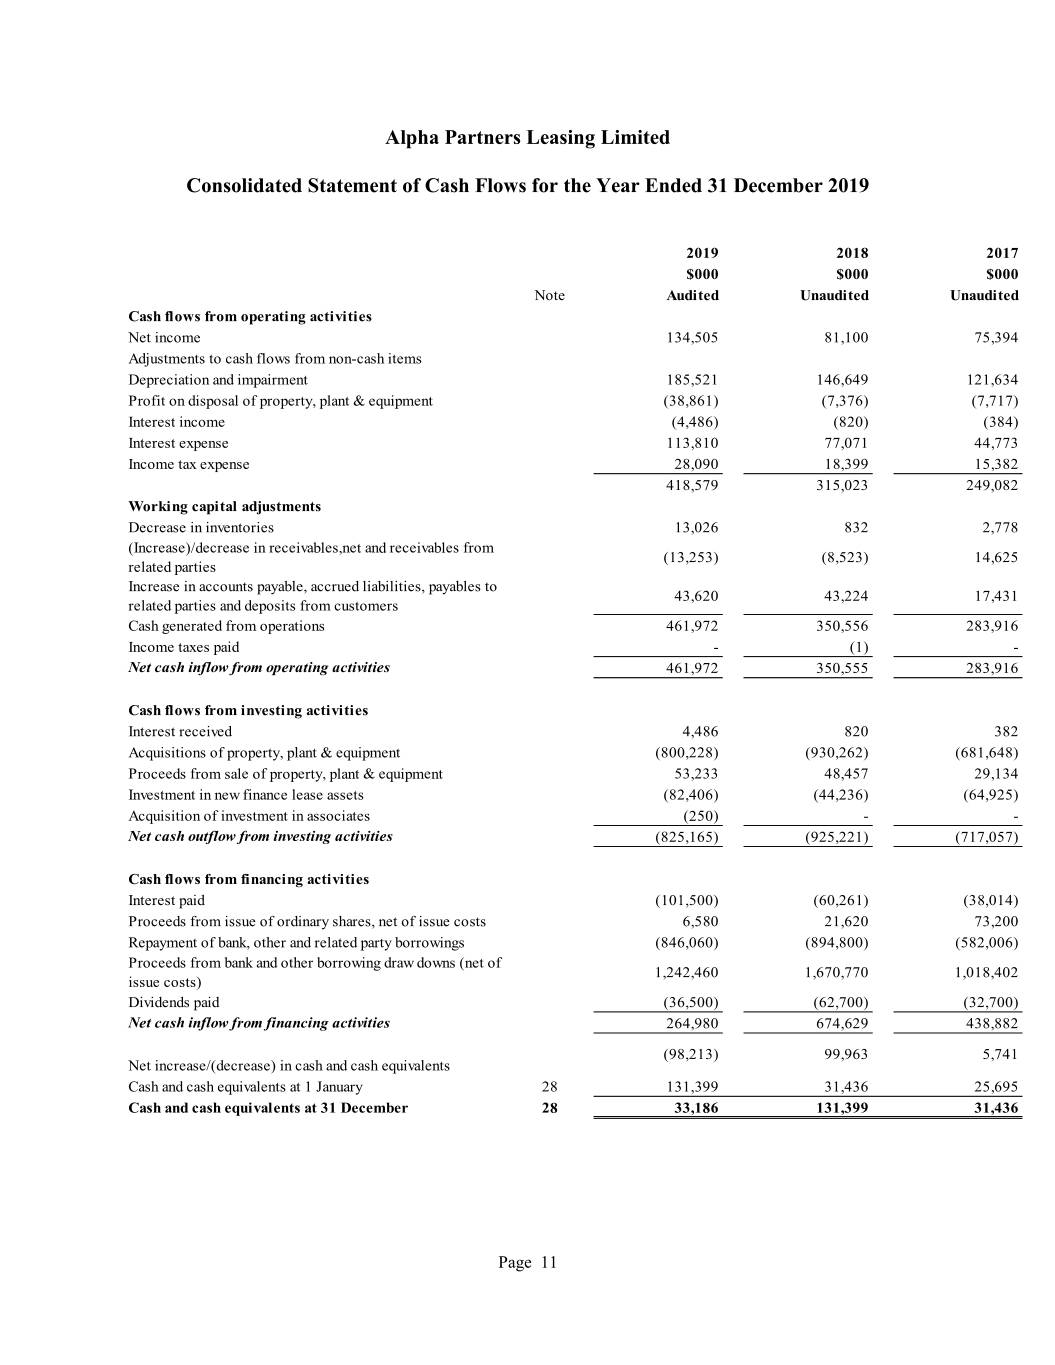
Alpha Partners Leasing Limited Consolidated Statement of Cash Flows for the Year Ended 31 December 2019 2019 2018 2017 $000 $000 $000 Note Audi ted Unaudited Unaudited Cash flows from operating activities Net income 134,505 81,100 75,394 Adjustments to cash flows from non-cash items Depreciation and impairment 185,521 146,649 121,634 Profit on disposal of property, plant & equipment (38,861) (7,376) (7,717) Interest income (4,486) (820) (384) Interest expense 113,810 77,071 44,773 Income tax expense 28,090 18,399 15,382 418,579 315,023 249,082 Working capital adjustments Decrease in inventories 13,026 832 2,778 (Increase)/decrease in receivables,net and receivables from (13,253) (8,523) 14,625 related parties Increase in accounts payable, accrued liabilities, payables to 43,620 43,224 17,431 related parties and deposits from customers Cash generated from operations 461,972 350,556 283,916 Income taxes paid - (1) - Net cash inflow from operating activities 461,972 350,555 283,916 Cash flows from investing activities Interest received 4,486 820 382 Acquisitions of property, plant & equipment (800,228) (930,262) (681,648) Proceeds from sale of property, plant & equipment 53,233 48,457 29,134 Investment in new finance lease assets (82,406) (44,236) (64,925) Acquisition of investment in associates (250) - - Net cash outflow from investing activities (825,165) (925,221) (717,057) Cash flows from financing activities Interest paid (101,500) (60,261) (38,014) Proceeds from issue of ordinary shares, net of issue costs 6,580 21,620 73,200 Repayment of bank, other and related party borrowings (846,060) (894,800) (582,006) Proceeds from bank and other borrowing draw downs (net of 1,242,460 1,670,770 1,018,402 issue costs) Dividends paid (36,500) (62,700) (32,700) Net cash inflow from financing activities 264,980 674,629 438,882 (98,213) 99,963 5,741 Net increase/(decrease) in cash and cash equivalents Cash and cash equivalents at 1 January 28 131,399 31,436 25,695 Cash and cash equivalents at 31 December 28 33,186 131,399 31,436 Page 11

Alpha Partners Leasing Limited Notes to the Financial Statements for the Year Ended 31 December 2019 1 General information and business overview Alpha Partners Leasing Limited (“the Company”) is a private company limited by share capital incorporated in England and Wales under the Companies Act. The address of its registered office is: 1 Brewer's Green London SW1H 0RH England Principal activity The principal activity of the Company and its subsidiaries (together “the Group”) is leasing of commercial aero engines to customers, primarily airlines and Original Equipment Manufacturers (OEMs). The split of revenues by region is provided in note 6. Fair review of the business The Group opened the year with an engine operating lease portfolio of 274 engines, and closed with 303 engines. During the year the Group acquired 42 engines and disposed 10 engines and 3 engines were transferred to finance lease. The Group also had an engine finance lease portfolio of 28 engines (2018: 21 engines). The Group increased its revenue by 21% compared to the previous year. This was mainly due to growth in the Group’s lease engine portfolio, acquisition of new generation engines commanding higher rental rates and increase in parts trading revenues. Both the level of business and the year-end financial position were satisfactory. The Group's key financial and other performance indicators during the year were as follows: Unit 2019 2018 2017 Number of engines in operating lease 303 274 250 portfolio Number of engines in finance lease portfolio 28 21 16 Net Book Value of assets held for use in $000 4,099,841 3,530,914 2,859,850 operating leases at year end Revenue $000 410,651 339,329 254,561 Profit on disposal of fixed assets $000 38,861 7,376 7,717 Profit before taxation $000 162,558 99,499 90,776 Use of estimates The preparation of financial statements in conformity with Financial Reporting Standard 102 'The Financial Reporting Standard applicable in the UK and Republic of Ireland' as issued in August 2014 (“FRS102”) requires management to make estimates and assumptions that affect the reported amounts of assets and liabilities and disclosure of contingent assets and liabilities at the date of the financial statements and the reported amounts of revenues and expenses during the reporting period. Actual results could differ from those estimates. Page 12
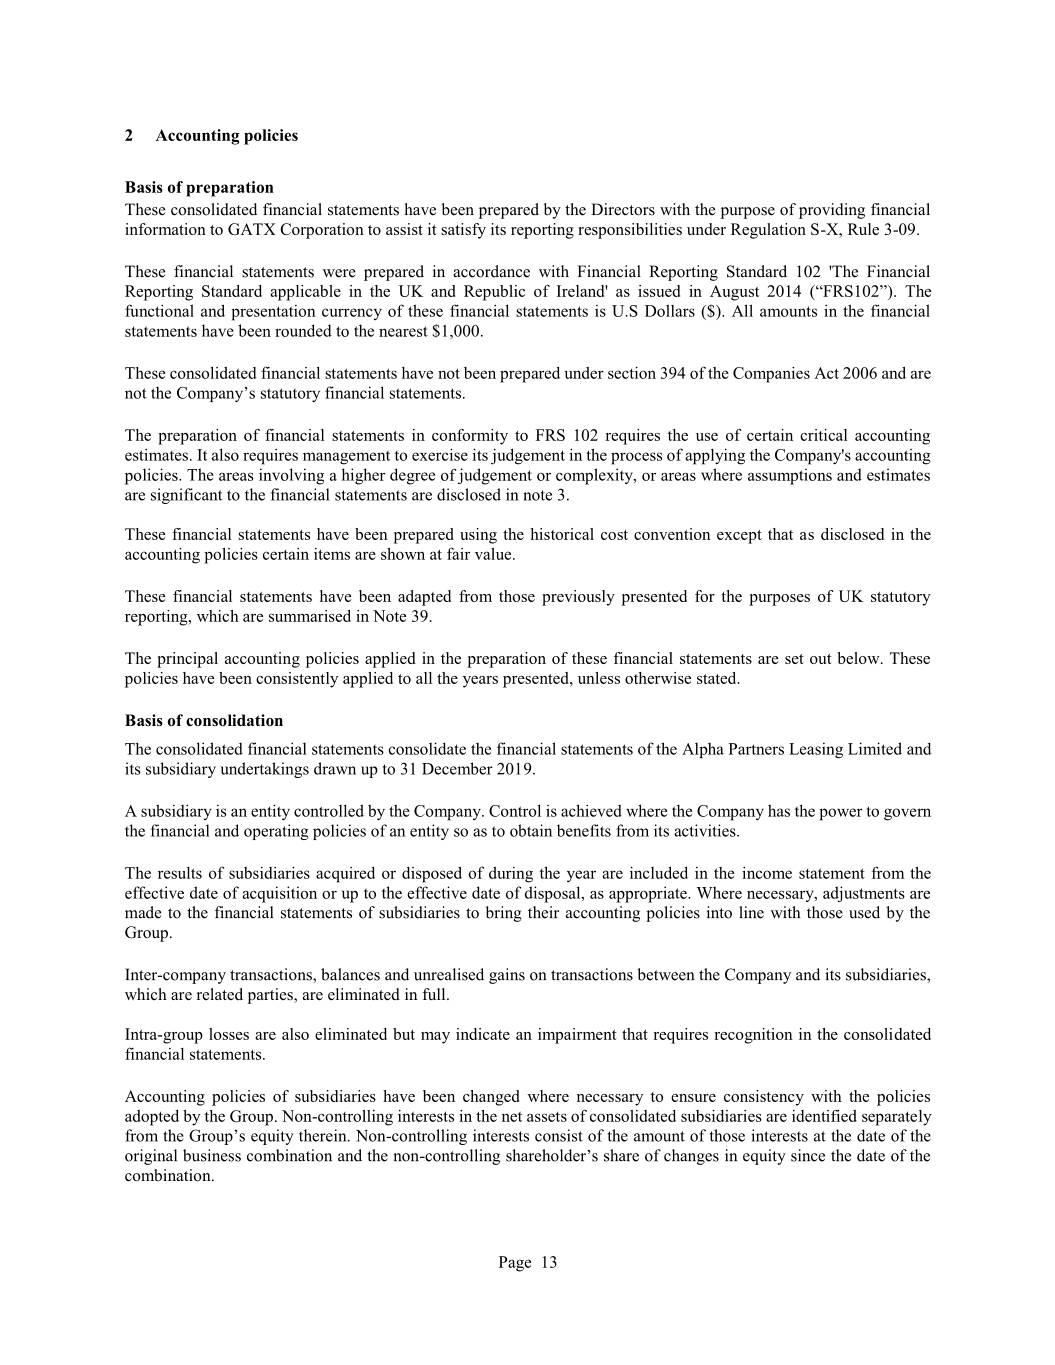
2 Accounting policies Basis of preparation These consolidated financial statements have been prepared by the Directors with the purpose of providing financial information to GATX Corporation to assist it satisfy its reporting responsibilities under Regulation S-X, Rule 3-09. These financial statements were prepared in accordance with Financial Reporting Standard 102 'The Financial Reporting Standard applicable in the UK and Republic of Ireland' as issued in August 2014 (“FRS102”). The functional and presentation currency of these financial statements is U.S Dollars ($). All amounts in the financial statements have been rounded to the nearest $1,000. These consolidated financial statements have not been prepared under section 394 of the Companies Act 2006 and are not the Company’s statutory financial statements. The preparation of financial statements in conformity to FRS 102 requires the use of certain critical accounting estimates. It also requires management to exercise its judgement in the process of applying the Company's accounting policies. The areas involving a higher degree of judgement or complexity, or areas where assumptions and estimates are significant to the financial statements are disclosed in note 3. These financial statements have been prepared using the historical cost convention except that as disclosed in the accounting policies certain items are shown at fair value. These financial statements have been adapted from those previously presented for the purposes of UK statutory reporting, which are summarised in Note 39. The principal accounting policies applied in the preparation of these financial statements are set out below. These policies have been consistently applied to all the years presented, unless otherwise stated. Basis of consolidation The consolidated financial statements consolidate the financial statements of the Alpha Partners Leasing Limited and its subsidiary undertakings drawn up to 31 December 2019. A subsidiary is an entity controlled by the Company. Control is achieved where the Company has the power to govern the financial and operating policies of an entity so as to obtain benefits from its activities. The results of subsidiaries acquired or disposed of during the year are included in the income statement from the effective date of acquisition or up to the effective date of disposal, as appropriate. Where necessary, adjustments are made to the financial statements of subsidiaries to bring their accounting policies into line with those used by the Group. Inter-company transactions, balances and unrealised gains on transactions between the Company and its subsidiaries, which are related parties, are eliminated in full. Intra-group losses are also eliminated but may indicate an impairment that requires recognition in the consolidated financial statements. Accounting policies of subsidiaries have been changed where necessary to ensure consistency with the policies adopted by the Group. Non-controlling interests in the net assets of consolidated subsidiaries are identified separately from the Group’s equity therein. Non-controlling interests consist of the amount of those interests at the date of the original business combination and the non-controlling shareholder’s share of changes in equity since the date of the combination. Page 13
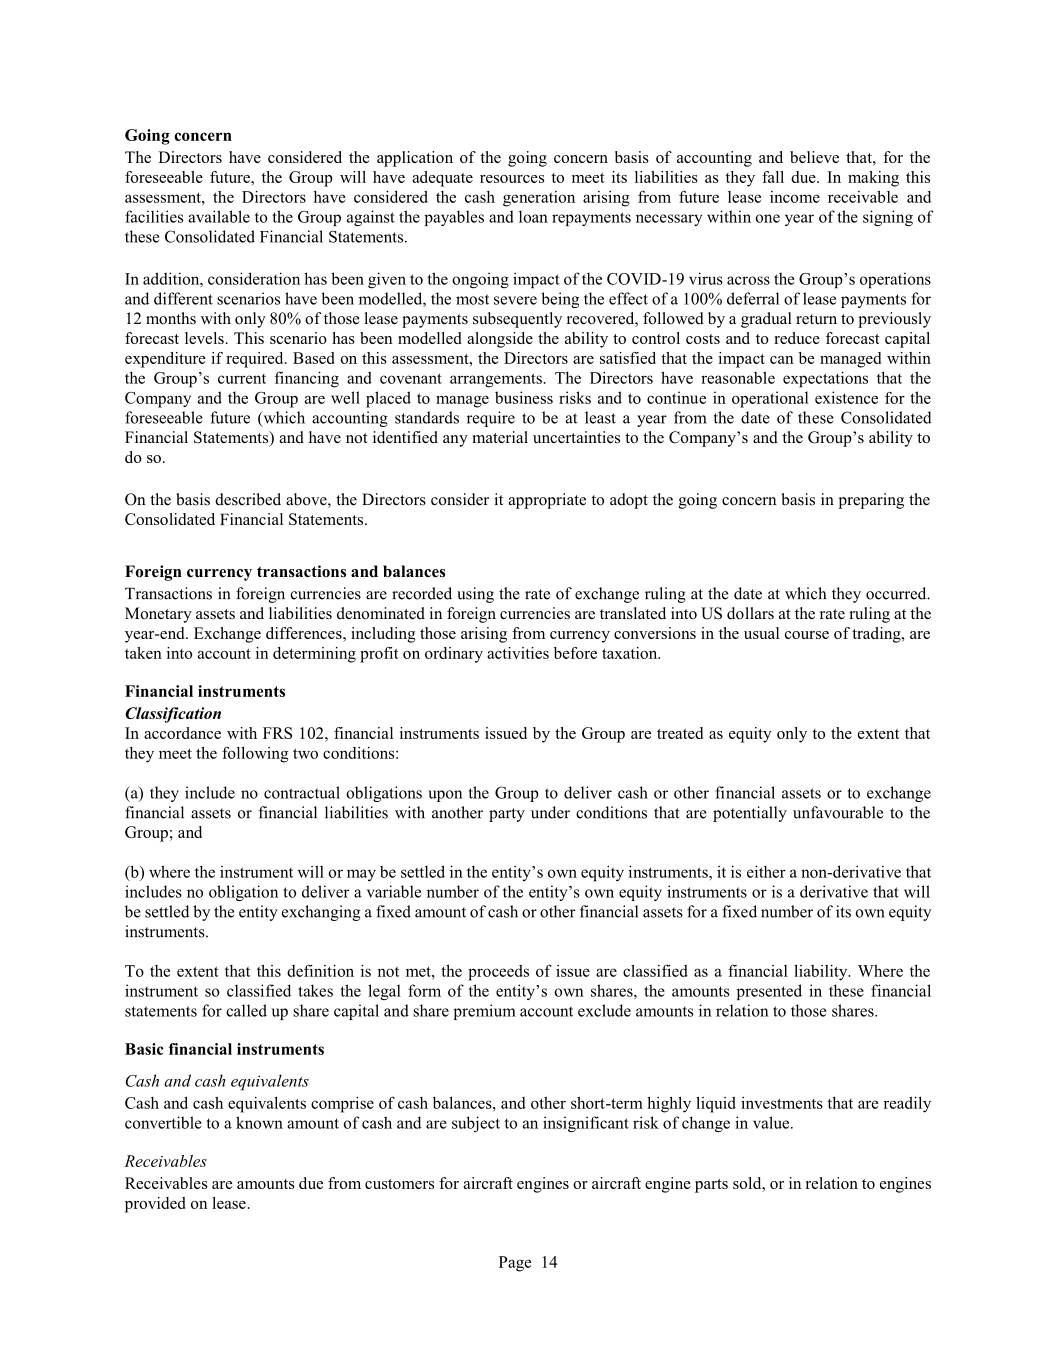
Going concern The Directors have considered the application of the going concern basis of accounting and believe that, for the foreseeable future, the Group will have adequate resources to meet its liabilities as they fall due. In making this assessment, the Directors have considered the cash generation arising from future lease income receivable and facilities available to the Group against the payables and loan repayments necessary within one year of the signing of these Consolidated Financial Statements. In addition, consideration has been given to the ongoing impact of the COVID-19 virus across the Group’s operations and different scenarios have been modelled, the most severe being the effect of a 100% deferral of lease payments for 12 months with only 80% of those lease payments subsequently recovered, followed by a gradual return to previously forecast levels. This scenario has been modelled alongside the ability to control costs and to reduce forecast capital expenditure if required. Based on this assessment, the Directors are satisfied that the impact can be managed within the Group’s current financing and covenant arrangements. The Directors have reasonable expectations that the Company and the Group are well placed to manage business risks and to continue in operational existence for the foreseeable future (which accounting standards require to be at least a year from the date of these Consolidated Financial Statements) and have not identified any material uncertainties to the Company’s and the Group’s ability to do so. On the basis described above, the Directors consider it appropriate to adopt the going concern basis in preparing the Consolidated Financial Statements. Foreign currency transactions and balances Transactions in foreign currencies are recorded using the rate of exchange ruling at the date at which they occurred. Monetary assets and liabilities denominated in foreign currencies are translated into US dollars at the rate ruling at the year-end. Exchange differences, including those arising from currency conversions in the usual course of trading, are taken into account in determining profit on ordinary activities before taxation. Financial instruments Classification In accordance with FRS 102, financial instruments issued by the Group are treated as equity only to the extent that they meet the following two conditions: (a) they include no contractual obligations upon the Group to deliver cash or other financial assets or to exchange financial assets or financial liabilities with another party under conditions that are potentially unfavourable to the Group; and (b) where the instrument will or may be settled in the entity’s own equity instruments, it is either a non-derivative that includes no obligation to deliver a variable number of the entity’s own equity instruments or is a derivative that will be settled by the entity exchanging a fixed amount of cash or other financial assets for a fixed number of its own equity instruments. To the extent that this definition is not met, the proceeds of issue are classified as a financial liability. Where the instrument so classified takes the legal form of the entity’s own shares, the amounts presented in these financial statements for called up share capital and share premium account exclude amounts in relation to those shares. Basic financial instruments Cash and cash equivalents Cash and cash equivalents comprise of cash balances, and other short-term highly liquid investments that are readily convertible to a known amount of cash and are subject to an insignificant risk of change in value. Receivables Receivables are amounts due from customers for aircraft engines or aircraft engine parts sold, or in relation to engines provided on lease. Page 14

Receivables are recognised initially at the transaction price. They are subsequently measured at amortised cost using the effective interest method, less provision for impairment. A provision for the impairment of receivables is established when there is objective evidence that the Group will not be able to collect all amounts due according to the original terms of the debts. Accounts payable Accounts payable are obligations to pay for goods or services that have been acquired in the ordinary course of business from suppliers. Accounts payable are classified as current liabilities the Group does not have an unconditional right, at the end of the reporting period, to defer settlement of the creditor for at least twelve months after the reporting date. If there is an unconditional right to defer settlement for at least twelve months after the reporting date, they are presented as non-current liabilities. Accounts payable are recognised initially at the transaction price and subsequently measured at amortised cost using the effective interest method. Borrowings Bank and other borrowings are initially recorded at fair value, net of transaction costs. Bank and other borrowings are subsequently carried at amortised cost, with the difference between the proceeds, net of transaction costs, and the amount due on redemption being recognised as a charge to the income statement over the period of the relevant borrowing. Interest expense is recognised on the basis of the effective interest method and is included in interest payable and similar expense. Borrowings are classified as payables due within one year unless the Group has an unconditional right to defer settlement of the liability for at least twelve months after the reporting date. Other financial instruments Derivatives Derivative financial instruments are recognised at fair value. The gain or loss on remeasurement to fair value is recognised immediately in the income statement. However, where derivatives qualify for hedge accounting, recognition of any resultant gain or loss depends on the nature of the item being hedged (see below). Hedging Fair value hedges Where a derivative financial instrument is designated as a hedge of the variability in fair value of a recognised asset or liability or an unrecognised firm commitment, all changes in the fair value of the derivative are recognised immediately in the income statement. The carrying value of the hedged item is adjusted by the change in fair value that is attributable to the risk being hedged (even if it is normally carried at cost or amortised cost) and any gains or losses on remeasurement are recognised immediately in the income statement (even if those gains would normally be recognised directly in reserves). If hedge accounting is discontinued and the hedged financial asset or liability has not been derecognised, any adjustments to the carrying amount of the hedged item are amortised into the income statement using the effective interest method over the remaining life of the hedged item. Cash flow hedges Where a derivative financial instrument is designated as a hedge of the variability in cash flows of a recognised asset or liability, or a highly probable forecast transaction, the effective part of any gain or loss on the derivative financial instrument is recognised directly in other comprehensive income. Any ineffective portion of the hedge is recognised immediately in the income statement. For cash flow hedges, where the forecast transactions resulted in the recognition of a non-financial asset or non-financial liability, the hedging gain or loss recognised in OCI is included in the initial cost or other carrying amount of the asset or liability. Alternatively, when the hedged item is recognised in the income statement the hedging gain or loss is reclassified to the income statement. When a hedging instrument expires or is sold, terminated or exercised, or the entity discontinues designation of the hedge relationship but the hedged forecast transaction is still expected to occur, the cumulative gain or loss at that point remains in equity and is recognised in Page 15
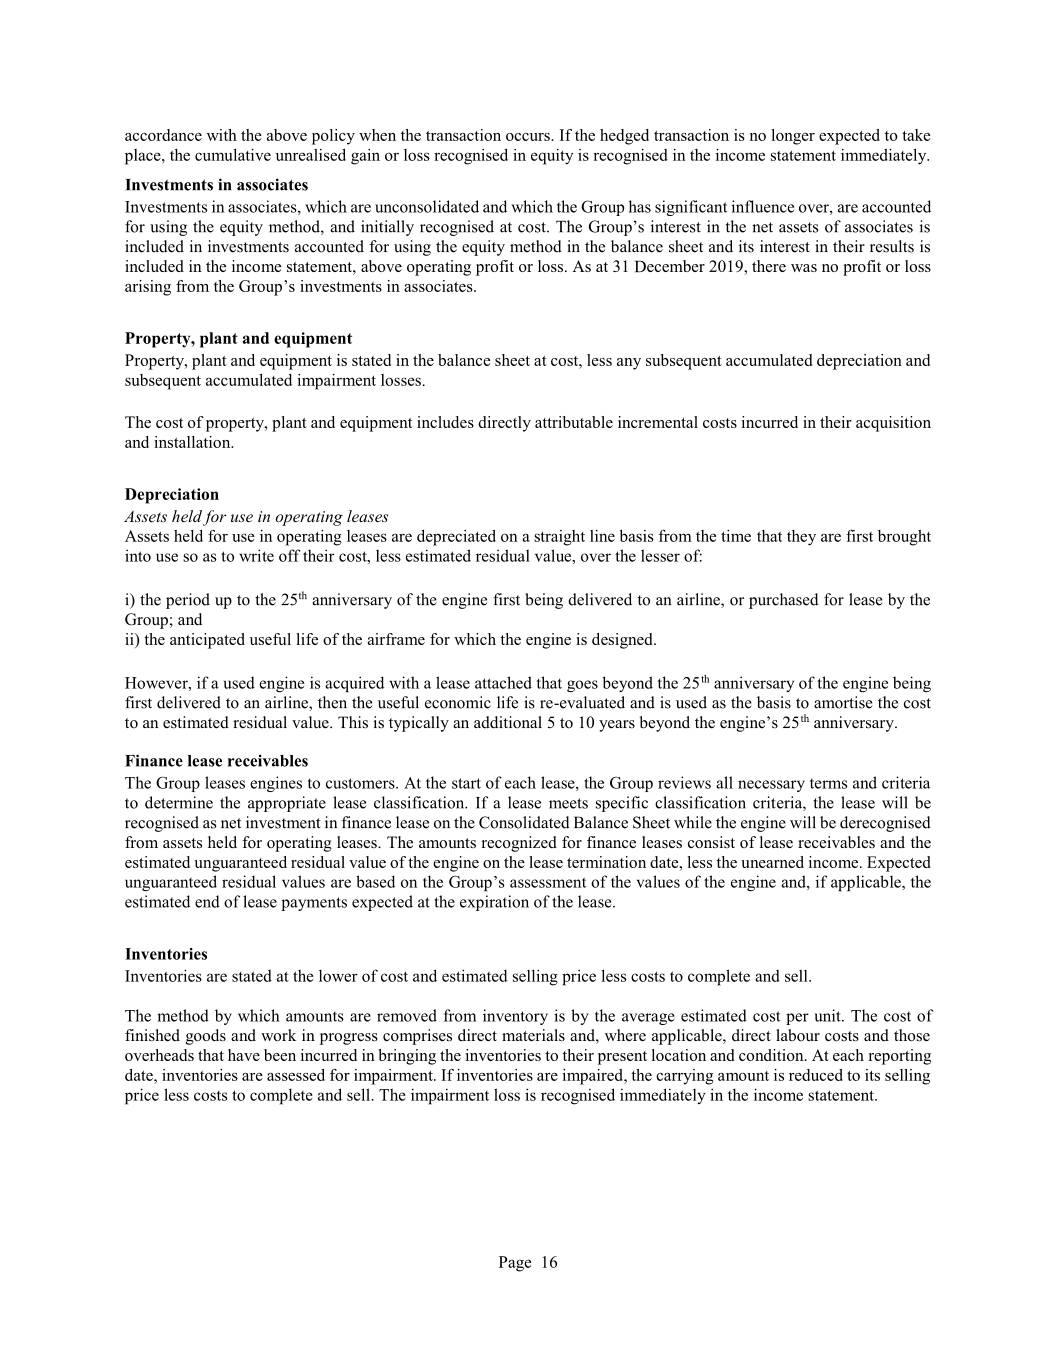
accordance with the above policy when the transaction occurs. If the hedged transaction is no longer expected to take place, the cumulative unrealised gain or loss recognised in equity is recognised in the income statement immediately. Investments in associates Investments in associates, which are unconsolidated and which the Group has significant influence over, are accounted for using the equity method, and initially recognised at cost. The Group’s interest in the net assets of associates is included in investments accounted for using the equity method in the balance sheet and its interest in their results is included in the income statement, above operating profit or loss. As at 31 December 2019, there was no profit or loss arising from the Group’s investments in associates. Property, plant and equipment Property, plant and equipment is stated in the balance sheet at cost, less any subsequent accumulated depreciation and subsequent accumulated impairment losses. The cost of property, plant and equipment includes directly attributable incremental costs incurred in their acquisition and installation. Depreciation Assets held for use in operating leases Assets held for use in operating leases are depreciated on a straight line basis from the time that they are first brought into use so as to write off their cost, less estimated residual value, over the lesser of: i) the period up to the 25th anniversary of the engine first being delivered to an airline, or purchased for lease by the Group; and ii) the anticipated useful life of the airframe for which the engine is designed. However, if a used engine is acquired with a lease attached that goes beyond the 25th anniversary of the engine being first delivered to an airline, then the useful economic life is re-evaluated and is used as the basis to amortise the cost to an estimated residual value. This is typically an additional 5 to 10 years beyond the engine’s 25th anniversary. Finance lease receivables The Group leases engines to customers. At the start of each lease, the Group reviews all necessary terms and criteria to determine the appropriate lease classification. If a lease meets specific classification criteria, the lease will be recognised as net investment in finance lease on the Consolidated Balance Sheet while the engine will be derecognised from assets held for operating leases. The amounts recognized for finance leases consist of lease receivables and the estimated unguaranteed residual value of the engine on the lease termination date, less the unearned income. Expected unguaranteed residual values are based on the Group’s assessment of the values of the engine and, if applicable, the estimated end of lease payments expected at the expiration of the lease. Inventories Inventories are stated at the lower of cost and estimated selling price less costs to complete and sell. The method by which amounts are removed from inventory is by the average estimated cost per unit. The cost of finished goods and work in progress comprises direct materials and, where applicable, direct labour costs and those overheads that have been incurred in bringing the inventories to their present location and condition. At each reporting date, inventories are assessed for impairment. If inventories are impaired, the carrying amount is reduced to its selling price less costs to complete and sell. The impairment loss is recognised immediately in the income statement. Page 16

Impairment Financial assets (including receivables) A financial asset not carried at fair value through profit or loss is assessed at each reporting date to determine whether there is objective evidence that it is impaired. A financial asset is impaired if objective evidence indicates that a loss event has occurred after the initial recognition of the asset, and that the loss event had a negative effect on the estimated future cash flows of that asset that can be estimated reliably. An impairment loss in respect of a financial asset measured at amortised cost is calculated as the difference between its carrying amount and the present value of the estimated future cash flows discounted at the asset’s original effective interest rate. Interest on the impaired asset continues to be recognised through the unwinding of the discount. Impairment losses are recognised in profit or loss. When a subsequent event causes the amount of impairment loss to decrease, the decrease in impairment loss is reversed through the income statement. Non-financial assets The carrying amounts of the entity’s non-financial assets, other than inventories and deferred tax assets, are reviewed at each reporting date to determine whether there is any indication of impairment. If any such indication exists, then the asset’s recoverable amount is estimated. The recoverable amount of an asset or cash-generating unit is the greater of its value in use and its fair value less costs to sell. The Group considers the valuation appraisals carried out by industry experts for the fair value of its engine portfolio and other material assets. In assessing value in use, the estimated future cash flows are discounted to their present value using a pre-tax discount rate that reflects current market assessments of the time value of money and the risks specific to the asset. For the purpose of impairment testing, assets that cannot be tested individually are grouped together into the smallest group of assets that generates cash inflows from continuing use that are largely independent of the cash inflows of other assets or groups of assets, the “cash-generating unit” (CGUs). The Group considers each engine to be an individual CGU. There were no assets grouped as CGUs during the year. An impairment loss is recognised if the carrying amount of an asset or its CGU exceeds its estimated recoverable amount. Impairment losses are recognised in profit or loss. Impairment losses recognised in respect of CGUs are allocated first to reduce the carrying amount of any goodwill allocated to the units, and then to reduce the carrying amounts of the other assets in the unit (group of units) on a pro rata basis. Maintenance reserves Maintenance reserves represent amounts receivable from certain customers. The purpose of the monies received is to cover essential maintenance obligations of the lessee and the risk of an engine not being returned in redelivery conditions. Maintenance reserves are initially recognised as a payable to the customer and is generally returned to the customer when qualifying shop visit have been carried out on an engine. Depending on the contractual terms with a customer, any remaining maintenance reserve at the conclusion of the lease is retained by the Group as a reflection of the engine redelivery condition. Maintenance reserves are de-recognised when they no longer meet the definition of a liability, which is typically at the end of the lease. At this point the maintenance reserves are released to the income statement to offset any related adjustment to the carrying amount of the engine, with any remaining excess reserves recognised as other income in the income statement. In the event that the engine is disposed of at the end of the lease, any remaining maintenance reserve is recognised as part of the net profit on sale of property, plant and equipment in the income statement. Share capital Ordinary shares are classified as equity. Equity instruments are measured at the fair value of the cash or other resources received or receivable, net of the direct costs of issuing the equity instruments. If payment is deferred and the time value of money is material, the initial measurement is on a present value basis. Dividends Final dividends to the Company’s shareholders are recognised as a liability in the financial statements in the period in which the final dividends are approved by the shareholders. Interim dividends are recognised when paid to the Company’s shareholders. These amounts are recognised in the statement of changes in equity. Page 17
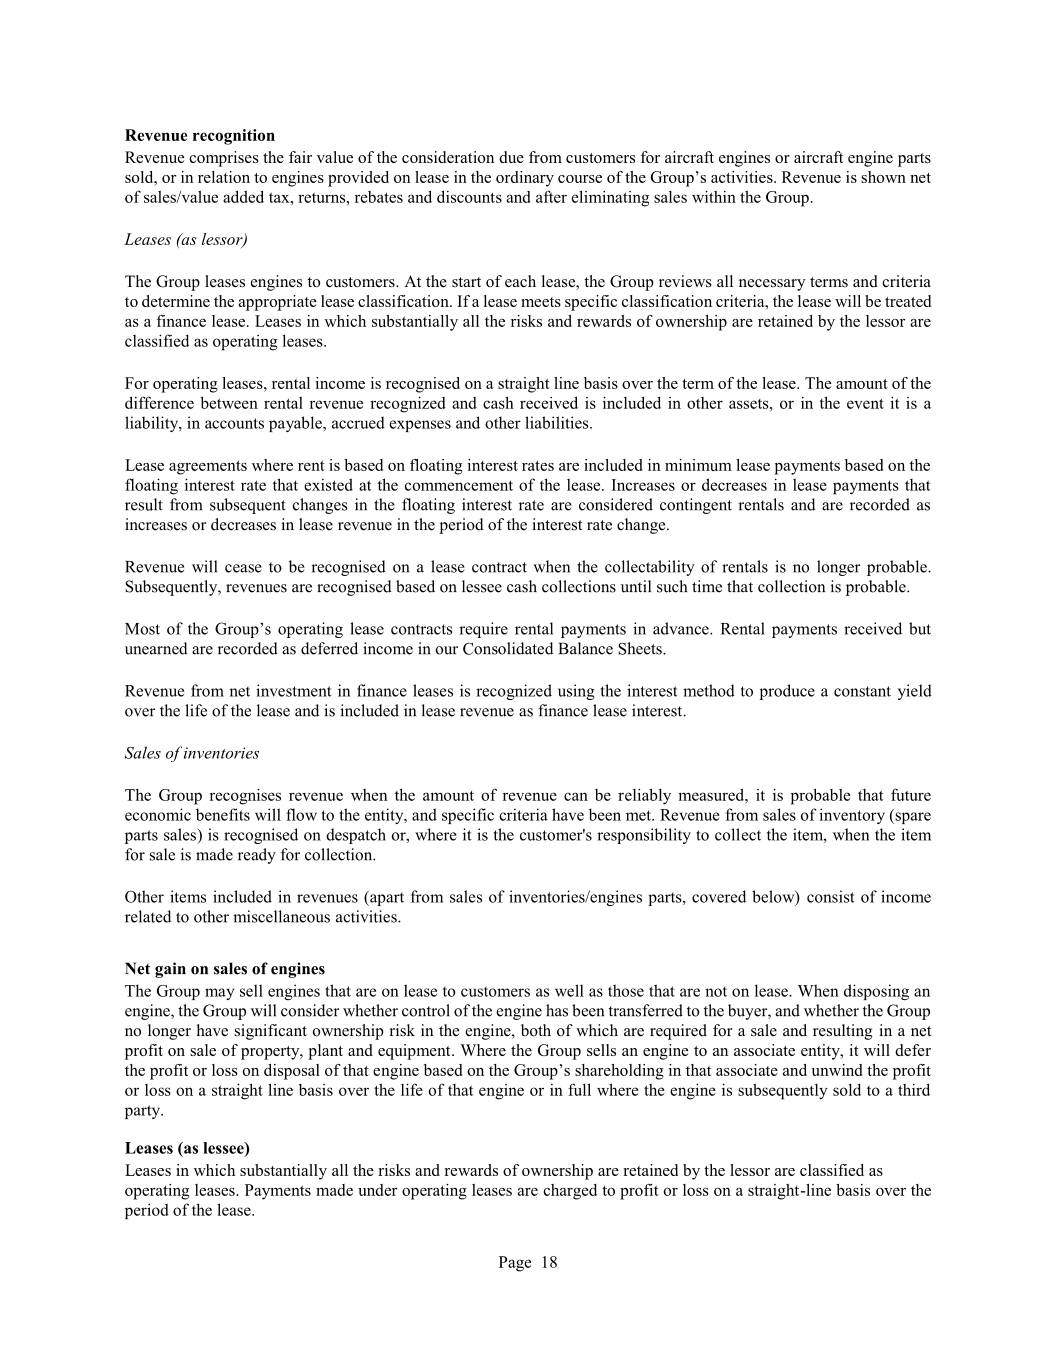
Revenue recognition Revenue comprises the fair value of the consideration due from customers for aircraft engines or aircraft engine parts sold, or in relation to engines provided on lease in the ordinary course of the Group’s activities. Revenue is shown net of sales/value added tax, returns, rebates and discounts and after eliminating sales within the Group. Leases (as lessor) The Group leases engines to customers. At the start of each lease, the Group reviews all necessary terms and criteria to determine the appropriate lease classification. If a lease meets specific classification criteria, the lease will be treated as a finance lease. Leases in which substantially all the risks and rewards of ownership are retained by the lessor are classified as operating leases. For operating leases, rental income is recognised on a straight line basis over the term of the lease. The amount of the difference between rental revenue recognized and cash received is included in other assets, or in the event it is a liability, in accounts payable, accrued expenses and other liabilities. Lease agreements where rent is based on floating interest rates are included in minimum lease payments based on the floating interest rate that existed at the commencement of the lease. Increases or decreases in lease payments that result from subsequent changes in the floating interest rate are considered contingent rentals and are recorded as increases or decreases in lease revenue in the period of the interest rate change. Revenue will cease to be recognised on a lease contract when the collectability of rentals is no longer probable. Subsequently, revenues are recognised based on lessee cash collections until such time that collection is probable. Most of the Group’s operating lease contracts require rental payments in advance. Rental payments received but unearned are recorded as deferred income in our Consolidated Balance Sheets. Revenue from net investment in finance leases is recognized using the interest method to produce a constant yield over the life of the lease and is included in lease revenue as finance lease interest. Sales of inventories The Group recognises revenue when the amount of revenue can be reliably measured, it is probable that future economic benefits will flow to the entity, and specific criteria have been met. Revenue from sales of inventory (spare parts sales) is recognised on despatch or, where it is the customer's responsibility to collect the item, when the item for sale is made ready for collection. Other items included in revenues (apart from sales of inventories/engines parts, covered below) consist of income related to other miscellaneous activities. Net gain on sales of engines The Group may sell engines that are on lease to customers as well as those that are not on lease. When disposing an engine, the Group will consider whether control of the engine has been transferred to the buyer, and whether the Group no longer have significant ownership risk in the engine, both of which are required for a sale and resulting in a net profit on sale of property, plant and equipment. Where the Group sells an engine to an associate entity, it will defer the profit or loss on disposal of that engine based on the Group’s shareholding in that associate and unwind the profit or loss on a straight line basis over the life of that engine or in full where the engine is subsequently sold to a third party. Leases (as lessee) Leases in which substantially all the risks and rewards of ownership are retained by the lessor are classified as operating leases. Payments made under operating leases are charged to profit or loss on a straight-line basis over the period of the lease. Page 18

Interest income and expense policy Interest expense comprise interest payable and amortisation of financing costs. Interest income comprise interest receivable from the bank. Tax The tax expense for the period comprises current and deferred tax. Tax is recognised in the income statement, except that a change attributable to an item of income or expense recognised as other comprehensive income is also recognised directly in other comprehensive income. Current Tax The current income tax charge is calculated on the basis of tax rates and laws that have been enacted or substantively enacted by the reporting date in the countries where the Group operates and generates taxable income. Deferred Tax Deferred tax is provided in full on timing differences that arise from differences between taxable profits and total comprehensive income, resulting in an obligation at the balance sheet date to pay more tax, or a right to pay less tax, at a future date, at rates expected to apply when they crystallise based on tax rates and law that have been enacted or substantively enacted by the reporting date. Deferred tax assets are recognised for future deductions and utilisations of tax carry-forwards to the extent that it is more likely than not that suitable taxable profit is expected to be available. 3 Recent accounting standards adopted during the year ended 31 December 2019 The Group adopted the accounting standards changes resulting from the Financial Reporting Council triennial review. The only material changes caused by this adoption were the inclusion of the net debt reconciliation in Note 28 and the inclusion of net profit on sale of property, plant and equipment in operating profit. 4 Future application of accounting standards Interest Benchmark Reform Interest rate benchmarks such as the London Interbank Offered Rate (LIBOR) are being reformed, and it is anticipated that LIBOR will not be available after 2021. There is increasing uncertainty about the long-term viability of some interest rate benchmarks and this gives rise to issues affecting financial reporting in the period before the reform, particularly in relation to hedge accounting. These amendments to specific hedge accounting requirements in Section 12 provide relief that will avoid unnecessary discontinuation of hedge accounting, during the period of uncertainty. Entities will apply specific hedge accounting requirements assuming that the interest rate benchmark relevant to the hedge accounting is not altered as a result of interest rate benchmark reform. The amendments are effective for accounting periods beginning on or after 1 January 2020, with early application permitted. The Group is assessing the impact of this change. 5 Critical accounting estimates and judgements The Company makes estimates and judgements concerning the future. The resulting accounting estimates will, by definition, seldom equal the related actual results. The estimates and judgements that have a significant risk of causing a material adjustment to the carrying amounts of assets and liabilities within the next financial year are addressed below. Page 19
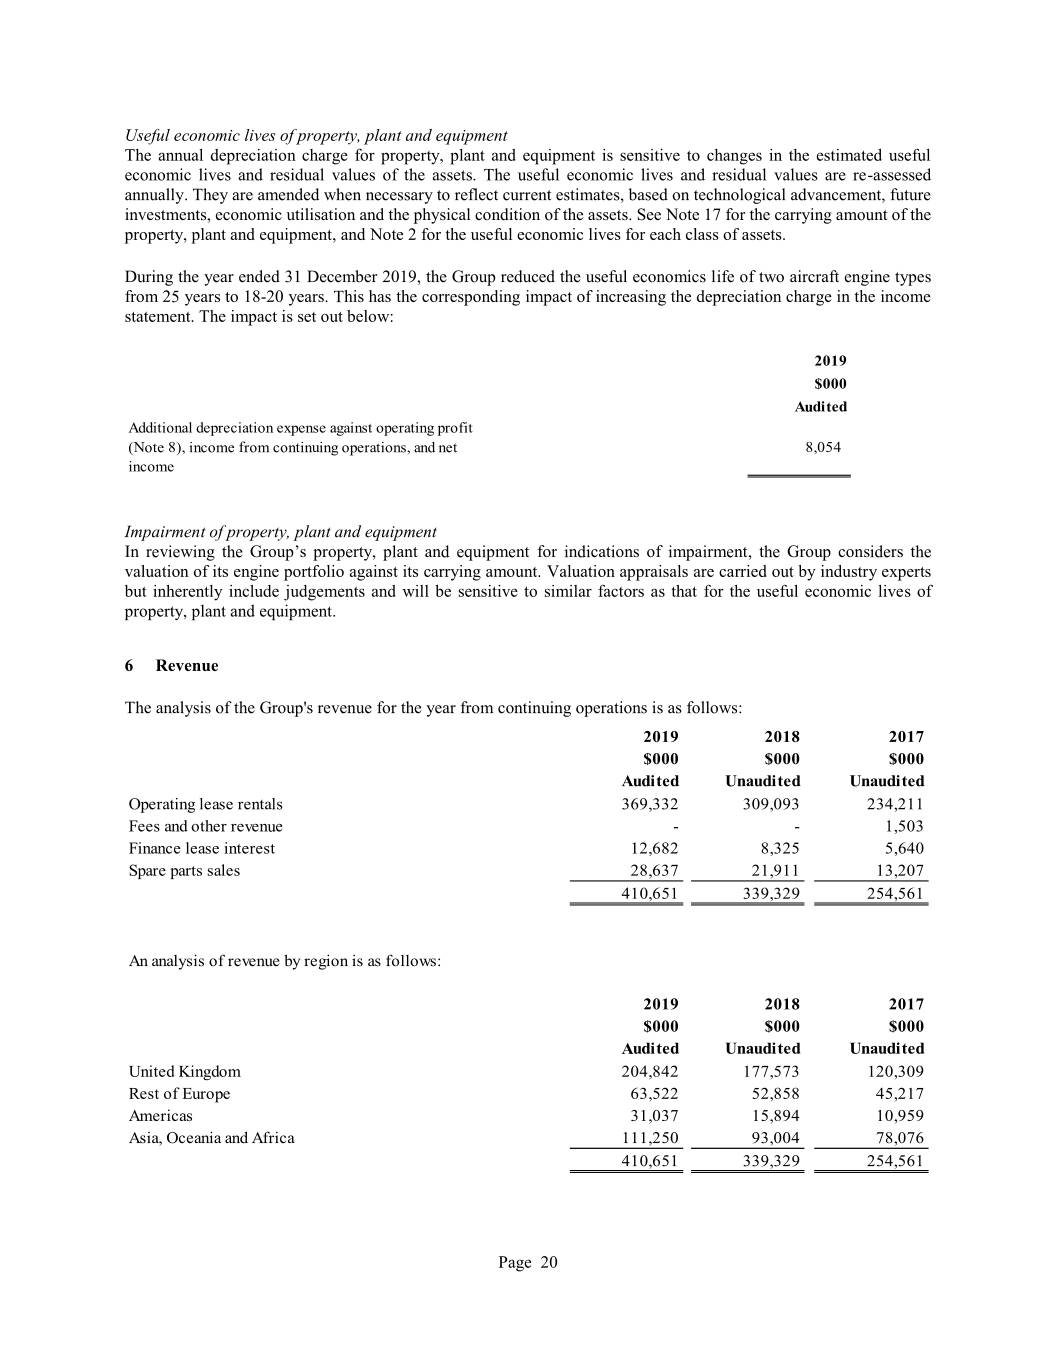
Useful economic lives of property, plant and equipment The annual depreciation charge for property, plant and equipment is sensitive to changes in the estimated useful economic lives and residual values of the assets. The useful economic lives and residual values are re-assessed annually. They are amended when necessary to reflect current estimates, based on technological advancement, future investments, economic utilisation and the physical condition of the assets. See Note 17 for the carrying amount of the property, plant and equipment, and Note 2 for the useful economic lives for each class of assets. During the year ended 31 December 2019, the Group reduced the useful economics life of two aircraft engine types from 25 years to 18-20 years. This has the corresponding impact of increasing the depreciation charge in the income statement. The impact is set out below: 2019 $000 Audi ted Additional depreciation expense against operating profit (Note 8), income from continuing operations, and net 8,054 income Impairment of property, plant and equipment In reviewing the Group’s property, plant and equipment for indications of impairment, the Group considers the valuation of its engine portfolio against its carrying amount. Valuation appraisals are carried out by industry experts but inherently include judgements and will be sensitive to similar factors as that for the useful economic lives of property, plant and equipment. 6 Revenue The analysis of the Group's revenue for the year from continuing operations is as follows: 2019 2018 2017 $000 $000 $000 Audi ted Unaudited Unaudited Operating lease rentals 369,332 309,093 234,211 Fees and other revenue - - 1,503 Finance lease interest 12,682 8,325 5,640 Spare parts sales 28,637 21,911 13,207 410,651 339,329 254,561 An analysis of revenue by region is as follows: 2019 2018 2017 $000 $000 $000 Audi ted Unaudited Unaudited United Kingdom 204,842 177,573 120,309 Rest of Europe 63,522 52,858 45,217 Americas 31,037 15,894 10,959 Asia, Oceania and Africa 111,250 93,004 78,076 410,651 339,329 254,561 Page 20

7 Other operating income The analysis of the Group's other operating income for the year is as follows: 2019 2018 2017 $000 $000 $000 Audi ted Unaudited Unaudited Other operating income 41,064 4,666 12,079 Other operating income relates to the release of amounts previously held as maintenance reserves for which customers no longer have rights to and for which the Group no longer has a liability. 8 Operating profit Arrived at after charging 2019 2018 2017 $000 $000 $000 Audi ted Unaudited Unaudited Depreciation expense 180,140 146,649 121,634 Foreign exchange (gains)/losses (157) 47 10 9 Asset impairments Asset impairments consisted of the following for the years ended 31 December 2017, 2018 and 2019: 2019 2018 2017 $000 $000 $000 Audi ted Unaudited Unaudited Engines held for operating leases (Note 17) 5,381 - - During the year ended 31 December 2019, the Group recognised impairments of $5.4 million against assets held for operating leases primarily as a result of engines returned that did not meet redelivery conditions from a customer that entered liquidation and for which maintenance reserves were not held. In addition, an adjustment to the carrying amount of property, plant and equipment of $19.9 million (2018: $3.5 million) has been recorded which has been offset by a release from the maintenance reserve resulting in a net nil impact in the income statement. Page 21
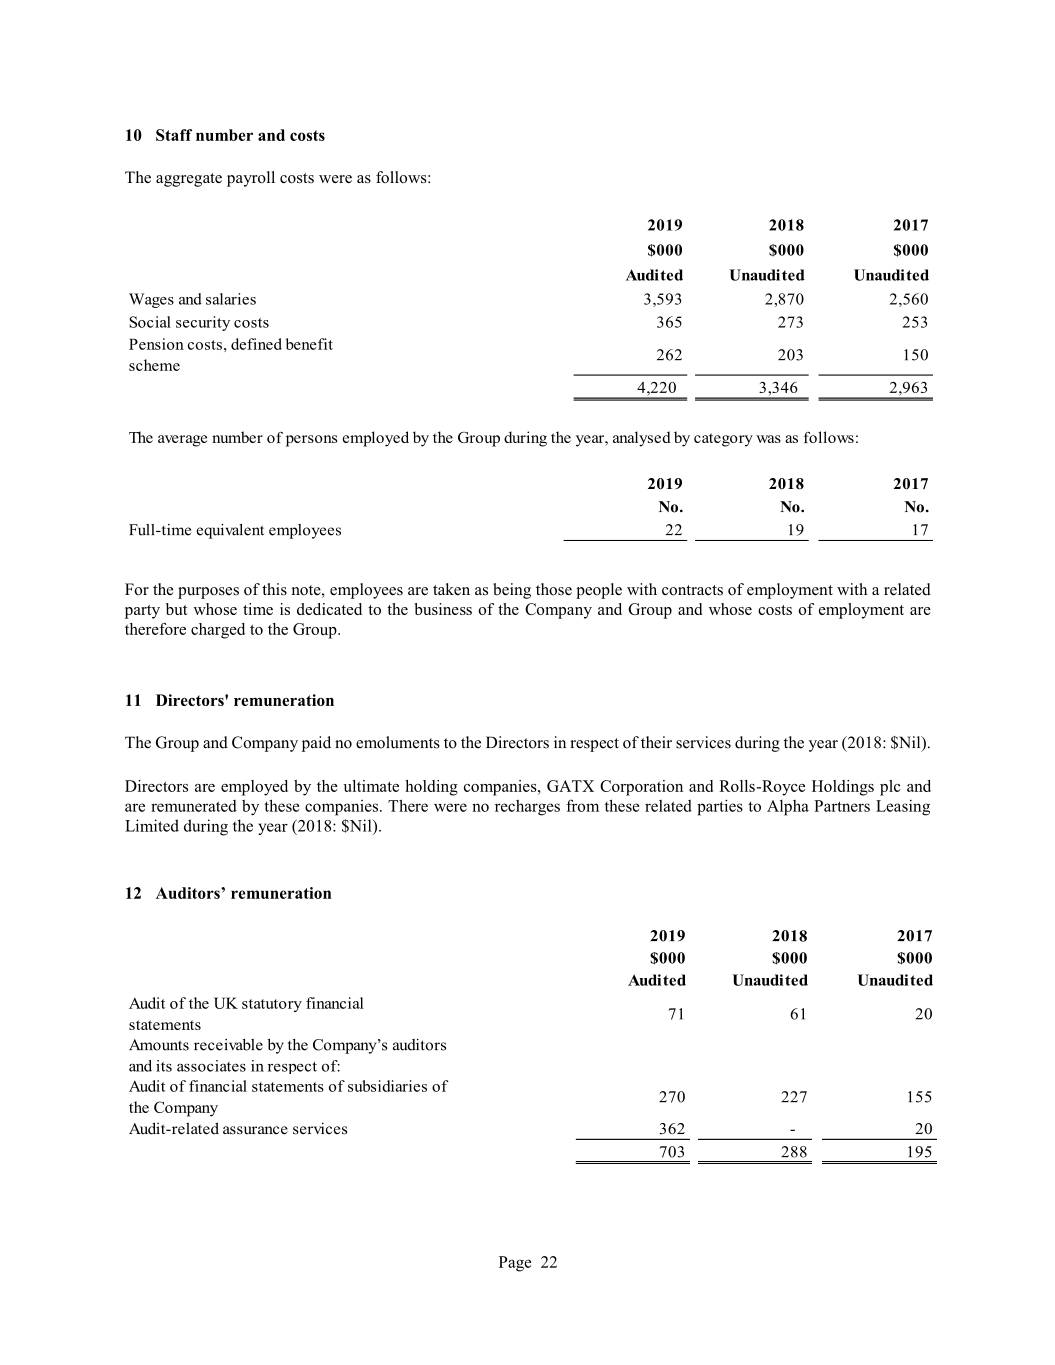
10 Staff number and costs The aggregate payroll costs were as follows: 2019 2018 2017 $000 $000 $000 Audi ted Unaudited Unaudited Wages and salaries 3,593 2,870 2,560 Social security costs 365 273 253 Pension costs, defined benefit 262 203 150 scheme 4,220 3,346 2,963 The average number of persons employed by the Group during the year, analysed by category was as follows: 2019 2018 2017 No. No. No. Full-time equivalent employees 22 19 17 For the purposes of this note, employees are taken as being those people with contracts of employment with a related party but whose time is dedicated to the business of the Company and Group and whose costs of employment are therefore charged to the Group. 11 Directors' remuneration The Group and Company paid no emoluments to the Directors in respect of their services during the year (2018: $Nil). Directors are employed by the ultimate holding companies, GATX Corporation and Rolls-Royce Holdings plc and are remunerated by these companies. There were no recharges from these related parties to Alpha Partners Leasing Limited during the year (2018: $Nil). 12 Auditors’ remuneration 2019 2018 2017 $000 $000 $000 Audi ted Unaudited Unaudited Audit of the UK statutory financial 71 61 20 statements Amounts receivable by the Company’s auditors and its associates in respect of: Audit of financial statements of subsidiaries of 270 227 155 the Company Audit-related assurance services 362 - 20 703 288 195 Page 22
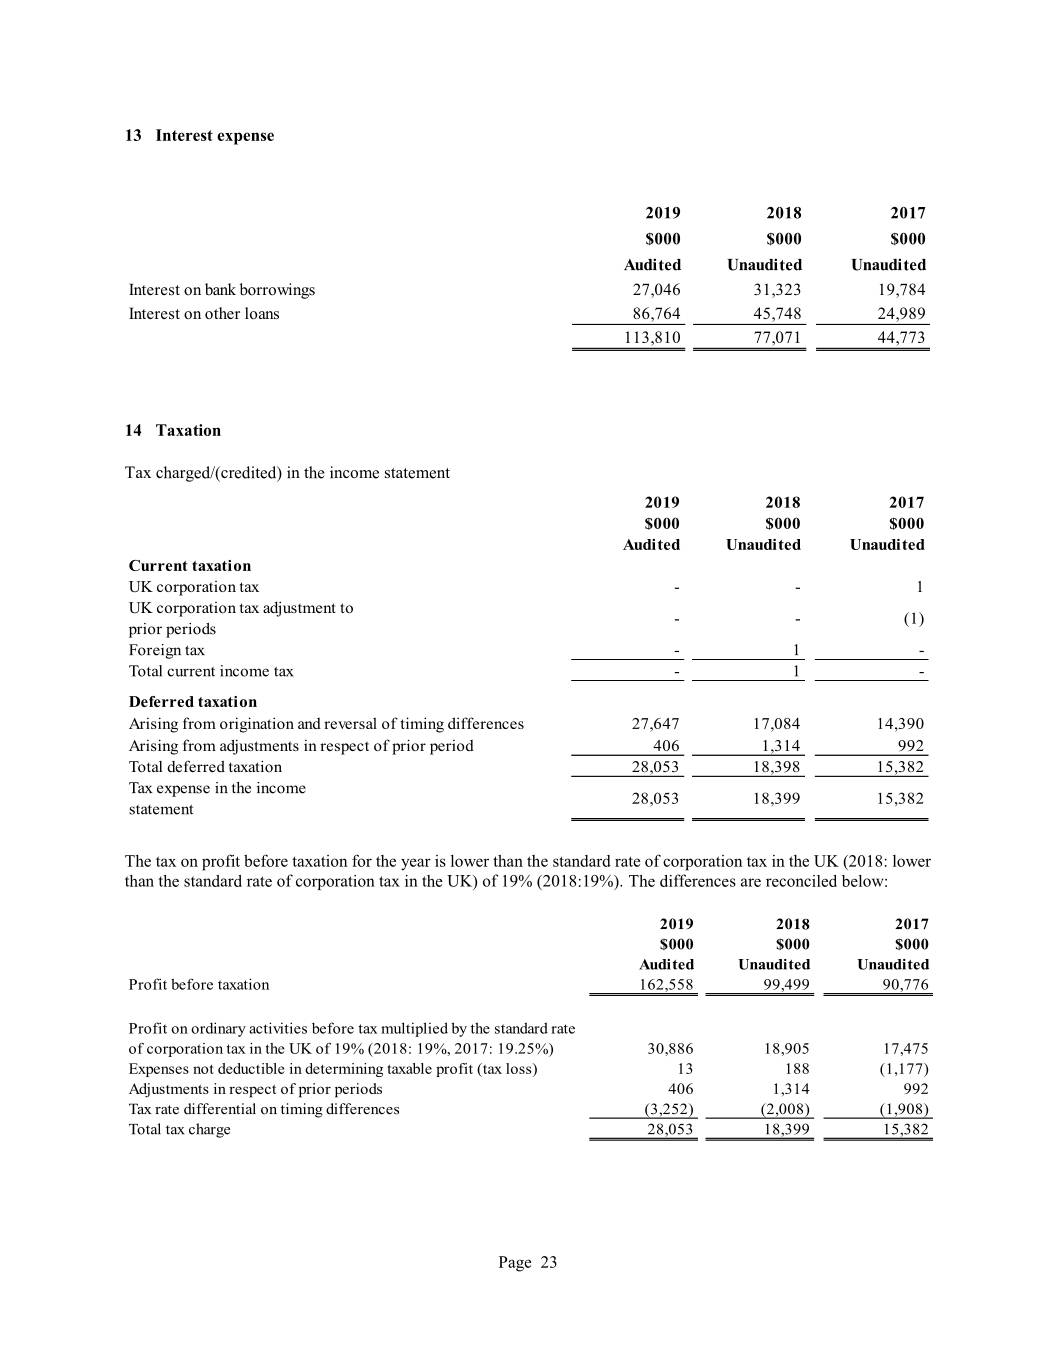
13 Interest expense 2019 2018 2017 $000 $000 $000 Audi ted Unaudited Unaudited Interest on bank borrowings 27,046 31,323 19,784 Interest on other loans 86,764 45,748 24,989 113,810 77,071 44,773 14 Taxation Tax charged/(credited) in the income statement 2019 2018 2017 $000 $000 $000 Audi ted Unaudited Unaudited Current taxation UK corporation tax - - 1 UK corporation tax adjustment to - - (1) prior periods Foreign tax - 1 - Total current income tax - 1 - Deferred taxation Arising from origination and reversal of timing differences 27,647 17,084 14,390 Arising from adjustments in respect of prior period 406 1,314 992 Total deferred taxation 28,053 18,398 15,382 Tax expense in the income 28,053 18,399 15,382 statement The tax on profit before taxation for the year is lower than the standard rate of corporation tax in the UK (2018: lower than the standard rate of corporation tax in the UK) of 19% (2018:19%). The differences are reconciled below: 2019 2018 2017 $000 $000 $000 Audi ted Unaudited Unaudited Profit before taxation 162,558 99,499 90,776 Profit on ordinary activities before tax multiplied by the standard rate of corporation tax in the UK of 19% (2018: 19%, 2017: 19.25%) 30,886 18,905 17,475 Expenses not deductible in determining taxable profit (tax loss) 13 188 (1,177) Adjustments in respect of prior periods 406 1,314 992 Tax rate differential on timing differences (3,252) (2,008) (1,908) Total tax charge 28,053 18,399 15,382 Page 23
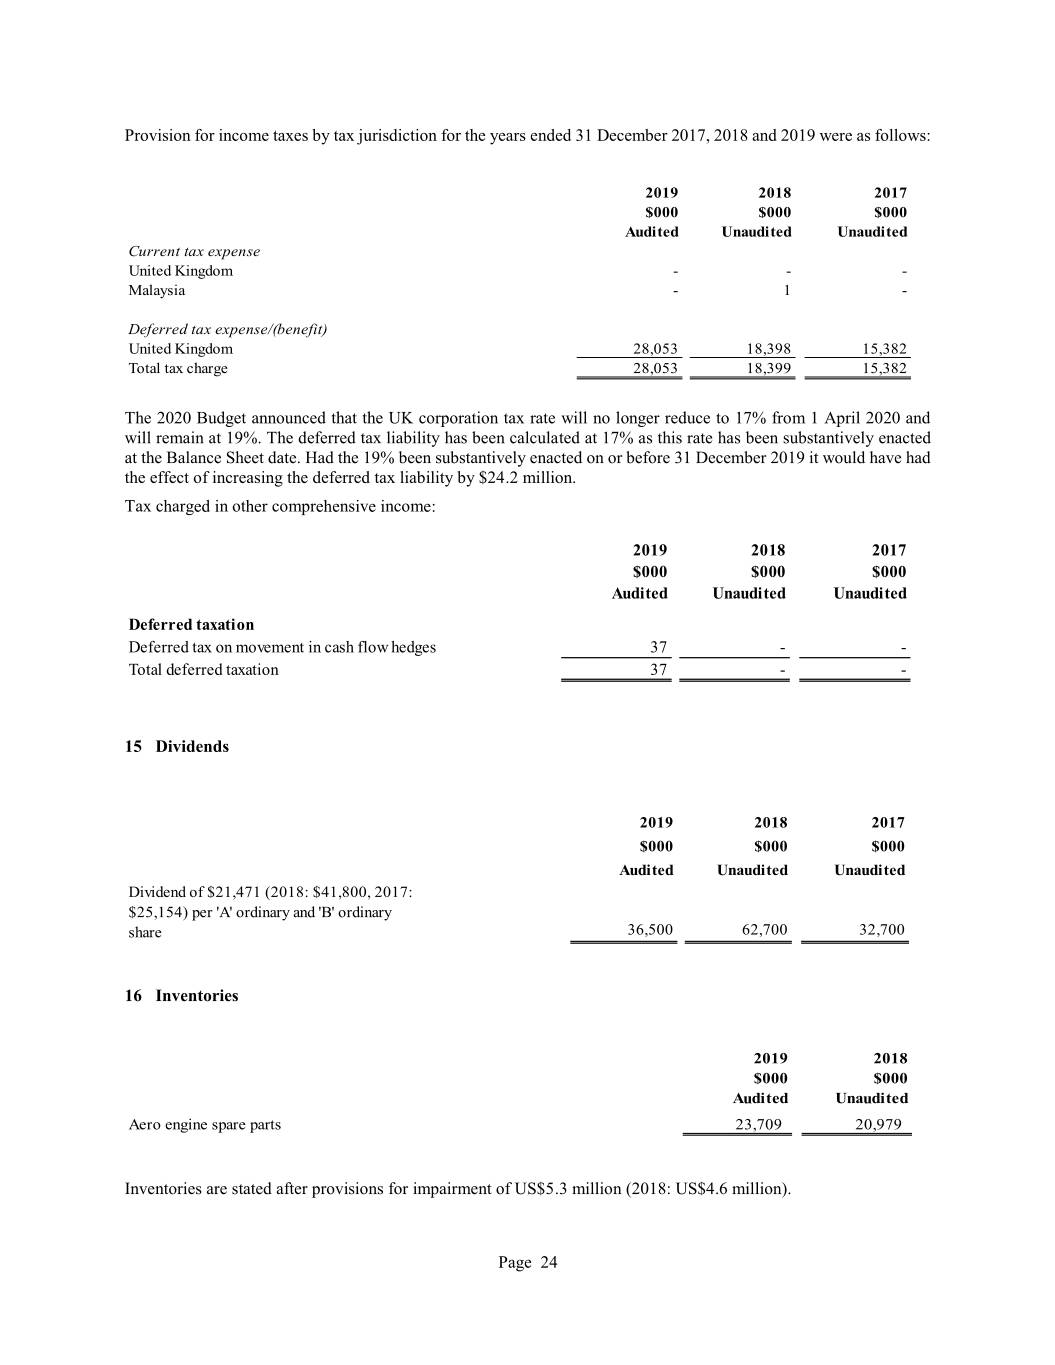
Provision for income taxes by tax jurisdiction for the years ended 31 December 2017, 2018 and 2019 were as follows: 2019 2018 2017 $000 $000 $000 Audi ted Unaudited Unaudited Current tax expense United Kingdom - - - Malaysia - 1 - Deferred tax expense/(benefit) United Kingdom 28,053 18,398 15,382 Total tax charge 28,053 18,399 15,382 The 2020 Budget announced that the UK corporation tax rate will no longer reduce to 17% from 1 April 2020 and will remain at 19%. The deferred tax liability has been calculated at 17% as this rate has been substantively enacted at the Balance Sheet date. Had the 19% been substantively enacted on or before 31 December 2019 it would have had the effect of increasing the deferred tax liability by $24.2 million. Tax charged in other comprehensive income: 2019 2018 2017 $000 $000 $000 Audi ted Unaudited Unaudited Deferred taxation Deferred tax on movement in cash flow hedges 37 - - Total deferred taxation 37 - - 15 Dividends 2019 2018 2017 $000 $000 $000 Audi ted Unaudited Unaudited Dividend of $21,471 (2018: $41,800, 2017: $25,154) per 'A' ordinary and 'B' ordinary share 36,500 62,700 32,700 16 Inventories 2019 2018 $000 $000 Audi ted Unaudited Aero engine spare parts 23,709 20,979 Inventories are stated after provisions for impairment of US$5.3 million (2018: US$4.6 million). Page 24
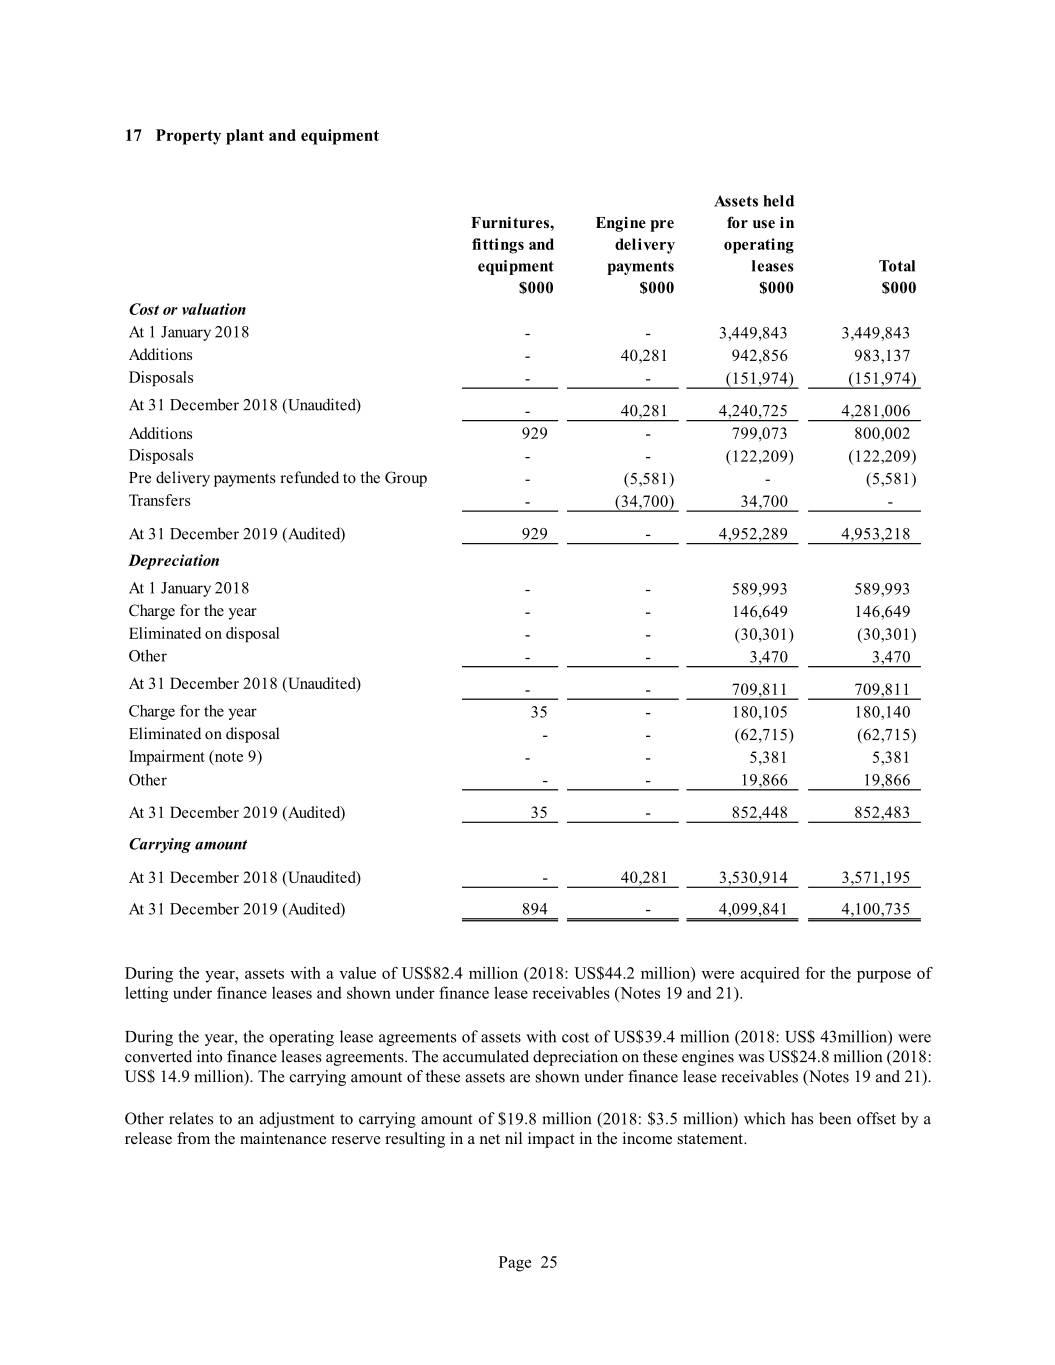
17 Property plant and equipment Assets hel d Furnitures, Engine pre for use in fittings and delivery operating equipment payments leases Total $000 $000 $000 $000 Cost or valuation At 1 January 2018 - - 3,449,843 3,449,843 Additions - 40,281 942,856 983,137 Disposals - - (151,974) (151,974) At 31 December 2018 (Unaudited) - 40,281 4,240,725 4,281,006 Additions 929 - 799,073 800,002 Disposals - - (122,209) (122,209) Pre delivery payments refunded to the Group - (5,581) - (5,581) Transfers - (34,700) 34,700 - At 31 December 2019 (Audited) 929 - 4,952,289 4,953,218 Depreciation At 1 January 2018 - - 589,993 589,993 Charge for the year - - 146,649 146,649 Eliminated on disposal - - (30,301) (30,301) Other - - 3,470 3,470 At 31 December 2018 (Unaudited) - - 709,811 709,811 Charge for the year 35 - 180,105 180,140 Eliminated on disposal - - (62,715) (62,715) Impairment (note 9) - - 5,381 5,381 Other - - 19,866 19,866 At 31 December 2019 (Audited) 35 - 852,448 852,483 Carrying amount At 31 December 2018 (Unaudited) - 40,281 3,530,914 3,571,195 At 31 December 2019 (Audited) 894 - 4,099,841 4,100,735 During the year, assets with a value of US$82.4 million (2018: US$44.2 million) were acquired for the purpose of letting under finance leases and shown under finance lease receivables (Notes 19 and 21). During the year, the operating lease agreements of assets with cost of US$39.4 million (2018: US$ 43million) were converted into finance leases agreements. The accumulated depreciation on these engines was US$24.8 million (2018: US$ 14.9 million). The carrying amount of these assets are shown under finance lease receivables (Notes 19 and 21). Other relates to an adjustment to carrying amount of $19.8 million (2018: $3.5 million) which has been offset by a release from the maintenance reserve resulting in a net nil impact in the income statement. Page 25
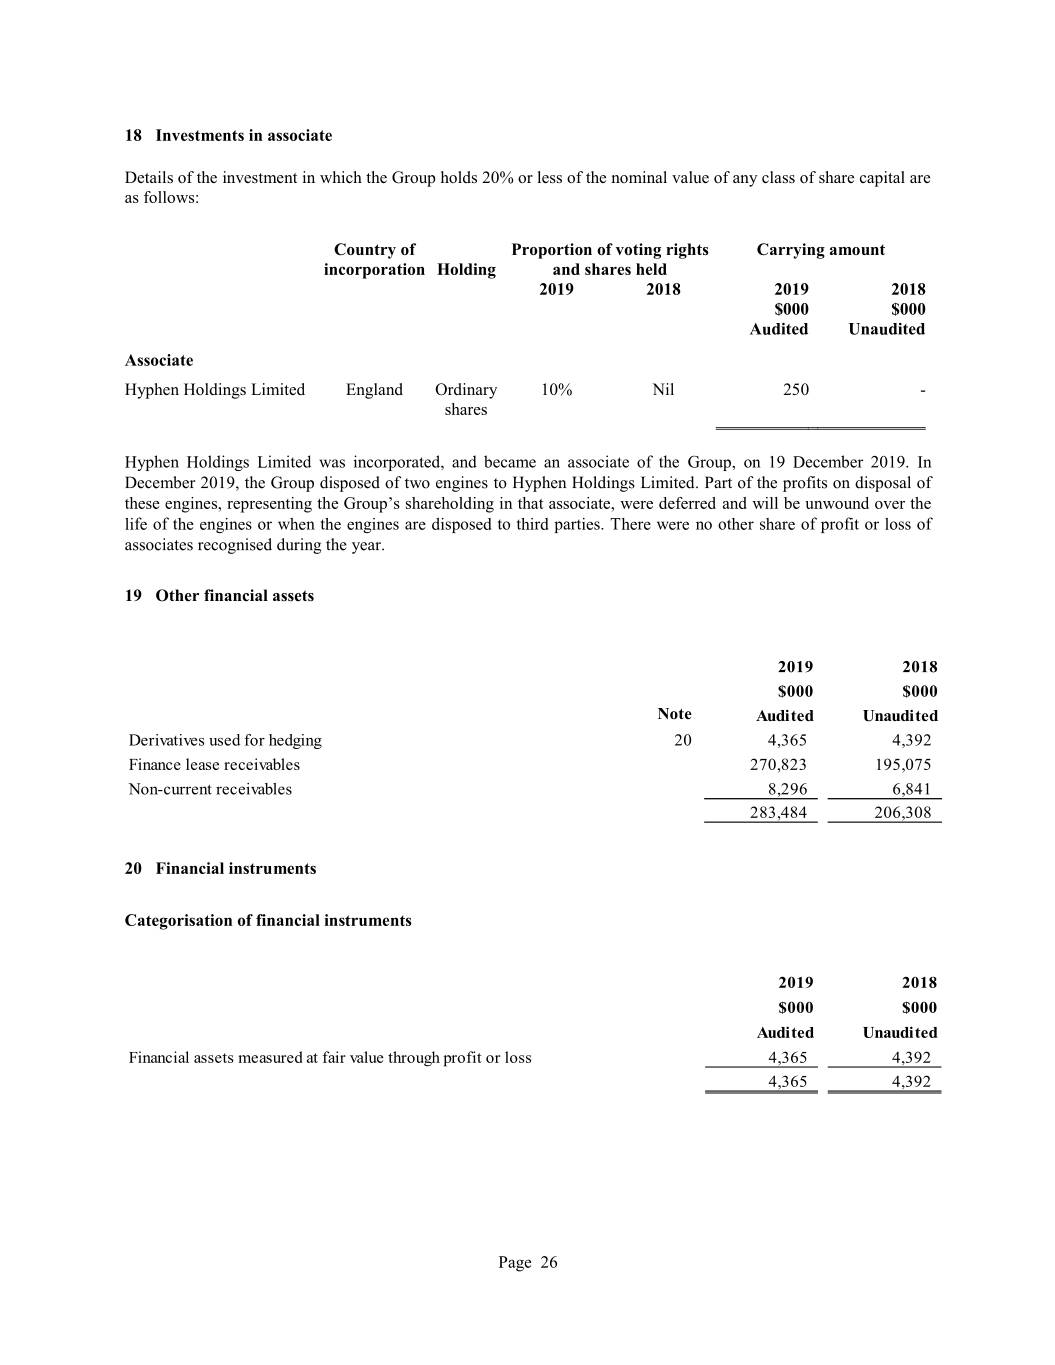
18 Investments in associate Details of the investment in which the Group holds 20% or less of the nominal value of any class of share capital are as follows: Country of Proportion of voting rights Carrying amount incorporation Holding and shares held 2019 2018 2019 2018 $000 $000 Audited Unaudited Associate Hyphen Holdings Limited England Ordinary 10% Nil 250 - shares Hyphen Holdings Limited was incorporated, and became an associate of the Group, on 19 December 2019. In December 2019, the Group disposed of two engines to Hyphen Holdings Limited. Part of the profits on disposal of these engines, representing the Group’s shareholding in that associate, were deferred and will be unwound over the life of the engines or when the engines are disposed to third parties. There were no other share of profit or loss of associates recognised during the year. 19 Other financial assets 2019 2018 $000 $000 Note Audi ted Unaudited Derivatives used for hedging 20 4,365 4,392 Finance lease receivables 270,823 195,075 Non-current receivables 8,296 6,841 283,484 206,308 20 Financial instruments Categorisation of financial instruments 2019 2018 $000 $000 Audi ted Unaudited Financial assets measured at fair value through profit or loss 4,365 4,392 4,365 4,392 Page 26

Financial assets measured at fair value Interest rate swap The fair value of interest rate swaps is estimated by discounting expected future contractual cash flows using prevailing interest rate curves. The fair value is $4.4 million (2018: $4.4 million) and the change in value included in the income statement is $3.2 million (2018: $(3.8 million)). Fair value hedges Interest rate swap US$100 million of fixed rate borrowing has been swapped to variable rate using interest rate swaps maturing in 2020. The swaps receive interest at a fixed rate of 3.31% and require payment of interest at a variable rate equal to 6-month USD LIBOR plus 1.0735%. This hedged borrowing was fully repaid in June 2018 resulting in the swap terminating. US$95 million of fixed rate borrowing has been swapped to variable rate using interest rate swaps maturing in 2023. The swaps receive interest at a fixed rate of 3.99% and require payment of interest at a variable rate equal to 6-month USD LIBOR plus 1.1625%. The fair value of the financial instruments designated as hedging instruments at 31 December 2019 is $3.9 million (2018: $0.8 million). The amount of the change in fair value of the hedging instrument recognised in the income statement for the period is $3.2 million (2018: $(3.8 million)). The amount of the change in fair value of the hedged item recognised in the income statement for the period is $(3.2 million) (2018: $3.8 million). Cash flow hedges Interest rate swap An amortising profile of floating interest rate borrowings, starting at US$399 million, has been swapped to fixed rate using interest rate swaps maturing in 2022. These swaps are designated instruments in the cash flow hedge and receive interest at a variable rate equal to 6-month USD LIBOR and require payment of interest at a fixed rate of 1.613125%. Cash flows relating to these cash flow hedging instruments are expected to occur bi-annually. The fair value of the financial instruments designated as hedging instruments at 31 December 2019 is $0.4 million (2018: $3.6 million). The amount of the change in fair value of the hedging instrument that was recognised in other comprehensive income during the period is $1.9 million (2018: $(1.9 million)). The amount reclassified from equity to the income statement for the period is $1.5 million (2018: $0.9 million). The amount of any excess of the fair value of the hedging instrument over the change in the fair value of the expected cash flows that was recognised in the income statement for the period is $Nil (2018: $Nil). Page 27
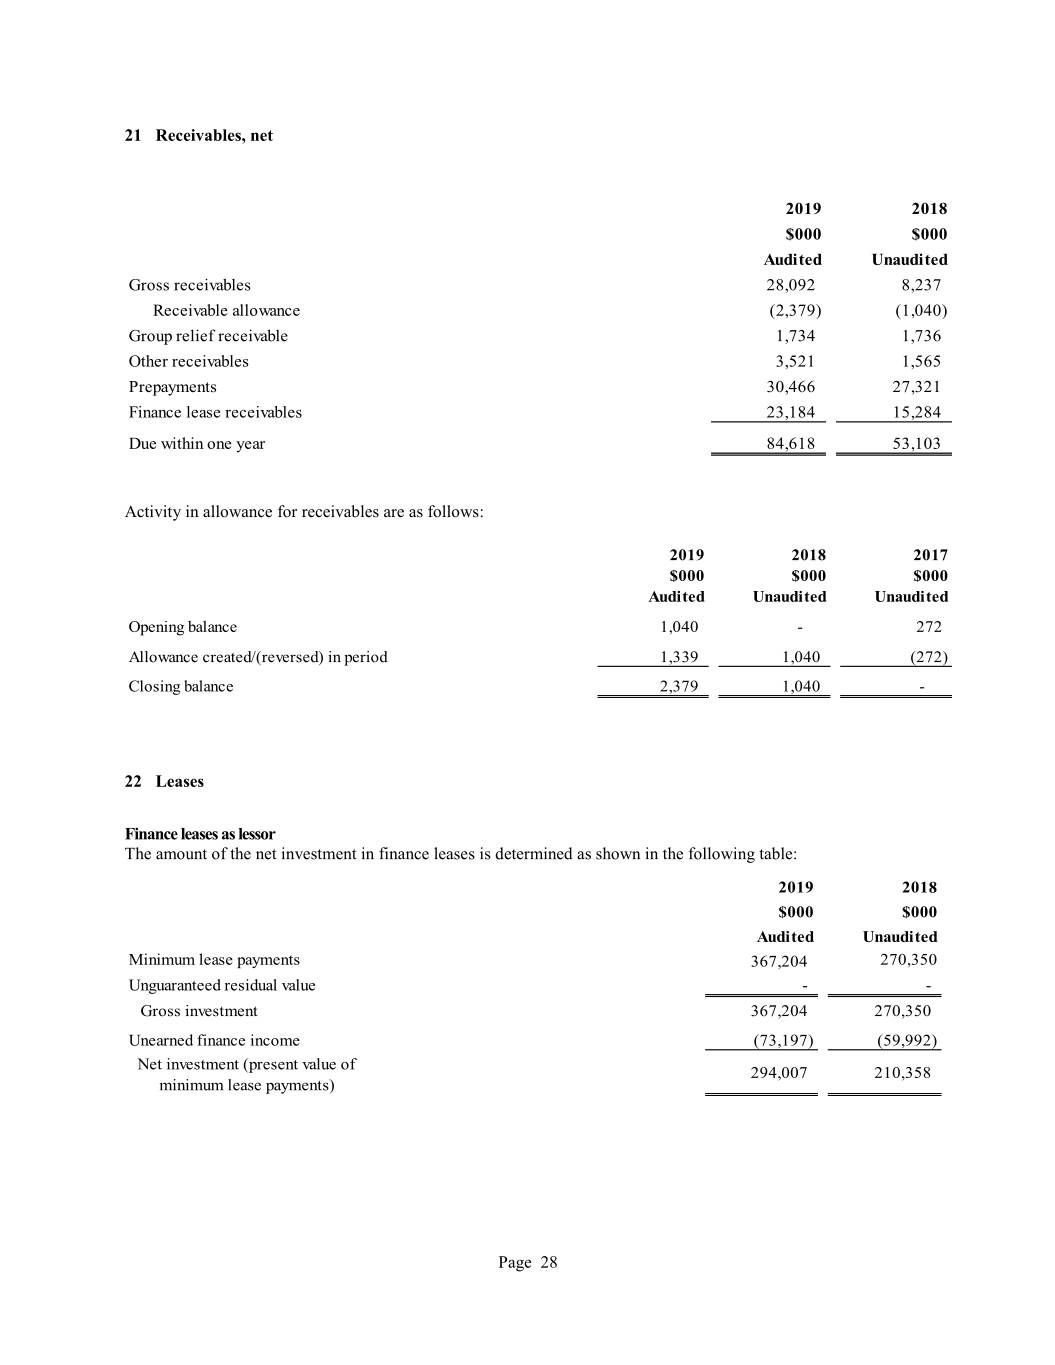
21 Receivables, net 2019 2018 $000 $000 Audi ted Unaudited Gross receivables 28,092 8,237 Receivable allowance (2,379) (1,040) Group relief receivable 1,734 1,736 Other receivables 3,521 1,565 Prepayments 30,466 27,321 Finance lease receivables 23,184 15,284 Due within one year 84,618 53,103 Activity in allowance for receivables are as follows: 2019 2018 2017 $000 $000 $000 Audi ted Unaudited Unaudited Opening balance 1,040 - 272 Allowance created/(reversed) in period 1,339 1,040 (272) Closing balance 2,379 1,040 - 22 Leases Finance leases as lessor The amount of the net investment in finance leases is determined as shown in the following table: 2019 2018 $000 $000 Audi ted Unaudited Minimum lease payments 367,204 270,350 Unguaranteed residual value - - Gross investment 367,204 270,350 Unearned finance income (73,197) (59,992) Net investment (present value of 294,007 210,358 minimum lease payments) Page 28

The gross investment amount and the present value of payable minimum lease payments are shown in the following table: Present value Present value Gross of minimum Gross of minimum investment in lease investment in lease the lease payments the lease payments 2019 2019 2018 2018 $000 $000 $000 $000 Maturity Audi ted Audi ted Unaudited Unaudited Not later than one year 37,171 23,034 26,170 15,283 Later than one year and not later than five years 160,980 118,805 124,655 91,424 Later than five years 169,053 152,168 119,525 103,651 367,204 294,007 270,350 210,358 There were no impairment charges relating to the Group’s finance leases recognised during the year ended 31 December 2019. There were also no contingent rents recognised as income in the period (2018: Nil, 2017: Nil). Operating leases as lessor The Groups operating lease agreements expire up to and over the next 15 years. The total of future minimum lease payments is as follows: 2019 2018 $000 $000 Maturity Audi ted Unaudited Not later than one year 362,331 356,306 Later than one year and not later than five years 1,230,769 1,217,179 Later than five years 827,665 957,476 2,420,765 2,530,961 There were also no contingent rents recognised as income in the period (2018: Nil, 2017: Nil). Operating leases as lessees The Group leases office space under operating lease arrangements. 2019 2018 $000 $000 Maturity Audi ted Unaudited Not later than one year 152 - Later than one year and not later than five years 2,196 - Later than five years 5,064 - 7,412 - Page 29

23 Current liabilities Note 2019 2018 $000 $000 $000 $000 Audi ted Audi ted Unaudited Unaudited Loans and borrowings 25 196,636 46,254 Borrowings from related parties 25 1,639 9,041 Account payables 4,688 2,013 Maintenance reserves 32,883 34,446 Other payables 1,674 2,207 Account payables and other current liabilities 39,245 38,666 Amounts owed to related parties 3,762 8,679 Accruals and deferred income 48,744 35,058 Current portion of deposits from customers 2,812 3,340 292,838 141,038 24 Non-current liabilities Note 2019 2019 2018 2018 $000 $000 $000 $000 Audi ted Audi ted Unaudited Unaudited Loans and borrowings, net of current portion 25 3,130,371 2,874,299 Borrowings from related parties 25 6,931 8,967 Maintenance reserves 102,452 84,238 Other payables 4,875 5,438 Other payables and non current liabilities 107,327 89,676 Deposit from customers, net of current portion 15,234 14,844 Provisions 206,097 178,007 3,465,960 3,165,793 Maintenance reserves included in current and non-current liabilities above comprise: 2019 2018 $000 $000 Audi ted Unaudited At the beginning of the year 118,684 99,702 Received during the year 98,883 36,170 Released during the year into other operating income and net (59,355) (11,460) profits on sale of property, plant & equipment Paid out during the year (3,011) (2,258) Released to income to offset adjustments to PPE (see note 17) (19,866) (3,470) At the end of the year 135,335 118,684 Page 30

25 Borrowings 2019 2018 $000 $000 Audi ted Unaudited Loans and borrowings due within one year Bank borrowings 12,474 12,353 Other borrowings 184,162 33,901 196,636 46,254 Borrowings from related parties 1,639 9,041 Total loans and borrowings due within one year 198,275 55,295 Loans and borrowings due after more than one year Bank borrowings 739,074 1,254,214 Other borrowings 2,391,297 1,620,085 3,130,371 2,874,299 Borrowings from related parties 6,931 8,967 Total loans and borrowings after more than one year 3,137,302 2,883,266 Total loans and borrowings 3,335,577 2,938,561 Future minimum principal payments on the facilities as at 31 December 2019 were as follows: Borrowings Total l oans Years Bank Other from related and borrowings borrowings parties borrowings $000 $000 $000 $000 2020 12,600 193,600 1,639 207,839 2021 124,050 43,600 1,600 169,250 2022 113,500 143,600 5,311 262,411 2023 - 343,600 - 343,600 2024 124,500 43,600 - 168,100 Thereafter 379,700 1,809,400 - 2,189,100 754,350 2,577,400 8,550 3,340,300 Net loan fees and interest rate swap (4,723) 3,335,577 Bank borrowings The above bank borrowings relate to a revolving credit facility and bank loans. Revolving credit facility Under the facility agreement the Group and its affiliates can make eligible drawings up to US$450 million. Borrowings are secured by the assets of the Group and its affiliates. Interest rate is payable at LIBOR + 0.50%. Page 31

The original termination date of the facility was 7 April 2019, however the Group and its affiliates had the option to extend to 7 April 2021. On 11 May, 2018, an Amendment Deed was agreed between the lenders, the Group and its affiliates allowing the termination date to be extended to 11 May 2023, with two 1 year extension options. In March 2019, the Group exercised an option to extend the termination date to 11 May 2024. As at 31 December 2019, the Group utilised US$124 million of this facility. The facility also includes an accordion option which makes additional funds available upon request. The total amount of funds available per the terms of the accordion option is US$150 million. As of 31 December 2019 the Group had not exercised this option. Bank loans The carrying amount of the Group's bank loans and facilities as at 31 December 2019 comprised of: - US$380 million of fixed interest loans maturing between April 2026 and October 2026 - US$247 million of variable interest loan notes (3-month USD LIBOR + margins between 0.70% and 0.75%), payable by instalments and maturing between October 2021 and October 2022. Other loans Other loans relate to private placements loan notes and related party loans. Loan notes issued by subsidiary companies totalled US$2,750 million, of which US$173 million was repaid as at 31 December 2019. The carrying amounts of the loan notes comprised of: - US$909 million of fixed interest loan notes with maturity dates between April 2022 and June 2033 - US$486 million of fixed interest loan notes payable by instalments with maturity dates between October 2022 and July 2028 - US$1,191 million of variable interest loan notes (6-month USD LIBOR + margins between 0.82% and 1.72%) with maturity dates between October 2020 and June 2033. One series of private placement loan notes comprising US$150 million of the variable interest loan notes will mature and be payable in October 2020. The Group expects to refinance this series later in 2020. The above other borrowings are net of private placement loan fees of US$8.3 million (2018: US$8.3 million) and interest rate swap fees of US$0.1 million (2018: US$0.3 million). Loans from related parties relate to a loan with a total principal amount outstanding of US$8.5 million as at 31 December 2019. 26 Security The borrowings were obtained in order to purchase property, plant and equipment of the Group. All borrowings are secured by a pledge of the shares of subsidiaries owning the relevant property, plant and equipment and mortgages against the relevant property, plant and equipment held for operating leases with carrying amount as at 31 December 2019 $4,099.8 million (2018: $3,530.9 million) and the underlying assets in the net investments in finance lease receivables with carrying amount as at 31 December 2019 $294 million (2018: $210.4 million). 27 Covenants All borrowings contain affirmative covenants customary for secured borrowings of this type. The Group has fulfilled all its covenant reporting and was not in breach of any of its borrowings covenants during the year ended 31 December 2019, 2018 and 2017. Page 32

28 Analysis of changes in net debt As at 31 As at 1 Fair value Non-cash December January 2019 Cash flows movements changes 2019 $000 $000 $000 $000 $000 Audi ted Audi ted Audi ted Audi ted Audi ted Cash 131,399 (98,213) - - 33,186 Bank and other borrowings (2,937,794) (376,630) (17,474) (3,331,898) Interest rate swap (768) - (2,911) - (3,679) Net debt (2,807,163) (474,843) (2,911) (17,474) (3,302,391) 29 Provisions for liabilities Provisions for liabilities comprise only of net deferred tax liabilities as at 31 December 2018 and 2019, which are set out in the table below. Deferred tax (assets) and liabilities 2019 Liability $000 Audi ted Property, plant & equipment 206,509 Losses (174) Other timing differences (238) 206,097 2018 $000 Unaudited Property, plant & equipment 177,565 Losses (174) Other timing differences 616 178,007 No net reversal of the deferred tax liability is expected to occur in the next reporting period. 30 Pension and other schemes The Company’s employees are members of one of two multi-employer defined benefits pension schemes. The Rolls- Royce Pension Fund or the Rolls-Royce Group Pension Scheme. The assets of the schemes are held in separate funds administered by trustees and invested in them independently of the finances of the Group. The schemes are funded by annual contributions from: a) the Company b) scheme members. As it is not possible to identify the share of underlying assets and liabilities relating to Alpha Partners Leasing Limited, in accordance with FRS102 paragraph 28.11 Retirement Benefits, the scheme has been accounted for as a defined contribution scheme in these financial statements. Page 33
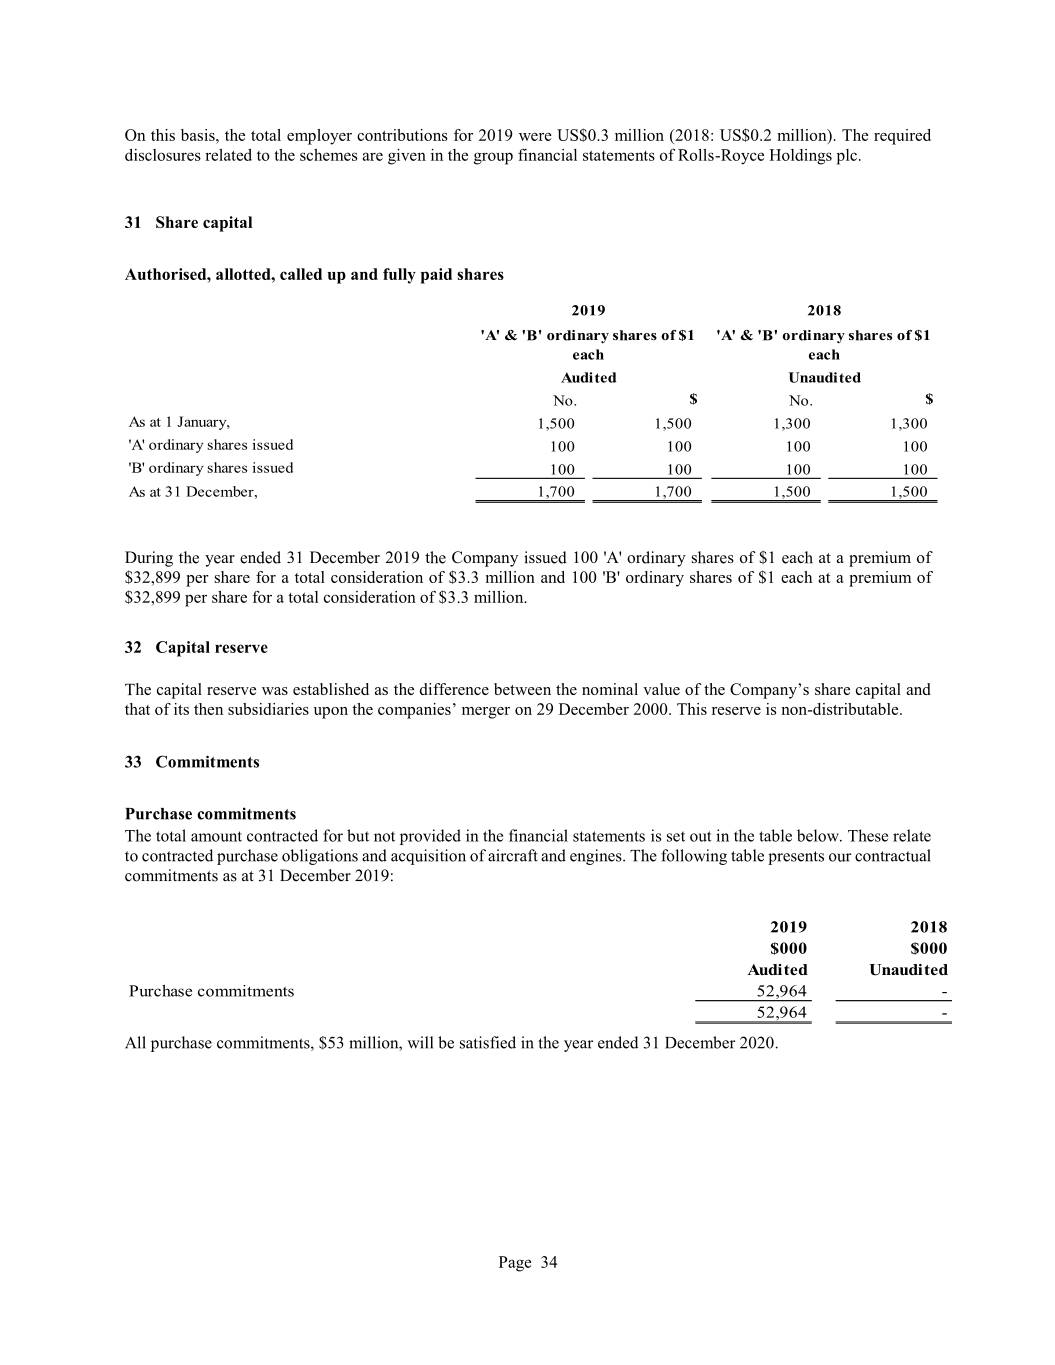
On this basis, the total employer contributions for 2019 were US$0.3 million (2018: US$0.2 million). The required disclosures related to the schemes are given in the group financial statements of Rolls-Royce Holdings plc. 31 Share capital Authorised, allotted, called up and fully paid shares 2019 2018 'A' & 'B' ordinary shares of $1 'A' & 'B' ordinary shares of $1 each each Audi ted Unaudited No. $ No. $ As at 1 January, 1,500 1,500 1,300 1,300 'A' ordinary shares issued 100 100 100 100 'B' ordinary shares issued 100 100 100 100 As at 31 December, 1,700 1,700 1,500 1,500 During the year ended 31 December 2019 the Company issued 100 'A' ordinary shares of $1 each at a premium of $32,899 per share for a total consideration of $3.3 million and 100 'B' ordinary shares of $1 each at a premium of $32,899 per share for a total consideration of $3.3 million. 32 Capital reserve The capital reserve was established as the difference between the nominal value of the Company’s share capital and that of its then subsidiaries upon the companies’ merger on 29 December 2000. This reserve is non-distributable. 33 Commitments Purchase commitments The total amount contracted for but not provided in the financial statements is set out in the table below. These relate to contracted purchase obligations and acquisition of aircraft and engines. The following table presents our contractual commitments as at 31 December 2019: 2019 2018 $000 $000 Audi ted Unaudited Purchase commitments 52,964 - 52,964 - All purchase commitments, $53 million, will be satisfied in the year ended 31 December 2020. Page 34
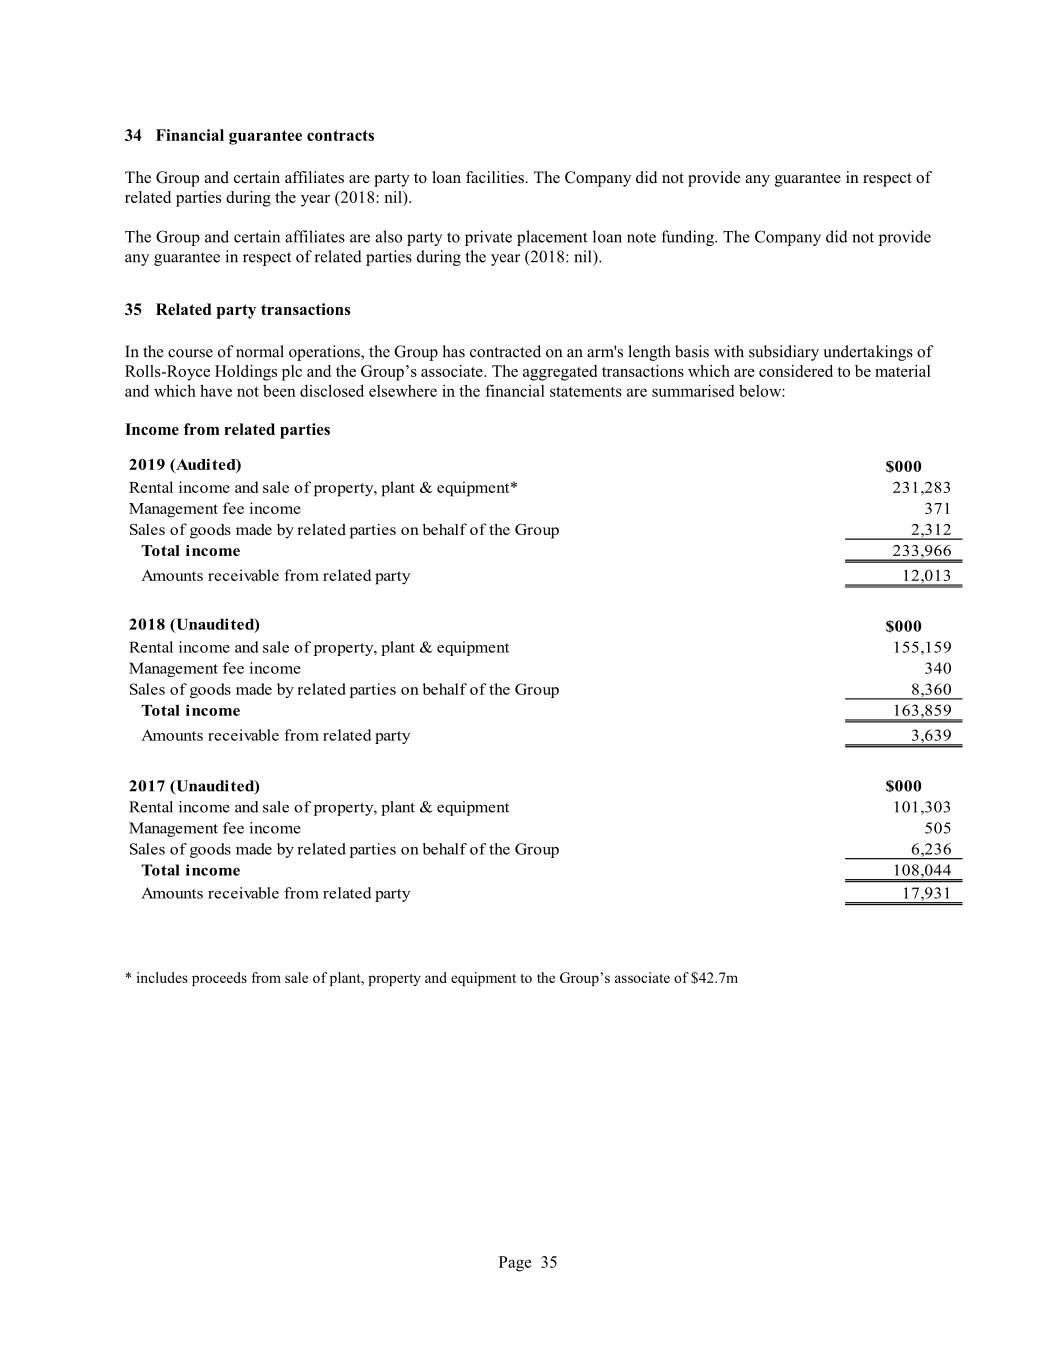
34 Financial guarantee contracts The Group and certain affiliates are party to loan facilities. The Company did not provide any guarantee in respect of related parties during the year (2018: nil). The Group and certain affiliates are also party to private placement loan note funding. The Company did not provide any guarantee in respect of related parties during the year (2018: nil). 35 Related party transactions In the course of normal operations, the Group has contracted on an arm's length basis with subsidiary undertakings of Rolls-Royce Holdings plc and the Group’s associate. The aggregated transactions which are considered to be material and which have not been disclosed elsewhere in the financial statements are summarised below: Income from related parties 2019 (Audited) $000 Rental income and sale of property, plant & equipment* 231,283 Management fee income 371 Sales of goods made by related parties on behalf of the Group 2,312 Total i ncome 233,966 Amounts receivable from related party 12,013 2018 (Unaudited) $000 Rental income and sale of property, plant & equipment 155,159 Management fee income 340 Sales of goods made by related parties on behalf of the Group 8,360 Total i ncome 163,859 Amounts receivable from related party 3,639 2017 (Unaudited) $000 Rental income and sale of property, plant & equipment 101,303 Management fee income 505 Sales of goods made by related parties on behalf of the Group 6,236 Total i ncome 108,044 Amounts receivable from related party 17,931 * includes proceeds from sale of plant, property and equipment to the Group’s associate of $42.7m Page 35
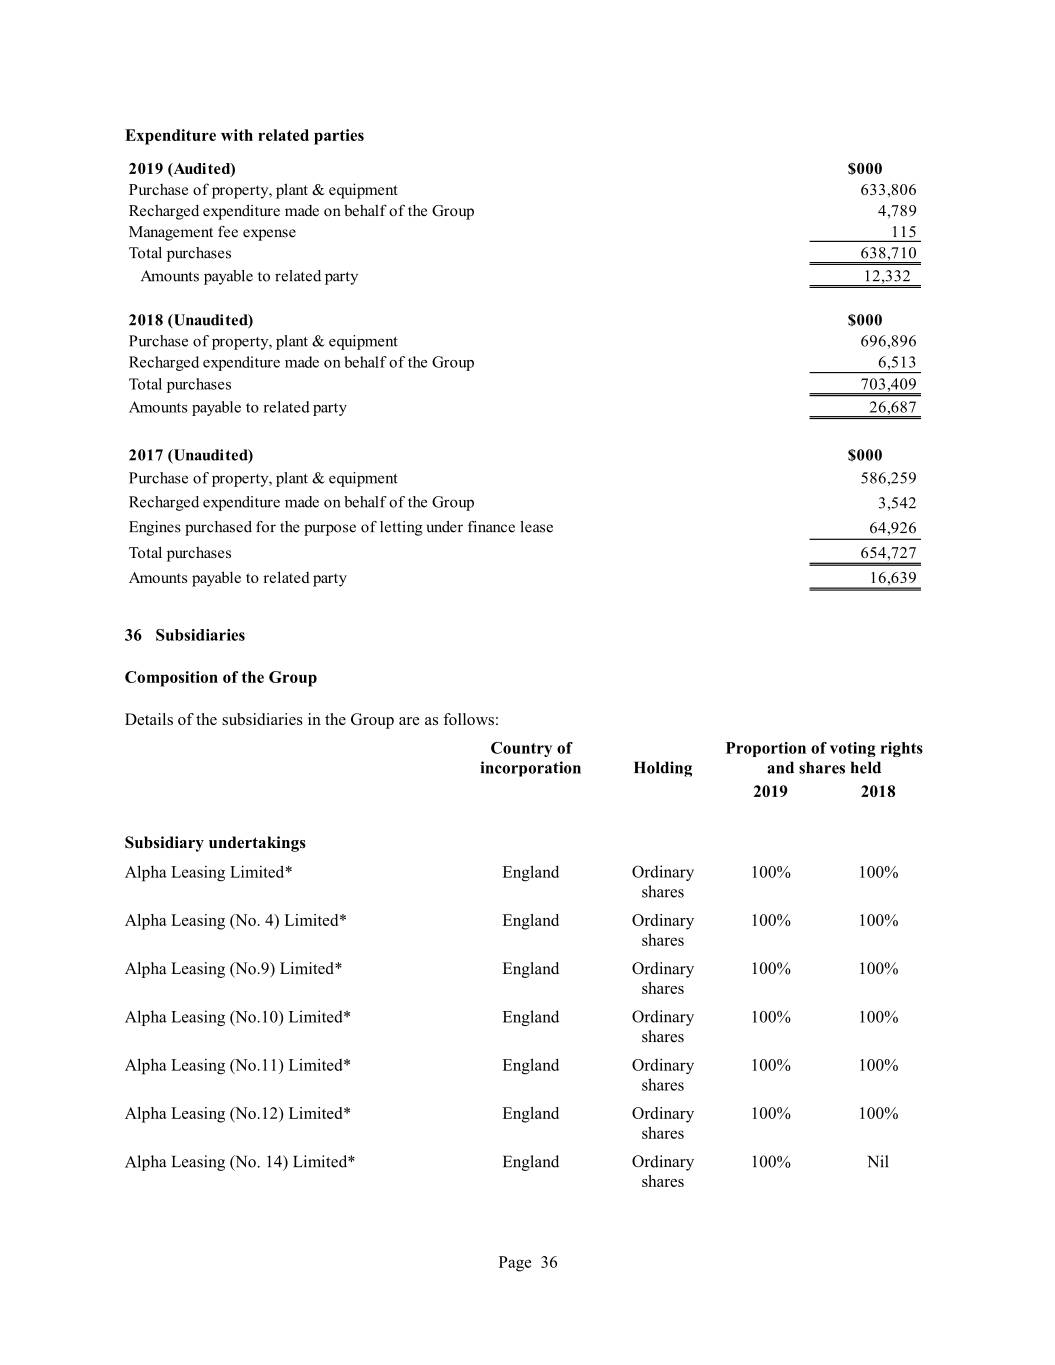
Expenditure with related parties 2019 (Audited) $000 Purchase of property, plant & equipment 633,806 Recharged expenditure made on behalf of the Group 4,789 Management fee expense 115 Total purchases 638,710 Amounts payable to related party 12,332 2018 (Unaudited) $000 Purchase of property, plant & equipment 696,896 Recharged expenditure made on behalf of the Group 6,513 Total purchases 703,409 Amounts payable to related party 26,687 2017 (Unaudited) $000 Purchase of property, plant & equipment 586,259 Recharged expenditure made on behalf of the Group 3,542 Engines purchased for the purpose of letting under finance lease 64,926 Total purchases 654,727 Amounts payable to related party 16,639 36 Subsidiaries Composition of the Group Details of the subsidiaries in the Group are as follows: Country of Proportion of voting rights incorporation Holding and shares held 2019 2018 Subsidiary undertakings Alpha Leasing Limited* England Ordinary 100% 100% shares Alpha Leasing (No. 4) Limited* England Ordinary 100% 100% shares Alpha Leasing (No.9) Limited* England Ordinary 100% 100% shares Alpha Leasing (No.10) Limited* England Ordinary 100% 100% shares Alpha Leasing (No.11) Limited* England Ordinary 100% 100% shares Alpha Leasing (No.12) Limited* England Ordinary 100% 100% shares Alpha Leasing (No. 14) Limited* England Ordinary 100% Nil shares Page 36
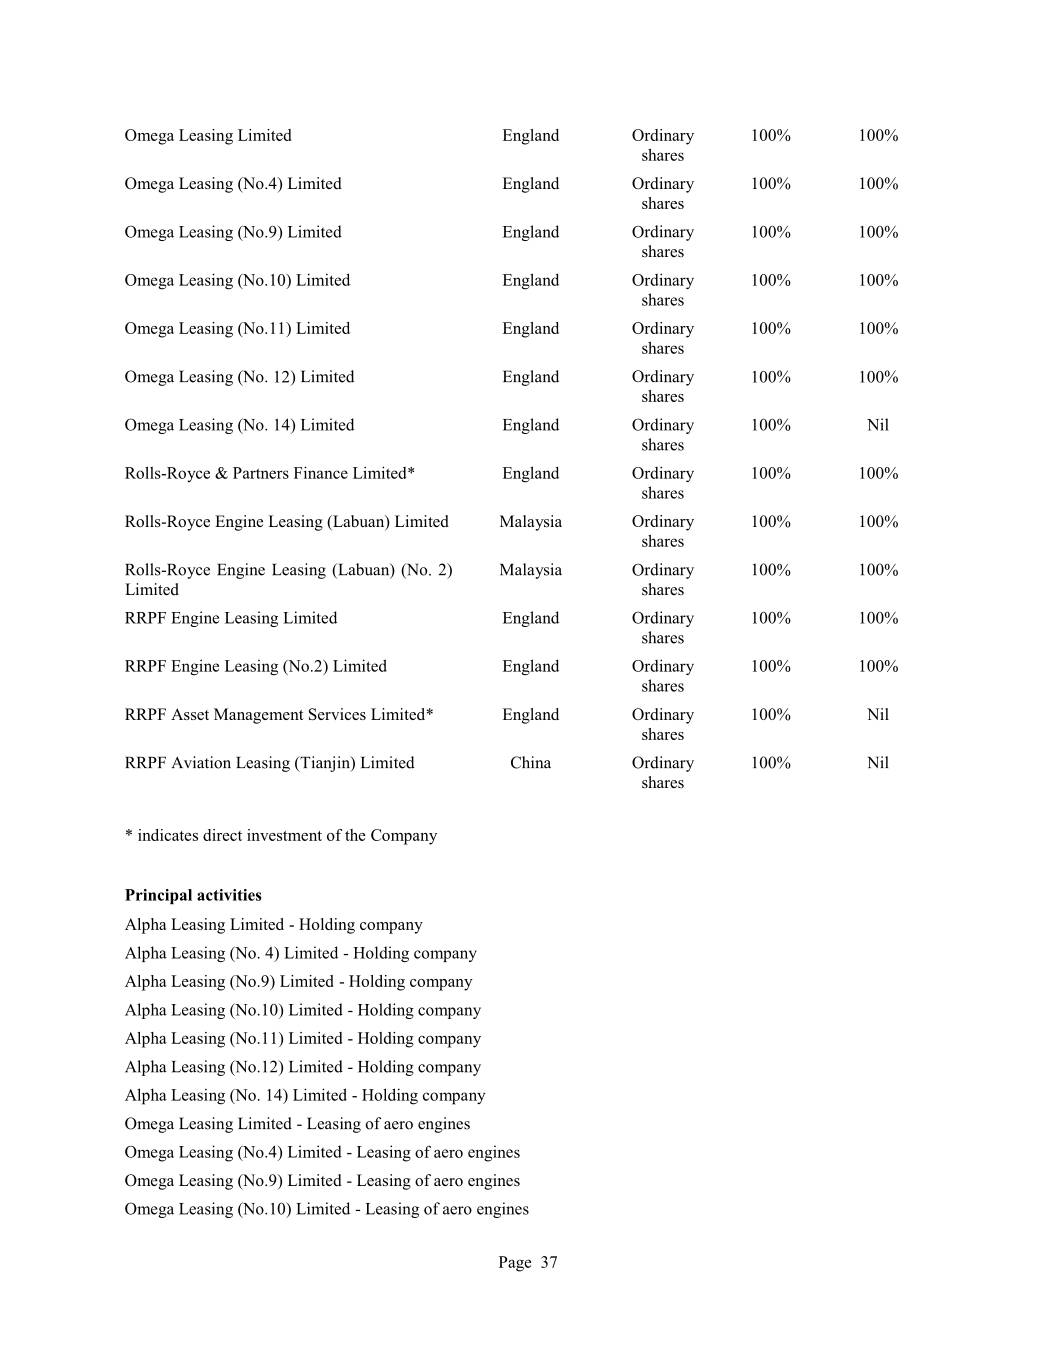
Omega Leasing Limited England Ordinary 100% 100% shares Omega Leasing (No.4) Limited England Ordinary 100% 100% shares Omega Leasing (No.9) Limited England Ordinary 100% 100% shares Omega Leasing (No.10) Limited England Ordinary 100% 100% shares Omega Leasing (No.11) Limited England Ordinary 100% 100% shares Omega Leasing (No. 12) Limited England Ordinary 100% 100% shares Omega Leasing (No. 14) Limited England Ordinary 100% Nil shares Rolls-Royce & Partners Finance Limited* England Ordinary 100% 100% shares Rolls-Royce Engine Leasing (Labuan) Limited Malaysia Ordinary 100% 100% shares Rolls-Royce Engine Leasing (Labuan) (No. 2) Malaysia Ordinary 100% 100% Limited shares RRPF Engine Leasing Limited England Ordinary 100% 100% shares RRPF Engine Leasing (No.2) Limited England Ordinary 100% 100% shares RRPF Asset Management Services Limited* England Ordinary 100% Nil shares RRPF Aviation Leasing (Tianjin) Limited China Ordinary 100% Nil shares * indicates direct investment of the Company Principal activities Alpha Leasing Limited - Holding company Alpha Leasing (No. 4) Limited - Holding company Alpha Leasing (No.9) Limited - Holding company Alpha Leasing (No.10) Limited - Holding company Alpha Leasing (No.11) Limited - Holding company Alpha Leasing (No.12) Limited - Holding company Alpha Leasing (No. 14) Limited - Holding company Omega Leasing Limited - Leasing of aero engines Omega Leasing (No.4) Limited - Leasing of aero engines Omega Leasing (No.9) Limited - Leasing of aero engines Omega Leasing (No.10) Limited - Leasing of aero engines Page 37
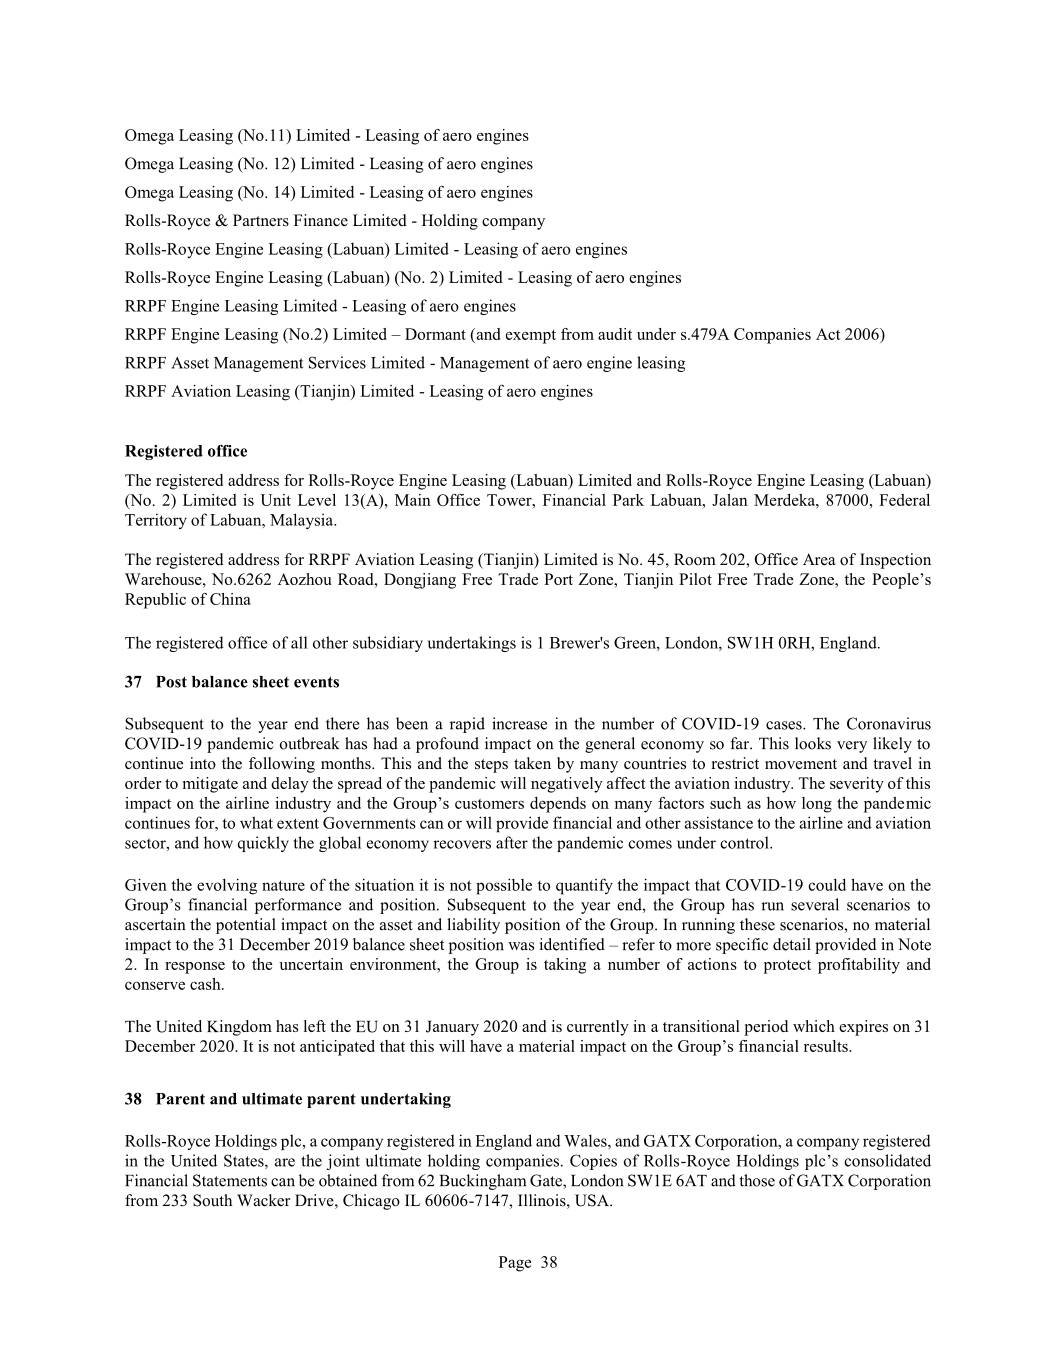
Omega Leasing (No.11) Limited - Leasing of aero engines Omega Leasing (No. 12) Limited - Leasing of aero engines Omega Leasing (No. 14) Limited - Leasing of aero engines Rolls-Royce & Partners Finance Limited - Holding company Rolls-Royce Engine Leasing (Labuan) Limited - Leasing of aero engines Rolls-Royce Engine Leasing (Labuan) (No. 2) Limited - Leasing of aero engines RRPF Engine Leasing Limited - Leasing of aero engines RRPF Engine Leasing (No.2) Limited – Dormant (and exempt from audit under s.479A Companies Act 2006) RRPF Asset Management Services Limited - Management of aero engine leasing RRPF Aviation Leasing (Tianjin) Limited - Leasing of aero engines Registered office The registered address for Rolls-Royce Engine Leasing (Labuan) Limited and Rolls-Royce Engine Leasing (Labuan) (No. 2) Limited is Unit Level 13(A), Main Office Tower, Financial Park Labuan, Jalan Merdeka, 87000, Federal Territory of Labuan, Malaysia. The registered address for RRPF Aviation Leasing (Tianjin) Limited is No. 45, Room 202, Office Area of Inspection Warehouse, No.6262 Aozhou Road, Dongjiang Free Trade Port Zone, Tianjin Pilot Free Trade Zone, the People’s Republic of China The registered office of all other subsidiary undertakings is 1 Brewer's Green, London, SW1H 0RH, England. 37 Post balance sheet events Subsequent to the year end there has been a rapid increase in the number of COVID-19 cases. The Coronavirus COVID-19 pandemic outbreak has had a profound impact on the general economy so far. This looks very likely to continue into the following months. This and the steps taken by many countries to restrict movement and travel in order to mitigate and delay the spread of the pandemic will negatively affect the aviation industry. The severity of this impact on the airline industry and the Group’s customers depends on many factors such as how long the pandemic continues for, to what extent Governments can or will provide financial and other assistance to the airline and aviation sector, and how quickly the global economy recovers after the pandemic comes under control. Given the evolving nature of the situation it is not possible to quantify the impact that COVID-19 could have on the Group’s financial performance and position. Subsequent to the year end, the Group has run several scenarios to ascertain the potential impact on the asset and liability position of the Group. In running these scenarios, no material impact to the 31 December 2019 balance sheet position was identified – refer to more specific detail provided in Note 2. In response to the uncertain environment, the Group is taking a number of actions to protect profitability and conserve cash. The United Kingdom has left the EU on 31 January 2020 and is currently in a transitional period which expires on 31 December 2020. It is not anticipated that this will have a material impact on the Group’s financial results. 38 Parent and ultimate parent undertaking Rolls-Royce Holdings plc, a company registered in England and Wales, and GATX Corporation, a company registered in the United States, are the joint ultimate holding companies. Copies of Rolls-Royce Holdings plc’s consolidated Financial Statements can be obtained from 62 Buckingham Gate, London SW1E 6AT and those of GATX Corporation from 233 South Wacker Drive, Chicago IL 60606-7147, Illinois, USA. Page 38

39 US GAAP information Reconciliations to US GAAP The Consolidated Financial Statements are prepared in accordance with UK GAAP, which differ in certain material respects from US GAAP. The following is a summary of the effects of the differences between UK GAAP and US GAAP. Net profit for the years ended 31 December 2019, 31 December 2018 and 31 December 2017 There is no material difference between the Group’s net profit prepared under FRS102 and US GAAP. Balance sheet as at 31 December 2019 and 31 December 2018 There is no material difference between the Group’s balance sheet prepared under FRS102 and US GAAP. Statement of cashflows for the years ended 31 December 2019, 31 December 2018 and 31 December 2017 A reconciliation of the consolidated statements of cash flows presented in accordance with FRS102 format to a US GAAP format is set out below. 2019 2018 2017 $000 $000 $000 Audi ted Unaudited Unaudited Cash flows from operating activities (FRS102) 461,972 350,555 283,916 Reclassification of interest paid, net interest received (97,014) (59,441) (37,632) Cash flows from operating activities (US GAAP) 364,958 291,114 246,284 Cash flows from investing activities (FRS102) (825,165) (925,221) (717,057) Reclassification of interest received (4,486) (820) (382) Cash flows from investing activities (US GAAP) (829,651) (926,041) (717,439) Cash flows from financing activities (FRS102) 264,980 674,629 438,882 Reclassification of interest paid 101,500 60,261 38,014 Cash flows from financing activities (US GAAP) 366,480 734,890 476,896 Net increase in cash and cash equivalents (98,213) 99,963 5,741 Cash and cash equivalents at 1 January 131,399 31,436 25,695 Cash and cash equivalents at 31 December $ 33,186 $ 131,399 $ 31,436 Summary of differences between FRS102 and US GAAP (a) Leases The Group is not required to adopt the FASB issued Accounting Standards Update (“ASU”) 2016-02, Leases (ASC 842) during the year ended 31 December 2019, and therefore applies ASC 840 (see Future application of US GAAP). The requirements of Section 20 of FRS102 is substantially similar to the requirements of ASC 840 and management has assessed there are no material GAAP differences. Page 39
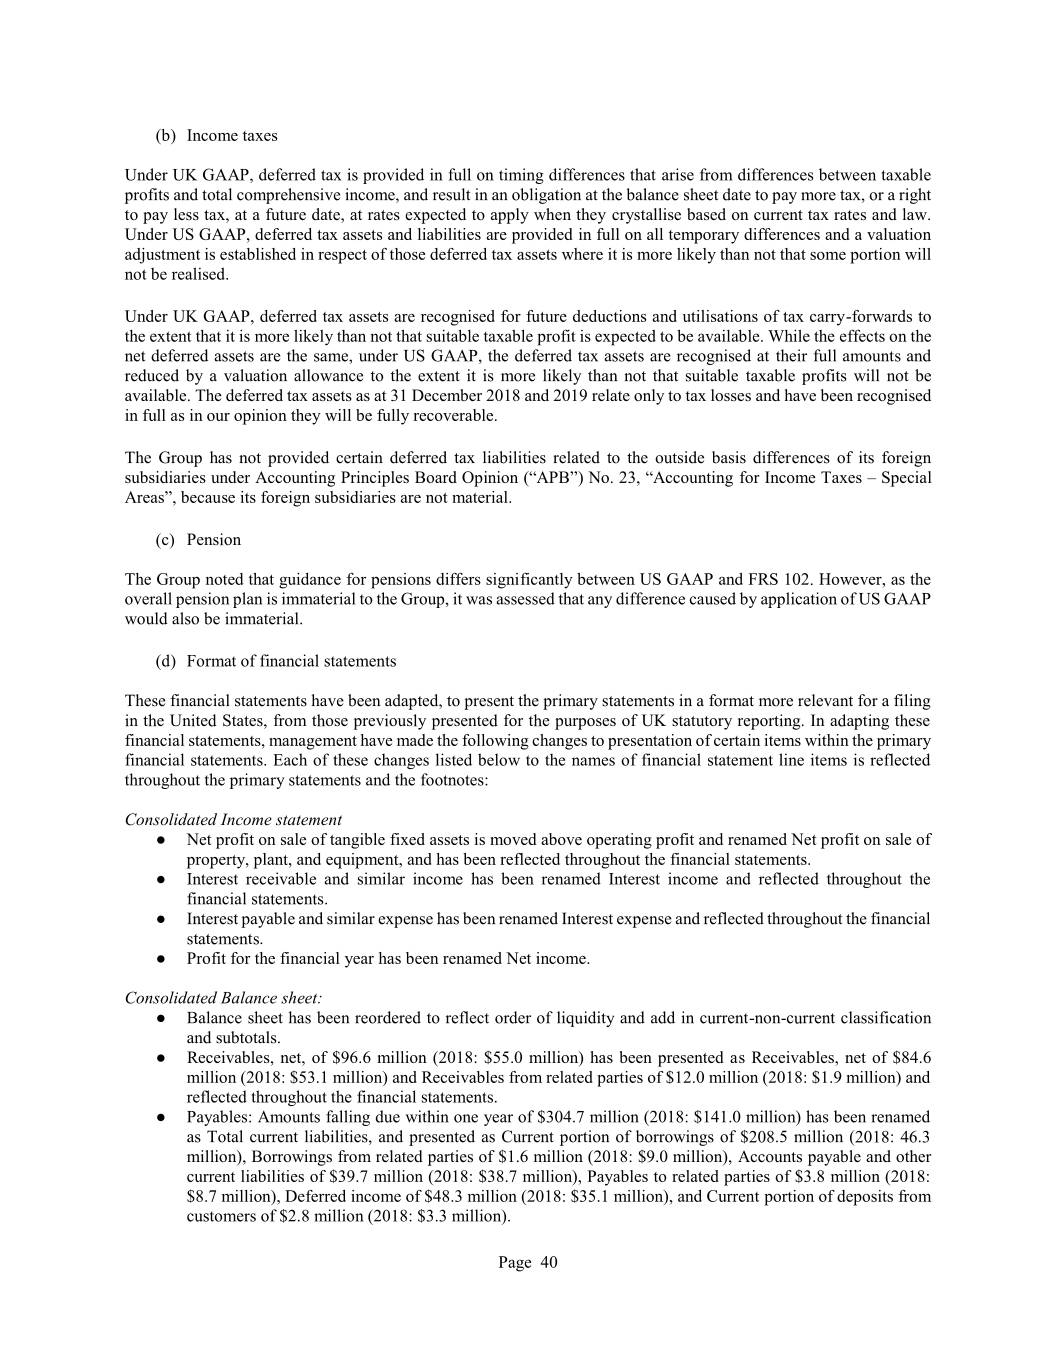
(b) Income taxes Under UK GAAP, deferred tax is provided in full on timing differences that arise from differences between taxable profits and total comprehensive income, and result in an obligation at the balance sheet date to pay more tax, or a right to pay less tax, at a future date, at rates expected to apply when they crystallise based on current tax rates and law. Under US GAAP, deferred tax assets and liabilities are provided in full on all temporary differences and a valuation adjustment is established in respect of those deferred tax assets where it is more likely than not that some portion will not be realised. Under UK GAAP, deferred tax assets are recognised for future deductions and utilisations of tax carry-forwards to the extent that it is more likely than not that suitable taxable profit is expected to be available. While the effects on the net deferred assets are the same, under US GAAP, the deferred tax assets are recognised at their full amounts and reduced by a valuation allowance to the extent it is more likely than not that suitable taxable profits will not be available. The deferred tax assets as at 31 December 2018 and 2019 relate only to tax losses and have been recognised in full as in our opinion they will be fully recoverable. The Group has not provided certain deferred tax liabilities related to the outside basis differences of its foreign subsidiaries under Accounting Principles Board Opinion (“APB”) No. 23, “Accounting for Income Taxes – Special Areas”, because its foreign subsidiaries are not material. (c) Pension The Group noted that guidance for pensions differs significantly between US GAAP and FRS 102. However, as the overall pension plan is immaterial to the Group, it was assessed that any difference caused by application of US GAAP would also be immaterial. (d) Format of financial statements These financial statements have been adapted, to present the primary statements in a format more relevant for a filing in the United States, from those previously presented for the purposes of UK statutory reporting. In adapting these financial statements, management have made the following changes to presentation of certain items within the primary financial statements. Each of these changes listed below to the names of financial statement line items is reflected throughout the primary statements and the footnotes: Consolidated Income statement ● Net profit on sale of tangible fixed assets is moved above operating profit and renamed Net profit on sale of property, plant, and equipment, and has been reflected throughout the financial statements. ● Interest receivable and similar income has been renamed Interest income and reflected throughout the financial statements. ● Interest payable and similar expense has been renamed Interest expense and reflected throughout the financial statements. ● Profit for the financial year has been renamed Net income. Consolidated Balance sheet: ● Balance sheet has been reordered to reflect order of liquidity and add in current-non-current classification and subtotals. ● Receivables, net, of $96.6 million (2018: $55.0 million) has been presented as Receivables, net of $84.6 million (2018: $53.1 million) and Receivables from related parties of $12.0 million (2018: $1.9 million) and reflected throughout the financial statements. ● Payables: Amounts falling due within one year of $304.7 million (2018: $141.0 million) has been renamed as Total current liabilities, and presented as Current portion of borrowings of $208.5 million (2018: 46.3 million), Borrowings from related parties of $1.6 million (2018: $9.0 million), Accounts payable and other current liabilities of $39.7 million (2018: $38.7 million), Payables to related parties of $3.8 million (2018: $8.7 million), Deferred income of $48.3 million (2018: $35.1 million), and Current portion of deposits from customers of $2.8 million (2018: $3.3 million). Page 40
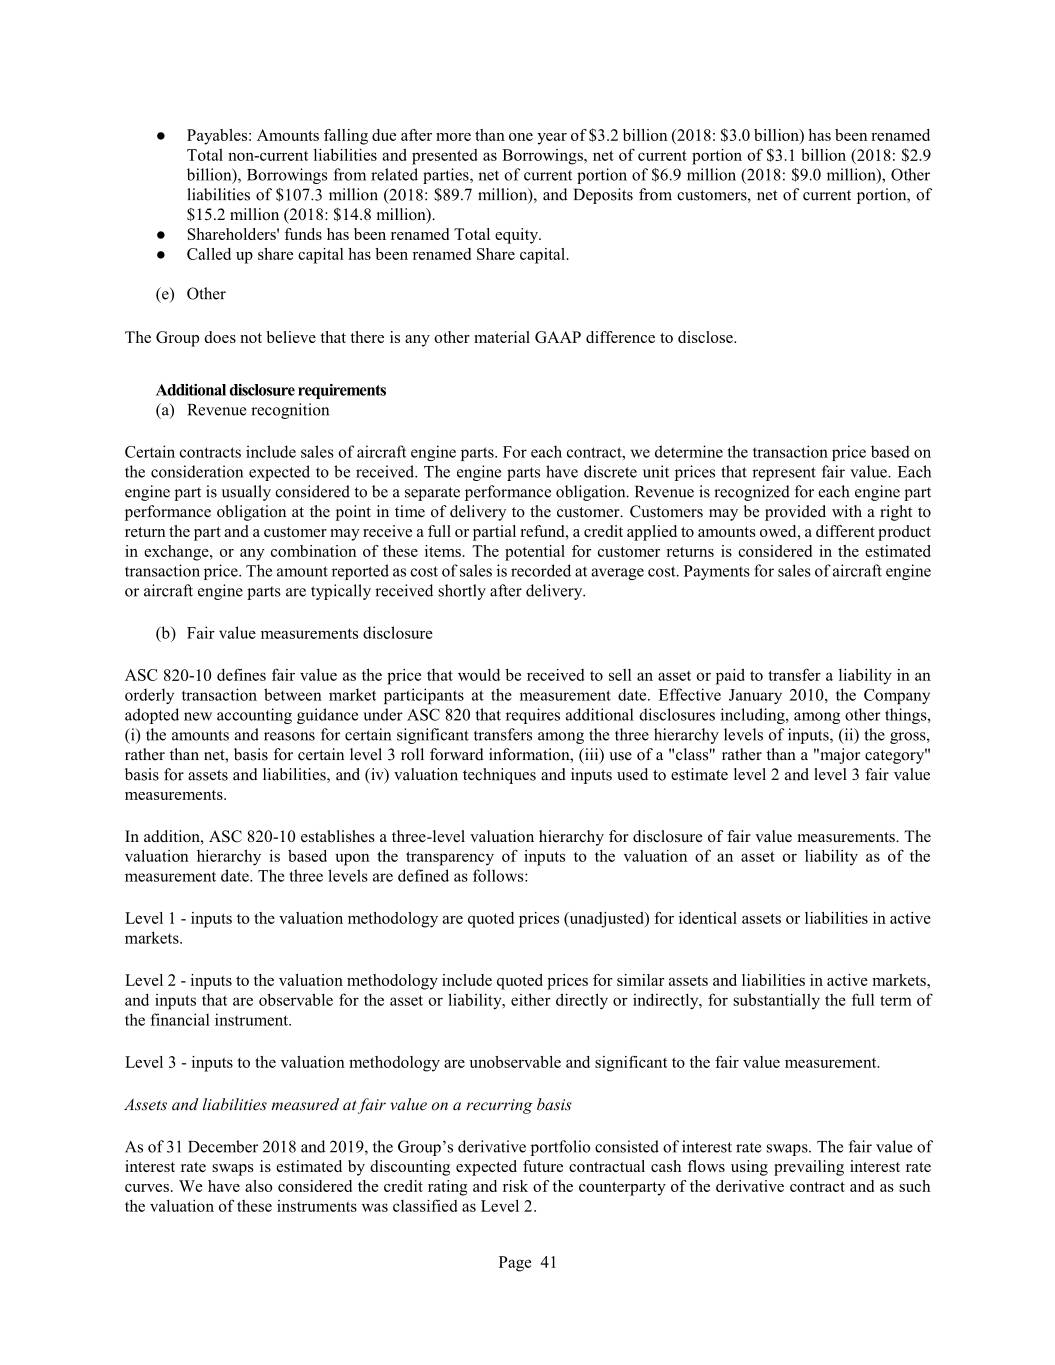
● Payables: Amounts falling due after more than one year of $3.2 billion (2018: $3.0 billion) has been renamed Total non-current liabilities and presented as Borrowings, net of current portion of $3.1 billion (2018: $2.9 billion), Borrowings from related parties, net of current portion of $6.9 million (2018: $9.0 million), Other liabilities of $107.3 million (2018: $89.7 million), and Deposits from customers, net of current portion, of $15.2 million (2018: $14.8 million). ● Shareholders' funds has been renamed Total equity. ● Called up share capital has been renamed Share capital. (e) Other The Group does not believe that there is any other material GAAP difference to disclose. Additional disclosure requirements (a) Revenue recognition Certain contracts include sales of aircraft engine parts. For each contract, we determine the transaction price based on the consideration expected to be received. The engine parts have discrete unit prices that represent fair value. Each engine part is usually considered to be a separate performance obligation. Revenue is recognized for each engine part performance obligation at the point in time of delivery to the customer. Customers may be provided with a right to return the part and a customer may receive a full or partial refund, a credit applied to amounts owed, a different product in exchange, or any combination of these items. The potential for customer returns is considered in the estimated transaction price. The amount reported as cost of sales is recorded at average cost. Payments for sales of aircraft engine or aircraft engine parts are typically received shortly after delivery. (b) Fair value measurements disclosure ASC 820-10 defines fair value as the price that would be received to sell an asset or paid to transfer a liability in an orderly transaction between market participants at the measurement date. Effective January 2010, the Company adopted new accounting guidance under ASC 820 that requires additional disclosures including, among other things, (i) the amounts and reasons for certain significant transfers among the three hierarchy levels of inputs, (ii) the gross, rather than net, basis for certain level 3 roll forward information, (iii) use of a "class" rather than a "major category" basis for assets and liabilities, and (iv) valuation techniques and inputs used to estimate level 2 and level 3 fair value measurements. In addition, ASC 820-10 establishes a three-level valuation hierarchy for disclosure of fair value measurements. The valuation hierarchy is based upon the transparency of inputs to the valuation of an asset or liability as of the measurement date. The three levels are defined as follows: Level 1 - inputs to the valuation methodology are quoted prices (unadjusted) for identical assets or liabilities in active markets. Level 2 - inputs to the valuation methodology include quoted prices for similar assets and liabilities in active markets, and inputs that are observable for the asset or liability, either directly or indirectly, for substantially the full term of the financial instrument. Level 3 - inputs to the valuation methodology are unobservable and significant to the fair value measurement. Assets and liabilities measured at fair value on a recurring basis As of 31 December 2018 and 2019, the Group’s derivative portfolio consisted of interest rate swaps. The fair value of interest rate swaps is estimated by discounting expected future contractual cash flows using prevailing interest rate curves. We have also considered the credit rating and risk of the counterparty of the derivative contract and as such the valuation of these instruments was classified as Level 2. Page 41
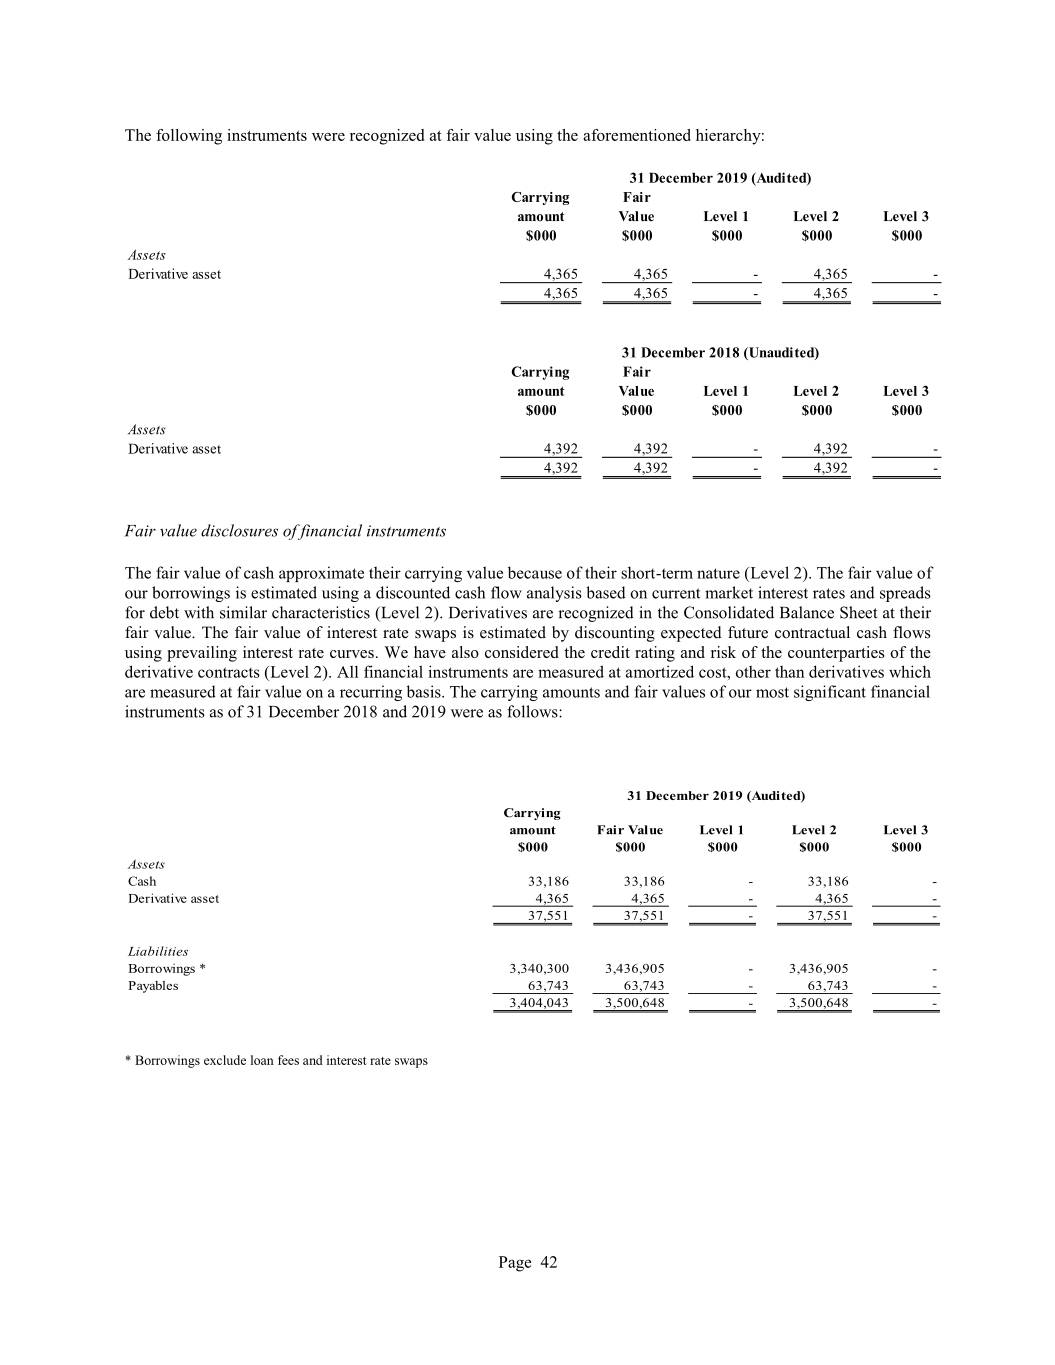
The following instruments were recognized at fair value using the aforementioned hierarchy: 31 December 2019 (Audited) Carrying Fair amount Val ue Level 1 Level 2 Level 3 $000 $000 $000 $000 $000 Assets Derivative asset 4,365 4,365 - 4,365 - 4,365 4,365 - 4,365 - 31 December 2018 (Unaudited) Carrying Fair amount Val ue Level 1 Level 2 Level 3 $000 $000 $000 $000 $000 Assets Derivative asset 4,392 4,392 - 4,392 - 4,392 4,392 - 4,392 - Fair value disclosures of financial instruments The fair value of cash approximate their carrying value because of their short-term nature (Level 2). The fair value of our borrowings is estimated using a discounted cash flow analysis based on current market interest rates and spreads for debt with similar characteristics (Level 2). Derivatives are recognized in the Consolidated Balance Sheet at their fair value. The fair value of interest rate swaps is estimated by discounting expected future contractual cash flows using prevailing interest rate curves. We have also considered the credit rating and risk of the counterparties of the derivative contracts (Level 2). All financial instruments are measured at amortized cost, other than derivatives which are measured at fair value on a recurring basis. The carrying amounts and fair values of our most significant financial instruments as of 31 December 2018 and 2019 were as follows: 31 December 2019 (Audited) Carrying amount Fair Value Level 1 Level 2 Level 3 $000 $000 $000 $000 $000 Assets Cash 33,186 33,186 - 33,186 - Derivative asset 4,365 4,365 - 4,365 - 37,551 37,551 - 37,551 - Liabilities Borrowings * 3,340,300 3,436,905 - 3,436,905 - Payables 63,743 63,743 - 63,743 - 3,404,043 3,500,648 - 3,500,648 - * Borrowings exclude loan fees and interest rate swaps Page 42
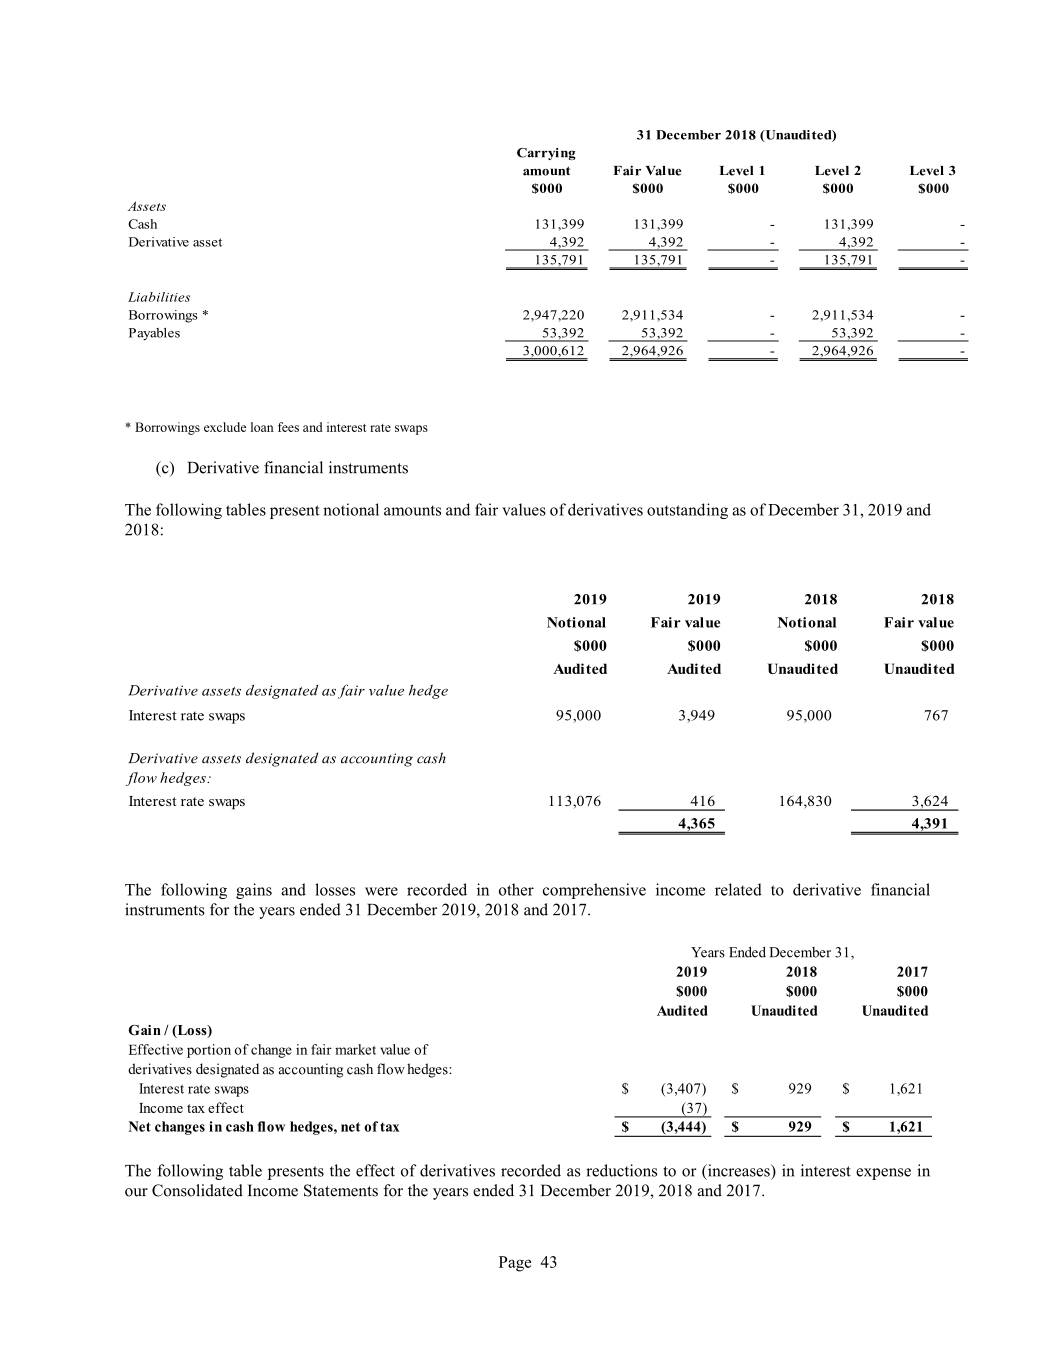
31 December 2018 (Unaudited) Carrying amount Fair Value Level 1 Level 2 Level 3 $000 $000 $000 $000 $000 Assets Cash 131,399 131,399 - 131,399 - Derivative asset 4,392 4,392 - 4,392 - 135,791 135,791 - 135,791 - Liabilities Borrowings * 2,947,220 2,911,534 - 2,911,534 - Payables 53,392 53,392 - 53,392 - 3,000,612 2,964,926 - 2,964,926 - * Borrowings exclude loan fees and interest rate swaps (c) Derivative financial instruments The following tables present notional amounts and fair values of derivatives outstanding as of December 31, 2019 and 2018: 2019 2019 2018 2018 Notional Fair value Notional Fair value $000 $000 $000 $000 Audi ted Audi ted Unaudited Unaudited Derivative assets designated as fair value hedge Interest rate swaps 95,000 3,949 95,000 767 Derivative assets designated as accounting cash flow hedges: Interest rate swaps 113,076 416 164,830 3,624 4,365 4,391 The following gains and losses were recorded in other comprehensive income related to derivative financial instruments for the years ended 31 December 2019, 2018 and 2017. Years Ended December 31, 2019 2018 2017 $000 $000 $000 Audi ted Unaudited Unaudited Gain / (Loss) Effective portion of change in fair market value of derivatives designated as accounting cash flow hedges: Interest rate swaps $ (3,407) $ 929 $ 1,621 Income tax effect (37) Net changes in cash flow hedges, net of tax $ (3,444) $ 929 $ 1,621 The following table presents the effect of derivatives recorded as reductions to or (increases) in interest expense in our Consolidated Income Statements for the years ended 31 December 2019, 2018 and 2017. Page 43
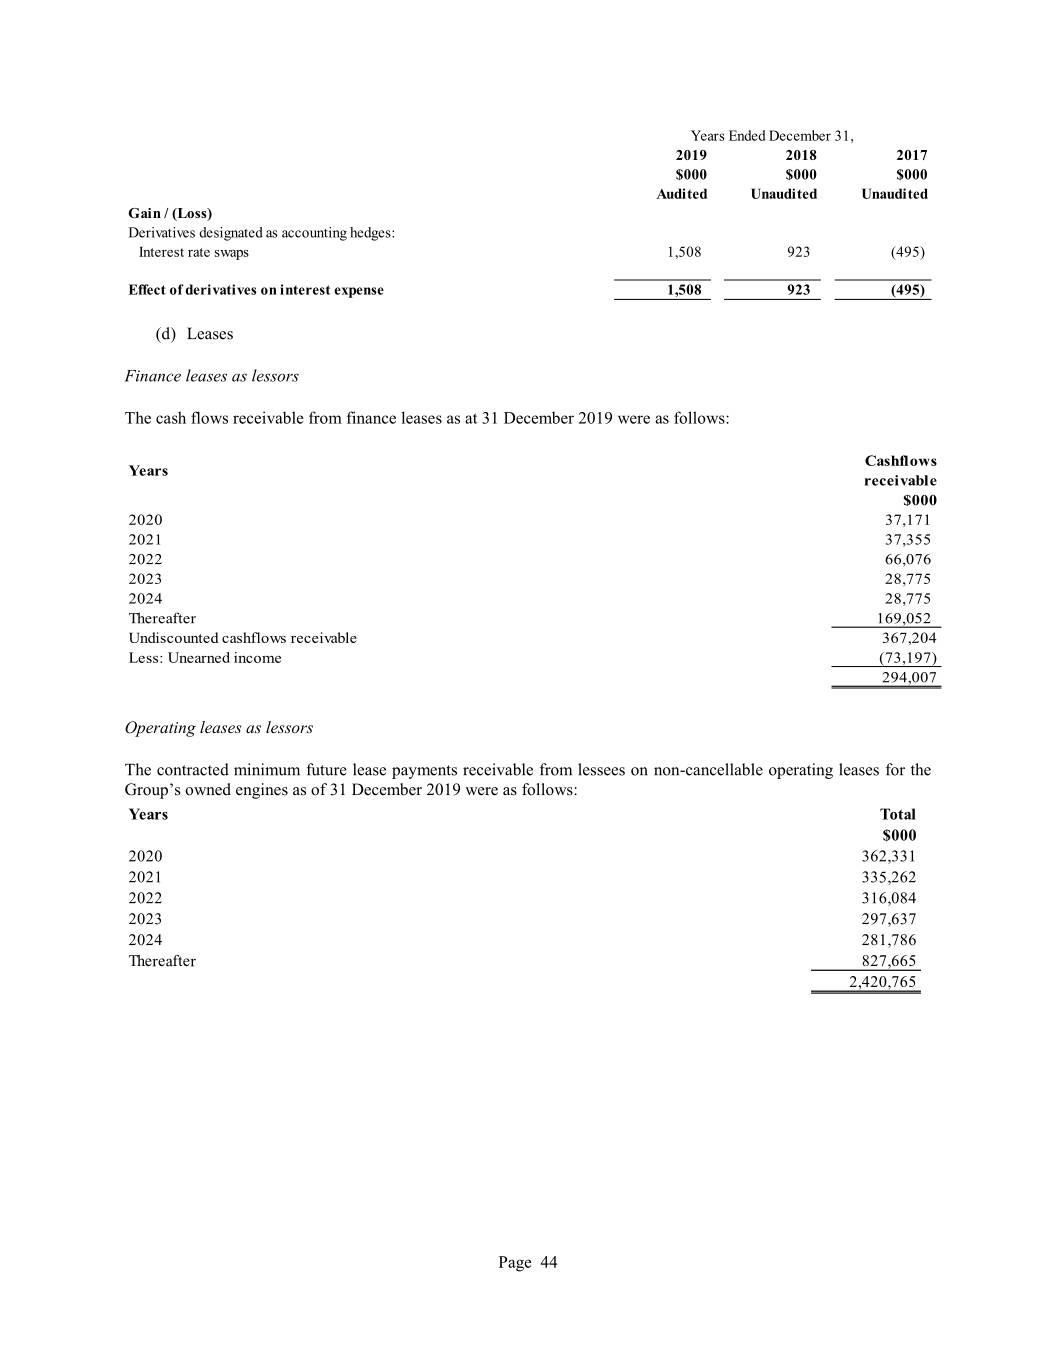
Years Ended December 31, 2019 2018 2017 $000 $000 $000 Audi ted Unaudited Unaudited Gain / (Loss) Derivatives designated as accounting hedges: Interest rate swaps 1,508 923 (495) Effect of derivatives on interest expense 1,508 923 (495) (d) Leases Finance leases as lessors The cash flows receivable from finance leases as at 31 December 2019 were as follows: Cashflows Years receivable $000 2020 37,171 2021 37,355 2022 66,076 2023 28,775 2024 28,775 Thereafter 169,052 Undiscounted cashflows receivable 367,204 Less: Unearned income (73,197) 294,007 Operating leases as lessors TheOperating contracted leases minimum - lessor future lease payments receivable from lessees on non-cancellable operating leases for the Group’sThe total owned of future engines minimum as of lease 31 December payments 2019 is as were follows: as follows: Years Total $000 2020 362,331 2021 335,262 2022 316,084 2023 297,637 2024 281,786 Thereafter 827,665 2,420,765 Page 44
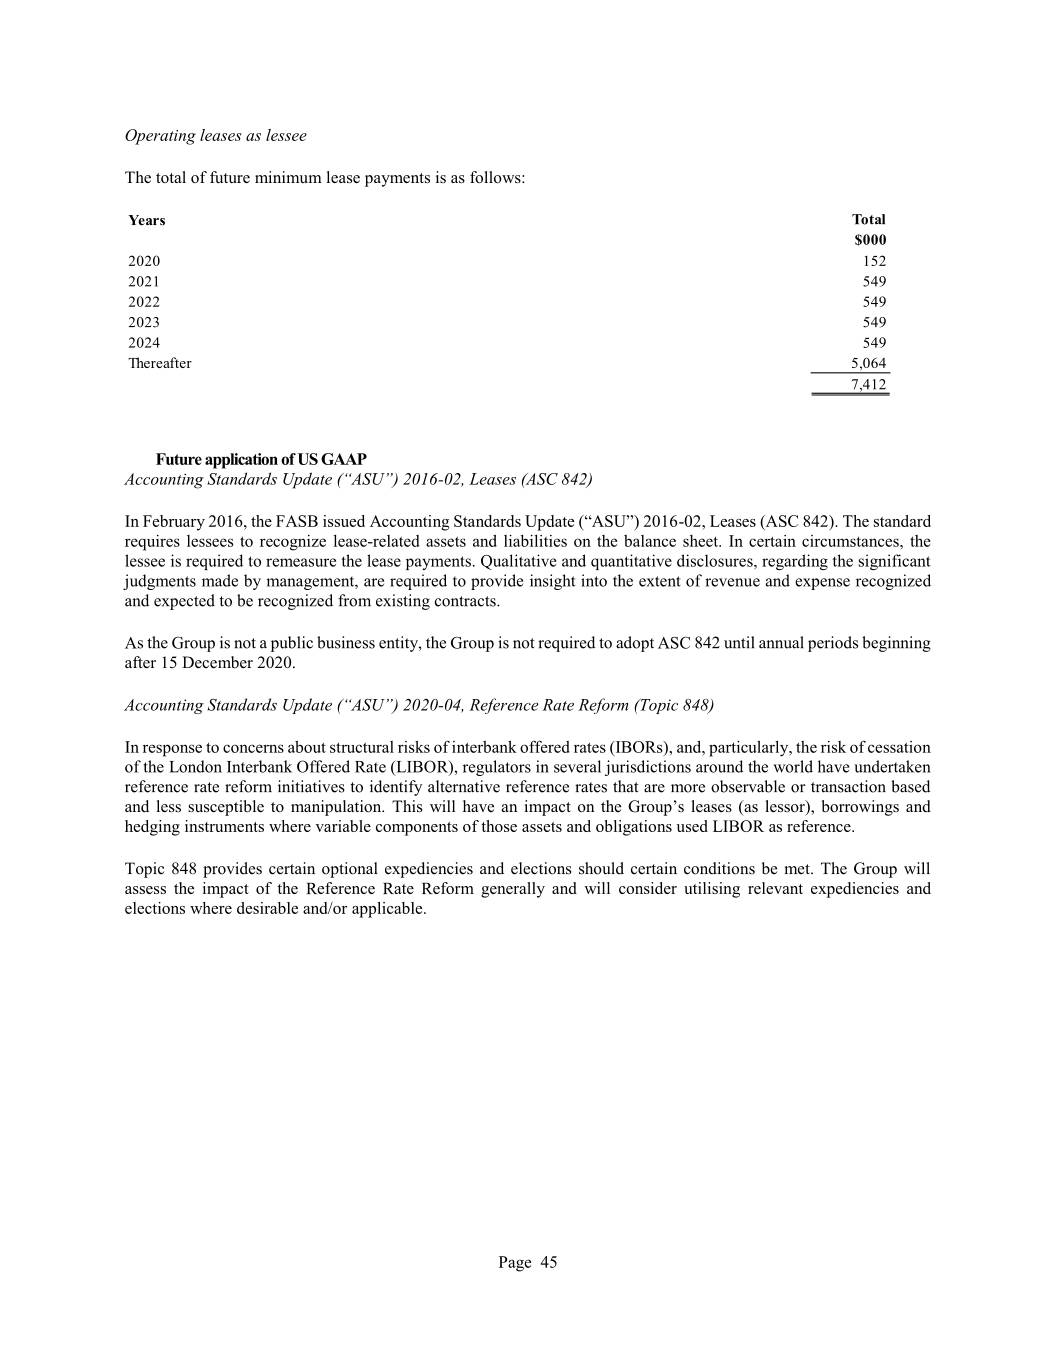
Operating leases as lessee The total of future minimum lease payments is as follows: Years Total $000 2020 152 2021 549 2022 549 2023 549 2024 549 Thereafter 5,064 7,412 Future application of US GAAP Accounting Standards Update (“ASU”) 2016-02, Leases (ASC 842) In February 2016, the FASB issued Accounting Standards Update (“ASU”) 2016-02, Leases (ASC 842). The standard requires lessees to recognize lease-related assets and liabilities on the balance sheet. In certain circumstances, the lessee is required to remeasure the lease payments. Qualitative and quantitative disclosures, regarding the significant judgments made by management, are required to provide insight into the extent of revenue and expense recognized and expected to be recognized from existing contracts. As the Group is not a public business entity, the Group is not required to adopt ASC 842 until annual periods beginning after 15 December 2020. Accounting Standards Update (“ASU”) 2020-04, Reference Rate Reform (Topic 848) In response to concerns about structural risks of interbank offered rates (IBORs), and, particularly, the risk of cessation of the London Interbank Offered Rate (LIBOR), regulators in several jurisdictions around the world have undertaken reference rate reform initiatives to identify alternative reference rates that are more observable or transaction based and less susceptible to manipulation. This will have an impact on the Group’s leases (as lessor), borrowings and hedging instruments where variable components of those assets and obligations used LIBOR as reference. Topic 848 provides certain optional expediencies and elections should certain conditions be met. The Group will assess the impact of the Reference Rate Reform generally and will consider utilising relevant expediencies and elections where desirable and/or applicable. Page 45


