Exhibit 99.1

| Unless otherwise noted, GATX Corporation is the source for all data provided June 2010 GATX Corporation Company and Industry Profile - 2010 |

| Page 2 Forward-Looking Statements This presentation contains statements that may constitute forward-looking statements within the meaning of Section 27A of the Securities Act of 1933 and Section 21E of the Securities Exchange Act of 1934 and are subject to the safe harbor provisions of those sections and the Private Securities Litigation Reform Act of 1995. Some of these statements may be identified by words such as "anticipate," "believe," "estimate," "expect," "intend," "predict," "project" or other words and terms of similar meaning. Investors are cautioned that any such forward-looking statements are not guarantees of future performance and involve risks and uncertainties, including those described in GATX's Annual Report on Form 10-K and other filings with the SEC, and that actual results or developments may differ materially from those in the forward-looking statements. Specific factors that might cause actual results to differ from expectations include, but are not limited to, general economic, market, regulatory and political conditions in the rail, marine, industrial and other industries served by GATX and its customers; lease rates, utilization levels and operating costs in GATX's primary operating segments; conditions in the capital markets; changes in GATX's credit ratings and financing costs; regulatory rulings that may impact the economic value and operating costs of assets; competitive factors in GATX's primary markets including lease pricing and asset availability; changes in loss provision levels within GATX's portfolio; impaired asset charges that may result from changing market conditions or portfolio management decisions implemented by GATX; the opportunity for remarketing income; the outcome of pending or threatened litigation; and other factors. Given these risks and uncertainties, readers are cautioned not to place undue reliance on these forward-looking statements, which reflect management's analysis, judgment, belief or expectation only as of the date hereof. GATX has based these forward-looking statements on information currently available and disclaims any intention or obligation to update or revise these forward-looking statements to reflect subsequent events or circumstances. NYSE: GMT |

| Page 3 GATX Corporation GATX Corporation provides leasing and related services to customers in the rail, marine and industrial equipment markets GATX strives to: Provide an attractive, risk-adjusted return to shareholders Be an excellent operator focused on providing quality services to customers Provide clear direction and challenging opportunities to employees |

| Page 4 GATX Corporate History Founded in 1898 as a railcar lessor Listed on NYSE in 1916 Initiated quarterly dividends in 1919 Paid without interruption ever since Railcar leasing remains the foundation of GATX |

| Page 5 GATX Strengths Keys to Success GATX leases long-lived, widely-used assets Railcars - Marine Vessels Locomotives - Industrial Equipment Assets that GATX uniquely understands Assets requiring valuable services that GATX provides |

| Page 6 2004-2009 Strategic Positioning Took a number of strategic actions Exited volatile assets and businesses Exited aircraft, technology, telecom, and venture leasing Strengthened balance sheet and improved credit ratings Dramatically reduced leverage Improved ratings two notches to Baa1/BBB+ Invested with discipline Invested more than $3.0 billion, primarily in Rail Capitalized on strong market Sold targeted assets at attractive valuations Extended lease terms Scrapped older railcars at high prices These actions have positioned GATX to manage through and capitalize on a market downturn |

| Page 7 2010 Market Environment Industry will continue to face challenges in 2010 Rail traffic levels weak, but recovering Industry has significant idle railcar inventory Idle inventory slowly declining Lease rates stabilizing, but at low levels European market also stabilizing Tank car market historically less volatile Freight car market showing early signs of recovery |

| Page 8 Business Profile Rail Specialty ASC Aircraft Tech Venture Assets 0.5 0.14 0.02 0.16 0.11 0.07 Rail Specialty ASC Other Asset Mix 0.83 0.1 0.04 0.03 Rail 83% Specialty 11% Other 2% ASC* 4% $6.2 billion NBV (assets of continuing operations on and off balance sheet) as of 12/31/09 Asset Mix *American Steamship Company $7.2 billion NBV (assets of continuing operations on and off balance sheet) as of 12/31/00 2000 2009 Rail 50% Specialty 14% ASC* 2% Aircraft 16% Tech 11% Venture 7% |
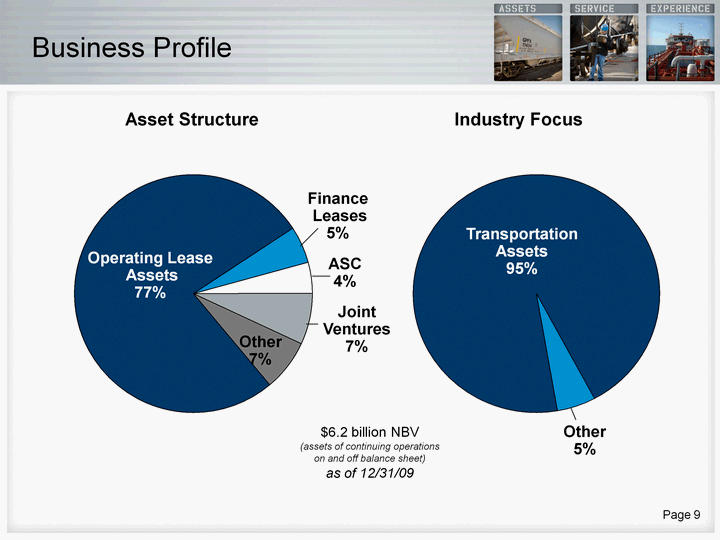
| Page 9 Business Profile Operating Lease Finance Lease ASC Joint Venture Other Assets 0.77 0.05 0.04 0.07 0.07 Transportation Assets Other Industry Focus 0.95 0.05 Operating Lease Assets 77% Finance Leases 5% Other 7% ASC 4% $6.2 billion NBV (assets of continuing operations on and off balance sheet) as of 12/31/09 Transportation Assets 95% Other 5% Asset Structure Industry Focus Joint Ventures 7% |

| Rail Industry |
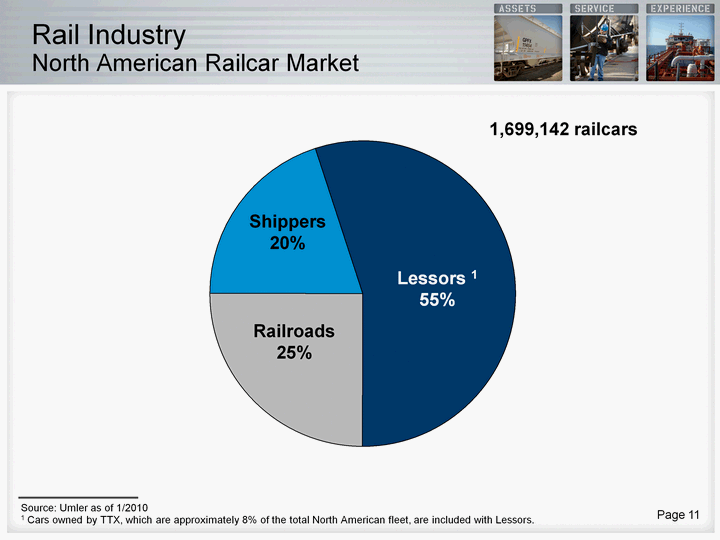
| Page 11 Rail Industry North American Railcar Market Railroads Shippers Lessors Railcars 0.25 0.2 0.55 1,699,142 railcars Lessors 1 55% Railroads 25% Shippers 20% Source: Umler as of 1/2010 1 Cars owned by TTX, which are approximately 8% of the total North American fleet, are included with Lessors. |

| Page 12 Rail Industry North American Fleet Composition Cars are owned by railroads, shippers and lessors Tank cars are owned by lessors such as GATX or shippers who utilize this car type Railroads do not have an ownership presence in tank cars as these cars have more complex service requirements Source: Umler as of 1/2010 (000s of Railcars) Other Intermodal Flat Cars Box Cars Open Top Hoppers Gondolas Tank Cars Covered Hoppers Lessor owned 1689 61174 120129 91450 53849 87525 247167 280053 Shipper owned 1345 1546 4783 5158 59084 73946 69826 117145 Railroad owned 1282 12273 28369 78773 75593 108893 2623 114703 Cars owned by TTX are included with Lessors. |

| Page 13 Source: Association of American Railroads (AAR) Rail Industry Shipment Composition Coal Intermodal Chemicals Autos Farm/Agriculture Food/Kindred Other East 0.24 0.14 0.13 0.06 0.09 0.08 0.26 Key commodity markets for the North American Class I railroads include coal, intermodal, and chemicals The chart at left is based on Class I U.S. revenues; the same chart based on ton miles would show a much higher percentage for coal, reflecting the high-volume, low-cost, long-haul nature of transporting this commodity Based on 2008 Industry Revenues |

| Page 14 Rail Industry Carloading Trends 1996 1997 1998 1999 2000 2001 2002 2003 2004 2005 2006 2007 2008 2009 Q1 '10 Q1 '09 All Commodities 20293 20547 20779 20682 20634 20435 20148 20207 20904 21145 21225 20983 20347 17062 4524 4320 2004-2006 rail traffic was driven by increased demand across most major commodity types Decline in 2007/2008 carloads reflect difficulties in nearly every sector; sharp decline in 4Q'08 Combined U.S. and Canadian carload traffic declined 8.0% in the 4Q09 vs. 4Q08 U.S. chemical and petroleum products carloads decreased 9.6% and 11.1%, respectively, in 2009 Carloadings in 2009 down 16.4% over 2008 Down 19.6% from 2006 peak " ... carload traffic on U.S. railroads at lowest levels since at least 1988, when the AAR's data series began"1 Source: American Association of Railroads (AAR) - Combined U.S. and Canada originated carloads, excluding intermodal Carloads Originated - U.S. & Canada Carloads (000s) 21,225 17,062 4,524 4,320 1 AAR. AAR Reports 2009 Carload Traffic at Lowest Level Since 1988. 13 Jan. 2010. |

| Page 15 Rail Industry Railcar Manufacturing Backlog 1998 1999 2000 2001 2002 2003 2004 2005 2006 2007 2008 2009 2010 Q1 63453 55680 30825 19991 6443 24055 42242 59416 86857 79038 65223 26171 12990 Q2 63120 43456 28176 14452 9281 33383 51446 60544 85692 73911 61573 21558 Q3 69858 36811 26218 11888 14491 31858 61052 60986 88116 67000 52154 19343 Q4 66390 33142 22648 8089 18402 33967 58677 69408 85826 75860 31921 10462 The cyclical nature of the railcar manufacturing industry is reflected in the backlog of railcar orders at the railcar manufacturers High railcar order backlogs in 2006 and 2007 resulted from strong market conditions and speculation in certain car types, particularly for ethanol service Decline in 2008 and 2009 reflects drop in orders due to economic downturn Source: Railway Supply Institute Q1 Q2 Q3 Q4 Q1 Q2 Q3 Q4 Q1 Q2 Q3 Q4 Q1 Q2 Q3 Q4 Q1 Q2 Q3 Q4 Q1 Q2 Q3 Q4 Q1 Q2 Q3 Q4 Number of Cars Q1 Q2 Q3 Q4 Q1 Q2 Q3 Q4 Q1 Q2 Q3 Q4 Q1 Q2 Q3 Q4 Q1 Q2 Q3 Q4 Q1 Q2 Q3 Q4 |

| Rail |

| Page 17 Rail GATX's largest, most valuable franchise One of the largest railcar and locomotive lessors in North America A leading North American tank car lessor Strong market identity Own, manage or have interest in approximately 162,000 railcars worldwide Expanding international presence with approximately 46,000 railcars Service-intensive business Repair, maintenance, training, engineering support Excellent long-term customer relationships Leading service provider to shippers in chemical, petroleum, and food industries Approximately 800 customers with strong credit profile |
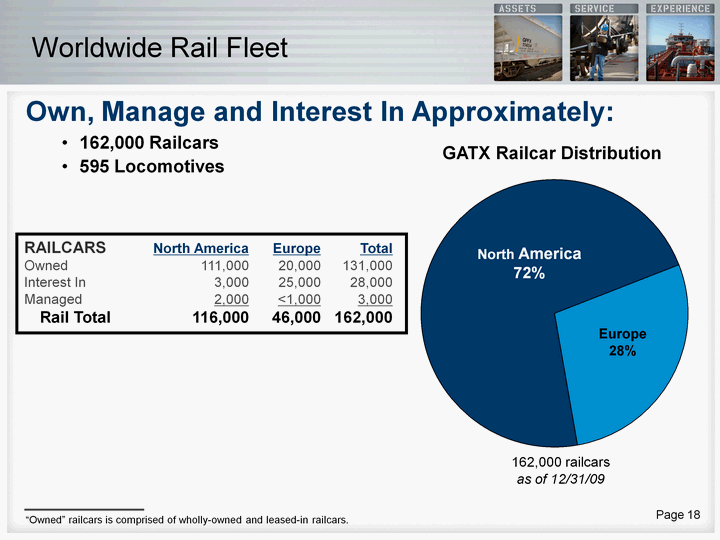
| Page 18 Worldwide Rail Fleet 162,000 Railcars 595 Locomotives North America Europe Railcar distribution 0.72 0.28 162,000 railcars as of 12/31/09 RAILCARS North America Europe Total Owned 111,000 20,000 131,000 Interest In 3,000 25,000 28,000 Managed 2,000 <1,000 3,000 Rail Total 116,000 46,000 162,000 Own, Manage and Interest In Approximately: GATX Railcar Distribution North America 72% Europe 28% "Owned" railcars is comprised of wholly-owned and leased-in railcars. |
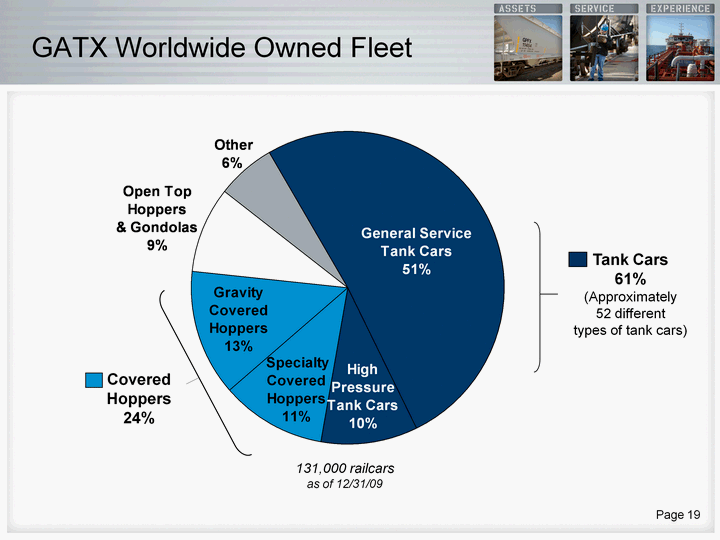
| Page 19 GATX Worldwide Owned Fleet General Service Tank Cars High Pressure Tank Cars Specialty Covered Hoppers Gravity Covered Hoppers Open Top Hoppers Other GATX Worldwide Owned Fleet (excl Spf) 0.51 0.1 0.11 0.13 0.09 0.06 131,000 railcars as of 12/31/09 Tank Cars 61% (Approximately 52 different types of tank cars) Covered Hoppers 24% |

| Page 20 Tank Car Leasing Market North America GATX Union Tank Car GE Railcar Trinity Other East 0.25 0.35 0.12 0.13 0.15 Source: Umler as of 1/2010 Tank Car Leasing North American Market Share |

| Page 21 GATX's Fleet Major Car Types, Industries, Commodities Major Car Types, Industries, Commodities Major Car Types, Industries, Commodities Industries Served Typical Commodities |

| Page 22 Rail Industries Served Chemical Petroleum Food & Agriculture Railroads Other Gross Revenues 0.31 0.31 0.16 0.11 0.11 Car types often serve multiple industry sectors Chemical 31% Petroleum 31% Food & Agriculture 16% Railroads 11% Other 11% Based on 2009 Rail revenues |

| Page 23 Top 20 Top 10 Top 5 Top 1 Worldwide 0.333 0.21 0.123 0.03 Rail has a diverse customer base with approximately 800 customers worldwide Top 20 Customer Families: Revenue Contribution as % Total Revenue as of 12/31/09 Rail Worldwide Top Customers AAA & AA A BBB BBB or < NR/Private Top 50 Customers 0.08 0.2 0.28 0.18 0.26 Top 50 Customer Families Not Rated/ Private 26% AAA & AA 8% A 20% BBB 28% BB or < 18% Note: Customer families sometimes include more than one customer account. Therefore, the S&P ratings noted generally reflect the credit quality of the rated parent entity. Lease obligations of subsidiaries are not necessarily guaranteed by the rated parent entity. |
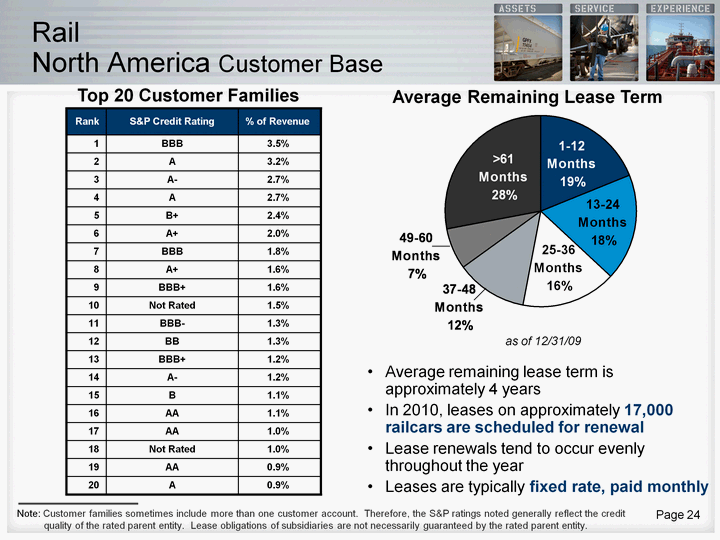
| Page 24 Rail North America Customer Base North America Customer Base North America Customer Base Note: Customer families sometimes include more than one customer account. Therefore, the S&P ratings noted generally reflect the credit quality of the rated parent entity. Lease obligations of subsidiaries are not necessarily guaranteed by the rated parent entity. as of 12/31/09 AAA & AA 8% Top 20 Customer Families 1-12 Months 13-24 Months 25-36 Months 37-48 Months 49-60 Months >61 Months Worldwide 0.19 0.18 0.16 0.12 0.07 0.28 Average Remaining Lease Term Average remaining lease term is approximately 4 years In 2010, leases on approximately 17,000 railcars are scheduled for renewal Lease renewals tend to occur evenly throughout the year Leases are typically fixed rate, paid monthly |

| Page 25 Rail Customer Stability Customer Stability Customer Stability GATX's commitment to the industry and extensive experience has led to stable and long-standing customer relationships that serve as the backbone of our business Customers demand that their railcar provider be committed to providing excellent service, possess a breadth and depth of knowledge, and that they be responsive and flexible The table at left shows the date of the first lease contract for each of GATX's 2009 top ten rail customers worldwide The average relationship tenure among this group is 44 years Reflects current/predecessor companies |
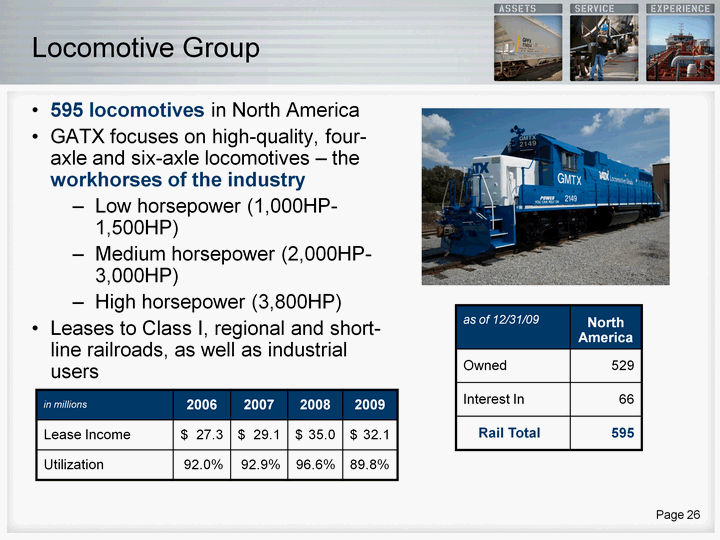
| Page 26 Locomotive Group 595 locomotives in North America GATX focuses on high-quality, four- axle and six-axle locomotives - the workhorses of the industry Low horsepower (1,000HP- 1,500HP) Medium horsepower (2,000HP- 3,000HP) High horsepower (3,800HP) Leases to Class I, regional and short- line railroads, as well as industrial users users users users users users users users users users users users users as of 12/31/09 as of 12/31/09 in millions 2006 2007 2008 2009 Lease Income $ 27.3 $ 29.1 $ 35.0 $ 32.1 Utilization 92.0% 92.9% 96.6% 89.8% |
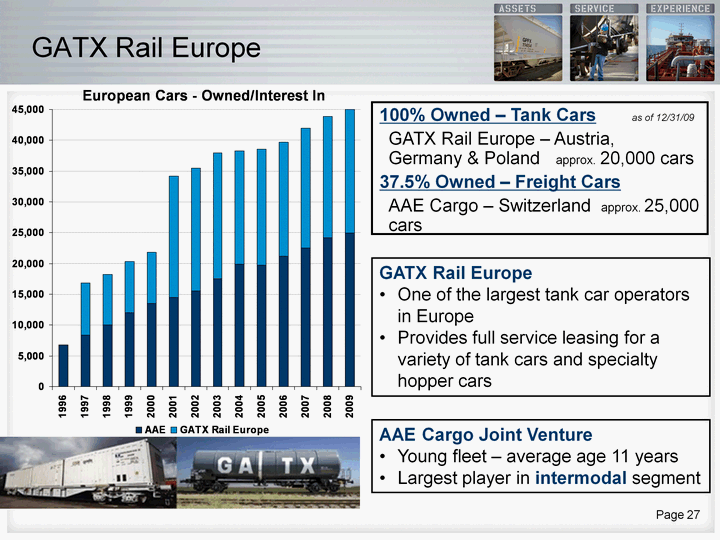
| Page 27 100% Owned - Tank Cars as of 12/31/09 GATX Rail Europe - Austria, Germany & Poland approx. 20,000 cars 37.5% Owned - Freight Cars AAE Cargo - Switzerland approx. 25,000 cars 1996 1997 1998 1999 2000 2001 2002 2003 2004 2005 2006 2007 2008 2009 AAE 6800 8400 10000 12000 13500 14500 15500 17500 19880 19724 21220 22523 24129 24976 GATX Rail Europe 8400 8249 8287 8335 19688 20000 20396 18446 18854 18471 19435 19724 20033 AAE Cargo Joint Venture Young fleet - average age 11 years Largest player in intermodal segment GATX Rail Europe GATX Rail Europe One of the largest tank car operators in Europe Provides full service leasing for a variety of tank cars and specialty hopper cars |

| Page 28 GATX Rail Europe Length of leases tend to be shorter than U.S., but renewal success is high European tank car marketplace comprised of three large participants and many small players Source: GATX Rail Europe (Wholly-Owned Rail Fleet: Tank Cars) in millions 2006 2007 2008 2009 Lease Income $ 108.0 $ 131.4 $ 153.7 $142.8 GATX VTG Ermewa Other Tank Car Market Share 0.22 0.36 0.14 0.28 *GATX management estimate European Tank Car Leasing Market* GATX Rail Europe' Fleet Utilization |

| Page 29 GATX Rail Europe Markets Served Germany Poland Austria Hungary Switzerland Romania Benelux Slovakia Czech Republic Other Rail Europe Revenue 34 24 14 6 6 3 2 2 2 7 Source: GATX Rail Europe (Wholly-Owned Rail Fleet: Tank Cars, based on 2009 revenue) Germany 34% |

| Page 30 GATX Rail Europe Products Carried in Tank Cars Mineral Oil* Chemical LPG Other Car Type 74 9 10 7 Source: GATX Rail Europe (Wholly-Owned Rail Fleet: Tank Cars, based on # of cars at 12/31/09) *Mineral Oil = light and dark petroleum products Mineral Oil* 74% Chemical 9% LPG 10% Other 7% |

| Page 31 Capitalizing on Market Environment GATX recognized the strength of the market in prior years GATX proactively used market strength to position itself to manage through and capitalize on a downturn Extended lease terms at attractive rates Scrapped/sold certain railcar types at high scrap/asset prices Limited advanced/speculative railcar orders in high asset cost environment As a result, GATX is uniquely situated to strengthen its position during the downturn |
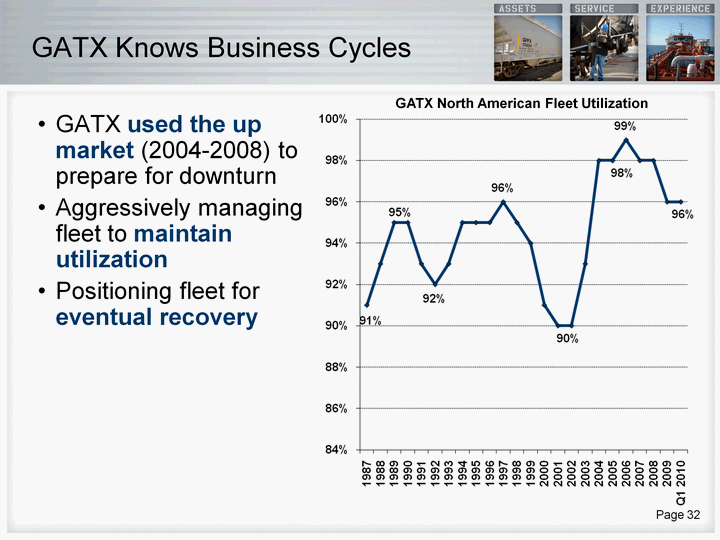
| Page 32 GATX Knows Business Cycles GATX used the up market (2004-2008) to prepare for downturn Aggressively managing fleet to maintain utilization Positioning fleet for eventual recovery GATX North American Fleet Utilization |

| Page 33 GATX Capitalized on Strong Market 2004 2005 2006 2007 2008 2009 2010 Exposed Cars 21000 23000 20000 20000 17500 15000 17000 Renewal Months 41 50 64 67 63 41 Actively Extended Renewal Terms to Reduce Cars Exposed Approximate Number of Exposed Cars Renewal Months North American Fleet LPI = Lease Price Index Rate changes measures % change from expiring lease rate to new lease rate on railcar renewals |

| Page 34 Capitalized on Strong Market Captured High Lease Rates The GATX Lease Price Index (LPI) is an internally generated business indicator that measures general lease rate pricing on renewals within Rail's North American railcar fleet The LPI reflects the weighted average lease rate for a select group of railcar types that GATX believes to be representative of its overall North American fleet The LPI renewal rate change measures the percentage (%) change between the weighted average renewal lease rate and the weighted average expiring lease rate rate rate rate rate rate rate rate rate rate rate rate rate rate rate rate rate |

| Page 35 Capitalized on Strong Market Optimized Fleet, Limited Orders Optimized Fleet, Limited Orders Optimized Fleet, Limited Orders 2010 2011 2012 Total Committed Railcar Orders (# of cars) 75 --- --- 75 Options --- --- --- --- Total 75 --- --- 75 Sold and scrapped less optimal cars at record prices ... ... and refrained from placing speculative orders at record prices |
| Page 36 Rail Current Focus Tactical Focus on utilization Control maintenance costs Constant customer dialogue Strategic - opportunities amidst challenges Fleet acquisitions New car order(s) as appropriate Asset management |

| Page 37 Rail Competitive Strengths GATX has built and maintained a strong market position by focusing on full-service leasing What do we mean by "full service"? |

| Page 38 Rail Competitive Strengths GATX provides the expertise, knowledge and services essential to our customers Maintenance Engineering Training |

| Page 39 Rail Maintenance Network Maintaining railcars and locomotives is a necessary and complicated process; customers rely on GATX to manage this maintenance process In North America, GATX owns a network of Seven (7) full-scale maintenance facilities Six (6) customer site locations Six (6) fast track service centers and 20 mobile service units GATX also works with a number of preferred third-party service providers throughout North America In Europe, GATX has major service centers in Germany and Poland as well as a customer site location in Poland In 2009, GATX performed an aggregate of 80,000 service events in its owned and third-party maintenance network in North America |

| Page 40 Rail Maintenance Services GATX handles every aspect of railcar maintenance, from routine service to complex railcar overhauls and retrofits GATX utilizes the latest in railcar maintenance equipment technology, including non-destructive testing inspection equipment, high-capacity overhead crane systems, environmentally-compliant paint spray booths with plural component spray equipment, and closed loop cleaning systems Sample services include: Regulatory compliance work Rebuilds Lining repairs Safety valve/coil testing Air brake system maintenance Insulation inspection |

| Page 41 Rail Engineering GATX's rail engineering team, comprised of experienced mechanical, structural, and chemical engineers, is constantly communicating with the customer base Each customer faces a unique set of transportation challenges. Railcar needs change based on factors such as a customer's commodity focus or the location and layout of their manufacturing facilities GATX's engineers draw on decades of experience to identify solutions that are tailored for each customer |

| Page 42 Training Signing a full-service lease is the starting point for GATX's long-term relationships with its customers GATX's service offering goes beyond maintenance and engineering to include ongoing training for customers. Since customers are the operators of the railcars, they need to be well-versed in the equipment and related regulations GATX offers rail customer training, both at Company headquarters and through its "TankTrainer" mobile classroom. This rolling classroom is in use year-round at customer facilities across North America |

| Specialty |
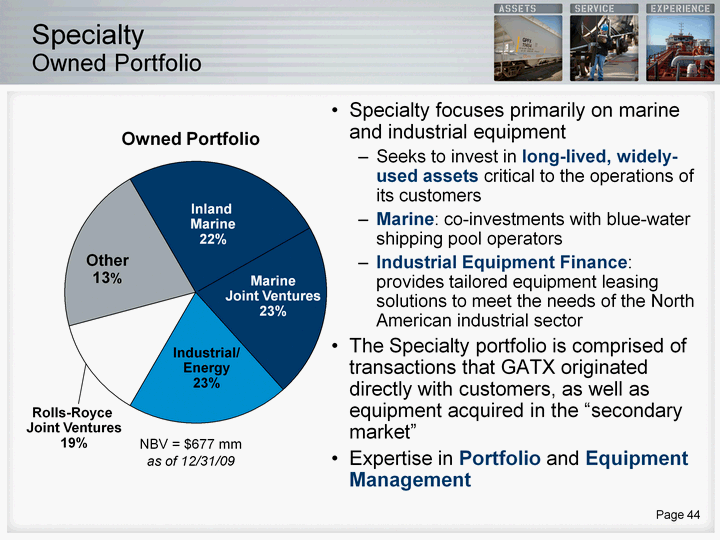
| Page 44 Specialty Owned Portfolio Marine Industrial Equipment Aircraft Engines Other Specialty Owned Portfolio 0.49 0.21 0.131428571428571 0.22 Specialty focuses primarily on marine and industrial equipment Seeks to invest in long-lived, widely- used assets critical to the operations of its customers Marine: co-investments with blue-water shipping pool operators Industrial Equipment Finance: provides tailored equipment leasing solutions to meet the needs of the North American industrial sector The Specialty portfolio is comprised of transactions that GATX originated directly with customers, as well as equipment acquired in the "secondary market" Expertise in Portfolio and Equipment Management NBV = $677 mm as of 12/31/09 Owned Portfolio Industrial/ Energy 23% Rolls-Royce Joint Ventures 19% Inland Marine 22% Other 13% Marine Joint Ventures 23% |

| Page 45 Marine GATX has invested in "blue water" (ocean-going) marine vessels for over 20 years GATX partners with leading ship owners and operators to invest in existing and new-build vessels |

| Page 46 Marine Blue Water Joint Ventures Partners are leading ship owners and operators with decades of shipping experience, reputations for outstanding service, and shared investment philosophy Our jointly-owned vessels are a small part of the overall pool of vessels operated by our partners Overlap with GATX's rail customers - major international manufacturing and industrial firms Products Carried: Bulk carriers ("handy size"): Steel Products, Grain, Pet Coke, Alumina, Cement, Fertilizer, Forestry Products, Coal Chemical parcel tankers: Methanol, Styrene, Benzene, P-xylene, Ethylene Glycol, MBTE, Palm Oil, Soybean Oil, Sunflower Oil, Rapeseed Oil, Caustic Soda, Lubricating Oils, Molasses LPG/E/LNG or Multi-gas carriers: LPG, Ethylene, Propylene, Butadiene, Vinyl Chloride Monomer, Isoprene, Butylene, Anhydrous Ammonia Isoprene, Butylene, Anhydrous Ammonia Isoprene, Butylene, Anhydrous Ammonia Isoprene, Butylene, Anhydrous Ammonia Isoprene, Butylene, Anhydrous Ammonia Isoprene, Butylene, Anhydrous Ammonia Isoprene, Butylene, Anhydrous Ammonia Isoprene, Butylene, Anhydrous Ammonia Isoprene, Butylene, Anhydrous Ammonia Isoprene, Butylene, Anhydrous Ammonia Isoprene, Butylene, Anhydrous Ammonia Isoprene, Butylene, Anhydrous Ammonia Isoprene, Butylene, Anhydrous Ammonia as of 12/31/09 * The first vessel was delivered in January 2010. Delivery of the remaining vessels will be completed by the middle of 2011. |
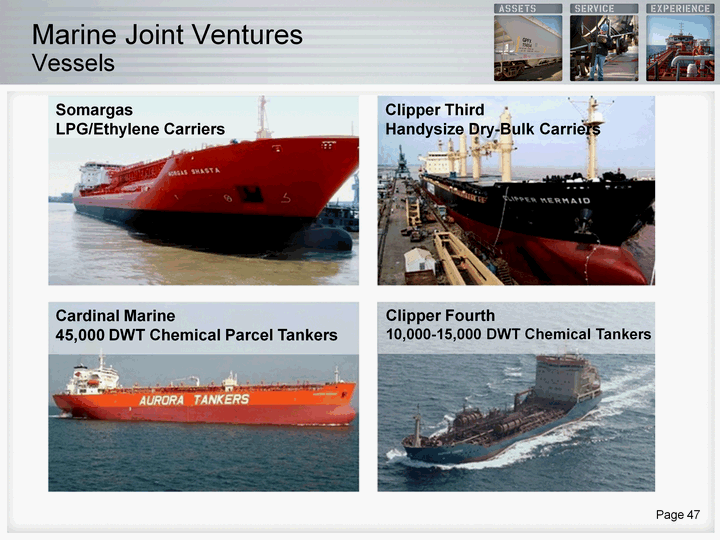
| Page 47 Marine Joint Ventures Vessels Cardinal Marine 45,000 DWT Chemical Parcel Tankers Somargas LPG/Ethylene Carriers Clipper Third Handysize Dry-Bulk Carriers Clipper Fourth 10,000-15,000 DWT Chemical Tankers |
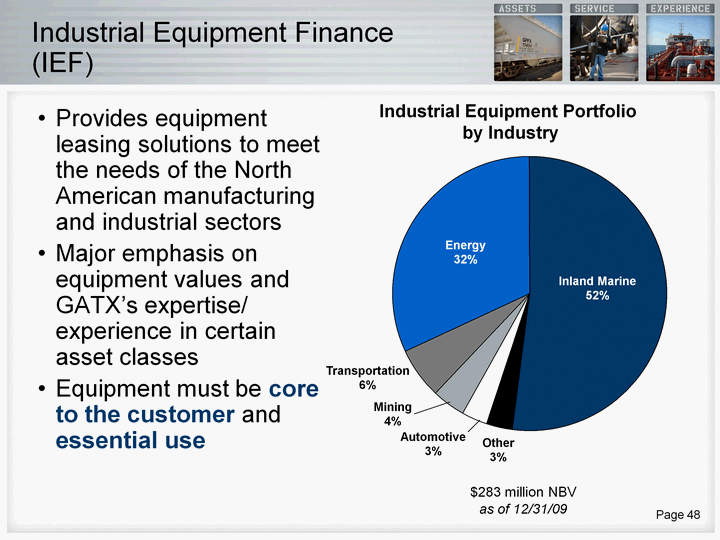
| Inland Marine Other Production Automotive Mining Transportation Energy Transaction Volume 0.52 0.03 0.03 0.04 0.06 0.32 Page 48 Industrial Equipment Finance (IEF) Provides equipment leasing solutions to meet the needs of the North American manufacturing and industrial sectors Major emphasis on equipment values and GATX's expertise/ experience in certain asset classes Equipment must be core to the customer and essential use Inland Marine 52% Transportation 6% Automotive 3% Mining 4% Other 3% $283 million NBV as of 12/31/09 Industrial Equipment Portfolio by Industry Energy 32% |

| Page 49 Rolls-Royce & Partners Finance Aircraft Engine Leasing Rolls-Royce and Partners Finance Limited (RRPF) was established in 1989 as a joint venture by Rolls-Royce PLC; GATX became 50/50 partner in 1998 One of the largest spare engine portfolios in the industry Approximately 350 aircraft engines, comprised of all Rolls-Royce and IAE types RRPF provides high levels of technical, financial and leasing expertise in the market Through RRPF, Rolls-Royce was one of the first Original Equipment Manufacturers (OEMs) to provide dedicated, long-term, spare engine leasing options The Trent 700 powers the Airbus A330 The Trent 800 powers the Boeing 777 |

| Page 50 Specialty Managed Portfolio GATX leverages its asset expertise and infrastructure by managing portfolios of assets for third-party owners Management activities include re- leasing initiatives, asset sales, advisory services, and back-office functions GATX is paid a management fee while also typically retaining a "residual interest" when an asset is sold; the higher the sale price, the greater the residual sharing income for GATX GATX has no investment in the managed portfolio Rail Aircraft Power Managed Portfolio 0.39 0.15 0.46 Managed Portfolio NBV = $252 million as of 12/31/09 Rail 42% Aircraft 12% Power 46% |

| American Steamship Company |

| Page 52 American Steamship Company (ASC) ASC provides transportation of dry-bulk commodities on the Great Lakes including iron ore, coal, and limestone aggregates ASC has been operating on the Great Lakes for more than 100 years, joining GATX in 1973 Fleet of 18 self-unloading vessels Range in length from 635 feet to 1,000 feet Single trip vessel carrying capacity ranges from 23,800 to 80,900 gross tons Unloading speeds range from 7,000 to 10,000 net tons per hour No shore side assistance required; can operate 24 hours a day, seven days a week Composition of fleet enhances ability to meet varying levels of demand on the Great Lakes |

| Page 53 ASC Market 2002 2003 2004 2005 2006 2007 2008 2009 U.S.-Flag Cargo Carriage - Net Tons 101.5 94.7 111.3 107.7 109.7 104 100.9 66 The largest consumers of the cargos carried by U.S.-Flag Great Lakes vessels are the steel mills The Great Lakes states account for more than 70% of the nation's steelmaking capacity Limestone is used by the steel and construction industries Coal is transported to power generating facilities along all five Great Lakes U.S.-Flag Dry-Bulk Cargo Carriage Net Tons (millions) Source: Lake Carriers' Association 2007 ASC Interlake Great Lakes Fleet, Inc. Grand River Navigation Central Marine Logistics K&K Integrated Van Enkevort Tug and Barge All Other ASC Commodities Carried - Net Tons 0.39 0.21 0.18 0.08 0.07 0.04 0.02 0.01 ASC 39% Interlake Steamship Company 21% Great Lakes Fleet, Inc. 18% All Other 1% Industry Total Annual Capacity 106 Million Net Tons Central Marine Logistics 7% Grand River Navigation 8% VanEnkevort Tug and Barge 2% Capacity of U.S.-Flag Vessel Operators KK Integrated 4% |

| Page 54 ASC Market 2006 Iron Ore Coal Limestone Aggregates Other ASC Commodities Carried - Net Tons 0.39 0.48 0.1 0.03 2008 Steel Electric Utility Construction Other ASC Commodities Carried - Net Tons 0.38 0.47 0.08 0.07 ASC Commodities Carried 2009 Iron Ore 39% Coal 48% Limestone Aggregates 10% Other 3% 21 million net tons ASC Industries Served 2009 Steel 38% Electric Utility 47% Construction 8% Other 7% |
| Page 55 ASC Industry Overview Industry environment is mature Long-lived assets; 2 non-ASC vessels operating since 1929 High barriers to entry; estimated cost for new 1000' vessel is $100 million Customer base is highly concentrated Top 5 customers = 73% total ASC revenue Market is primarily driven by integrated steel producers Sailing season generally runs from April 1 to December 31 |

| Page 56 ASC Great Lakes Trade Patterns Great Lakes Trade Patterns Great Lakes Trade Patterns Great Lakes Trade Patterns Great Lakes Trade Patterns Great Lakes Trade Patterns Great Lakes Trade Patterns Great Lakes Trade Patterns Great Lakes Trade Patterns |

| Page 57 ASC Fleet With the most versatile fleet operating on the Great Lakes, ASC is well positioned to manage its fleet to meet changing demand levels in 2010 |

| Financial Highlights |

| Page 59 Financial Profile Overview Stable cash flow and contracted revenue Market leader in the railcar leasing business Credit strength of underlying customer base Access to capital is solid and well diversified Financial ratios are strong Limited capital expenditure commitments Investments will be opportunistic Focused on disciplined investment and maintaining a strong balance sheet |
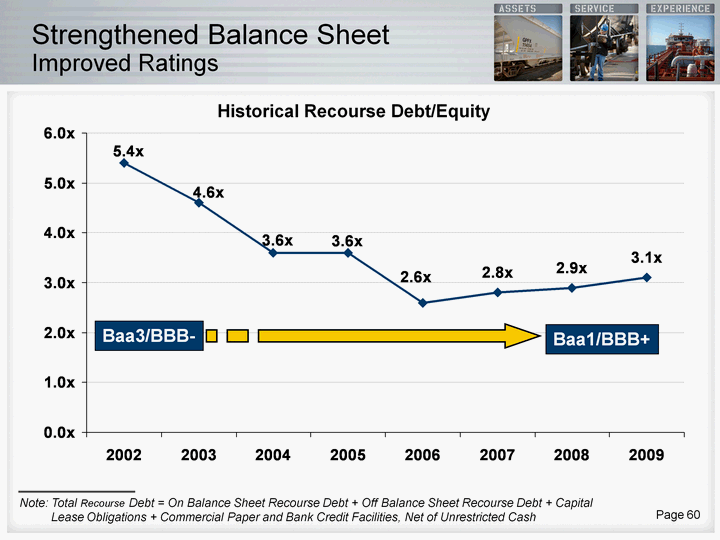
| Page 60 Strengthened Balance Sheet Improved Ratings 2002 2003 2004 2005 2006 2007 2008 2009 Recourse Leverage 5.4 4.6 3.6 3.6 2.6 2.8 2.9 3.1 Note: Total Recourse Debt = On Balance Sheet Recourse Debt + Off Balance Sheet Recourse Debt + Capital Lease Obligations + Commercial Paper and Bank Credit Facilities, Net of Unrestricted Cash Historical Recourse Debt/Equity Baa3/BBB- Baa1/BBB+ |
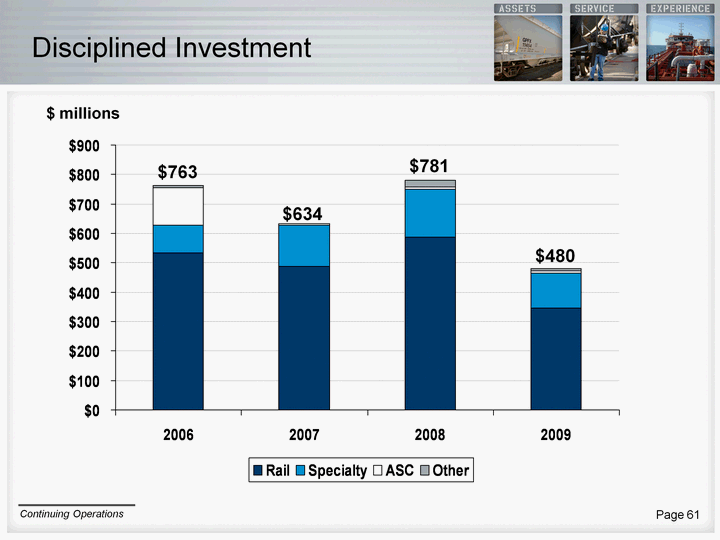
| Page 61 Disciplined Investment 2006 2007 2008 2009 Rail 534 487 587 345 Specialty 94 141 163 120 ASC 128 4 8 7 Other 7 2 23 8 $ millions $763 $634 $781 $480 Continuing Operations |

| Page 62 Financial Profile Strong Operating Cash Flow And Portfolio Proceeds 2004 2005 2006 2007 2008 2009 Operating Cash Flow 210 197 293 340 364 265 Portfolio Proceeds 308 167 123 247 156 68 $ millions Continuing Operations |

| Page 63 Financial Profile Strong Committed Cash Flows 2010 2011 2012 2013 2014 Thereafter East 792.3 614.9 452.1 330.1 244.4 734.9 as of 12/31/09 $3.2 billion in minimum future lease receipts $ millions |

| Page 64 Financial Profile Future Debt Obligations Q2 2010 Q3 2010 Q4 2010 Q1 2011 Q2 2011 Q3 2011 Q4 2011 Q1 2012 Q2 2012 Q3 2012 Q4 2012 Q1 2013 Q2 2013 Q3 2013 Q4 2013 Q1 2014 Q2 2014 Q3 2014 Q4 2104 Thereafter Debt 243.124 5.73 44.144 26.731 193.642 53.409 26.693 255.648 70.713 10.051 395.178 54.727 78.945 4.787 195.525 53.977 383.761 2.666 17.442 876.008 $ millions GATX's debt maturity schedule is moderate and manageable as of 3/31/10 |

| Page 65 Summary GATX has consistently been a market force for 112 years Experienced in every operating cycle and market environment Credit profile is attractive Strategic actions taken throughout business cycles stabilized fleet performance and reduced volatility Actively pursuing investment opportunities in a disciplined manner |

| GATX Financial Review For detailed financial information, please see the Supplemental Financial Information contained in the Investor Relations section of www.gatx.com |