GATX Corporation Company and Industry Profile April 2013 Unless otherwise noted, GATX is the source for data provided

NYSE:GMT Forward-Looking Statements Certain statements in this document may constitute forward-looking statements within the meaning of Section 27A of the Securities Act of 1933, as amended, and Section 21E of the Securities Exchange Act of 1934, as amended, and are subject to the safe harbor provisions of those sections and the Private Securities Litigation Reform Act of 1995. These statements refer to information that is not purely historical, such as estimates, projections and statements relating to our business plans, objectives and expected operating results, and the assumptions on which those statements are based. Some of these statements may be identified by words like “anticipate,” “believe,” “estimate,” “expect,” “intend,” “plan,” “predict,” “project” or other similar words. Investors are cautioned that any such forward-looking statements are not guarantees of future performance and involve risks and uncertainties, including those described in GATX’s Annual Report on Form 10-K/A for the year ended December 31, 2012 and other filings with the SEC, and that actual results or events may differ materially from the forward-looking statements. Specific risks and uncertainties that might cause actual results to differ from expectations include, but are not limited to, (1) general economic, market, regulatory and political conditions affecting the rail, marine and other industries served by GATX and its customers; (2) competitive factors in GATX’s primary markets, including lease pricing and asset availability; (3) lease rates, utilization levels and operating costs in GATX’s primary operating segments; (4) conditions in the capital markets or changes in GATX’s credit ratings and financing costs; (5) risks related to GATX’s international operations and expansion into new geographic markets; (6) risks related to compliance with, or changes to, laws, rules and regulations applicable to GATX and its rail, marine and other assets; (7) operational disruption and costs associated with compliance maintenance programs and other maintenance initiatives; (8) operational and financial risks associated with long-term railcar purchase commitments; (9) changes in loss provision levels within GATX’s portfolio; (10) conditions affecting certain assets, customers or regions where GATX has a large investment; (11) impaired asset charges that may result from changing market conditions or portfolio management decisions implemented by GATX; (12) opportunities for remarketing income; (13) labor relations with unions representing GATX employees; and (14) the outcome of pending or threatened litigation. Given these risks and uncertainties, readers are cautioned not to place undue reliance on these forward-looking statements, which reflect management’s analysis, judgment, belief or expectation only as of the date hereof. GATX has based these forward-looking statements on information currently available and disclaims any intention or obligation to update or revise these forward-looking statements to reflect subsequent events or circumstances. 2
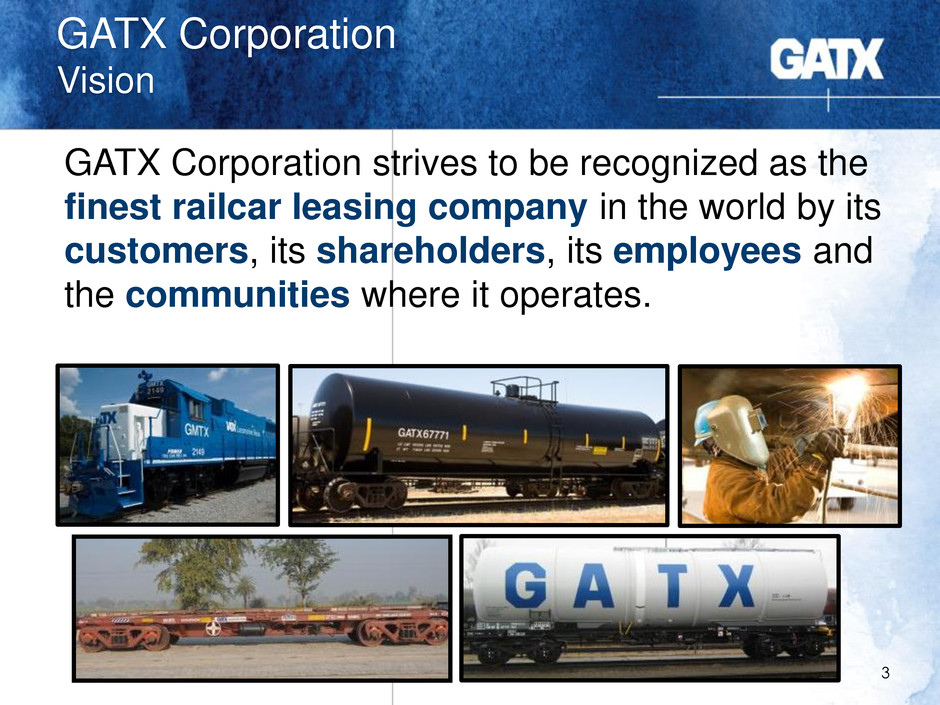
GATX Corporation Vision GATX Corporation strives to be recognized as the finest railcar leasing company in the world by its customers, its shareholders, its employees and the communities where it operates. 3

GATX Corporation History 4 • Founded as a railcar lessor 1898 • Listed on the NYSE 1916 • Initiated quarterly dividends • Paid without interruption ever since • Increased 3.3% in January 2013 to $1.24 annualized 1919 Railcar leasing remains the foundation of GATX
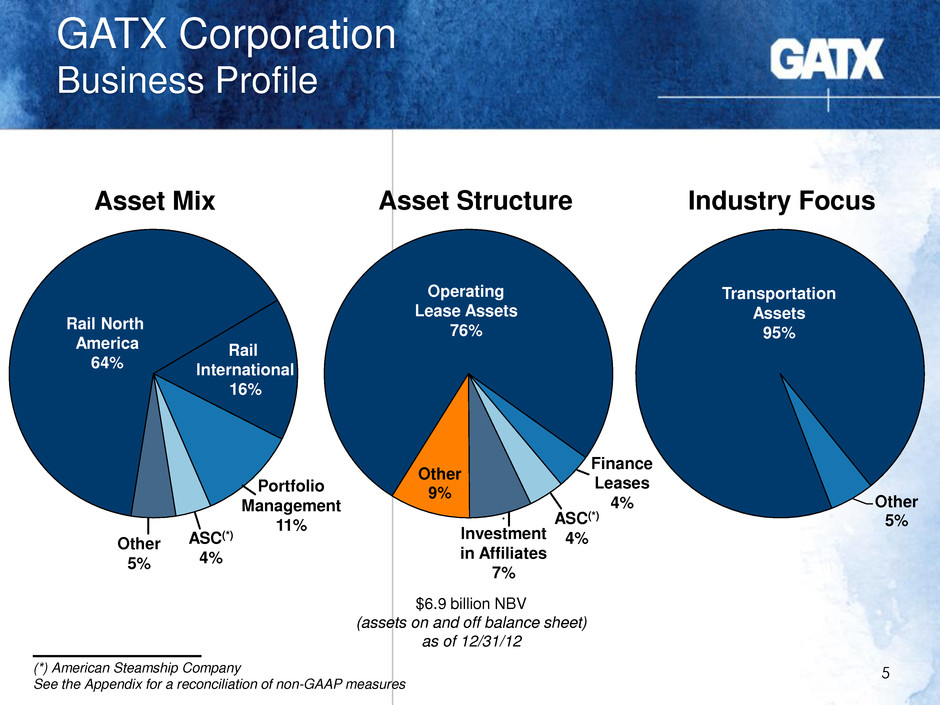
(*) American Steamship Company See the Appendix for a reconciliation of non-GAAP measures Asset Mix Rail North America 64% Rail International 16% GATX Corporation Business Profile 5 Other 9% Asset Structure Other 5% Industry Focus $6.9 billion NBV (assets on and off balance sheet) as of 12/31/12 Portfolio Management 11% ASC(*) 4% Other 5% Operating Lease Assets 76% Investment in Affiliates 7% ASC(*) 4% Finance Leases 4% Transportation Assets 95%
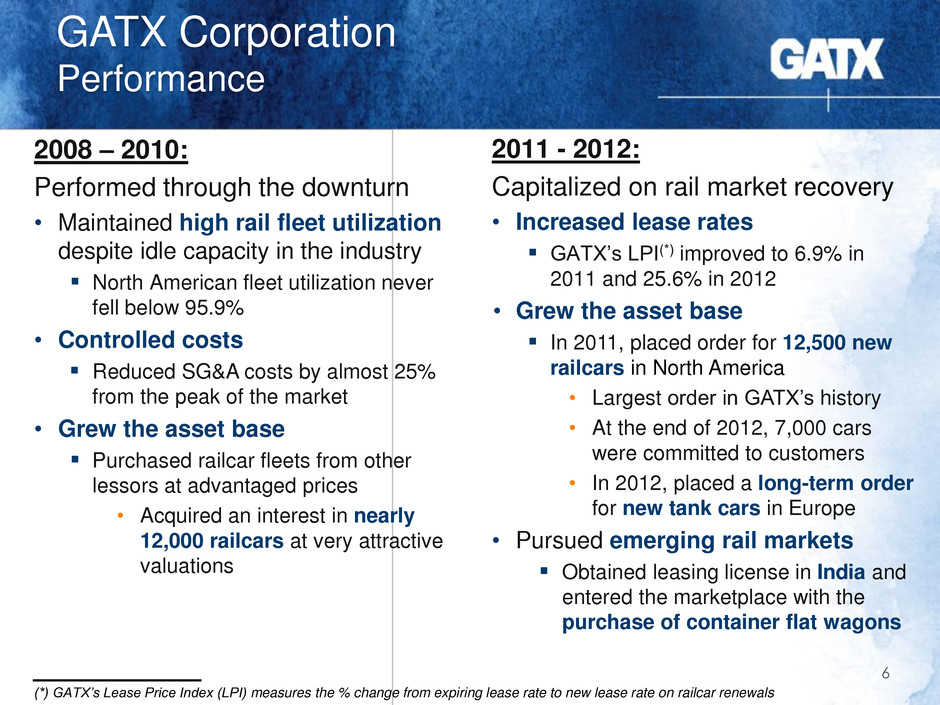
2011 - 2012: Capitalized on rail market recovery • Increased lease rates GATX’s LPI(*) improved to 6.9% in 2011 and 25.6% in 2012 • Grew the asset base In 2011, placed order for 12,500 new railcars in North America • Largest order in GATX’s history • At the end of 2012, 7,000 cars were committed to customers • In 2012, placed a long-term order for new tank cars in Europe • Pursued emerging rail markets Obtained leasing license in India and entered the marketplace with the purchase of container flat wagons 6 2008 – 2010: Performed through the downturn • Maintained high rail fleet utilization despite idle capacity in the industry North American fleet utilization never fell below 95.9% • Controlled costs Reduced SG&A costs by almost 25% from the peak of the market • Grew the asset base Purchased railcar fleets from other lessors at advantaged prices • Acquired an interest in nearly 12,000 railcars at very attractive valuations GATX Corporation Performance (*) GATX’s Lease Price Index (LPI) measures the % change from expiring lease rate to new lease rate on railcar renewals
North American Rail Industry

North American Railcar Market Railroads 24% North American Railcar Ownership Railcars are owned by lessors, railroads and shippers 8 Source: Umler as of Jan-13 (*) Cars owned by TTX, representing about 9% of the total North American fleet, are included with Lessors Lessors(*) 57% Shippers 19% Approximately 1.6 million railcars • Car ownership by railroads has been declining In 2000, 53% of railcars were owned by railroads In 2012, 24% of railcars were owned by railroads

North American Railcar Ownership 9 0 50 100 150 200 250 300 350 400 450 500 550 Other Intermodal Box Cars Flat Cars Open Top Hoppers Gondolas Tank Cars Covered Hoppers Lessor owned (*) Shipper owned Railroad owned 000s of railcars • Tank cars are owned by lessors such as GATX or shippers who utilize this car type • Railroads do not have an ownership presence in tank cars as these cars have more complex service requirements North American Fleet Composition Source: Umler as of Jan-13 * Cars owned by TTX are included with Lessors
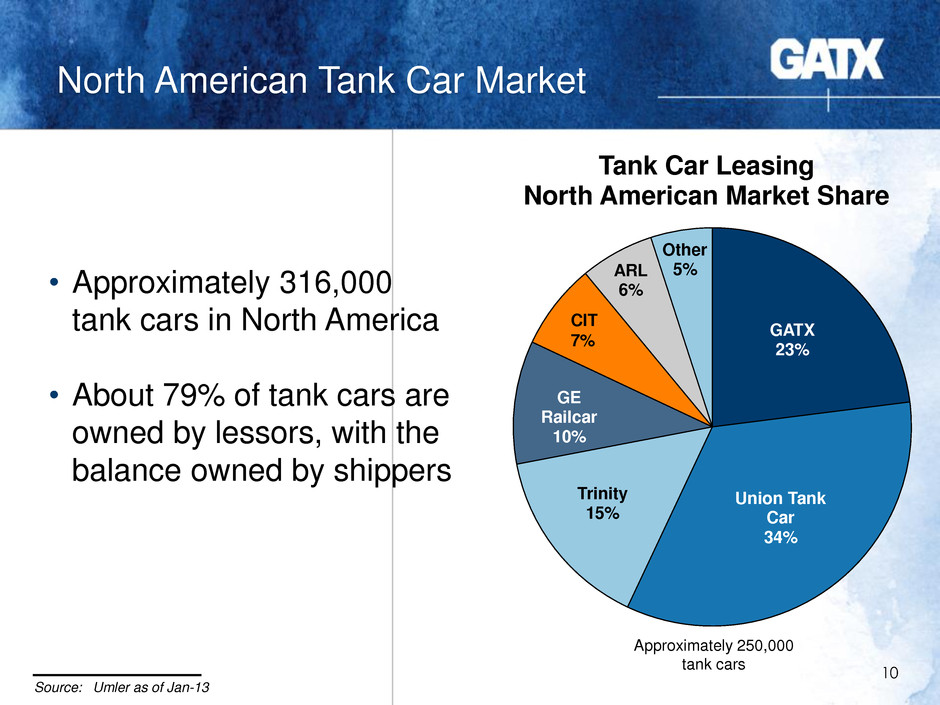
• Approximately 316,000 tank cars in North America • About 79% of tank cars are owned by lessors, with the balance owned by shippers North American Tank Car Market 10 GATX 23% Union Tank Car 34% GE Railcar 10% Trinity 15% ARL 6% Other 5% Tank Car Leasing North American Market Share Source: Umler as of Jan-13 Approximately 250,000 tank cars CIT 7%

North American Rail Shipments 11 Coal 25% Auto 6% Other 25% Farm/ Agriculture 9% Food/ Kindred 8% • Key commodity markets for North American Class I railroads include Coal Chemicals Intermodal • The chart at the left is based on Class I U.S. revenues The same chart based on tons originated would show a much higher percentage for coal, reflecting the high-volume, long-haul nature of transporting this commodity Shipment Composition Based on 2011 Industry Revenues approximately $65.3 billion Source: Association of American Railroads; Jan-13 Chemicals 14% Intermodal 13%
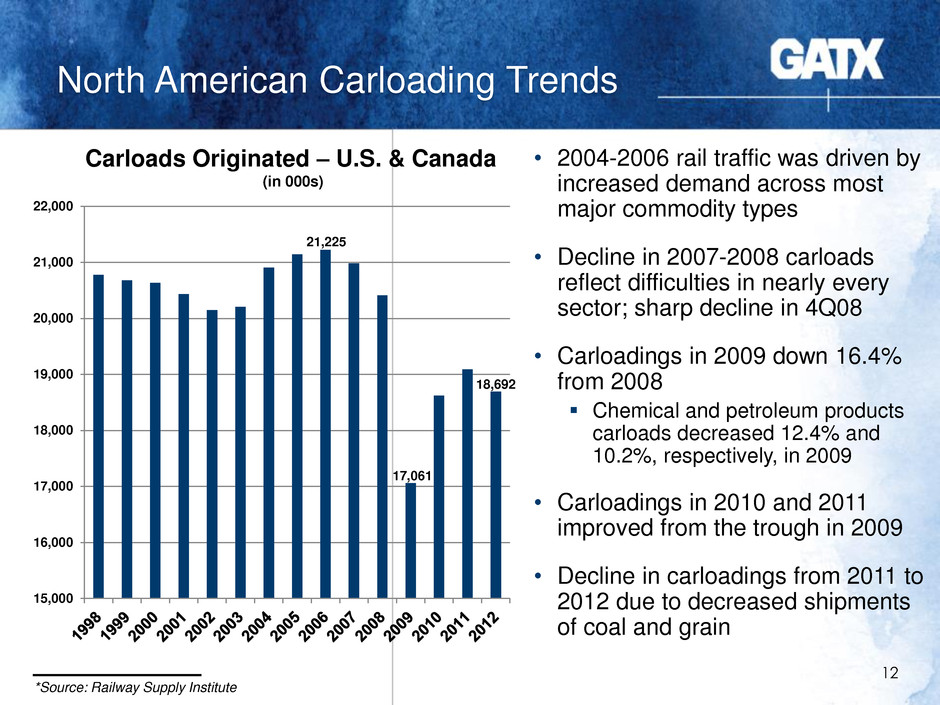
North American Carloading Trends 12 15,000 16,000 17,000 18,000 19,000 20,000 21,000 22,000 17,061 • 2004-2006 rail traffic was driven by increased demand across most major commodity types • Decline in 2007-2008 carloads reflect difficulties in nearly every sector; sharp decline in 4Q08 • Carloadings in 2009 down 16.4% from 2008 Chemical and petroleum products carloads decreased 12.4% and 10.2%, respectively, in 2009 • Carloadings in 2010 and 2011 improved from the trough in 2009 • Decline in carloadings from 2011 to 2012 due to decreased shipments of coal and grain Carloads Originated – U.S. & Canada *Source: Railway Supply Institute 21,225 18,692 (in 000s)
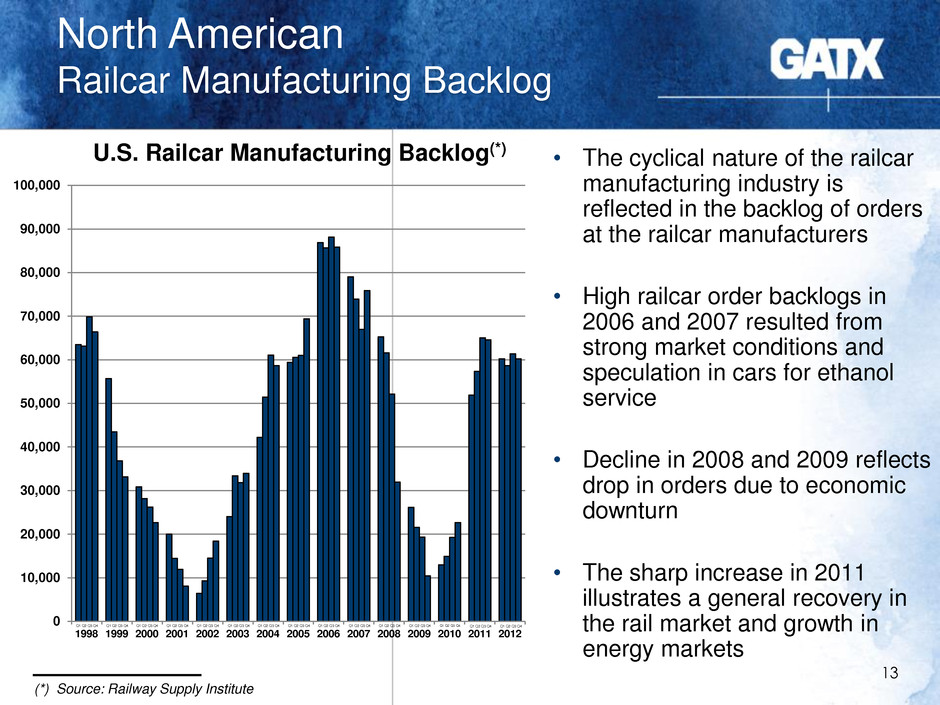
0 10,000 20,000 30,000 40,000 50,000 60,000 70,000 80,000 90,000 100,000 1998 1999 2000 2001 2002 2003 2004 2005 2006 2007 2008 2009 2010 2011 2012 Q1 Q2 Q3 Q4 North American Railcar Manufacturing Backlog 13 U.S. Railcar Manufacturing Backlog(*) • The cyclical nature of the railcar manufacturing industry is reflected in the backlog of orders at the railcar manufacturers • High railcar order backlogs in 2006 and 2007 resulted from strong market conditions and speculation in cars for ethanol service • Decline in 2008 and 2009 reflects drop in orders due to economic downturn • The sharp increase in 2011 illustrates a general recovery in the rail market and growth in energy markets (*) Source: Railway Supply Institute Q1 Q2 Q3 Q4 Q1 Q2 Q3 Q4 Q1 Q2 Q3 Q4 Q1 Q2 Q3 Q4 Q1 Q2 Q3 Q4 Q1 Q2 Q3 Q4 Q1 Q2 Q3 Q4 Q1 Q2 Q3 Q4 Q1 Q2 Q3 Q4 Q1 Q2 Q3 Q4 Q1 Q2 Q3 Q4 Q1 Q2 Q3 Q4 Q1 Q2 Q3 Q4 Q1 Q2 Q3 Q4
GATX Worldwide Railcar Fleet

Railcar Leasing 15 • New and used • Consider car type, potential markets and customers served, timing of purchase and price Buy long-lived assets • Repeatedly, maintaining high utilization • Top-tier customer base • Useful life of a railcar in excess of 30 years • Average remaining lease term of North American railcar fleet is approximately 4 years Lease to customers • More than 80,000 service events each year in North America Maintain to the highest standards • Fleet optimization Scrap or Sell
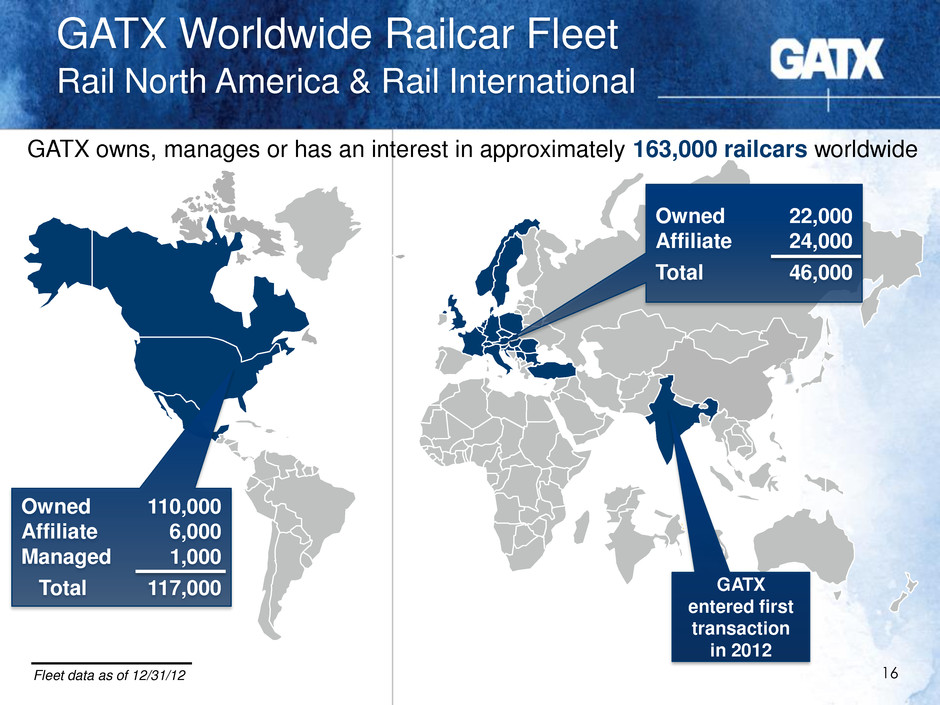
Owned 110,000 Affiliate 6,000 Managed 1,000 Total 117,000 Owned 22,000 Affiliate 24,000 Total 46,000 GATX entered first transaction in 2012 GATX owns, manages or has an interest in approximately 163,000 railcars worldwide 16 GATX Worldwide Railcar Fleet Rail North America & Rail International Fleet data as of 12/31/12
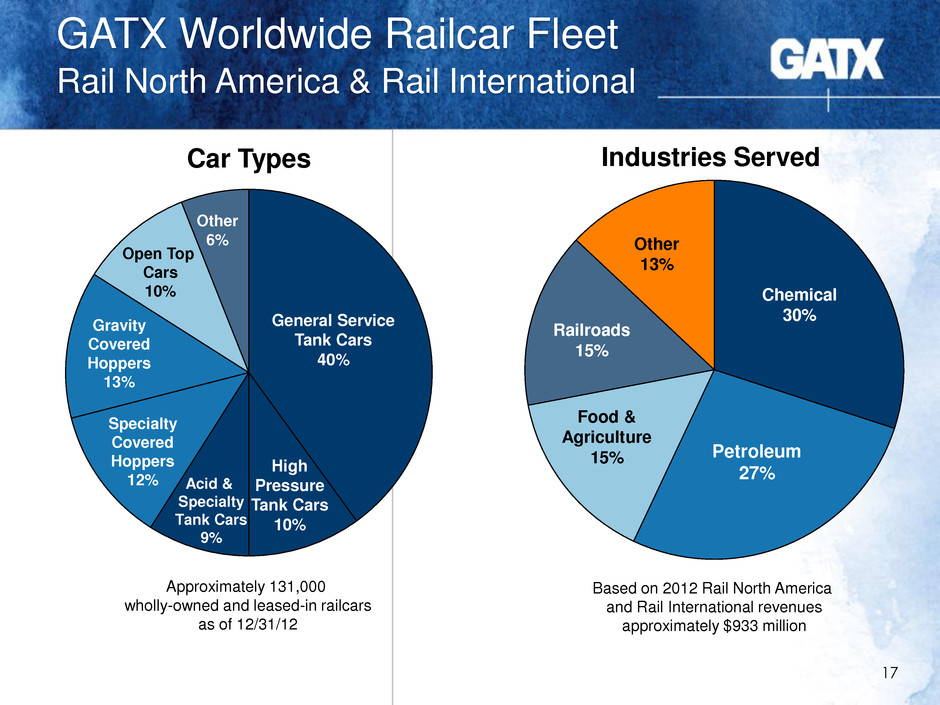
GATX Worldwide Railcar Fleet Rail North America & Rail International 17 Car Types Gravity Covered Hoppers 13% Other 6% Industries Served Petroleum 27% Chemical 30% Food & Agriculture 15% Railroads 15% Based on 2012 Rail North America and Rail International revenues approximately $933 million General Service Tank Cars 40% Open Top Cars 10% Other 13% High Pressure Tank Cars 10% Acid & Specialty Tank Cars 9% Specialty Covered Hoppers 12% Approximately 131,000 wholly-owned and leased-in railcars as of 12/31/12
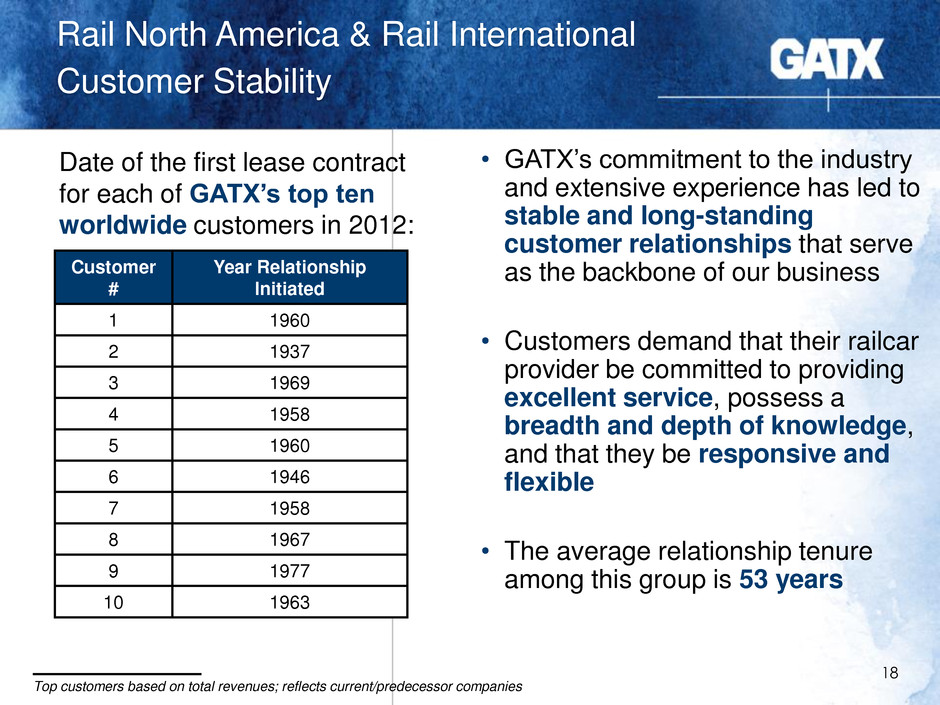
Rail North America & Rail International Customer Stability 18 Date of the first lease contract for each of GATX’s top ten worldwide customers in 2012: Customer # Year Relationship Initiated 1 1960 2 1937 3 1969 4 1958 5 1960 6 1946 7 1958 8 1967 9 1977 10 1963 • GATX’s commitment to the industry and extensive experience has led to stable and long-standing customer relationships that serve as the backbone of our business • Customers demand that their railcar provider be committed to providing excellent service, possess a breadth and depth of knowledge, and that they be responsive and flexible • The average relationship tenure among this group is 53 years Top customers based on total revenues; reflects current/predecessor companies
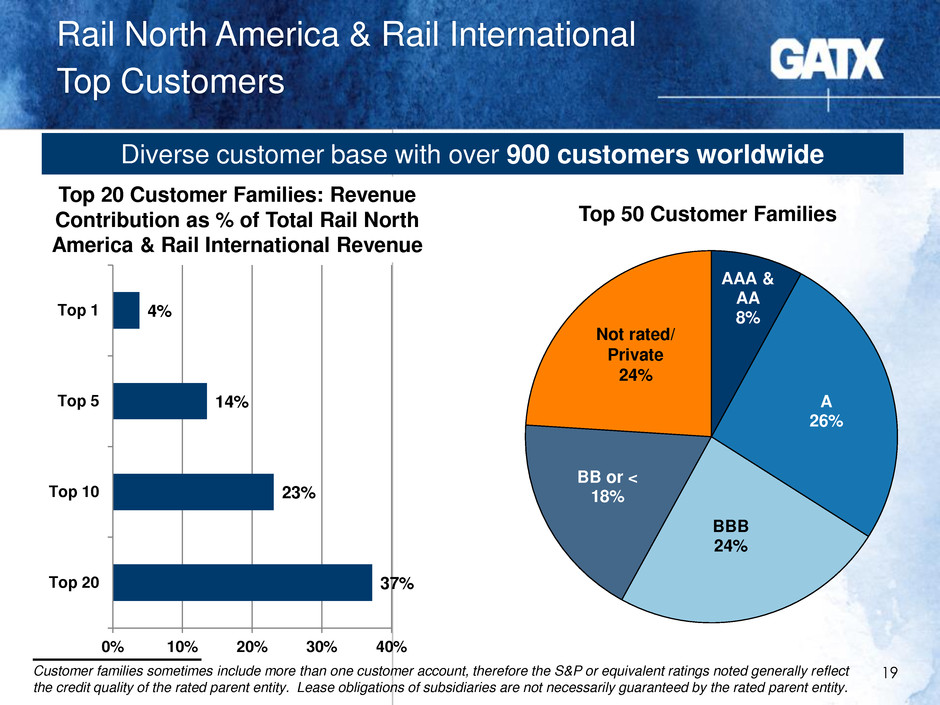
Rail North America & Rail International Top Customers 19 Diverse customer base with over 900 customers worldwide Top 20 Customer Families: Revenue Contribution as % of Total Rail North America & Rail International Revenue 37% 23% 14% 4% 0% 10% 20% 30% 40% Top 20 Top 10 Top 5 Top 1 AAA & AA 8% A 26% BBB 24% BB or < 18% Top 50 Customer Families Customer families sometimes include more than one customer account, therefore the S&P or equivalent ratings noted generally reflect the credit quality of the rated parent entity. Lease obligations of subsidiaries are not necessarily guaranteed by the rated parent entity. Not rated/ Private 24%

GATX Rail North America
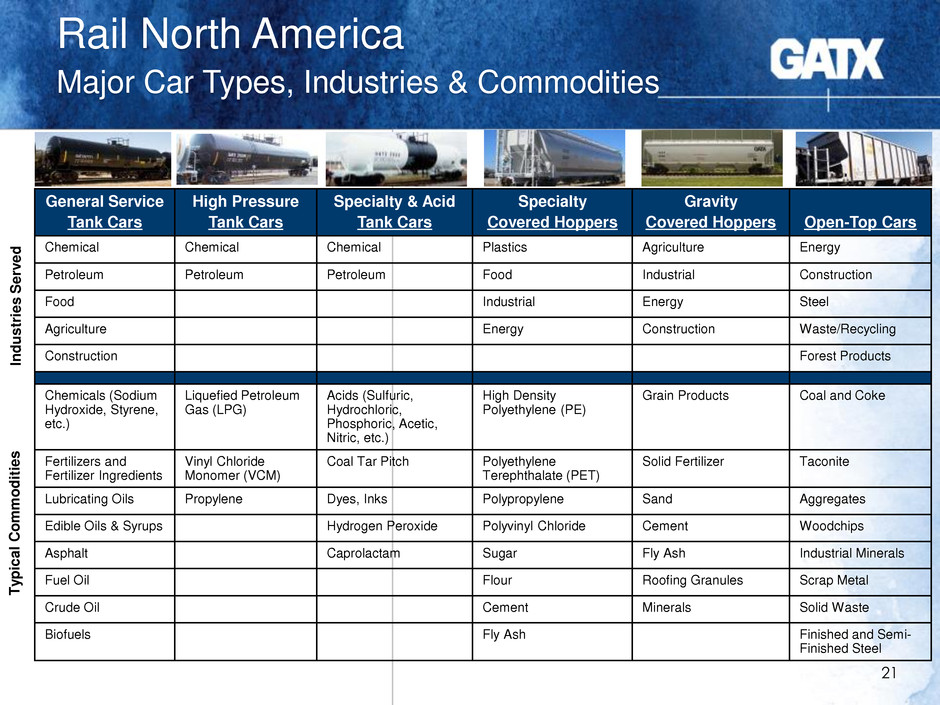
Rail North America Major Car Types, Industries & Commodities 21 General Service Tank Cars High Pressure Tank Cars Specialty & Acid Tank Cars Specialty Covered Hoppers Gravity Covered Hoppers Open-Top Cars Chemical Chemical Chemical Plastics Agriculture Energy Petroleum Petroleum Petroleum Food Industrial Construction Food Industrial Energy Steel Agriculture Energy Construction Waste/Recycling Construction Forest Products Chemicals (Sodium Hydroxide, Styrene, etc.) Liquefied Petroleum Gas (LPG) Acids (Sulfuric, Hydrochloric, Phosphoric, Acetic, Nitric, etc.) High Density Polyethylene (PE) Grain Products Coal and Coke Fertilizers and Fertilizer Ingredients Vinyl Chloride Monomer (VCM) Coal Tar Pitch Polyethylene Terephthalate (PET) Solid Fertilizer Taconite Lubricating Oils Propylene Dyes, Inks Polypropylene Sand Aggregates Edible Oils & Syrups Hydrogen Peroxide Polyvinyl Chloride Cement Woodchips Asphalt Caprolactam Sugar Fly Ash Industrial Minerals Fuel Oil Flour Roofing Granules Scrap Metal Crude Oil Cement Minerals Solid Waste Biofuels Fly Ash Finished and Semi- Finished Steel In d u str ie s S er v e d T y pica l C ommodi ti e s
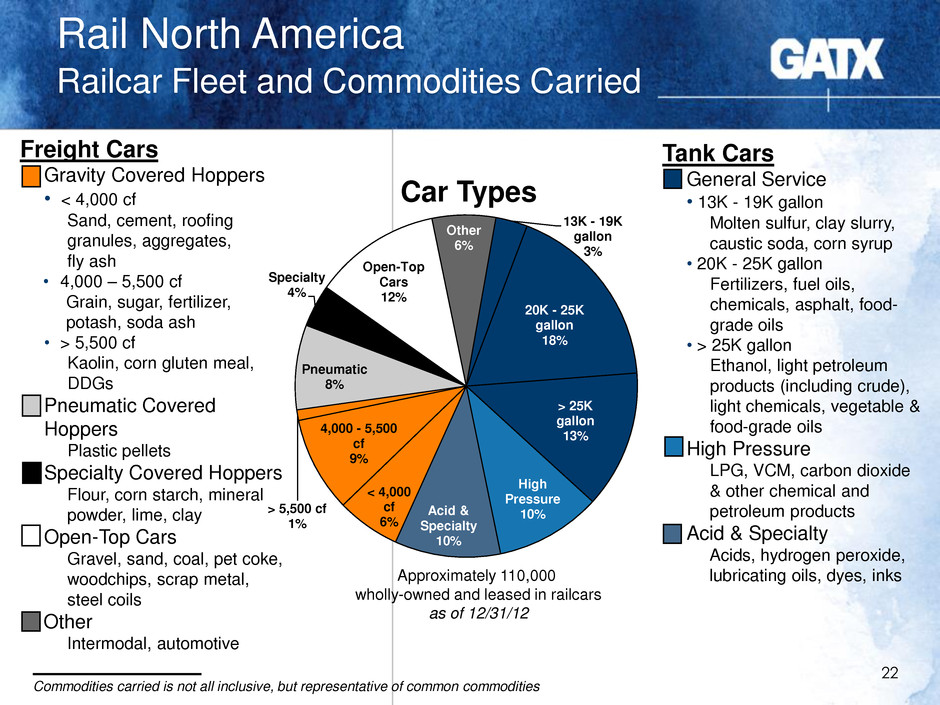
Rail North America Railcar Fleet and Commodities Carried 13K - 19K gallon 3% 20K - 25K gallon 18% > 25K gallon 13% High Pressure 10% Acid & Specialty 10% < 4,000 cf 6% 4,000 - 5,500 cf 9% > 5,500 cf 1% Pneumatic 8% Specialty 4% Open-Top Cars 12% Other 6% Car Types 22 Tank Cars General Service • 13K - 19K gallon Molten sulfur, clay slurry, caustic soda, corn syrup • 20K - 25K gallon Fertilizers, fuel oils, chemicals, asphalt, food- grade oils • > 25K gallon Ethanol, light petroleum products (including crude), light chemicals, vegetable & food-grade oils High Pressure LPG, VCM, carbon dioxide & other chemical and petroleum products Acid & Specialty Acids, hydrogen peroxide, lubricating oils, dyes, inks Freight Cars Gravity Covered Hoppers • < 4,000 cf Sand, cement, roofing granules, aggregates, fly ash • 4,000 – 5,500 cf Grain, sugar, fertilizer, potash, soda ash • > 5,500 cf Kaolin, corn gluten meal, DDGs Pneumatic Covered Hoppers Plastic pellets Specialty Covered Hoppers Flour, corn starch, mineral powder, lime, clay Open-Top Cars Gravel, sand, coal, pet coke, woodchips, scrap metal, steel coils Other Intermodal, automotive Approximately 110,000 wholly-owned and leased in railcars as of 12/31/12 Commodities carried is not all inclusive, but representative of common commodities
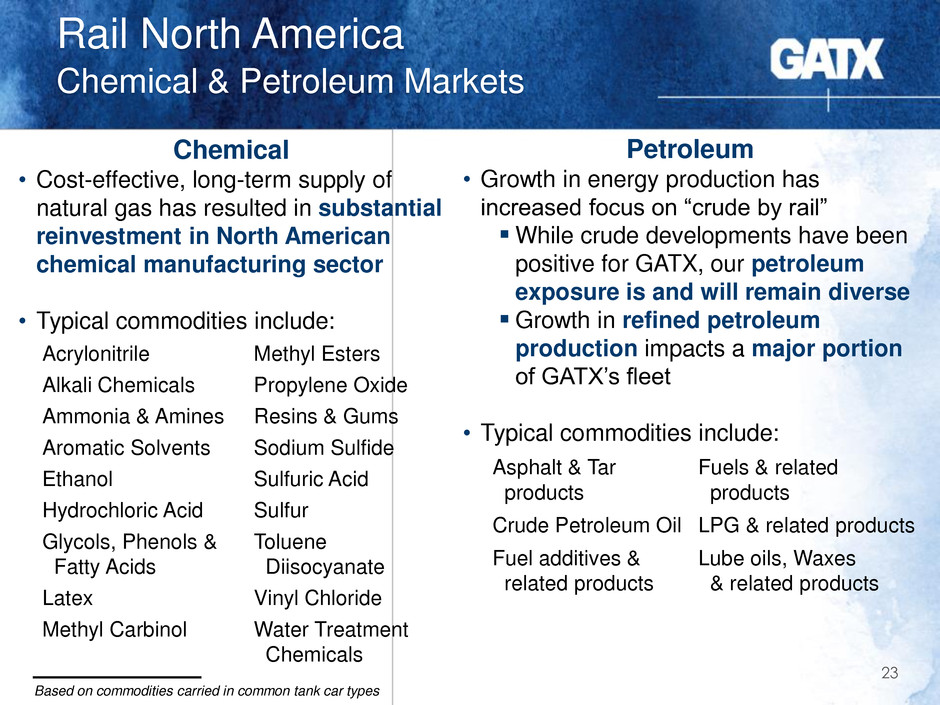
Petroleum • Growth in energy production has increased focus on “crude by rail” While crude developments have been positive for GATX, our petroleum exposure is and will remain diverse Growth in refined petroleum production impacts a major portion of GATX’s fleet • Typical commodities include: Asphalt & Tar Fuels & related products products Crude Petroleum Oil LPG & related products Fuel additives & Lube oils, Waxes related products & related products 23 Chemical • Cost-effective, long-term supply of natural gas has resulted in substantial reinvestment in North American chemical manufacturing sector • Typical commodities include: Acrylonitrile Methyl Esters Alkali Chemicals Propylene Oxide Ammonia & Amines Resins & Gums Aromatic Solvents Sodium Sulfide Ethanol Sulfuric Acid Hydrochloric Acid Sulfur Glycols, Phenols & Toluene Fatty Acids Diisocyanate Latex Vinyl Chloride Methyl Carbinol Water Treatment Chemicals Rail North America Chemical & Petroleum Markets Based on commodities carried in common tank car types
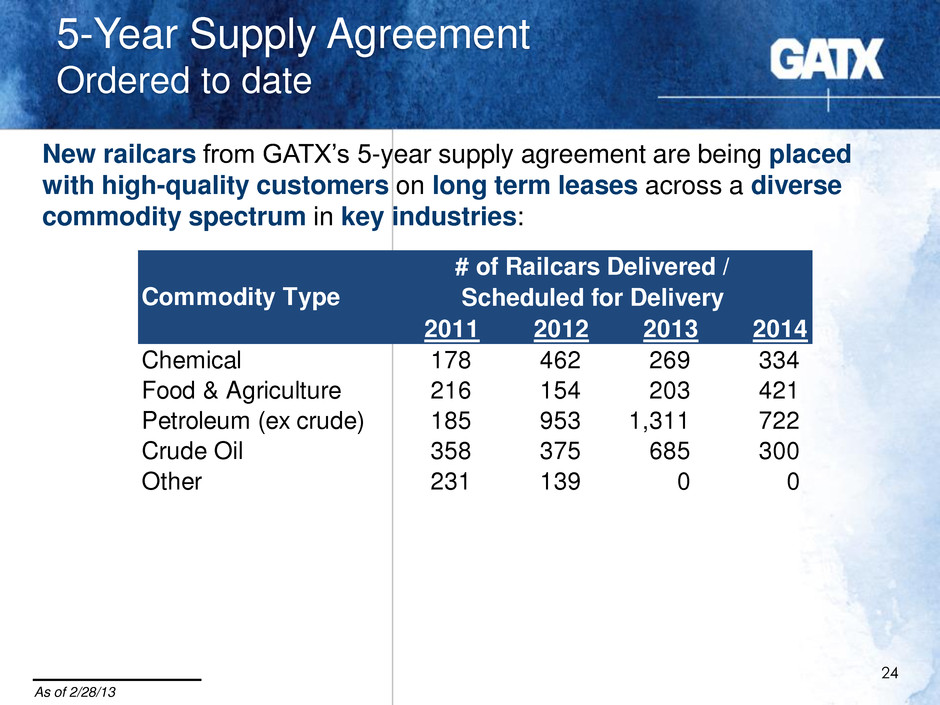
5-Year Supply Agreement Ordered to date New railcars from GATX’s 5-year supply agreement are being placed with high-quality customers on long term leases across a diverse commodity spectrum in key industries: 24 As of 2/28/13 2011 2012 2013 2014 Chemical 178 462 269 334 Food & Agriculture 216 154 203 421 Petroleum (ex crude) 185 953 1,311 722 Crude Oil 358 375 685 300 Other 231 139 0 0 Commodity Type # of Railcars Delivered / Scheduled for Delivery
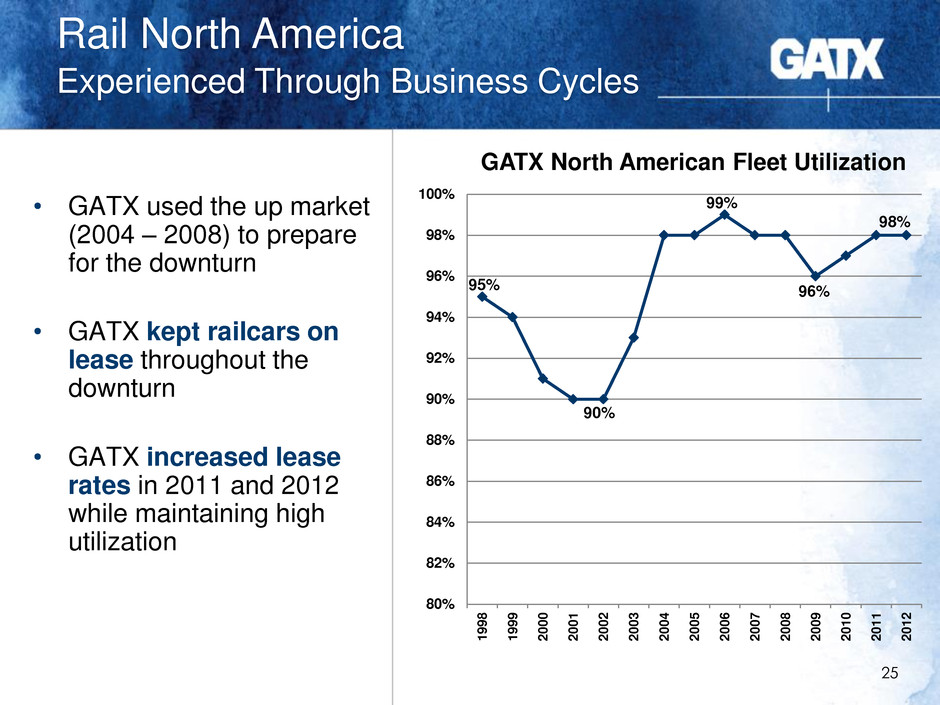
Rail North America Experienced Through Business Cycles 25 • GATX used the up market (2004 – 2008) to prepare for the downturn • GATX kept railcars on lease throughout the downturn • GATX increased lease rates in 2011 and 2012 while maintaining high utilization GATX North American Fleet Utilization 80% 82% 84% 86% 88% 90% 92% 94% 96% 98% 100% 1 9 9 8 1 9 9 9 2 0 0 0 2 0 0 1 2 0 0 2 2 0 0 3 2 0 0 4 2 0 0 5 2 0 0 6 2 0 0 7 2 0 0 8 2 0 0 9 2 0 1 0 2 0 1 1 2 0 1 2 95% 90% 99% 96% 98%
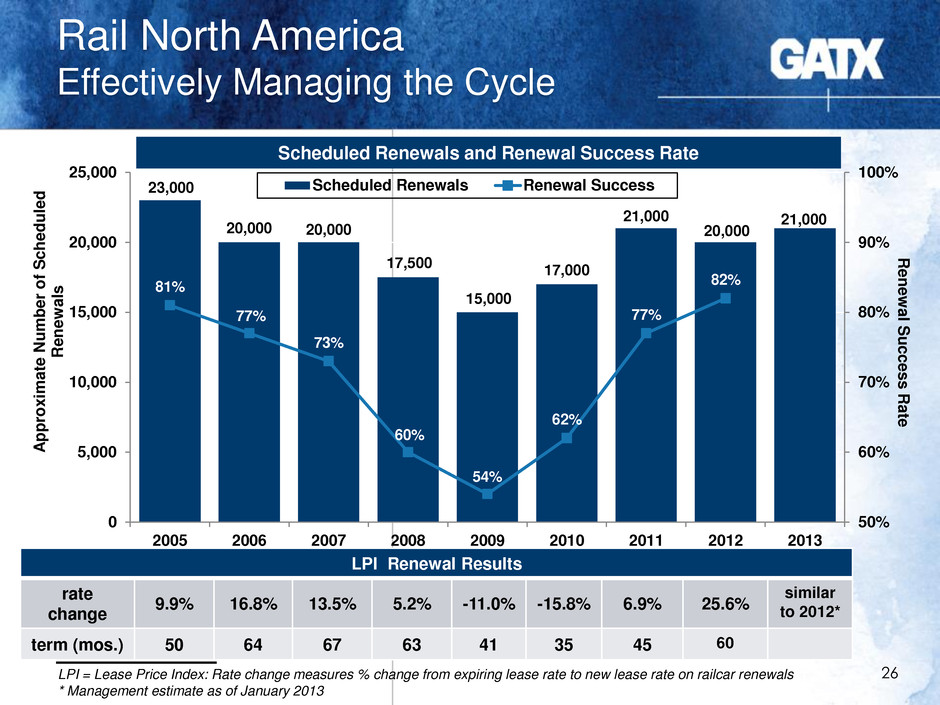
26 LPI = Lease Price Index: Rate change measures % change from expiring lease rate to new lease rate on railcar renewals * Management estimate as of January 2013 23,000 20,000 20,000 17,500 15,000 17,000 21,000 20,000 21,000 81% 77% 73% 60% 54% 62% 77% 82% 50% 60% 70% 80% 90% 100% 0 5,000 10,000 15,000 20,000 25,000 2005 2006 2007 2008 2009 2010 2011 2012 2013 Ren e w a l S uc c e s s Rat e A pprox im a te Num b e r of S c hedul e d Ren e w a ls Scheduled Renewals Renewal Success Rail North America Effectively Managing the Cycle LPI Renewal Results rate change 9.9% 16.8% 13.5% 5.2% -11.0% -15.8% 6.9% 25.6% similar to 2012* term (mos.) 50 64 67 63 41 35 45 60 Scheduled Renewals and Renewal Success Rate
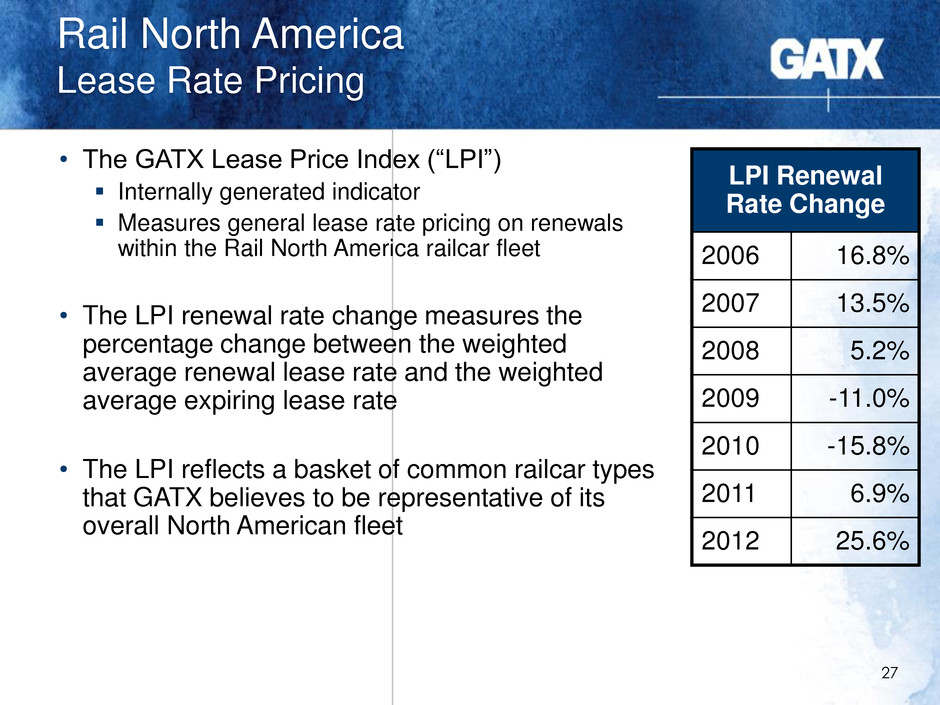
Rail North America Lease Rate Pricing 27 • The GATX Lease Price Index (“LPI”) Internally generated indicator Measures general lease rate pricing on renewals within the Rail North America railcar fleet • The LPI renewal rate change measures the percentage change between the weighted average renewal lease rate and the weighted average expiring lease rate • The LPI reflects a basket of common railcar types that GATX believes to be representative of its overall North American fleet LPI Renewal Rate Change 2006 16.8% 2007 13.5% 2008 5.2% 2009 -11.0% 2010 -15.8% 2011 6.9% 2012 25.6%
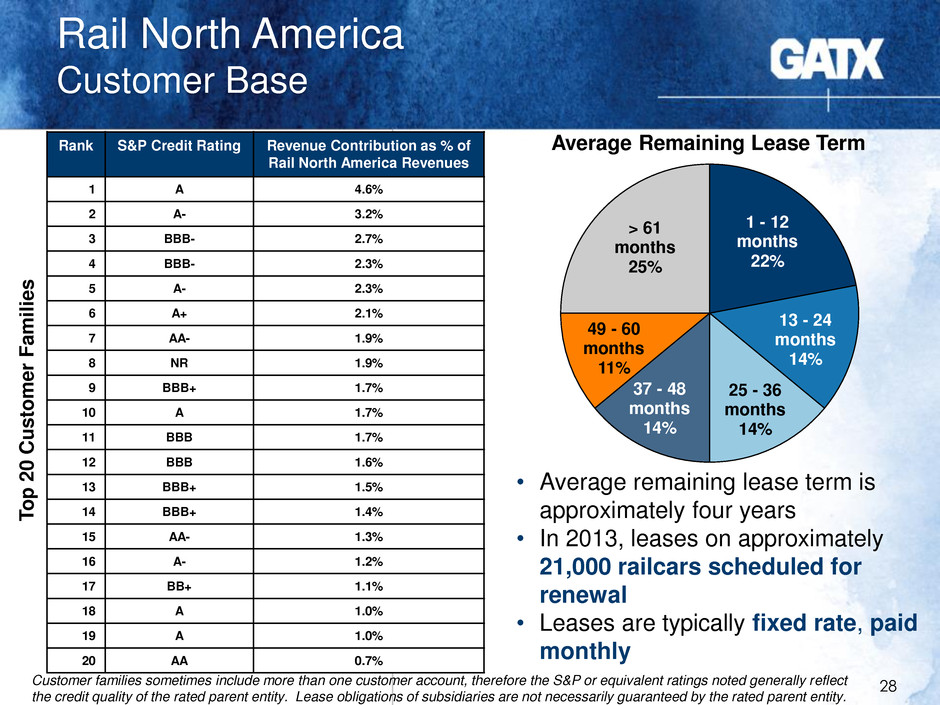
Rank S&P Credit Rating Revenue Contribution as % of Rail North America Revenues 1 A 4.6% 2 A- 3.2% 3 BBB- 2.7% 4 BBB- 2.3% 5 A- 2.3% 6 A+ 2.1% 7 AA- 1.9% 8 NR 1.9% 9 BBB+ 1.7% 10 A 1.7% 11 BBB 1.7% 12 BBB 1.6% 13 BBB+ 1.5% 14 BBB+ 1.4% 15 AA- 1.3% 16 A- 1.2% 17 BB+ 1.1% 18 A 1.0% 19 A 1.0% 20 AA 0.7% Rail North America Customer Base 28 T o p 2 0 C u s tom e r F a mil ie s 1 - 12 months 22% 13 - 24 months 14% 25 - 36 months 14% 37 - 48 months 14% 49 - 60 months 11% > 61 months 25% Average Remaining Lease Term • Average remaining lease term is approximately four years • In 2013, leases on approximately 21,000 railcars scheduled for renewal • Leases are typically fixed rate, paid monthly Customer families sometimes include more than one customer account, therefore the S&P or equivalent ratings noted generally reflect the credit quality of the rated parent entity. Lease obligations of subsidiaries are not necessarily guaranteed by the rated parent entity.
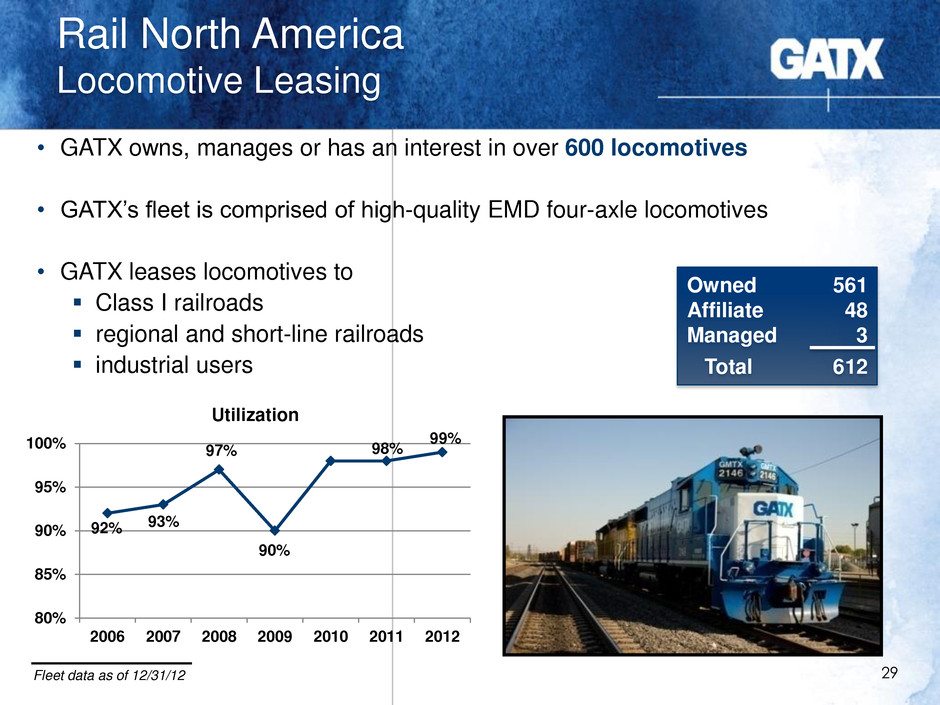
Rail North America Locomotive Leasing 29 • GATX owns, manages or has an interest in over 600 locomotives • GATX’s fleet is comprised of high-quality EMD four-axle locomotives • GATX leases locomotives to Class I railroads regional and short-line railroads industrial users 92% 93% 97% 90% 98% 99% 80% 85% 90% 95% 100% 2006 2007 2008 2009 2010 2011 2012 Utilization Owned 561 Affiliate 48 Managed 3 Total 612 Fleet data as of 12/31/12
GATX Rail International
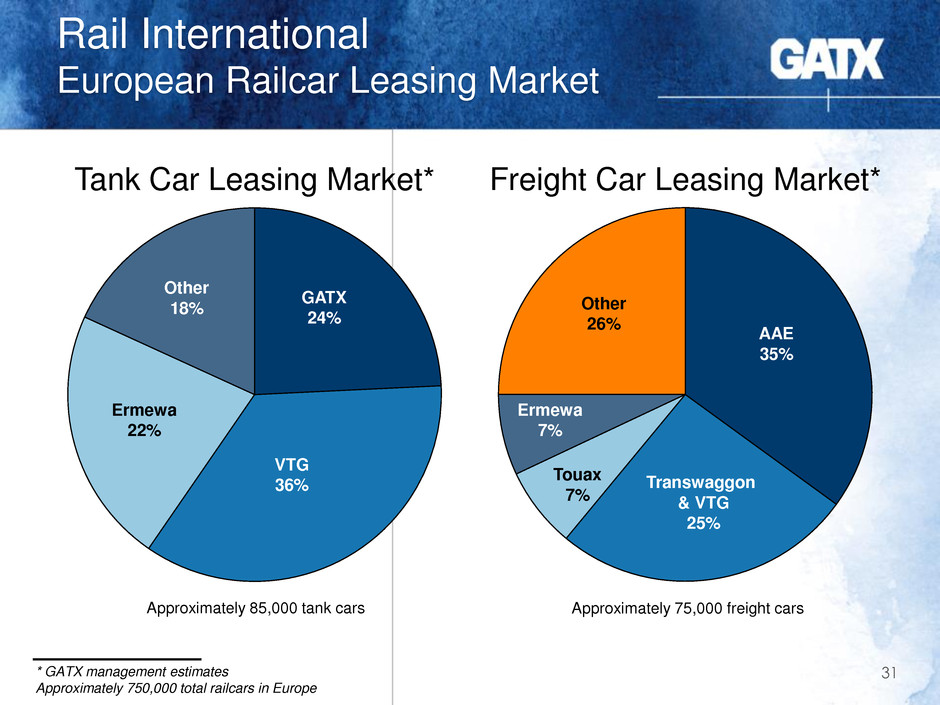
Rail International European Railcar Leasing Market Tank Car Leasing Market* Freight Car Leasing Market* 31 AAE 35% * GATX management estimates Approximately 750,000 total railcars in Europe GATX 24% VTG 36% Ermewa 22% Other 18% Approximately 85,000 tank cars Transwaggon & VTG 25% Ermewa 7% Touax 7% Other 26% Approximately 75,000 freight cars
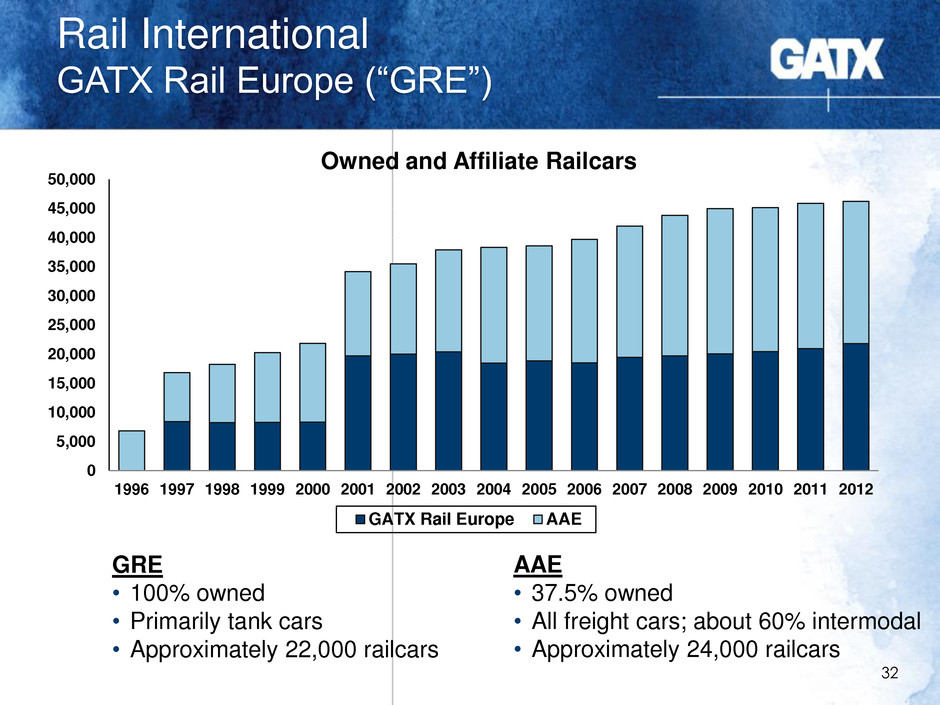
AAE • 37.5% owned • All freight cars; about 60% intermodal • Approximately 24,000 railcars Rail International GATX Rail Europe (“GRE”) 32 0 5,000 10,000 15,000 20,000 25,000 30,000 35,000 40,000 45,000 50,000 1996 1997 1998 1999 2000 2001 2002 2003 2004 2005 2006 2007 2008 2009 2010 2011 2012 Owned and Affiliate Railcars GATX Rail Europe AAE GRE • 100% owned • Primarily tank cars • Approximately 22,000 railcars

Rail International GATX Rail Europe 33 96% 97% 95% 97% 95% 80% 85% 90% 95% 100% 2006 2007 2008 2009 2010 2011 2012 Utilization of Owned Fleet • Length of leases tend to be shorter than in the U.S., but renewal success rate is high Average remaining lease term is approximately two years • Fleet utilization and renewal rates have remained relatively stable
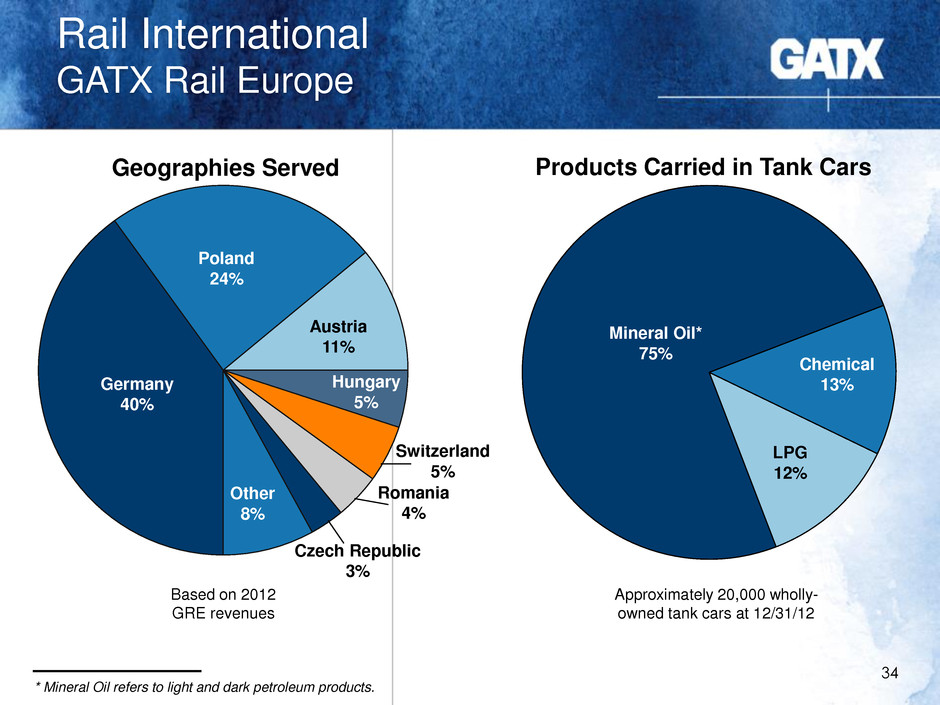
Rail International GATX Rail Europe 34 Geographies Served Products Carried in Tank Cars Based on 2012 GRE revenues Approximately 20,000 wholly- owned tank cars at 12/31/12 * Mineral Oil refers to light and dark petroleum products. Poland 24% Austria 11% Hungary 5% Switzerland 5% Czech Republic 3% Other 8% Germany 40% Romania 4% Mineral Oil* 75% Chemical 13% LPG 12%

Rail International Indian Rail Market • World’s 4th largest rail network • $158 billion in rail infrastructure development projected 2012-2017 (3) • Dedicated Freight Corridors under construction 35 (1) “Rail Budget 2013: India Inc awaits clarity on PPP opportunities in Railways in 12th Plan.” The Economic Times. 27 February 2013. (2) India Brand Equity Foundation. (November 2011). Railways. Available at www.ibef.org (3) Government of India Ministry of Railways, Report of the Expert Group for Modernization of Indian Railways (February 2012). • Rail traffic expected to grow faster than GDP with approximately 36% modal market share vs. approximately 57% highway(1) 804 837 892 933 996 1,061 1,128 1,202 FY08 FY09 FY10 FY11 FY12 FY13E FY14E FY15E Freight Traffic Estimates(2) (million metric tonnes)

Rail International GATX India Private Ltd. (“GIPL”) • First ever wagon leasing license issued to GIPL in May 2012 • GIPL initial investment in container flat wagons announced in 2012 Wagons began to deliver in November 2012 • Continue to focus on investments, lease execution and wagon quality while diversifying fleet 36

GATX Full-service railcar leasing 37

Full-Service Railcar Leasing • GATX has built and maintained a strong market position by focusing on full-service leasing • GATX provides the expertise, knowledge and services essential to our customers Maintenance Engineering Training • As a full-service railcar leasing provider, GATX takes an active role in the complex regulatory landscape 38
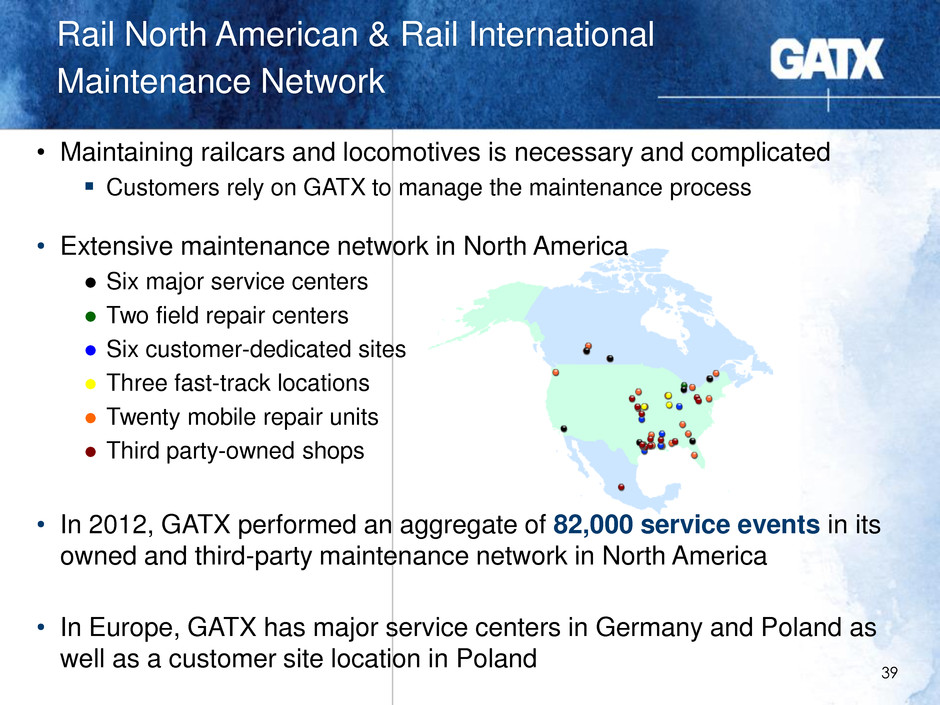
Rail North American & Rail International Maintenance Network 39 • Maintaining railcars and locomotives is necessary and complicated Customers rely on GATX to manage the maintenance process • Extensive maintenance network in North America ● Six major service centers ● Two field repair centers ● Six customer-dedicated sites ● Three fast-track locations ● Twenty mobile repair units ● Third party-owned shops • In 2012, GATX performed an aggregate of 82,000 service events in its owned and third-party maintenance network in North America • In Europe, GATX has major service centers in Germany and Poland as well as a customer site location in Poland
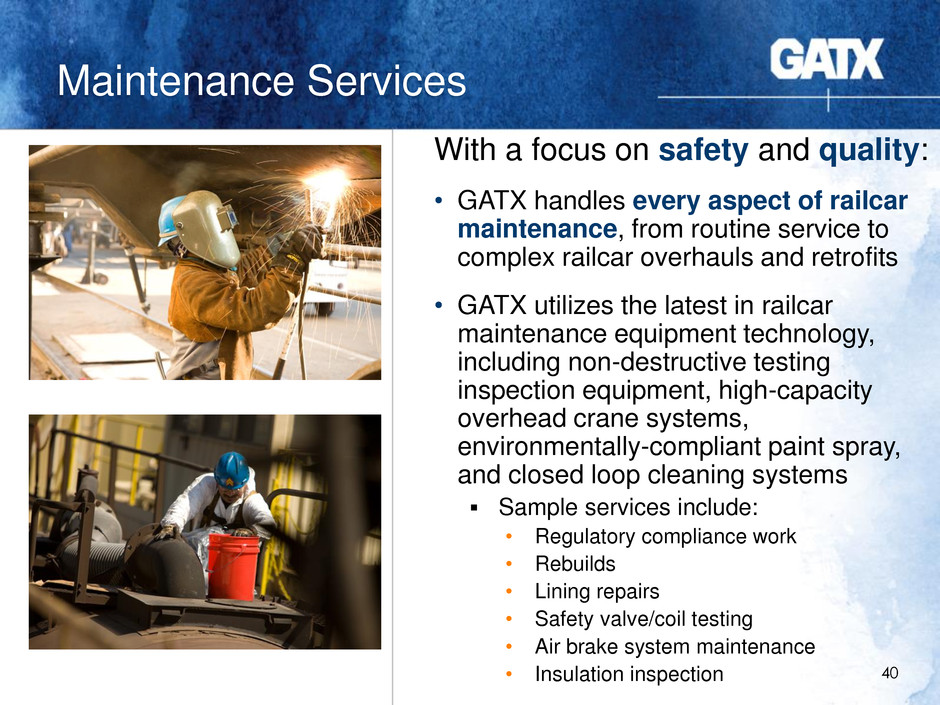
Maintenance Services 40 With a focus on safety and quality: • GATX handles every aspect of railcar maintenance, from routine service to complex railcar overhauls and retrofits • GATX utilizes the latest in railcar maintenance equipment technology, including non-destructive testing inspection equipment, high-capacity overhead crane systems, environmentally-compliant paint spray, and closed loop cleaning systems Sample services include: • Regulatory compliance work • Rebuilds • Lining repairs • Safety valve/coil testing • Air brake system maintenance • Insulation inspection

• GATX’s engineering team, comprised of experienced mechanical, structural, and chemical engineers, is constantly communicating with customers • GATX’s engineers draw on decades of experience to identify solutions tailored to meet customer needs Each customer faces a unique set of transportation challenges Factors such as a customer’s commodity focus or the location and layout of their manufacturing facilities must be considered • The engineering group supports GATX’s effort to provide quality equipment as GATX continues to grow in emerging rail markets Engineering 41
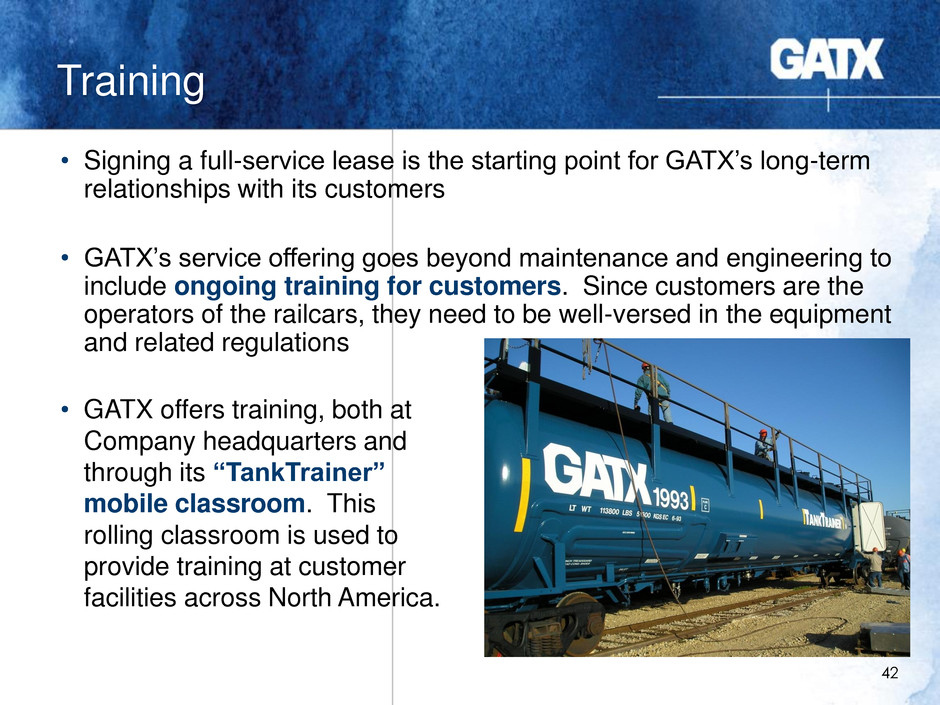
Training 42 • Signing a full-service lease is the starting point for GATX’s long-term relationships with its customers • GATX’s service offering goes beyond maintenance and engineering to include ongoing training for customers. Since customers are the operators of the railcars, they need to be well-versed in the equipment and related regulations • GATX offers training, both at Company headquarters and through its “TankTrainer” mobile classroom. This rolling classroom is used to provide training at customer facilities across North America.

GATX is an active participant in complex U.S. Rail Regulatory Landscape 43 U.S. Government ECONOMICS STB Surface Transportation Board SAFETY NTSB National Transportation Safety Board REGULATE/ ENFORCE DOT Dept of Transportation SECURITY DHS Department of Homeland Security TSA Transportation Security Administration AAR Association of American Railroads FRA Federal Railroad Administration PHMSA Pipeline and Hazardous Material Safety Administration Office of Safety SOMC Safety & Operations Mgmt Committee Railinc TTCI Transpor- tation Technology Center NEMC Network Efficiency Mgmt Committee TSWC Tech. Services Working Committee Interchange Rules / Stds. RMWC Risk Mgmt. Working Committee Environment & HAZMAT Tech. Subcommittees ARB Arbitration & Rules Committee Tank Car Committee * GATX interacts with agencies and participates in or interacts with committees indicated in blue

GATX actively participates in or interacts with several committees within various government agencies in the United States • GATX employees have roles on boards and committees within the AAR: Associates Advisory Board Advanced Safety & Efficiency Committee Arbitration & Rules Committee Car Repair Billing Committee Equipment Assets Committee Equipment Health Monitoring Committee Locomotive Committee Tank Car Committee UMLER Committee Wheels, Axels, Bearings & Lubrication Committee • GATX employees are involved with various Trade and Supplier Associations: American Chemistry Council American Petroleum Institute Chlorine Institute Equipment Leasing & Finance Association The Fertilizer Institute North American Freight Car Association Railway Supply Institute Renewable Fuels Association Sulfur Institute 44 GATX’s participation in the Regulatory Environment

American Steamship Company
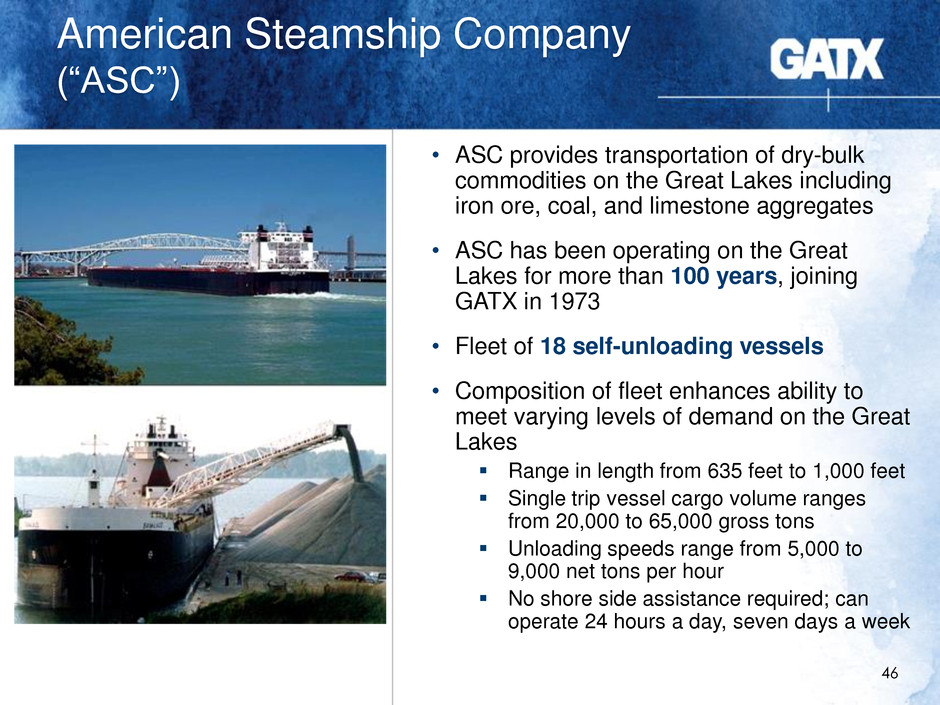
American Steamship Company (“ASC”) 46 • ASC provides transportation of dry-bulk commodities on the Great Lakes including iron ore, coal, and limestone aggregates • ASC has been operating on the Great Lakes for more than 100 years, joining GATX in 1973 • Fleet of 18 self-unloading vessels • Composition of fleet enhances ability to meet varying levels of demand on the Great Lakes Range in length from 635 feet to 1,000 feet Single trip vessel cargo volume ranges from 20,000 to 65,000 gross tons Unloading speeds range from 5,000 to 9,000 net tons per hour No shore side assistance required; can operate 24 hours a day, seven days a week
ASC Industry Overview 47 • Industry is mature • The assets are long-lived • High barriers to entry New-build vessel costs have risen sharply in recent years In 2012, ASC deployed the first new, U.S.-built vessel on the Great Lakes in 12 years • Customer base is highly concentrated ASC served 20 customers in 2012 Top five customers comprised 84% of ASC’s total revenue in 2012 • Sailing season generally runs from late March through the end of December

ASC Great Lakes Trade Patterns 48 IRON ORE PELLETS Routes and Loading Ports LIMESTONE Routes and Loading Ports EASTERN COAL Routes and Loading Ports WESTERN COAL Routes and Loading Ports
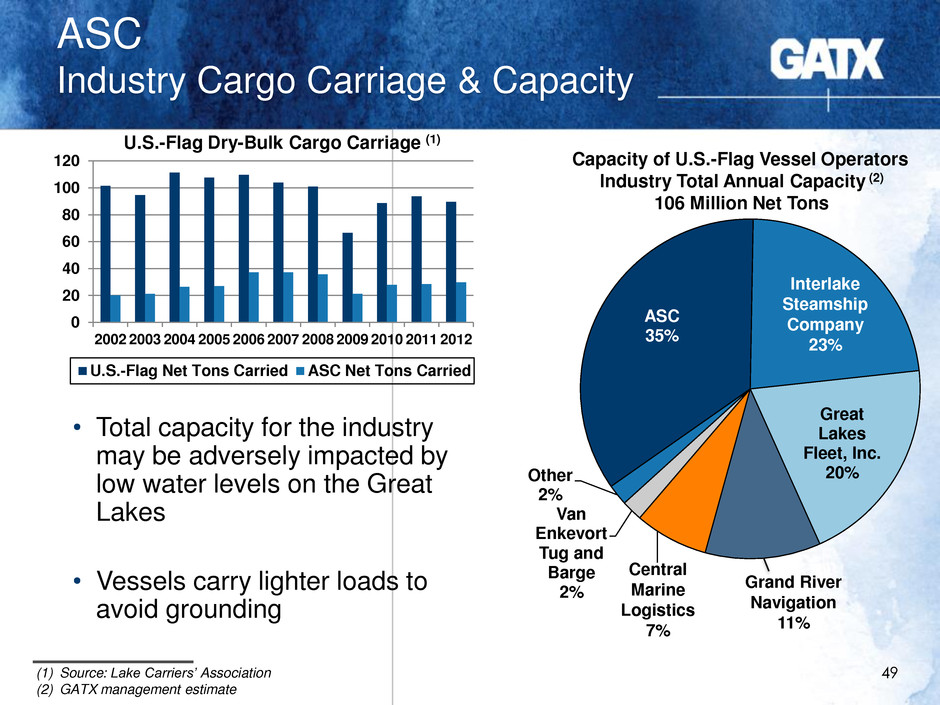
ASC Industry Cargo Carriage & Capacity 49 0 20 40 60 80 100 120 2002 2003 2004 2005 2006 2007 2008 2009 2010 2011 2012 U.S.-Flag Net Tons Carried ASC Net Tons Carried U.S.-Flag Dry-Bulk Cargo Carriage (1) Capacity of U.S.-Flag Vessel Operators Industry Total Annual Capacity (2) 106 Million Net Tons ASC 35% Great Lakes Fleet, Inc. 20% Van Enkevort Tug and Barge 2% Other 2% • Total capacity for the industry may be adversely impacted by low water levels on the Great Lakes • Vessels carry lighter loads to avoid grounding (1) Source: Lake Carriers’ Association (2) GATX management estimate Interlake Steamship Company 23% Grand River Navigation 11% Central Marine Logistics 7%
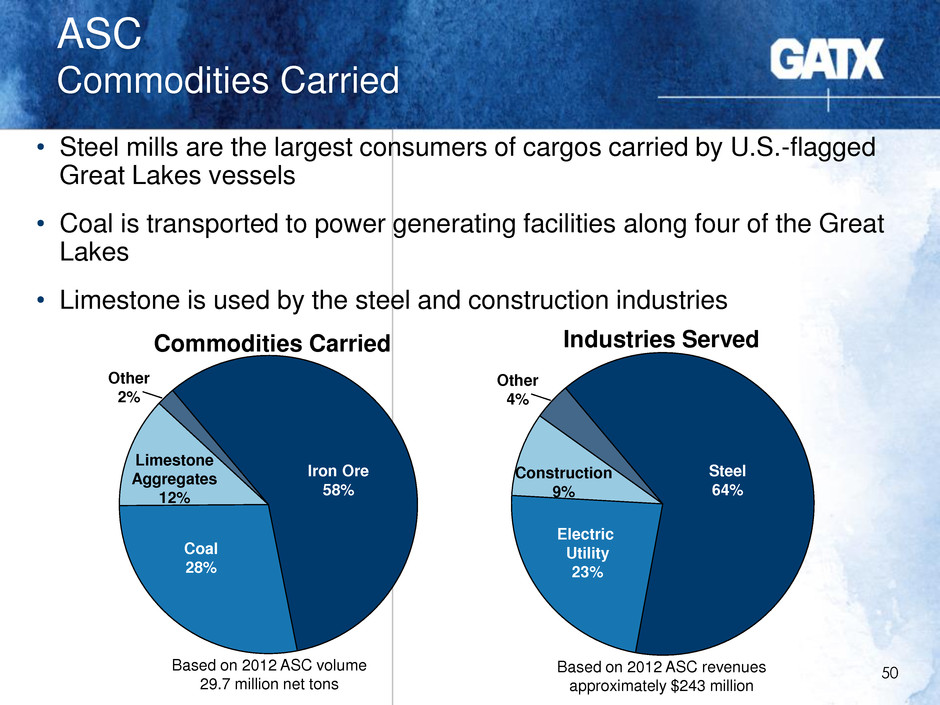
• Steel mills are the largest consumers of cargos carried by U.S.-flagged Great Lakes vessels • Coal is transported to power generating facilities along four of the Great Lakes • Limestone is used by the steel and construction industries Industries Served ASC Commodities Carried 50 Commodities Carried Based on 2012 ASC volume 29.7 million net tons Iron Ore 58% Coal 28% Limestone Aggregates 12% Other 2% Steel 64% Electric Utility 23% Construction 9% Based on 2012 ASC revenues approximately $243 million Other 4%
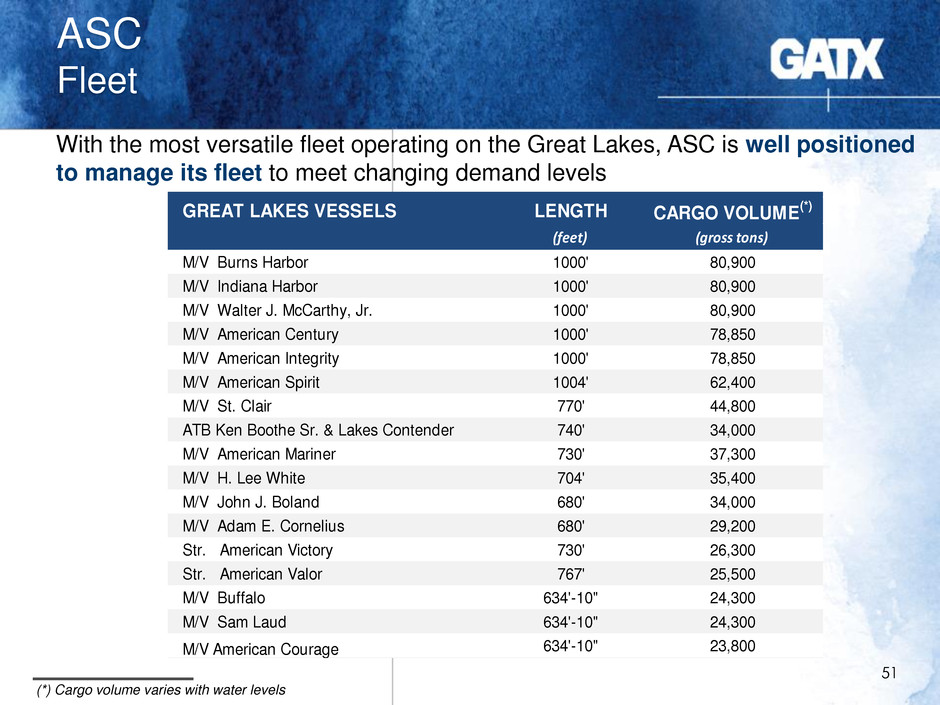
51 With the most versatile fleet operating on the Great Lakes, ASC is well positioned to manage its fleet to meet changing demand levels GREAT LAKES VESSELS LENGTH CARGO VOLUME (*) (feet) (gross tons) M/V Burns Harbor 1000' 80,900 M/V Indiana Harbor 1000' 80,900 M/V Walter J. McCarthy, Jr. 1000' 80,900 M/V American Century 1000' 78,850 M/V American Integrity 1000' 78,850 M/V American Spirit 1004' 62,400 M/V St. Clair 770' 44,800 ATB Ken Boothe Sr. & Lakes Contender 740' 34,000 M/V American Mariner 730' 37,300 M/V H. Lee White 704' 35,400 M/V John J. Boland 680' 34,000 M/V Adam E. Cornelius 680' 29,200 Str. American Victory 730' 26,300 Str. American Valor 767' 25,500 M/V Buffalo 634'-10" 24,300 M/V Sam Laud 634'-10" 24,300 M/V American Courage 634'-10" 23,800 ASC Fleet (*) Cargo volume varies with water levels
GATX Portfolio Management
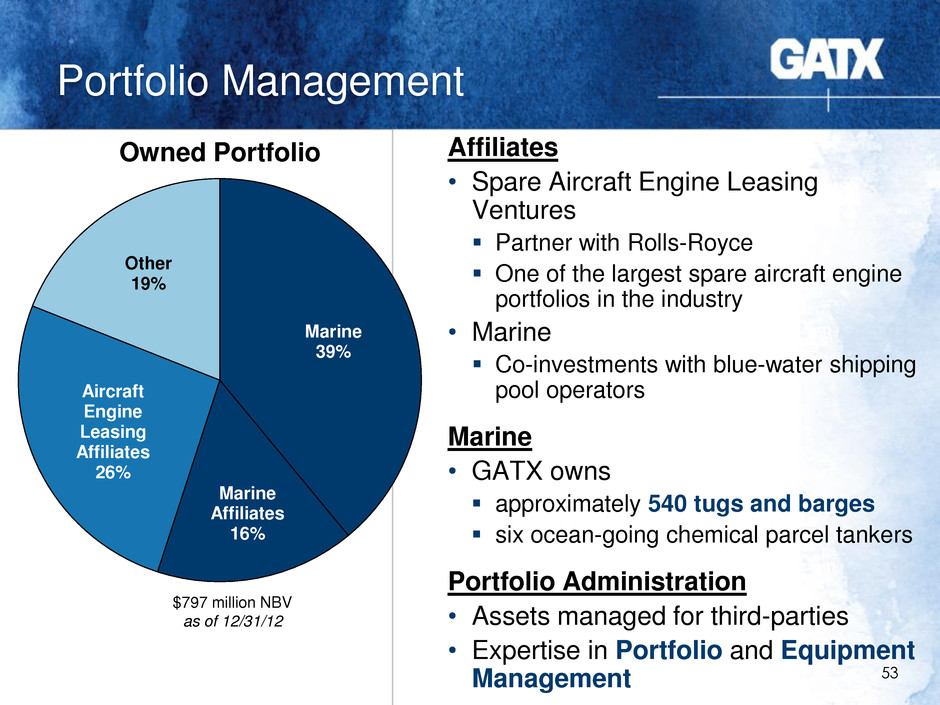
Portfolio Management 53 Marine 39% Marine Affiliates 16% Aircraft Engine Leasing Affiliates 26% Other 19% Owned Portfolio Affiliates • Spare Aircraft Engine Leasing Ventures Partner with Rolls-Royce One of the largest spare aircraft engine portfolios in the industry • Marine Co-investments with blue-water shipping pool operators Marine • GATX owns approximately 540 tugs and barges six ocean-going chemical parcel tankers Portfolio Administration • Assets managed for third-parties • Expertise in Portfolio and Equipment Management $797 million NBV as of 12/31/12
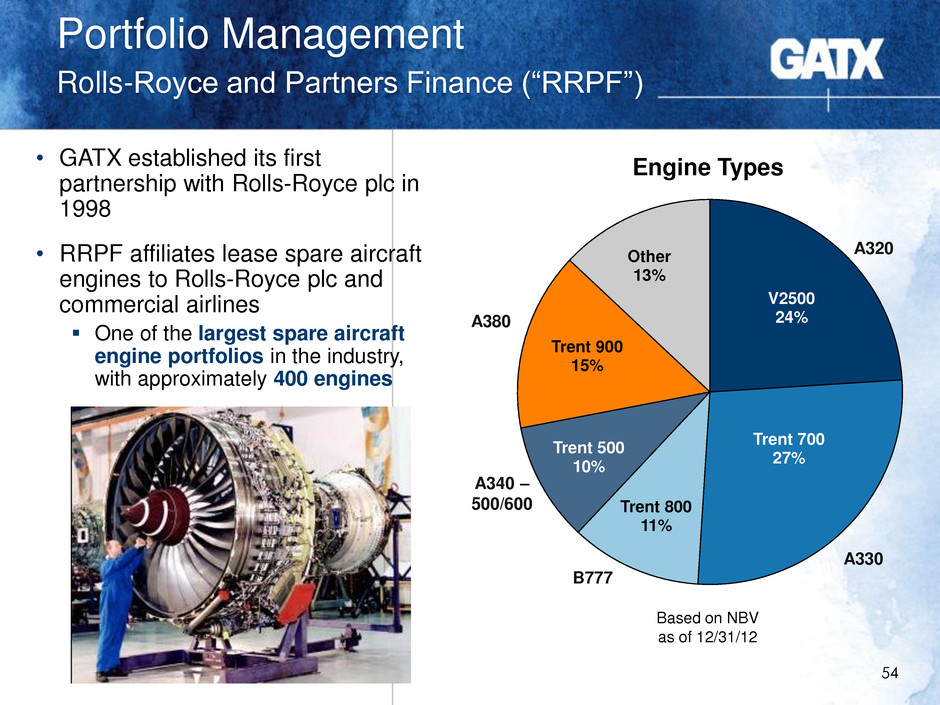
Portfolio Management Rolls-Royce and Partners Finance (“RRPF”) 54 • GATX established its first partnership with Rolls-Royce plc in 1998 • RRPF affiliates lease spare aircraft engines to Rolls-Royce plc and commercial airlines One of the largest spare aircraft engine portfolios in the industry, with approximately 400 engines V2500 24% Trent 700 27% Trent 800 11% Trent 500 10% Trent 900 15% Other 13% Engine Types A330 Based on NBV as of 12/31/12 A320 B777 A340 – 500/600 A380
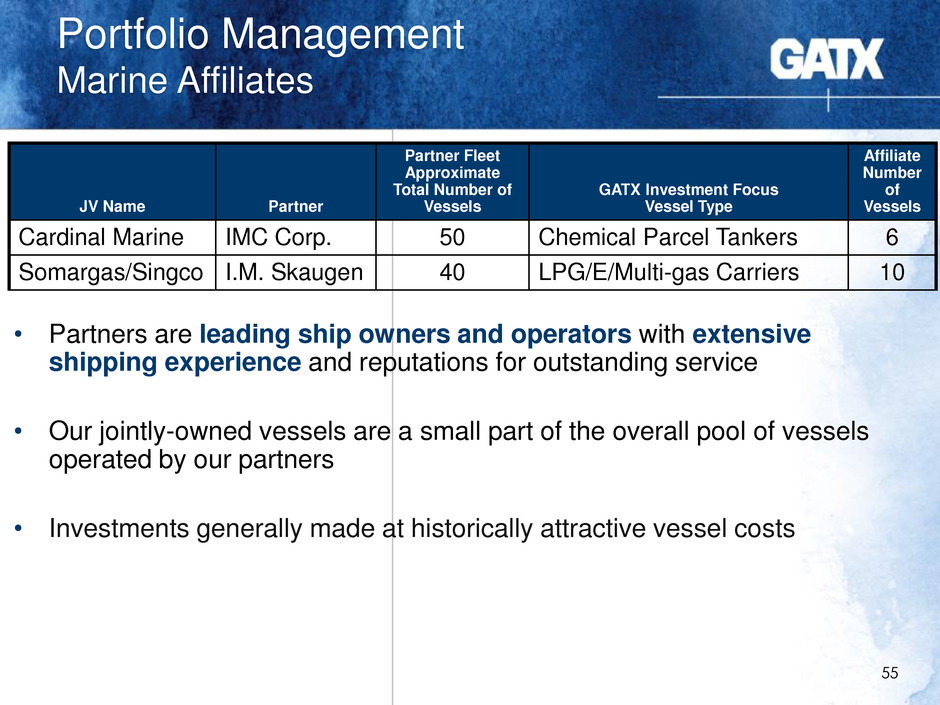
Portfolio Management Marine Affiliates 55 JV Name Partner Partner Fleet Approximate Total Number of Vessels GATX Investment Focus Vessel Type Affiliate Number of Vessels Cardinal Marine IMC Corp. 50 Chemical Parcel Tankers 6 Somargas/Singco I.M. Skaugen 40 LPG/E/Multi-gas Carriers 10 • Partners are leading ship owners and operators with extensive shipping experience and reputations for outstanding service • Our jointly-owned vessels are a small part of the overall pool of vessels operated by our partners • Investments generally made at historically attractive vessel costs
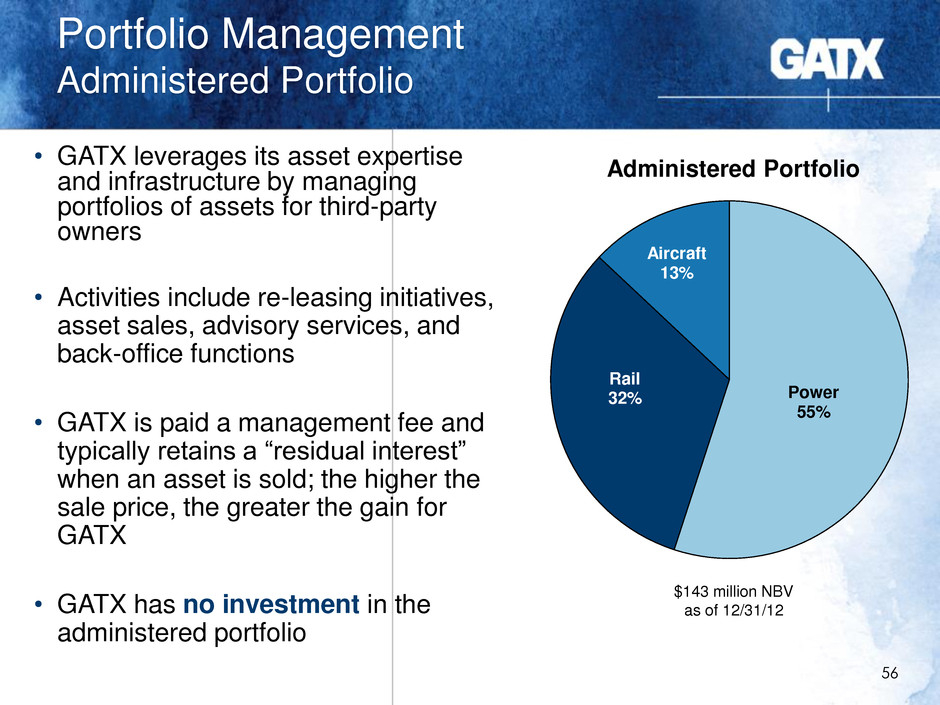
Portfolio Management Administered Portfolio 56 • GATX leverages its asset expertise and infrastructure by managing portfolios of assets for third-party owners • Activities include re-leasing initiatives, asset sales, advisory services, and back-office functions • GATX is paid a management fee and typically retains a “residual interest” when an asset is sold; the higher the sale price, the greater the gain for GATX • GATX has no investment in the administered portfolio Power 55% Rail 32% Aircraft 13% Administered Portfolio $143 million NBV as of 12/31/12

GATX Financial Highlights
Financial Profile • Strong cash flow and contracted revenue • Access to capital is solid and well-diversified • Focused on disciplined investment and effective asset remarketing 58
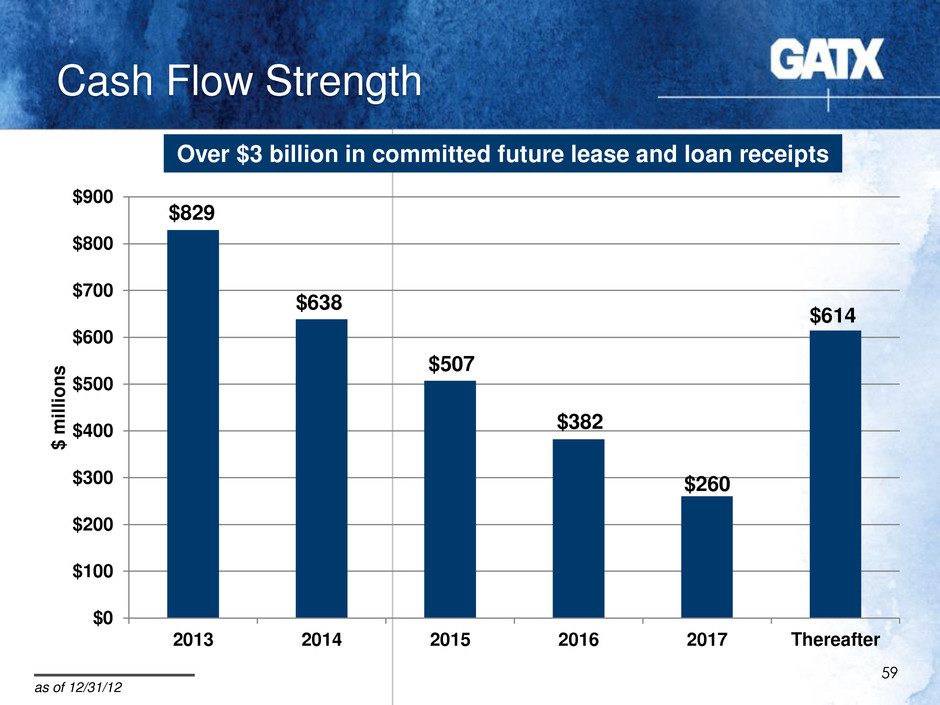
Cash Flow Strength 59 Over $3 billion in committed future lease and loan receipts $829 $638 $507 $382 $260 $614 $0 $100 $200 $300 $400 $500 $600 $700 $800 $900 2013 2014 2015 2016 2017 Thereafter $ m il li o n s as of 12/31/12
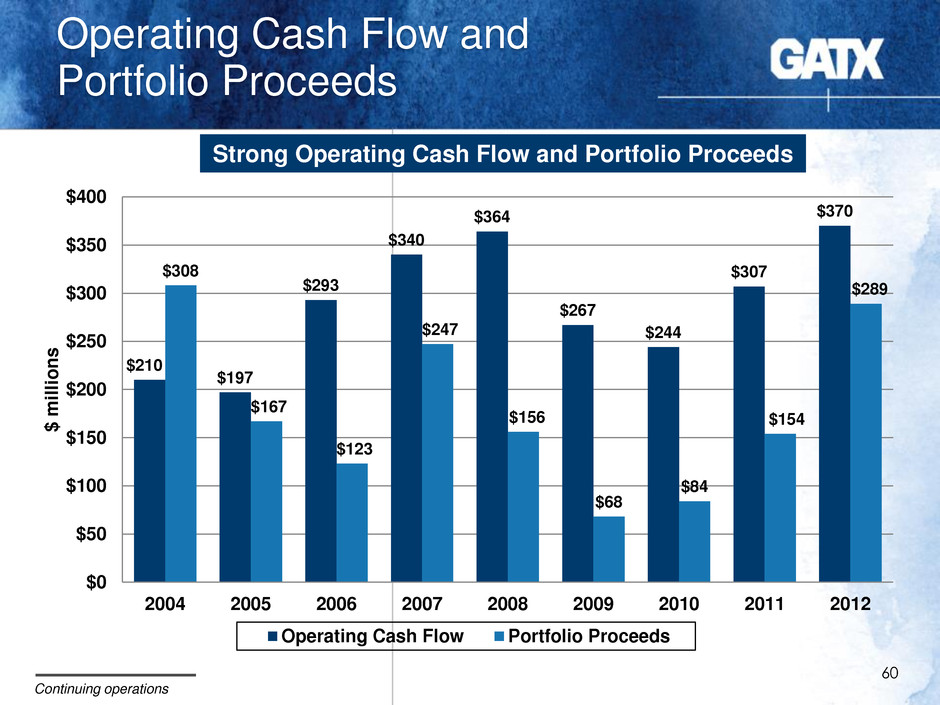
Operating Cash Flow and Portfolio Proceeds 60 Strong Operating Cash Flow and Portfolio Proceeds $210 $197 $293 $340 $364 $267 $244 $307 $370 $308 $167 $123 $247 $156 $68 $84 $154 $289 $0 $50 $100 $150 $200 $250 $300 $350 $400 2004 2005 2006 2007 2008 2009 2010 2011 2012 $ m il li o n s Operating Cash Flow Portfolio Proceeds Continuing operations

Financial Profile Future Debt Obligations 61 GATX’s debt maturity schedule is well-balanced $486 $514 $552 $627 $236 $866 $0 $100 $200 $300 $400 $500 $600 $700 $800 $900 $1,000 2013 2014 2015 2016 2017 Thereafter $ m il lion s as of 12/31/12
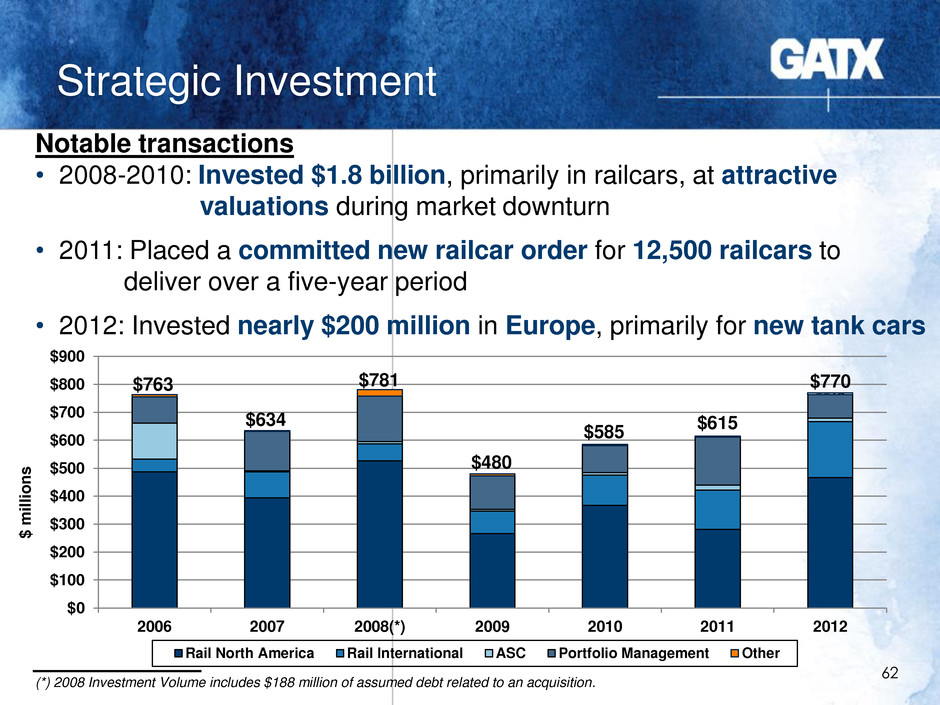
Strategic Investment 62 $0 $100 $200 $300 $400 $500 $600 $700 $800 $900 2006 2007 2008(*) 2009 2010 2011 2012 $ m il lion s Rail North America Rail International ASC Portfolio Management Other $615 (*) 2008 Investment Volume includes $188 million of assumed debt related to an acquisition. Notable transactions • 2008-2010: Invested $1.8 billion, primarily in railcars, at attractive valuations during market downturn • 2011: Placed a committed new railcar order for 12,500 railcars to deliver over a five-year period • 2012: Invested nearly $200 million in Europe, primarily for new tank cars $763 $634 $781 $480 $585 $770
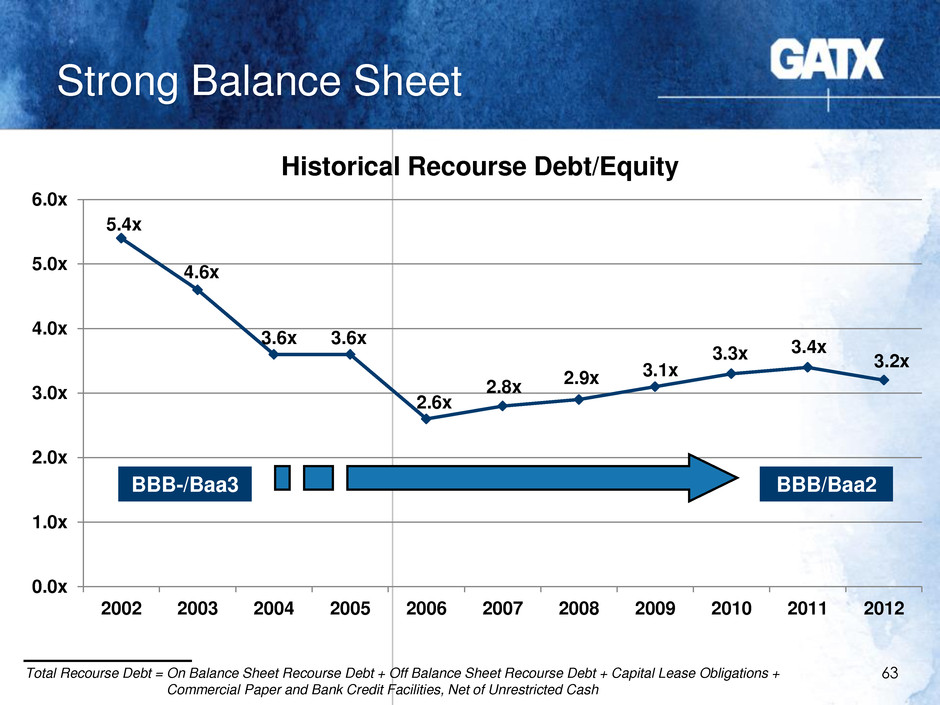
Strong Balance Sheet 63 5.4x 4.6x 3.6x 3.6x 2.6x 2.8x 2.9x 3.1x 3.3x 3.4x 3.2x 0.0x 1.0x 2.0x 3.0x 4.0x 5.0x 6.0x 2002 2003 2004 2005 2006 2007 2008 2009 2010 2011 2012 Historical Recourse Debt/Equity BBB-/Baa3 BBB/Baa2 Total Recourse Debt = On Balance Sheet Recourse Debt + Off Balance Sheet Recourse Debt + Capital Lease Obligations + Commercial Paper and Bank Credit Facilities, Net of Unrestricted Cash
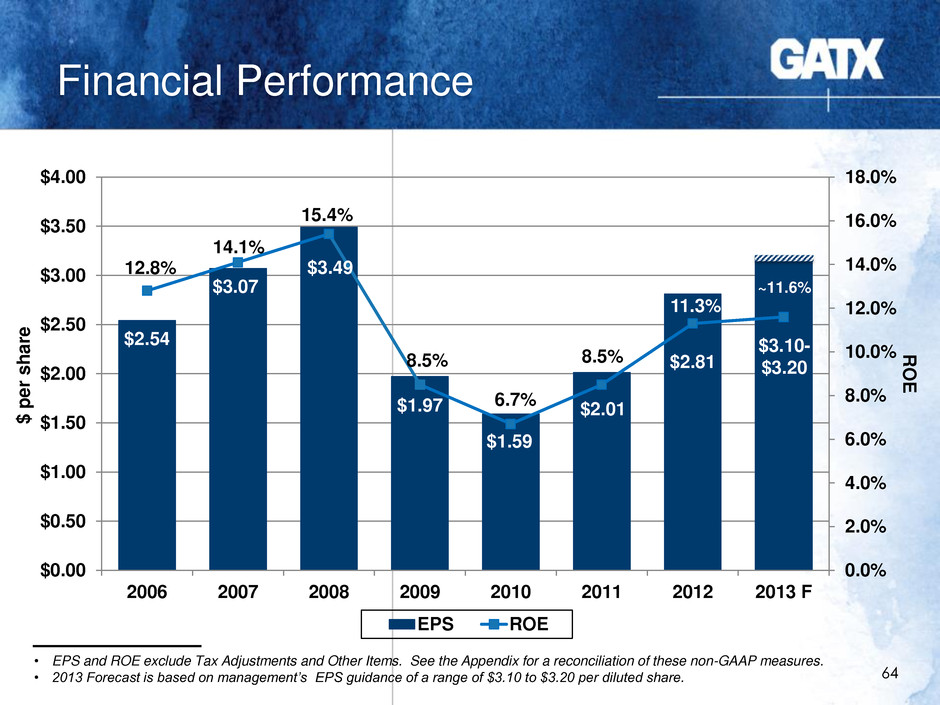
Financial Performance 64 $2.54 $3.07 $3.49 $1.97 $1.59 $2.01 $2.81 12.8% 14.1% 15.4% 8.5% 6.7% 8.5% 11.3% 0.0% 2.0% 4.0% 6.0% 8.0% 10.0% 12.0% 14.0% 16.0% 18.0% $0.00 $0.50 $1.00 $1.50 $2.00 $2.50 $3.00 $3.50 $4.00 2006 2007 2008 2009 2010 2011 2012 2013 F R O E $ p e r s h a re EPS ROE $3.10- $3.20 ~11.6% • EPS and ROE exclude Tax Adjustments and Other Items. See the Appendix for a reconciliation of these non-GAAP measures. • 2013 Forecast is based on management’s EPS guidance of a range of $3.10 to $3.20 per diluted share.
Summary and Opportunity • GATX has consistently been a market force in the rail industry for 115 years • GATX is benefitting from unprecedented strength in the tank car market • GATX has the desire to make disciplined investments and fleet acquisitions in North America and International rail markets • GATX is focused on generating attractive, risk- adjusted returns for our shareholders 65
Appendix Reconciliation of non-GAAP measures
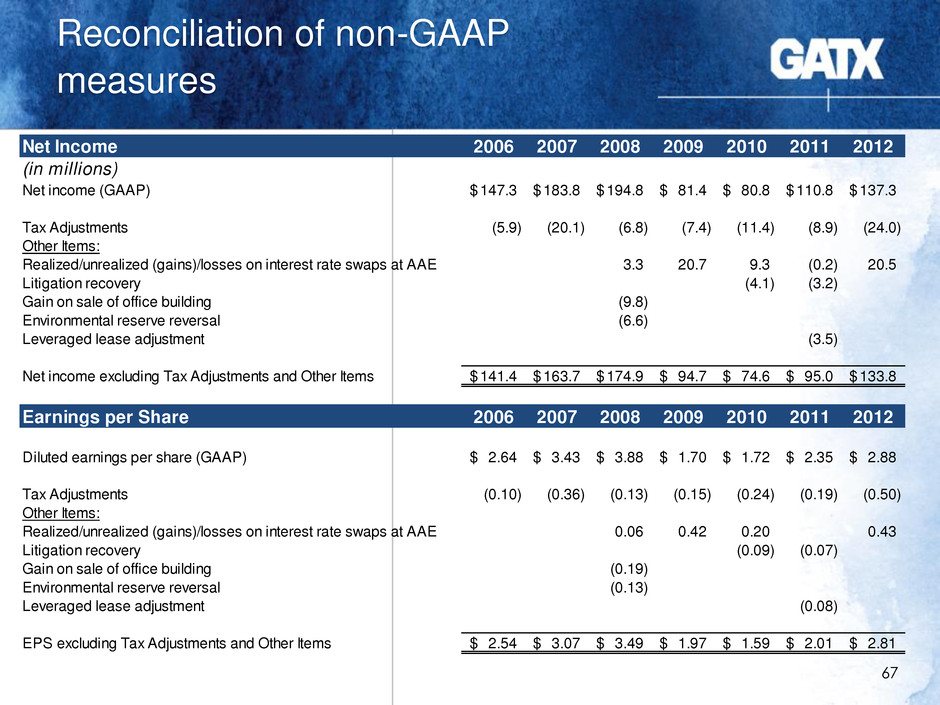
Reconciliation of non-GAAP measures 67 Net Income 2006 2007 2008 2009 2010 2011 2012 (in millions) Net income (GAAP) 147.3$ 183.8$ 194.8$ 81.4$ 80.8$ 110.8$ 137.3$ Tax Adjustments (5.9) (20.1) (6.8) (7.4) (11.4) (8.9) (24.0) Other Items: Realized/unrealized (gains)/losses on interest rate swaps at AAE 3.3 20.7 9.3 (0.2) 20.5 Litigation recovery (4.1) (3.2) Gain on sale of office building (9.8) Environmental reserve reversal (6.6) Leveraged lease adjustment (3.5) Net income excluding Tax Adjustments and Other Items 141.4$ 163.7$ 174.9$ 94.7$ 74.6$ 95.0$ 133.8$ Earnings per Share 2006 2007 2008 2009 2010 2011 2012 Diluted earnings per share (GAAP) 2.64$ 3.43$ 3.88$ 1.70$ 1.72$ 2.35$ 2.88$ Tax Adjustments (0.10) (0.36) (0.13) (0.15) (0.24) (0.19) (0.50) Other Items: Realized/unrealized (gains)/losses on interest rate swaps at AAE 0.06 0.42 0.20 0.43 Litigation recovery (0.09) (0.07) Gain on sale of office building (0.19) Environmental reserve reversal (0.13) L veraged lease adjustment (0.08) EPS excluding Tax Adjustments and Other Items 2.54$ 3.07$ 3.49$ 1.97$ 1.59$ 2.01$ 2.81$

Reconciliation of non-GAAP measures 68 GATX on and off balance sheet assets 12/31/2012 (in millions) Consolidated on balance sheet assets 6,055.4$ Off balance sheet assets 884.5 Total on and off balance sheet assets 6,939.9$

GATX Corporation Financial Review For detailed financial information, please see the SUPPLEMENTAL FINANCIAL DATA contained in the Investor Relations section of www.gatx.com.


