Exhibit 13
FINANCIAL SECTION
Contents
42 | Management’s Discussion of Financial Responsibility | We begin with a letter from our Chief Executive and Financial Officers discussing our unyielding commitment to rigorous oversight, controllership, informative disclosure and visibility to investors. | |
43 | Management’s Annual Report on Internal Control Over Financial Reporting | In this report our Chief Executive and Financial Officers provide their assessment of the effectiveness of our internal control over financial reporting. | |
43 | Report of Independent Registered Public Accounting Firm | Our auditors, KPMG LLP, express their independent opinions on our financial statements and our internal control over financial reporting. | |
44 | Management’s Discussion and Analysis (MD&A) | ||
44 | Operations | We begin the Operations section of MD&A with an overview of our earnings, including a perspective on how the global economic environment has affected our businesses over the last three years. We then discuss various key operating results for GE industrial (GE) and financial services (GECS). Because of the fundamental differences in these businesses, reviewing certain information separately for GE and GECS offers a more meaningful analysis. Next we provide a description of our global risk management process. Our discussion of segment results includes quantitative and qualitative disclosure about the factors affecting segment revenues and profits, and the effects of recent acquisitions, dispositions and significant transactions. We conclude the Operations section with an overview of our operations from a global perspective and a discussion of environmental matters. | |
53 | Financial Resources and Liquidity | In the Financial Resources and Liquidity section of MD&A, we provide an overview of the major factors that affected our consolidated financial position and insight into the liquidity and cash flow activities of GE and GECS. | |
60 | Selected Financial Data | Selected Financial Data provides five years of financial information for GE and GECS. This table includes commonly used metrics that facilitate comparison with other companies. | |
60 | Critical Accounting Estimates | Critical Accounting Estimates are necessary for us to prepare our financial statements. In this section, we discuss what these estimates are, why they are important, how they are developed and uncertainties to which they are subject. | |
63 | Other Information | We conclude MD&A with a brief discussion of a new accounting standard that will be effective for us in 2006. | |
64 | Audited Financial Statements and Notes | ||
64 | Statement of Earnings | ||
64 | Consolidated Statement of Changes in Shareowners’ Equity | ||
66 | Statement of Financial Position | ||
68 | Statement of Cash Flows | ||
70 | Notes to Consolidated Financial Statements | ||
106 | Supplemental Information | We provide Supplemental Information to reconcile certain “non-GAAP” financial measures referred to in our report to the most closely associated GAAP financial measures. | |
108 | Glossary | For your convenience, we also provide a Glossary of key terms used in our financial statements. | |
We also present our financial information electronically at www.ge.com/investor. This award-winning site is interactive and informative. | |||
GE 2005 ANNUAL REPORT 41
Management’s Discussion of Financial Responsibility
We believe that great companies are built on a foundation of reliable financial information and compliance with the spirit and letter of the law. For GE, that foundation includes rigorous management oversight of, and an unyielding dedication to, controllership. The financial disclosures in this report are one product of our commitment to high quality financial reporting. In addition, we make every effort to adopt appropriate accounting policies, we devote our full resources to ensuring that those policies are applied properly and consistently and we do our best to fairly present our financial results in a manner that is complete and understandable. While we take pride in our financial reporting, we tirelessly seek improvements, and we welcome your suggestions.
RIGOROUS MANAGEMENT OVERSIGHT
Members of our corporate leadership team review each of our businesses routinely on matters that range from overall strategy and financial performance to staffing and compliance. Our business leaders monitor financial and operating systems, enabling us to identify potential opportunities and concerns at an early stage and positioning us to respond rapidly. Our Board of Directors oversees management’s business conduct, and our Audit Committee, which consists entirely of independent directors, oversees our internal control over financial reporting. We continually examine our governance practices in an effort to enhance investor trust and improve the Board’s overall effectiveness. The Board and its committees annually conduct a performance self-evaluation and recommend improvements. Our Presiding Director led three meetings of non-management directors this year, helping us sharpen our full Board meetings to better cover significant topics. Compensation policies for our executives are aligned with the long-term interests of GE investors. For example, payout of CEO equity grants is contingent on our Company meeting key performance metrics.
DEDICATION TO CONTROLLERSHIP
We maintain a dynamic system of internal controls and procedures-including internal control over financial reporting-designed to ensure reliable financial record-keeping, transparent financial reporting and disclosure, and protection of physical and intellectual property. We recruit, develop and retain a world-class financial team. Our internal audit function, 563 auditors, including 405 members of our Corporate Audit Staff, conducts thousands of financial, compliance and process improvement audits each year, in every geographic area, at every GE business. We recognized the contributions of our controllers and these auditors with a Chairman’s Leadership Award in 2005. The Audit Committee oversees the scope and evaluates the overall results of these audits. Our Audit Committee Chairman regularly attends GE Capital Services Board of Directors, Corporate Audit Staff and Controllership Council meetings. Our global integrity policies-“The Spirit & The Letter”-require compliance with law and policy, and pertain to such vital issues as upholding financial integrity and avoiding conflicts of interest. These integrity policies are available in 31 languages, and we have provided them to every one of GE’s more than 300,000 global employees, holding each of these individuals-from factory floor through top management-personally accountable for compliance. Our integrity policies reinforce key employee responsibilities around the world, and we inquire extensively about compliance. Our strong compliance culture reinforces these efforts by requiring employees to raise any compliance concerns and by prohibiting retribution for doing so. To facilitate open and candid communication, we have designated ombuds-persons throughout the Company to act as independent resources for reporting integrity or compliance concerns. We hold our directors, consultants, agents and independent contractors to the same integrity standards.
INFORMATIVE DISCLOSURE AND VISIBILITY TO INVESTORS
We are keenly aware of the importance of full and open presentation of our financial position and operating results and rely for this purpose on our disclosure controls and procedures, including our Disclosure Committee, which comprises senior executives with detailed knowledge of our businesses and the related needs of our investors. We ask this committee to review our compliance with accounting and disclosure requirements, to evaluate the fairness of our financial and non-financial disclosures, and to report their findings to us. We further ensure strong disclosure by holding more than 350 analyst and investor meetings every year. Recognizing the effectiveness of our disclosure policies, investors surveyed annually by Investor Relations magazine have given us 27 awards during the last 10 years, including “Best Report” and “Best Communication with the Retail Market” in 2005 and “Best Overall Investor Relations Program” by a mega-cap company for 2005 (and for seven of the last 10 years). We were also ranked “First Team” by Institutional Investor. We are in regular contact with representatives of the major rating agencies, and our debt continues to receive their highest ratings.
GE continues to earn the respect of the business world. We were named ”Global Most Admired Company” and “America’s Most Admired Company” by FORTUNE magazine; “World’s Most Respected” by Barron’s in its inaugural investor survey; and number two in the Financial Times/PricewaterhouseCoopers annual CEO survey-again placing first for corporate governance. GE was also named to the Dow Jones Sustainability Index for the second year in a row, which recognizes GE as a global leader in social responsibility and citizenship. We also published our first annual citizenship report in 2005, entitled “Our Actions.”
CONCLUSION
We welcome the strong oversight of our financial reporting activities by our independent registered public accounting firm, KPMG LLP, engaged by and reporting directly to the Audit Committee. U.S. legislation requires management to report on internal control over financial reporting and for auditors to render an opinion on such controls. Our report and the KPMG LLP report for 2005 appear on the following page.
We present our financial information proudly, with the expectation that those who use it will understand our Company, recognize our commitment to performance with integrity, and share our confidence in GE’s future.
| /s/ Jeffrey R. Immelt | /s/ Keith S. Sherin | |
| Jeffrey R. Immelt | Keith S. Sherin | |
| Chairman of the Board and | Senior Vice President, Finance | |
| Chief Executive Officer | and Chief Financial Officer |
GE 2005 ANNUAL REPORT 42
Management’s Annual Report on Internal Control Over Financial Reporting
The management of General Electric Company is responsible for establishing and maintaining adequate internal control over financial reporting for the Company. With the participation of the Chief Executive Officer and the Chief Financial Officer, our management conducted an evaluation of the effectiveness of our internal control over financial reporting based on the framework and criteria established in Internal Control-Integrated Framework, issued by the Committee of Sponsoring Organizations of the Treadway Commission. Based on this evaluation, our management has concluded that our internal control over financial reporting was effective as of December 31, 2005.
General Electric Company’s auditor, KPMG LLP, an independent registered public accounting firm, has issued an audit report on our management’s assessment of our internal control over financial reporting. This audit report appears below.
| /s/ Jeffrey R. Immelt | /s/ Keith S. Sherin | |
| Jeffrey R. Immelt | Keith S. Sherin | |
| Chairman of the Board and | Senior Vice President, Finance | |
| Chief Executive Officer | and Chief Financial Officer |
February 10, 2006
Report of Independent Registered Public Accounting Firm
To Shareowners and Board of Directors of General Electric Company
We have audited the accompanying statement of financial position of General Electric Company and consolidated affiliates (“GE”) as of December 31, 2005 and 2004, and the related statements of earnings, changes in shareowners’ equity and cash flows for each of the years in the three-year period ended December 31, 2005. We also have audited management’s assessment, included in the accompanying Management’s Annual Report on Internal Control Over Financial Reporting, that GE maintained effective internal control over financial reporting as of December 31, 2005, based on criteria established in Internal Control-Integrated Framework issued by the Committee of Sponsoring Organizations of the Treadway Commission (“COSO”). GE management is responsible for these consolidated financial statements, for maintaining effective internal control over financial reporting, and for its assessment of the effectiveness of internal control over financial reporting. Our responsibility is to express an opinion on these consolidated financial statements, an opinion on management’s assessment, and an opinion on the effectiveness of GE’s internal control over financial reporting based on our audits.
We conducted our audits in accordance with the standards of the Public Company Accounting Oversight Board (United States). Those standards require that we plan and perform the audits to obtain reasonable assurance about whether the financial statements are free of material misstatement and whether effective internal control over financial reporting was maintained in all material respects. Our audit of financial statements included examining, on a test basis, evidence supporting the amounts and disclosures in the financial statements, assessing the accounting principles used and significant estimates made by management, and evaluating the overall financial statement presentation. Our audit of internal control over financial reporting included obtaining an understanding of internal control over financial reporting, evaluating management’s assessment, testing and evaluating the design and operating effectiveness of internal control, and performing such other procedures as we considered necessary in the circumstances. We believe that our audits provide a reasonable basis for our opinions.
A company’s internal control over financial reporting is a process designed to provide reasonable assurance regarding the reliability of financial reporting and the preparation of financial statements for external purposes in accordance with generally accepted accounting principles. A company’s internal control over financial reporting includes those policies and procedures that (1) pertain to the maintenance of records that, in reasonable detail, accurately and fairly reflect the transactions and dispositions of the assets of the company; (2) provide reasonable assurance that transactions are recorded as necessary to permit preparation of financial statements in accordance with generally accepted accounting principles, and that receipts and expenditures of the company are being made only in accordance with authorizations of management and directors of the company; and (3) provide reasonable assurance regarding prevention or timely detection of unauthorized acquisition, use, or disposition of the company’s assets that could have a material effect on the financial statements.
Because of its inherent limitations, internal control over financial reporting may not prevent or detect misstatements. Also, projections of any evaluation of effectiveness to future periods are subject to the risk that controls may become inadequate because of changes in conditions, or that the degree of compliance with the policies or procedures may deteriorate.
In our opinion, the consolidated financial statements appearing on pages 64, 66, 68, 70-105 and the Summary of Operating Segments table on page 49 present fairly, in all material respects, the financial position of GE as of December 31, 2005 and 2004, and the results of its operations and its cash flows for each of the years in the three-year period ended December 31, 2005, in conformity with U.S. generally accepted accounting principles. Also, in our opinion, management’s assessment that GE maintained effective internal control over financial reporting as of December 31, 2005, is fairly stated, in all material respects, based on criteria established in Internal Control-Integrated Framework issued by COSO. Further-more, in our opinion, GE maintained, in all material respects, effective internal control over financial reporting as of December 31, 2005, based on criteria established in Internal Control-Integrated Framework issued by COSO.
As discussed in note 1 to the consolidated financial statements, GE in 2004 and 2003 changed its method of accounting for variable interest entities and in 2003 changed its method of accounting for asset retirement obligations.
Our audits of GE’s consolidated financial statements were made for the purpose of forming an opinion on the consolidated financial statements taken as a whole. The accompanying consolidating information appearing on pages 65, 67 and 69 is presented for purposes of additional analysis of the consolidated financial statements rather than to present the financial position, results of operations and cash flows of the individual entities. The consolidating information has been subjected to the auditing procedures applied in the audits of the consolidated financial statements and, in our opinion, is fairly stated in all material respects in relation to the consolidated financial statements taken as a whole.
/s/ KPMG LLP
KPMG LLP
Stamford, Connecticut
February 10, 2006
GE 2005 ANNUAL REPORT 43
MANAGEMENT'S DISCUSSION AND ANALYSIS
Operations
Our consolidated financial statements combine the industrial manufacturing, services and media businesses of General Electric Company (GE) with the financial services businesses of General Electric Capital Services, Inc. (GECS or financial services).
In the accompanying analysis of financial information, we sometimes use information derived from consolidated financial information but not presented in our financial statements prepared in accordance with U.S. generally accepted accounting principles (GAAP). Certain of these data are considered “non-GAAP financial measures” under the U.S. Securities and Exchange Commission (SEC) rules. For such measures, we have provided supplemental explanations and reconciliations in the Supplemental Information section.
We present Management’s Discussion of Operations in five parts: Overview of Our Earnings from 2003 through 2005, Global Risk Management, Segment Operations, Global Operations and Environmental Matters.
Overview of Our Earnings from 2003 through 2005
Our results over the last several years reflect the global economic environment in which we operate. During these years, the economy has grown, but at a rate that, in historic terms, has been relatively modest. Long-term interest rates have been stable. We also experienced a weaker, but recently strengthening, U.S. dollar, escalating energy costs and higher fossil fuel-related raw material prices. Market developments in two industries in which we operate-power generation and commercial aviation-also had significant effects on our results. As the following pages show, our diversification and risk management strategies enabled us to continue to grow revenues and earnings to record levels during this challenging time.
Of our six segments, Infrastructure (29% and 36% of consolidated three-year revenues and total segment profit, respectively) was one of the most significantly affected by the recent economic environment. Infrastructure’s Energy business was particularly affected by the period of unprecedented U.S. power industry demands that peaked in 2002. The return to normal demand levels was reflected in subsequent lower shipments of large heavy-duty gas turbine units. In 2003, we sold 175 such units, compared with 122 in 2004 and 127 in 2005. During these years we invested in other lines of power generation such as wind power and developed product services that we believe will position the Energy business well for continued growth in 2006 and beyond. We also continued to invest in market-leading technology and services at Aviation, Transportation and Water. We had 1,405 commercial aircraft on lease at December 31, 2005, an increase of 63 aircraft from last year. All of our aircraft were on lease at the end of 2005, and at that time we held $10.6 billion (list price) of multiple-year orders for various Boeing, Airbus and other aircraft, including 73 aircraft ($4.8 billion list price) scheduled for delivery in 2006, all under agreement to commence operations with commercial airline customers. Product services and sales of our Evolution Series locomotives continue to be strong.
Industrial (22% and 10% of consolidated three-year revenues and total segment profit, respectively) is particularly sensitive to economic conditions. Higher capacity, in combination with declining or weak volume growth in many of the industries in which it operates, resulted in increased competitive price pressures. The Consumer & Industrial business continued to grow through product innovation and its focus on high-end appliances. The Plastics business was hit particularly hard during these three years because of additional pressure from significant inflation in natural gas and certain raw materials such as benzene. Increased earnings at Plastics reflected improved product pricing.
We have achieved strong growth in our Healthcare and NBC Universal segments with a combination of organic growth and strategic acquisitions. Healthcare (10% and 11% of consolidated three-year revenues and total segment profit, respectively) realized benefits of acquisitions of Amersham plc (Amersham) in 2004 and Instrumentarium in 2003, expanding the breadth of our product and services offerings to the healthcare industry, and positioning us well for continued growth. NBC Universal (9% and 13% of consolidated three-year revenues and total segment profit, respectively) has developed into a diversified world-class media company over the last several years as the combination of NBC with Vivendi Universal Entertainment LLLP (VUE) in 2004 followed successful acquisitions of Telemundo and Bravo in 2002. NBC Universal revenues and segment profit rose 14% and 21%, respectively, in 2005, and 88% and 28%, respectively, in 2004, largely on acquisitions. We expect the technology and business model for the entertainment media industry to continue to evolve in the coming years and believe that NBC Universal is well positioned to compete in this challenging environment.
Commercial Finance and Consumer Finance (together, 26% and 31% of consolidated three-year revenues and total segment profit, respectively) are large, profitable growth businesses in which we continue to invest with confidence. In a challenging economic environment, these businesses grew earnings by a combined $1.3 billion and $1.0 billion in 2005 and 2004, respectively. Commercial Finance and Consumer Finance have delivered strong results through solid core growth, disciplined risk management and successful acquisitions. The most significant acquisitions affecting Commercial Finance and Consumer Finance results in
GE 2005 ANNUAL REPORT 44
MANAGEMENT'S DISCUSSION AND ANALYSIS
2005 were the commercial lending business of Transamerica Finance Corporation; WMC Finance Co. (WMC), a U.S. wholesale mortgage lender; Australian Financial Investments Group (AFIG), a residential mortgage lender in Australia; and the Transportation Financial Services Group of CitiCapital. These acquisitions collectively contributed $1.9 billion and $0.2 billion to 2005 revenues and net earnings, respectively.
Overall, acquisitions contributed $9.6 billion, $12.3 billion and $5.4 billion to consolidated revenues in 2005, 2004 and 2003, respectively. Our consolidated net earnings in 2005, 2004 and 2003 included approximately $0.9 billion, $1.2 billion and $0.5 billion, respectively, from acquired businesses. We integrate acquisitions as quickly as possible. Only revenues and earnings from the date we complete the acquisition through the end of the fourth following quarter are attributed to such businesses. Dispositions also affected our operations through lower revenues of $2.0 billion, $3.0 billion and $2.3 billion in 2005, 2004 and 2003, respectively. This resulted in lower earnings of $0.1 billion and $0.5 billion in 2005 and 2004, respectively, and higher earnings of $0.2 billion in 2003.
Significant matters relating to our Statement of Earnings are explained below.
INSURANCE EXIT. In 2005, we reduced our exposure to insurance in a disciplined fashion and our exit is now in sight.
• | On November 18, 2005, we announced that we had entered into an agreement with Swiss Reinsurance Company (Swiss Re) to sell the property and casualty insurance and reinsurance businesses and the European life and health operations of GE Insurance Solutions. The transaction is expected to close in the second quarter of 2006, subject to regulatory approvals and customary closing conditions. |
• | In May 2004, we completed the initial public offering of Genworth Financial, Inc. (Genworth), our formerly wholly-owned subsidiary that conducted most of our consumer insurance business, including life and mortgage insurance operations. Throughout 2005, we continued to reduce our ownership in Genworth, currently at 18%. We intend to continue to dispose of our remaining shares in 2006, subject to market conditions. |
We reported both the portions of GE Insurance Solutions described above and Genworth as discontinued operations for all periods presented. Unless otherwise indicated, we refer to captions such as revenues and earnings from continuing operations simply as “revenues” and “earnings” throughout this Management’s Discussion and Analysis. Similarly, discussion of other matters in our consolidated financial statements relates to continuing operations unless otherwise indicated.
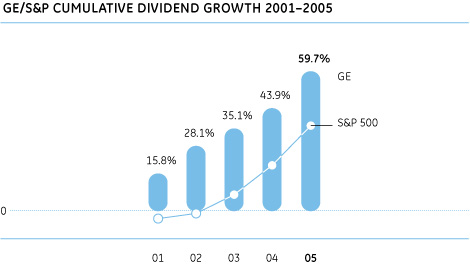
WE DECLARED $9.6 BILLION IN DIVIDENDS IN 2005. Per-share dividends of $0.91 were up 11% from 2004, following a 6% increase from the preceding year. In December 2005, our Board of Directors raised our quarterly dividend 14% to $0.25 per share. We have rewarded our shareowners with over 100 consecutive years of dividends, with 30 consecutive years of dividend growth, and our dividend growth for the past five years has significantly outpaced that of companies in the Standard & Poor’s (S&P) 500 stock index.
Except as otherwise noted, the analysis in the remainder of this section presents the results of GE (with GECS included on a one-line basis) and GECS. See the Segment Operations section for a more detailed discussion of the businesses within GE and GECS.
GE SALES OF PRODUCT SERVICES were $27.4 billion in 2005, a 9% increase over 2004. Increases in product services in 2005 and 2004 were widespread, led by continued strong growth at Infrastructure and Healthcare. Operating profit from product services was approximately $7.0 billion in 2005, up 14% from 2004, reflecting ongoing improvements at Infrastructure and Healthcare.
POSTRETIREMENT BENEFIT PLANS reduced pre-tax earnings by $1.7 billion, $1.2 billion and $0.2 billion in 2005, 2004 and 2003, respectively. Costs of our principal pension plans increased over the last three years primarily because of the effects of:
• | Prior years investment losses which reduced pre-tax earnings by $0.5 billion, $0.6 billion and $0.4 billion in 2005, 2004 and 2003, respectively, and |
• | Lowering pension discount rates which reduced pre-tax earnings by $0.1 billion, $0.4 billion and $0.2 billion in 2005, 2004 and 2003, respectively. |
Considering current and expected asset allocations, as well as historical and expected returns on various categories of assets in which our plans are invested, we have assumed that long-term returns on our principal pension plan assets would be 8.5% throughout this period and in 2006. U.S. generally accepted accounting principles provide for recognition of differences between assumed and actual returns over a period no longer than the average future service of employees.
We believe that our postretirement benefit costs will increase again in 2006 for a number of reasons, including further reduction in discount rates at December 31, 2005, and continued recognition of prior years investment losses relating to our principal pension plans.
GE 2005 ANNUAL REPORT 45
MANAGEMENT'S DISCUSSION AND ANALYSIS
Our principal pension plans had a surplus of $5.8 billion at December 31, 2005. We will not make any contributions to the GE Pension Plan in 2006. To the best of our ability to forecast the next five years, we do not anticipate making contributions to that plan so long as expected investment returns are achieved. At December 31, 2005, the fair value of assets for our other pension plans was $2.9 billion less than their respective projected benefit obligations. We expect to contribute $0.4 billion to these plans in 2006, the same amount that was contributed in 2005 and 2004, respectively.
The funded status of our postretirement benefit plans and future effects on operating results depend on economic conditions and investment performance. See notes 6 and 7 for additional information about funded status, components of earnings effects and actuarial assumptions. See the Critical Accounting Estimates section for discussion of pension assumptions.
GE OTHER COSTS AND EXPENSES are selling, general and administrative expenses, which increased 11% to $13.3 billion in 2005, following a 22% increase in 2004, substantially the result of acquisitions in both years.
GE OPERATING PROFIT is earnings from continuing operations before interest and other financial charges, income taxes and the effects of accounting changes. GE operating profit was $13.3 billion in 2005, up from $11.4 billion in 2004 and $11.6 billion in 2003 (14.4%, 13.7% and 16.4% of GE total revenues in 2005, 2004 and 2003, respectively). The increase in 2005 operating profit reflected higher productivity (principally Healthcare and Infrastructure), volume (Infrastructure and NBC Universal) and prices (Industrial), partially offset by higher other costs across all segments. The decrease in 2004 reflected the combination of higher material and other costs (Industrial and NBC Universal), higher pension costs, lower prices (Infrastructure and Healthcare) and lower productivity (Infrastructure and NBC Universal), partially offset by increased volume (NBC Universal and Healthcare, reflecting 2004 combination/acquisition activity).
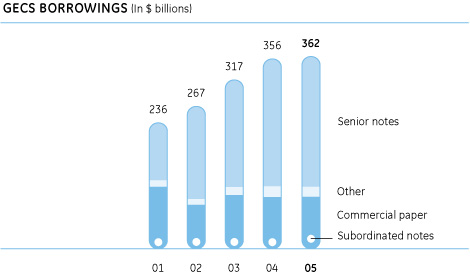
INTEREST ON BORROWINGS AND OTHER FINANCIAL CHARGES amounted to $15.2 billion, $11.7 billion and $10.5 billion in 2005, 2004 and 2003, respectively. Substantially all of our borrowings are through GECS, where interest expense was $14.3 billion, $11.1 billion and $9.9 billion in 2005, 2004 and 2003, respectively. Changes over the three-year period reflected increased average borrowings and increased interest rates. GECS average borrowings were $346.1 billion, $319.2 billion and $305.0 billion in 2005, 2004 and 2003, respectively. GECS average composite effective interest rate was 4.2% in 2005, compared with 3.5% in 2004 and 3.2% in 2003. Proceeds of these borrowings were used in part to finance asset growth and acquisitions. In 2005, GECS average assets of $487.0 billion were 10% higher than in 2004, which in turn were 15% higher than in 2003. See the Financial Resources and Liquidity section for a discussion of interest rate risk management.
INCOME TAXES are a significant cost. As a global commercial enterprise, our tax rates are affected by many factors, including our global mix of earnings, legislation, acquisitions, dispositions and tax characteristics of our income. Our tax returns are routinely audited and settlements of issues raised in these audits sometimes affect our tax provisions.
Income taxes on consolidated earnings from continuing operations before accounting changes were 17.4% in 2005, compared with 17.6% in 2004 and 21.8% in 2003. Our consolidated income tax rate was essentially unchanged in 2005 from 2004 because the 2005 tax benefits from a reorganization of our aircraft leasing business and from the growth in lower-taxed global operations were about the same as the 2004 tax benefits from favorable U.S. Internal Revenue Service (IRS) settlements, the NBC Universal combination, the 2004 reorganization of our aircraft leasing business and a lower tax rate on the sale of a portion of Gecis, our business process outsourcing operation (now Genpact). Our consolidated income tax rate decreased by 4.2 percentage points in 2004 as the benefits listed above for 2004 were greater than the tax benefits from certain business dispositions in 2003. A more detailed analysis of differences between the U.S. federal statutory rate and the consolidated rate, as well as other information about our income tax provisions, is provided in note 8. The nature of business activities and associated income taxes differ for GE and for GECS and a separate analysis of each is presented in the paragraphs that follow.
Because GE tax expense does not include taxes on GECS earnings, the GE effective tax rate is best analyzed in relation to GE earnings excluding GECS. GE pre-tax earnings from continuing operations before accounting changes excluding GECS earnings from continuing operations before accounting changes were $11.9 billion, $10.4 billion and $10.7 billion for 2005, 2004 and 2003, respectively. On this basis, GE’s effective tax rate was 23.1% in 2005, 19.0% in 2004 and 26.7% in 2003. The increase in the 2005 rate over the 2004 rate was primarily attributable to the lack of current-year counterparts to the 2004 settlements with the IRS and 2004 tax benefits associated with the NBC Universal combination, both discussed below, that together reduced the 2004 rate by 7.2 percentage points. Partially offsetting this increase were the favorable impact of a number of audit
GE 2005 ANNUAL REPORT 46
MANAGEMENT'S DISCUSSION AND ANALYSIS
resolutions with taxing authorities and our 2005 repatriation of earnings at the reduced U.S. tax rate provided in 2004 legislation (together representing a 3.2 percentage point reduction of the GE tax rate). These 2005 tax benefits are reflected in note 8 in the lines “All other-net” (1.6 percentage points) and “Tax on global activities including exports” (1.6 percentage points).
The 2004 rate reduction was primarily a result of two items that decreased the 2004 GE tax rate by 7.2 percentage points-settling several issues with the IRS for the years 1985 through 1999 and tax benefits associated with the NBC Universal combination. As part of the IRS settlements, we closed two significant issues: the 1997 tax-free exchange of the Lockheed Martin convertible preferred stock we received on the disposition of our Aerospace business in 1993, and a 1998 tax loss on the sale of a Puerto Rican subsidiary. The tax portion of these settlements is included in the line “IRS settlements of Lockheed Martin tax-free exchange/Puerto Rico subsidiary loss” in note 8. The tax benefits associated with the NBC Universal combination are included in the line “All other-net” in note 8. The 2004 GE effective tax rate also reflects lower pre-tax income primarily from lower earnings in the Energy business and higher costs related to our principal pension plans. Partially offsetting these changes was the non-recurrence of certain 2003 tax benefits.
GECS effective tax rate decreased to 10.8% in 2005 from 16.2% in 2004 and 14.3% in 2003. The 2005 GECS rate reflects the net benefits, discussed below, of a reorganization of our aircraft leasing business; and an increase in lower-taxed earnings from global operations. Together, these items more than account for the 6.9 percentage point decrease in rate from 2004 reflected in the line “Tax on global activities including exports” in note 8. Partially offsetting these benefits was the nonrecurrence of the benefits from 2004 favorable settlements with the IRS and the low-taxed disposition of a majority interest in Genpact. The lack of counterparts to these items increased the 2005 GECS tax rate by 2.2 percentage points.
The increase in the GECS effective tax rate from 2003 to 2004 also reflected the net benefits, discussed below, of a reorganization of our aircraft leasing business, which decreased the 2004 effective tax rate 1.7 percentage points and is included in the line “Tax on global activities including exports” in note 8; tax benefits from favorable IRS settlements, which decreased the 2004 effective tax rate 1.3 percentage points and is included in the line “All other-net” in note 8; and the low-taxed disposition of a majority interest in Genpact which decreased the 2004 effective tax rate 0.9 percentage points, and is included in the line “Tax on global activities including exports” in note 8. Offsetting these benefits were the effects of higher pre-tax income and the nonrecurrence of a 2003 tax benefit on the disposition of shares of ERC Life Reinsurance Corporation.
As a result of the repeal of the extraterritorial income (ETI) taxing regime as part of the American Jobs Creation Act of 2004 (the Act), our aircraft leasing business no longer qualifies for a reduced U.S. tax rate. However, the Act also extended to aircraft leasing, the U.S. tax deferral benefits that were already available to other GE non-U.S. active operations. These legislative changes, coupled with a reorganization of our aircraft leasing business and a favorable Irish tax ruling, decreased the GECS effective tax rate 3.0 percentage points in 2005 and 1.7 percentage points in 2004.
Global Risk Management
A disciplined approach to risk is important in a diversified organization such as ours in order to ensure that we are executing according to our strategic objectives and that we only accept risk for which we are adequately compensated. It is necessary for us to manage risk at the individual transaction level, and to consider aggregate risk at the customer, industry, geography and collateral-type levels, where appropriate.
The GE Board of Directors oversees the risk management process through clearly established delegation of authority. Board and committee meeting agendas are jointly developed with management to cover risk topics presented to our Corporate Risk Committee, including environmental, compliance, liquidity, credit, market and event risks.
The GECS Board of Directors oversees the risk management process for financial services, and approves directly or by delegation all significant acquisitions and dispositions as well as borrowings and investments. All participants in the risk management process must comply with approval limits established by the Board.
The GECS Chief Risk Officer is responsible, through the Corporate Risk Function, for establishing standards for the measurement, reporting and limiting of risk; for managing and evaluating risk managers; for approving risk management policies; and for reviewing major risk exposures and concentrations across the organization. The GECS Corporate Risk Function analyzes certain business risks and assesses them in relation to aggregate risk appetite and approval limits set by the GECS Board of Directors.
Threshold responsibility for identifying, quantifying and mitigating risks is assigned to our individual businesses. Because the risks and their interdependencies are complex, we apply a Six Sigma-based analytical approach to each major product line that monitors performance against external benchmarks, proactively manages changing circumstances, provides early warning detection of risk and facilitates communication to all levels of authority. Other corporate functions such as Financial Planning and Analysis, Treasury, Legal and our Corporate Audit Staff support business-level risk management. Businesses that, for example, hedge financial risk with derivative financial instruments must do so using our centrally-managed Treasury function, providing assurance that the business strategy complies with our corporate policies and achieves economies of scale. We review risks periodically with business-level risk managers, senior management and our Board of Directors.
GECS employs about 11,000 dedicated risk professionals, including 6,600 involved in collection activities and 400 specialized asset managers who evaluate leased asset residuals and remarket off-lease equipment.
GE 2005 ANNUAL REPORT 47
MANAGEMENT'S DISCUSSION AND ANALYSIS
GE and GECS manage a variety of risks including liquidity, credit, market and event risks.
• | Liquidity risk is the risk of being unable to accommodate liability maturities, fund asset growth and meet contractual obligations through access to funding at reasonable market rates. Additional information about our liquidity and how we manage this risk can be found in the Financial Resources and Liquidity section and in notes 18 and 27. |
• | Credit risk is the risk of financial loss arising from a customer or counterparty failure to meet its contractual obligations. We face credit risk in our lending and leasing activities (see the Financial Resources and Liquidity and Critical Accounting Estimates sections and notes 1, 13, 14 and 29) and derivative financial instruments activities (see note 27). |
• | Market risk is the potential loss in value of investment and other asset and liability portfolios, including financial instruments, caused by changes in market variables, such as interest and currency exchange rates and equity and commodity prices. We are exposed to market risk in the normal course of our business operations as a result of our ongoing investing and funding activities. We attempt to mitigate the risks to our various portfolios arising from changes in interest and currency exchange rates in a variety of ways that often include offsetting positions in local currencies or selective use of derivatives. Additional information about how we mitigate the risks to our various portfolios from changes in interest and currency exchange rates can be found in the Financial Resources and Liquidity section and in note 27. |
• | Event risk is that body of risk beyond liquidity, credit and market risk. Event risk includes the possibility of adverse occurrences both within and beyond our control. Examples of event risk include natural disasters, availability of necessary materials, guarantees of product performance and business interruption. This type of risk is often insurable, and success in managing this risk is ultimately determined by the balance between the level of risk retained or assumed and the cost of transferring the risk to others. The decision as to the appropriate level of event risk to retain or cede is evaluated in the framework of business decisions. Additional information about certain event risk can be found in note 29. |
Segment Operations
Operating segments comprise our six businesses focused on the broad markets they serve: Infrastructure, Industrial, Healthcare, NBC Universal, Commercial Finance and Consumer Finance. For segment reporting purposes, certain GECS businesses are included in the industrial operating segments that actively manage such businesses and report their results for internal performance measurement purposes. These include Aviation Financial Services, Energy Financial Services and Transportation Finance reported in the Infrastructure segment, and Equipment Services reported in the Industrial segment.
In the fourth quarter of 2005, we commenced reporting businesses affected by our insurance exit as discontinued operations for all periods presented. These businesses were previously reported in the Commercial Finance segment. Also, during the fourth quarter of 2005, our insurance activities, previously reported in the Commercial Finance segment, were transferred to Corporate items and eliminations for all periods presented.
Segment profit is determined based on internal performance measures used by the Chief Executive Officer to assess the performance of each business in a given period. In connection with that assessment, the Chief Executive Officer may exclude matters such as charges for restructuring; rationalization and other similar expenses; in-process research and development and certain other acquisition-related charges and balances; technology development costs; certain gains and losses from dispositions; and litigation settlements or other charges, responsibility for which preceded the current management team.
Segment profit always excludes the effects of principal pension plans and results reported as discontinued operations and accounting changes. Segment profit excludes or includes interest and other financial charges and income taxes according to how a particular segment’s management is measured-excluded in determining segment profit, which we refer to as “operating profit,” for Healthcare, NBC Universal and the industrial businesses of the Industrial and Infrastructure segments; included in determining segment profit, which we refer to as “net earnings,” for Commercial Finance, Consumer Finance, and the financial services businesses of the Industrial segment (Equipment Services) and the Infrastructure segment (Aviation Financial Services, Energy Financial Services and Transportation Finance).

GE 2005 ANNUAL REPORT 48
MANAGEMENT'S DISCUSSION AND ANALYSIS
Summary of Operating Segments
General Electric Company and consolidated affiliates | ||||||||||||||||
| (In millions) | 2005 | 2004 | 2003 | 2002 | 2001 | |||||||||||
REVENUES | ||||||||||||||||
Infrastructure | $ | 41,803 | $ | 37,373 | $ | 36,569 | $ | 40,119 | $ | 36,419 | ||||||
| Industrial | 32,631 | 30,722 | 24,988 | 26,154 | 26,101 | |||||||||||
| Healthcare | 15,153 | 13,456 | 10,198 | 8,955 | 8,409 | |||||||||||
| NBC Universal | 14,689 | 12,886 | 6,871 | 7,149 | 5,769 | |||||||||||
| Commercial Finance | 20,646 | 19,524 | 16,927 | 15,688 | 14,610 | |||||||||||
| Consumer Finance | 19,416 | 15,734 | 12,845 | 10,266 | 9,508 | |||||||||||
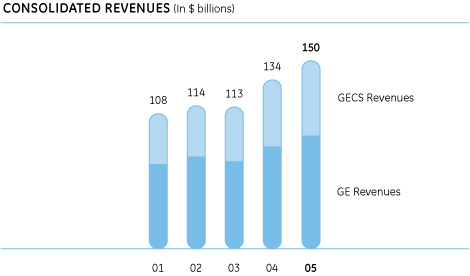
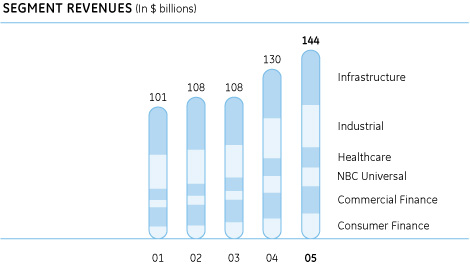
| Total segment revenues | 144,338 | 129,695 | 108,398 | 108,331 | 100,816 | |||||||||||
| Corporate items and eliminations | 5,364 | 4,786 | 4,488 | 5,525 | 6,742 | |||||||||||
CONSOLIDATED REVENUES | $ | 149,702 | $ | 134,481 | $ | 112,886 | $ | 113,856 | $ | 107,558 | ||||||
SEGMENT PROFIT | ||||||||||||||||
Infrastructure | $ | 7,769 | $ | 6,797 | $ | 7,362 | $ | 9,178 | $ | 7,869 | ||||||
| Industrial | 2,559 | 1,833 | 1,385 | 1,837 | 2,642 | |||||||||||
| Healthcare | 2,665 | 2,286 | 1,701 | 1,546 | 1,498 | |||||||||||
| NBC Universal | 3,092 | 2,558 | 1,998 | 1,658 | 1,408 | |||||||||||
| Commercial Finance | 4,290 | 3,570 | 2,907 | 2,170 | 1,784 | |||||||||||
| Consumer Finance | 3,050 | 2,520 | 2,161 | 1,799 | 1,602 | |||||||||||
| Total segment profit | 23,425 | 19,564 | 17,514 | 18,188 | 16,803 | |||||||||||
| Corporate items and eliminations | (968 | ) | (327 | ) | 50 | 2,016 | 1,155 | |||||||||
| GE interest and other financial charges | (1,432 | ) | (979 | ) | (941 | ) | (569 | ) | (817 | ) | ||||||
| GE provision for income taxes | (2,750 | ) | (1,973 | ) | (2,857 | ) | (3,837 | ) | (4,193 | ) | ||||||
| Earnings from continuing operations | ||||||||||||||||
| before accounting changes | 18,275 | 16,285 | 13,766 | 15,798 | 12,948 | |||||||||||
| Earnings (loss) from discontinued | ||||||||||||||||
| operations, net of taxes | (1,922 | ) | 534 | 2,057 | (616 | ) | 1,130 | |||||||||
| Earnings before accounting changes | 16,353 | 16,819 | 15,823 | 15,182 | 14,078 | |||||||||||
| Cumulative effect of accounting changes | - | - | (587 | ) | (1,015 | ) | (287 | ) | ||||||||
CONSOLIDATED NET EARNINGS | $ | 16,353 | $ | 16,819 | $ | 15,236 | $ | 14,167 | $ | 13,791 | ||||||
The notes to consolidated financial statements are an integral part of this summary.
In addition to providing information on segments in their entirety, we have also provided supplemental information for certain businesses within the segments.
For additional information about our segments, see note 26.
INFRASTRUCTURE
| (In millions) | 2005 | 2004 | 2003 | |||||||
REVENUES | $ | 41,803 | $ | 37,373 | $ | 36,569 | ||||
SEGMENT PROFIT | $ | 7,769 | $ | 6,797 | $ | 7,362 | ||||
| (In millions) | 2005 | 2004 | 2003 | |||||||
REVENUES | ||||||||||
| Aviation | $ | 11,904 | $ | 11,094 | $ | 9,808 | ||||
| Aviation Financial Services | 3,504 | 3,159 | 2,881 | |||||||
| Energy | 16,525 | 14,586 | 16,611 | |||||||
| Energy Financial Services | 1,349 | 972 | 805 | |||||||
| Oil & Gas | 3,598 | 3,135 | 2,842 | |||||||
| Transportation | 3,577 | 3,007 | 2,543 | |||||||
SEGMENT PROFIT | ||||||||||
| Aviation | $ | 2,573 | $ | 2,238 | $ | 1,809 | ||||
| Aviation Financial Services | 764 | 520 | 506 | |||||||
| Energy | 2,665 | 2,543 | 3,875 | |||||||
| Energy Financial Services | 646 | 376 | 280 | |||||||
| Oil & Gas | 411 | 331 | 264 | |||||||
| Transportation | 524 | 516 | 450 | |||||||
Infrastructure revenues rose 12%, or $4.4 billion, in 2005 as higher volume ($4.3 billion) was partially offset by lower prices ($0.6 billion) at the industrial businesses in the segment. The increase in volume was primarily at Energy, Aviation and Transportation. The decrease in prices was primarily at Energy, and was partially offset by increased prices at Transportation and Aviation. Revenues also increased as a result of organic revenue growth at Energy Financial Services ($0.4 billion) and Aviation Financial Services ($0.3 billion).
Segment profit rose 14% to $7.8 billion, compared with $6.8 billion in 2004, as higher volume ($1.0 billion) and productivity ($0.2 billion including customer settlements and contract terminations) more than offset lower prices ($0.6 billion) and the effects of higher material and other costs ($0.3 billion) at the industrial businesses in the segment. The increase in volume primarily related to Energy, Aviation and Transportation. Segment profit also increased as a result of increased net earnings at the financial services businesses. This increase reflected core growth at Energy Financial Services ($0.3 billion) and core growth at Aviation Financial Services ($0.2 billion), including growth in lower-taxed earnings from global operations related to a reorganization of our aircraft leasing operations.
GE 2005 ANNUAL REPORT 49
MANAGEMENT'S DISCUSSION AND ANALYSIS
Infrastructure revenues increased 2%, or $0.8 billion, in 2004 as the weaker U.S. dollar ($0.5 billion), primarily at Energy, and higher volume ($0.4 billion) were partially offset by lower prices ($0.6 billion) at the industrial businesses of the segment, primarily at Energy. The increase in volume was the net result of increased sales in commercial services and military engines at Aviation and locomotives at Transportation, partially offset by lower sales at Energy. Energy sold 122 large heavy-duty gas turbines in 2004, compared with 175 in 2003. Financial services activity, primarily at Aviation Financial Services and Energy Financial Services, increased revenues primarily from organic revenue growth ($0.4 billion) and acquisitions ($0.1 billion).
Segment profit fell 8%, or $0.6 billion, in 2004 as lower material costs ($0.3 billion), primarily at Energy, and higher volume ($0.1 billion) were more than offset by lower prices ($0.6 billion) and lower productivity ($0.6 billion) at the industrial businesses of the segment. The lower productivity was the net effect of lower productivity at Energy, primarily from the anticipated decline in higher margin gas turbine sales and a decrease in customer contract termination fees, partially offset by higher productivity at Aviation. Segment profit from the financial services businesses, primarily Energy Financial Services, increased $0.1 billion as a result of core growth.
Infrastructure orders were $38.4 billion in 2005, up from $34.0 billion in 2004. The $29.2 billion total backlog at year-end 2005 comprised unfilled product orders of $18.8 billion (of which 65% was scheduled for delivery in 2006) and product service orders of $10.4 billion scheduled for 2006 delivery. Comparable December 31, 2004, total backlog was $27.8 billion, of which $18.2 billion was for unfilled product orders and $9.6 billion for product services orders.
INDUSTRIAL
| (In millions) | 2005 | 2004 | 2003 | |||||||
REVENUES | $ | 32,631 | $ | 30,722 | $ | 24,988 | ||||
SEGMENT PROFIT | $ | 2,559 | $ | 1,833 | $ | 1,385 | ||||
| (In millions) | 2005 | 2004 | 2003 | |||||||
REVENUES | ||||||||||
| Consumer & Industrial | $ | 14,092 | $ | 13,767 | $ | 12,843 | ||||
| Equipment Services | 6,627 | 6,571 | 3,357 | |||||||
| Plastics | 6,606 | 6,066 | 5,501 | |||||||
SEGMENT PROFIT | ||||||||||
| Consumer & Industrial | $ | 871 | $ | 716 | $ | 577 | ||||
| Equipment Services | 197 | 82 | (76 | ) | ||||||
| Plastics | 867 | 566 | 503 | |||||||
Industrial revenues rose 6%, or $1.9 billion, in 2005 on higher prices ($1.5 billion), higher volume ($0.2 billion) and the weaker U.S. dollar ($0.2 billion) at the industrial businesses in the segment. We realized price increases primarily at Plastics and Consumer & Industrial. Volume increases related primarily to the acquisitions of Edwards Systems Technology and InVision Technologies, Inc. by our Security business, but were partially offset by lower volume at Plastics. Revenues at Equipment Services also increased as a result of organic revenue growth ($0.4 billion) and acquisitions ($0.1 billion), partially offset by the effects of the 2004 disposition of IT Solutions ($0.4 billion). Segment profit rose 35%, or $0.6 billion, at the industrial businesses in the segment in 2005 as price increases ($1.5 billion) and higher volume ($0.1 billion) more than offset higher material and other costs ($0.8 billion), primarily from commodities such as benzene and natural gas at Plastics, and lower productivity ($0.2 billion). Segment profit at Equipment Services also increased as a result of improved operating performance, reflecting core growth ($0.1 billion).
Industrial revenues rose 23%, or $5.7 billion, in 2004 on higher volume ($2.0 billion), primarily at Consumer & Industrial and Plastics, the weaker U.S. dollar ($0.5 billion) and higher prices ($0.1 billion) at the industrial businesses in the segment. Higher prices at Plastics, as demand for plastic resins increased, were partially offset by lower prices at Consumer & Industrial. On January 1, 2004, we consolidated Penske Truck Leasing Co., L.P. (Penske), previously accounted for using the equity method. As a result, consolidated operating lease rentals and other income increased by $2.6 billion and $0.6 billion, respectively, from 2003 levels. Segment profit rose 32%, or $0.4 billion in 2004, as productivity ($0.8 billion), primarily at Consumer & Industrial and Plastics, higher volume ($0.1 billion) and higher prices ($0.1 billion) more than offset higher material and other costs ($0.8 billion), primarily from commodities such as benzene and natural gas at Plastics. Segment profit at Equipment Services also rose on improved operating performance ($0.2 billion). See Corporate Items and Eliminations for a discussion of items not allocated to this segment.
HEALTHCARE revenues increased 13% to $15.2 billion in 2005 as higher volume ($2.1 billion), including $0.8 billion from the Amersham acquisition in the second quarter of 2004, and the weaker U.S. dollar ($0.1 billion) more than offset lower prices ($0.4 billion). Operating profit of $2.7 billion was 17% higher than in 2004 as productivity ($0.5 billion) and higher volume ($0.4 billion) more than offset lower prices ($0.4 billion) and higher labor and other costs ($0.1 billion).
Healthcare revenues increased 32% to $13.5 billion in 2004 as higher volume ($3.3 billion), primarily from acquisitions including Amersham ($2.2 billion) and Instrumentarium ($1.0 billion), and the weaker U.S. dollar ($0.4 billion) more than offset lower prices ($0.4 billion). Operating profit of $2.3 billion in 2004 was 34% higher than in 2003 as the effects of higher volume ($0.5 billion) and productivity ($0.5 billion) more than offset the effects of lower prices ($0.4 billion). See Corporate Items and Eliminations for a discussion of items not allocated to this segment.
Orders received by Healthcare in 2005 were $15.6 billion, compared with $13.7 billion in 2004. The $5.4 billion total backlog at year-end 2005 comprised unfilled product orders of $3.5 billion (of which 90% was scheduled for delivery in 2006) and product services orders of $1.9 billion scheduled for 2006 delivery. Comparable December 31, 2004, total backlog was $4.7 billion, of which $2.8 billion was for unfilled product orders and $1.9 billion for product services orders.
GE 2005 ANNUAL REPORT 50
MANAGEMENT'S DISCUSSION AND ANALYSIS
NBC UNIVERSAL revenues rose 14%, or $1.8 billion, to $14.7 billion in 2005, reflecting a number of factors, the largest of which was the full-year contribution from the May 2004 combination of NBC with VUE. The full-year ownership of VUE was reflected in higher film revenues ($1.6 billion), growth of our entertainment cable business ($0.6 billion), and higher revenues from television production operations ($0.3 billion) and theme parks operations ($0.1 billion). Also contributing to the increase in 2005 revenues was $0.6 billion, partially from settling obligations related to preferred interests previously issued by VUE and partially from settling certain contracts as part of our MSNBC restructuring. Partial offsets arose from the lack of a current-year counterpart to the 2004 Olympic Games broadcasts ($0.9 billion), effects of lower ratings on network and station ad sales ($0.4 billion) and an investment impairment ($0.1 billion). Segment profit rose 21%, or $0.5 billion, in 2005 as the full-year ownership of VUE contributed $0.6 billion to higher earnings, including improvements in the film ($0.3 billion), entertainment cable ($0.3 billion) and television production ($0.2 billion) businesses. Effects of the preferred interests and restructuring transactions ($0.6 billion) were more than offset by the effects of lower earnings from network and station operations ($0.6 billion) and the investment impairment loss ($0.1 billion).
Revenues were up sharply in 2004, to $12.9 billion, and segment profit was up 28% to $2.6 billion. Operations were significantly affected by the May combination of NBC and VUE, which increased revenues by $4.7 billion and, net of effects of the 20% minority interest, operating profit by $0.6 billion. Other significant 2004 factors affecting results were the Olympic Games broadcasts ($0.9 billion higher revenues), price increases ($0.2 billion of revenues and operating profit), volume ($0.3 billion of revenues and $0.1 billion of operating profit) and $0.3 billion higher NBC Universal operating costs.
COMMERCIAL FINANCE
| (In millions) | 2005 | 2004 | 2003 | |||||||
REVENUES | $ | 20,646 | $ | 19,524 | $ | 16,927 | ||||
SEGMENT PROFIT | $ | 4,290 | $ | 3,570 | $ | 2,907 | ||||
| December 31 (In millions) | 2005 | 2004 | |||||
TOTAL ASSETS | $ | 190,546 | $ | 184,388 | |||
| (In millions) | 2005 | 2004 | 2003 | |||||||
REVENUES | ||||||||||
| Capital Solutions | $ | 11,476 | $ | 11,503 | $ | 9,893 | ||||
| Real Estate | 3,492 | 3,084 | 2,956 | |||||||
SEGMENT PROFIT | ||||||||||
| Capital Solutions | $ | 1,515 | $ | 1,325 | $ | 1,184 | ||||
| Real Estate | 1,282 | 1,124 | 947 | |||||||
| December 31 (In millions) | 2005 | 2004 | |||||
ASSETS | |||||||
| Capital Solutions | $ | 87,306 | $ | 80,514 | |||
| Real Estate | 35,323 | 39,515 | |||||
Commercial Finance revenues and net earnings increased 6% and 20%, respectively, compared with 2004. Revenues during 2005 and 2004 included $1.0 billion and $0.3 billion from acquisitions, respectively, and in 2005 were reduced by $0.7 billion as a result of dispositions. Revenues during 2005 also increased $1.1 billion as a result of organic revenue growth ($0.8 billion) and the weaker U.S. dollar ($0.3 billion). The increase in net earnings resulted primarily from core growth ($0.6 billion), including growth in lower-taxed earnings from global operations, acquisitions ($0.2 billion) and the weaker U.S. dollar ($0.1 billion), partially offset by lower securitizations ($0.1 billion).
Commercial Finance revenues and net earnings increased 15% and 23%, respectively, compared with 2003. The increase in revenues resulted primarily from acquisitions ($2.2 billion) and the weaker U.S. dollar ($0.6 billion), partially offset by lower securitizations ($0.2 billion). The increase in net earnings resulted primarily from acquisitions ($0.4 billion), core growth ($0.3 billion) and the weaker U.S. dollar ($0.1 billion), partially offset by lower securitizations ($0.1 billion).
CONSUMER FINANCE
| (In millions) | 2005 | 2004 | 2003 | |||||||
REVENUES | $ | 19,416 | $ | 15,734 | $ | 12,845 | ||||
SEGMENT PROFIT | $ | 3,050 | $ | 2,520 | $ | 2,161 |
| December 31 (In millions) | 2005 | 2004 | |||||
TOTAL ASSETS | $ | 158,829 | $ | 151,255 | |||
Consumer Finance revenues and net earnings increased 23% and 21%, respectively, compared with 2004. Revenues for 2005 included $1.9 billion from acquisitions. Revenues during 2005 also increased $1.8 billion as a result of organic revenue growth ($1.5 billion) and the weaker U.S. dollar ($0.3 billion). The increase in net earnings resulted primarily from core growth ($0.6 billion), including growth in lower-taxed earnings from global operations, and acquisitions ($0.1 billion), partially offset by increased costs to launch new products and promote brand awareness ($0.2 billion).
Consumer Finance revenues and net earnings increased 22% and 17%, respectively, from 2003. The increase in revenues resulted primarily from organic revenue growth ($1.0 billion), acquisitions ($1.0 billion) and the weaker U.S. dollar ($0.8 billion). Organic revenue growth was achieved despite the absence of a 2004 counterpart to the 2003 gain on sale of The Home Depot private-label credit card receivables ($0.9 billion). The increase in net earnings resulted from core growth ($0.6 billion), including growth in lower-taxed earnings from global operations, acquisitions ($0.1 billion), and the weaker U.S. dollar ($0.1 billion), partially offset by the effects of The Home Depot private-label credit card receivables ($0.4 billion) and increased costs to launch new products and promote brand awareness in 2004 ($0.1 billion).
GE 2005 ANNUAL REPORT 51
MANAGEMENT'S DISCUSSION AND ANALYSIS
CORPORATE ITEMS AND ELIMINATIONS
| (In millions) | 2005 | 2004 | 2003 | |||||||
REVENUES | ||||||||||
| Insurance activities | $ | 6,469 | $ | 4,711 | $ | 4,466 | ||||
| Eliminations and other | (1,105 | ) | 75 | 22 | ||||||
| Total | $ | 5,364 | $ | 4,786 | $ | 4,488 | ||||
OPERATING PROFIT (COST) | ||||||||||
| Insurance activities | $ | 131 | $ | 30 | $ | 21 | ||||
| Principal pension plans | (329 | ) | 124 | 1,040 | ||||||
| Underabsorbed corporate overhead | (464 | ) | (498 | ) | (630 | ) | ||||
| Other | (306 | ) | 17 | (381 | ) | |||||
| Total | $ | (968 | ) | $ | (327 | ) | $ | 50 | ||
Corporate Items and Eliminations include the effects of eliminating transactions between operating segments; results of our insurance activities remaining in continuing operations; cost of, and cost reductions from, our principal pension plans; results of liquidating businesses such as consolidated, liquidating securitization entities; underabsorbed corporate overhead; certain non-allocated amounts described below; and a variety of sundry items. Corporate Items and Eliminations is not an operating segment. Rather, it is added to operating segment totals to reconcile to consolidated totals on the financial statements.
Certain amounts included in the line “Other” above are not allocated to GE operating segments because they are excluded from the measurement of their operating performance for internal purposes. In 2004, these comprised $0.4 billion of Healthcare charges, principally related to the write-off of in-process research and development projects and other transitional costs associated with Amersham; and a $0.1 billion charge at Industrial as the gain on sale of the motors business was more than offset by costs for inventory obsolescence and other charges. In 2003, amounts not allocated to GE operating segments included charges of $0.2 billion for settlement of litigation, restructuring and other charges at Healthcare; and $0.1 billion for restructuring and other charges at Industrial.
Changes in Other operating profit (cost) also reflect gains of $0.1 billion and $0.3 billion from partial sales of an interest in Genpact, in 2005 and 2004, respectively.
DISCONTINUED INSURANCE OPERATIONS
| (In millions) | 2005 | 2004 | 2003 | |||||||
| Earnings (loss) from discontinued | ||||||||||
| operations, net of taxes | $ | (1,922 | ) | $ | 534 | $ | 2,057 | |||
Discontinued operations comprise the property and casualty insurance and reinsurance businesses and the European life and health operations of GE Insurance Solutions and most of its affiliates, that we agreed to sell in the fourth quarter of 2005; and Genworth, our formerly wholly-owned subsidiary that conducted most of our consumer insurance business, including life and mortgage insurance operations. Results of these businesses are reported as discontinued operations for all periods presented.
Loss from discontinued operations in 2005 reflected losses from the portions of GE Insurance Solutions described above ($2.8 billion), partially offset by Genworth earnings ($0.9 billion). GE Insurance Solutions results will be included in our 2006 discontinued operations to the date of closing, which is expected to be in the second quarter. Dividends we receive from Genworth and any gains or losses on sales of our remaining 18% position in Genworth common stock will also be reported in discontinued operations.
Earnings from discontinued operations in 2004 reflected earnings of Genworth ($0.4 billion), including our share of 2004 earnings from operations ($0.8 billion), partially offset by the loss on the Genworth initial public offering in May 2004 ($0.3 billion), and GE Insurance Solutions ($0.1 billion), primarily 2004 operations.
For additional information related to discontinued operations see note 2.
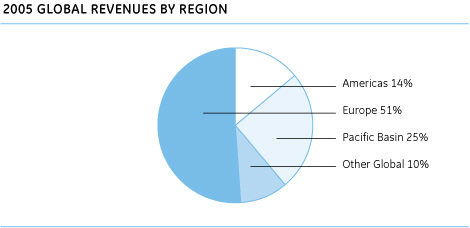
Global Operations
Our global activities span all geographic regions and primarily encompass manufacturing for local and export markets, import and sale of products produced in other regions, leasing of aircraft, sourcing for our plants domiciled in other global regions and provision of financial services within these regional economies. Thus, when countries or regions experience currency and/or economic stress, we often have increased exposure to certain risks, but also often have new profit opportunities. Potential increased risks include, among other things, higher receivable delinquencies and bad debts, delays or cancelations of sales and orders principally related to power and aircraft equipment, higher local currency financing costs and slowdown in established financial services activities. New profit opportunities include, among other things, more opportunities for lower cost outsourcing, expansion of industrial and financial services activities through purchases of companies or assets at reduced prices and lower U.S. debt financing costs.
Estimated results of global activities include the results of our operations located outside the United States plus all U.S. exports. We classify certain GECS operations that cannot meaningfully be associated with specific geographic areas as “Other Global” for this purpose.
GLOBAL REVENUES BY REGION
| (In millions) | 2005 | 2004 | 2003 | |||||||
| Europe | $ | 36,900 | $ | 32,400 | $ | 24,400 | ||||
| Pacific Basin | 16,000 | 13,000 | 13,000 | |||||||
| Americas | 7,500 | 7,000 | 5,600 | |||||||
| Other Global | 6,100 | 5,700 | 4,600 | |||||||
66,500 | 58,100 | 47,600 | ||||||||
| Exports from the U.S. to external customers | 11,400 | 8,800 | 6,700 | |||||||
Total(a) | $ | 77,900 | $ | 66,900 | $ | 54,300 | ||||
| (a) | Included $6.6 billion, $5.8 billion and $4.7 billion of intercompany revenues in 2005, 2004 and 2003, respectively. |
Global revenues rose 16% to $77.9 billion in 2005 compared with $66.9 billion and $54.3 billion in 2004 and 2003, respectively. Global revenues to external customers as a percentage of consolidated revenues were 48% in 2005, compared with 45% and 44% in 2004 and 2003, respectively. The effects of the weaker U.S. dollar on reported results were to increase revenues by
GE 2005 ANNUAL REPORT 52
MANAGEMENT'S DISCUSSION AND ANALYSIS
$0.9 billion, $4.1 billion and $3.1 billion in 2005, 2004 and 2003, respectively; and to increase earnings by $0.1 billion, $0.1 billion and $0.2 billion in 2005, 2004 and 2003, respectively.
GE global revenues were $48.2 billion in 2005, up 15% over 2004, led by increases at Infrastructure and NBC Universal, mainly in Europe and the Pacific Basin. Exports from the U.S. were up 30%, led by Infrastructure, again showing strength in Europe and the Pacific Basin. GE global revenues in 2004 were $41.7 billion, up 27% over 2003, led by Healthcare, including the effects of the Amersham acquisition, and NBC Universal, reflecting the combination of NBC and VUE. U.S. exports grew 31% in 2004 on strong growth at Infrastructure.
GECS global revenues were $29.7 billion, $25.2 billion and $21.3 billion in 2005, 2004 and 2003, respectively. GECS revenues in the Pacific Basin increased 28% in 2005, primarily as a result of the acquisition of AFIG at Consumer Finance and organic revenue growth at Consumer Finance and Commercial Finance. GECS revenues increased 25% in Europe primarily as a result of higher investment income (largely offset by policyholder dividends) at our insurance activities, and organic revenue growth and acquisitions at Consumer Finance and Commercial Finance. Revenues in Other Global decreased 4% primarily as a result of the absence of a current-year counterpart to the 2004 gain on the sale of a majority interest in Genpact, partially offset by organic revenue growth at the financial services businesses in Infrastructure.
Global operating profit was $12.7 billion in 2005, an increase of 20% over 2004, which was 35% higher than in 2003. GE global operating profit in 2005 rose 30% reflecting solid growth in Europe and Other Global, mainly at Infrastructure.
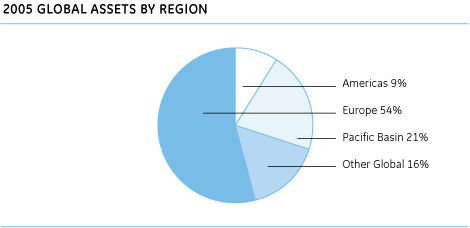
Total assets of global operations on a continuing basis were $299.4 billion in 2005, an increase of $2.8 billion, or 1%, over 2004. GECS global assets on a continuing basis of $261.9 billion at the end of 2005 were 1% higher than at the end of 2004, reflecting acquisitions and core growth, almost fully offset by the recently strengthening U.S. dollar.
Financial results of our global activities reported in U.S. dollars are affected by currency exchange. We use a number of techniques to manage the effects of currency exchange, including selective borrowings in local currencies and selective hedging of significant cross-currency transactions. Such principal currencies are the pound sterling, the euro, the Japanese yen and the Canadian dollar.
Environmental Matters
Our operations, like operations of other companies engaged in similar businesses, involve the use, disposal and cleanup of substances regulated under environmental protection laws.
We are involved in a sizable number of remediation actions to clean up hazardous wastes as required by federal and state laws. Such statutes require that responsible parties fund remediation actions regardless of fault, legality of original disposal or ownership of a disposal site. Expenditures for site remediation actions amounted to $0.1 billion in each of the last two years. We presently expect that such remediation actions will require average annual expenditures in the range of $0.2 billion to $0.3 billion over the next two years.
The U.S. Environmental Protection Agency (EPA) ruled in February 2002 that approximately 150,000 pounds of polychlorinated biphenyls (PCBs) must be dredged from a 40-mile stretch of the upper Hudson River in New York state. On October 6, 2005, GE and the EPA entered into and filed in the U.S. District Court for the Northern District of New York a consent decree that, subject to approval of that court, represents a comprehensive framework for implementation of the EPA’s 2002 decision to dredge PCB-containing sediments in the upper Hudson River. The dredging will be performed in two phases with an intervening peer review of performance after phase 1. Under this consent decree, we have committed up to $0.1 billion to reimburse the EPA for its past and future project oversight costs and agreed to perform the first phase of dredging. We further committed that, subject to future agreement with the EPA about completion of dredging after completion of phase 1 and the peer review, we will be responsible for further costs, including costs of phase 2 dredging. Our Statement of Financial Position as of December 31, 2005 and 2004, included liabilities for the estimated costs of this remediation.
Financial Resources and Liquidity
This discussion of financial resources and liquidity addresses the Statement of Financial Position, the Statement of Changes in Shareowners’ Equity, the Statement of Cash Flows, Contractual Obligations, Off-Balance Sheet Arrangements, and Debt Instruments, Guarantees and Covenants.
The fundamental differences between GE and GECS are reflected in the measurements commonly used by investors, rating agencies and financial analysts. These differences will become clearer in the discussion that follows with respect to the more significant items in the financial statements.
GE 2005 ANNUAL REPORT 53
MANAGEMENT'S DISCUSSION AND ANALYSIS
Overview of Financial Position
Major changes in our financial position resulted from the following:
• | In the fourth quarter of 2005, we announced the planned sale of most of GE Insurance Solutions and completed a Genworth secondary public offering, which reduced our ownership in Genworth from 27% to 18%. We have separately reported the assets and liabilities related to these discontinued operations for all periods presented. |
• | Our discontinued operations assets and liabilities decreased by $83.4 billion on September 27, 2005, when we reduced our ownership of Genworth to 27%, a level of investment that is reported as an associated company. As an associated company, our ongoing interest in Genworth operating results were presented on a one-line basis. This deconsolidation had a significant effect on our assets and liabilities of discontinued operations. |
• | During 2005, we completed the acquisitions of Edwards Systems Technology at Industrial and Ionics, Inc. at Infrastructure. GECS completed acquisitions of the Transportation Financial Services Group of CitiCapital, the Inventory Finance division of Bombardier Capital, Antares Capital Corp., a unit of Massachusetts Mutual Life Insurance Co., and ING’s portion of Heller AG. |
• | The U.S. dollar was stronger at December 31, 2005, than it was at December 31, 2004, reducing the translated levels of our non-U.S. dollar assets and liabilities. However, on average, the U.S. dollar in 2005 has been weaker than during the comparable 2004 period, resulting in increases in reported levels of non-U.S. dollar operations as noted in the preceding Operations section. |
• | Minority interest in equity of consolidated affiliates decreased $4.5 billion during 2005 principally from settlement of the VUE preferred interests and our acquisition of the previously outstanding minority interest in VUE common stock (together $1.9 billion), and redemption of preferred stock at General Electric Capital Corporation (GE Capital) ($2.5 billion). See notes 16 and 22. |
Statement of Financial Position
Because GE and GECS share certain significant elements of their Statements of Financial Position-property, plant and equipment and borrowings, for example-the following discussion addresses significant captions in the “consolidated” statement. Within the following discussions, however, we distinguish between GE and GECS activities in order to permit meaningful analysis of each individual consolidating statement.
INVESTMENT SECURITIES comprise mainly available-for-sale investment-grade debt securities supporting obligations to annuitants and policyholders, and debt and equity securities designated as trading and associated with certain non-U.S. insurance contract-holders who retain the related investment risks and rewards except in the event of our bankruptcy or liquidation. Investment securities were $53.1 billion at December 31, 2005, compared with $56.9 billion at December 31, 2004.
We regularly review investment securities for impairment based on both quantitative and qualitative criteria. Quantitative criteria include length of time and amount that each security is in an unrealized loss position and, for fixed maturities whether the issuer is in compliance with terms and covenants of the security. Qualitative criteria include the financial health of and specific prospects for the issuer, as well as our intent and ability to hold the security to maturity or until forecasted recovery. Our impairment reviews involve our finance, risk and asset management teams as well as the portfolio management and research capabilities of our internal and third-party asset managers. Our qualitative review attempts to identify those issuers with a greater than 50% chance of default in the following 12 months. These securities are characterized as “at-risk” of impairment. Of available-for-sale securities with unrealized losses at December 31, 2005, approximately $0.1 billion was at risk of being charged to earnings in the next 12 months; substantially all of this amount related to the automotive and commercial aviation industries.
Impairment losses for 2005 totaled $0.1 billion compared with $0.2 billion in 2004. We recognized impairments in both periods for issuers in a variety of industries; we do not believe that any of the impairments indicate likely future impairments in the remaining portfolio.
Gross unrealized gains and losses were $2.5 billion and $0.5 billion, respectively, at December 31, 2005, compared with $2.9 billion and $0.5 billion, respectively, at December 31, 2004, primarily reflecting a decrease in the estimated fair value of debt securities as interest rates increased. At December 31, 2005, available accounting gains could be as much as $0.7 billion, net of consequential adjustments to certain insurance assets that are amortized based on anticipated gross profits. The market values we used in determining unrealized gains and losses are those defined by relevant accounting standards and should not be viewed as a forecast of future gains or losses. See note 10.
We also hold collateralized investment securities issued by various airlines, including those operating in bankruptcy. Total amortized cost of these securities was $1.7 billion at December 31, 2005, and total fair value was $1.6 billion. Unrealized losses totaling $0.1 billion were associated with securities in an unrealized loss position for more than 12 months, an improvement from the comparable $0.3 billion a year earlier. All of these securities have remained current on all payment terms; we do not expect the borrowers to default. Current appraised market values of associated aircraft collateral exceeded both the market value and the amortized cost of our related securities at December 31, 2005, offering protection in the event of foreclosure. Therefore, we expect full recovery of our investment as well as our contractual returns.
WORKING CAPITAL, representing GE inventories and receivables from customers, less trade payables and progress collections, was $8.4 billion at December 31, 2005, up $0.1 billion from December 31, 2004, reflecting the effects of 2005 acquisitions.
We discuss current receivables and inventories, two important elements of working capital, in the following paragraphs.
GE 2005 ANNUAL REPORT 54
MANAGEMENT'S DISCUSSION AND ANALYSIS
CURRENT RECEIVABLES for GE amounted to $15.1 billion at the end of 2005 and $14.5 billion at the end of 2004, and included $10.3 billion due from customers at the end of 2005 compared with $10.2 billion at the end of 2004. Turnover of customer receivables from sales of goods and services was 9.0 in 2005, compared with 9.4 in 2004. Other current receivables are primarily amounts that did not originate from sales of GE goods or services, such as advances to suppliers in connection with large contracts. See note 11.
INVENTORIES for GE amounted to $10.3 billion at December 31, 2005, up $0.7 billion from the end of 2004. This increase reflected higher inventories at Aviation and the effects of 2005 acquisitions. GE inventory turnover was 8.3 in 2005 compared with 8.4 in 2004. See note 12.
FINANCING RECEIVABLES is our largest category of assets and represents one of our primary sources of revenues. The portfolio of financing receivables, before allowance for losses, was $292.2 billion at December 31, 2005, and $288.3 billion at December 31, 2004. The related allowance for losses at December 31, 2005, amounted to $4.6 billion, compared with $5.6 billion at December 31, 2004, representing our best estimate of probable losses inherent in the portfolio. The allowance for losses decreased $1.0 billion from 2004. The 2005 decrease reflected write-offs of previously reserved financing receivables ($0.8 billion), principally commercial aviation loans and leases in our Infrastructure segment, and the recently strengthening U.S. dollar ($0.2 billion). During 2005, changes in U.S. bankruptcy laws prompted certain customers to accelerate filing for bankruptcy protection. These changes had an inconsequential effect on our allowance and earnings. Balances at December 31, 2005 and 2004, included securitized, managed GE trade receivables of $3.9 billion and $3.5 billion, respectively. See notes 13 and 14.
A discussion of the quality of certain elements of the financing receivables portfolio follows. For purposes of that discussion, “delinquent” receivables are those that are 30 days or more past due; “nonearning” receivables are those that are 90 days or more past due (or for which collection has otherwise become doubtful); and “reduced-earning” receivables are commercial receivables whose terms have been restructured to a below-market yield.
Commercial Finance financing receivables, before allowance for losses, totaled $131.8 billion at December 31, 2005, compared with $124.5 billion at December 31, 2004, and consisted of loans and leases to the equipment and leasing, commercial and industrial and real estate industries. This portfolio of receivables increased primarily from core growth ($39.9 billion) and acquisitions ($10.6 billion), partially offset by securitizations and sales ($37.3 billion) and the recently strengthening U.S. dollar ($2.0 billion). Related nonearning and reduced-earning receivables were $1.3 billion (1.0% of outstanding receivables) at December 31, 2005, and $1.4 billion (1.1% of outstanding receivables) at year-end 2004. Commercial Finance financing receivables are generally backed by assets and there is a broad spread of geographic and credit risk in the portfolio.
Consumer Finance financing receivables, before allowance for losses, were $130.1 billion at December 31, 2005, compared with $127.8 billion at December 31, 2004, and consisted primarily of card receivables, installment loans, auto loans and leases, and residential mortgages. This portfolio of receivables increased primarily as a result of core growth ($11.3 billion) and acquisitions ($0.4 billion), partially offset by the recently strengthening U.S. dollar ($7.8 billion), securitizations ($0.7 billion), loans transferred to assets held for sale ($0.5 billion) and dispositions ($0.4 billion). Nonearning consumer receivables were $2.8 billion at December 31, 2005, compared with $2.5 billion at December 31, 2004, representing 2.1% and 2.0% of outstanding receivables, respectively. The increase was primarily related to higher nonearning receivables in our European secured financing business, a business that tends to experience relatively higher delinquencies but lower losses than the rest of our consumer portfolio.
Infrastructure financing receivables, before allowance for losses, were $19.1 billion at December 31, 2005, compared with $20.9 billion at December 31, 2004, and consisted primarily of loans and leases to the commercial aircraft and energy industries. Related nonearning and reduced-earning receivables were insignificant at December 31, 2005, down from $0.2 billion (0.8% of outstanding receivables) at December 31, 2004.
Other financing receivables, before allowance for losses, were $11.2 billion and $15.1 billion at December 31, 2005 and December 31, 2004, respectively, and consisted primarily of financing receivables in consolidated, liquidating securitization entities. This portfolio of receivables decreased because we have stopped transferring assets to these entities. Nonearning receivables at December 31, 2005, were $0.1 billion (0.7% of outstanding receivables) compared with $0.2 billion (1.2% of outstanding receivables) at December 31, 2004.
Delinquency rates on managed Commercial Finance equipment loans and leases and managed Consumer Finance financing receivables follow.
| December 31 | 2005 | 2004 | 2003 | |||||||
| Commercial Finance | 1.31 | % | 1.40 | % | 1.38 | % | ||||
| Consumer Finance | 5.08 | 4.85 | 5.62 | |||||||
Delinquency rates at Commercial Finance decreased from December 31, 2004, to December 31, 2005, primarily resulting from improved credit quality across all portfolios. The increase from December 31, 2003, to December 31, 2004, reflected the effect of certain acquired portfolios, partially offset by improvement in the overall core portfolio.
Delinquency rates at Consumer Finance increased from December 31, 2004, to December 31, 2005, as a result of higher delinquencies in our European secured financing business, discussed above. The decrease from December 31, 2003, to December 31, 2004, reflected the results of the standardization of our write-off policy, the acquisition of AFIG, and the U.S. acquisition of WMC, with lower relative delinquencies as a result of whole loan sales, partially offset by higher delinquencies in our European secured financing business, discussed above. See notes 13 and 14.
GE 2005 ANNUAL REPORT 55
MANAGEMENT'S DISCUSSION AND ANALYSIS
OTHER GECS RECEIVABLES totaled $19.1 billion at December 31, 2005, and $15.0 billion at December 31, 2004, and consisted primarily of nonfinancing customer receivables, insurance receivables, amounts due from GE (generally related to certain material procurement programs), amounts due under operating leases, receivables due on sale of securities and various sundry items.
PROPERTY, PLANT AND EQUIPMENT amounted to $67.5 billion at December 31, 2005, up $4.4 billion from 2004, primarily reflecting acquisitions of commercial aircraft at the Aviation Financial Services business of Infrastructure. GE property, plant and equipment consisted of investments for its own productive use, whereas the largest element for GECS was equipment provided to third parties on operating leases. Details by category of investment are presented in note 15.
GE expenditures for plant and equipment during 2005 totaled $2.8 billion, compared with $2.4 billion in 2004. Total expenditures for the past five years were $12.7 billion, of which 32% was investment for growth through new capacity and product development; 37% was investment in productivity through new equipment and process improvements; and 31% was investment for other purposes such as improvement of research and development facilities and safety and environmental protection.
GECS additions to property, plant and equipment were $11.6 billion and $10.7 billion during 2005 and 2004, respectively, primarily reflecting additions of commercial aircraft at the Aviation Financial Services business of Infrastructure and vehicles at Commercial Finance and the Equipment Services business of Industrial.
INTANGIBLE ASSETS were $81.7 billion at year-end 2005, up from $78.5 billion at year-end 2004. GE intangibles increased $3.1 billion from $54.7 billion at the end of 2004, principally as a result of goodwill and other intangibles related to the Edwards Systems Technology acquisition by Industrial, the Ionics, Inc. acquisition by Infrastructure and the acquisitions of an additional interest in MSNBC and the previously outstanding minority interest in VUE by NBC Universal. GECS intangibles increased $0.2 billion to $23.9 billion at December 31, 2005, resulting from goodwill associated with acquisitions partially offset by the recently strengthening U.S. dollar and purchase accounting adjustments. See note 16.
ALL OTHER ASSETS totaled $87.4 billion at year-end 2005, a decrease of $2.1 billion, reflecting NBC Universal settling obligations related to preferred interests previously issued by VUE and dispositions affecting real estate, partially offset by increases in assets held for sale. See notes 16 and 17.
CONSOLIDATED BORROWINGS amounted to $370.4 billion at December 31, 2005, compared with $365.1 billion at the end of 2004.
GE total borrowings were $10.2 billion at year-end 2005 ($1.1 billion short term, $9.1 billion long term) compared with $11.0 billion at December 31, 2004. GE total debt at the end of 2005 equaled 8.1% of total capital compared with 9.0% at the end of 2004.
GECS borrowings amounted to $362.1 billion at December 31, 2005, of which $157.7 billion is due in 2006 and $204.4 billion is due in subsequent years. Comparable amounts at the end of 2004 were $355.5 billion in total, $154.3 billion due within one year and $201.2 billion due thereafter. Included in GECS total borrowings were borrowings of consolidated, liquidating securitization entities amounting to $16.8 billion and $25.8 billion at December 31, 2005 and 2004, respectively. A large portion of GECS borrowings ($97.4 billion and $96.9 billion at the end of 2005 and 2004, respectively) was issued in active commercial paper markets that we believe will continue to be a reliable source of short-term financing. The average remaining terms and interest rates of GE Capital commercial paper were 45 days and 4.09% at the end of 2005, compared with 42 days and 2.39% at the end of 2004. The GE Capital ratio of debt to equity was 7.09 to 1 at the end of 2005 and 6.46 to 1 at the end of 2004. See note 18.
EXCHANGE RATE AND INTEREST RATE RISKS are managed with a variety of straightforward techniques, including match funding and selective use of derivatives. We use derivatives to mitigate or eliminate certain financial and market risks because we conduct business in diverse markets around the world and local funding is not always efficient. In addition, we use derivatives to adjust the debt we are issuing to match the fixed or floating nature of the assets we are acquiring. We apply strict policies to manage each of these risks, including prohibitions on derivatives trading, derivatives market-making or other speculative activities. Following is an analysis of the potential effects of changes in interest rates and currency exchange rates using so-called “shock” tests that model effects of shifts in rates. These are not forecasts.
• | It is our policy to minimize exposure to interest rate changes. We fund our financial investments using debt or a combination of debt and hedging instruments so that the interest rates and terms of our borrowings match the expected yields and terms on our assets. To test the effectiveness of our positions, we assumed that, on January 1, 2006, interest rates increased by 100 basis points across the yield curve (a “parallel shift” in that curve) and further assumed that the increase remained in place for 2006. We estimated, based on that year-end 2005 portfolio and holding everything else constant, that our 2006 GE consolidated net earnings would decline by $0.2 billion. |
• | It is our policy to minimize currency exposures and to conduct operations either within functional currencies or using the protection of hedge strategies. We analyzed year-end 2005 consolidated currency exposures, including derivatives designated and effective as hedges, to identify assets and liabilities denominated in other than their relevant functional currencies. For such assets and liabilities, we then evaluated the effects of a 10% shift in exchange rates between those currencies and the U.S. dollar. This analysis indicated that there would be an inconsequential effect on 2006 earnings of such a shift in exchange rates. |
GE 2005 ANNUAL REPORT 56
MANAGEMENT'S DISCUSSION AND ANALYSIS
Statement of Changes in Shareowners’ Equity
Shareowners’ equity decreased $1.5 billion in 2005, and increased $31.2 billion in 2004 and $15.6 billion in 2003. Changes over the three-year period were largely attributable to net earnings, partially offset by dividends declared of $9.6 billion, $8.6 billion and $7.8 billion in 2005, 2004 and 2003, respectively. In 2005, we purchased $5.3 billion of GE stock (153.3 million shares) under our $25 billion share repurchase program. In 2004, we issued 341.7 million shares of stock in connection with the Amersham acquisition, which increased equity by $10.7 billion, and 119.4 million shares of stock to partially fund the combination of NBC and VUE, which increased equity by $3.8 billion. Currency translation adjustments decreased equity by $4.3 billion in 2005, compared with a $3.9 billion increase in 2004. Changes in currency translation adjustments reflect the effects of changes in currency exchange rates on our net investment in non-U.S. subsidiaries that have functional currencies other than the U.S. dollar. In 2005, the U.S. dollar strengthened against the pound sterling and euro. In 2004, the pound sterling, euro and, to a lesser extent, Asian currencies strengthened against the U.S. dollar. See note 23. Accumulated currency translation adjustments affect net earnings only when all or a portion of an affiliate is disposed of or substantially liquidated.
Overview of Our Cash Flow from 2003 through 2005
GE cash from operating activities (CFOA) is a useful measure of performance for our non-financial businesses and totaled $21.6 billion in 2005, $15.2 billion in 2004 and $12.9 billion in 2003. Generally, factors that affect our earnings-for example, pricing, volume, costs and productivity-affect CFOA similarly. However, while management of working capital, including timing of collections and payments and levels of inventory, affects operating results only indirectly, the effect of these programs on CFOA can be significant. Excluding progress collections, working capital improvements benefited CFOA by $2.8 billion since 2002, as we applied our Lean Six Sigma and other working capital management tools broadly.
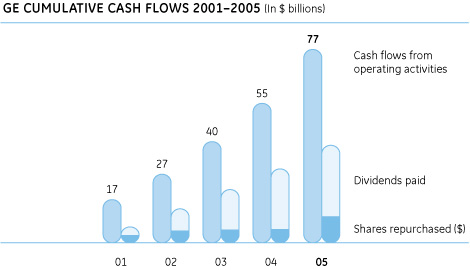
Our GE Statement of Cash Flows shows CFOA in the required format. While that display is of some use in analyzing how various assets and liabilities affected our year-end cash positions, we believe that it is also useful to supplement that display and to examine in a broader context the business activities that provide and require cash.
| December 31 (In billions) | 2005 | 2004 | 2003 | |||||||
| Operating cash collections | $ | 89.9 | $ | 81.6 | $ | 68.4 | ||||
| Operating cash payments | (76.1 | ) | (69.5 | ) | (58.9 | ) | ||||
| Cash dividends from GECS | 7.8 | 3.1 | 3.4 | |||||||
| GE cash from operating activities | $ | 21.6 | $ | 15.2 | $ | 12.9 | ||||
The most significant source of cash in CFOA is customer-related activities, the largest of which is collecting cash following a product or services sale. GE operating cash collections increased by $8.3 billion during 2005 and by $13.2 billion during 2004. These increases are consistent with the changes in comparable GE operating segment revenues, comprising Healthcare, NBC Universal and the industrial businesses of the Industrial and Infrastructure segments, and which also reflect the effects of the second quarter 2004 acquisition of Amersham and combination of NBC and VUE. Analyses of operating segment revenues discussed in the preceding Segment Operations section is the best way of understanding their customer-related CFOA.
The most significant operating use of cash is to pay our suppliers, employees, tax authorities and others for the wide range of material and services necessary in a diversified global organization. GE operating cash payments increased in 2005 by $6.6 billion and by $10.6 billion in 2004, comparable to the increases in GE total costs and expenses, and also reflect the second quarter 2004 acquisition of Amersham and combination of NBC and VUE.
Dividends from GECS represented distribution of a portion of GECS retained earnings, including proceeds from certain business sales, and are distinct from cash from continuing operating activities within the financial services businesses, which increased in 2005 by $0.8 billion to $20.9 billion and in 2004 by $6.1 billion to $20.1 billion. The amount we show in CFOA is the total dividend, including the normal dividend as well as any special dividends from excess capital primarily resulting from GECS business sales. Financial services cash is not necessarily freely available for alternative uses. For example, use of cash generated by our regulated activities is often restricted by such regulations. Further, any reinvestment in financing receivables is shown in cash used for investing activities, not operating activities. Therefore, maintaining or growing financial services assets requires that we invest much of the cash they generate from operating activities in their earning assets.
Based on past performance and current expectations, in combination with the financial flexibility that comes with a strong balance sheet and the highest credit ratings, we believe that we are in a sound position to grow dividends, continue to execute our $25 billion share repurchase program, which is an expansion of the $15 billion share repurchase program announced in 2004, and continue making selective investments for long-term growth.
GE 2005 ANNUAL REPORT 57
MANAGEMENT'S DISCUSSION AND ANALYSIS
Contractual Obligations
As defined by reporting regulations, our contractual obligations for future payments as of December 31, 2005, follow.
Payments due by period | ||||||||||||||||
| (In billions) | Total | 2006 | 2007-2008 | 2009-2010 | 2011 and thereafter | |||||||||||
| Borrowings (note 18) | $ | 370.4 | $ | 158.2 | $ | 87.1 | $ | 45.5 | $ | 79.6 | ||||||
| Interest on borrowings | 66.0 | 12.0 | 18.0 | 10.0 | 26.0 | |||||||||||
| Operating lease obligations (note 5) | 6.8 | 1.4 | 2.2 | 1.5 | 1.7 | |||||||||||
Purchase obligations(a)(b) | 58.0 | 37.0 | 13.0 | 4.0 | 4.0 | |||||||||||
Insurance liabilities (note 19)(c) | 28.0 | 5.0 | 6.0 | 4.0 | 13.0 | |||||||||||
Other liabilities(d) | 60.0 | 13.0 | 6.0 | 4.0 | 37.0 | |||||||||||
| Contractual obligations of discontinued | ||||||||||||||||
operations(e) | 12.0 | 1.0 | 1.0 | 1.0 | 9.0 | |||||||||||
| (a) | Included all take-or-pay arrangements, capital expenditures, contractual commitments to purchase equipment that will be classified as equipment leased to others, software acquisition/license commitments, contractual minimum programming commitments and any contractually required cash payments for acquisitions. |
| (b) | Excluded funding commitments entered into in the ordinary course of business by our financial services businesses. Further information on these commitments and other guarantees is provided in note 29. |
| (c) | Included guaranteed investment contracts (GICs), structured settlements and single premium immediate annuities based on scheduled payouts, as well as those contracts with reasonably determinable cash flows such as deferred annuities, universal life, term life, long-term care, whole life and other life insurance contracts. |
| (d) | Included an estimate of future expected funding requirements related to our pension and postretirement benefit plans. Because their future cash outflows are uncertain, the following non-current liabilities are excluded from the table above: deferred taxes, derivatives, deferred revenue and other sundry items. See notes 21 and 27 for further information on certain of these items. |
| (e) | Included payments for borrowings and interest on borrowings of $3.6 billion, operating lease obligations of $0.2 billion, other liabilities of $2.8 billion, and insurance liabilities of $5.4 billion. Insurance liabilities primarily included workers’ compensation tabular indemnity loan and long-term liability claims. |
Off-Balance Sheet Arrangements
We use off-balance sheet arrangements in the ordinary course of business to improve shareowner returns. These securitization transactions also serve as funding sources for a variety of diversified lending and securities transactions. Our securitization transactions are similar to those used by many financial institutions.
In a typical securitization transaction, we sell assets to a special purpose entity (SPE), which has obtained cash by issuing beneficial interests, usually debt, to third parties. Securitization entities commonly use derivatives such as interest rate swaps to match interest rate characteristics of the assets with characteristics of the related beneficial interests. An example is an interest rate swap that serves to convert fixed rate assets to a variable rate, matching the cash flows on SPE floating rate debt. An investor in a beneficial interest usually has recourse to assets in the associated SPE, and often benefits from credit enhancements supporting those assets. The most common credit enhancement is overcollateralization, where we securitize a greater principal amount of assets than debt issued by the SPE. Our other credit enhancements are in the form of liquidity and credit support agreements and guarantee and reimbursement contracts. We have provided $0.1 billion at year-end 2005 representing our best estimate of the fair value of potential losses under these arrangements.
Historically, we executed securitization transactions using entities sponsored by us and by third parties. Beginning in 2003, we only have executed securitization transactions with third parties in the asset-backed commercial paper and term markets. Securitization entities hold receivables secured by equipment, commercial and residential real estate, credit card and trade receivables and other assets. Our total securitized assets at year-end 2005 amounted to $61.7 billion, a $3.5 billion increase from year-end 2004. Of that total, the off-balance sheet amount was $43.8 billion, up $11.6 billion from December 31, 2004, and the amount in consolidated, liquidating securitization entities was $17.9 billion, down $8.1 billion from December 31, 2004, reflecting repayments. See note 28 for further information.
We have extensive experience in evaluating economic, liquidity and credit risk related to the assets we securitize. Assets held by these entities are of high quality and we actively monitor them in accordance with our servicing role. We apply rigorous controls to the execution of securitization transactions and continuously monitor developments affecting credit. In view of our experience and taking into consideration the historical depth and liquidity of global commercial paper markets, we believe that, under any plausible future economic scenario, the likelihood is remote that the financial support arrangements we provide to securitization entities could have an adverse effect on our financial position or results of operations.
Debt Instruments, Guarantees and Covenants
The major debt rating agencies routinely evaluate the debt of GE, GECS and GE Capital, the major borrowing affiliate of GECS. These agencies have given the highest debt ratings to GE and GE Capital (long-term rating AAA/Aaa; short-term rating A-1+/P-1). One of our strategic objectives is to maintain these ratings, as they serve to lower our cost of funds and to facilitate our access to a variety of lenders. We manage our businesses in a fashion that is consistent with maintaining these ratings.
GE, GECS and GE Capital have distinct business characteristics that the major debt rating agencies evaluate both quantitatively and qualitatively.
Quantitative measures include:
• | Earnings and profitability, revenue growth, the breadth and diversity of sources of income and return on assets, |
• | Asset quality, including delinquency and write-off ratios and reserve coverage, |
GE 2005 ANNUAL REPORT 58
MANAGEMENT'S DISCUSSION AND ANALYSIS
• | Funding and liquidity, including cash generated from operating activities, leverage ratios such as debt-to-capital, market access, back-up liquidity from banks and other sources, composition of total debt and interest coverage, and |
• | Capital adequacy, including required capital and tangible leverage ratios. |
Qualitative measures include:
• | Franchise strength, including competitive advantage and market conditions and position, |
• | Strength of management, including experience, corporate governance and strategic thinking, and |
• | Financial reporting quality, including clarity, completeness and transparency of all financial performance communications. |
GE Capital’s ratings are supported contractually by a GE commitment to maintain the ratio of earnings to fixed charges at a specified level as described below.
As of January 1, 2003, we extended a business-specific, market-based leverage to the performance measurement of each of our financial services businesses. As a result, at January 1, 2003, debt of $12.5 billion previously allocated to our financial services segments was allocated to Corporate items and eliminations. We refer to this as “parent-supported debt.” As of December 31, 2004, $3.2 billion of such debt remained and was paid down during the first quarter of 2005.
During 2005, GECS paid $3.9 billion of special dividends to GE, which was a portion of the proceeds from the Genworth secondary public offerings.
During 2005, GE issued $1.5 billion of senior, unsecured three-year floating rate debt. The proceeds were used primarily for repayment of maturing long-term debt. During 2005, GECS and GECS affiliates issued $58 billion of senior, unsecured long-term debt and $2 billion of subordinated debt. This debt was both fixed and floating rate and was issued to institutional and retail investors in the U.S. and 15 other global markets. Maturities for these issuances ranged from one to 40 years. We used the proceeds primarily for repayment of maturing long-term debt, but also to fund acquisitions and organic growth. We anticipate that we will issue between $55 billion and $65 billion of additional long-term debt during 2006, mostly to repay maturing long-term debt. The ultimate amount we issue will depend on our needs and on the markets.
Following is the composition of GECS debt obligations excluding any asset-backed debt obligations, such as debt of consolidated, liquidating securitization entities.
| December 31 | 2005 | 2004 | |||||
| Senior notes and other long-term debt | 57 | % | 58 | % | |||
| Commercial paper | 26 | 25 | |||||
| Current portion of long-term debt | 12 | 11 | |||||
Other-bank and other retail deposits | 5 | 6 | |||||
| Total | 100 | % | 100 | % | |||
We target a ratio for commercial paper of 25% to 35% of outstanding debt based on the anticipated composition of our assets and the liquidity profile of our debt. GE Capital is the most widely held name in global commercial paper markets.
We believe that alternative sources of liquidity are sufficient to permit an orderly transition from commercial paper in the unlikely event of impaired access to those markets. Funding sources on which we would rely would depend on the nature of such a hypothetical event, but include $57.2 billion of contractually committed lending agreements with 75 highly-rated global banks and investment banks. Total credit lines extending beyond one year increased $0.3 billion to $57.1 billion at December 31, 2005. See note 18.
Beyond contractually committed lending agreements, other sources of liquidity include medium and long-term funding, monetization, asset securitization, cash receipts from our lending and leasing activities, short-term secured funding on global assets and potential sales of other assets.
PRINCIPAL DEBT CONDITIONS are described below.
The following two conditions relate to GE and GECS:
• | Swap, forward and option contracts are required to be executed under master-netting agreements containing mutual downgrade provisions that provide the ability of the counterparty to require assignment or termination if the long-term credit rating of either GE or GECS were to fall below A-/A3. Had this provision been triggered at December 31, 2005, we could have been required to disburse $2.2 billion. |
• | If GE Capital’s ratio of earnings to fixed charges, which was 1.66:1 at the end of 2005, were to deteriorate to 1.10:1 or, upon redemption of certain preferred stock, its ratio of debt to equity, which was 7.09:1 at the end of 2005, were to exceed 8:1, GE has committed to contribute capital to GE Capital. GE also has guaranteed certain issuances of subordinated debt of GECS with a face amount of $1.0 billion at December 31, 2005 and 2004. |
The following three conditions relate to consolidated, liquidating securitization entities:
• | If the short-term credit rating of GE Capital or certain consolidated, liquidating securitization entities discussed further in note 28 were to fall below A-1/P-1, GE Capital would be required to provide substitute liquidity for those entities or provide funds to retire the outstanding commercial paper. The maximum net amount that GE Capital would be required to provide in the event of such a downgrade is determined by contract, and amounted to $12.8 billion at January 1, 2006. Amounts related to non-consolidated SPEs were $1.7 billion. |
• | If the long-term credit rating of GE Capital were to fall below AA/Aa2, GE Capital would be required to provide substitute credit support or liquidate the consolidated, liquidating securitization entities. The maximum amount that GE Capital would be required to substitute in the event of such a downgrade is determined by contract, and amounted to $0.6 billion at December 31, 2005. |
GE 2005 ANNUAL REPORT 59
MANAGEMENT'S DISCUSSION AND ANALYSIS
• | For certain transactions, if the long-term credit rating of GE Capital were to fall below A/A2 or BBB+/Baa1 or its short-term credit rating were to fall below A-2/P-2, GE Capital could be required to provide substitute credit support or fund the undrawn commitment. GE Capital could be required to provide up to $2.0 billion in the event of such a downgrade based on terms in effect at December 31, 2005. |
One group of consolidated SPEs holds high quality investment securities funded by the issuance of GICs. If the long-term credit rating of GE Capital were to fall below AA-/Aa3 or its short-term credit rating were to fall below A-1+/P-1, GE Capital could be required to provide up to $4.1 billion of capital to such entities.
In our history, we have never violated any of the above conditions either at GE, GECS or GE Capital. We believe that under any reasonable future economic developments, the likelihood that any such arrangements could have a significant effect on our operations, cash flows or financial position is remote.
Selected Financial Data
The page is divided into three sections: upper portion-consolidated data; middle portion-GE data that reflect various conventional measurements for such enterprises; and lower portion-GECS data that reflect key information pertinent to financial services businesses.
GE’S TOTAL RESEARCH AND DEVELOPMENT expenditures were $3.4 billion in 2005, compared with $3.1 billion and $2.7 billion in 2004 and 2003, respectively. In 2005, expenditures from GE’s own funds were $2.7 billion compared with $2.4 billion in 2004. Expenditures funded by customers (mainly the U.S. government) were $0.7 billion and $0.6 billion in 2005 and 2004, respectively.
Expenditures reported above reflect the definition of research and development required by U.S. generally accepted accounting principles. For operating and management purposes, we consider amounts spent on product and services technology to include our reported research and development expenditures, but also amounts for improving our existing products and services, and the productivity of our plant, equipment and processes. On this basis, our technology expenditures in 2005 were $5.2 billion.
GE’S TOTAL BACKLOG of firm unfilled orders at the end of 2005 was $36.1 billion, an increase of 6% from year-end 2004, reflecting increased demand for wind turbines, locomotives and product services. Of the total backlog, $23.8 billion related to products, of which 70% was scheduled for delivery in 2006. Product services orders, included in this reported backlog for only the succeeding 12 months, were $12.3 billion at the end of 2005. Orders constituting this backlog may be canceled or deferred by customers, subject in certain cases to penalties. See the Segment Operations section for further information.
Critical Accounting Estimates
Accounting estimates and assumptions discussed in this section are those that we consider to be the most critical to an understanding of our financial statements because they inherently involve significant judgments and uncertainties. For all of these estimates, we caution that future events rarely develop exactly as forecast, and the best estimates routinely require adjustment. Also see note 1, Summary of Significant Accounting Policies, which discusses accounting policies that we have selected from acceptable alternatives.
LOSSES ON FINANCING RECEIVABLES are recognized when they are incurred, which requires us to make our best estimate of probable losses inherent in the portfolio. Such estimate requires consideration of historical loss experience, adjusted for current conditions, and judgments about the probable effects of relevant observable data, including present economic conditions such as delinquency rates, financial health of specific customers and market sectors, collateral values, and the present and expected future levels of interest rates. Our risk management process, which includes standards and policies for reviewing major risk exposures and concentrations, ensures that relevant data are identified and considered either for individual loans or leases, or on a portfolio basis, as appropriate.
Our lending and leasing experience and the extensive data we accumulate and analyze facilitate estimates that have proven reliable over time. Our actual loss experience was in line with expectations for 2005, 2004 and 2003. While prospective losses depend to a large degree on future economic conditions, we do not anticipate significant adverse credit development in 2006. Further information is provided in the Financial Resources and Liquidity-Financing Receivables section, the Asset Impairment section that follows and in notes 1, 13 and 14.
REVENUE RECOGNITION ON LONG-TERM AGREEMENTS to provide product services (product services agreements) requires estimates of profits over the multiple-year terms of such agreements, considering factors such as the frequency and extent of future monitoring, maintenance and overhaul events; the amount of personnel, spare parts and other resources required to perform the services; and future billing rate and cost changes. We routinely review estimates under product services agreements and regularly revise them to adjust for changes in outlook. We also regularly assess customer credit risk inherent in the carrying amounts of receivables and contract costs and estimated earnings, including the risk that contractual penalties may not be sufficient to offset our accumulated investment in the event of customer termination. We gain insight into future utilization and cost trends, as well as credit risk, through our knowledge of the installed base of equipment and the close interaction with our customers that comes with supplying critical services and parts over extended periods. Revisions that affect a product services agreement’s total estimated profitability will also result in an immediate adjustment of earnings. We provide for probable losses.
GE 2005 ANNUAL REPORT 60
MANAGEMENT'S DISCUSSION AND ANALYSIS
Selected Financial Data
| (In millions; per-share amounts in dollars) | 2005 | 2004 | 2003 | 2002 | 2001 | |||||||||||
GENERAL ELECTRIC COMPANY AND CONSOLIDATED AFFILIATES | ||||||||||||||||
Revenues | $ | 149,702 | $ | 134,481 | $ | 112,886 | $ | 113,856 | $ | 107,558 | ||||||
| Earnings from continuing operations | ||||||||||||||||
| before accounting changes | 18,275 | 16,285 | 13,766 | 15,798 | 12,948 | |||||||||||
| Earnings (loss) from discontinued operations, net of taxes | (1,922 | ) | 534 | 2,057 | (616 | ) | 1,130 | |||||||||
| Earnings before accounting changes | 16,353 | 16,819 | 15,823 | 15,182 | 14,078 | |||||||||||
| Cumulative effect of accounting changes | - | - | (587 | ) | (1,015 | ) | (287 | ) | ||||||||
| Net earnings | 16,353 | 16,819 | 15,236 | 14,167 | 13,791 | |||||||||||
| Dividends declared | 9,647 | 8,594 | 7,759 | 7,266 | 6,555 | |||||||||||
Return on average shareowners’ equity(a) | 17.6 | % | 17.6 | % | 19.6 | % | 27.2 | % | 24.7 | % | ||||||
| Per share | ||||||||||||||||
| Earnings from continuing operations before | ||||||||||||||||
accounting changes-diluted | $ | 1.72 | $ | 1.56 | $ | 1.37 | $ | 1.58 | $ | 1.29 | ||||||
Earnings (loss) from discontinued operations-diluted | (0.18 | ) | 0.05 | 0.20 | (0.06 | ) | 0.11 | |||||||||
Earnings before accounting changes-diluted | 1.54 | 1.61 | 1.57 | 1.51 | 1.40 | |||||||||||
Cumulative effect of accounting changes-diluted | - | - | (0.06 | ) | (0.10 | ) | (0.03 | ) | ||||||||
Net earnings-diluted | 1.54 | 1.61 | 1.51 | 1.41 | 1.37 | |||||||||||
| Earnings from continuing operations before | ||||||||||||||||
accounting changes-basic | 1.73 | 1.57 | 1.37 | 1.59 | 1.30 | |||||||||||
Earnings (loss) from discontinued operations-basic | (0.18 | ) | 0.05 | 0.21 | (0.06 | ) | 0.11 | |||||||||
Earnings before accounting changes-basic | 1.55 | 1.62 | 1.58 | 1.52 | 1.42 | |||||||||||
Cumulative effect of accounting changes-basic | - | - | (0.06 | ) | (0.10 | ) | (0.03 | ) | ||||||||
Net earnings-basic | 1.55 | 1.62 | 1.52 | 1.42 | 1.39 | |||||||||||
| Dividends declared | 0.91 | 0.82 | 0.77 | 0.73 | 0.66 | |||||||||||
| Stock price range | 37.34-32.67 | 37.75-28.88 | 32.42-21.30 | 41.84-21.40 | 52.90-28.25 | |||||||||||
| Year-end closing stock price | 35.05 | 36.50 | 30.98 | 24.35 | 40.08 | |||||||||||
| Total assets of continuing operations | 626,586 | 618,241 | 503,610 | 441,768 | 373,550 | |||||||||||
| Total assets | 673,342 | 750,507 | 647,828 | 575,236 | 495,012 | |||||||||||
| Long-term borrowings | 212,281 | 207,871 | 170,309 | 138,570 | 77,818 | |||||||||||
Shares outstanding-average (in thousands) | 10,569,805 | 10,399,629 | 10,018,587 | 9,947,113 | 9,932,245 | |||||||||||
Shareowner accounts-average | 634,000 | 658,000 | 670,000 | 655,000 | 625,000 | |||||||||||
| Employees at year end | ||||||||||||||||
| United States | 161,000 | 165,000 | 155,000 | 161,000 | 158,000 | |||||||||||
| Other countries | 155,000 | 142,000 | 150,000 | 154,000 | 152,000 | |||||||||||
| Total employees | 316,000 | (b) | 307,000 | 305,000 | 315,000 | 310,000 | ||||||||||
GE DATA | ||||||||||||||||
Short-term borrowings | $ | 1,127 | $ | 3,409 | $ | 2,555 | $ | 8,786 | $ | 1,722 | ||||||
| Long-term borrowings | 9,081 | 7,625 | 8,388 | 970 | 787 | |||||||||||
| Minority interest | 5,806 | 7,701 | 1,079 | 1,028 | 948 | |||||||||||
| Shareowners’ equity | 109,354 | 110,821 | 79,631 | 64,079 | 55,000 | |||||||||||
| Total capital invested | $ | 125,368 | $ | 129,556 | $ | 91,653 | $ | 74,863 | $ | 58,457 | ||||||
Return on average total capital invested(a) | 16.4 | % | 16.0 | % | 17.7 | % | 25.8 | % | 24.9 | % | ||||||
Borrowings as a percentage of total capital invested(a) | 8.1 | % | 9.0 | % | 11.9 | % | 13.0 | % | 4.3 | % | ||||||
Working capital(a) | $ | 8,399 | $ | 8,328 | $ | 5,282 | $ | 3,821 | $ | (2,398 | ) | |||||
| Additions to property, plant and equipment | 2,812 | 2,427 | 2,158 | 2,386 | 2,876 | |||||||||||
GECS DATA | ||||||||||||||||
Revenues | $ | 59,297 | $ | 52,894 | $ | 42,978 | $ | 40,345 | $ | 39,998 | ||||||
| Earnings from continuing operations | ||||||||||||||||
| before accounting changes | 9,141 | 7,853 | 5,931 | 5,291 | 4,406 | |||||||||||
| Earnings (loss) from discontinued operations, net of taxes | (1,922 | ) | 534 | 2,057 | (616 | ) | 1,130 | |||||||||
| Earnings before accounting changes | 7,219 | 8,387 | 7,988 | 4,675 | 5,536 | |||||||||||
| Cumulative effect of accounting changes | - | - | (339 | ) | (1,015 | ) | (12 | ) | ||||||||
| Net earnings | 7,219 | 8,387 | 7,649 | 3,660 | 5,524 | |||||||||||
| Shareowner’s equity | 50,815 | 54,292 | 45,759 | 37,302 | 28,766 | |||||||||||
| Minority interest | 2,248 | 4,902 | 5,115 | 4,445 | 4,267 | |||||||||||
| Total borrowings | 362,069 | 355,501 | 316,593 | 267,014 | 236,449 | |||||||||||
| Ratio of debt to equity at GE Capital | 7.09:1 | 6.46:1 | 6.63:1 | 6.46:1 | 7.21:1 | |||||||||||
| Total assets of continuing operations | $ | 493,849 | $ | 486,238 | $ | 410,653 | $ | 356,352 | $ | 304,011 | ||||||
| Total assets | 540,605 | 618,504 | 554,871 | 489,820 | 425,473 | |||||||||||
| Transactions between GE and GECS have been eliminated from the consolidated information | |
| (a) | Indicates terms are defined in the Glossary. |
| (b) | Excludes employees of Genworth in 2005 as a result of the third quarter deconsolidation. |
GE 2005 ANNUAL REPORT 61
MANAGEMENT'S DISCUSSION AND ANALYSIS
Carrying amounts for product services agreements in progress at December 31, 2005 and 2004, were $4.4 billion and $3.7 billion, respectively, and are included in the line, “Contract costs and estimated earnings” in note 17. Adjustments to earnings resulting from revisions to estimates on product services agreements have been insignificant for each of the years in the three-year period ended December 31, 2005.
Further information is provided in note 1.
ASSET IMPAIRMENT assessment involves various estimates and assumptions as follows:
INVESTMENTS. We regularly review investment securities for impairment based on both quantitative and qualitative criteria that include the extent to which cost exceeds market value, the duration of that market decline, our intent and ability to hold to maturity or until forecasted recovery and the financial health of and specific prospects for the issuer. We perform comprehensive market research and analysis and monitor market conditions to identify potential impairments. Further information about actual and potential impairment losses is provided in the Financial Resources and Liquidity-Investment Securities section and in notes 1 and 10.
LONG-LIVED ASSETS. We review long-lived assets for impairment whenever events or changes in circumstances indicate that the related carrying amounts may not be recoverable. Determining whether an impairment has occurred typically requires various estimates and assumptions, including determining which undiscounted cash flows are directly related to the potentially impaired asset, the useful life over which cash flows will occur, their amount, and the asset’s residual value, if any. In turn, measurement of an impairment loss requires a determination of fair value, which is based on the best information available. We derive the required undiscounted cash flow estimates from our historical experience and our internal business plans. To determine fair value, we use our internal cash flow estimates discounted at an appropriate interest rate, quoted market prices when available and independent appraisals, as appropriate.
Commercial aircraft are a significant concentration of assets in Infrastructure, and are particularly subject to market fluctuations. Therefore, we test recoverability of each aircraft in our operating lease portfolio at least annually. Additionally, we perform quarterly evaluations in circumstances such as when aircraft are re-leased, current lease terms have changed or a specific lessee’s credit standing changes. Future rentals and residual values are based on historical experience and information received routinely from independent appraisers. Estimated cash flows from future leases are reduced for expected downtime between leases and for estimated technical costs required to prepare aircraft to be redeployed. Fair value used to measure impairment is based on current market values from independent appraisers.
We recognized impairment losses on our operating lease portfolio of commercial aircraft of $0.3 billion and $0.1 billion in 2005 and 2004, respectively. In addition to these impairment charges relating to operating leases, we recorded provisions for losses on financing receivables related to commercial aircraft of $0.2 billion in 2005, primarily related to Northwest Airlines Corporation (Northwest Airlines), and $0.3 billion in 2004, primarily related to US Airways and ATA Holdings Corp.
Certain of our commercial aviation customers are operating under bankruptcy protection while they implement steps to return to profitable operations with a lower cost structure. At December 31, 2005, our largest exposures to carriers operating in bankruptcy were to Delta Air Lines, $2.4 billion; UAL Corp., $1.4 billion; and Northwest Airlines, $1.3 billion. Our financial exposures to these carriers are substantially secured by various Boeing, Airbus and Bombardier aircraft and operating equipment. On February 1, 2006, UAL Corp. emerged from bankruptcy protection.
Further information on impairment losses and our exposure to the commercial aviation industry is provided in the Operations-Overview section and in notes 10, 15 and 29.
GOODWILL AND OTHER IDENTIFIED INTANGIBLE ASSETS. We test goodwill for impairment annually and whenever events or circumstances make it more likely than not that an impairment may have occurred, such as a significant adverse change in the business climate or a decision to sell or dispose of a reporting unit. Determining whether an impairment has occurred requires valuation of the respective reporting unit, which we estimate using a discounted cash flow method. When available and as appropriate, we use comparative market multiples to corroborate discounted cash flow results. In applying this methodology, we rely on a number of factors, including actual operating results, future business plans, economic projections and market data.
If this analysis indicates goodwill is impaired, measuring the impairment requires a fair value estimate of each identified tangible and intangible asset. In this case we supplement the cash flow approach discussed above with independent appraisals, as appropriate.
We test other identified intangible assets with defined useful lives and subject to amortization by comparing the carrying amount to the sum of undiscounted cash flows expected to be generated by the asset. We test intangible assets with indefinite lives annually for impairment using a fair value method such as discounted cash flows.
Further information is provided in the Financial Resources and Liquidity-Intangible Assets section and in notes 1 and 16.
PENSION ASSUMPTIONS are significant inputs to the actuarial models that measure pension benefit obligations and related effects on operations. Two assumptions-discount rate and expected return on assets-are important elements of plan expense and asset/liability measurement. We evaluate these critical assumptions at least annually on a plan and country-specific basis. We evaluate other assumptions involving demographic factors such as retirement age, mortality and turnover periodically and update them to reflect our experience and expectations for the future. Actual results in any given year will often differ from actuarial assumptions because of economic and other factors.
GE 2005 ANNUAL REPORT 62
MANAGEMENT'S DISCUSSION AND ANALYSIS
Accumulated and projected benefit obligations are expressed as the present value of future cash payments. We discount those cash payments using the weighted average of market-observed yields for high quality fixed income securities with maturities that correspond to the payment of benefits. Lower discount rates increase present values and subsequent year pension expense; higher discount rates decrease present values and subsequent year pension expense.
To reflect market interest rate conditions, we reduced our discount rate for principal pension plans at December 31, 2005, from 5.75% to 5.50% and at December 31, 2004, from 6.0% to 5.75%.
To determine the expected long-term rate of return on pension plan assets, we consider the current and expected asset allocations, as well as historical and expected returns on various categories of plan assets. Assets in our principal pension plans earned 10.2% in 2005 and had average annual earnings of 4.7%, 10.1% and 11.8% per year in the five, 10 and 25-year periods ended December 31, 2005, respectively. We believe that these results, in connection with our current and expected asset allocations, support our assumed long-term return of 8.5% on those assets.
Sensitivity to changes in key assumptions for our principal pension plans follows.
• | Discount rate-A 25 basis point reduction in discount rate would increase pension cost in the following year by $0.2 billion. |
• | Expected return on assets-A 50 basis point increase in the expected return on assets would decrease pension cost in the following year by $0.2 billion. |
Further information on our pension plans is provided in the Operations-Overview section and in note 7.
DERIVATIVES AND HEDGING. We use derivatives to manage a variety of risks, including risks related to interest rates, foreign exchange and commodity prices. Accounting for derivatives as hedges requires that, at inception and over the term of the arrangement, the hedged item and related derivative meet the requirements for hedge accounting. The accounting guidance related to derivatives accounting is complex. Failure to apply this complex guidance correctly will result in all changes in the fair value of the derivative being reported in earnings, while offsetting changes in the fair value of the hedged item are reported in earnings only upon realization, regardless of whether the hedging relationship is economically effective.
In evaluating whether a particular relationship qualifies for hedge accounting, we first determine whether the relationship meets the strict criteria to qualify for exemption from ongoing effectiveness testing. For a relationship that does not meet these criteria, we test effectiveness at inception and quarterly thereafter by determining whether changes in the fair value of the derivative offset, within a specified range, changes in the fair value of the hedged item. This test is conducted on a cumulative basis each reporting period. If fair value changes fail this test, we discontinue applying hedge accounting to that relationship prospectively. Fair values of both the derivative instrument and the hedged item are calculated using internal valuation models incorporating market-based assumptions, subject to third party confirmation.
At December 31, 2005, derivative assets and liabilities were $1.9 billion and $2.2 billion, respectively. Further information about our use of derivatives is provided in notes 18 and 27.
OTHER LOSS CONTINGENCIES are recorded as liabilities when it is probable that a liability has been incurred and the amount of the loss is reasonably estimable. Disclosure is required when there is a reasonable possibility that the ultimate loss will materially exceed the recorded provision. Contingent liabilities are often resolved over long time periods. Estimating probable losses requires analysis of multiple forecasts that often depend on judgments about potential actions by third parties such as regulators. Further information is provided in notes 20 and 29.
Other Information
New Accounting Standard
In December 2004, the Financial Accounting Standards Board (FASB) issued Statement of Financial Accounting Standards (SFAS) 123 (revised 2004), Share-Based Payment (SFAS 123R), which will be effective for us on January 1, 2006. Among other things, SFAS 123R requires expensing the fair value of stock options, previously optional accounting that we adopted voluntarily in 2002. The transitional effect of this provision of SFAS 123R will be modest, consisting of a reduction in full-year 2006 net earnings of $9 million to expense the unvested portion of options granted in 2001. SFAS 123R also will require us to change the classification of certain tax benefits from share-based compensation deductions to financing rather than operating cash flows. While the effects of these future tax deductions will depend on several variables, had SFAS 123R been in effect, approximately $0.3 billion would have been required to be classified as financing, not operating, cash flows in both 2005 and 2004. Prior periods will not be restated as a result of this accounting change.
GE 2005 ANNUAL REPORT 63
AUDITED FINANCIAL STATEMENTS
Statement of Earnings
General Electric Company and consolidated affiliates | ||||||||||
| For the years ended December 31 (In millions; per-share amounts in dollars) | 2005 | 2004 | 2003 | |||||||
REVENUES | ||||||||||
| Sales of goods | $ | 59,837 | $ | 55,005 | $ | 49,963 | ||||
| Sales of services | 32,752 | 29,700 | 22,391 | |||||||
| Other income (note 3) | 1,683 | 1,064 | 602 | |||||||
| GECS earnings from continuing operations | ||||||||||
| before accounting changes | - | - | - | |||||||
| GECS revenues from services (note 4) | 55,430 | 48,712 | 39,930 | |||||||
| Total revenues | 149,702 | 134,481 | 112,886 | |||||||
COSTS AND EXPENSES (note 5) | ||||||||||
| Cost of goods sold | 46,169 | 42,645 | 37,189 | |||||||
| Cost of services sold | 20,645 | 19,114 | 14,017 | |||||||
| Interest and other financial charges | 15,187 | 11,656 | 10,460 | |||||||
| Investment contracts, insurance losses and | ||||||||||
| insurance annuity benefits | 5,474 | 3,583 | 3,069 | |||||||
| Provision for losses on financing receivables (note 14) | 3,841 | 3,888 | 3,752 | |||||||
| Other costs and expenses | 35,271 | 33,096 | 26,480 | |||||||
| Minority interest in net earnings of consolidated affiliates | 986 | 728 | 308 | |||||||
| Total costs and expenses | 127,573 | 114,710 | 95,275 | |||||||
EARNINGS FROM CONTINUING OPERATIONS BEFORE | ||||||||||
INCOME TAXES AND ACCOUNTING CHANGES | 22,129 | 19,771 | 17,611 | |||||||
| Provision for income taxes (note 8) | (3,854 | ) | (3,486 | ) | (3,845 | ) | ||||
EARNINGS FROM CONTINUING OPERATIONS BEFORE | ||||||||||
ACCOUNTING CHANGES | 18,275 | 16,285 | 13,766 | |||||||
| Earnings (loss) from discontinued operations, net of taxes (note 2) | (1,922 | ) | 534 | 2,057 | ||||||
EARNINGS BEFORE ACCOUNTING CHANGES | 16,353 | 16,819 | 15,823 | |||||||
| Cumulative effect of accounting changes (note 1) | - | - | (587 | ) | ||||||
NET EARNINGS | $ | 16,353 | $ | 16,819 | $ | 15,236 | ||||
| Per-share amounts (note 9) | ||||||||||
Per-share amounts-earnings from continuing | ||||||||||
| operations before accounting changes | ||||||||||
| Diluted earnings per share | $ | 1.72 | $ | 1.56 | $ | 1.37 | ||||
| Basic earnings per share | 1.73 | 1.57 | 1.37 | |||||||
Per-share amounts-earnings before accounting changes | ||||||||||
| Diluted earnings per share | 1.54 | 1.61 | 1.57 | |||||||
| Basic earnings per share | 1.55 | 1.62 | 1.58 | |||||||
Per-share amounts-net earnings | ||||||||||
| Diluted earnings per share | 1.54 | 1.61 | 1.51 | |||||||
| Basic earnings per share | 1.55 | 1.62 | 1.52 | |||||||
DIVIDENDS DECLARED PER SHARE | $ | 0.91 | $ | 0.82 | $ | 0.77 | ||||
Consolidated Statement of Changes in Shareowners’ Equity
| (In millions) | 2005 | 2004 | 2003 | |||||||
CHANGES IN SHAREOWNERS’ EQUITY (note 23) | ||||||||||
| Balance at January 1 | $ | 110,821 | $ | 79,631 | $ | 64,079 | ||||
| Dividends and other transactions with shareowners | (13,249 | ) | 10,009 | (5,520 | ) | |||||
| Changes other than transactions with shareowners | ||||||||||
| Increase attributable to net earnings | 16,353 | 16,819 | 15,236 | |||||||
Investment securities-net | (437 | ) | 412 | 710 | ||||||
Currency translation adjustments-net | (4,318 | ) | 3,936 | 5,061 | ||||||
Cash flow hedges-net | 401 | 435 | 226 | |||||||
Minimum pension liabilities-net | (217 | ) | (421 | ) | (161 | ) | ||||
| Total changes other than transactions with shareowners | 11,782 | 21,181 | 21,072 | |||||||
| Balance at December 31 | $ | 109,354 | $ | 110,821 | $ | 79,631 | ||||
The notes to consolidated financial statements are an integral part of these statements.
GE 2005 ANNUAL REPORT 64
AUDITED FINANCIAL STATEMENTS
Statement of Earnings (continued)
GE | GECS | ||||||||||||||||||
For the years ended December 31 (In millions; per-share amounts in dollars) | 2005 | 2004 | 2003 | 2005 | 2004 | 2003 | |||||||||||||
REVENUES | |||||||||||||||||||
| Sales of goods | $ | 57,378 | $ | 52,260 | $ | 47,767 | $ | 2,528 | $ | 2,840 | $ | 2,228 | |||||||
| Sales of services | 33,052 | 29,954 | 22,675 | - | - | - | |||||||||||||
| Other income (note 3) | 1,764 | 1,076 | 645 | - | - | - | |||||||||||||
| GECS earnings from continuing operations | |||||||||||||||||||
| before accounting changes | 9,141 | 7,853 | 5,931 | - | - | - | |||||||||||||
| GECS revenues from services (note 4) | - | - | - | 56,769 | 50,054 | 40,750 | |||||||||||||
| Total revenues | 101,335 | 91,143 | 77,018 | 59,297 | 52,894 | 42,978 | |||||||||||||
COSTS AND EXPENSES (note 5) | |||||||||||||||||||
| Cost of goods sold | 43,870 | 39,999 | 35,102 | 2,369 | 2,741 | 2,119 | |||||||||||||
| Cost of services sold | 20,945 | 19,368 | 14,301 | - | - | - | |||||||||||||
| Interest and other financial charges | 1,432 | 979 | 941 | 14,308 | 11,121 | 9,897 | |||||||||||||
| Investment contracts, insurance losses | |||||||||||||||||||
| and insurance annuity benefits | - | - | - | 5,674 | 3,800 | 3,069 | |||||||||||||
| Provision for losses on financing | |||||||||||||||||||
| receivables (note 14) | - | - | - | 3,841 | 3,888 | 3,752 | |||||||||||||
| Other costs and expenses | 13,279 | 12,001 | 9,870 | 22,658 | 21,788 | 17,095 | |||||||||||||
| Minority interest in net earnings of | |||||||||||||||||||
| consolidated affiliates | 784 | 538 | 181 | 202 | 190 | 127 | |||||||||||||
| Total costs and expenses | 80,310 | 72,885 | 60,395 | 49,052 | 43,528 | 36,059 | |||||||||||||
EARNINGS FROM CONTINUING | |||||||||||||||||||
OPERATIONS BEFORE INCOME | |||||||||||||||||||
TAXES AND ACCOUNTING CHANGES | 21,025 | 18,258 | 16,623 | 10,245 | 9,366 | 6,919 | |||||||||||||
| Provision for income taxes (note 8) | (2,750 | ) | (1,973 | ) | (2,857 | ) | (1,104 | ) | (1,513 | ) | (988 | ) | |||||||
EARNINGS FROM CONTINUING OPERATIONS | |||||||||||||||||||
BEFORE ACCOUNTING CHANGES | 18,275 | 16,285 | 13,766 | 9,141 | 7,853 | 5,931 | |||||||||||||
| Earnings (loss) from discontinued | |||||||||||||||||||
| operations, net of taxes (note 2) | (1,922 | ) | 534 | 2,057 | (1,922 | ) | 534 | 2,057 | |||||||||||
EARNINGS BEFORE ACCOUNTING CHANGES | 16,353 | 16,819 | 15,823 | 7,219 | 8,387 | 7,988 | |||||||||||||
| Cumulative effect of accounting changes (note 1) | - | - | (587 | ) | - | - | (339 | ) | |||||||||||
NET EARNINGS | $ | 16,353 | $ | 16,819 | $ | 15,236 | $ | 7,219 | $ | 8,387 | $ | 7,649 | |||||||
In the consolidating data on this page, “GE” means the basis of consolidation as described in note 1 to the consolidated financial statements; “GECS” means General Electric Capital Services, Inc. and all of its affiliates and associated companies. Transactions between GE and GECS have been eliminated from the “General Electric Company and consolidated affiliates” columns.
GE 2005 ANNUAL REPORT 65
AUDITED FINANCIAL STATEMENTS
Statement of Financial Position
General Electric Company and consolidated affiliates | |||||||
| At December 31 (In millions, except share amounts) | 2005 | 2004 | |||||
ASSETS | |||||||
| Cash and equivalents | $ | 9,011 | $ | 12,152 | |||
| Investment securities (note 10) | 53,144 | 56,923 | |||||
| Current receivables (note 11) | 14,851 | 14,233 | |||||
| Inventories (note 12) | 10,474 | 9,778 | |||||
Financing receivables-net (notes 13 and 14) | 287,639 | 282,699 | |||||
| Other GECS receivables | 14,767 | 11,340 | |||||
Property, plant and equipment-net (note 15) | 67,528 | 63,103 | |||||
| Investment in GECS | - | - | |||||
Intangible assets-net (note 16) | 81,726 | 78,456 | |||||
| All other assets (note 17) | 87,446 | 89,557 | |||||
| Assets of discontinued operations (note 2) | 46,756 | 132,266 | |||||
| Total assets | $ | 673,342 | $ | 750,507 | |||
LIABILITIES AND EQUITY | |||||||
| Short-term borrowings (note 18) | $ | 158,156 | $ | 157,195 | |||
| Accounts payable, principally trade accounts | 21,273 | 19,137 | |||||
| Progress collections and price adjustments accrued | 4,456 | 3,937 | |||||
| Dividends payable | 2,623 | 2,329 | |||||
| All other current costs and expenses accrued | 18,419 | 17,539 | |||||
| Long-term borrowings (note 18) | 212,281 | 207,871 | |||||
| Investment contracts, insurance liabilities and | |||||||
| insurance annuity benefits (note 19) | 45,432 | 48,076 | |||||
| All other liabilities (note 20) | 40,632 | 42,779 | |||||
| Deferred income taxes (note 21) | 16,330 | 15,285 | |||||
| Liabilities of and minority interest in | |||||||
| discontinued operations (note 2) | 36,332 | 112,935 | |||||
| Total liabilities | 555,934 | 627,083 | |||||
| Minority interest in equity of consolidated affiliates (note 22) | 8,054 | 12,603 | |||||
| Common stock (10,484,268,000 and 10,586,358,000 | |||||||
| shares outstanding at year-end 2005 and 2004, respectively) | 669 | 669 | |||||
Accumulated gains (losses)-net | |||||||
| Investment securities | 1,831 | 2,268 | |||||
| Currency translation adjustments | 2,532 | 6,850 | |||||
| Cash flow hedges | (822 | ) | (1,223 | ) | |||
| Minimum pension liabilities | (874 | ) | (657 | ) | |||
| Other capital | 25,227 | 24,265 | |||||
| Retained earnings | 98,117 | 91,411 | |||||
| Less common stock held in treasury | (17,326 | ) | (12,762 | ) | |||
| Total shareowners’ equity (notes 23 and 24) | 109,354 | 110,821 | |||||
| Total liabilities and equity | $ | 673,342 | $ | 750,507 | |||
The sum of accumulated gains (losses) on investment securities, currency translation adjustments, cash flow hedges and minimum pension liabilities constitutes “Accumulated nonowner changes other than earnings,” as shown in note 23, and was $2,667 million and $7,238 million at December 31, 2005 and 2004, respectively.
The notes to consolidated financial statements are an integral part of this statement.
GE 2005 ANNUAL REPORT 66
AUDITED FINANCIAL STATEMENTS
Statement of Financial Position (continued)
GE | GECS | ||||||||||||
| At December 31 (In millions, except share amounts) | 2005 | 2004 | 2005 | 2004 | |||||||||
ASSETS | |||||||||||||
| Cash and equivalents | $ | 2,015 | $ | 3,155 | $ | 7,316 | $ | 9,191 | |||||
| Investment securities (note 10) | 461 | 413 | 52,706 | 56,539 | |||||||||
| Current receivables (note 11) | 15,058 | 14,533 | - | - | |||||||||
| Inventories (note 12) | 10,315 | 9,589 | 159 | 189 | |||||||||
Financing receivables-net (notes 13 and 14) | - | - | 287,639 | 282,699 | |||||||||
| Other GECS receivables | - | - | 19,060 | 14,965 | |||||||||
Property, plant and equipment-net (note 15) | 16,504 | 16,756 | 51,024 | 46,347 | |||||||||
| Investment in GECS | 50,815 | 54,292 | - | - | |||||||||
Intangible assets-net (note 16) | 57,839 | 54,720 | 23,887 | 23,736 | |||||||||
| All other assets (note 17) | 36,752 | 38,123 | 52,058 | 52,572 | |||||||||
| Assets of discontinued operations (note 2) | - | - | 46,756 | 132,266 | |||||||||
| Total assets | $ | 189,759 | $ | 191,581 | $ | 540,605 | $ | 618,504 | |||||
LIABILITIES AND EQUITY | |||||||||||||
| Short-term borrowings (note 18) | $ | 1,127 | $ | 3,409 | $ | 157,672 | $ | 154,292 | |||||
| Accounts payable, principally trade accounts | 11,870 | 11,013 | 13,133 | 11,374 | |||||||||
| Progress collections and price adjustments accrued | 4,456 | 3,937 | - | - | |||||||||
| Dividends payable | 2,623 | 2,329 | - | - | |||||||||
| All other current costs and expenses accrued | 18,436 | 17,569 | - | - | |||||||||
| Long-term borrowings (note 18) | 9,081 | 7,625 | 204,397 | 201,209 | |||||||||
| Investment contracts, insurance liabilities | |||||||||||||
| and insurance annuity benefits (note 19) | - | - | 45,722 | 48,393 | |||||||||
| All other liabilities (note 20) | 23,273 | 23,561 | 17,453 | 19,300 | |||||||||
| Deferred income taxes (note 21) | 3,733 | 3,616 | 12,597 | 11,669 | |||||||||
| Liabilities of and minority interest in | |||||||||||||
| discontinued operations (note 2) | - | - | 36,568 | 113,073 | |||||||||
| Total liabilities | 74,599 | 73,059 | 487,542 | 559,310 | |||||||||
| Minority interest in equity of consolidated affiliates (note 22) | 5,806 | 7,701 | 2,248 | 4,902 | |||||||||
| Common stock (10,484,268,000 and 10,586,358,000 shares | |||||||||||||
| outstanding at year-end 2005 and 2004, respectively) | 669 | 669 | 1 | 1 | |||||||||
Accumulated gains (losses)-net | |||||||||||||
| Investment securities | 1,831 | 2,268 | 1,754 | 2,345 | |||||||||
| Currency translation adjustments | 2,532 | 6,850 | 2,287 | 5,104 | |||||||||
| Cash flow hedges | (822 | ) | (1,223 | ) | (813 | ) | (1,354 | ) | |||||
| Minimum pension liabilities | (874 | ) | (657 | ) | (179 | ) | (150 | ) | |||||
| Other capital | 25,227 | 24,265 | 12,386 | 12,370 | |||||||||
| Retained earnings | 98,117 | 91,411 | 35,379 | 35,976 | |||||||||
| Less common stock held in treasury | (17,326 | ) | (12,762 | ) | - | - | |||||||
| Total shareowners’ equity (notes 23 and 24) | 109,354 | 110,821 | 50,815 | 54,292 | |||||||||
| Total liabilities and equity | $ | 189,759 | $ | 191,581 | $ | 540,605 | $ | 618,504 | |||||
In the consolidating data on this page, “GE” means the basis of consolidation as described in note 1 to the consolidated financial statements; “GECS” means General Electric Capital Services, Inc. and all of its affiliates and associated companies. Transactions between GE and GECS have been eliminated from the “General Electric Company and consolidated affiliates” columns.
GE 2005 ANNUAL REPORT 67
AUDITED FINANCIAL STATEMENTS
Statement of Cash Flows
General Electric Company and consolidated affiliates | ||||||||||
| For the years ended December 31 (In millions) | 2005 | 2004 | 2003 | |||||||
CASH FLOWS-OPERATING ACTIVITIES | ||||||||||
| Net earnings | $ | 16,353 | $ | 16,819 | $ | 15,236 | ||||
| Loss (earnings) from discontinued operations | 1,922 | (534 | ) | (2,057 | ) | |||||
| Adjustments to reconcile net earnings to cash | ||||||||||
| provided from operating activities | ||||||||||
| Cumulative effect of accounting changes | - | - | 587 | |||||||
| Depreciation and amortization of property, plant and equipment | 8,538 | 8,349 | 6,864 | |||||||
| Earnings before accounting changes retained by GECS | - | - | - | |||||||
| Deferred income taxes | (1,121 | ) | (172 | ) | 1,206 | |||||
| Decrease (increase) in GE current receivables | (360 | ) | (849 | ) | 534 | |||||
| Decrease (increase) in inventories | (578 | ) | (468 | ) | 874 | |||||
| Increase in accounts payable | 1,238 | 4,090 | 232 | |||||||
| Increase (decrease) in GE progress collections | 510 | (464 | ) | (2,268 | ) | |||||
| Increase (decrease) in insurance liabilities | 1,034 | 1,959 | (729 | ) | ||||||
| Provision for losses on GECS financing receivables | 3,841 | 3,888 | 3,752 | |||||||
| All other operating activities | 2,410 | (2,136 | ) | (2,391 | ) | |||||
Cash from operating activities-continuing operations | 33,787 | 30,482 | 21,840 | |||||||
Cash from operating activities-discontinued operations | 3,854 | 6,002 | 7,389 | |||||||
CASH FROM OPERATING ACTIVITIES | 37,641 | 36,484 | 29,229 | |||||||
CASH FLOWS-INVESTING ACTIVITIES | ||||||||||
| Additions to property, plant and equipment | (14,441 | ) | (13,092 | ) | (9,751 | ) | ||||
| Dispositions of property, plant and equipment | 6,027 | 5,838 | 4,918 | |||||||
| Net increase in GECS financing receivables | (16,954 | ) | (15,280 | ) | (4,687 | ) | ||||
| Payments for principal businesses purchased | (11,498 | ) | (18,703 | ) | (14,352 | ) | ||||
| All other investing activities | 6,535 | 10,785 | 7,974 | |||||||
Cash used for investing activities-continuing operations | (30,331 | ) | (30,452 | ) | (15,898 | ) | ||||
Cash used for investing activities-discontinued operations | (4,718 | ) | (7,962 | ) | (5,945 | ) | ||||
CASH USED FOR INVESTING ACTIVITIES | (35,049 | ) | (38,414 | ) | (21,843 | ) | ||||
CASH FLOWS-FINANCING ACTIVITIES | ||||||||||
| Net increase (decrease) in borrowings (maturities of 90 days or less) | (4,600 | ) | (1,558 | ) | (20,559 | ) | ||||
| Newly issued debt (maturities longer than 90 days) | 66,523 | 58,538 | 67,719 | |||||||
| Repayments and other reductions (maturities longer than 90 days) | (53,133 | ) | (47,106 | ) | (43,479 | ) | ||||
| Net dispositions (purchases) of GE shares for treasury | (4,844 | ) | 3,993 | 726 | ||||||
| Dividends paid to shareowners | (9,352 | ) | (8,278 | ) | (7,643 | ) | ||||
| All other financing activities | (1,191 | ) | (3,397 | ) | 286 | |||||
Cash from (used for) financing activities-continuing operations | (6,597 | ) | 2,192 | (2,950 | ) | |||||
Cash from (used for) financing activities-discontinued operations | 478 | 2,402 | (682 | ) | ||||||
CASH FROM (USED FOR) FINANCING ACTIVITIES | (6,119 | ) | 4,594 | (3,632 | ) | |||||
INCREASE (DECREASE) IN CASH AND | ||||||||||
EQUIVALENTS DURING YEAR | (3,527 | ) | 2,664 | 3,754 | ||||||
| Cash and equivalents at beginning of year | 15,328 | 12,664 | 8,910 | |||||||
| Cash and equivalents at end of year | 11,801 | 15,328 | 12,664 | |||||||
| Less cash and equivalents of discontinued operations at end of year | 2,790 | 3,176 | 2,734 | |||||||
| Cash and equivalents of continuing operations at end of year | $ | 9,011 | $ | 12,152 | $ | 9,930 | ||||
SUPPLEMENTAL DISCLOSURE OF CASH | ||||||||||
FLOWS INFORMATION | ||||||||||
| Cash paid during the year for interest | $ | (16,446 | ) | $ | (11,907 | ) | $ | (10,910 | ) | |
| Cash recovered (paid) during the year for income taxes | (3,254 | ) | (1,339 | ) | (1,539 | ) | ||||
The notes to consolidated financial statements are an integral part of this statement.
GE 2005 ANNUAL REPORT 68
AUDITED FINANCIAL STATEMENTS
Statement of Cash Flows (continued)
GE | GECS | ||||||||||||||||||
| For the years ended December 31 (In millions) | 2005 | 2004 | 2003 | 2005 | 2004 | 2003 | |||||||||||||
CASH FLOWS-OPERATING ACTIVITIES | |||||||||||||||||||
| Net earnings | $ | 16,353 | $ | 16,819 | $ | 15,236 | $ | 7,219 | $ | 8,387 | $ | 7,649 | |||||||
| Loss (earnings) from discontinued operations | - | - | - | 1,922 | (534 | ) | (2,057 | ) | |||||||||||
| Adjustments to reconcile net earnings to cash | |||||||||||||||||||
| provided from operating activities | |||||||||||||||||||
| Cumulative effect of accounting changes | - | - | 587 | - | - | 339 | |||||||||||||
| Depreciation and amortization of | |||||||||||||||||||
| property, plant and equipment | 2,501 | 2,533 | 2,277 | 6,037 | 5,816 | 4,587 | |||||||||||||
| Earnings before accounting changes | |||||||||||||||||||
| retained by GECS | 597 | (5,282 | ) | (4,553 | ) | - | - | - | |||||||||||
| Deferred income taxes | (287 | ) | (175 | ) | 389 | (834 | ) | 3 | 817 | ||||||||||
| Decrease (increase) in GE current receivables | (266 | ) | (908 | ) | 585 | - | - | - | |||||||||||
| Decrease (increase) in inventories | (608 | ) | (459 | ) | 909 | 30 | (9 | ) | (35 | ) | |||||||||
| Increase in accounts payable | 983 | 1,888 | 676 | 596 | 2,927 | 96 | |||||||||||||
| Increase (decrease) in GE progress collections | 510 | (464 | ) | (2,268 | ) | - | - | - | |||||||||||
| Increase (decrease) in insurance liabilities | - | - | - | 1,034 | 1,959 | (729 | ) | ||||||||||||
| Provision for losses on GECS | |||||||||||||||||||
| financing receivables | - | - | - | 3,841 | 3,888 | 3,752 | |||||||||||||
| All other operating activities | 1,826 | 1,252 | (913 | ) | 1,065 | (2,312 | ) | (360 | ) | ||||||||||
Cash from operating activities- | |||||||||||||||||||
| continuing operations | 21,609 | 15,204 | 12,925 | 20,910 | 20,125 | 14,059 | |||||||||||||
Cash from operating activities- | |||||||||||||||||||
| discontinued operations | - | - | - | 3,854 | 6,002 | 7,389 | |||||||||||||
CASH FROM OPERATING ACTIVITIES | 21,609 | 15,204 | 12,925 | 24,764 | 26,127 | 21,448 | |||||||||||||
CASH FLOWS-INVESTING ACTIVITIES | |||||||||||||||||||
| Additions to property, plant and equipment | (2,812 | ) | (2,427 | ) | (2,158 | ) | (11,629 | ) | (10,665 | ) | (7,593 | ) | |||||||
| Dispositions of property, plant and equipment | - | - | - | 6,027 | 5,838 | 4,918 | |||||||||||||
| Net increase in GECS financing receivables | - | - | - | (16,954 | ) | (15,280 | ) | (4,687 | ) | ||||||||||
| Payments for principal businesses purchased | (4,331 | ) | (4,815 | ) | (3,870 | ) | (7,167 | ) | (13,888 | ) | (10,482 | ) | |||||||
| All other investing activities | 702 | 632 | 236 | 4,644 | 8,386 | 6,103 | |||||||||||||
Cash used for investing activities-continuing operations | (6,441 | ) | (6,610 | ) | (5,792 | ) | (25,079 | ) | (25,609 | ) | (11,741 | ) | |||||||
Cash used for investing activities- | |||||||||||||||||||
| discontinued operations | - | - | - | (4,718 | ) | (7,962 | ) | (5,945 | ) | ||||||||||
CASH USED FOR INVESTING ACTIVITIES | (6,441 | ) | (6,610 | ) | (5,792 | ) | (29,797 | ) | (33,571 | ) | (17,686 | ) | |||||||
CASH FLOWS-FINANCING ACTIVITIES | |||||||||||||||||||
| Net increase (decrease) in borrowings | |||||||||||||||||||
| (maturities of 90 days or less) | (392 | ) | (1,690 | ) | (6,704 | ) | (4,044 | ) | 33 | (13,487 | ) | ||||||||
| Newly issued debt (maturities longer than 90 days) | 1,704 | 434 | 7,356 | 65,054 | 58,143 | 60,113 | |||||||||||||
| Repayments and other reductions (maturities | |||||||||||||||||||
| longer than 90 days) | (3,424 | ) | (1,568 | ) | (277 | ) | (49,709 | ) | (45,538 | ) | (43,202 | ) | |||||||
| Net dispositions (purchases) of GE shares for treasury | (4,844 | ) | 3,993 | 726 | - | - | - | ||||||||||||
| Dividends paid to shareowners | (9,352 | ) | (8,278 | ) | (7,643 | ) | (7,816 | ) | (3,105 | ) | (3,435 | ) | |||||||
| All other financing activities | - | - | - | (1,191 | ) | (3,397 | ) | 286 | |||||||||||
Cash from (used for) financing activities- | |||||||||||||||||||
| continuing operations | (16,308 | ) | (7,109 | ) | (6,542 | ) | 2,294 | 6,136 | 275 | ||||||||||
Cash from (used for) financing activities- | |||||||||||||||||||
| discontinued operations | - | - | - | 478 | 2,402 | (682 | ) | ||||||||||||
CASH FROM (USED FOR) FINANCING ACTIVITIES | (16,308 | ) | (7,109 | ) | (6,542 | ) | 2,772 | 8,538 | (407 | ) | |||||||||
INCREASE (DECREASE) IN CASH AND | |||||||||||||||||||
EQUIVALENTS DURING YEAR | (1,140 | ) | 1,485 | 591 | (2,261 | ) | 1,094 | 3,355 | |||||||||||
| Cash and equivalents at beginning of year | 3,155 | 1,670 | 1,079 | 12,367 | 11,273 | 7,918 | |||||||||||||
| Cash and equivalents at end of year | 2,015 | 3,155 | 1,670 | 10,106 | 12,367 | 11,273 | |||||||||||||
| Less cash and equivalents of discontinued | |||||||||||||||||||
| operations at end of year | - | - | - | 2,790 | 3,176 | 2,734 | |||||||||||||
| Cash and equivalents of continuing operations | |||||||||||||||||||
| at end of year | $ | 2,015 | $ | 3,155 | $ | 1,670 | $ | 7,316 | $ | 9,191 | $ | 8,539 | |||||||
SUPPLEMENTAL DISCLOSURE OF CASH | |||||||||||||||||||
FLOWS INFORMATION | |||||||||||||||||||
| Cash paid during the year for interest | $ | (928 | ) | $ | (603 | ) | $ | (248 | ) | $ | (15,518 | ) | $ | (11,304 | ) | $ | (10,662 | ) | |
| Cash recovered (paid) during the year for income taxes | (1,829 | ) | (2,261 | ) | (2,685 | ) | (1,425 | ) | 922 | 1,146 | |||||||||
In the consolidating data on this page, “GE” means the basis of consolidation as described in note 1 to the consolidated financial statements; “GECS” means General Electric Capital Services, Inc. and all of its affiliates and associated companies. Transactions between GE and GECS have been eliminated from the “General Electric Company and consolidated affiliates” columns.
GE 2005 ANNUAL REPORT 69
NOTES TO CONSOLIDATED FINANCIAL STATEMENTS
Note 1
Summary of Significant Accounting Policies
Accounting principles
Our financial statements are prepared in conformity with U.S. generally accepted accounting principles (GAAP).
Consolidation
Our financial statements consolidate all of our affiliates-companies that we control and in which we hold a majority voting interest. Associated companies are companies that we do not control but over which we have significant influence, most often because we hold a shareholder voting position of 20% to 50%. Results of associated companies are presented on a one-line basis. Investments in and advances to associated companies are presented on a one-line basis in the caption “All other assets” in our Statement of Financial Position, net of allowance for losses that represents our best estimate of probable losses inherent in such assets.
Because of new accounting requirements that became effective in 2004 and 2003, we consolidated certain non-affiliates, including certain special purpose entities (SPEs) and investments previously considered associated companies, in each of those years.
Financial statement presentation
We have reclassified certain prior-year amounts to conform to the current year’s presentation.
Financial data and related measurements are presented in the following categories:
• | GE This represents the adding together of all affiliates other than General Electric Capital Services, Inc. (GECS), whose operations are presented on a one-line basis. |
• | GECS This affiliate owns all of the common stock of General Electric Capital Corporation (GE Capital) and GE Insurance Solutions Corporation (GE Insurance Solutions), the parent of Employers Reinsurance Corporation. GE Capital and its respective affiliates are consolidated in the accompanying GECS columns and constitute its business. |
In 2005, most of GE Insurance Solutions was classified as part of our discontinued insurance operations. See note 2.
• | CONSOLIDATED This represents the adding together of GE and GECS. |
• | OPERATING SEGMENTS These comprise our six businesses focused on the broad markets they serve: Infrastructure, Industrial, Healthcare, NBC Universal, Commercial Finance and Consumer Finance. For segment reporting purposes, certain GECS businesses are included in the industrial operating segments that actively manage such businesses and report their results for internal performance measurement purposes. These include Aviation Financial Services, Energy Financial Services and Transportation Finance reported in the Infrastructure segment, and Equipment Services reported in the Industrial segment. |
Unless otherwise indicated, information in these notes to consolidated financial statements relates to continuing operations.
The effects of translating to U.S. dollars the financial statements of non-U.S. affiliates whose functional currency is the local currency are included in shareowners’ equity. Asset and liability accounts are translated at year-end exchange rates, while revenues and expenses are translated at average rates for the period.
Effects of transactions between related companies are eliminated. Transactions between GE and GECS are immaterial and consist primarily of GECS services for material procurement and trade receivables management, buildings and equipment leased by GE from GECS, information technology (IT) and other services sold to GECS by GE, aircraft engines manufactured by GE that are installed on aircraft purchased by GECS from third-party producers for lease to others, medical equipment manufactured by GE that is leased by GECS to others, and various investments and loans.
Preparing financial statements in conformity with GAAP requires us to make estimates and assumptions that affect reported amounts and related disclosures. Actual results could differ from those estimates.
Sales of goods and services
We record sales of goods when a firm sales agreement is in place, delivery has occurred and collectibility of the fixed or determinable sales price is reasonably assured. If customer acceptance of products is not assured, we record sales only upon formal customer acceptance.
Consumer lighting products, home videos and computer hardware and software products are often sold with a right of return. Accumulated experience is used to estimate and provide for such returns when we record the sale.
Sales of goods in the Industrial businesses typically do not include multiple product and/or services elements. In contrast, sales of goods in the Infrastructure and Healthcare businesses sometimes include multiple components and sometimes include services such as installation. In such contracts, amounts assigned to each component are based on that component’s objectively determined fair value, such as the sales price for the component when it is sold separately or competitor prices for similar components. Sales are recognized individually for delivered components only if they have value to the customer on a standalone basis and the undelivered components have objectively determined fair values and are not essential to the functionality of the delivered components. When undelivered components are inconsequential or perfunctory and not essential to the functionality of the delivered components (like certain training commitments), we recognize sales on the total contract and make a provision for the cost of the incomplete components.
We record sales of product services, certain power generation equipment, military aircraft engines, Healthcare IT projects and water treatment equipment in accordance with their respective contracts. For long-term product services agreements, we use estimated contract profit rates to record sales as work is performed. For other contracts, we use estimated contract profit rates to
GE 2005 ANNUAL REPORT 70
NOTES TO CONSOLIDATED FINANCIAL STATEMENTS
record sales as major components are completed and delivered to customers. Estimates are subject to revisions. Revisions that affect an agreement’s total estimated profitability result in an immediate adjustment of earnings. We provide for any loss when that loss is probable.
We expense costs to acquire or originate sales agreements as incurred.
NBC Universal, Inc. (NBC Universal) records broadcast and cable television advertising sales when advertisements are aired, net of provision for any viewer shortfalls (make goods). We record sales from theatrical distribution of films as the films are exhibited; sales of home videos, net of a return provision, when the videos are shipped and available for sale by retailers; fees from cable and satellite operators when services are provided; and licensing of film and television programming when we make the material available for airing.
GECS revenues from services (earned income)
We use the interest method to recognize income on all loans. Interest on loans includes origination, commitment and other non-refundable fees related to funding (recorded in earned income on the interest method). We stop accruing interest at the earlier of the time at which collection of an account becomes doubtful or the account becomes 90 days past due. We recognize interest income on nonearning loans either as cash is collected or on a cost-recovery basis as conditions warrant. We resume accruing interest on nonearning, non-restructured commercial loans only when (a) payments are brought current according to the loan’s original terms and (b) future payments are reasonably assured. When we agree to restructured terms with the borrower, we resume accruing interest only when reasonably assured that we will recover full contractual payments, and such loans pass underwriting reviews equivalent to those applied to new loans. We resume accruing interest on nonearning consumer loans when the customer’s account is less than 90 days past due.
We record financing lease income on the interest method to produce a level yield on funds not yet recovered. Estimated unguaranteed residual values at the date of lease inception represent our initial estimates of the fair value of the leased assets at the expiration of the lease and are based primarily on independent appraisals, which are updated periodically. Guarantees of residual values by unrelated third parties are considered part of minimum lease payments. Significant assumptions we use in estimating residual values include estimated net cash flows over the remaining lease term, results of future remarketing, and future component part and scrap metal prices, discounted at an appropriate rate.
We recognize operating lease income on a straight-line basis over the terms of underlying leases.
Fees include commitment fees related to loans that we do not expect to fund and line-of-credit fees. We record these fees in earned income on a straight-line basis over the period to which they relate. We record syndication fees in earned income at the time related services are performed, unless significant contingencies exist.
See the Investment securities and GECS investment contracts, insurance liabilities and insurance annuity benefits sections of this note for a description of accounting policies for these activities.
Depreciation and amortization
The cost of GE manufacturing plant and equipment is depreciated over its estimated economic life. U.S. assets are depreciated using an accelerated method based on a sum-of-the-years digits formula; non-U.S. assets are depreciated on a straight-line basis.
The cost of GECS equipment leased to others on operating leases is amortized on a straight-line basis to estimated residual value over the lease term or over the estimated economic life of the equipment. See note 15.
NBC Universal film and television costs
We defer film and television production costs, including direct costs, production overhead, development costs and interest. We do not defer costs of exploitation, which principally comprise costs of film and television program marketing and distribution. We amortize deferred film and television production costs, as well as associated participation and residual costs, on an individual production basis using the ratio of the current period’s gross revenues to estimated total remaining gross revenues from all sources; we state such costs at the lower of amortized cost or fair value. We defer the costs of acquired broadcast material, including rights to material for use on NBC Universal’s broadcast and cable networks, at the earlier of acquisition or when the license period begins and the material is available for use. We amortize acquired broadcast material and rights when we broadcast the associated programs; we state such costs at the lower of amortized cost or net realizable value.
Losses on financing receivables
Our allowance for losses on financing receivables represents our best estimate of probable losses inherent in the portfolio. Our method of calculating estimated losses depends on the size, type and risk characteristics of the related receivables. Write-offs are deducted from the allowance for losses and subsequent recoveries are added. Impaired financing receivables are written down to the extent that we judge principal to be uncollectible.
Our portfolio consists entirely of homogenous consumer loans and of commercial loans and leases. The underlying assumptions, estimates and assessments we use to provide for losses are continually updated to reflect our view of current conditions. Changes in such estimates can significantly affect the allowance and provision for losses. It is possible to experience credit losses that are different from our current estimates.
Our consumer loan portfolio consists of smaller balance, homogenous loans including card receivables, installment loans, auto loans and leases and residential mortgages. We collectively evaluate each portfolio for impairment. The allowance for losses on these receivables is established through a process that estimates the probable losses inherent in the portfolio based upon statistical analyses of portfolio data. These analyses include migration analysis, in which historical delinquency and credit loss experience is applied to the current aging of the portfolio, together with other analyses that reflect current trends and conditions. We also consider overall portfolio indicators including nonearning loans, trends in loan volume and lending terms, credit policies and other observable environmental factors.
GE 2005 ANNUAL REPORT 71
NOTES TO CONSOLIDATED FINANCIAL STATEMENTS
During 2004, Consumer Finance adopted a global policy for uncollectible receivables that accelerated write-offs to follow one consistent basis. We write off unsecured closed-end installment loans at 120 days contractually past due and unsecured open-ended revolving loans at 180 days contractually past due. We write down loans secured by collateral other than real estate to the fair value of the collateral, less costs to sell, when such loans are 120 days past due. Consumer loans secured by residential real estate (both revolving and closed-end loans) are written down to the fair value of collateral, less costs to sell, no later than when they become 360 days past due. Unsecured loans in bankruptcy are written off within 60 days of notification of filing by the bankruptcy court or within contractual write-off periods, whichever occurs earlier.
Our commercial loan and lease portfolio consists of a variety of loans and leases, including both larger balance, non-homogenous loans and leases and smaller balance homogenous commercial and equipment loans and leases. Losses on such loans and leases are recorded when probable and estimable. We routinely survey our entire portfolio for potential specific credit or collection issues that might indicate an impairment. For larger balance, non-homogenous loans and leases, this survey first considers the financial status, payment history, collateral value, industry conditions and guarantor support related to specific customers. Any delinquencies or bankruptcies are indications of potential impairment requiring further assessment of collectibility. We routinely receive financial, as well as rating agency reports, on our customers, and we elevate for further attention those customers whose operations we judge to be marginal or deteriorating. We also elevate customers for further attention when we observe a decline in collateral values for asset-based loans. While collateral values are not always available, when we observe such a decline, we evaluate relevant markets to assess recovery alternatives- for example, for real estate loans, relevant markets are local; for aircraft loans, relevant markets are global. We provide allowances based on our evaluation of all available information, including expected future cash flows, fair value of collateral, net of disposal costs, and the secondary market value of the financing receivables. After providing for specific incurred losses, we then determine an allowance for losses that have been incurred in the balance of the portfolio but cannot yet be identified to a specific loan or lease. This estimate is based on historical and projected default rates and loss severity, and it is prepared by each respective line of business.
Experience is not available with new products; therefore, while we are developing that experience, we set loss allowances based on our experience with the most closely analogous products in our portfolio.
When we repossess collateral in satisfaction of a loan, we write down the receivable against the allowance for losses. Repossessed collateral is included in All other assets in the Statement of Financial Position and carried at the lower of cost or estimated fair value less costs to sell.
The remainder of our commercial loans and leases are portfolios of smaller balance homogenous commercial and equipment positions that we evaluate collectively for impairment based upon various statistical analyses considering historical losses and aging.
Sales of stock by affiliates
We record gains or losses on sales by an affiliate of its own shares as revenue unless realization of gains is not reasonably assured, in which case we record the results in shareowners’ equity.
Cash and equivalents
Debt securities with original maturities of three months or less are included in cash equivalents unless designated as available-for-sale and classified as investment securities.
Investment securities
We report investments in debt and marketable equity securities, and equity securities in our insurance portfolio, at fair value based on quoted market prices or, if quoted prices are not available, discounted expected cash flows using market rates commensurate with the credit quality and maturity of the investment. Unrealized gains and losses on available-for-sale investment securities are included in shareowners’ equity, net of applicable taxes and other adjustments. We regularly review investment securities for impairment based on both quantitative and qualitative criteria that include the extent to which cost exceeds market value, the duration of that market decline, our intent and ability to hold to maturity or until forecasted recovery and the financial health of and specific prospects for the issuer. Unrealized losses that are other than temporary are recognized in earnings. For investment securities designated as trading, unrealized gains and losses are recognized currently in earnings. Realized gains and losses are accounted for on the specific identification method.
Inventories
All inventories are stated at the lower of cost or realizable values. Cost for substantially all of GE’s U.S. inventories is determined on a last-in, first-out (LIFO) basis. Cost of other GE inventories is determined on a first-in, first-out (FIFO) basis. GECS inventories consist of finished products held for sale, and cost is determined on a FIFO basis.
Intangible assets
We do not amortize goodwill, but test it annually for impairment using a fair value approach at the reporting unit level. A reporting unit is the operating segment, or a business one level below that operating segment (the component level) if discrete financial information is prepared and regularly reviewed by segment management. However, components are aggregated as a single reporting unit if they have similar economic characteristics. We recognize an impairment charge for any amount by which the carrying amount of a reporting unit’s goodwill exceeds its fair value. We use discounted cash flows to establish fair values. When available and as appropriate, we use comparative market multiples to corroborate discounted cash flow results. When a business within a reporting unit is disposed of, goodwill is allocated to the gain or loss on disposition using the relative fair value method.
We amortize the cost of other intangibles over their estimated useful lives unless such lives are deemed indefinite. Amortizable intangible assets are tested for impairment based on undiscounted cash flows and, if impaired, written down to fair value based
GE 2005 ANNUAL REPORT 72
NOTES TO CONSOLIDATED FINANCIAL STATEMENTS
on either discounted cash flows or appraised values. Intangible assets with indefinite lives are tested annually for impairment and written down to fair value as required.
GECS investment contracts, insurance liabilities and insurance annuity benefits
Certain SPEs, which we consolidate, provide guaranteed investment contracts to states, municipalities and municipal authorities.
Our insurance activities also include providing insurance and reinsurance for life and health risks and providing certain annuity products. Three product groups are provided: traditional insurance contracts, investment contracts and universal life insurance contracts. Insurance contracts are contracts with significant mortality and/or morbidity risks, while investment contracts are contracts without such risks. Universal life insurance contracts are a particular type of long-duration insurance contract whose terms are not fixed and guaranteed.
For short-duration insurance contracts, including accident and health insurance, we report premiums as earned income over the terms of the related agreements, generally on a pro-rata basis. For traditional long-duration insurance contracts including term, whole life and annuities payable for the life of the annuitant, we report premiums as earned income when due.
Premiums received on investment contracts (including annuities without significant mortality risk) and universal life contracts are not reported as revenues but rather as deposit liabilities. We recognize revenues for charges and assessments on these contracts, mostly for mortality, contract initiation, administration and surrender. Amounts credited to policyholder accounts are charged to expense.
Liabilities for traditional long-duration insurance contracts represent the present value of such benefits less the present value of future net premiums based on mortality, morbidity, interest and other assumptions at the time the policies were issued or acquired. Liabilities for investment contracts and universal life policies equal the account value, that is, the amount that accrues to the benefit of the contract or policyholder including credited interest and assessments through the financial statement date.
Liabilities for unpaid claims and claims adjustment expenses represent our best estimate of the ultimate obligations for reported and incurred-but-not-reported claims and the related estimated claim settlement expenses. Liabilities for unpaid claims and claims adjustment expenses are continually reviewed and adjusted through current operations.
Accounting changes
On July 1, 2003, we adopted FIN 46, Consolidation of Variable Interest Entities, and, on January 1, 2004, the related subsequent amendment (FIN 46R). Consequently, in 2003 we recorded a $372 million ($0.04 per share) after-tax charge related to the first-time consolidation of certain SPEs, reported in the caption “Cumulative effect of accounting changes.” There was no earnings effect arising from our adoption of FIN 46R. Additional information about entities consolidated under these rules is provided in note 28.
Statement of Financial Accounting Standards (SFAS) 143, Accounting for Asset Retirement Obligations, became effective for us on January 1, 2003. Under SFAS 143, obligations associated with the retirement of long-lived assets are recorded when there is a legal obligation to incur such costs and the fair value of the liability can be reasonably estimated. This amount is accounted for like an additional element of cost, and, like other cost elements, is depreciated over the corresponding asset’s useful life. On January 1, 2003, we recorded a one-time, non-cash transition charge of $330 million ($215 million after tax, or $0.02 per share), which is reported in the caption “Cumulative effect of accounting changes.” SFAS 143 primarily affects our accounting for costs associated with the future retirement of facilities used for storage and production of nuclear fuel and, with our acquisition of Amersham plc (Amersham) in April 2004, radio-pharmaceuticals and special radio-labeled chemicals.
In 2002, we adopted on a prospective basis the stock option expense provisions of SFAS 123, Accounting for Stock-Based Compensation. A comparison of reported and pro-forma net earnings, including effects of expensing stock options, follows.
| (In millions; per-share amounts in dollars) | 2005 | 2004 | 2003 | |||||||
| Net earnings, as reported | $ | 16,353 | $ | 16,819 | $ | 15,236 | ||||
| Earnings per share, as reported | ||||||||||
| Diluted | 1.54 | 1.61 | 1.51 | |||||||
| Basic | 1.55 | 1.62 | 1.52 | |||||||
| Stock option expense included in net earnings | 106 | 93 | 81 | |||||||
Total stock option expense(a) | 191 | 245 | 315 | |||||||
PRO-FORMA EFFECTS | ||||||||||
| Net earnings, on pro-forma basis | 16,268 | 16,667 | 15,002 | |||||||
| Earnings per share, on pro-forma basis | ||||||||||
| Diluted | 1.53 | 1.60 | 1.49 | |||||||
| Basic | 1.54 | 1.60 | 1.50 | |||||||
Other stock-based compensation expense recognized in earnings was $87 million, $95 million and $75 million in 2005, 2004 and 2003, respectively.
| (a) | As if we had applied SFAS 123 to expense stock options in all periods. Included amounts we actually recognized in earnings. |
GE 2005 ANNUAL REPORT 73
NOTES TO CONSOLIDATED FINANCIAL STATEMENTS
Note 2
Discontinued Operations
Planned sale of GE Insurance Solutions
On November 18, 2005, Swiss Reinsurance Company (Swiss Re) agreed to buy the property and casualty insurance and reinsurance businesses and the European life and health operations of GE Insurance Solutions for $8.5 billion, including the assumption of $1.7 billion of debt. Of the consideration other than assumed debt, 55%, or $3.7 billion, will consist of some combination of cash and mandatory convertible instruments and 45%, or $3.1 billion, of newly issued Swiss Re common stock that will be restricted from sale for 360 days. The common stock position is expected to represent about a 12% ownership position in Swiss Re. Operating results through closing will be controlled by us and be for our benefit, we will be subject to certain restrictions with respect to conducting the businesses being sold, and we and Swiss Re will mutually indemnify each other. Effective at closing, all claims liabilities will be the responsibility of Swiss Re.
We presently expect this transaction to close in the second quarter of 2006, subject to regulatory approvals and customary closing conditions.
Sale of Genworth
In May 2004, we completed the initial public offering of Genworth Financial Inc. (Genworth), our formerly wholly-owned subsidiary that conducted most of our consumer insurance business, including life and mortgage insurance operations. During 2005, we reduced our ownership in Genworth to 18% through further sales of stock in three secondary public offerings. Our remaining available-for-sale investment in Genworth common stock is included in assets of discontinued operations, and results of future sales will be reported in discontinued operations.
Discontinued operations
At December 31, 2005, most of GE Insurance Solutions and Genworth were classified as discontinued operations and their results of operations, financial position and cash flows are separately reported for all periods presented. Summarized financial information for discontinued operations is set forth below. Gain (loss) on disposal included actual (Genworth) and estimated (GE Insurance Solutions) effects of these sales.
Total | Genworth | GE Insurance Solutions | ||||||||||||||||||||||||||
| (In millions) | 2005 | 2004 | 2003 | 2005 | 2004 | 2003 | 2005 | 2004 | 2003 | |||||||||||||||||||
DISCONTINUED OPERATIONS | ||||||||||||||||||||||||||||
BEFORE DISPOSAL | ||||||||||||||||||||||||||||
| Revenues from services | $ | 15,359 | $ | 18,773 | $ | 21,755 | $ | 7,908 | $ | 10,148 | $ | 11,790 | $ | 7,451 | $ | 8,625 | $ | 9,965 | ||||||||||
| Earnings (loss) from discontinued | ||||||||||||||||||||||||||||
| operations before minority interest | ||||||||||||||||||||||||||||
| and income taxes | $ | (1,748 | ) | $ | 1,479 | $ | 2,682 | $ | 1,388 | $ | 1,546 | $ | 2,039 | $ | (3,136 | ) | $ | (67 | ) | $ | 643 | |||||||
| Minority interest | 394 | 200 | 2 | 394 | 200 | 2 | - | - | - | |||||||||||||||||||
| Earnings (loss) from discontinued | ||||||||||||||||||||||||||||
| operations before income taxes | (2,142 | ) | 1,279 | 2,680 | 994 | 1,346 | 2,037 | (3,136 | ) | (67 | ) | 643 | ||||||||||||||||
| Income tax benefit (expense) | 602 | (409 | ) | (623 | ) | (618 | ) | (566 | ) | (640 | ) | 1,220 | 157 | 17 | ||||||||||||||
| Earnings (loss) from discontinued | ||||||||||||||||||||||||||||
| operations before disposal, | ||||||||||||||||||||||||||||
| net of taxes | $ | (1,540 | ) | $ | 870 | $ | 2,057 | $ | 376 | $ | 780 | $ | 1,397 | $ | (1,916 | ) | $ | 90 | $ | 660 | ||||||||
DISPOSAL | ||||||||||||||||||||||||||||
| Gain (loss) on disposal before income taxes | $ | 629 | $ | (570 | ) | $ | - | $ | 932 | $ | (570 | ) | $ | - | $ | (303 | ) | $ | - | $ | - | |||||||
| Income tax benefit (expense) | (1,011 | ) | 234 | - | (380 | ) | 234 | - | (631 | ) | - | - | ||||||||||||||||
| Gain (loss) on disposal, net of taxes | $ | (382 | ) | $ | (336 | ) | $ | - | $ | 552 | $ | (336 | ) | $ | - | $ | (934 | ) | $ | - | $ | - | ||||||
EARNINGS (LOSS) FROM | ||||||||||||||||||||||||||||
DISCONTINUED OPERATIONS, | ||||||||||||||||||||||||||||
NET OF TAXES | $ | (1,922 | ) | $ | 534 | $ | 2,057 | $ | 928 | $ | 444 | $ | 1,397 | $ | (2,850 | ) | $ | 90 | $ | 660 | ||||||||
GE 2005 ANNUAL REPORT 74
NOTES TO CONSOLIDATED FINANCIAL STATEMENTS
Total | Genworth | GE Insurance Solutions | |||||||||||||||||
| December 31 (In millions) | 2005 | 2004 | 2005 | 2004 | 2005 | 2004 | |||||||||||||
| Cash and equivalents | $ | 2,790 | $ | 3,176 | $ | - | $ | 1,407 | $ | 2,790 | $ | 1,769 | |||||||
| Investment securities | 26,637 | 78,613 | 2,981 | 54,064 | 23,656 | 24,549 | |||||||||||||
| Other GECS receivables | 13,480 | 25,140 | - | 11,684 | 13,480 | 13,456 | |||||||||||||
| Other | 3,849 | 25,337 | - | 20,642 | 3,849 | 4,695 | |||||||||||||
| Assets of discontinued operations | 46,756 | 132,266 | 2,981 | 87,797 | 43,775 | 44,469 | |||||||||||||
ELIMINATIONS | - | - | - | - | - | - | |||||||||||||
| Total | $ | 46,756 | $ | 132,266 | $ | 2,981 | $ | 87,797 | $ | 43,775 | $ | 44,469 | |||||||
| Investment contracts, insurance liabilities | |||||||||||||||||||
| and insurance annuity benefits | $ | 31,043 | $ | 92,509 | $ | - | $ | 61,857 | $ | 31,043 | $ | 30,652 | |||||||
| Other | 5,525 | 16,784 | - | 11,437 | 5,525 | 5,347 | |||||||||||||
| Minority interest | - | 3,780 | - | 3,780 | - | - | |||||||||||||
| Liabilities of and minority interest | |||||||||||||||||||
| in discontinued operations | 36,568 | 113,073 | - | 77,074 | 36,568 | 35,999 | |||||||||||||
ELIMINATIONS | (236 | ) | (138 | ) | - | - | (236 | ) | (138 | ) | |||||||||
| Total | $ | 36,332 | $ | 112,935 | $ | - | $ | 77,074 | $ | 36,332 | $ | 35,861 | |||||||
Accumulated gains (losses)-net | |||||||||||||||||||
| Investment securities | $ | 532 | $ | 869 | $ | 465 | $ | 707 | $ | 67 | $ | 162 | |||||||
| Currency translation adjustments | (48 | ) | 591 | - | 332 | (48 | ) | 259 | |||||||||||
| Cash flow hedges | - | 189 | - | 191 | - | (2 | ) | ||||||||||||
| Total accumulated nonowner changes | |||||||||||||||||||
| other than earnings | $ | 484 | $ | 1,649 | $ | 465 | $ | 1,230 | $ | 19 | $ | 419 | |||||||
Note 3
GE Other Income
| (In millions) | 2005 | 2004 | 2003 | |||||||
| Sales of business interests | $ | 630 | $ | 464 | $ | 110 | ||||
| Associated companies | 256 | 191 | 118 | |||||||
| Licensing and royalty income | 227 | 145 | 135 | |||||||
| Marketable securities and bank deposits | 96 | 92 | 75 | |||||||
| Other items | 555 | 184 | 207 | |||||||
| Total | $ | 1,764 | $ | 1,076 | $ | 645 | ||||
Note 4
GECS Revenues from Services
| (In millions) | 2005 | 2004 | 2003 | |||||||
| Interest on loans | $ | 20,096 | $ | 17,314 | $ | 15,448 | ||||
| Operating lease rentals | 11,582 | 10,744 | 7,199 | |||||||
| Investment income | 4,278 | 2,801 | 1,628 | |||||||
| Fees | 4,180 | 3,254 | 2,494 | |||||||
| Financing leases | 3,990 | 4,160 | 4,206 | |||||||
| Premiums earned by insurance activities | 2,951 | 2,428 | 3,432 | |||||||
| Other income | 9,692 | 9,353 | 6,343 | |||||||
Total(a) | $ | 56,769 | $ | 50,054 | $ | 40,750 | ||||
| (a) | Included $1,295 million, $962 million and $867 million from consolidated, liquidating securitization entities in 2005, 2004 and 2003, respectively. Of these amounts, $634 million in 2005 related to Australian Financial Investments Group (AFIG), a December 2004 acquisition. |
Note 5
Supplemental Cost Information
Total expenditures for research and development were $3,425 million, $3,091 million and $2,656 million in 2005, 2004 and 2003, respectively. The portion we funded was $2,741 million in 2005, $2,443 million in 2004 and $2,103 million in 2003.
Rental expense under operating leases is shown below.
| (In millions) | 2005 | 2004 | 2003 | |||||||
| GE | $ | 939 | $ | 874 | $ | 733 | ||||
| GECS | 994 | 931 | 827 | |||||||
At December 31, 2005, minimum rental commitments under noncancelable operating leases aggregated $2,779 million and $4,039 million for GE and GECS, respectively. Amounts payable over the next five years follow.
| (In millions) | 2006 | 2007 | 2008 | 2009 | 2010 | |||||||||||
| GE | $ | 596 | $ | 499 | $ | 408 | $ | 330 | $ | 285 | ||||||
| GECS | 778 | 679 | 582 | 521 | 388 | |||||||||||
GE’s selling, general and administrative expenses totaled $13,279 million in 2005, $12,001 million in 2004 and $9,870 million in 2003.
GE 2005 ANNUAL REPORT 75
NOTES TO CONSOLIDATED FINANCIAL STATEMENTS
Note 6
Retiree Health and Life Benefits
We sponsor a number of retiree health and life insurance benefit plans (retiree benefit plans). Principal retiree benefit plans are discussed below; other such plans are not significant individually or in the aggregate.
PRINCIPAL RETIREE BENEFIT PLANS provide health and life insurance benefits to employees who retire under the GE Pension Plan with 10 or more years of service. Eligible retirees share in the cost of healthcare benefits. Effective January 1, 2005, we amended our principal retiree benefit plans to provide that, upon retirement of salaried employees who commenced service after that date, such retirees will pay in full for their participation in the GE retiree health benefit plans. These plans cover approximately 240,000 retirees and dependents.
The effect on operations of principal retiree benefit plans follows.
COST OF PRINCIPAL RETIREE BENEFIT PLANS
| (In millions) | 2005 | 2004 | 2003 | |||||||
| Expected return on plan assets | $ | (138 | ) | $ | (149 | ) | $ | (159 | ) | |
| Service cost for benefits earned | 243 | 210 | 307 | |||||||
| Interest cost on benefit obligation | 507 | 518 | 535 | |||||||
| Prior service cost | 326 | 298 | 191 | |||||||
| Net actuarial loss recognized | 70 | 60 | 127 | |||||||
| Retiree benefit plans cost | $ | 1,008 | $ | 937 | $ | 1,001 | ||||
ACTUARIAL ASSUMPTIONS. The discount rates at December 31 were used to measure the year-end benefit obligations and the earnings effects for the subsequent year. Actuarial assumptions used to determine benefit obligations and earnings effects for principal retiree benefit plans follow.
ACTUARIAL ASSUMPTIONS
| December 31 | 2005 | 2004 | 2003 | 2002 | |||||||||
Discount rate(a) | 5.25 | % | 5.75 | % | 6.00 | % | 6.75 | % | |||||
| Compensation increases | 5.00 | 5.00 | 5.00 | 5.00 | |||||||||
| Expected return on assets | 8.50 | 8.50 | 8.50 | 8.50 | |||||||||
Initial healthcare trend rate(b) | 10.00 | 10.30 | 10.50 | 13.00 | |||||||||
| (a) | Weighted average discount rates of 5.90% and 6.40% were used for determination of costs in 2004 and 2003, respectively. |
| (b) | For 2005, gradually declining to 5% for 2015 and thereafter. |
To determine the expected long-term rate of return on retiree life plan assets, we consider the current and expected asset allocations, as well as historical and expected returns on various categories of plan assets. We apply our expected rate of return to a market-related value of assets, which stabilizes variability in assets to which we apply that expected return.
We amortize experience gains and losses, as well as the effects of changes in actuarial assumptions and plan provisions, over a period no longer than the average future service of employees.
FUNDING POLICY. We fund retiree health benefits on a pay-as-you-go basis. We expect to contribute approximately $700 million in 2006 to fund such benefits. We fund retiree life insurance benefits at our discretion.
Changes in the accumulated postretirement benefit obligation for retiree benefit plans follow.
ACCUMULATED POSTRETIREMENT BENEFIT OBLIGATION (APBO)
| (In millions) | 2005 | 2004 | |||||
| Balance at January 1 | $ | 9,250 | $ | 9,701 | |||
| Service cost for benefits earned | 243 | 210 | |||||
| Interest cost on benefit obligation | 507 | 518 | |||||
| Participant contributions | 41 | 37 | |||||
| Actuarial gain | (55 | ) | (509 | ) | |||
| Benefits paid | (856 | ) | (797 | ) | |||
| Other | (46 | ) | 90 | ||||
Balance at December 31(a) | $ | 9,084 | $ | 9,250 | |||
| (a) | The APBO for the retiree health plans was $6,713 million and $6,979 million at year-end 2005 and 2004, respectively. |
Increasing or decreasing the healthcare cost trend rates by one percentage point would have had an insignificant effect on the December 31, 2005, accumulated postretirement benefit obligation and the annual cost of retiree health plans. Our principal retiree benefit plans are collectively bargained and have provisions that limit our per capita costs.
Changes in the fair value of assets for retiree benefit plans follow.
FAIR VALUE OF ASSETS
| (In millions) | 2005 | 2004 | |||||
| Balance at January 1 | $ | 1,652 | $ | 1,626 | |||
| Actual gain on plan assets | 107 | 160 | |||||
| Employer contributions | 675 | 626 | |||||
| Participant contributions | 41 | 37 | |||||
| Benefits paid | (856 | ) | (797 | ) | |||
| Balance at December 31 | $ | 1,619 | $ | 1,652 | |||
Plan assets are held in trust, as follows:
PLAN ASSET ALLOCATION
2005 | 2004 | |||||||||
| December 31 | Target allocation | Actual allocation | Actual allocation | |||||||
| U.S. equity securities | 35-55 | % | 51 | % | 53 | % | ||||
| Non-U.S. equity securities | 15-25 | 19 | 18 | |||||||
| Debt securities | 15-30 | 20 | 19 | |||||||
| Real estate | 1-10 | 2 | 1 | |||||||
| Other | 1-18 | 8 | 9 | |||||||
| Total | 100 | % | 100 | % | ||||||
GE 2005 ANNUAL REPORT 76
NOTES TO CONSOLIDATED FINANCIAL STATEMENTS
Plan fiduciaries set investment policies and strategies for the trust. Long-term strategic investment objectives include preserving the funded status of the trust and balancing risk and return. The plan fiduciaries oversee the investment allocation process, which includes selecting investment managers, setting long-term strategic targets and monitoring asset allocations. Target allocation ranges are guidelines, not limitations, and occasionally plan fiduciaries will approve allocations above or below a target range.
Trust assets invested in short-term securities must be invested in securities rated A1/P1 or better, other than 15% of short-term holdings which may be rated A2/P2. GE common stock represented 6.1% and 6.2% of trust assets at year-end 2005 and 2004, respectively, and is subject to a statutory limit when it reaches 10% of total trust assets.
Our recorded assets and liabilities for retiree benefit plans are as follows:
RETIREE BENEFIT ASSET (LIABILITY)
| December 31 (In millions) | 2005 | 2004 | |||||
Funded status(a) | $ | (7,465 | ) | $ | (7,598 | ) | |
| Unrecognized prior service cost | 2,409 | 2,747 | |||||
| Unrecognized net actuarial loss | 902 | 1,004 | |||||
| Net liability recognized | $ | (4,154 | ) | $ | (3,847 | ) | |
| Amounts recorded in the Statement | |||||||
| of Financial Position: | |||||||
| Retiree life plans prepaid asset (liability) | $ | (19 | ) | $ | 38 | ||
| Retiree health plans liability | (4,135 | ) | (3,885 | ) | |||
| Net liability recognized | $ | (4,154 | ) | $ | (3,847 | ) | |
| (a) | Fair value of assets less APBO, as shown in the preceding tables. |
Estimated future benefit payments are as follows:
ESTIMATED FUTURE BENEFIT PAYMENTS
| (In millions) | 2006 | 2007 | 2008 | 2009 | 2010 | 2011- 2015 | |||||||||||||
| $ | 825 | $ | 875 | $ | 825 | $ | 800 | $ | 750 | $ | 3,300 | ||||||||
Note 7
Pension Benefits
We sponsor a number of pension plans. Principal pension plans, together with affiliate and certain other pension plans (other pension plans), detailed in this note represent about 99% of our total pension assets.
PRINCIPAL PENSION PLANS are the GE Pension Plan and the GE Supplementary Pension Plan.
The GE Pension Plan provides benefits to certain U.S. employees based on the greater of a formula recognizing career earnings or a formula recognizing length of service and final average earnings. Certain benefit provisions are subject to collective bargaining.
The GE Supplementary Pension Plan is an unfunded plan providing supplementary retirement benefits primarily to higher-level, longer-service U.S. employees.
OTHER PENSION PLANS in 2005 included 33 U.S. and non-U.S. pension plans with pension assets or obligations greater than $50 million. These defined benefit plans provide benefits to employees based on formulas recognizing length of service and earnings.
To determine the expected long-term rate of return on pension plan assets, we consider the current and expected asset allocations, as well as historical and expected returns on various categories of plan assets. For the principal pension plans, we apply our expected rate of return to a market-related value of assets, which stabilizes variability in assets to which we apply that expected return.
We amortize experience gains and losses and effects of changes in actuarial assumptions and plan provisions over a period no longer than the average future service of employees.
PENSION PLAN PARTICIPANTS
| December 31, 2005 (In thousands) | Total | Principal pension plans | Other pension plans | |||||||
| Active employees | 188 | 143 | 45 | |||||||
| Vested former employees | 210 | 173 | 37 | |||||||
| Retirees and beneficiaries | 230 | 207 | 23 | |||||||
| Total | 628 | 523 | 105 | |||||||
GE 2005 ANNUAL REPORT 77
NOTES TO CONSOLIDATED FINANCIAL STATEMENTS
COST OF PENSION PLANS
Total | Principal pension plans | Other pension plans | ||||||||||||||||||||||||||
| (In millions) | 2005 | 2004 | 2003 | 2005 | 2004 | 2003 | 2005 | 2004 | 2003 | |||||||||||||||||||
| Expected return on | ||||||||||||||||||||||||||||
| plan assets | $ | (4,242 | ) | $ | (4,256 | ) | $ | (4,243 | ) | $ | (3,885 | ) | $ | (3,958 | ) | $ | (4,072 | ) | $ | (357 | ) | $ | (298 | ) | $ | (171 | ) | |
| Service cost for | ||||||||||||||||||||||||||||
| benefits earned | 1,618 | 1,436 | 1,374 | 1,359 | 1,178 | 1,213 | 259 | 258 | 161 | |||||||||||||||||||
| Interest cost on | ||||||||||||||||||||||||||||
| benefit obligation | 2,609 | 2,511 | 2,385 | 2,248 | 2,199 | 2,180 | 361 | 312 | 205 | |||||||||||||||||||
| Prior service cost | 262 | 316 | 252 | 256 | 311 | 248 | 6 | 5 | 4 | |||||||||||||||||||
| Net actuarial loss | ||||||||||||||||||||||||||||
| (gain) recognized | 480 | 242 | (548 | ) | 351 | 146 | (609 | ) | 129 | 96 | 61 | |||||||||||||||||
| Total cost (income) | $ | 727 | $ | 249 | $ | (780 | ) | $ | 329 | $ | (124 | ) | $ | (1,040 | ) | $ | 398 | $ | 373 | $ | 260 | |||||||
ACTUARIAL ASSUMPTIONS are described below. The discount rates at December 31 were used to measure the year-end benefit obligations and the earnings effects for the subsequent year.
ACTUARIAL ASSUMPTIONS
Principal pension plans | Other pension plans (weighted average) | ||||||||||||||||||||||||
| December 31 | 2005 | 2004 | 2003 | 2002 | 2005 | 2004 | 2003 | 2002 | |||||||||||||||||
| Discount rate | 5.50 | % | 5.75 | % | 6.00 | % | 6.75 | % | 4.74 | % | 5.28 | % | 5.53 | % | 5.88 | % | |||||||||
| Compensation increases | 5.00 | 5.00 | 5.00 | 5.00 | 4.20 | 4.03 | 3.87 | 3.92 | |||||||||||||||||
| Expected return on assets | 8.50 | 8.50 | 8.50 | 8.50 | 7.47 | 7.67 | 7.56 | 7.66 | |||||||||||||||||
FUNDING POLICY for the GE Pension Plan is to contribute amounts sufficient to meet minimum funding requirements as set forth in employee benefit and tax laws plus such additional amounts as we may determine to be appropriate. We have not made contributions to the GE Pension Plan since 1987. We will not make any contributions to the GE Pension Plan in 2006; any GE contribution to that plan would require payment of excise taxes and would not be deductible for income tax purposes. In 2006, we expect to pay approximately $120 million for the GE Supplementary Pension Plan benefit payments and administrative expenses for our principal pension plans ($106 million in 2005), and expect to contribute approximately $385 million to other pension plans ($366 million in 2005).
BENEFIT OBLIGATIONS are described in the following table. Accumulated and projected benefit obligations (ABO and PBO) represent the obligations of a pension plan for past service as of the measurement date. ABO is the present value of benefits earned to date with benefits computed based on current compensation levels. PBO is ABO increased to reflect expected future compensation.
PROJECTED BENEFIT OBLIGATION
Principal pension plans | Other pension plans | ||||||||||||
| (In millions) | 2005 | 2004 | 2005 | 2004 | |||||||||
| Balance at January 1 | $ | 39,969 | $ | 37,827 | $ | 7,122 | $ | 4,761 | |||||
| Service cost for benefits earned | 1,359 | 1,178 | 259 | 258 | |||||||||
| Interest cost on benefit obligations | 2,248 | 2,199 | 361 | 312 | |||||||||
| Participant contributions | 174 | 163 | 36 | 31 | |||||||||
| Plan amendments | - | - | 3 | 15 | |||||||||
Actuarial loss(a) | 1,988 | 969 | 909 | 363 | |||||||||
| Benefits paid | (2,407 | ) | (2,367 | ) | (256 | ) | (226 | ) | |||||
| Acquired plans | - | - | 54 | 1,170 | |||||||||
| Exchange rate adjustments and other | - | - | (391 | ) | 438 | ||||||||
Balance at December 31(b) | $ | 43,331 | $ | 39,969 | $ | 8,097 | $ | 7,122 | |||||
| (a) | Principally associated with discount rate changes. |
| (b) | The PBO for the GE Supplementary Pension Plan was $3,534 million and $3,266 million at year-end 2005 and 2004, respectively. |
GE 2005 ANNUAL REPORT 78
NOTES TO CONSOLIDATED FINANCIAL STATEMENTS
ABO balances for our pension plans follow.
ACCUMULATED BENEFIT OBLIGATION
| December 31 (In millions) | 2005 | 2004 | |||||
| GE Pension Plan | $ | 38,044 | $ | 35,296 | |||
| GE Supplementary Pension Plan | 2,178 | 1,916 | |||||
| Other pension plans | 7,194 | 6,320 | |||||
Following is information about our pension plans in which the accumulated benefit obligation exceeds the fair value of plan assets.
PLANS WITH ASSETS LESS THAN ABO
| December 31 (In millions) | 2005 | 2004 | |||||
| Funded plans with assets less than ABO: | |||||||
| Plan assets | $ | 4,737 | $ | 3,943 | |||
| Accumulated benefit obligations | 6,096 | 5,075 | |||||
| Projected benefit obligations | 6,967 | 5,825 | |||||
Unfunded plans covered by book reserves:(a) | |||||||
| Accrued pension liability | 3,323 | 2,880 | |||||
| Accumulated benefit obligations | 2,859 | 2,564 | |||||
| Projected benefit obligations | 4,235 | 3,931 | |||||
| (a) | Primarily related to the GE Supplementary Pension Plan. |
Pension plan assets are described below.
FAIR VALUE OF ASSETS
Principal pension plans | Other pension plans | ||||||||||||
| (In millions) | 2005 | 2004 | 2005 | 2004 | |||||||||
| Balance at January 1 | $ | 46,665 | $ | 43,879 | $ | 4,602 | $ | 2,989 | |||||
| Actual gain on plan assets | 4,558 | 4,888 | 670 | 294 | |||||||||
| Employer contributions | 106 | 102 | 365 | 364 | |||||||||
| Participant contributions | 174 | 163 | 36 | 31 | |||||||||
| Benefits paid | (2,407 | ) | (2,367 | ) | (256 | ) | (226 | ) | |||||
| Acquired plans | - | - | 29 | 868 | |||||||||
| Exchange rate adjustments and other | - | - | (233 | ) | 282 | ||||||||
| Balance at December 31 | $ | 49,096 | $ | 46,665 | $ | 5,213 | $ | 4,602 | |||||
Our pension plan assets are held in trust, as follows:
PLAN ASSET ALLOCATION
Principal pension plans | ||||||||||
2005 | 2004 | |||||||||
| December 31 | Target allocation | Actual allocation | Actual allocation | |||||||
| U.S. equity securities | 30-45 | % | 42 | % | 44 | % | ||||
| Non-U.S. equity securities | 15-25 | 21 | 19 | |||||||
| Debt securities | 15-30 | 18 | 19 | |||||||
| Real estate | 4-10 | 6 | 6 | |||||||
| Private equities | 5-11 | 7 | 6 | |||||||
| Other | 1-12 | 6 | 6 | |||||||
| Total | 100 | % | 100 | % | ||||||
Plan fiduciaries of the GE Pension Plan set investment policies and strategies for the GE Pension Trust. Long-term strategic investment objectives include preserving the funded status of the trust and balancing risk and return. These plan fiduciaries oversee the investment allocation process, which includes selecting investment managers, commissioning periodic asset-liability studies, setting long-term strategic targets and monitoring asset allocations. Target allocation ranges are guidelines, not limitations, and occasionally plan fiduciaries will approve allocations above or below a target range.
GE Pension Trust assets are invested subject to the following additional guidelines:
• | Short-term securities must be rated A1/P1 or better, other than 15% of short-term holdings which may be rated A2/P2, |
• | Real estate may not exceed 25% of total assets (6% of trust assets at December 31, 2005), |
• | Investments in securities not freely tradable may not exceed 20% of total assets (12% of trust assets at December 31, 2005), and |
• | GE stock is limited by statute when it reaches 10% of total trust assets (6.4% and 7.0% at the end of 2005 and 2004, respectively). |
Other pension plans (weighted average) | ||||||||||
2005 | 2004 | |||||||||
| December 31 | Target allocation | Actual allocation | Actual allocation | |||||||
| Equity securities | 63 | % | 65 | % | 65 | % | ||||
| Debt securities | 30 | 28 | 27 | |||||||
| Real estate | 3 | 3 | 3 | |||||||
| Other | 4 | 4 | 5 | |||||||
| Total | 100 | % | 100 | % | ||||||
GE 2005 ANNUAL REPORT 79
NOTES TO CONSOLIDATED FINANCIAL STATEMENTS
Our recorded assets and liabilities for pension plans are as follows:
PREPAID PENSION ASSET (LIABILITY)
Principal pension plans | Other pension plans | ||||||||||||
| December 31 (In millions) | 2005 | 2004 | 2005 | 2004 | |||||||||
Funded status(a) | $ | 5,765 | $ | 6,696 | $ | (2,884 | ) | $ | (2,520 | ) | |||
| Unrecognized prior | |||||||||||||
| service cost | 1,004 | 1,260 | 37 | 40 | |||||||||
| Unrecognized net | |||||||||||||
| actuarial loss | 8,445 | 7,481 | 2,046 | 1,658 | |||||||||
| Net amount recognized | $ | 15,214 | $ | 15,437 | $ | (801 | ) | $ | (822 | ) | |||
| Amounts recorded in the | |||||||||||||
| Statement of Financial | |||||||||||||
| Position: | |||||||||||||
| Prepaid pension asset | $ | 17,853 | $ | 17,629 | $ | 114 | $ | 153 | |||||
| Accrued pension | |||||||||||||
obligation(b) | (2,639 | ) | (2,192 | ) | (2,197 | ) | (1,993 | ) | |||||
| Intangible assets | - | - | 54 | 57 | |||||||||
| Accumulated other | |||||||||||||
| comprehensive | |||||||||||||
| income | - | - | 1,228 | 961 | |||||||||
| Net amount recognized | $ | 15,214 | $ | 15,437 | $ | (801 | ) | $ | (822 | ) | |||
| (a) | Fair value of assets less PBO, as shown in the preceding tables. |
| (b) | For principal pension plans, represents the GE Supplementary Pension Plan liability. |
Estimated future benefit payments for our pension plans are as follows:
ESTIMATED FUTURE BENEFIT PAYMENTS
| (In millions) | 2006 | 2007 | 2008 | 2009 | 2010 | 2011- 2015 | |||||||||||||
| Principal pension plans | $ | 2,400 | $ | 2,450 | $ | 2,500 | $ | 2,500 | $ | 2,550 | $ | 14,000 | |||||||
| Other pension plans | 250 | 275 | 275 | 300 | 300 | 1,650 | |||||||||||||
Note 8
Provision for Income Taxes
| (In millions) | 2005 | 2004 | 2003 | |||||||
GE | ||||||||||
| Current tax expense | $ | 3,037 | $ | 2,148 | $ | 2,468 | ||||
| Deferred tax expense (benefit) | ||||||||||
| from temporary differences | (287 | ) | (175 | ) | 389 | |||||
2,750 | 1,973 | 2,857 | ||||||||
GECS | ||||||||||
| Current tax expense | 1,938 | 1,510 | 171 | |||||||
| Deferred tax expense (benefit) | ||||||||||
| from temporary differences | (834 | ) | 3 | 817 | ||||||
1,104 | 1,513 | 988 | ||||||||
CONSOLIDATED | ||||||||||
| Current tax expense | 4,975 | 3,658 | 2,639 | |||||||
| Deferred tax expense (benefit) | ||||||||||
| from temporary differences | (1,121 | ) | (172 | ) | 1,206 | |||||
| Total | $ | 3,854 | $ | 3,486 | $ | 3,845 | ||||
GE and GECS file a consolidated U.S. federal income tax return. The GECS provision for current tax expense includes its effect on the consolidated return.
Consolidated current tax expense includes amounts applicable to U.S. federal income taxes of $2,527 million, $587 million and $1,314 million in 2005, 2004 and 2003, respectively, and amounts applicable to non-U.S. jurisdictions of $2,241 million, $2,577 million and $1,276 million in 2005, 2004 and 2003, respectively. Consolidated deferred taxes related to U.S. federal income taxes were benefits of $380 million and $211 million in 2005 and 2004, respectively, compared with an expense of $653 million in 2003.
Deferred income tax balances reflect the effects of temporary differences between the carrying amounts of assets and liabilities and their tax bases, as well as from net operating loss and tax credit carryforwards, and are stated at enacted tax rates expected to be in effect when taxes are actually paid or recovered. Deferred income tax assets represent amounts available to reduce income taxes payable on taxable income in future years. We evaluate the recoverability of these future tax deductions by assessing the adequacy of future expected taxable income from all sources, including reversal of temporary differences and forecasted operating earnings. See note 21 for details.
We have not provided U.S. deferred taxes on cumulative earnings of non-U.S. affiliates and associated companies that have been reinvested indefinitely. These earnings relate to ongoing operations and, at December 31, 2005, were approximately $36 billion. Because of the availability of U.S. foreign tax credits, it is not practicable to determine the U.S. federal income tax liability that would be payable if such earnings were not reinvested indefinitely. Deferred taxes are provided for earnings of non-U.S. affiliates and associated companies when we plan to remit those earnings.
GE 2005 ANNUAL REPORT 80
NOTES TO CONSOLIDATED FINANCIAL STATEMENTS
The American Jobs Creation Act of 2004 (the Act) allowed U.S. companies a one-time opportunity to repatriate non-U.S. earnings through 2005 at a 5.25% rate of tax rather than the normal U.S. tax rate of 35%, provided that certain criteria, including qualified U.S. reinvestment of those earnings, were met. Available U.S. foreign tax credits related to the repatriation are reduced under provisions of the Act. During the fourth quarter of 2005, we reached a final decision concerning repatriation. Because the vast majority of our non-U.S. earnings have been permanently reinvested in active business operations, we repatriated only $1.2 billion of non-U.S. earnings. Because a U.S. tax provision at normal tax rates had been provided on the majority of this amount, the result was a reduction of the GE and consolidated tax rates of approximately 0.5 percentage points.
Consolidated U.S. earnings from continuing operations before income taxes and accounting changes were $9,921 million in 2005, $9,093 million in 2004 and $9,545 million in 2003. The corresponding amounts for non-U.S.-based operations were $12,208 million in 2005, $10,678 million in 2004 and $8,066 million in 2003.
A reconciliation of the U.S. federal statutory income tax rate to the actual income tax rate is provided below.
RECONCILIATION OF U.S. FEDERAL STATUTORY INCOME TAX RATE TO ACTUAL INCOME TAX RATE
Consolidated | GE | GECS | ||||||||||||||||||||||||||
2005 | 2004 | 2003 | 2005 | 2004 | 2003 | 2005 | 2004 | 2003 | ||||||||||||||||||||
| U.S. federal statutory income tax rate | 35.0 | % | 35.0 | % | 35.0 | % | 35.0 | % | 35.0 | % | 35.0 | % | 35.0 | % | 35.0 | % | 35.0 | % | ||||||||||
| Increase (reduction) in rate | ||||||||||||||||||||||||||||
| resulting from: | ||||||||||||||||||||||||||||
| Inclusion of after-tax earnings | ||||||||||||||||||||||||||||
| of GECS in before-tax | ||||||||||||||||||||||||||||
| earnings of GE | - | - | - | (15.2 | ) | (15.1 | ) | (12.5 | ) | - | - | - | ||||||||||||||||
| Tax-exempt income | (0.2 | ) | (0.3 | ) | (0.5 | ) | - | - | - | (0.5 | ) | (0.6 | ) | (1.2 | ) | |||||||||||||
| Tax on global activities | ||||||||||||||||||||||||||||
| including exports | (15.9 | ) | (12.7 | ) | (9.8 | ) | (5.9 | ) | (5.9 | ) | (4.8 | ) | (22.2 | ) | (15.3 | ) | (13.5 | ) | ||||||||||
| IRS settlements of Lockheed | ||||||||||||||||||||||||||||
| Martin tax-free exchange/ | ||||||||||||||||||||||||||||
| Puerto Rico subsidiary loss | - | (3.5 | ) | - | - | (3.8 | ) | - | - | - | - | |||||||||||||||||
All other-net | (1.5 | ) | (0.9 | ) | (2.9 | ) | (0.8 | ) | 0.6 | (0.5 | ) | (1.5 | ) | (2.9 | ) | (6.0 | ) | |||||||||||
(17.6 | ) | (17.4 | ) | (13.2 | ) | (21.9 | ) | (24.2 | ) | (17.8 | ) | (24.2 | ) | (18.8 | ) | (20.7 | ) | |||||||||||
| Actual income tax rate | 17.4 | % | 17.6 | % | 21.8 | % | 13.1 | % | 10.8 | % | 17.2 | % | 10.8 | % | 16.2 | % | 14.3 | % | ||||||||||
Note 9
Earnings Per Share Information
2005 | 2004 | 2003 | |||||||||||||||||
| (In millions; per-share amounts in dollars) | Diluted | Basic | Diluted | Basic | Diluted | Basic | |||||||||||||
CONSOLIDATED | |||||||||||||||||||
| Earnings from continuing operations before | |||||||||||||||||||
accounting changes for per-share calculation(a) | $ | 18,276 | $ | 18,275 | $ | 16,286 | $ | 16,285 | $ | 13,767 | $ | 13,766 | |||||||
| Earnings (loss) from discontinued | |||||||||||||||||||
operations for per-share calculation(b) | (1,933 | ) | (1,922 | ) | 532 | 534 | 2,057 | 2,057 | |||||||||||
| Earnings before accounting changes | |||||||||||||||||||
| for per-share calculation | 16,343 | 16,353 | 16,818 | 16,819 | 15,824 | 15,823 | |||||||||||||
| Cumulative effect of accounting changes | - | - | - | - | (587 | ) | (587 | ) | |||||||||||
| Net earnings available for per-share calculation | $ | 16,343 | $ | 16,353 | $ | 16,818 | $ | 16,819 | $ | 15,237 | $ | 15,236 | |||||||
AVERAGE EQUIVALENT SHARES | |||||||||||||||||||
| Shares of GE common stock outstanding | 10,570 | 10,570 | 10,400 | 10,400 | 10,019 | 10,019 | |||||||||||||
| Employee compensation-related shares, | |||||||||||||||||||
| including stock options | 41 | - | 45 | - | 56 | - | |||||||||||||
| Total average equivalent shares | 10,611 | 10,570 | 10,445 | 10,400 | 10,075 | 10,019 | |||||||||||||
PER-SHARE AMOUNTS | |||||||||||||||||||
| Earnings from continuing operations | |||||||||||||||||||
| before accounting changes | $ | 1.72 | $ | 1.73 | $ | 1.56 | $ | 1.57 | $ | 1.37 | $ | 1.37 | |||||||
| Earnings (loss) from discontinued operations | (0.18 | ) | (0.18 | ) | 0.05 | 0.05 | 0.20 | 0.21 | |||||||||||
| Earnings before accounting changes | 1.54 | 1.55 | 1.61 | 1.62 | 1.57 | 1.58 | |||||||||||||
| Cumulative effect of accounting changes | - | - | - | - | (0.06 | ) | (0.06 | ) | |||||||||||
| Net earnings per share | $ | 1.54 | $ | 1.55 | $ | 1.61 | $ | 1.62 | $ | 1.51 | $ | 1.52 | |||||||
| (a) | Included dividend equivalents of approximately $1 million in each of the three years ended December 31, 2005. |
| (b) | Included dilutive effects of subsidiary-issued stock-based awards of approximately $11 million in 2005 and $2 million in 2004. |
GE 2005 ANNUAL REPORT 81
NOTES TO CONSOLIDATED FINANCIAL STATEMENTS
Note 10
Investment Securities
| Estimated fair value | |||||||
| December 31 (In millions) | 2005 | 2004 | |||||
| Available-for-sale securities | $ | 45,002 | $ | 48,577 | |||
| GECS trading securities | 8,142 | 8,346 | |||||
| Total | $ | 53,144 | $ | 56,923 | |||
AVAILABLE-FOR-SALE SECURITIES
2005 | 2004 | ||||||||||||||||||||||||
| December 31 (In millions) | Amortized cost | Gross unrealized gains | Gross unrealized losses | Estimated fair value | Amortized cost | Gross unrealized gains | Gross unrealized losses | Estimated fair value | |||||||||||||||||
GE | |||||||||||||||||||||||||
Debt-U.S. corporate | $ | 307 | $ | 2 | $ | - | $ | 309 | $ | 350 | $ | - | $ | - | $ | 350 | |||||||||
| Equity | 26 | 131 | (5 | ) | 152 | 58 | 8 | (3 | ) | 63 | |||||||||||||||
| GE available-for-sale securities | 333 | 133 | (5 | ) | 461 | 408 | 8 | (3 | ) | 413 | |||||||||||||||
GECS | |||||||||||||||||||||||||
| Debt: | |||||||||||||||||||||||||
| U.S. corporate | 20,578 | 1,317 | (339 | ) | 21,556 | 22,703 | 1,596 | (362 | ) | 23,937 | |||||||||||||||
| State and municipal | 810 | 47 | (2 | ) | 855 | 802 | 63 | - | 865 | ||||||||||||||||
Mortgage-backed(a) | 5,677 | 44 | (56 | ) | 5,665 | 5,983 | 78 | (25 | ) | 6,036 | |||||||||||||||
| Asset-backed | 8,434 | 205 | (19 | ) | 8,620 | 7,610 | 251 | (46 | ) | 7,815 | |||||||||||||||
Corporate-non-U.S. | 4,796 | 404 | (11 | ) | 5,189 | 5,309 | 405 | (7 | ) | 5,707 | |||||||||||||||
Government-non-U.S. | 694 | 92 | - | 786 | 1,423 | 100 | - | 1,523 | |||||||||||||||||
| U.S. government and | |||||||||||||||||||||||||
| federal agency | 803 | 61 | (5 | ) | 859 | 759 | 59 | (1 | ) | 817 | |||||||||||||||
| Equity | 838 | 229 | (33 | ) | 1,034 | 1,194 | 314 | (15 | ) | 1,493 | |||||||||||||||
| GECS available-for-sale | |||||||||||||||||||||||||
| securities | 42,630 | 2,399 | (465 | ) | 44,564 | (b) | 45,783 | 2,866 | (456 | ) | 48,193 | (b) | |||||||||||||
ELIMINATIONS | (17 | ) | (6 | ) | - | (23 | ) | (17 | ) | (12 | ) | - | (29 | ) | |||||||||||
| Total | $ | 42,946 | $ | 2,526 | $ | (470 | ) | $ | 45,002 | $ | 46,174 | $ | 2,862 | $ | (459 | ) | $ | 48,577 | |||||||
| (a) | Substantially collateralized by U.S. residential mortgages. |
| (b) | Included $16 million in 2005 and $684 million in 2004 of debt securities related to consolidated, liquidating securitization entities. See note 28. |
GE 2005 ANNUAL REPORT 82
NOTES TO CONSOLIDATED FINANCIAL STATEMENTS
The following tables present the gross unrealized losses and estimated fair values of our available-for-sale investment securities.
Less than 12 months | 12 months or more | ||||||||||||
| December 31 (In millions) | Estimated fair value | Gross unrealized losses | Estimated fair value | Gross unrealized losses | |||||||||
2005 | |||||||||||||
| Debt: | |||||||||||||
| U.S. corporate | $ | 3,640 | $ | (131 | ) | $ | 2,584 | $ | (208 | ) | |||
| State and municipal | 77 | (2 | ) | - | - | ||||||||
| Mortgage-backed | 1,859 | (22 | ) | 1,190 | (34 | ) | |||||||
| Asset-backed | 1,495 | (10 | ) | 383 | (9 | ) | |||||||
Corporate-non-U.S. | 286 | (9 | ) | 73 | (2 | ) | |||||||
| U.S. government and | |||||||||||||
| federal agency | 297 | (5 | ) | - | - | ||||||||
| Equity | 84 | (25 | ) | 38 | (13 | ) | |||||||
| Total | $ | 7,738 | $ | (204 | ) | $ | 4,268 | $ | (266 | ) | |||
2004 | |||||||||||||
| Debt: | |||||||||||||
| U.S. corporate | $ | 3,198 | $ | (88 | ) | $ | 1,346 | $ | (274 | ) | |||
| Mortgage-backed | 2,465 | (19 | ) | 197 | (6 | ) | |||||||
| Asset-backed | 1,586 | (15 | ) | 429 | (31 | ) | |||||||
Corporate-non-U.S. | 2,512 | (2 | ) | 168 | (5 | ) | |||||||
| U.S. government and | |||||||||||||
| federal agency | 116 | (1 | ) | - | - | ||||||||
| Equity | 148 | (14 | ) | 49 | (4 | ) | |||||||
| Total | $ | 10,025 | $ | (139 | ) | $ | 2,189 | $ | (320 | ) | |||
Securities in an unrealized loss position for 12 months or more at December 31, 2005 and 2004, included investment securities collateralized by commercial aircraft, primarily Enhanced Equipment Trust Certificates, with unrealized losses of $96 million and $259 million, respectively, and estimated fair values of $1,207 million and $810 million, respectively. We review all of our investment securities routinely for other than temporary impairment as described in note 1. In accordance with that policy, we have provided for all amounts that we did not expect either to collect in accordance with the contractual terms of the instruments or to recover based on underlying collateral values. For our securities collateralized by commercial aircraft, that review included our best estimates of the securities’ cash flows and underlying collateral values, and assessment of whether the borrower was in compliance with terms and conditions. We believe that these securities, which are current on all payment terms, were trading at a discount to market value since the respective stated interest rates on the securities were below what was perceived as a market rate based on the ongoing negative market reaction to difficulties in the commercial airline industry. We do not anticipate changes in the timing and amount of estimated cash flows and we expect full recovery of our amortized cost. Should our cash flow expectation prove to be incorrect, the current appraised market values of associated collateral exceeded both the market value and the amortized cost of our related securities at December 31, 2005.
We presently intend to hold our investment securities in an unrealized loss position at December 31, 2005, at least until we can recover their respective amortized cost. We have the ability to hold our debt securities until their maturities.
CONTRACTUAL MATURITIES OF GECS INVESTMENT IN AVAILABLE-FOR-SALE DEBT SECURITIES (EXCLUDING MORTGAGE-BACKED AND ASSET-BACKED SECURITIES)
| (In millions) | Amortized cost | Estimated fair value | |||||
| Due in | |||||||
| 2006 | $ | 2,447 | $ | 2,444 | |||
2007-2010 | 4,603 | 4,601 | |||||
2011-2015 | 4,786 | 4,874 | |||||
| 2016 and later | 15,845 | 17,326 |
We expect actual maturities to differ from contractual maturities because borrowers have the right to call or prepay certain obligations.
Supplemental information about gross realized gains and losses on available-for-sale investment securities follows.
| (In millions) | 2005 | 2004 | 2003 | |||||||
GE | ||||||||||
| Gains | $ | 6 | $ | 15 | $ | 3 | ||||
| Losses, including impairments | (5 | ) | - | (38 | ) | |||||
| Net | 1 | 15 | (35 | ) | ||||||
GECS | ||||||||||
| Gains | 514 | 413 | 522 | |||||||
| Losses, including impairments | (133 | ) | (209 | ) | (317 | ) | ||||
| Net | 381 | 204 | 205 | |||||||
| Total | $ | 382 | $ | 219 | $ | 170 | ||||
Proceeds from available-for-sale investment securities sales amounted to $14,100 million, $12,000 million and $12,400 million in 2005, 2004 and 2003, respectively.
GECS TRADING SECURITIES
Gains and losses on trading securities are for the benefit of certain non-U.S. insurance contractholders. In 2005 and 2004, we recognized net pre-tax gains on such securities of $862 million and $284 million, respectively, and recognized corresponding insurance losses of $860 million and $280 million, respectively, reflecting the contractholders participation in the actual returns generated by these investments.
GE 2005 ANNUAL REPORT 83
NOTES TO CONSOLIDATED FINANCIAL STATEMENTS
Note 11
GE Current Receivables
| December 31 (In millions) | 2005 | 2004 | |||||
| Infrastructure | $ | 6,827 | $ | 5,861 | |||
| Industrial | 2,255 | 2,230 | |||||
| Healthcare | 2,947 | 2,862 | |||||
| NBC Universal | 3,633 | 4,067 | |||||
| Corporate items and eliminations | 154 | 251 | |||||
15,816 | 15,271 | ||||||
| Less allowance for losses | (758 | ) | (738 | ) | |||
| Total | $ | 15,058 | $ | 14,533 | |||
Receivables balances at December 31, 2005 and 2004, before allowance for losses, included $10,250 million and $10,182 million, respectively, from sales of goods and services to customers, and $246 million at both December 31, 2005 and 2004, from transactions with associated companies.
Current receivables of $563 million and $435 million at December 31, 2005 and 2004, respectively, arose from sales, principally of aircraft engine goods and services on open account to various agencies of the U.S. government, our largest single customer. About 4% of our sales of goods and services were to the U.S. government in 2005, 2004 and 2003.
Note 12
Inventories
| December 31 (In millions) | 2005 | 2004 | |||||
GE | |||||||
| Raw materials and work in process | $ | 5,527 | $ | 5,042 | |||
| Finished goods | 5,152 | 4,806 | |||||
| Unbilled shipments | 333 | 402 | |||||
11,012 | 10,250 | ||||||
| Less revaluation to LIFO | (697 | ) | (661 | ) | |||
10,315 | 9,589 | ||||||
GECS | |||||||
| Finished goods | 159 | 189 | |||||
| Total | $ | 10,474 | $ | 9,778 | |||
As of December 31, 2005, we were obligated to acquire certain raw materials at market prices through the year 2027 under various take-or-pay or similar arrangements. Annual minimum commitments under these arrangements are insignificant.
Note 13
GECS Financing Receivables (investments in loans and financing leases)
| December 31 (In millions) | 2005 | 2004 | |||||
| Loans, net of deferred income | $ | 227,923 | $ | 220,593 | |||
| Investment in financing leases, net of deferred income | 64,309 | 67,754 | |||||
292,232 | 288,347 | ||||||
| Less allowance for losses (note 14) | (4,593 | ) | (5,648 | ) | |||
Financing receivables-net | $ | 287,639 | $ | 282,699 | |||
Included in the above are the financing receivables of consolidated, liquidating securitization entities as follows:
| December 31 (In millions) | 2005 | 2004 |
| Loans, net of deferred income | $15,868 | $20,728 |
| Investment in financing leases, net of deferred income | 769 | 2,125 |
16,637 | 22,853 | |
| Less allowance for losses | (22) | (5) |
Financing receivables-net | $16,615 | $22,848 |
Details of financing receivables-net follow.
| December 31 (In millions) | 2005 | 2004 | |||||
COMMERCIAL FINANCE | |||||||
| Equipment and leasing | $ | 70,851 | $ | 64,540 | |||
| Commercial and industrial | 41,402 | 39,481 | |||||
| Real estate | 19,555 | 20,470 | |||||
131,808 | 124,491 | ||||||
CONSUMER FINANCE | |||||||
| Non-U.S. residential mortgages | 46,205 | 42,201 | |||||
| Non-U.S. installment and revolving credit | 31,849 | 33,889 | |||||
| Non-U.S. auto | 22,803 | 23,517 | |||||
| U.S. installment and revolving credit | 21,963 | 21,385 | |||||
| Other | 7,286 | 6,771 | |||||
130,106 | 127,763 | ||||||
INFRASTRUCTURE(a) | 19,124 | 20,991 | |||||
OTHER(b) | 11,194 | 15,102 | |||||
292,232 | 288,347 | ||||||
| Less allowance for losses | (4,593 | ) | (5,648 | ) | |||
| Total | $ | 287,639 | $ | 282,699 | |||
| (a) | Included loans and financing leases of $11,192 million and $13,562 million at December 31, 2005 and 2004, respectively, related to commercial aircraft at Aviation Financial Services and loans and financing leases of $5,419 million and $4,659 million at December 31, 2005 and 2004, respectively, related to Energy Financial Services. |
| (b) | Included loans and financing leases of $10,160 million and $13,759 million at December 31, 2005 and 2004, respectively, related to certain consolidated, liquidating securitization entities. |
GE 2005 ANNUAL REPORT 84
NOTES TO CONSOLIDATED FINANCIAL STATEMENTS
GECS financing receivables include both loans and financing leases. Loans represent transactions in a variety of forms, including revolving charge and credit, mortgages, installment loans, intermediate-term loans and revolving loans secured by business assets. The portfolio includes loans carried at the principal amount on which finance charges are billed periodically, and loans carried at gross book value, which includes finance charges.
Investment in financing leases consists of direct financing and leveraged leases of aircraft, railroad rolling stock, autos, other transportation equipment, data processing equipment, medical equipment, commercial real estate and other manufacturing, power generation, and commercial equipment and facilities.
As the sole owner of assets under direct financing leases and as the equity participant in leveraged leases, GECS is taxed on total lease payments received and is entitled to tax deductions based on the cost of leased assets and tax deductions for interest paid to third-party participants. GECS is generally entitled to any residual value of leased assets.
Investment in direct financing and leveraged leases represents net unpaid rentals and estimated unguaranteed residual values of leased equipment, less related deferred income. GECS has no general obligation for principal and interest on notes and other instruments representing third-party participation related to leveraged leases; such notes and other instruments have not been included in liabilities but have been offset against the related rentals receivable. The GECS share of rentals receivable on leveraged leases is subordinate to the share of other participants who also have security interests in the leased equipment.
NET INVESTMENT IN FINANCING LEASES
Total financing leases | Direct financing leases(a) | Leveraged leases(b) | |||||||||||||||||
| December 31 (In millions) | 2005 | 2004 | 2005 | 2004 | 2005 | 2004 | |||||||||||||
| Total minimum lease payments receivable | $ | 86,436 | $ | 91,840 | $ | 60,594 | $ | 63,733 | $ | 25,842 | $ | 28,107 | |||||||
| Less principal and interest on third-party | |||||||||||||||||||
| nonrecourse debt | (19,061 | ) | (20,992 | ) | - | - | (19,061 | ) | (20,992 | ) | |||||||||
| Net rentals receivable | 67,375 | 70,848 | 60,594 | 63,733 | 6,781 | 7,115 | |||||||||||||
| Estimated unguaranteed residual value | |||||||||||||||||||
| of leased assets | 9,379 | 10,323 | 6,260 | 6,898 | 3,119 | 3,425 | |||||||||||||
| Less deferred income | (12,445 | ) | (13,417 | ) | (9,305 | ) | (9,966 | ) | (3,140 | ) | (3,451 | ) | |||||||
| Investment in financing leases, net of | |||||||||||||||||||
| deferred income | 64,309 | 67,754 | 57,549 | 60,665 | 6,760 | 7,089 | |||||||||||||
| Less amounts to arrive at net investment | |||||||||||||||||||
| Allowance for losses | (525 | ) | (1,090 | ) | (380 | ) | (903 | ) | (145 | ) | (187 | ) | |||||||
| Deferred taxes | (8,037 | ) | (9,767 | ) | (3,495 | ) | (5,099 | ) | (4,542 | ) | (4,668 | ) | |||||||
| Net investment in financing leases | $ | 55,747 | $ | 56,897 | $ | 53,674 | $ | 54,663 | $ | 2,073 | $ | 2,234 | |||||||
| (a) | Included $475 million and $489 million of initial direct costs on direct financing leases at December 31, 2005 and 2004, respectively. |
| (b) | Included pre-tax income of $248 million and $340 million and income tax of $96 million and $131 million during 2005 and 2004, respectively. Net investment credits recognized during 2005 and 2004 were inconsequential. |
CONTRACTUAL MATURITIES
| (In millions) | Total loans | Net rentals receivable | |||||
| Due in | |||||||
| 2006 | $ | 74,232 | $ | 17,812 | |||
| 2007 | 30,610 | 14,320 | |||||
| 2008 | 23,696 | 10,756 | |||||
| 2009 | 13,812 | 7,261 | |||||
| 2010 | 14,306 | 4,164 | |||||
| 2011 and later | 71,267 | 13,062 | |||||
| Total | $ | 227,923 | $ | 67,375 | |||
We expect actual maturities to differ from contractual maturities.
Individually “impaired” loans are defined by GAAP as larger balance or restructured loans for which it is probable that the lender will be unable to collect all amounts due according to original contractual terms of the loan agreement. An analysis of impaired loans follows.
| December 31 (In millions) | 2005 | 2004 | |||||
| Loans requiring allowance for losses | $ | 1,479 | $ | 1,689 | |||
| Loans expected to be fully recoverable | 451 | 520 | |||||
$ | 1,930 | $ | 2,209 | ||||
| Allowance for losses | $ | 627 | $ | 749 | |||
| Average investment during year | 2,118 | 2,403 | |||||
Interest income earned while impaired(a) | 46 | 26 | |||||
| (a) | Recognized principally on cash basis. |
GE 2005 ANNUAL REPORT 85
NOTES TO CONSOLIDATED FINANCIAL STATEMENTS
Note 14
GECS Allowance for Losses on Financing Receivables
| (In millions) | 2005 | 2004 | 2003 | |||||||
BALANCE AT JANUARY 1 | ||||||||||
| Commercial Finance | $ | 1,562 | $ | 1,952 | $ | 2,407 | ||||
| Consumer Finance | 3,473 | 3,984 | 2,782 | |||||||
| Infrastructure | 583 | 293 | 258 | |||||||
| Other | 30 | 27 | 53 | |||||||
5,648 | 6,256 | 5,500 | ||||||||
PROVISION CHARGED TO OPERATIONS | ||||||||||
| Commercial Finance | 293 | 327 | 874 | |||||||
| Consumer Finance | 3,337 | 3,219 | 2,808 | |||||||
| Infrastructure | 210 | 325 | 28 | |||||||
| Other | 1 | 17 | 42 | |||||||
3,841 | 3,888 | 3,752 | ||||||||
OTHER ADDITIONS (REDUCTIONS) | (487 | ) | (74 | ) | 679 | |||||
GROSS WRITE-OFFS | ||||||||||
| Commercial Finance | (892 | ) | (928 | ) | (1,312 | ) | ||||
Consumer Finance(a) | (4,447 | ) | (4,423 | ) | (3,114 | ) | ||||
| Infrastructure | (572 | ) | (27 | ) | (24 | ) | ||||
| Other | (48 | ) | (74 | ) | (73 | ) | ||||
(5,959 | ) | (5,452 | ) | (4,523 | ) | |||||
RECOVERIES | ||||||||||
| Commercial Finance | 180 | 161 | 124 | |||||||
| Consumer Finance | 1,359 | 846 | 710 | |||||||
| Infrastructure | - | 2 | 2 | |||||||
| Other | 11 | 21 | 12 | |||||||
1,550 | 1,030 | 848 | ||||||||
BALANCE AT DECEMBER 31 | ||||||||||
| Commercial Finance | 1,110 | 1,562 | 1,952 | |||||||
| Consumer Finance | 3,234 | 3,473 | 3,984 | |||||||
| Infrastructure | 220 | 583 | 293 | |||||||
| Other | 29 | 30 | 27 | |||||||
| Total | $ | 4,593 | $ | 5,648 | $ | 6,256 | ||||
| (a) | Included $889 million in 2004 related to the standardization of our write-off policy. |
See note 13 for amounts related to consolidated, liquidating securitization entities.
SELECTED FINANCING RECEIVABLES RATIOS
| December 31 | 2005 | 2004 | |||||
ALLOWANCE FOR LOSSES ON FINANCING | |||||||
RECEIVABLES AS A PERCENTAGE OF | |||||||
TOTAL FINANCING RECEIVABLES | |||||||
| Commercial Finance | 0.84 | % | 1.25 | % | |||
| Consumer Finance | 2.49 | 2.72 | |||||
| Infrastructure | 1.15 | 2.78 | |||||
| Other | 0.26 | 0.20 | |||||
| Total | 1.57 | 1.96 | |||||
NONEARNING AND REDUCED EARNING | |||||||
FINANCING RECEIVABLES AS A PERCENTAGE | |||||||
OF TOTAL FINANCING RECEIVABLES | |||||||
| Commercial Finance | 1.0 | % | 1.1 | % | |||
| Consumer Finance | 2.1 | 2.0 | |||||
| Infrastructure | 0.1 | 0.8 | |||||
| Other | 0.7 | 1.2 | |||||
| Total | 1.4 | 1.5 | |||||
GE 2005 ANNUAL REPORT 86
NOTES TO CONSOLIDATED FINANCIAL STATEMENTS
Note 15
Property, Plant and Equipment
| December 31 (Dollars in millions) | Estimated useful lives- new (years) | 2005 | 2004 | |||||||
ORIGINAL COST | ||||||||||
GE | ||||||||||
| Land and improvements | 8 | (a) | $ | 1,366 | $ | 1,562 | ||||
| Buildings, structures and related equipment | 8-40 | 10,044 | 9,617 | |||||||
| Machinery and equipment | 4-20 | 25,811 | 25,026 | |||||||
| Leasehold costs and manufacturing plant under construction | 1-10 | 2,157 | 2,942 | |||||||
39,378 | 39,147 | |||||||||
GECS(b) | ||||||||||
| Buildings and equipment | 2-40 | 5,547 | 5,684 | |||||||
| Equipment leased to others | ||||||||||
| Aircraft | 20 | 32,941 | 26,837 | |||||||
| Vehicles | 1-14 | 23,208 | 23,056 | |||||||
| Railroad rolling stock | 3-30 | 3,327 | 3,390 | |||||||
| Mobile and modular space | 12-18 | 2,889 | 2,965 | |||||||
| Construction and manufacturing | 5-25 | 1,609 | 1,772 | |||||||
| All other | 2-33 | 2,834 | 3,021 | |||||||
72,355 | 66,725 | |||||||||
| Total | $ | 111,733 | $ | 105,872 | ||||||
NET CARRYING VALUE | ||||||||||
GE | ||||||||||
| Land and improvements | $ | 1,269 | $ | 1,464 | ||||||
| Buildings, structures and related equipment | 4,823 | 4,405 | ||||||||
| Machinery and equipment | 8,525 | 8,206 | ||||||||
| Leasehold costs and manufacturing plant under construction | 1,887 | 2,681 | ||||||||
16,504 | 16,756 | |||||||||
GECS(b) | ||||||||||
| Buildings and equipment | 3,116 | 3,295 | ||||||||
| Equipment leased to others | ||||||||||
Aircraft(c) | 27,116 | 21,991 | ||||||||
| Vehicles | 14,064 | 14,062 | ||||||||
| Railroad rolling stock | 2,188 | 2,193 | ||||||||
| Mobile and modular space | 1,496 | 1,636 | ||||||||
| Construction and manufacturing | 1,088 | 1,157 | ||||||||
| All other | 1,956 | 2,013 | ||||||||
51,024 | 46,347 | |||||||||
| Total | $ | 67,528 | $ | 63,103 | ||||||
| (a) | Estimated useful lives exclude land. |
| (b) | Included $1,935 million and $2,243 million of original cost of assets leased to GE with accumulated amortization of $298 million and $377 million at December 31, 2005 and 2004, respectively. |
| (c) | The Aviation Financial Services business of Infrastructure recognized impairment losses of $295 million in 2005 and $148 million in 2004 recorded in the caption “Other costs and expenses” in the Statement of Earnings to reflect adjustments to fair value based on current market values from independent appraisers. |
Amortization of GECS equipment leased to others was $5,642 million, $5,365 million and $4,224 million in 2005, 2004 and 2003, respectively. Noncancelable future rentals due from customers for equipment on operating leases at December 31, 2005, are due as follows:
| (In millions) | ||||
| Due in | ||||
| 2006 | $ | 7,615 | ||
| 2007 | 6,099 | |||
| 2008 | 4,743 | |||
| 2009 | 3,375 | |||
| 2010 | 2,642 | |||
| 2011 and later | 7,840 | |||
| Total | $ | 32,314 | ||
Note 16
Intangible Assets
| December 31 (In millions) | 2005 | 2004 | |||||
GE | |||||||
| Goodwill | $ | 48,274 | $ | 45,775 | |||
| Intangible assets subject to amortization | 7,478 | 6,911 | |||||
Indefinite-lived intangible assets(a) | 2,087 | 2,034 | |||||
57,839 | 54,720 | ||||||
GECS | |||||||
| Goodwill | 21,337 | 21,590 | |||||
| Intangible assets subject to amortization | 2,550 | 2,146 | |||||
23,887 | 23,736 | ||||||
| Total | $ | 81,726 | $ | 78,456 | |||
| (a) | Indefinite-lived intangible assets principally comprised trademarks, tradenames and U.S. Federal Communications Commission licenses. |
GE 2005 ANNUAL REPORT 87
NOTES TO CONSOLIDATED FINANCIAL STATEMENTS
Changes in goodwill balances, net of accumulated amortization, follow.
2005 | 2004 | ||||||||||||||||||||||||
| (In millions) | Balance January 1 | Acquisitions/ purchase accounting adjustments | Currency exchange and other | Balance December 31 | Balance January 1 | Acquisitions/ purchase accounting adjustments | Currency exchange and other | Balance December 31 | |||||||||||||||||
| Infrastructure | $ | 9,759 | $ | 770 | $ | (363 | ) | $ | 10,166 | $ | 9,355 | $ | 212 | $ | 192 | $ | 9,759 | ||||||||
| Industrial | 7,674 | 1,236 | (208 | ) | 8,702 | 5,885 | 666 | 1,123 | (a) | 7,674 | |||||||||||||||
| Healthcare | 13,259 | 226 | (81 | ) | 13,404 | 4,766 | 8,422 | 71 | 13,259 | ||||||||||||||||
| NBC Universal | 16,672 | 946 | (84 | ) | 17,534 | 6,730 | 9,944 | (2 | ) | 16,672 | |||||||||||||||
| Commercial Finance | 10,141 | 766 | (286 | ) | 10,621 | 9,145 | 929 | 67 | 10,141 | ||||||||||||||||
| Consumer Finance | 9,860 | (24 | ) | (652 | ) | 9,184 | 8,163 | 1,275 | 422 | 9,860 | |||||||||||||||
| Total | $ | 67,365 | $ | 3,920 | $ | (1,674 | ) | $ | 69,611 | $ | 44,044 | $ | 21,448 | $ | 1,873 | $ | 67,365 | ||||||||
| (a) | Included $1,055 million of goodwill associated with the consolidation of Penske effective January 1, 2004. |
The amount of goodwill related to new acquisitions recorded during 2005 was $3,705 million, the largest of which were Edwards Systems Technology ($996 million) by Industrial, Ionics, Inc. ($681 million) by Infrastructure, Antares Capital Corp. ($407 million) by Commercial Finance, an additional interest in MSNBC ($402 million) and the previously outstanding minority interest in Vivendi Universal Entertainment LLLP (VUE) ($329 million) by NBC Universal.
The amount of goodwill related to purchase accounting adjustments to prior-year acquisitions during 2005 was $215 million, primarily associated with the 2004 acquisition of Amersham by Healthcare and the combination of NBC and VUE.
The amount of goodwill related to new acquisitions during 2004 was $20,948 million, the largest of which were the combination of NBC and VUE and the acquisition of Amersham by Healthcare, both discussed on the following page, and InVision Technologies, Inc. ($618 million) by Industrial.
The amount of goodwill related to purchase accounting adjustments to prior-year acquisitions during 2004 was $500 million, primarily associated with the 2003 acquisition of Instrumentarium at Healthcare and Allbank and First National Bank at Consumer Finance.
Upon closing an acquisition, we estimate the fair values of assets and liabilities acquired and consolidate the acquisition as quickly as possible. Given the time it takes to obtain pertinent information to finalize the acquired company’s balance sheet (frequently with implications for the price of the acquisition), then to adjust the acquired company’s accounting policies, procedures, books and records to our standards, it is often several quarters before we are able to finalize those initial fair value estimates. Accordingly, it is not uncommon for our initial estimates to be subsequently revised.
INTANGIBLE ASSETS SUBJECT TO AMORTIZATION
| December 31 (In millions) | Gross carrying amount | Accumulated amortization | Net | |||||||
GE | ||||||||||
2005 | ||||||||||
| Patents, licenses and trademarks | $ | 4,814 | $ | (1,134 | ) | $ | 3,680 | |||
| Capitalized software | 4,109 | (2,261 | ) | 1,848 | ||||||
| All other | 2,172 | (222 | ) | 1,950 | ||||||
| Total | $ | 11,095 | $ | (3,617 | ) | $ | 7,478 | |||
2004 | ||||||||||
| Patents, licenses and trademarks | $ | 4,736 | $ | (757 | ) | $ | 3,979 | |||
| Capitalized software | 3,763 | (1,869 | ) | 1,894 | ||||||
| All other | 1,171 | (133 | ) | 1,038 | ||||||
| Total | $ | 9,670 | $ | (2,759 | ) | $ | 6,911 | |||
GECS | ||||||||||
2005 | ||||||||||
| Patents, licenses and trademarks | $ | 497 | $ | (272 | ) | $ | 225 | |||
| Capitalized software | 1,478 | (799 | ) | 679 | ||||||
| All other | 2,661 | (1,015 | ) | 1,646 | ||||||
| Total | $ | 4,636 | $ | (2,086 | ) | $ | 2,550 | |||
2004 | ||||||||||
| Patents, licenses and trademarks | $ | 438 | $ | (226 | ) | $ | 212 | |||
| Capitalized software | 1,268 | (672 | ) | 596 | ||||||
| All other | 2,226 | (888 | ) | 1,338 | ||||||
| Total | $ | 3,932 | $ | (1,786 | ) | $ | 2,146 | |||
Consolidated amortization expense related to intangible assets subject to amortization was $1,413 million and $1,375 million for 2005 and 2004, respectively.
GE 2005 ANNUAL REPORT 88
NOTES TO CONSOLIDATED FINANCIAL STATEMENTS
SIGNIFICANT ACQUISITIONS AND COMBINATIONS
In April 2004, we acquired all of the outstanding common shares of Amersham, a world leader in medical diagnostics and life sciences. The total purchase price of $11,279 million included 341.7 million shares of GE common stock valued at $10,674 million, cash of $150 million and assumed debt of $455 million. Final allocation of the purchase price assigned $8,452 million to goodwill, $2,704 million to identified intangible assets that are being amortized over periods ranging from five to 25 years, $158 million to acquired inventories and $99 million to acquired in-process research and development projects charged to operations in the second quarter of 2004.
In May 2004, we completed the combination of NBC with VUE and certain related assets to create one of the world’s leading media companies, NBC Universal, Inc. (NBC Universal). Twenty percent of NBC Universal’s shares were issued to a subsidiary of Vivendi Universal (VU) as partial consideration for VU’s interest in VUE and the related assets. NBC’s acquired interest in VUE and the related assets were valued at $14,429 million, for which we exchanged the NBC Universal shares, paid cash to certain VUE interest holders of $3,650 million and assumed debt of $2,498 million. In March 2004, we had issued 119.4 million shares of our common stock for net cash proceeds of $3,765 million, and we used most of those proceeds to fund the $3,650 million we paid in this transaction. The final allocation of our acquired interest assigned $10,156 million to goodwill, $1,503 million to indefinite-lived intangibles and $307 million to identified intangible assets that are being amortized over periods ranging from two to 20 years. As a result of issuing the NBC Universal shares, we essentially disposed of 20% of NBC, and therefore recorded an increase in shareowners’ equity of $2,153 million, net of taxes of $1,439 million. IAC/InteractiveCorp (IAC), the holder of 5.44% of the VUE common interests, did not participate in the transaction and remained a minority interest holder of VUE at December 31, 2004. IAC also owned two series of VUE preferred interests at that date-$758 million of mandatorily redeemable Preferred A interests that we recorded as a liability and $1,582 million of cumulative redeemable Preferred B interests that we included in minority interest. As of the same date and in approximately the same amounts, VUE held U.S. Treasury securities as an economic hedge of the redemption of the Preferred A interests; and NBC Universal held IAC securities that could be used to redeem the Preferred B interests. We also agreed to provide VU any excess value in the IAC securities. The combined position provided an effective hedge of the disposition of those shares.
In June 2005, NBC Universal, VU and IAC jointly agreed to unwind various interrelated financial interests pertaining to the IAC investments described above. As part of that agreement, NBC Universal fully settled its obligations in connection with both the Preferred A and B interests in exchange for the U.S. Treasury securities, the IAC securities and $200 million cash. NBC Universal recognized a $318 million pre-tax gain on the final fair value adjustments to its various affected financial instruments as of the transaction date ($127 million, net of taxes and minority interest of $133 million and $58 million, respectively); and recorded an increase in shareowners’ equity of $108 million on the fair value exchange, net of taxes and minority interest of $82 million and $32 million, respectively. Also as part of that agreement, NBC Universal acquired IAC’s 5.44% common interest in VUE for cash of $800 million, including $160 million funded by VU, and other consideration of $115 million. The preliminary allocation of its acquired interest assigned $329 million to goodwill and $31 million to intangible assets. VU’s right to monetize its ownership interest over time at fair value was amended to begin in 2007.
GE 2005 ANNUAL REPORT 89
NOTES TO CONSOLIDATED FINANCIAL STATEMENTS
Note 17
All Other Assets
| December 31 (In millions) | 2005 | 2004 | |||||
GE | |||||||
| Investments | |||||||
| Associated companies | $ | 1,824 | $ | 1,830 | |||
Other(a)(b) | 1,089 | 3,974 | |||||
2,913 | 5,804 | ||||||
Prepaid pension asset-principal plans | 17,853 | 17,629 | |||||
| Contract costs and estimated earnings | 4,664 | 4,089 | |||||
| Film and television costs | 3,828 | 3,441 | |||||
| Long-term receivables, including notes | 2,790 | 2,821 | |||||
| Derivative instruments | 247 | 628 | |||||
| Other | 4,457 | 3,711 | |||||
36,752 | 38,123 | ||||||
GECS | |||||||
| Investments | |||||||
| Associated companies | 13,481 | 10,644 | |||||
Real estate(c) | 16,467 | 19,163 | |||||
Assets held for sale(d) | 8,574 | 6,501 | |||||
Cost method(e) | 2,280 | 2,392 | |||||
| Other | 3,072 | 3,876 | |||||
43,874 | 42,576 | ||||||
| Deferred acquisition costs | 1,541 | 1,619 | |||||
| Derivative instruments | 1,622 | 3,052 | |||||
| Advances to suppliers | 1,762 | 1,754 | |||||
| Other | 3,259 | 3,571 | |||||
52,058 | 52,572 | ||||||
ELIMINATIONS | (1,364 | ) | (1,138 | ) | |||
Total(f) | $ | 87,446 | $ | 89,557 | |||
| (a) | The fair value of and unrealized loss on cost method investments in a continuous loss position in 2005 were insignificant. The fair value of and unrealized loss on cost method investments in a continuous loss position for less than 12 months in 2004 were $373 million and $34 million, respectively. Also included available-for-sale securities of $1,200 million in 2004, of which the unrealized loss on those in a continuous loss position for less than 12 months in 2004 was $111 million. |
| (b) | 2004 amounts included investments associated with the VUE settlement in 2005. See note 16 for further information. |
| (c) | GECS investment in real estate consisted principally of two categories: real estate held for investment and equity method investments. Both categories contained a wide range of properties including the following at December 31, 2005: office buildings (52%), apartment buildings (20%), retail facilities (7%), industrial properties (6%), parking facilities (5%), franchise properties (3%) and other (7%). At December 31, 2005, investments were located in Europe (46%), North America (35%) and Asia (19%). |
| (d) | Assets were classified as held for sale on the date a decision was made to dispose of them through sale, securitization or other means. Such assets consisted primarily of real estate properties and mortgage and credit card receivables, and were accounted for at the lower of carrying amount or estimated fair value less costs to sell. |
| (e) | The fair value of and unrealized loss on those investments in a continuous loss position for less than 12 months in 2005 were $100 million and $31 million, respectively. The fair value of and unrealized loss on those investments in a continuous loss position for 12 months or more in 2005 were $22 million and $9 million, respectively. The fair value of and unrealized loss on those investments in a continuous loss position for less than 12 months in 2004 were $56 million and $25 million, respectively. The fair value of and unrealized loss on those investments in a continuous loss position for 12 months or more in 2004 were $55 million and $42 million, respectively. |
| (f) | Included $1,235 million in 2005 and $2,384 million in 2004 related to consolidated, liquidating securitization entities. See note 28. |
Note 18
Borrowings
SHORT-TERM BORROWINGS
2005 | 2004 | ||||||||||||
| December 31 (Dollars in millions) | Amount | Average rate(a) | Amount | Average rate(a) | |||||||||
GE | |||||||||||||
| Commercial paper | |||||||||||||
| U.S. | $ | 497 | 4.40 | % | $ | - | - | % | |||||
| Non-U.S. | 1 | 2.85 | 131 | 2.52 | |||||||||
| Payable to banks | 358 | 3.99 | 407 | 2.95 | |||||||||
| Current portion of long-term debt | 129 | 4.84 | 2,563 | 2.17 | |||||||||
| Other | 142 | 308 | |||||||||||
1,127 | 3,409 | ||||||||||||
GECS | |||||||||||||
| Commercial paper | |||||||||||||
| U.S. | |||||||||||||
| Unsecured | 67,643 | 4.30 | 62,195 | 2.24 | |||||||||
Asset-backed(b) | 9,267 | 4.21 | 13,842 | 2.17 | |||||||||
| Non-U.S. | 20,456 | 3.47 | 20,835 | 2.97 | |||||||||
Current portion of long-term debt(c)(d) | 41,792 | 4.05 | 37,530 | 4.11 | |||||||||
| Other | 18,514 | 19,890 | |||||||||||
157,672 | 154,292 | ||||||||||||
ELIMINATIONS | (643 | ) | (506 | ) | |||||||||
| Total | $ | 158,156 | $ | 157,195 | |||||||||
| (a) | Based on year-end balances and year-end local currency interest rates. Current portion of long-term debt included the effects of interest rate and currency swaps, if any, directly associated with the original debt issuance. |
| (b) | Entirely obligations of consolidated, liquidating securitization entities. See note 28. |
| (c) | Included short-term borrowings by consolidated, liquidating securitization entities of $697 million and $756 million at December 31, 2005 and 2004, respectively. See note 28. |
| (d) | Included $250 million of subordinated notes guaranteed by GE at December 31, 2005. |
GE 2005 ANNUAL REPORT 90
NOTES TO CONSOLIDATED FINANCIAL STATEMENTS
LONG-TERM BORROWINGS
| December 31 (Dollars in millions) | 2005 Average rate(a) | Maturities | 2005 | 2004 | |||||||||
GE | |||||||||||||
| Senior notes | 4.88 | % | 2008-2013 | $ | 6,486 | $ | 4,984 | ||||||
| Industrial development/ pollution control bonds | 3.83 | 2011-2027 | 299 | 307 | |||||||||
| Payable to banks, principally U.S. | 4.99 | 2007-2023 | 1,912 | 1,927 | |||||||||
Other(b) | 384 | 407 | |||||||||||
9,081 | 7,625 | ||||||||||||
GECS | |||||||||||||
| Senior notes | |||||||||||||
| Unsecured | 4.45 | 2007-2055 | 180,546 | 174,893 | |||||||||
Asset-backed(c) | 4.66 | 2007-2035 | 6,845 | 10,939 | |||||||||
Extendible notes(d) | 4.38 | 2007-2009 | 14,022 | 14,258 | |||||||||
Subordinated notes(e) | 6.00 | 2009-2037 | 2,984 | 1,119 | |||||||||
204,397 | 201,209 | ||||||||||||
ELIMINATIONS | (1,197 | ) | (963 | ) | |||||||||
| Total | $ | 212,281 | $ | 207,871 | |||||||||
| (a) | Based on year-end balances and year-end local currency interest rates, including the effects of interest rate and currency swaps, if any, directly associated with the original debt issuance. |
| (b) | A variety of obligations having various interest rates and maturities, including certain borrowings by parent operating components and affiliates. |
| (c) | Asset-backed senior notes were all issued by consolidated, liquidating securitization entities. See note 28. |
| (d) | Included obligations of consolidated, liquidating securitization entities in the amount of $38 million and $267 million at December 31, 2005 and 2004, respectively. See note 28. |
| (e) | Included $750 million and $1,000 million of subordinated notes guaranteed by GE at December 31, 2005 and 2004, respectively. |
Our borrowings are addressed below from the perspectives of liquidity, interest rate and currency risk management. Additional information about borrowings and associated swaps can be found in note 27.
LIQUIDITY is affected by debt maturities and our ability to repay or refinance such debt. Long-term debt maturities over the next five years follow.
| (In millions) | 2006 | 2007 | 2008 | 2009 | 2010 | |||||||||||
| GE | $ | 129 | $ | 1,733 | $ | 1,574 | $ | 48 | $ | 18 | ||||||
| GECS | 41,598 | (a) | 41,381 | (b) | 42,385 | 26,928 | 18,549 | |||||||||
| (a) | Floating rate extendible notes of $297 million are due in 2006, but are extendible at the option of the investors to a final maturity in 2008. Fixed and floating rate notes of $1,059 million contain put options with exercise dates in 2006, but have final maturity dates in 2007 ($250 million), 2008 ($350 million) and beyond 2010 ($459 million). |
| (b) | Floating rate extendible notes of $14,022 million are due in 2007, of which $2,000 million are extendible at the option of the investors to a final maturity in 2009. |
Committed credit lines totaling $57.2 billion had been extended to us by 75 banks at year-end 2005. Included in this amount was $47.7 billion provided directly to GECS and $9.5 billion provided by 19 banks to GE, to which GECS also has access. The GECS lines include $27.4 billion of revolving credit agreements under which we can borrow funds for periods exceeding one year. The remaining $29.8 billion are 364-day lines of which $29.7 billion contain a term-out feature that allows GE or GECS to extend the borrowings for one year from the date of expiration of the lending agreement. We pay banks for credit facilities, but compensation amounts were insignificant in each of the past three years.
INTEREST RATE AND CURRENCY RISK is managed through the direct issuance of debt or use of derivatives. We take positions in view of anticipated behavior of assets, including prepayment behavior. We use a variety of instruments, including interest rate and currency swaps and currency forwards, to achieve our interest rate objectives. The following table shows GECS borrowing positions considering the effects of swaps of currencies and interest rates.
GECS EFFECTIVE BORROWINGS (INCLUDING SWAPS)
2005 | 2004 | |||||||||
| December 31 (Dollars in millions) | Amount | Average rate | Amount | |||||||
Short-term(a) | $ | 97,202 | 3.95 | % | $ | 90,754 | ||||
| Long-term (including current portion) | ||||||||||
Fixed rate(b) | $ | 161,771 | 4.65 | % | $ | 142,510 | ||||
| Floating rate | 103,096 | 4.32 | 122,237 | |||||||
| Total long-term | $ | 264,867 | $ | 264,747 | ||||||
| (a) | Included commercial paper and other short-term debt. |
| (b) | Included fixed-rate borrowings and $16,868 million ($23,642 million in 2004) notional long-term interest rate swaps that effectively convert the floating-rate nature of short-term borrowings to fixed rates of interest. |
At December 31, 2005, interest rate swap maturities ranged from 2006 to 2041, including swap maturities for hedges of commercial paper that ranged from 2006 to 2024. The use of commercial paper swaps allows us to match our actual asset profile more efficiently and provides more flexibility as it does not depend on investor demand for particular maturities.
The following table provides additional information about derivatives designated as hedges of borrowings in accordance with SFAS 133.
DERIVATIVE FAIR VALUES BY ACTIVITY/INSTRUMENT
| December 31 (In millions) | 2005 | 2004 | |||||
| Cash flow hedges | $ | 96 | $ | (1,134 | ) | ||
| Fair value hedges | (39 | ) | 1,864 | ||||
| Total | $ | 57 | $ | 730 | |||
| Interest rate swaps | $ | (1,053 | ) | $ | (1,464 | ) | |
| Currency swaps | 1,110 | 2,194 | |||||
| Total | $ | 57 | $ | 730 | |||
At December 31, 2005, approximately 49% of our interest rate swaps related to borrowings were exempt from ongoing tests of their effectiveness as hedges. We regularly assess the effectiveness of all other hedge positions using a variety of techniques, including cumulative dollar offset and regression analysis depending on which method was selected at inception of the respective hedge. See note 27.
GE 2005 ANNUAL REPORT 91
NOTES TO CONSOLIDATED FINANCIAL STATEMENTS
Note 19
GECS Investment Contracts, Insurance Liabilities and Insurance Annuity Benefits
| December 31 (In millions) | 2005 | 2004 | |||||
| Investment contracts | $ | 16,039 | $ | 18,268 | |||
| Guaranteed investment contracts of SPEs | 11,685 | 11,648 | |||||
| Total investment contracts | 27,724 | 29,916 | |||||
Life insurance benefits(a) | 15,538 | 15,398 | |||||
| Unpaid claims and claims adjustment expenses | 1,690 | 1,729 | |||||
| Unearned premiums | 430 | 405 | |||||
| Universal life benefits | 340 | 945 | |||||
| Total | $ | 45,722 | $ | 48,393 | |||
| (a) | Life insurance benefits are accounted for mainly by a net-level-premium method using estimated yields generally ranging from 3.0% to 8.5% in both 2005 and 2004. |
When insurance affiliates cede insurance to third parties, they are not relieved of their primary obligation to policyholders. Losses on ceded risks give rise to claims for recovery; we establish allowances for probable losses on such receivables from reinsurers as required.
We recognize reinsurance recoveries as a reduction of the Statement of Earnings caption “Investment contracts, insurance losses and insurance annuity benefits.” Reinsurance recoveries were $183 million, $223 million and $434 million for the years ended December 31, 2005, 2004 and 2003, respectively.
Note 20
All Other Liabilities
This caption includes liabilities for various items including non-current compensation and benefits, deferred income, interest on tax liabilities, accrued participation and residuals, environmental remediation, asset retirement obligations, derivative instruments, product warranties and a variety of sundry items.
Accruals for non-current compensation and benefits amounted to $13,832 million and $12,502 million for year-end 2005 and 2004, respectively. These amounts include post-retirement benefits, international and supplemental pension benefits, and other compensation and benefit accruals such as deferred incentive compensation.
We are involved in numerous remediation actions to clean up hazardous wastes as required by federal and state laws. Liabilities for remediation costs at each site are based on our best estimate of undiscounted future costs, excluding possible insurance recoveries. When there appears to be a range of possible costs with equal likelihood, liabilities are based on the low end of such range. Uncertainties about the status of laws, regulations, technology and information related to individual sites make it difficult to develop a meaningful estimate of the reasonably possible aggregate environmental remediation exposure. However, even in the unlikely event that remediation costs amounted to the high end of the range of costs for each site, the resulting additional liability would not be material to our financial position, results of operations or liquidity.
Note 21
Deferred Income Taxes
Aggregate deferred income tax amounts are summarized below.
| December 31 (In millions) | 2005 | 2004 | |||||
ASSETS | |||||||
| GE | $ | 9,928 | $ | 9,464 | |||
| GECS | 6,317 | 6,762 | |||||
16,245 | 16,226 | ||||||
LIABILITIES | |||||||
| GE | 13,661 | 13,080 | |||||
| GECS | 18,914 | 18,431 | |||||
32,575 | 31,511 | ||||||
| Net deferred income tax liability | $ | 16,330 | $ | 15,285 | |||
Principal components of our net liability (asset) representing deferred income tax balances are as follows:
| December 31 (In millions) | 2005 | 2004 | |||||
GE | |||||||
Provisions for expenses(a) | $ | (6,521 | ) | $ | (5,833 | ) | |
| Retiree insurance plans | (1,454 | ) | (1,346 | ) | |||
Prepaid pension asset-principal plans | 6,249 | 6,170 | |||||
| Depreciation | 2,130 | 2,029 | |||||
| Intangible assets | 1,490 | 1,204 | |||||
Other-net | 1,839 | 1,392 | |||||
3,733 | 3,616 | ||||||
GECS | |||||||
| Financing leases | 8,037 | 9,767 | |||||
| Operating leases | 4,024 | 3,716 | |||||
| Intangible assets | 1,195 | 892 | |||||
| Allowance for losses | (2,025 | ) | (2,149 | ) | |||
| Cash flow hedges | (354 | ) | (961 | ) | |||
Other-net | 1,720 | 404 | |||||
12,597 | 11,669 | ||||||
| Net deferred income tax liability | $ | 16,330 | $ | 15,285 | |||
| (a) | Represented the tax effects of temporary differences related to expense accruals for a wide variety of items, such as employee compensation and benefits, interest on tax liabilities, product warranties and other sundry items that are not currently deductible. |
GE 2005 ANNUAL REPORT 92
NOTES TO CONSOLIDATED FINANCIAL STATEMENTS
Note 22
Minority Interest in Equity of Consolidated Affiliates
Minority interest in equity of consolidated affiliates includes common shares in consolidated affiliates and preferred stock issued by GE Capital and by affiliates of GE Capital. Preferred shares that we are required to redeem at a specified or determinable date are classified as liabilities. The balance is summarized as follows:
| December 31 (In millions) | 2005 | 2004 | |||||
| Minority interest in consolidated affiliates | |||||||
NBC Universal(a) | $ | 4,597 | $ | 6,529 | |||
Others(b) | 2,073 | 2,156 | |||||
Minority interest in preferred stock(c) | |||||||
| GE Capital | 70 | 2,600 | |||||
| GE Capital affiliates | 1,314 | 1,318 | |||||
| Total | $ | 8,054 | $ | 12,603 | |||
| (a) | 2004 amounts included preferred interests associated with VUE that were settled in 2005. See note 16 for further information. |
| (b) | Included minority interest in consolidated, liquidating securitization entities, partnerships and common shares of consolidated affiliates. |
| (c) | The preferred stock primarily pays cumulative dividends at variable rates. Dividend rates in local currency on the preferred stock ranged from 1.94% to 5.38% during 2005 and 0.99% to 5.46% during 2004. |
Note 23
Shareowners’ Equity
| (In millions) | 2005 | 2004 | 2003 | |||||||
COMMON STOCK ISSUED | $ | 669 | $ | 669 | $ | 669 | ||||
ACCUMULATED NONOWNER CHANGES | ||||||||||
OTHER THAN EARNINGS | ||||||||||
| Balance at January 1 | $ | 7,238 | $ | 2,876 | $ | (2,960 | ) | |||
Investment securities-net of deferred taxes | ||||||||||
| of $(307), $503 and $590 | (231 | ) | 677 | 960 | ||||||
Currency translation adjustments-net of deferred | ||||||||||
| taxes of $646, $(1,314) and $(1,409) | (4,315 | ) | 3,936 | 5,057 | ||||||
Cash flow hedges-net of deferred taxes of | ||||||||||
| $577, $(97) and $(464) | 863 | (80 | ) | (828 | ) | |||||
Minimum pension liabilities-net of deferred | ||||||||||
| taxes of $(159), $(184) and $(85) | (217 | ) | (421 | ) | (161 | ) | ||||
| Reclassification adjustments | ||||||||||
| Investment securities-net of | ||||||||||
| deferred taxes of $(100), $(142) and $(135) | (206 | ) | (265 | ) | (250 | ) | ||||
| Currency translation adjustments | (3 | ) | - | 4 | ||||||
| Cash flow hedges-net of deferred | ||||||||||
| taxes of $(306), $291 and $601 | (462 | ) | 515 | 1,054 | ||||||
Balance at December 31(a) | $ | 2,667 | $ | 7,238 | $ | 2,876 | ||||
OTHER CAPITAL | ||||||||||
| Balance at January 1 | $ | 24,265 | $ | 17,497 | $ | 17,288 | ||||
Gains on treasury stock dispositions and other(b) | 962 | 4,615 | 209 | |||||||
Issuance of subsidiary shares(b)(c) | - | 2,153 | - | |||||||
| Balance at December 31 | $ | 25,227 | $ | 24,265 | $ | 17,497 | ||||
RETAINED EARNINGS | ||||||||||
| Balance at January 1 | $ | 91,411 | $ | 83,186 | $ | 75,709 | ||||
| Net earnings | 16,353 | 16,819 | 15,236 | |||||||
Dividends(b) | (9,647 | ) | (8,594 | ) | (7,759 | ) | ||||
| Balance at December 31 | $ | 98,117 | $ | 91,411 | $ | 83,186 | ||||
COMMON STOCK HELD IN TREASURY | ||||||||||
| Balance at January 1 | $ | (12,762 | ) | $ | (24,597 | ) | $ | (26,627 | ) | |
Purchases(b) | (6,868 | ) | (1,892 | ) | (1,177 | ) | ||||
Dispositions(b)(d) | 2,304 | 13,727 | 3,207 | |||||||
| Balance at December 31 | $ | (17,326 | ) | $ | (12,762 | ) | $ | (24,597 | ) | |
TOTAL EQUITY | ||||||||||
| Balance at December 31 | $ | 109,354 | $ | 110,821 | $ | 79,631 | ||||
| (a) | Included accumulated nonowner changes related to discontinued operations of $484 million, $1,649 million and $1,820 million at December 31, 2005, 2004 and 2003, respectively. |
| (b) | Total dividends and other transactions with shareowners reduced equity by $13,249 million in 2005; increased equity by $10,009 million in 2004; and reduced equity by $5,520 million in 2003. |
| (c) | Related to the issuance of 20% of NBC Universal’s shares to a subsidiary of VU as part of the transaction described in note 16. |
| (d) | In 2004, included 341.7 million shares valued at $10,674 million issued in the Amersham acquisition, and 119.4 million shares valued at $3,765 million sold to partially fund the NBC and VUE combination. |
GE 2005 ANNUAL REPORT 93
NOTES TO CONSOLIDATED FINANCIAL STATEMENTS
At December 31, 2005 and 2004, the aggregate statutory capital and surplus of the insurance activities and discontinued insurance operations totaled $9.8 billion and $19.4 billion, respectively. Accounting practices prescribed by statutory authorities are used in preparing statutory statements.
In December 2004, our Board of Directors authorized a three-year, $15 billion share repurchase program, expanded that program in 2005 to $25 billion and extended it through 2008. Under this share repurchase program, we repurchased 153.3 million shares for a total of $5.3 billion during 2005.
Common shares issued and outstanding are summarized in the following table.
SHARES OF GE COMMON STOCK
| December 31 (In thousands) | 2005 | 2004 | 2003 | |||||||
| Issued | 11,145,212 | 11,145,212 | 11,145,212 | |||||||
| In treasury | (660,944 | ) | (558,854 | ) | (1,082,092 | ) | ||||
| Outstanding | 10,484,268 | 10,586,358 | 10,063,120 | |||||||
GE has 50 million authorized shares of preferred stock ($1.00 par value), but has not issued any such shares as of December 31, 2005.
Note 24
Other Stock-Related Information
We grant stock options, restricted stock units (RSUs) and performance share units (PSUs) to employees under the 1990 Long-Term Incentive Plan as described in our current Proxy Statement. In addition, we grant options and RSUs in limited circumstances to consultants, advisors and independent contractors (primarily non-employee talent at NBC Universal) under a plan approved by our Board of Directors in 1997 (the consultants’ plan). There are outstanding grants under two separate shareowner-approved option plans for non-employee directors; the last grant was made in 2002 and no further grants are expected to be made under these plans. Requirements for stock option shares may be met from either unissued or treasury shares. RSUs give the recipients the right to receive shares of our stock upon the lapse of their related restrictions. Restrictions on RSUs lapse in various increments and at various dates, beginning after three years from date of grant through grantee retirement. Although the plan permits us to issue RSUs settleable in cash, we have only issued RSUs settleable in shares of our stock. PSUs give recipients the right to receive shares of our stock upon the achievement of certain performance targets.
We measure the total cost of each stock option grant at the date of grant using a market-based option trading model. We recognize the cost of each stock option, RSU and PSU on a straight-line basis over its vesting period.
Stock options expire 10 years from the date they are granted and vest over service periods that range from one to five years.
All grants of GE options under all plans must be approved by the Management Development and Compensation Committee, which consists entirely of outside directors.
STOCK OPTION ACTIVITY
Average per share | ||||||||||
| (Shares in thousands) | Shares subject to option | Exercise price | Market price | |||||||
| Balance at December 31, 2002 | 362,058 | $ | 26.26 | $ | 24.35 | |||||
| Options granted | 8,261 | 31.19 | 31.19 | |||||||
| Options exercised | (43,829 | ) | 9.45 | 27.59 | ||||||
| Options terminated | (10,643 | ) | 38.98 | (a) | ||||||
| Balance at December 31, 2003 | 315,847 | 28.30 | 30.98 | |||||||
Options granted(b) | 27,141 | 32.26 | 32.26 | |||||||
| Options exercised | (43,110 | ) | 10.54 | 32.68 | ||||||
| Options terminated | (13,409 | ) | 36.91 | (a) | ||||||
| Balance at December 31, 2004 | 286,469 | 30.94 | 36.50 | |||||||
| Options granted | 12,779 | 34.54 | 34.54 | |||||||
| Options exercised | (31,568 | ) | 12.54 | 35.37 | ||||||
| Options terminated | (9,746 | ) | 37.62 | (a) | ||||||
| Balance at December 31, 2005 | 257,934 | $ | 33.12 | $ | 35.05 | |||||
| (a) | Not applicable. |
| (b) | Included approximately 3.5 million options that replaced canceled stock appreciation rights and have identical terms. |
STOCK COMPENSATION PLANS
| December 31, 2005 (Shares in thousands) | Securities to be issued upon exercise | Weighted average exercise price | Securities available for future issuance | |||||||
APPROVED BY SHAREOWNERS | ||||||||||
| Options | 256,584 | $ | 33.16 | (a | ) | |||||
| RSUs | 31,877 | (b | ) | (a | ) | |||||
| PSUs | 950 | (b | ) | (a | ) | |||||
NOT APPROVED BY SHAREOWNERS | ||||||||||
(CONSULTANTS’ PLAN) | ||||||||||
| Options | 1,350 | 25.17 | (c | ) | ||||||
| RSUs | 98 | (b | ) | (c | ) | |||||
Total(d) | 290,859 | $ | 33.12 | 130,261 | ||||||
| (a) | Under the 1990 Long-Term Incentive Plan, 0.95% of issued common stock (including treasury shares) as of the first day of each calendar year during which the Plan is in effect becomes available for awards in that calendar year. Total shares available for future issuance under the 1990 Long-Term Incentive Plan amounted to 105.9 million shares. |
| (b) | Not applicable. |
| (c) | Total shares available for future issuance under the consultants’ plan amount to 24.4 million shares. |
| (d) | In connection with various acquisitions, there are an additional 1.2 million options outstanding, with a weighted average exercise price of $21.81. |
Outstanding options expire on various dates through December 8, 2015.
GE 2005 ANNUAL REPORT 94
NOTES TO CONSOLIDATED FINANCIAL STATEMENTS
The following table summarizes information about stock options outstanding at December 31, 2005.
STOCK OPTIONS OUTSTANDING
| (Shares in thousands) | Outstanding | Exercisable | ||||||||||||||
| Exercise price range | Shares | Average life(a) | Average exercise price | Shares | Average exercise price | |||||||||||
| Under $14.00 | 10,115 | 0.5 | $ | 13.45 | 10,115 | $ | 13.45 | |||||||||
14.01-21.00 | 16,390 | 0.7 | 14.91 | 16,390 | 14.91 | |||||||||||
21.01-28.00 | 70,980 | 4.5 | 25.72 | 56,919 | 25.40 | |||||||||||
28.01-35.00 | 46,379 | 8.5 | 32.69 | 10,559 | 31.85 | |||||||||||
35.01-42.00 | 49,327 | 4.3 | 37.18 | 41,329 | 37.47 | |||||||||||
42.01-49.00 | 51,243 | 5.0 | 43.30 | 51,242 | 43.30 | |||||||||||
| Over $49.00 | 13,500 | 4.7 | 56.88 | 13,500 | 56.88 | |||||||||||
| Total | 257,934 | 4.9 | $ | 33.12 | 200,054 | $ | 33.48 | |||||||||
At year-end 2004, options with an average exercise price of $29.40 were exercisable on 204 million shares; at year-end 2003, options with an average exercise price of $24.63 were exercisable on 214 million shares.
| (a) | Average contractual life remaining in years. |
OPTION VALUE INFORMATION(a)
2005 | 2004 | 2003 | ||||||||
Fair value per option (in dollars)(b) | $ | 8.87 | $ | 8.33 | $ | 9.44 | ||||
| Valuation assumptions | ||||||||||
| Expected option term (in years) | 6 | 6 | 6 | |||||||
| Expected volatility | 28 | % | 28 | % | 35 | % | ||||
| Expected dividend yield | 2.5 | 2.5 | 2.5 | |||||||
| Risk-free interest rate | 4.1 | 4.0 | 3.5 | |||||||
| (a) | Weighted averages of option grants during each period. |
| (b) | Estimated using Black-Scholes option pricing model. |
Note 25
Supplemental Cash Flows Information
Changes in operating assets and liabilities are net of acquisitions and dispositions of principal businesses.
Amounts reported in the “Payments for principal businesses purchased” line in the Statement of Cash Flows is net of cash acquired and included debt assumed and immediately repaid in acquisitions.
Amounts reported in the “All other operating activities” line in the Statement of Cash Flows consists primarily of adjustments to current and noncurrent accruals and deferrals of costs and expenses, adjustments for gains and losses on assets, increases and decreases in assets held for sale and adjustments to assets.
Non-cash transactions include the following: in 2005, NBC Universal acquired IAC’s 5.44% common interest in VUE for a total purchase price that included $115 million of non-cash consideration, representing the fair value of future services to be performed by NBC Universal (see note 16); in 2004, the issuance of GE common stock valued at $10,674 million in connection with the acquisition of Amersham and the issuance of NBC Universal shares valued at $5,845 million in connection with the combination of NBC and VUE; and in 2003, the acquisition of Osmonics, Inc. for GE common stock valued at $240 million.
GE 2005 ANNUAL REPORT 95
NOTES TO CONSOLIDATED FINANCIAL STATEMENTS
Certain supplemental information related to GE and GECS cash flows is shown below.
| December 31 (In millions) | 2005 | 2004 | 2003 | |||||||
GE | ||||||||||
NET DISPOSITIONS (PURCHASES) OF | ||||||||||
GE SHARES FOR TREASURY | ||||||||||
Open market purchases under share repurchase program | $ | (5,024 | ) | $ | (203 | ) | $ | (340 | ) | |
| Other purchases | (1,844 | ) | (1,689 | ) | (837 | ) | ||||
| Dispositions | 2,024 | 5,885 | 1,903 | |||||||
$ | (4,844 | ) | $ | 3,993 | $ | 726 | ||||
GECS | ||||||||||
ALL OTHER OPERATING ACTIVITIES | ||||||||||
| Net change in assets held for sale | $ | 2,192 | $ | 84 | $ | 1,168 | ||||
| Amortization of intangible assets | 459 | 519 | 618 | |||||||
| Realized gains on sale of investment securities | (381 | ) | (204 | ) | (205 | ) | ||||
| Other | (1,205 | ) | (2,711 | ) | (1,941 | ) | ||||
$ | 1,065 | $ | (2,312 | ) | $ | (360 | ) | |||
NET INCREASE IN GECS FINANCING RECEIVABLES | ||||||||||
Increase in loans to customers | $ | (315,697 | ) | $ | (342,357 | ) | $ | (263,815 | ) | |
Principal collections from customers-loans | 267,728 | 305,846 | 238,518 | |||||||
| Investment in equipment for financing leases | (23,508 | ) | (22,649 | ) | (22,825 | ) | ||||
Principal collections from customers-financing leases | 21,770 | 19,715 | 18,909 | |||||||
| Net change in credit card receivables | (21,391 | ) | (20,651 | ) | (11,483 | ) | ||||
| Sales of financing receivables | 54,144 | 44,816 | 36,009 | |||||||
$ | (16,954 | ) | $ | (15,280 | ) | $ | (4,687 | ) | ||
ALL OTHER INVESTING ACTIVITIES | ||||||||||
Purchases of securities by insurance activities | $ | (9,264 | ) | $ | (7,474 | ) | $ | (7,942 | ) | |
| Dispositions and maturities of securities by insurance activities | 10,892 | 9,305 | 9,509 | |||||||
| Proceeds from principal business dispositions | 209 | 472 | 3,337 | |||||||
| Other | 2,807 | 6,083 | 1,199 | |||||||
$ | 4,644 | $ | 8,386 | $ | 6,103 | |||||
NEWLY ISSUED DEBT HAVING MATURITIES | ||||||||||
LONGER THAN 90 DAYS | ||||||||||
Short-term (91 to 365 days) | $ | 4,675 | $ | 3,940 | $ | 3,661 | ||||
| Long-term (longer than one year) | 60,176 | 53,641 | 55,661 | |||||||
Proceeds-nonrecourse, leveraged lease | 203 | 562 | 791 | |||||||
$ | 65,054 | $ | 58,143 | $ | 60,113 | |||||
REPAYMENTS AND OTHER REDUCTIONS OF DEBT | ||||||||||
HAVING MATURITIES LONGER THAN 90 DAYS | ||||||||||
Short-term (91 to 365 days) | $ | (38,132 | ) | $ | (41,443 | ) | $ | (38,756 | ) | |
| Long-term (longer than one year) | (10,746 | ) | (3,443 | ) | (3,664 | ) | ||||
Principal payments-nonrecourse, leveraged lease | (831 | ) | (652 | ) | (782 | ) | ||||
$ | (49,709 | ) | $ | (45,538 | ) | $ | (43,202 | ) | ||
ALL OTHER FINANCING ACTIVITIES | ||||||||||
Proceeds from sales of investment contracts | $ | 15,743 | $ | 11,079 | $ | 766 | ||||
| Redemption of investment contracts | (16,934 | ) | (14,476 | ) | (480 | ) | ||||
$ | (1,191 | ) | $ | (3,397 | ) | $ | 286 | |||
GE 2005 ANNUAL REPORT 96
NOTES TO CONSOLIDATED FINANCIAL STATEMENTS
Note 26
Operating Segments
REVENUES
Total revenues | Intersegment revenues | External revenues | ||||||||||||||||||||||||||
| (In millions) | 2005 | 2004 | 2003 | 2005 | 2004 | 2003 | 2005 | 2004 | 2003 | |||||||||||||||||||
| Infrastructure | $ | 41,803 | $ | 37,373 | $ | 36,569 | $ | 405 | $ | 481 | $ | 449 | $ | 41,398 | $ | 36,892 | $ | 36,120 | ||||||||||
| Industrial | 32,631 | 30,722 | 24,988 | 702 | 493 | 308 | 31,929 | 30,229 | 24,680 | |||||||||||||||||||
| Healthcare | 15,153 | 13,456 | 10,198 | 9 | - | 2 | 15,144 | 13,456 | 10,196 | |||||||||||||||||||
| NBC Universal | 14,689 | 12,886 | 6,871 | - | - | - | 14,689 | 12,886 | 6,871 | |||||||||||||||||||
| Commercial Finance | 20,646 | 19,524 | 16,927 | 204 | 279 | 197 | 20,442 | 19,245 | 16,730 | |||||||||||||||||||
| Consumer Finance | 19,416 | 15,734 | 12,845 | 52 | 33 | 23 | 19,364 | 15,701 | 12,822 | |||||||||||||||||||
| Corporate items and | ||||||||||||||||||||||||||||
| eliminations | 5,364 | 4,786 | 4,488 | (1,372 | ) | (1,286 | ) | (979 | ) | 6,736 | 6,072 | 5,467 | ||||||||||||||||
| Total | $ | 149,702 | $ | 134,481 | $ | 112,886 | $ | - | $ | - | $ | - | $ | 149,702 | $ | 134,481 | $ | 112,886 | ||||||||||
Revenues of GE businesses include income from sales of goods and services to customers and other income.
Sales from one component to another generally are priced at equivalent commercial selling prices.
Revenues originating from operations based in the United States were $89,887 million, $82,148 million and $69,998 million in 2005, 2004 and 2003, respectively. Revenues originating from operations based outside the United States were $59,815 million, $52,333 million and $42,888 million in 2005, 2004 and 2003, respectively.
Assets(a) | Property, plant and equipment additions(b) | Depreciation and amortization | ||||||||||||||||||||||||||
| At December 31 | For the years ended December 31 | For the years ended December 31 | ||||||||||||||||||||||||||
| (In millions) | 2005 | 2004 | 2003 | 2005 | 2004 | 2003 | 2005 | 2004 | 2003 | |||||||||||||||||||
| Infrastructure | $ | 89,555 | $ | 82,798 | $ | 76,185 | $ | 4,188 | $ | 3,938 | $ | 3,540 | $ | 2,436 | $ | 2,162 | $ | 2,077 | ||||||||||
| Industrial | 41,556 | 42,040 | 40,359 | 4,367 | 4,111 | 2,205 | 3,292 | 3,292 | 2,288 | |||||||||||||||||||
| Healthcare | 24,661 | 24,871 | 10,816 | 460 | 1,590 | 289 | 617 | 565 | 278 | |||||||||||||||||||
| NBC Universal | 31,196 | 34,206 | 11,619 | 275 | 1,189 | 121 | 339 | 273 | 117 | |||||||||||||||||||
| Commercial Finance | 190,546 | 184,388 | 172,471 | 5,426 | 4,573 | 5,141 | 2,648 | 2,772 | 2,444 | |||||||||||||||||||
| Consumer Finance | 158,829 | 151,255 | 106,530 | 189 | 217 | 191 | 393 | 334 | 276 | |||||||||||||||||||
| Corporate items and | ||||||||||||||||||||||||||||
| eliminations | 136,999 | 230,949 | 229,848 | 199 | 194 | 252 | 208 | 245 | 373 | |||||||||||||||||||
| Total | $ | 673,342 | $ | 750,507 | $ | 647,828 | $ | 15,104 | $ | 15,812 | $ | 11,739 | $ | 9,933 | $ | 9,643 | $ | 7,853 | ||||||||||
| (a) | Assets of discontinued operations are included in Corporate items and eliminations for all periods presented. |
| (b) | Additions to property, plant and equipment include amounts relating to principal businesses purchased. |
Interest and other financial charges | Provision for income taxes | ||||||||||||||||||
| (In millions) | 2005 | 2004 | 2003 | 2005 | 2004 | 2003 | |||||||||||||
Infrastructure(a) | $ | 1,706 | $ | 1,436 | $ | 1,236 | $ | (202 | ) | $ | 62 | $ | 243 | ||||||
Industrial(a) | 536 | 526 | 601 | 64 | (124 | ) | (165 | ) | |||||||||||
| Commercial Finance | 5,893 | 4,720 | 4,630 | 971 | 1,144 | 493 | |||||||||||||
| Consumer Finance | 5,443 | 3,564 | 2,696 | 529 | 449 | 458 | |||||||||||||
Corporate items and eliminations(b) | 1,609 | 1,410 | 1,297 | 2,492 | 1,955 | 2,816 | |||||||||||||
| Total | $ | 15,187 | $ | 11,656 | $ | 10,460 | $ | 3,854 | $ | 3,486 | $ | 3,845 | |||||||
| (a) | Included only portions of the segment that are financial services businesses. |
| (b) | Included amounts for Healthcare, NBC Universal and the industrial businesses of Infrastructure and Industrial, for which our measure of segment profit excludes interest and other financial charges and income taxes. |
Property, plant and equipment associated with operations based in the United States were $26,140 million, $25,219 million and $20,591 million at year-end 2005, 2004 and 2003, respectively. Property, plant and equipment associated with operations based outside the United States were $41,388 million, $37,884 million and $32,560 million at year-end 2005, 2004 and 2003, respectively.
Basis for presentation
Our operating businesses are organized based on the nature of markets and customers. Segment accounting policies are the same as described in note 1.
A description of our operating segments can be found on page 105 and details of segment profit by operating segment can be found in the Summary of Operating Segments table on page 49 of this report.
GE 2005 ANNUAL REPORT 97
NOTES TO CONSOLIDATED FINANCIAL STATEMENTS
Note 27
Derivatives and Other Financial Instruments
Derivatives and hedging
We conduct our business activities in diverse markets around the world, including countries where obtaining local funding may not be efficient. The nature of our activities exposes us to risks of changes in interest rates, currency exchange rates and commodity prices. We manage these risks using a variety of straightforward techniques, including issuing debt funding that matches the interest rate nature and currency denomination of the related asset. In addition, we selectively use derivatives to reduce our exposure to interest rate and currency risk. For example, if we make a fixed rate loan and fund that loan with variable rate debt, we will enter into an interest rate swap to pay a fixed rate of interest and receive a variable rate of interest, and designate the swap as a hedge of the variable rate borrowing. We apply strict policies to manage each of these risks, including prohibitions on derivatives trading, derivatives market-making or other speculative activities.
To qualify for hedge accounting, details of the hedging relationship must be formally documented at inception of the arrangement, including the risk management objective, hedging strategy, hedged item, specific risks that are to be hedged, the derivative instrument and how effectiveness is being assessed. The derivative must be highly effective in offsetting either changes in fair value or cash flows, as appropriate, for the risk being hedged. Effectiveness is assessed at the inception of the relationship. If specified criteria for the assumption of effectiveness are not met at hedge inception, effectiveness is assessed quarterly on a retrospective and prospective basis. Ineffectiveness is also measured quarterly, with the results recognized in earnings.
For derivatives that are not exchange-traded instruments, we use internal valuation models that incorporate market-based information. With the exception of foreign currency forwards and commodity derivatives, we also obtain valuations from our derivative counterparties to validate the valuations produced by our own models and to value a limited number of products that our internal models do not cover.
Cash flow hedges
Our cash flow hedging arrangements use simple derivatives to offset the variability of expected future cash flows. We use interest rate and currency swaps to convert variable rate borrowings to match the nature of the assets we acquire. We use currency forwards and options to manage exposures to changes in currency exchange rates associated with commercial purchase and sale transactions, including commodities. These instruments permit us to reduce the cash flow variability, in local currency, of costs or selling prices denominated in currencies other than the functional currency. For derivatives designated as cash flow hedges, we record changes in fair value in a separate component of equity to the extent effective, then release those changes to earnings contemporaneously with the earnings effects of the hedged items. If the hedge relationship is terminated, then the change in fair value of the derivative recorded in equity is recognized contemporaneously with the earnings effects of the hedged item, consistent with the original hedge strategy.
At December 31, 2005, amounts related to derivatives qualifying as cash flow hedges amounted to a reduction of equity of $822 million, of which we expect to transfer $151 million to earnings in 2006 along with the earnings effects of the related forecasted transactions. At December 31, 2005, the amount of unrecognized losses related to cash flow hedges of short-term borrowings was $1,019 million. At that date, the maximum term of derivative instruments that hedge forecasted transactions, other than interest rate swaps designated as hedges of commercial paper (discussed in note 18), was 27 years and related to hedges of anticipated bond purchases. Funding for those purchases is provided by contractual premiums on insurance policies of similar duration.
Fair value hedges
Fair value hedges are hedges that reduce the risk of changes in the fair values of assets, liabilities and certain types of firm commitments. We use interest rate swaps, currency swaps and interest rate and currency forwards to hedge the effects of interest rate and currency exchange rate changes on local and nonfunctional currency denominated fixed-rate borrowings and certain types of fixed-rate assets. We record changes in fair value of a derivative designated and effective as a fair value hedge in earnings, offset by corresponding changes in the fair value of the hedged item.
Fair value adjustments decreased the carrying amount of debt outstanding at December 31, 2005, by $114 million.
Net investment hedges
Net investment hedges consist of currency forwards and currency swaps that reduce our exposure to changes in currency exchange rates on our investments in non-U.S. financial services subsidiaries. For qualifying net investment hedges, changes in the intrinsic value of the derivative are recorded in equity. Amounts excluded from the measure of effectiveness of net investment hedges are recognized in earnings in the period in which they arise. Derivative gains included in equity amounted to $977 million and $867 million at December 31, 2005 and 2004, respectively.
Derivatives not designated as hedges
We must meet specific criteria in order to apply any of the three forms of hedge accounting discussed above. For example, hedge accounting is not permitted for hedged items that are marked to market through earnings. However, we use derivatives to hedge exposures when it makes economic sense to do so, including circumstances in which the hedging relationship does not qualify for hedge accounting, as described in the following paragraph. Derivatives that do not qualify for hedge accounting are marked to market through earnings.
GE 2005 ANNUAL REPORT 98
NOTES TO CONSOLIDATED FINANCIAL STATEMENTS
We use swaps, futures and option contracts, including caps, floors and collars, as economic hedges of changes in interest rates, currency exchange rates and equity prices on certain types of assets and liabilities. We sometimes use credit default swaps to hedge the credit risk of various counterparties with which we have entered into loan or leasing arrangements. We occasionally obtain equity warrants as part of sourcing or financing transactions. Although these instruments are considered to be derivatives, their economic risks are similar to, and managed on the same basis as, risks of other equity instruments we hold.
Earnings effects of derivatives
In the context of hedging relationships, “effectiveness” refers to the degree to which fair value changes in the hedging instrument offset the corresponding expected earnings effects of the hedged item. At December 31, 2005, approximately 35 percent of our total interest rate swaps were exempt from ongoing tests of their effectiveness as hedges. For derivatives designated and qualifying as hedges but not qualifying for the assumption of effectiveness, we use a variety of techniques to assess effectiveness and measure ineffectiveness, including cumulative dollar offset and regression analysis, depending on which method was selected at inception of the respective hedge. Certain elements of hedge positions may be excluded from the measure of effectiveness, for example, changes in the value of purchased options attributable to volatility and passage of time.
The following table provides additional information about the earnings effects of derivatives.
PRE-TAX GAINS (LOSSES)
| December 31 (In millions) | 2005 | 2004 | 2003 | |||||||
CASH FLOW HEDGES | ||||||||||
| Ineffectiveness | $ | (31 | ) | $ | 2 | $ | (19 | ) | ||
| Amounts excluded from the measure of effectiveness | 17 | 25 | - | |||||||
FAIR VALUE HEDGES | ||||||||||
| Ineffectiveness | 4 | 11 | - | |||||||
| Amounts excluded from the measure of effectiveness | (8 | ) | 3 | - | ||||||
For hedge relationships discontinued because the forecasted transaction is not expected to occur by the end of the originally specified period, any related derivative amounts recorded in equity are reclassified to earnings.
In 2005, we recognized an insignificant loss related to hedged forecasted transactions and firm commitments that did not occur by the end of the originally specified period.
In 2004, we recognized a pre-tax loss of $46 million, before cancelation penalties, for terminating a forward euro contract when our customer canceled its hedged, firm order for equipment and services.
Additional information regarding the use of derivatives related to our financing activities is provided in note 18.
Counterparty credit risk
The risk that counterparties to derivative contracts will default and not make payments to us according to the terms of the agreements is counterparty credit risk. We manage counterparty credit risk on an individual counterparty basis, which means that we net exposures on transactions by counterparty where legal right of offset exists and include the value of collateral to determine the amount of exposure to each counterparty. When the net exposure to a counterparty, based on the current market value of transactions, exceeds credit exposure limits (see table below), actions are taken to reduce exposure. Actions can include prohibiting the counterparty from entering into additional transactions, requiring collateral from the counterparty (as described below) and terminating or restructuring transactions.
Swaps are required to be executed under master agreements containing mutual credit downgrade provisions that provide the ability to require assignment or termination in the event either party is downgraded below A3 or A-. To mitigate credit risk, in certain cases we have entered into collateral arrangements that provide us with the right to hold collateral when the current market value of derivative contracts exceeds an exposure threshold. Under these arrangements, we may receive rights to cash or U.S. Treasury or other highly-rated securities to secure our exposure. Such collateral is available to us in the event that a counterparty defaults. We evaluate credit risk exposures and compliance with credit exposure limits net of such collateral.
Fair values of our derivatives assets and liabilities represent the replacement value of existing derivatives at market prices and can change significantly from period to period based on, among other factors, market movements and changes in our positions. At December 31, 2005, our exposure to counterparties, after consideration of netting arrangements and collateral, was $779 million.
Following is GECS policy relating to initial credit rating requirements and to exposure limits to counterparties.
COUNTERPARTY CREDIT CRITERIA
Credit rating | |||||||
| Moody’s | S&P | ||||||
| Foreign exchange forwards and other derivatives less than one year | P-1 | A-1 | |||||
| All derivatives between one and five years | Aa3 | (a) | AA- | (a) | |||
| All derivatives greater than five years | Aaa | (a) | AAA | (a) | |||
| (a) | Counterparties that have an obligation to provide collateral to cover credit exposure in accordance with a credit support agreement must have a minimum A3/A-rating. |
EXPOSURE LIMITS
| (In millions) | ||||||||||
Minimum rating | Exposure(a) | |||||||||
| Moody’s | S&P | With collateral arrangements | Without collateral arrangements | |||||||
| Aaa | AAA | $ | 100 | $ | 75 | |||||
| Aa3 | AA- | 50 | 50 | |||||||
| A3 | A- | 5 | - | |||||||
| (a) | For derivatives with maturities less than one year, counterparties are permitted to have unsecured exposure up to $150 million with a minimum rating of A-1/P-1. |
GE 2005 ANNUAL REPORT 99
NOTES TO CONSOLIDATED FINANCIAL STATEMENTS
FINANCIAL INSTRUMENTS
2005 | 2004 | ||||||||||||||||||
| Assets (liabilities) | Assets (liabilities) | ||||||||||||||||||
| December 31 (In millions) | Notional amount | Carrying amount (net) | Estimated fair value | Notional amount | Carrying amount (net) | Estimated fair value | |||||||||||||
GE | |||||||||||||||||||
| Assets | |||||||||||||||||||
Investments and notes receivable(a) | $ | (b | ) | $ | 573 | $ | 625 | $ | (b | ) | $ | 3,465 | $ | 3,545 | |||||
| Liabilities | |||||||||||||||||||
Borrowings(c)(d) | (b | ) | (10,208 | ) | (10,223 | ) | (b | ) | (11,034 | ) | (11,144 | ) | |||||||
Other financial instruments(a) | (b | ) | - | - | (b | ) | (758 | ) | (855 | ) | |||||||||
GECS | |||||||||||||||||||
| Assets | |||||||||||||||||||
| Loans | (b | ) | 223,855 | 224,259 | (b | ) | 216,035 | 217,155 | |||||||||||
| Other commercial and residential mortgages held for sale | (b | ) | 6,696 | 6,696 | (b | ) | 5,143 | 5,113 | |||||||||||
| Other financial instruments | (b | ) | 4,138 | 4,494 | (b | ) | 2,972 | 3,184 | |||||||||||
| Liabilities | |||||||||||||||||||
Borrowings(c)(d) | (b | ) | (362,069 | ) | (369,972 | ) | (b | ) | (355,501 | ) | (362,851 | ) | |||||||
| Investment contract benefits | (b | ) | (9,877 | ) | (9,862 | ) | (b | ) | (12,539 | ) | (12,520 | ) | |||||||
Insurance-credit life(e) | 2,365 | (8 | ) | (8 | ) | 2,210 | (13 | ) | (13 | ) | |||||||||
| (a) | 2004 amounts included financial instruments associated with VUE that were settled in 2005. See note 16 for further information. |
| (b) | These financial instruments do not have notional amounts. |
| (c) | Included effects of interest rate and cross-currency swaps. |
| (d) | See note 18. |
| (e) | Net of reinsurance of $292 million and $105 million at December 31, 2005 and 2004, respectively. |
Assets and liabilities that are reflected in the accompanying financial statements at fair value are not included in the above disclosures; such items include cash and equivalents, investment securities and derivative financial instruments. Other assets and liabilities-those not carried at fair value-are discussed below. Apart from certain of our borrowings and certain marketable securities, few of the instruments discussed below are actively traded and their fair values must often be determined using financial models. There is no assurance that such estimates could actually have been realized at December 31, 2005 or 2004.
A description of how we estimate fair values follows.
Loans
Based on quoted market prices, recent transactions and/or discounted future cash flows, using rates at which similar loans would have been made to similar borrowers.
Borrowings
Based on discounted future cash flows using current market rates which are comparable to market quotes.
Investment contract benefits
Based on expected future cash flows, discounted at currently offered rates for immediate annuity contracts or cash surrender values for single premium deferred annuities.
All other instruments
Based on comparable market transactions, discounted future cash flows, quoted market prices, and/or estimates of the cost to terminate or otherwise settle obligations.
Additional information about certain categories in the table above follows.
Residential mortgages
Residential mortgage products amounting to $12,633 million at December 31, 2005, were either high loan-to-value loans or those permitting interest-only payments. We originate such loans either for our portfolio or for sale in secondary markets. In both cases, higher yields compensate for the increased risk. The portfolio was geographically diverse, with Europe and North America the most significant market segments.
Insurance-credit life
Certain insurance affiliates, primarily in Consumer Finance, issue credit life insurance designed to pay the balance due on a loan if the borrower dies before the loan is repaid. As part of our overall risk management process, we cede to third parties a portion of this associated risk, but are not relieved of our primary obligation to policyholders.
GE 2005 ANNUAL REPORT 100
NOTES TO CONSOLIDATED FINANCIAL STATEMENTS
LOAN COMMITMENTS
Notional amount | |||||||
December 31 (In millions) | 2005 | 2004 | |||||
| Ordinary course of business lending commitments | |||||||
| Fixed rate | $ | 4,648 | $ | 2,260 | |||
| Variable rate | 7,026 | 8,145 | |||||
Unused revolving credit lines(a) | |||||||
| Commercial | |||||||
| Fixed rate | 779 | 1,210 | |||||
| Variable rate | 20,779 | 21,411 | |||||
Consumer-principally credit cards | |||||||
| Fixed rate | 170,367 | 141,965 | |||||
| Variable rate | 281,113 | 200,219 | |||||
| (a) | Excluded inventory financing arrangements, which may be withdrawn at our option, of $11.4 billion and $8.9 billion as of December 31, 2005 and 2004, respectively. |
Note 28
Securitization Entities
We securitize financial assets in the ordinary course of business to improve shareowner returns. The securitization transactions we engage in are similar to those used by many financial institutions. Beyond improving returns, these securitization transactions serve as funding sources for a variety of diversified lending and securities transactions. Historically, we have used both GE-supported and third-party entities to execute securitization transactions funded in the commercial paper and term bond markets.
Securitized assets that are on-balance sheet include assets consolidated upon adoption of FIN 46. Although we do not control these entities, consolidation was required because we provided a majority of the credit and liquidity support for their activities. A majority of these entities were established to issue asset-backed securities, using assets that were sold by us and by third parties. These entities differ from others included in our consolidated financial statements because the assets they hold are legally isolated and are unavailable to us under any circumstances. Repayment of their liabilities depends primarily on cash flows generated by their assets. Because we have ceased transferring assets to these entities, balances will decrease as the assets repay. We refer to these entities as “consolidated, liquidating securitization entities.”
The following table represents assets in securitization entities, both consolidated and off-balance sheet.
| December 31 (In millions) | 2005 | 2004 | |||||
| Receivables secured by: | |||||||
| Equipment | $ | 12,949 | $ | 13,941 | |||
| Commercial real estate | 13,010 | 14,626 | |||||
| Residential real estate | 8,882 | 9,094 | |||||
| Other assets | 12,869 | 9,880 | |||||
| Credit card receivables | 10,039 | 7,075 | |||||
| GE trade receivables | 3,960 | 3,582 | |||||
| Total securitized assets | $ | 61,709 | $ | 58,198 | |||
| December 31 (In millions) | 2005 | 2004 | |||||
Off-balance sheet(a)(b) | $ | 43,805 | $ | 32,205 | |||
On-balance sheet(c) | 17,904 | 25,993 | |||||
| Total securitized assets | $ | 61,709 | $ | 58,198 | |||
| (a) | At December 31, 2005 and 2004, liquidity support amounted to $2,000 million and $2,300 million, respectively. These amounts are net of $3,800 million and $4,300 million, respectively, participated or deferred beyond one year. Credit support amounted to $6,000 million and $6,600 million at December 31, 2005 and 2004, respectively. |
| (b) | Liabilities for recourse obligations related to off-balance sheet assets were $93 million and $64 million at December 31, 2005 and 2004, respectively. |
| (c) | At December 31, 2005 and 2004, liquidity support amounted to $10,000 million and $14,400 million, respectively. These amounts are net of $100 million and $1,200 million, respectively, participated or deferred beyond one year. Credit support amounted to $4,800 million and $6,900 million at December 31, 2005 and 2004, respectively. |
The portfolio of financing receivables consisted of loans and financing lease receivables secured by equipment, commercial and residential real estate and other assets; credit card receivables; and trade receivables. Examples of these assets include loans and leases on manufacturing and transportation equipment, loans on commercial property, commercial loans, and balances of high credit quality accounts from sales of a broad range of products and services to a diversified customer base.
Assets in consolidated, liquidating securitization entities are shown in the following captions in the Statement of Financial Position.
| December 31 (In millions) | 2005 | 2004 | |||||
Financing receivables-net (note 13) | $ | 16,615 | $ | 22,848 | |||
| Other assets | 1,235 | 2,384 | |||||
| Other, principally investment securities | 54 | 761 | |||||
| Total | $ | 17,904 | $ | 25,993 | |||
GE 2005 ANNUAL REPORT 101
NOTES TO CONSOLIDATED FINANCIAL STATEMENTS
Off-balance sheet arrangements
We engage in off-balance sheet securitization transactions with third-party entities and use public market term securitizations. As discussed above, assets in off-balance sheet securitization entities amounted to $43.8 billion and $32.2 billion at December 31, 2005 and 2004, respectively. Gross securitization gains amounted to $939 million in 2005 compared with $1,195 million in 2004 and $1,351 million in 2003.
Amounts recognized in our financial statements related to sales to off-balance sheet securitization entities are as follows:
| December 31 (In millions) | 2005 | 2004 | |||||
| Retained interests | $ | 4,515 | $ | 3,671 | |||
| Servicing assets | 29 | 33 | |||||
| Recourse liability | (93 | ) | (64 | ) | |||
| Total | $ | 4,451 | $ | 3,640 | |||
• | RETAINED INTERESTS. When we securitize receivables, we determine fair value of retained interests based on discounted cash flow models that incorporate, among other things, assumptions about loan pool credit losses, prepayment speeds and discount rates. These assumptions are based on our experience, market trends and anticipated performance related to the particular assets securitized. We classify retained interests in securitized receivables as investment securities and mark them to fair value each reporting period, updating our models for current assumptions. These assets decrease as cash is received in payment. When the carrying amounts exceed fair value, we evaluate whether the unrealized loss is other than temporary and, if so, record any indicated loss in earnings currently. |
• | SERVICING ASSETS. Following a securitization transaction, we also may provide servicing for a market-based fee based on remaining outstanding principal balances. Servicing assets are primarily associated with residential mortgage loans. Their value is subject to credit, prepayment and interest rate risk. |
• | RECOURSE LIABILITY. Certain transactions involve credit support agreements. As a result, we provide for expected credit losses at amounts that approximate fair value. |
The following table summarizes data related to securitization sales that we completed during 2005 and 2004.
| (Dollars in millions) | Equipment | Commercial real estate | Other assets | Credit card receivables | |||||||||
2005 | |||||||||||||
| Cash proceeds from securitization | $ | 3,702 | $ | 5,571 | $ | 4,705 | $ | 6,985 | |||||
| Proceeds from collections reinvested | |||||||||||||
| in new receivables | - | - | 27,697 | 10,067 | |||||||||
| Cash received on retained interests | 190 | 69 | 10 | 1,644 | |||||||||
| Cash received from servicing and other sources | 75 | 36 | 91 | 155 | |||||||||
| Weighted average lives (in months) | 37 | 80 | 35 | 8 | |||||||||
Assumptions as of sale date(a) | |||||||||||||
| Discount rate | 8.8 | % | 13.4 | % | 12.6 | % | 11.7 | % | |||||
| Prepayment rate | 8.8 | % | 6.5 | % | 21.2 | % | 12.6 | % | |||||
| Estimate of credit losses | 2.3 | % | 0.8 | % | 0.6 | % | 7.5 | % | |||||
2004 | |||||||||||||
| Cash proceeds from securitization | $ | 5,367 | $ | 4,578 | $ | - | $ | 8,121 | |||||
| Proceeds from collections reinvested | |||||||||||||
| in new receivables | - | - | 21,389 | 5,208 | |||||||||
| Cash received on retained interests | 107 | 70 | 128 | 1,788 | |||||||||
| Cash received from servicing and other sources | 85 | 6 | 62 | 138 | |||||||||
| Weighted average lives | |||||||||||||
| (in months) | 37 | 68 | - | 7 | |||||||||
Assumptions as of sale date(a) | |||||||||||||
| Discount rate | 8.2 | % | 13.0 | % | - | 12.2 | % | ||||||
| Prepayment rate | 9.1 | % | 11.2 | % | - | 14.9 | % | ||||||
| Estimate of credit losses | 1.9 | % | 1.1 | % | - | 8.9 | % | ||||||
| (a) | Based on weighted averages. |
Key assumptions used in measuring the fair value of retained interests in securitizations and the sensitivity of the current fair value of residual cash flows to changes in those assumptions related to all outstanding retained interests as of December 31, 2005, are noted in the following table.
| (Dollars in millions) | Equipment | Commercial real estate | Other assets | Credit card receivables | |||||||||
DISCOUNT RATE(a) | 6.4 | % | 11.0 | % | 5.5 | % | 11.1 | % | |||||
| Effect of: | |||||||||||||
| 10% Adverse change | $ | (12 | ) | $ | (14 | ) | $ | (4 | ) | $ | (10 | ) | |
| 20% Adverse change | (24 | ) | (26 | ) | (8 | ) | (23 | ) | |||||
PREPAYMENT RATE(a) | 9.7 | % | 1.8 | % | 8.4 | % | 12.8 | % | |||||
| Effect of: | |||||||||||||
| 10% Adverse change | $ | (6 | ) | $ | (5 | ) | $ | (7 | ) | $ | (40 | ) | |
| 20% Adverse change | (12 | ) | (10 | ) | (12 | ) | (77 | ) | |||||
ESTIMATE OF CREDIT LOSSES(a) | 2.0 | % | 1.1 | % | 0.5 | % | 7.1 | % | |||||
| Effect of: | |||||||||||||
| 10% Adverse change | $ | (11 | ) | $ | (7 | ) | $ | (5 | ) | $ | (39 | ) | |
| 20% Adverse change | (22 | ) | (13 | ) | (9 | ) | (81 | ) | |||||
| Remaining weighted | |||||||||||||
| average lives (in months) | 27 | 51 | 15 | 7 | |||||||||
| Net credit losses | $ | 63 | $ | - | $ | 8 | $ | 588 | |||||
| Delinquencies | 93 | 5 | 59 | 374 | |||||||||
| (a) | Based on weighted averages. |
GE 2005 ANNUAL REPORT 102
NOTES TO CONSOLIDATED FINANCIAL STATEMENTS
GUARANTEE AND REIMBURSEMENT CONTRACTS. We provide protection to certain counterparties of interest rate swaps entered into by securitization-related entities related to changes in the relationship between commercial paper interest rates and the timing and amount of the payment streams. These arrangements provide protection for the life of the assets held by the securitization entities but generally amortize in proportion to the decline in underlying asset principal balances. At December 31, 2005, the notional amount of such support was $1,259 million and related assets and liabilities were insignificant.
Note 29
Commitments and Guarantees
Commitments, including guarantees
In our Aviation business of Infrastructure, we had committed to provide financial assistance on $2,269 million of future customer acquisitions of aircraft equipped with our engines, including commitments made to airlines in 2005 for future sales under our GE90 and GEnx engine campaigns. The Aviation Financial Services business of Infrastructure had placed multiple-year orders for various Boeing, Airbus and other aircraft with list prices approximating $10,595 million at December 31, 2005.
At December 31, 2005, we were committed under the following guarantee arrangements beyond those provided on behalf of securitization entities. See note 28.
• | LIQUIDITY SUPPORT. Liquidity support provided to holders of certain variable rate bonds issued by municipalities amounted to $2,510 million at December 31, 2005. If holders elect to sell supported bonds that cannot be remarketed, we are obligated to repurchase them at par. If called upon, our position would be secured by the repurchased bonds. While we hold any such bonds, we would receive interest payments from the municipalities at a rate that is in excess of the stated rate on the bond. To date, we have not been required to perform under such arrangements and our existing liquidity support will decrease $1,437 million in 2006 and the remaining $1,073 million by the end of 2008 as the underlying variable rate bonds reach their maturity date. We are currently not providing any such new liquidity facilities. |
• | CREDIT SUPPORT. We have provided $7,227 million of credit support on behalf of certain customers or associated companies, predominantly joint ventures and partnerships, using arrangements such as standby letters of credit and performance guarantees. These arrangements enable our customers and associated companies to execute transactions or obtain desired financing arrangements with third parties. Should the customer or associated company fail to perform under the terms of the transaction or financing arrangement, we would be required to perform on their behalf. Under most such arrangements, our guarantee is secured, usually by the asset being purchased or financed, but possibly by certain other assets of the customer or associated company. The length of these credit support arrangements parallels the length of the related financing arrangements or transactions. The liability for such credit support was $268 million at December 31, 2005. |
• | INDEMNIFICATION AGREEMENTS. These are agreements that require us to fund up to $711 million under residual value guarantees on a variety of leased equipment and $229 million of other indemnification commitments arising primarily from sales of businesses or assets. Under most of our residual value guarantees, our commitment is secured by the leased asset at termination of the lease. The liability for these indemnification agreements was $69 million at December 31, 2005. |
• | CONTINGENT CONSIDERATION. These are agreements to provide additional consideration in a business combination to the seller if contractually specified conditions related to the acquired entity are achieved. At December 31, 2005, we had recognized liabilities for estimated payments amounting to $27 million of our total exposure of $434 million. |
At year-end 2005, NBC Universal had $11,595 million of commitments to acquire film and broadcast material and the rights to broadcast television programs, including U.S. television rights to future Olympic Games and National Football League (NFL) games, contractual commitments under various creative talent arrangements and commitments under long-term television station affiliation agreements that require payments through 2014.
Our guarantees are provided in the ordinary course of business. We underwrite these guarantees considering economic, liquidity and credit risk of the counterparty. We believe that the likelihood is remote that any such arrangements could have a significant adverse effect on our financial position, results of operations or liquidity. We record liabilities for guarantees at estimated fair value, generally the amount of the premium received, or if we do not receive a premium, the amount based on appraisal, observed market values or discounted cash flows. Any associated recoveries from third parties are recorded as other receivables; not netted against the liabilities.
Product warranties
We provide for estimated product warranty expenses when we sell the related products. Because warranty estimates are forecasts that are based on the best available information-mostly historical claims experience-claims costs may differ from amounts provided. An analysis of changes in the liability for product warranties follows.
| (In millions) | 2005 | 2004 | 2003 | |||||||
| Balance at January 1 | $ | 1,326 | $ | 1,437 | $ | 1,304 | ||||
| Current year provisions | 448 | 720 | 751 | |||||||
Expenditures(a) | (699 | ) | (838 | ) | (749 | ) | ||||
| Other changes | - | 7 | 131 | |||||||
| Balance at December 31 | $ | 1,075 | $ | 1,326 | $ | 1,437 | ||||
| (a) | Primarily related to Infrastructure and Healthcare. |
GE 2005 ANNUAL REPORT 103
NOTES TO CONSOLIDATED FINANCIAL STATEMENTS
Note 30
Quarterly Information (Unaudited)
First quarter | Second quarter | Third quarter | Fourth quarter | ||||||||||||||||||||||
| (In millions; per-share amounts in dollars) | 2005 | 2004 | 2005 | 2004 | 2005 | 2004 | 2005 | 2004 | |||||||||||||||||
CONSOLIDATED OPERATIONS | |||||||||||||||||||||||||
| Earnings from continuing operations | $ | 3,562 | $ | 2,968 | $ | 4,372 | $ | 3,658 | $ | 4,569 | $ | 3,941 | $ | 5,772 | $ | 5,718 | |||||||||
| Earnings (loss) from | |||||||||||||||||||||||||
| discontinued operations | 403 | 398 | 275 | 93 | 108 | 130 | (2,708 | ) | (87 | ) | |||||||||||||||
| Net earnings | $ | 3,965 | $ | 3,366 | $ | 4,647 | $ | 3,751 | $ | 4,677 | $ | 4,071 | $ | 3,064 | $ | 5,631 | |||||||||
Per-share amounts-earnings from | |||||||||||||||||||||||||
| continuing operations | |||||||||||||||||||||||||
| Diluted earnings per share | $ | 0.33 | $ | 0.29 | $ | 0.41 | $ | 0.35 | $ | 0.43 | $ | 0.37 | $ | 0.55 | $ | 0.54 | |||||||||
| Basic earnings per share | 0.34 | 0.29 | 0.41 | 0.35 | 0.43 | 0.37 | 0.55 | 0.54 | |||||||||||||||||
Per-share amounts-earnings (loss) | |||||||||||||||||||||||||
| from discontinued operations | |||||||||||||||||||||||||
| Diluted earnings per share | 0.04 | 0.04 | 0.03 | 0.01 | 0.01 | 0.01 | (0.26 | ) | (0.01 | ) | |||||||||||||||
| Basic earnings per share | 0.04 | 0.04 | 0.03 | 0.01 | 0.01 | 0.01 | (0.26 | ) | (0.01 | ) | |||||||||||||||
Per-share amounts-net earnings | |||||||||||||||||||||||||
| Diluted earnings per share | 0.37 | 0.33 | 0.44 | 0.36 | 0.44 | 0.38 | 0.29 | 0.53 | |||||||||||||||||
| Basic earnings per share | 0.37 | 0.33 | 0.44 | 0.36 | 0.44 | 0.39 | 0.29 | 0.53 | |||||||||||||||||
SELECTED DATA | |||||||||||||||||||||||||
| GE | |||||||||||||||||||||||||
| Sales of goods and services | $ | 20,833 | $ | 16,680 | $ | 22,408 | $ | 19,995 | $ | 21,567 | $ | 20,967 | $ | 25,622 | $ | 24,572 | |||||||||
| Gross profit from sales | 5,824 | 4,467 | 6,358 | 5,503 | 5,978 | 5,648 | 7,455 | 7,229 | |||||||||||||||||
| GECS | |||||||||||||||||||||||||
| Total revenues | 14,227 | 11,994 | 14,375 | 12,749 | 15,570 | 13,030 | 15,125 | 15,121 | |||||||||||||||||
| Earnings from continuing operations | 1,865 | 1,573 | 2,024 | 1,430 | 2,577 | 2,123 | 2,675 | 2,727 | |||||||||||||||||
For GE, gross profit from sales is sales of goods and services less costs of goods and services sold.
Earnings-per-share amounts are computed independently each quarter for earnings from continuing operations, earnings from discontinued operations, and net earnings. As a result, the sum of each quarter’s per-share amount may not equal the total per-share amount for the respective year; and the sum of per-share amounts from continuing operations and discontinued operations may not equal the total per-share amounts for net earnings for the respective quarters.
GE 2005 ANNUAL REPORT 104
NOTES TO CONSOLIDATED FINANCIAL STATEMENTS
Our Businesses
A description of operating segments for General Electric Company and consolidated affiliates as of December 31, 2005, and the basis for presentation in this report, follows.
Infrastructure
Jet engines and replacement parts and repair and maintenance services for all categories of commercial aircraft; for a wide variety of military aircraft, including fighters, bombers, tankers and helicopters; and for executive and regional aircraft. Products and services are sold worldwide to airframe manufacturers, airlines and government agencies. Rail systems products and maintenance services including diesel electric locomotives, transit propulsion equipment, motorized wheels for off-highway vehicles, and railway signaling communications systems.
Financial products to airlines, aircraft operators, owners, lenders and investors including leases, aircraft purchasing and trading, loans, engine/spare parts financing, pilot training, fleet planning and financial advisory services.
Power plant products and services, including design, installation, operation and maintenance services sold into global markets. Gas, steam and aeroderivative turbines, generators, combined cycle systems, controls and related services, including total asset optimization solutions, equipment upgrades and contractual services, are sold to power generation and other industrial customers. Renewable energy solutions including wind turbines and hydro turbines and generators. Advanced turbomachinery products and related services for the oil and gas market, including total pipeline integrity solutions. Substation automation, network solutions and power equipment sold to power transmission and distribution customers. Also includes portable and rental power plants, nuclear reactors, fuel and nuclear support services.
Chemical water treatment program services and equipment including mobile treatment systems and desalination processes.
Financial products to the global energy industry including structured equity, leveraged leasing, partnerships, project finance and broad-based commercial finance.
Industrial
Major appliances and related services for products such as refrigerators, freezers, electric and gas ranges, cooktops, dish-washers, clothes washers and dryers, microwave ovens, room air conditioners and residential water system products. These products are distributed to both retail outlets and direct to consumers, mainly for the replacement market, and to building contractors and distributors for new installations. Lighting products include a wide variety of lamps and lighting fixtures. Electrical distribution and control equipment includes power delivery and control products such as transformers, meters and relays. Also includes GE Supply, a network of electrical supply houses. Products and services are sold in North America and in global markets under various GE and private-label brands.
High-performance engineered plastics used in a variety of applications such as automotive parts, computer enclosures, telecommunications equipment and construction materials. Products also include structured products, silicones and high-purity quartzware. Products and services are sold worldwide to a diverse customer base consisting mainly of manufacturers.
Rentals, leases, sales and asset management services of commercial and transportation equipment, including tractors, trailers, railroad rolling stock, modular space units, intermodal shipping containers and, primarily through an associated company, marine containers.
Measurement and sensing equipment (products and subsystems for sensing temperature, flow rates, humidity, pressure and detection of material defects); security equipment and systems (including card access systems, video and sensor monitoring equipment, integrated facility monitoring systems and explosive detection systems); a broad range of automation hardware and software. Markets are extremely diverse. Products and services are sold to commercial and industrial end-users, including utilities; original equipment manufacturers; electrical distributors; retail outlets; airports; railways; and transit authorities. Increasingly, products and services are developed for and sold in global markets.
Healthcare
Medical imaging systems such as magnetic resonance (MR) and computed tomography (CT) scanners, x-ray, nuclear imaging and ultrasound, as well as diagnostic cardiology and patient monitoring devices; related services, including equipment monitoring and repair, computerized data management and customer productivity services. Diagnostic imaging agents used in medical scanning procedures, protein separations products including chromotography purification systems used in the manufacture of biopharmaceuticals, and high-throughput systems for applications in genomics, proteomics and bioassays. Products and services are sold worldwide to hospitals, medical facilities, pharmaceutical and biotechnology companies and to the life science research market.
NBC Universal
Principal businesses are the furnishing of U.S. network television services to 230 affiliated stations, production of television programs, the production and distribution of motion pictures, operation of 30 VHF and UHF television broadcasting stations, operation of cable/satellite networks around the world, operation of theme parks, and investment and programming activities in multimedia and the Internet.
Commercial Finance
Loans, leases and other financial services to customers, including manufacturers, distributors and end-users for a variety of equipment and major capital assets. These assets include industrial-related facilities and equipment; commercial and residential real estate; vehicles; corporate aircraft; and equipment used in many industries, including the construction, manufacturing, telecommunications and healthcare industries.
Consumer Finance
Private-label credit cards; bank cards; Dual Cards™; corporate travel and purchasing cards; personal loans; auto loans; leases and inventory financing; residential mortgages; home equity loans; debt consolidation loans; current and savings accounts and insurance products for customers on a global basis.
GE 2005 ANNUAL REPORT 105
SUPPLEMENTAL INFORMATION
Financial Measures that Supplement Generally Accepted Accounting Principles
We sometimes use information derived from consolidated financial information but not presented in our financial statements prepared in accordance with U.S. generally accepted accounting principles (GAAP). Certain of these data are considered “non-GAAP financial measures” under U.S. Securities and Exchange Commission rules. Specifically, we have referred, in various sections of this Annual Report, to:
• | Organic revenue growth in 2005 |
• | Growth in Industrial cash from operating activities (CFOA) in 2005 |
• | GE pre-tax earnings from continuing operations before accounting changes excluding GECS earnings from continuing operations before accounting changes, and the corresponding effective tax rates, for the three years ended December 31, 2005 |
• | Delinquency rates on certain financing receivables of the Commercial Finance and Consumer Finance segments for 2005, 2004 and 2003 |
• | Average total shareowners’ equity, excluding effects of discontinued operations |
The reasons we use these non-GAAP financial measures and their reconciliation to their most directly comparable GAAP financial measures follow.
Organic Revenue Growth
| (In millions) | 2005 | 2004 | % change | |||||||
| GE consolidated revenues as reported | $ | 149,702 | $ | 134,481 | 11 | % | ||||
| Less the effects of: | ||||||||||
| Acquisitions, business dispositions (other | ||||||||||
| than dispositions of businesses acquired for | ||||||||||
| investment) and currency exchange rates | 10,561 | 4,526 | ||||||||
| The 2004 Olympics broadcasts | - | 927 | ||||||||
| The May 2005 SFAS 133 correction | - | 503 | ||||||||
| GE consolidated revenues excluding the effects | ||||||||||
| of acquisitions, business dispositions (other | ||||||||||
| than dispositions of businesses acquired for | ||||||||||
| investment), currency exchange rates, the 2004 | ||||||||||
| Olympics broadcasts and the May 2005 | ||||||||||
| SFAS 133 correction (organic revenues) | $ | 139,141 | $ | 128,525 | 8 | % | ||||
Growth in Industrial CFOA
| (In millions) | 2005 | 2004 | % change | |||||||
| Cash from GE’s operating activities as reported | $ | 21,609 | $ | 15,204 | 42 | % | ||||
| Less GECS dividends | 7,816 | 3,105 | ||||||||
| Cash from GE’s operating activities excluding | ||||||||||
| dividends from GECS (Industrial CFOA) | $ | 13,793 | $ | 12,099 | 14 | % | ||||
GE Tax Rate, Excluding GECS Earnings
| (In millions) | 2005 | 2004 | 2003 | |||||||
| GE earnings from continuing operations before | ||||||||||
| income taxes, and accounting changes | $ | 21,025 | $ | 18,258 | $ | 16,623 | ||||
| Less GECS earnings from continuing operations | ||||||||||
| before accounting changes | 9,141 | 7,853 | 5,931 | |||||||
| Total | $ | 11,884 | $ | 10,405 | $ | 10,692 | ||||
| GE provision for income taxes | $ | 2,750 | $ | 1,973 | $ | 2,857 | ||||
| GE effective tax rate, excluding GECS earnings | 23.1 | % | 19.0 | % | 26.7 | % | ||||
We believe that meaningful analysis of our financial performance requires an understanding of the factors underlying that performance and our judgments about the likelihood that particular factors will repeat. In some cases, short-term patterns and long-term trends may be obscured by large factors or events. For example, events or trends in a particular segment may be so significant as to obscure patterns and trends of our industrial or financial services businesses in total. For this reason, we believe that investors may find it useful to see our 2005 revenue growth without the effect of acquisitions, dispositions and currency exchange rates, and without the effects of the 2004 Olympics broadcasts and the May 2005 SFAS 133 correction which effects have no counterpart in 2005, and if included would overshadow trends in ongoing revenues. Similarly, we believe that investors would find it useful to compare our 2005 operating cash flow against our 2004 operating cash flow without the impact of GECS dividends.
Delinquency Rates on Certain Financing Receivables
Delinquency rates on managed Commercial Finance equipment loans and leases and managed Consumer Finance financing receivables follow.
COMMERCIAL FINANCE
| December 31 | 2005 | 2004 | 2003 | |||||||
| Managed | 1.31 | % | 1.40 | % | 1.38 | % | ||||
| Off-book | 0.76 | 0.90 | 1.27 | |||||||
| On-book | 1.53 | 1.58 | 1.41 | |||||||
CONSUMER FINANCE
| December 31 | 2005 | 2004 | 2003 | |||||||
| Managed | 5.08 | % | 4.85 | % | 5.62 | % | ||||
| Off-book | 5.28 | 5.09 | 5.04 | |||||||
| On-book | 5.07 | 4.84 | 5.67 | |||||||
We believe that delinquency rates on managed financing receivables provide a useful perspective on our on and off-book portfolio quality and are key indicators of financial performance.
GE 2005 ANNUAL REPORT 106
SUPPLEMENTAL INFORMATION
Average Total Shareowners’ Equity, Excluding Effects of Discontinued Operations(a)
| December 31 (In millions) | 2005 | 2004 | 2003 | 2002 | 2001 | |||||||||||
Average total shareowners’ equity(b) | $ | 111,683 | $ | 95,656 | $ | 71,336 | $ | 59,174 | $ | 52,674 | ||||||
| Less: | ||||||||||||||||
| Cumulative effect of losses from | ||||||||||||||||
discontinued operations(c) | 3,094 | 2,980 | 925 | 1,007 | 226 | |||||||||||
| Average net investment in discontinued | ||||||||||||||||
operations(d) | 4,620 | -- | - | - | - | |||||||||||
| Average total shareowners’ equity, | ||||||||||||||||
excluding effects of discontinued operations(a) | $ | 103,969 | $ | 92,676 | $ | 70,411 | $ | 58,167 | $ | 52,448 | ||||||
| (a) | Used for computing return on average shareowners’ equity and return on average total capital invested shown on page 61. |
| (b) | On an annual basis, calculated using a five-point average. |
| (c) | Represented the average cumulative net earnings effects of discontinued operations from 2001 to 2005 (on an annual basis, calculated using a five-point average). |
| (d) | Represented the average net investment in discontinued operations for the second half of 2005 only-see below. |
U.S. GAAP requires earnings of discontinued operations to be displayed separately in the Statement of Earnings. Accordingly, the numerators used in our calculations of returns on average shareowners’ equity and average total capital invested presented in Selected Financial Data on page 61 exclude those earnings (losses). Further we believe it is appropriate to exclude from the denominators, specifically the average total shareowners’ equity component, the cumulative effect of those earnings (losses) since 2000 for each of the five years for which such returns are presented, as well as our average net investment in discontinued operations for the second half of 2005 only. Had we disposed of these operations before mid-2005, proceeds would have been applied to reduce parent-supported debt at GE Capital; however since parent-supported debt at GE Capital was retired in the first half of 2005, we have assumed that any proceeds after that time would have been distributed to shareowners by means of share repurchases, thus reducing average total shareowners’ equity.
Definitions indicating how the above-named ratios are calculated using average total shareowners’ equity, excluding effects of discontinued operations, can be found in the Glossary.
GE 2005 ANNUAL REPORT 107
GLOSSARY
BACKLOG Unfilled customer orders for products and product services (12 months for product services).
BORROWING Financial liability (short or long-term) that obligates us to repay cash or another financial asset to another entity.
BORROWINGS AS A PERCENTAGE OF TOTAL CAPITAL INVESTED For GE, the sum of borrowings and mandatorily redeemable preferred stock, divided by the sum of borrowings, mandatorily redeemable preferred stock, minority interest and total shareowners’ equity.
CASH EQUIVALENTS Highly liquid debt instruments with original maturities of less than three months, such as commercial paper. Typically included with cash for reporting purposes, unless designated as available-for-sale and included with investment securities.
CASH FLOW HEDGES Qualifying derivative instruments that we use to protect ourselves against exposure to volatility in future cash flows. The exposure may be associated with an existing asset or liability, or with a forecasted transaction. See “Hedge.”
COMMERCIAL PAPER Unsecured, unregistered promise to repay borrowed funds in a specified period ranging from overnight to 270 days.
CUSTOMER SERVICE AGREEMENTS (also referred to as “product services agreements”) Contractual commitments, with multiple-year terms, to provide specified services for products in our industrial installed base-for example, monitoring, maintenance, overhaul and spare parts for a gas turbine/generator set installed in a customer’s power plant.
DERIVATIVE INSTRUMENT A financial instrument or contract with another party (counterparty) that is structured to meet any of a variety of financial objectives, including those related to fluctuations in interest rates, currency exchange rates or commodity prices. Options, forwards and swaps are the most common derivative instruments we employ. See “Hedge.”
DISCONTINUED OPERATIONS Certain businesses we have sold or committed to sell within the next year and which will no longer be part of our ongoing operations. The net earnings, assets and liabilities and cash flows of such businesses are separately classified on our Statement of Earnings, Statement of Financial Position and Statement of Cash Flows, respectively for all periods presented.
EARNED PREMIUMS Portion of the premium, net of any amount ceded, pertaining to the segment of the policy period for which insurance coverage has been provided.
EFFECTIVE TAX RATE Provision for income taxes as a percentage of earnings from continuing operations before income taxes and accounting changes. Does not represent cash paid for income taxes in the current accounting period. Also referred to as “actual tax rate” or “tax rate.”
EQUIPMENT LEASED TO OTHERS Rental equipment we own that is available to rent and is stated at cost less accumulated depreciation.
FAIR VALUE HEDGE Qualifying derivative instruments that we use to reduce the risk of changes in the fair value of assets, liabilities or certain types of firm commitments. Changes in the fair values of derivative instruments that are designated and effective as fair value hedges are recorded in earnings, but are offset by corresponding changes in the fair values of the hedged items. See “Hedge.”
FINANCIAL LEVERAGE The relationship of debt to equity. Expressed for financial services businesses as borrowings divided by equity. Expressed for industrial businesses as borrowings divided by total capital.
FINANCING RECEIVABLES Investment in contractual loans and leases due from customers (not investment securities).
FORWARD CONTRACT Fixed price contract for purchase or sale of a specified quantity of a commodity, security, currency or other financial instrument with delivery and settlement at a specified future date. Commonly used as a hedging tool. See “Hedge.”
GOODWILL The premium paid for acquisition of a business. Calculated as the purchase price less the fair value of net assets acquired (net assets are identified tangible and intangible assets, less liabilities assumed).
GUARANTEED INVESTMENT CONTRACTS (GICS) Deposit-type products that guarantee a minimum rate of return, which may be fixed or floating.
HEDGE A technique designed to eliminate risk. Often refers to the use of derivative financial instruments to offset changes in interest rates, currency exchange rates or commodity prices, although many business positions are “naturally hedged”-for example, funding a U.S. fixed-rate investment with U.S. fixed-rate borrowings is a natural interest rate hedge.
INTANGIBLE ASSET A non-financial asset lacking physical substance, such as goodwill, patents, trademarks and licenses.
INTEREST RATE SWAP Agreement under which two counterparties agree to exchange one type of interest rate cash flow for another. In a typical arrangement, one party periodically will pay a fixed amount of interest, in exchange for which that party will receive variable payments computed using a published index. See “Hedge.”
INVESTMENT SECURITIES Generally, an instrument that provides an ownership position in a corporation (a stock), a creditor relationship with a corporation or governmental body (a bond), or rights to ownership such as those represented by options, subscription rights and subscription warrants.
MANAGED RECEIVABLES Total receivable amounts on which we continue to perform billing and collection activities, including receivables that have been sold with and without credit recourse and are no longer reported on our balance sheet.
MATCH FUNDING A risk control policy that provides funds for a particular financial asset having the same currency, maturity and interest rate characteristics as that asset. Match funding ensures that we maintain initial financing spreads or margins for the life of a financial asset, and is executed directly, by issuing debt, or synthetically, through a combination of debt and derivative financial instruments. For example, when we lend at a fixed interest rate in the U.S., we can borrow those U.S. dollars either at a fixed rate of interest or at a floating rate executed concurrently with a pay-fixed interest rate swap. See “Hedge.”
MONETIZATION Sale of financial assets to a third party for cash. For example, we sell certain loans, credit card receivables and trade receivables to third-party financial buyers, typically providing at least some credit protection and often agreeing to provide collection and processing services for a fee. Monetization normally results in gains on interest-bearing assets and losses on non-interest bearing assets. See “Securitization” and “Variable Interest Entity.”
GE 2005 ANNUAL REPORT 108
GLOSSARY
OPERATING PROFIT GE earnings from continuing operations before interest and other financial charges, income taxes and effects of accounting changes.
OPTION The right, not the obligation, to execute a transaction at a designated price, generally involving equity interests, interest rates, currencies or commodities. See “Hedge.”
PREMIUM Rate that is charged under insurance/reinsurance contracts.
PRODUCT SERVICES For purposes of the financial statement display of sales and costs of sales in our Statement of Earnings, “goods” is required by U.S. Securities and Exchange Commission regulations to include all sales of tangible products, and “services” must include all other sales, including broadcasting and other services activities. In our Management’s Discussion and Analysis of Operations we refer to sales of both spare parts (goods) and related services as sales of “product services,” which is an important part of our operations.
PRODUCT SERVICES AGREEMENTS See “Customer Service Agreements.”
PRODUCTIVITY The rate of increased output for a given level of input, with both output and input measured in constant currency. A decline in output for a given level of input is “negative” productivity.
PROGRESS COLLECTIONS Payments received from customers as deposits before the associated work is performed or product is delivered.
REINSURANCE A form of insurance that insurance companies buy for their own protection.
RETAINED INTEREST A portion of a transferred financial asset retained by the transferor that provides rights to receive portions of the cash inflows from that asset.
RETURN ON AVERAGE SHAREOWNERS’ EQUITY Earnings from continuing operations before accounting changes divided by average total shareowners’ equity, excluding effects of discontinued operations (on an annual basis, calculated using a five-point average). Average total shareowners’ equity, excluding effects of discontinued operations, as of the end of each of the years in the five-year period ended December 31, 2005, is described in the Supplemental Information section.
RETURN ON AVERAGE TOTAL CAPITAL INVESTED For GE, earnings from continuing operations before accounting changes plus the sum of after-tax interest and other financial charges and minority interest, divided by the sum of the averages of total shareowners’ equity (excluding effects of discontinued operations), borrowings, mandatorily redeemable preferred stock and minority interest (on an annual basis, calculated using a five-point average). Average total shareowners’ equity, excluding effects of discontinued operations as of the end of each of the years in the five-year period ended December 31, 2005, is described in the Supplemental Information section.
SECURITIZATION A process whereby loans or other receivables are packaged, underwritten and sold to investors. In a typical transaction, assets are sold to a special purpose entity (SPE), which purchases the assets with cash raised through issuance of beneficial interests (usually debt instruments) to third-party investors. Whether or not credit risk associated with the securitized assets is retained by the seller depends on the structure of the securitization. See “Monetization” and “Variable Interest Entity.”
TURNOVER Broadly based on the number of times that working capital is replaced during a year. Accounts receivable turnover is total sales divided by the five-point average balance of customer receivables from sales of goods and services (trade receivables). Inventory turnover is total sales divided by a five-point average balance of inventories. See “Working Capital.”
UNEARNED PREMIUMS Portion of the premium received, net of any amount ceded, that relates to future coverage periods.
UNPAID CLAIMS AND CLAIMS ADJUSTMENT EXPENSES Claims reserves for events that have occurred, including both reported and incurred-but-not-reported (IBNR) reserves, and the expenses of settling such claims.
VARIABLE INTEREST ENTITY Entity defined by Financial Accounting Standards Board Interpretation No. 46 (as amended), and that must be consolidated by its primary beneficiary. A variable interest entity has one or both of the following characteristics: (1) its equity at risk is not sufficient to permit the entity to finance its activities without additional subordinated financial support from other parties, or (2) as a group, the equity investors lack one or more of the following characteristics: (a) direct/indirect ability to make decisions, (b) obligation to absorb expected losses, or (c) right to receive expected residual returns.
WORKING CAPITAL Sum of receivables from the sales of goods and services, plus inventories, less trade accounts payables and progress collections.
GE 2005 ANNUAL REPORT 109