Exhibit 99(b)
Certain sections of Management’s Discussion and Analysis of Results of Operations of the 2003 Form 10-K and notes 10, 12, 13, 16 and 27, of the audited consolidated financial statements of GE for the fiscal year ended December 31, 2003, all conformed to reflect the January 1, 2004, organizational changes.
MANAGEMENT’S DISCUSSION AND ANALYSIS
OPERATIONS
Our consolidated financial statements combine the industrial manufacturing and product services businesses of General Electric Company (GE) and the financial services businesses of General Electric Capital Services, Inc. (GECS or financial services).
We present Management’s Discussion of Operations in three parts: Overview of Our Earnings from 2001 through 2003, Segment Operations and International Operations.
In the accompanying analysis of financial information, we sometimes refer to data derived from consolidated financial information but not required by U.S. generally accepted accounting principles (GAAP) to be presented in financial statements. Certain of these data are considered “non-GAAP financial measures” under the U.S. Securities and Exchange Commission (SEC) regulations; those rules require the supplemental explanation and reconciliation provided on page 68 of exhibit 99(d).
ON JANUARY 1, 2004, WE SIMPLIFIED OUR ORGANIZATION. With 11 operating segments, we will achieve lower costs of operations in platforms that will accommodate our future growth. The new segments most affected by this change follow:
| • | Advanced Materials—plastics, silicones and quartz |
| • | Infrastructure—water, security, sensors and Fanuc Automation |
| • | Transportation—aircraft engines, rail and certain parts of GE Supply |
| • | Consumer and Industrial—appliances, lighting and industrial |
| • | Commercial Finance—the combination of Commercial Finance and the Fleet Services business that was previously part of Equipment Management |
| • | Equipment & Other Services—the combination of Equipment Management (excluding Fleet Services) and All Other GECS segments |
Results in this financial section have been reclassified on the basis of that January 1, 2004, reorganization.
During 2003, we entered into an agreement to acquire U.K.-based Amersham plc, a world leader in medical diagnostics and life sciences. We also entered into an agreement to merge NBC with Vivendi Universal Entertainment to create one of the world’s premier media companies, NBC Universal.
We announced in November 2003 our intent for an initial public offering (IPO) of a new company, Genworth Financial, Inc. (Genworth), comprising most of our life and mortgage insurance businesses. We plan to sell approximately one-third of Genworth’s equity in the IPO, and we expect (subject to market conditions) to reduce our ownership over the next three years as Genworth transitions to full independence. We commenced the IPO process in January 2004 and expect to complete the IPO in the first half of the year, subject to market conditions and receipt of various regulatory approvals.
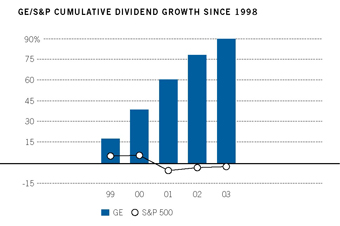
WE DECLARED $7.8 BILLION IN DIVIDENDS IN 2003. Per-share dividends of $0.77 were up 5% from 2002, following an 11% increase from the preceding year. We have rewarded our shareowners with 28 consecutive years of dividend growth. Our dividend growth for the past five years has significantly outpaced dividend growth of companies in the Standard & Poor’s 500 stock index.
Except as otherwise noted, the analysis in the remainder of this section presents the results of GE (with GECS included on a one-line basis) and GECS. See the Segment Operations section on page 49 of exhibit 99(d) for a more detailed discussion of the businesses within GE and GECS.
Overview of Our Earnings from 2001 through 2003
The global economic environment must be considered when evaluating our 2001 to 2003 results. Important factors for us included slow global economic growth, a mild U.S. recession that did not cause significantly higher credit losses, lower global interest rates, distinct developments in three industries that are significant to us (power generation, property and casualty insurance and commercial aviation), and escalating raw material prices. As you will see in detail in the following pages, our diversification and risk management strategies reduced the earnings effects of many of the significant developments of the last three years.
If, for comparison, we adjust 2001 results for the required accounting change to stop goodwill amortization, our earnings would have increased modestly in percentage terms over this three-year period. This modest increase results from a combination of factors, both positive and negative.
First, consider two businesses whose results were noteworthy.
| • | Energy is significant to our consolidated results, at 16% and 21% of three-year revenues and earnings before accounting changes, respectively. Energy was significantly affected by the unprecedented industry dynamics sometimes referred to as the “U.S. power bubble,” a phenomenon that dramatically increased demand for power generation equipment, peaking during 2002. Energy continued shipping large numbers of |
gas turbine units in 2002, reaching $0.09 per share growth in earnings—up 29% from 2001. (Note that per-share results we present in this discussion are on a diluted basis.) The subsequent 2003 decline in shipments was reflected in the $0.14 per share drop in 2003 earnings. We foresaw the 2002 end of the “bubble” and took appropriate action to cushion the downturn, right-sizing the business and growing and investing in other lines of the power generation business such as product services and GE Wind. The result is an Energy business whose results are remarkable from any perspective save its own extraordinary recent history.

| • | At Employers Reinsurance Corporation (ERC), we, like most of the reinsurance industry, faced volatility throughout the period. We are now confident we have worked through our historical underwriting mistakes. But in 2002 we recognized losses on our 1997-2001 business, increasing loss reserves by $3.5 billion, resulting in a loss of $0.18 per share in 2002, a decline of $0.19 per share from 2001. In 2003, our turnaround efforts started to pay off. We realized benefits from improved ERC operations and ERC earnings rebounded by $0.23 per share to a profit of $0.05 per share. |
Most of our operations achieved operating results in line with expectations in the 2001 to 2003 economic environment.
| • | Commercial and Consumer Finance at 23% and 34% of consolidated three-year revenues and earnings before accounting changes, respectively, are large, profitable growth businesses in which we continue to invest with confidence. In a challenging economic environment, these businesses grew earnings by $0.09 per share in 2003 and $0.06 per share in 2002. Solid core growth, disciplined risk management and successful acquisitions have delivered these strong results. |
| • | Transportation continued to invest in market-leading technology and services. While our commercial aviation and rail customers were sometimes understandably reluctant to buy new equipment in these markets, our business model also succeeds by diversification. Product services and the military engines business continued strong, and overall this segment grew 6%, or $0.01 per share, in 2003, following a slight decline in 2002. |
| • | NBC and Healthcare contributed strong performances in their distinct markets. NBC’s leadership in key demographics yielded higher pricing on strong demand from advertisers. Healthcare continued to invest in new products and sustained its product leadership position, with strong double-digit growth in Healthcare IT and Ultrasound. The successful acquisitions of Bravo and Instrumentarium also provided growth, and Telemundo improved to a promising position entering 2004. Earnings from these segments increased $0.03 per share in 2003 following a $0.02 per share increase in 2002. |
| • | Infrastructure, with its new growth platforms such as security and water treatment, grew significantly through acquisitions. We continue to foresee dramatic growth in these platforms. |
| • | Advanced Materials, Equipment & Other Services, and Consumer & Industrial are economically sensitive and consequently were affected adversely by the U.S. recession and by slow global growth in developed countries. Even in the difficult environments they faced, these businesses continued to succeed in their primary role in GE, to generate cash. Higher capacity, in combination with declining or weak volume growth in many of these industries, resulted in fierce competitive price pressures. Advanced Materials was hit particularly hard because of additional pressures from inflation in certain raw materials such as benzene and natural gas. Earnings from this group of businesses as a whole declined by $0.09 per share over this period with Advanced Materials down $0.03 per share in 2003 and $0.03 per share in 2002. |
Other factors that were important to our recent earnings performance included reduced earnings from our principal postretirement benefit plans (down $0.05 per share in 2003 following a decline of $0.04 per share in 2002) and unusual events in 2002 such as the gains on the sale of Global eXchange Services ($0.03 per share) and the Bravo exchange net of restructuring ($0.03 per share), as well as favorable tax settlements with the U.S. Internal Revenue Service (IRS) in 2002 ($0.07 per share).
Acquisitions affected our operations and contributed $5.4 billion, $7.2 billion and $3.5 billion, respectively, to consolidated revenues in each of the last three years. Our consolidated net earnings in 2003, 2002 and 2001 included approximately $0.5 billion, $0.6 billion and $0.2 billion, respectively, from acquired businesses. We integrate acquisitions as quickly as possible and only revenues and earnings during the first 12 months following the quarter in which we complete the acquisition are attributed to such businesses.
Significant matters in our Statement of Earnings, pages 70 and 71 of exhibit 99(d), are explained below.
OPERATING MARGINis sales of goods and services less the costs of goods and services sold, as well as selling, general and administrative expenses. GE operating margin was 15.9% of sales in 2003, down from 19.1% in 2002 and 19.6% in 2001. The decrease in 2003 was attributable to lower operating margins at Energy and Advanced Materials. The decline in 2002 was attributable to Advanced Materials and Consumer & Industrial, and also reflected $0.6 billion of restructuring and other charges, partially offset by improvements in operating margins at Energy, NBC and Infrastructure. Restructuring and other charges in 2002 included $0.4 billion for rationalizing certain operations and facilities of GE’s worldwide industrial businesses.
Sales of product services were $22.9 billion in 2003, a 10% increase over 2002. Increases in product services in 2003 and 2002 were widespread, led by continued strong growth at Energy, Infrastructure and Healthcare. Operating margin from product services was approximately $5.3 billion, compared with $5.2 billion in 2002. The increase reflected improvements at Energy and Infrastructure.
TOTAL COST PRODUCTIVITY(sales in relation to costs, both on a constant dollar basis) for GE was negative 1.3% in 2003 on declining volume at Energy and Advanced Materials. In 2002 total cost productivity was 0.7% on variable cost productivity improvements partially offset by lower base cost productivity, primarily at Energy and Infrastructure.
PRINCIPAL POSTRETIREMENT BENEFIT PLANS contributed modestly to pre-tax earnings in 2003, compared with $0.8 billion and $1.5 billion in 2002 and 2001, respectively. Benefit costs relating to these plans increased in 2003 primarily because of a reduction in the pension discount rate for the year from 7.25% to 6.75% (which increased the pension obligation), amortization of prior years’ investment losses, plan benefit changes resulting from union negotiations and increases in retiree medical and drug costs.
Considering current and expected asset allocations, as well as historical and expected returns on various categories of assets in which our plans are invested, we assumed that long-term returns on our pension plan assets would be 8.5% in 2003 and 2002 and 9.5% in 2001. Reducing the assumed return by 100 basis points in 2002 increased annual pension costs by about $480 million pretax. Actual annual investment returns are extremely volatile. Because this short-term market volatility occurs in context of the long-term nature of pension plans, U.S. accounting principles provide that differences between assumed and actual returns are recognized over the average future service of employees. See notes 5 and 6 for additional information about funding status, components of earnings effects and actuarial assumptions of the plans. See page 68 of exhibit 99(d) for discussion of pension assumptions.
We believe our postretirement benefit costs will increase in 2004 for a number of reasons, including a further reduction in the pension discount rate from 6.75% to 6.0%, additional amortization of investment losses, plan benefit changes as a result of union negotiations and continued increases in retiree healthcare costs. We continue to expect that our plan assets will earn 8.5%, on average, over the long term.
We will not make any contributions to the GE Pension Plan in 2004. To the best of our ability to forecast the next five years, we do not anticipate making contributions to that Plan so long as expected investment returns are achieved. The present funding status provides assurance of benefits for our participants, but future effects on operating results and funding depend on economic conditions and investment performance.
GE INTEREST AND OTHER FINANCIAL CHARGES amounted to $0.9 billion, $0.6 billion and $0.8 billion in 2003, 2002 and 2001, respectively. Interest costs in 2003 were higher as a result of our issuing $5.0 billion of long-term bonds in the first quarter of the year and higher average short-term borrowings, partially offset by lower average interest rates. The decrease in 2002 was primarily the result of reduced interest on lower tax liabilities following the 2002 settlements described on page 47 of exhibit 99(d).
GECS INTEREST EXPENSE ON BORROWINGS was $9.9 billion in 2003 and 2002, compared with $10.6 billion in 2001. Changes over the three-year period reflected the effects of lower interest rates, partially offset by the effects of higher average borrowings of $279.7 billion, $250.1 billion and $212.2 billion in 2003, 2002 and 2001, respectively, used to finance asset growth and acquisitions. The average composite effective interest rate was 3.5% in 2003, compared with 4.1% in 2002 and 5.1% in 2001. In 2003, average assets of $521.6 billion were 15% higher than in 2002, which in turn were 18% higher than in 2001. See page 59 of exhibit 99(d) for a discussion of interest rate risk management.
INCOME TAXESon consolidated earnings before accounting changes were 21.7%, compared with 19.9% in 2002 and 28.3% in 2001. Our consolidated income tax rate increased in 2003 by 1.8 percentage points over 2002 because our savings from 2003 business dispositions were less than our 2002 savings from settlements with the IRS. Income tax rates were lower than they otherwise would have been in both 2003 and 2002 because of the increasing share of earnings from lower taxed international operations. A more detailed analysis of differences between the U.S. federal statutory rate and the consolidated rate, as well as other information about our income tax provisions, is provided in note 7. The nature of business activities and associated income taxes differ for GE and for GECS, and a separate analysis of each is presented in the paragraphs that follow.
Because GE tax expense does not include taxes on GECS earnings, the GE effective tax rate is best analyzed in relation to GE earnings excluding GECS. In 2003, 2002 and 2001, respectively, GE’s pre-tax earnings excluding GECS were $10.7 billion, $14.3 billion and $12.7 billion. On this basis, GE’s effective tax rate was 26.7% in 2003 and 2002, and 32.9% in 2001. The 2003 GE rate was reduced by approximately 1.7 percentage points because certain reductions in pre-tax earnings—specifically, lower earnings at Energy and from our principal pension plans—affected taxes at higher than our average rate. The 2003 GE rate was also reduced by approximately 1.0 percentage point (after adjusting for the effect of the lower pre-tax income at Energy and our principal pension plans) from a tax benefit on the disposition of shares of GE Superabrasives U.S., Inc., included in the line, “All other—net” in note 7. In 2002, GE entered into settlements with the IRS concerning certain export tax benefits. The effect of the settlements, the tax portion of which is included on the line “Tax on international activities including exports” in note 7, was a reduction of the GE tax rate of approximately 2.7 percentage points. Also in 2002, GE entered into a tax-advantaged transaction to exchange certain assets for the cable network Bravo. The related reduction of approximately 1.0 percentage point in the GE effective tax rate is reflected in the line, “All other—net” in note 7.
GECS effective tax rate was 15.8% in 2003, negative 1.7% in 2002 and 19.8% in 2001. The increase from 2002 to 2003 reflected the absence of a current year counterpart to the 2002 pre-tax loss at ERC and the IRS settlements discussed below, as well as lower pre-tax losses at GE Equity, partially offset by an approximately three percentage point decrease due to the 2003 pre-tax loss and tax benefit on the disposition of shares of ERC Life Reinsurance Corporation (ERC Life), included in the line “All other—net” in note 7.
GECS 2002 effective tax rate reflected pre-tax losses at ERC and GE Equity, the effects of lower taxed earnings from international operations and favorable tax settlements with the IRS. Pre-tax losses of $2.9 billion at ERC and $0.6 billion at GE Equity reduced the effective tax rate of GECS by approximately 17 percentage points.
During 2002, as a result of revised IRS regulations, GECS reached a settlement with the IRS allowing the deduction of previously realized losses associated with the prior disposition of Kidder Peabody. Also during 2002, we reached a settlement with the IRS regarding the treatment of certain reserves for obligations to policyholders on life insurance contracts in Insurance. The benefits of these settlements, which reduced the GECS tax rate approximately four percentage points (excluding the ERC and GE Equity losses), are included in the line “All other—net” in note 7.
SUMMARY OF OPERATING SEGMENTS
| General Electric Company and consolidated affiliates | ||||||||||||||||||||
For the years ended December 31 (In millions) | 2003 | 2002 | 2001 | 2000 | 1999 | |||||||||||||||
REVENUES | ||||||||||||||||||||
Advanced Materials | $ | 7,078 | $ | 6,963 | $ | 7,069 | $ | 8,020 | $ | 7,118 | ||||||||||
Commercial Finance | 20,813 | 19,592 | 17,723 | 17,549 | 14,506 | |||||||||||||||
Consumer Finance | 12,845 | 10,266 | 9,508 | 9,320 | 7,562 | |||||||||||||||
Consumer & Industrial | 12,843 | 12,887 | 13,063 | 13,406 | 13,051 | |||||||||||||||
Energy | 19,082 | 23,633 | 21,030 | 15,703 | 10,998 | |||||||||||||||
Equipment & Other Services | 4,427 | 5,545 | 7,735 | 15,074 | 14,768 | |||||||||||||||
Healthcare | 10,198 | 8,955 | 8,409 | 7,275 | 6,171 | |||||||||||||||
Infrastructure | 3,078 | 1,901 | 392 | 486 | 421 | |||||||||||||||
Insurance | 26,194 | 23,296 | 23,890 | 24,766 | 19,433 | |||||||||||||||
NBC | 6,871 | 7,149 | 5,769 | 6,797 | 5,790 | |||||||||||||||
Transportation | 13,515 | 13,685 | 13,885 | 13,285 | 13,293 | |||||||||||||||
Corporate items and eliminations | (2,757 | ) | (1,662 | ) | (2,057 | ) | (1,296 | ) | (961 | ) | ||||||||||
CONSOLIDATED REVENUES | $ | 134,187 | $ | 132,210 | $ | 126,416 | $ | 130,385 | $ | 112,150 | ||||||||||
SEGMENT PROFIT | ||||||||||||||||||||
Advanced Materials | $ | 616 | $ | 1,000 | $ | 1,433 | $ | 1,864 | $ | 1,588 | ||||||||||
Commercial Finance | 3,910 | 3,310 | 2,879 | 2,528 | 1,940 | |||||||||||||||
Consumer Finance | 2,161 | 1,799 | 1,602 | 1,295 | 848 | |||||||||||||||
Consumer & Industrial | 577 | 567 | 894 | 1,966 | 1,330 | |||||||||||||||
Energy | 4,109 | 6,294 | 4,897 | 2,598 | 1,583 | |||||||||||||||
Equipment & Other Services | (419 | ) | (388 | ) | (222 | ) | (212 | ) | 25 | |||||||||||
Healthcare | 1,701 | 1,546 | 1,498 | 1,321 | 1,107 | |||||||||||||||
Infrastructure | 462 | 297 | 26 | 45 | 63 | |||||||||||||||
Insurance | 2,102 | (95 | ) | 1,879 | 2,201 | 2,142 | ||||||||||||||
NBC | 1,998 | 1,658 | 1,408 | 1,609 | 1,427 | |||||||||||||||
Transportation | 2,661 | 2,510 | 2,577 | 2,511 | 2,233 | |||||||||||||||
Total segment profit | 19,878 | 18,498 | 18,871 | 17,726 | 14,286 | |||||||||||||||
GECS goodwill amortization | — | — | (552 | ) | (620 | ) | (512 | ) | ||||||||||||
GE corporate items and eliminations | (491 | ) | 1,041 | 819 | 239 | 960 | ||||||||||||||
GE interest and other financial charges | (941 | ) | (569 | ) | (817 | ) | (811 | ) | (810 | ) | ||||||||||
GE provision for income taxes | (2,857 | ) | (3,837 | ) | (4,193 | ) | (3,799 | ) | (3,207 | ) | ||||||||||
Earnings before accounting changes | 15,589 | 15,133 | 14,128 | 12,735 | 10,717 | |||||||||||||||
Cumulative effect of accounting changes | (587 | ) | (1,015 | ) | (444 | ) | — | — | ||||||||||||
CONSOLIDATED NET EARNINGS | $ | 15,002 | $ | 14,118 | $ | 13,684 | $ | 12,735 | $ | 10,717 | ||||||||||
The notes to consolidated financial statements on pages 76-113 of exhibit 99(d) are an integral part of this summary.
Segment Operations
REVENUES AND SEGMENT PROFIT FOR OPERATING SEGMENTS are shown on page 48 of exhibit 99(d). As discussed in our 2003 Annual Report, effective January 1, 2004, and January 1, 2003, we made changes to the way we report our segments. Information in this report reflects those changes. For additional information, including a description of the products and services included in each segment, see pages 112 and 113 of exhibit 99(d).
Segment profit is determined based on internal performance measures used by the Chief Executive Officer to assess the performance of each business in a given period. In connection with that assessment, the Chief Executive Officer may exclude matters such as charges for restructuring; rationalization and other similar expenses; certain gains/losses from dispositions; and litigation settlements or other charges, responsibility for which precedes the current management team.
Segment profit always excludes goodwill amortization, the effects of principal pension plans and accounting changes. Segment profit excludes or includes interest and other financial charges and segment income taxes according to how a particular segment management is measured—excluded in determining operating profit for Advanced Materials, Consumer & Industrial, Energy, Healthcare, Infrastructure, NBC and Transportation; included in determining segment profit which we refer to as “segment net earnings” for Commercial Finance, Consumer Finance, Equipment & Other Services and Insurance.
ADVANCED MATERIALSrevenues in 2003 were up 2% at $7.1 billion as the effects of the weaker U.S. dollar ($0.3 billion) and the OSi acquisition ($0.1 billion) offset lower volume ($0.2 billion). Operating profit of $0.6 billion was 38% lower than in 2002 reflecting higher material costs ($0.2 billion), primarily benzene, and lower productivity ($0.2 billion), partially offset by effects of dispositions and the OSi acquisition. Advanced Materials revenues of $7.0 billion in 2002 were down 2% from 2001 levels, as weakness in pricing ($0.6 billion) offset increased volume ($0.4 billion). Operating profit declined 30% in 2002 to $1.0 billion as productivity and higher volume were not sufficient to offset the effects of lower prices ($0.6 billion).
See GE Corporate Items and Eliminations on page 54 of exhibit 99(d) for a discussion of items not allocated to this segment.
COMMERCIAL FINANCE
(In millions) | 2003 | 2002 | 2001 | ||||||
REVENUES | $ | 20,813 | $ | 19,592 | $ | 17,723 | |||
NET REVENUES | |||||||||
Total revenues | $ | 20,813 | $ | 19,592 | $ | 17,723 | |||
Interest expense | 5,789 | 5,979 | 6,055 | ||||||
Total net revenues | $ | 15,024 | $ | 13,613 | $ | 11,668 | |||
NET EARNINGS | $ | 3,910 | $ | 3,310 | $ | 2,879 | |||
December 31 (In millions) | 2003 | 2002 | ||||
TOTAL ASSETS | $ | 214,016 | $ | 202,462 | ||
(In millions) | 2003 | 2002 | 2001 | ||||||
REAL ESTATE | |||||||||
Revenues | $ | 2,386 | $ | 2,124 | $ | 1,886 | |||
Net earnings | 834 | 650 | 528 | ||||||
AVIATION SERVICES | |||||||||
Revenues | 2,881 | 2,694 | 2,173 | ||||||
Net earnings | 506 | 454 | 497 | ||||||
December 31 (In millions) | 2003 | 2002 | ||||
REAL ESTATE | ||||||
Assets | $ | 27,767 | $ | 29,522 | ||
AVIATION SERVICES | ||||||
Assets | 33,271 | 30,512 | ||||
Commercial Finance revenues and net earnings increased 6% and 18%, respectively, compared with 2002. The increase in revenues resulted primarily from acquisitions across substantially all businesses ($1.1 billion), higher investment gains at Real Estate ($0.1 billion) and origination growth, partially offset by lower securitization activity ($0.1 billion). The increase in net earnings resulted primarily from origination growth, acquisitions across substantially all businesses ($0.2 billion), higher investment gains at Real Estate as a result of the sale of properties and our investments in Regency Centers and Prologis ($0.1 billion), lower credit losses ($0.1 billion) resulting from continued improvement in overall portfolio credit quality as reflected by lower delinquencies and nonearning receivables, and growth in lower taxed earnings from international operations ($0.1 billion).
The most significant acquisitions affecting Commercial Finance 2003 results were the commercial inventory financing business of Deutsche Financial Services and the structured finance business of ABB, both of which were acquired during the fourth quarter of 2002. These two acquisitions contributed $0.5 billion and $0.1 billion to 2003 revenues and net earnings, respectively.
The 2002 increase in revenues of 11% principally reflected acquisitions and increased originations across substantially all businesses, partially offset by reduced market interest rates and lower securitization activity. The 2002 net earnings increase of 15% primarily reflected acquisitions ($0.4 billion) and origination growth, productivity across all businesses and growth in lower taxed earnings from international operations, partially offset by increased credit losses and lower securitization activity.
Included in Equipment & Other Services on page 51 of exhibit 99(d) are items not allocated to this segment.
CONSUMER FINANCE
(In millions) | 2003 | 2002 | 2001 | ||||||
REVENUES | $ | 12,845 | $ | 10,266 | $ | 9,508 | |||
NET REVENUES | |||||||||
Total revenues | $ | 12,845 | $ | 10,266 | $ | 9,508 | |||
Interest expense | 2,696 | 2,143 | 2,179 | ||||||
Total net revenues | $ | 10,149 | $ | 8,123 | $ | 7,329 | |||
NET EARNINGS | $ | 2,161 | $ | 1,799 | $ | 1,602 | |||
December 31 (In millions) | 2003 | 2002 | ||||
TOTAL ASSETS | $ | 106,530 | $ | 76,965 | ||
Consumer Finance revenues increased 25% in 2003, a result of acquisitions ($1.1 billion), the net effects of the weaker U.S. dollar ($0.7 billion), origination growth as a result of continued global expansion and the premium on the sale of The Home Depot private label credit card receivables ($0.1 billion). Net earnings increased 20% in 2003 as a result of origination growth, growth in lower taxed earnings from international operations, the premium on the sale of The Home Depot private label credit card receivables ($0.1 billion) and acquisitions. These increases were partially offset by lower securitization activity ($0.2 billion) and lower earnings in Japan, principally as a result of increased personal bankruptcies.
The most significant acquisitions affecting Consumer Finance 2003 results were First National Bank, which provides mortgage and sales finance products in the United Kingdom, and the retail sales finance unit of Conseco Finance Corp., both of which were acquired during the second quarter of 2003. These businesses contributed $0.7 billion and $0.1 billion to 2003 revenues and net earnings, respectively.
Revenues increased in 2002 primarily as a result of acquisitions ($0.8 billion) and increased international originations, partially offset by lower securitization activity ($0.4 billion). Net earnings increased 12% in 2002, as a result of origination growth, acquisitions ($0.1 billion), growth in lower taxed earnings from international operations and productivity benefits, partially offset by lower securitization activity ($0.1 billion).
Included in Equipment & Other Services on page 51 of exhibit 99(d) are items not allocated to this segment.
CONSUMER & INDUSTRIALrevenues decreased slightly to $12.8 billion in 2003 as lower prices ($0.3 billion) primarily of home appliances and consumer lighting products were partially offset by the effect of the weaker U.S. dollar ($0.2 billion). Operating profit rose slightly as productivity ($0.3 billion), primarily achieved by combining the lighting and appliance businesses, the mix of higher-margin appliances and an investment gain were partially offset by lower prices ($0.3 billion).
In 2002, Consumer & Industrial revenues fell slightly to $12.9 billion as higher volume ($0.1 billion) was more than offset by the effects of lower prices ($0.3 billion). Operating profit decreased 37% in 2002 to $0.6 billion, with adverse results in the lighting products business, particularly lower prices, higher base costs and higher charges resulting from customer credit issues. Lower prices reduced 2002 operating profit by $0.3 billion.
ENERGYrevenues fell 19% to $19.1 billion as growth in the energy services and wind businesses was more than offset by lower volume ($4.8 billion) reflecting the continued effects of the decline in sales of large gas turbines (208 in 2003 compared with 362 in 2002) and industrial aero-derivative products, partially offset by the net effects of the weaker U.S. dollar ($0.7 billion). Operating profit dropped 35% to $4.1 billion in 2003, principally reflecting the combined effects of lower volume ($1.3 billion), lower productivity ($0.8 billion) and lower prices ($0.5 billion). Customer contract termination fees, net of associated costs, were $0.6 billion in 2003 and $0.9 billion in 2002, reflecting the decline in demand for new power generation equipment that began in 2002, with such fees primarily occurring in that year and the first half of 2003. Energy revenues increased 12% to $23.6 billion in 2002 on higher volume ($2.2 billion) and price ($0.2 billion). Operating profit rose 29% to $6.3 billion in 2002 on higher volume ($0.5 billion), and productivity ($0.6 billion) which included the $0.9 billion positive effect of customer contract termination fees, net of associated costs. Results in 2002 also included restructuring and other charges of $0.2 billion as Energy adjusted its cost structure.
Energy orders were $15.4 billion in 2003, compared with $13.3 billion in 2002, reflecting strong demand for wind turbines, oil and gas turbomachinery, and services. The $12.5 billion total backlog at year-end 2003 comprised unfilled product orders of $7.9 billion (of which 70% was scheduled for delivery in 2004) and product services orders of $4.6 billion scheduled for 2004 delivery. Comparable December 31, 2002, total backlog was $16.5 billion.
EQUIPMENT & OTHER SERVICES
(In millions) | 2003 | 2002 | 2001 | |||||||||
REVENUES | $ | 4,427 | $ | 5,545 | $ | 7,735 | ||||||
NET EARNINGS | $ | (419 | ) | $ | (388 | ) | $ | (222 | ) | |||
Equipment & Other Services operating performance over the past three years was primarily the result of the effects of the U.S. recession and higher capacity, in combination with declining growth in many industries served by the businesses in the Equipment & Other Services segment, which resulted in fierce competitive price pressures.
Equipment & Other Services revenues and net earnings in 2003, decreased 20% and 8%, respectively, as compared with 2002. More specifically, revenues decreased as a result of the following:
| • | The exit of certain European operations at IT Solutions ($1.3 billion) in response to intense competition and transition of the computer equipment market to a direct distribution model; |
| • | Continued poor market conditions and product line market exits at IT Solutions and the run-off of the Auto Financial Services (AFS) business ($0.3 billion); and |
| • | Lower asset utilization and price ($0.2 billion) an effect of industry-wide excess equipment capacity reflective of current conditions in the road and rail transportation sector. |
These decreases were partially offset by the overall improvement in equity markets and lower level of investment losses in 2003 at GE Equity ($0.2 billion) and the consolidation of certain entities in our financial statements ($0.7 billion) as a result of our July 1, 2003, adoption of Financial Accounting Standards Board Interpretation No. 46,Consolidation of Variable Interest Entities, (see note 29). The decrease in net earnings resulted primarily from lower asset utilization and price ($0.1 billion) and the absence of a 2002 tax settlement related to Kidder Peabody ($0.2 billion), offset by improved performance in 2003 at GE Equity ($0.2 billion) and the tax benefit related to the sale of ERC Life ($0.1 billion).
Equipment & Other Services revenues and net earnings in 2002, decreased 28% and 75%, respectively, as compared with 2001. The decrease in revenues resulted primarily from the following:
| • | The 2001 sale of Americom ($1.7 billion); |
| • | Continued poor market conditions and product line and geographic market exits at IT Solutions and the run-off of AFS ($0.5 billion); |
| • | Increased losses on investments and lower gains at GE Equity ($0.3 billion); and |
| • | Lower asset utilization and price ($0.2 billion) an effect of industry-wide excess equipment capacity reflective of current conditions in the road and rail transportation sector. |
These decreases were partially offset by the absence of 2001 asset impairments and product line exits ($0.4 billion). The decrease in net earnings resulted primarily from the 2001 sale of Americom ($0.9 billion); reduced net earnings at IT Solutions and AFS ($0.1 billion); increased losses on investments and lower gains at GE Equity ($0.1 billion); and lower asset utilization and price ($0.1 billion). These decreases were partially offset by the absence of 2001 asset impairments and product line exits ($0.7 billion) and a favorable tax settlement with the IRS allowing the deduction of previously realized losses associated with the prior disposition of Kidder Peabody ($0.2 billion).
Certain amounts are not included in other financial services operating segments or businesses because they are excluded from the measurement of their operating performance for internal purposes. In 2001, after-tax charges of $0.7 billion primarily related to asset impairments and product line exits, included: other-than-temporary impairments of investments totaling $0.3 billion, the largest of which were primarily held by GE Equity and Insurance; charges of $0.1 billion related to loss events and the exit of certain insurance and financing product lines at Insurance, primarily nonstandard automobile and higher limit industrial property insurance coverages; charges of $0.1 billion related to the exit of certain financing product lines at Consumer Finance; and costs related to restructuring totaling $0.1 billion, consisting of involuntary termination benefits, facilities exit costs, and asset impairments.
HEALTHCARErevenues increased 14% to $10.2 billion in 2003 reflecting $0.5 billion of sales from recently acquired businesses, primarily Instrumentarium, and other volume growth ($0.7 billion) that more than offset lower prices ($0.4 billion). Operating profit of $1.7 billion rose 10% as productivity ($0.3 billion) and higher volume ($0.2 billion) more than offset the $0.4 billion effects of lower prices. Healthcare revenues increased 6% to $9.0 billion in 2002, on higher equipment and product services volume, partially offset by lower prices ($0.4 billion) and weak market conditions in Latin America and Japan. Operating profit of $1.5 billion was relatively flat in 2002 as productivity ($0.2 billion) and increased volume ($0.2 billion) were partially offset by a $0.4 billion effect of lower pricing.
See GE Corporate Items and Eliminations on page 54 of exhibit 99(d) for a discussion of items not allocated to this segment.
Orders received by Healthcare in 2003 were $10.5 billion, compared with $9.4 billion in 2002. The $4.6 billion total backlog at year-end 2003 comprised unfilled product orders of $2.8 billion (of which 95% was scheduled for delivery in 2004) and product services orders of $1.8 billion scheduled for 2004 delivery. Comparable December 31, 2002, total backlog was $4.0 billion.
During 2003, we entered into an agreement to acquire U.K.-based Amersham plc, a world leader in medical diagnostics and life sciences.
INFRASTRUCTUREreported a 62% increase in revenues, to $3.1 billion in 2003, on higher volume ($1.0 billion) primarily from acquisitions. Recently acquired businesses, the largest of which were Betz-Dearborn and Osmonics, contributed $0.5 billion of sales in 2003. Operating profit rose 56% to $0.5 billion on higher volume ($0.2 billion) primarily from acquisitions. Infrastructure revenues more than tripled to $1.9 billion in 2002 on higher volume ($1.5 billion), reflecting the contributions of acquisitions. Operating profit at Infrastructure was $0.3 billion in 2002 compared with less than $0.1 billion in 2001, reflecting higher volume ($0.1 billion) and productivity ($0.2 billion).
INSURANCE
(In millions) | 2003 | 2002 | 2001 | |||||||
REVENUES | $ | 26,194 | $ | 23,296 | $ | 23,890 | ||||
NET EARNINGS | $ | 2,102 | $ | (95 | ) | $ | 1,879 | |||
GE GLOBAL INSURANCE | ||||||||||
HOLDING (ERC) | ||||||||||
Revenues | $ | 11,600 | $ | 9,432 | $ | 9,453 | ||||
Net earnings | 481 | (1,794 | ) | 78 | ||||||
Insurance revenues increased $2.9 billion (12%) in 2003 on increased premium revenues ($2.2 billion), a gain of $0.6 billion on sale of GE Edison Life Insurance Company (Edison Life), higher investment income ($0.4 billion) and the net effects of the weaker U.S. dollar ($0.7 billion). The premium revenue increase reflected continued favorable pricing at ERC ($0.5 billion), net volume growth in certain ERC and other insurance businesses ($0.8 billion), absence of prior year loss adjustments ($0.4 billion), adjustment of current year premium accruals to actual ($0.3 billion) and lower levels of ceded premiums resulting from a decline in prior year ERC loss events ($0.1 billion). Partial revenue offsets resulted from absence of revenues following the sale of Edison Life ($0.7 billion) and a $0.2 billion loss on the disposition of Financial Guaranty Insurance Company (FGIC) at the end of 2003. Revenues decreased 2% in 2002, principally the result of ongoing planned run-off of acquired policies at Toho and lower realized investment gains.
Net earnings increased $2.2 billion in 2003, primarily from the substantial improvement in current operating results at ERC ($2.3 billion) reflecting improved underwriting, lower adverse development (discussed below) and generally favorable industry conditions during the year. Net earnings also benefited from the gain on the sale of Edison Life ($0.3 billion). These increases were partially offset by the absence of a current year counterpart to the favorable tax settlement with the IRS in 2002 ($0.2 billion) and the loss on the sale of FGIC ($0.1 billion after tax).
Net earnings decreased $2.0 billion in 2002, primarily the result of adverse development at ERC. Also in 2002, investment gains decreased, an effect partially offset by core premium growth including higher premium pricing at ERC, and benefit from the favorable tax settlement with the IRS.
As described on page 67 of exhibit 99(d) under the caption “Insurance liabilities and reserves,” insurance loss provisions are adjusted up or down based on the best available estimates. Reported claims activity at ERC related to prior year loss events, particularly for liability-related exposures underwritten in 1997 through 2001, has performed much worse than we anticipated.
| • | In the fourth quarter of 2002, considering the continued acceleration in reported claims activity, we concluded that our best estimate of ultimate pre-tax losses was $2.5 billion higher in the range of reasonably possible loss scenarios than we had previously estimated. The more significant 2002 adverse development was in hospital medical malpractice, product liability and professional liability ($0.3 billion each) and umbrella liability, workers compensation, individual liability and asbestos ($0.2 billion each). With amounts recognized in the first three quarters of 2002, our total 2002 pre-tax charge for adverse development at ERC amounted to $3.5 billion. |
| • | In 2003, we continued to monitor our reported claims activity compared with our revised expected loss levels. In a majority of our lines of business, reported claims activity in 2003 was reasonably close to expected amounts. In a few lines—principally medical malpractice, product liability and certain director and officer related coverage—reported claims volumes exceeded our revised loss expectations. Accordingly, we increased our loss reserves to the newly-indicated ultimate levels in 2003, recording adverse development of $0.9 billion pretax. We are confident we have worked through our historical underwriting mistakes. |
Throughout 2003, ERC has remained disciplined in rejecting risks that either fail to meet the established standards of price or terms and conditions, or that involve risks for which sufficient historical data do not exist to permit us to make a satisfactory evaluation. For risks that pass our criteria, we have sought to retain and even judiciously expand our business. On the other hand, we have curtailed or exited business in particular property and casualty business channels when expected returns do not appear to justify the risks.
ERC’s improved operating performance is illustrated by its “combined ratio”—the sum of claims-related losses incurred plus related underwriting expenses in relation to earned premiums. A combined ratio of less than 100% reflects an underwriting profit, that is, profit before investment income, another significant revenue source for most insurance entities. ERC’s 2003 combined ratio was 106%, but, in an early indication of the effectiveness of our revised underwriting standards, the combined ratio excluding prior-year loss events was 93%.
Our mortgage insurance business had favorable development throughout the three years ended December 31, 2003, primarily reflecting continued strength in certain real estate markets and the success of our loss containment initiatives in that business.
Included in Equipment & Other Services on page 51 of exhibit 99(d) are items not allocated to this segment. See page 44 of exhibit 99(d) for a discussion of our planned Genworth offering.
NBCrevenues decreased 4% to $6.9 billion in 2003 following a 24% increase to $7.1 billion in 2002. Operating profit rose 21% to $2.0 billion in 2003, following an 18% increase in the prior year. Results were affected by several events during the three-year period. Improved pricing and higher syndication and network sales increased revenues by $0.2 billion in 2002 and higher prices and network sales increased revenues $0.5 billion in 2003, but were partially offset in 2003 by advertising reductions because of coverage of the Iraq war ($0.1 billion). The Salt Lake City Olympic Games and final year of NBA coverage contributed $0.7 billion and $0.3 billion, respectively, to 2002 revenues, but the NBA contract resulted in a loss that exceeded profit from the Olympics. We acquired Telemundo and Bravo in 2002; together they added $0.7 billion and $0.3 billion of advertising revenues in 2003 and 2002, respectively, and $0.1 billion operating profit in 2003. The 2002 exchange of certain assets for Bravo resulted in $0.6 billion of gain, $0.2 billion of which was attributed to NBC’s segment results, an amount equal to $0.2 billion of other charges for impairments in 2002. The remainder was included in GE Corporate Items and Eliminations as discussed on page 54 of exhibit 99(d).
During 2003, we entered into an agreement to merge NBC with Vivendi Universal Entertainment to create one of the world’s premier media companies, NBC Universal.
TRANSPORTATION
(In millions) | 2003 | 2002 | 2001 | ||||||
REVENUES | $ | 13,515 | $ | 13,685 | $ | 13,885 | |||
OPERATING PROFIT | $ | 2,661 | $ | 2,510 | $ | 2,577 | |||
AIRCRAFT ENGINES | |||||||||
Revenues | $ | 10,972 | $ | 11,371 | $ | 11,530 | |||
Operating profit | 2,201 | 2,096 | 2,167 | ||||||
RAIL | |||||||||
Revenues | $ | 2,543 | $ | 2,314 | $ | 2,355 | |||
Operating profit | 460 | 414 | 410 | ||||||
Transportation revenues decreased slightly in 2003 on lower volume ($0.2 billion). Operating profit rose 6% in 2003 to $2.7 billion as productivity ($0.2 billion) more than offset the effects of lower volume. Revenues in 2002 decreased slightly on lower prices ($0.1 billion) and lower volume ($0.1 billion). Operating profit also fell slightly as productivity partially offset the effects of lower prices.
Aircraft Engines revenues decreased 4% to $11.0 billion in 2003 reflecting lower volume ($0.5 billion), primarily related to commercial aircraft and industrial aero-derivative engines, partially offset by higher military spare parts volume. Despite the decrease in revenues, operating profit rose 5% to $2.2 billion reflecting the effects of productivity ($0.2 billion) largely from workforce efficiency, and lower research and development spending upon completion of certain development programs, more than offsetting the effect of decreased volume ($0.1 billion). Aircraft Engines reported a 1% decrease in revenues in 2002 as commercial engine pricing pressures and reduced commercial product services revenues, combined with lower industrial units, were substantially offset by increased military sales. Operating profit in 2002 was 3% lower than in 2001, primarily as a result of lower pricing ($0.1 billion), including pricing for commercial engines, lower product services volume from reduced customer flight hours, and higher labor costs, partially offset by lower material costs and productivity.
In 2003, Aircraft Engines revenues from sales to the U.S. government were $2.4 billion, compared with $2.2 billion and $1.9 billion in 2002 and 2001, respectively.
Aircraft Engines received orders of $10.4 billion in 2003, compared with $11.6 billion in 2002, as military orders decreased from $4.3 billion to $2.2 billion and commercial engines increased $0.6 billion to $2.3 billion. The $10.6 billion total backlog at year-end 2003 comprised unfilled product orders of $8.0 billion (of which 38% was scheduled for delivery in 2004) and product services orders of $2.6 billion scheduled for 2004 delivery. Comparable December 31, 2002, total backlog was $11.5 billion.
Rail revenues of $2.5 billion increased 10% compared with 2002 on higher volume ($0.2 billion), primarily from locomotive sales and growth in the global signaling business. Operating profit rose 11% to $0.5 billion in 2003 on the higher volume, partially offset by reduced pricing. In 2002, Rail revenues of $2.3 billion were 2% lower and operating profit of $0.4 billion was about the same as in 2001, as product services revenues, strong variable cost productivity and lower material costs offset the effects of lower volume and pricing pressures.
Rail received orders of $2.9 billion in 2003, compared with $2.8 billion in 2002. The $2.4 billion total backlog at year-end 2003 comprised unfilled product orders of $1.3 billion (of which 69% was scheduled for delivery in 2004) and product services orders of $1.1 billion scheduled for 2004 delivery. Comparable December 31, 2002, total backlog was $2.1 billion.
See GE Corporate Items and Eliminations below for a discussion of items not allocated to this segment.
GE CORPORATE ITEMS AND ELIMINATIONS
(In millions) | 2003 | 2002 | 2001 | |||||||||
REVENUES | ||||||||||||
Eliminations | $ | (2,757 | ) | $ | (1,662 | ) | $ | (2,057 | ) | |||
OPERATING PROFIT | ||||||||||||
Principal pension plans | $ | 1,040 | $ | 1,556 | $ | 2,095 | ||||||
Eliminations | (504 | ) | (558 | ) | (544 | ) | ||||||
Underabsorbed corporate overhead | (582 | ) | (367 | ) | (334 | ) | ||||||
Not allocated | (228 | ) | 115 | (545 | ) | |||||||
Other | (217 | ) | 295 | 147 | ||||||||
Total | $ | (491 | ) | $ | 1,041 | $ | 819 | |||||
GE Corporate Items and Eliminations include the effects of eliminating transactions between operating segments; cost reductions from our principal pension plans; liquidating businesses; underabsorbed corporate overhead; certain non-allocated amounts described below; a variety of sundry items; and, before 2002, goodwill amortization. Corporate overhead is allocated to GE operating segments based on a ratio of segment net cost of operations, excluding direct materials, to total company cost of operations. This caption also includes internal allocated costs for segment funds on deposit.
Not allocated—Certain amounts are not included in GE operating segments because they are excluded from the measurement of their operating performance for internal purposes. In 2003 and 2002, these comprised charges of $0.2 billion and $0.1 billion, respectively, for settlement of litigation, restructuring and other charges at Healthcare; in 2002, a portion of NBC’s gain from the Bravo exchange; in 2002, a total of $0.1 billion for restructuring and other charges at Transportation and Advanced Materials; and in 2001, a total of $0.5 billion of goodwill amortization.
Other includes a $0.5 billion gain from the sale of 90% of Global eXchange Services in 2002.
International Operations
Our international activities span all global regions and primarily encompass manufacturing for local and export markets, import and sale of products produced in other regions, leasing of aircraft, sourcing for our plants domiciled in other global regions and provision of financial services within these regional economies. Thus, when countries or regions experience currency and/or economic stress, we often have increased exposure to certain risks, but also often have new profit opportunities. Potential increased risks include, among other things, higher receivables delinquencies and bad debts, delays or cancellation of sales and orders principally related to power and aircraft equipment, higher local currency financing costs and a slowdown in established financial services activities. New profit opportunities include, among other things, more opportunities for lower cost outsourcing, expansion of industrial and financial services activities through purchases of companies or assets at reduced prices and lower U.S. debt financing costs.
Estimated results of international activities include the results of our operations located outside the United States plus all U.S. exports. We classify certain GECS operations that cannot meaningfully be associated with specific geographic areas as “Other international” for this purpose.
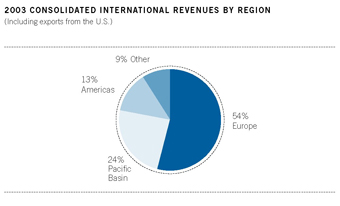
International revenues rose 14% to $60.8 billion in 2003 compared with $53.4 billion and $51.9 billion in 2002 and 2001, respectively. International revenues as a percentage of consolidated revenues were 45% in 2003, compared with 40% and 41% in 2002 and 2001, respectively. The effects of exchange rates on reported results were to increase revenues by $3.8 billion and $0.4 billion in 2003 and 2002, respectively, and increase earnings by $0.1 billion in 2003 and decrease earnings by $0.1 billion in 2002.
CONSOLIDATED INTERNATIONAL REVENUES
(In millions) | 2003 | 2002 | 2001 | ||||||
Europe | $ | 30,505 | $ | 24,813 | $ | 24,381 | |||
Pacific Basin | 13,119 | 12,026 | 11,447 | ||||||
Americas | 5,854 | 5,165 | 5,507 | ||||||
Other international | 4,608 | 3,911 | 3,456 | ||||||
| 54,086 | 45,915 | 44,791 | |||||||
Exports from the U.S. to external customers | 6,719 | 7,481 | 7,149 | ||||||
Total | $ | 60,805 | $ | 53,396 | $ | 51,940 | |||
GE international revenues were $33.0 billion, $29.0 billion and $28.3 billion in 2003, 2002 and 2001, respectively. The $4.0 billion increase in GE international revenues related to increased operations outside the U.S., partially offset by lower U.S. exports.
GE revenues in Europe rose 25%, led by Energy, Healthcare and Infrastructure, reflecting the net effects of the weaker U.S. dollar and volume growth. GE revenues in the Pacific Basin increased 14% as most businesses reported improved results. Energy and Infrastructure were the primary contributors to a 16% increase in revenues in the Americas and Energy more than accounted for the 10% decrease in U.S. exports. The increase in 2002 related to both an increase in operations outside the U.S. and higher U.S. exports. Revenue increases in Europe were led by Healthcare in 2002. Transportation and Energy were the primary contributors to a 9% decrease in revenues in the Americas. Increases in U.S. export sales in 2002 were primarily in Advanced Materials and Energy, partially offset by lower exports by Healthcare and Transportation.
GECS international revenues were $27.8 billion, $24.4 billion and $23.6 billion in 2003, 2002 and 2001, respectively. The $3.4 billion increase related to a 21% increase in Europe in 2003 as a result of the growth in premiums and price increases at Insurance ($2.1 billion), acquisitions ($1.0 billion) and the net effects of the weaker U.S. dollar ($0.7 billion), primarily at Consumer Finance and Commercial Finance, partially offset by geographic market exits at certain Equipment & Other Services businesses ($1.3 billion).
International operating profit was $8.8 billion in 2003, an increase of 35% over 2002, which was 7% higher than in 2001. Operating profit in 2003 rose 89% to $4.0 billion in Europe, primarily as a result of lower adverse development at Insurance ($1.1 billion). Operating profit also rose 30% to $1.5 billion in the Americas and was relatively unchanged in the Pacific Basin ($2.4 billion) and “Other international” ($0.9 billion).
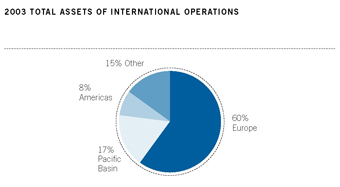
Total assets of international operations were $258.9 billion in 2003 (40% of consolidated assets), an increase of $29.9 billion, or 13%, over 2002. GECS international assets grew 12% from $207.5 billion at the end of 2002 to $231.9 billion at the end of 2003. GECS assets increased 31% in Europe as a result of acquisitions ($14.8 billion), primarily at Consumer Finance and Commercial Finance, the net effects of the weaker U.S. dollar ($11.7 billion) and growth at Consumer Finance and Insurance. GECS assets increased 13% in the Americas as a result of growth at Commercial Finance and Insurance.
Financial results of our international activities reported in U.S. dollars are affected by currency exchange. We use a number of techniques to manage the effects of currency exchange, including selective borrowings in local currencies and selective hedging of significant cross-currency transactions. Such principal currencies are the British pound sterling, the euro, the Japanese yen and the Canadian dollar.
Environmental Matters
Our operations, like operations of other companies engaged in similar businesses, involve the use, disposal and cleanup of substances regulated under environmental protection laws.
We have developed environmental, health and safety management systems that are implemented at all of our facilities and track our performance. Since 1996, we have reduced employee injuries by over 70% as well as reducing air and wastewater exceedances and emissions at our facilities. We also actively participate in various programs that recognize facilities with health and safety programs that exceed legal requirements, including the United States Occupational Safety and Health Administration’s Voluntary Protection Program (VPP) as well as a similar government program in Mexico. Participation in these programs requires government audits to verify our comprehensive health and safety management systems. We are a leading participant in the U.S. VPP program with 82 sites, and have an additional 25 sites participating in the Mexico program. We have a Global Star program designed to recognize sites with world-class health and safety programs in those countries without government VPP programs. The 44 Global Star sites have passed a rigorous evaluation conducted by GE internal health and safety experts. We also have 79 sites accredited by outside auditors under the ISO 14000 Standard for Environmental Management Systems.
Over the last two years we spent a total of about $0.1 billion for projects related to the environment. These amounts exclude expenditures for remediation actions, which are principally expensed and are discussed below. Capital expenditures for environmental purposes have included pollution control devices—such as waste-water treatment plants, groundwater monitoring devices, air strippers or separators, and incinerators—at new and existing facilities constructed or upgraded in the normal course of business. Consistent with policies stressing environmental responsibility, we expect our capital expenditures other than for remediation projects to total about $0.1 billion over the next two years for new or expanded programs to build facilities or modify manufacturing processes to minimize waste and reduce emissions.
We also are involved in a sizable number of remediation actions to clean up hazardous wastes as required by federal and state laws. Such statutes require that responsible parties fund remediation actions regardless of fault, legality of original disposal or ownership of a disposal site. Expenditures for site remediation actions amounted to $0.1 billion in each of the last two years. We presently expect that such remediation actions will require average annual expenditures in the range of $0.1 billion to $0.2 billion over the next two years.
The U.S. Environmental Protection Agency (EPA) ruled in February 2002 that approximately 150,000 pounds of polychlo-rinated biphenyls (PCBs) must be dredged from a 40-mile stretch of the upper Hudson River in New York State. We have submitted what is known as a “Good Faith Offer” under the Superfund law and began negotiations with the EPA to undertake the design and engineering of the remedy. Our Statement of Financial Position as of December 31, 2003 and 2002, included liabilities for the estimated costs of this remediation.
NOTES TO CONSOLIDATED FINANCIAL STATEMENTS
NOTE 10
GE CURRENT RECEIVABLES
December 31 (In millions) | 2003 | 2002 | ||||||
Advanced Materials | $ | 927 | $ | 1,082 | ||||
Consumer & Industrial | 1,111 | 1,426 | ||||||
Energy | 3,788 | 3,883 | ||||||
Healthcare | 2,024 | 1,411 | ||||||
Infrastructure | 400 | 363 | ||||||
NBC | 938 | 891 | ||||||
Transportation | 1,993 | 2,021 | ||||||
Corporate items and eliminations | 278 | 349 | ||||||
| 11,459 | 11,426 | |||||||
Less allowance for losses | (486 | ) | (453 | ) | ||||
Total | $ | 10,973 | $ | 10,973 | ||||
Receivables balances at December 31, 2003 and 2002, before allowance for losses, included $6,746 million and $6,269 million, respectively, from sales of goods and services to customers, and $226 million and $304 million, respectively, from transactions with associated companies.
Current receivables of $444 million at year-end 2003 and $344 million at year-end 2002 arose from sales, principally of aircraft engine goods and services, on open account to various agencies of the U.S. government, which is our largest single customer. About 4% of our sales of goods and services were to the U.S. government in 2003, 2002 and 2001.
NOTE 12
GECS FINANCING RECEIVABLES (INVESTMENTS IN TIME SALES, LOANS AND FINANCING LEASES)
December 31 (In millions) | 2003 | 2002 | ||||||
COMMERCIAL FINANCE | ||||||||
Equipment | $ | 63,737 | $ | 64,618 | ||||
Commercial and industrial | 39,383 | 36,512 | ||||||
Real estate | 20,171 | 21,041 | ||||||
Commercial aircraft | 12,424 | 11,397 | ||||||
| 135,715 | 133,568 | |||||||
CONSUMER FINANCE | ||||||||
Non-U.S. installment, revolving | ||||||||
credit and other | 34,440 | 23,655 | ||||||
Non-U.S. residential | 19,593 | 9,731 | ||||||
Non-U.S. auto | 18,668 | 15,113 | ||||||
U.S. installment, revolving credit and other | 16,545 | 14,312 | ||||||
Other | 5,431 | 3,225 | ||||||
| 94,677 | 66,036 | |||||||
Equipment & Other Services | 1,893 | 3,956 | ||||||
| 232,285 | 203,560 | |||||||
Less allowance for losses (note 13) | (6,256 | ) | (5,500 | ) | ||||
Total | $ | 226,029 | $ | 198,060 | ||||
GECS financing receivables include both time sales and loans and financing leases. Time sales and loans represents transactions in a variety of forms, including time sales, revolving charge and credit, mortgages, installment loans, intermediate-term loans and revolving loans secured by business assets. The portfolio includes time sales and loans carried at the principal amount on which finance charges are billed periodically, and time sales and loans carried at gross book value, which includes finance charges.
Investment in financing leases consists of direct financing and leveraged leases of aircraft, railroad rolling stock, autos, other transportation equipment, data processing equipment and medical equipment, as well as other manufacturing, power generation, commercial real estate, and commercial equipment and facilities.
As the sole owner of assets under direct financing leases and as the equity participant in leveraged leases, GECS is taxed on total lease payments received and is entitled to tax deductions based on the cost of leased assets and tax deductions for interest paid to third-party participants. GECS is generally entitled to any residual value of leased assets.
Investment in direct financing and leveraged leases represents net unpaid rentals and estimated unguaranteed residual values of leased equipment, less related deferred income. GECS has no general obligation for principal and interest on notes and other instruments representing third-party participation related to leveraged leases; such notes and other instruments have not been included in liabilities but have been offset against the related rentals receivable. The GECS share of rentals receivable on leveraged leases is subordinate to the share of other participants who also have security interests in the leased equipment.
NET INVESTMENT IN FINANCING LEASES
| Total financing leases | Direct financing leases | Leveraged leases | ||||||||||||||||||||||
December 31 (In millions) | 2003 | 2002 | 2003 | 2002 | 2003 | 2002 | ||||||||||||||||||
Total minimum lease payments receivable | $ | 87,400 | 88,640 | $ | 57,929 | $ | 56,779 | $ | 29,471 | $ | 31,861 | |||||||||||||
Less principal and interest on third-party | ||||||||||||||||||||||||
nonrecourse debt | (22,144 | ) | (24,249 | ) | — | — | (22,144 | ) | (24,249 | ) | ||||||||||||||
Net rentals receivable | 65,256 | 64,391 | 57,929 | 56,779 | 7,327 | 7,612 | ||||||||||||||||||
Estimated unguaranteed residual value | ||||||||||||||||||||||||
of leased assets | 9,733 | 9,807 | 6,058 | 6,032 | 3,675 | 3,775 | ||||||||||||||||||
Less deferred income | (13,496 | ) | (13,947 | ) | (9,720 | ) | (9,998 | ) | (3,776 | ) | (3,949 | ) | ||||||||||||
Investment in financing leases | 61,493 | 60,251 | 54,267 | 52,813 | 7,226 | 7,438 | ||||||||||||||||||
Less amounts to arrive at net investment | ||||||||||||||||||||||||
Allowance for losses | (830 | ) | (861 | ) | (734 | ) | (759 | ) | (96 | ) | (102 | ) | ||||||||||||
Deferred taxes | (10,250 | ) | (9,763 | ) | (5,793 | ) | (5,559 | ) | (4,457 | ) | (4,204 | ) | ||||||||||||
Net investment in financing leases | $ | 50,413 | $ | 49,627 | $ | 47,740 | $ | 46,495 | $ | 2,673 | $ | 3,132 | ||||||||||||
CONTRACTUAL MATURITIES
(In millions) | Total time and loans | Net rentals receivable | ||||
Due in | ||||||
2004 | $ | 55,044 | $ | 16,490 | ||
2005 | 28,020 | 13,272 | ||||
2006 | 23,249 | 10,148 | ||||
2007 | 13,951 | 6,883 | ||||
2008 | 12,650 | 4,066 | ||||
2009 and later | 37,878 | 14,397 | ||||
Total | $ | 170,792 | $ | 65,256 | ||
We expect actual maturities to differ from contractual maturities.
“Impaired” loans are defined by generally accepted accounting principles as large balance loans for which it is probable that the lender will be unable to collect all amounts due according to original contractual terms of the loan agreement. An analysis of impaired loans follows.
December 31 (millions) | 2003 | 2002 | ||||
Loans requiring allowance for losses | $ | 940 | $ | 1,140 | ||
Loans expected to be fully recoverable | 1,355 | 845 | ||||
| $ | 2,295 | $ | 1,985 | |||
Allowance for losses | $ | 378 | $ | 397 | ||
Average investment during year | 2,193 | 1,747 | ||||
Interest income earned while impaired(a) | 33 | 16 | ||||
| (a) | Recognized principally on cash basis. |
NOTE 13
GECS ALLOWANCE FOR LOSSES ON FINANCING RECEIVABLES
(In millions) | 2003 | 2002 | 2001 | |||||||||
BALANCE AT JANUARY 1 | ||||||||||||
Commercial Finance | $ | 2,664 | $ | 2,532 | $ | 1,695 | ||||||
Consumer Finance | 2,782 | 2,173 | 2,149 | |||||||||
Equipment & Other Services | 54 | 87 | 182 | |||||||||
| 5,500 | 4,792 | 4,026 | ||||||||||
PROVISION CHARGED TO OPERATIONS | ||||||||||||
Commercial Finance | 887 | 1,110 | 771 | |||||||||
Consumer Finance | 2,808 | 1,950 | 1,646 | |||||||||
Equipment & Other Services | 57 | 24 | 64 | |||||||||
| 3,752 | 3,084 | 2,481 | ||||||||||
OTHER ADDITIONS(a) | 648 | 704 | 563 | |||||||||
GROSS WRITE-OFFS | ||||||||||||
Commercial Finance | (1,321 | ) | (1,262 | ) | (564 | ) | ||||||
Consumer Finance | (3,114 | ) | (2,383 | ) | (2,076 | ) | ||||||
Equipment & Other Services | (57 | ) | (77 | ) | (134 | ) | ||||||
| (4,492 | ) | (3,722 | ) | (2,774 | ) | |||||||
RECOVERIES | ||||||||||||
Commercial Finance | 126 | 95 | 66 | |||||||||
Consumer Finance | 710 | 534 | 417 | |||||||||
Equipment & Other Services | 12 | 13 | 13 | |||||||||
| 848 | 642 | 496 | ||||||||||
BALANCE AT DECEMBER 31 | ||||||||||||
Commercial Finance | 2,244 | 2,664 | 2,532 | |||||||||
Consumer Finance | 3,984 | 2,782 | 2,173 | |||||||||
Equipment & Other Services | 28 | 54 | 87 | |||||||||
Balance at December 31 | $ | 6,256 | $ | 5,500 | $ | 4,792 | ||||||
| (a) | Included $168 million, $493 million and $666 million related to acquisitions and $480 million, $211 million and $(103) million related to the net effects of exchange rates in 2003, 2002 and 2001, respectively. |
SELECTED FINANCING RECEIVABLES RATIOS
December 31 | 2003 | 2002 | ||||
ALLOWANCE FOR LOSSES ON FINANCING RECEIVABLES AS A PERCENTAGE OF TOTAL FINANCING RECEIVABLES | ||||||
Commercial Finance | 1.65 | % | 1.99 | % | ||
Consumer Finance | 4.21 | 4.21 | ||||
Equipment & Other Services | 1.48 | 1.37 | ||||
Total | 2.69 | 2.70 | ||||
NONEARNING AND REDUCED EARNING FINANCING RECEIVABLES AS A PERCENTAGE OF TOTAL FINANCING RECEIVABLES | ||||||
Commercial Finance | 1.3 | % | 1.6 | % | ||
Consumer Finance | 2.6 | 2.4 | ||||
Equipment & Other Services | 2.3 | 1.4 | ||||
Total | 1.8 | 1.9 | ||||
NOTE 16
INTANGIBLE ASSETS
December 31 (In millions) | 2003 | 2002 | ||||
GE | ||||||
Goodwill | $ | 25,960 | $ | 20,044 | ||
Capitalized software | 1,678 | 1,559 | ||||
Other intangibles | 2,566 | 1,446 | ||||
| 30,204 | 23,049 | |||||
GECS | ||||||
Goodwill | 21,527 | 19,094 | ||||
Present value of future profits (PVFP) | 1,562 | 2,457 | ||||
Capitalized software | 800 | 894 | ||||
Other intangibles | 932 | 686 | ||||
| 24,821 | 23,131 | |||||
Total | $ | 55,025 | $ | 46,180 | ||
GE intangible assets were net of accumulated amortization of $5,759 million in 2003 and $5,203 million in 2002. GECS intangible assets were net of accumulated amortization of $11,515 million in 2003 and $10,603 million in 2002.
INTANGIBLE ASSETS SUBJECT TO AMORTIZATION
December 31 (In millions) | Gross carrying amount | Accumulated amortization | Net | |||||||
2003 | ||||||||||
PVFP | $ | 4,571 | $ | (3,009 | ) | $ | 1,562 | |||
Capitalized software | 4,911 | (2,433 | ) | 2,478 | ||||||
Servicing assets(a) | 3,539 | (3,392 | ) | 147 | ||||||
Patents, licenses and other | 2,721 | (806 | ) | 1,915 | ||||||
All other | 1,095 | (417 | ) | 678 | ||||||
Total | $ | 16,837 | $ | (10,057 | ) | $ | 6,780 | |||
2002 | ||||||||||
PVFP | $ | 5,261 | $ | (2,804 | ) | $ | 2,457 | |||
Capitalized software | 4,269 | (1,816 | ) | 2,453 | ||||||
Servicing assets(a) | 3,582 | (3,240 | ) | 342 | ||||||
Patents, licenses and other | 1,665 | (675 | ) | 990 | ||||||
All other | 556 | (341 | ) | 215 | ||||||
Total | $ | 15,333 | $ | (8,876 | ) | $ | 6,457 | |||
| (a) | Servicing assets, net of accumulated amortization, were associated primarily with serviced residential mortgage loans amounting to $14 billion and $33 billion at December 31, 2003 and 2002, respectively. |
Indefinite-lived intangible assets were $758 million and $585 million at December 31, 2003 and 2002, respectively, and principally comprise U.S. Federal Communication Commission licenses and cable affiliation agreements.
Consolidated amortization expense related to intangible assets, excluding goodwill, for 2003 and 2002 was $1,407 million and $1,999 million, respectively. The estimated percentage of the December 31, 2003, net PVFP balance to be amortized over each of the next five years follows.
2004 | 2005 | 2006 | 2007 | 2008 | ||||
8.8% | 8.2% | 7.5% | 6.9% | 6.4% | ||||
Change in PVFP balances follow.
(In millions) | 2003 | 2002 | ||||||
Balance at January 1 | $ | 2,457 | $ | 2,198 | ||||
Acquisitions | 46 | 494 | ||||||
Dispositions | (658 | ) | — | |||||
Accrued interest(a) | 80 | 83 | ||||||
Amortization | (318 | ) | (369 | ) | ||||
Other | (45 | ) | 51 | |||||
Balance at December 31 | $ | 1,562 | $ | 2,457 | ||||
| (a) | Interest was accrued at a rate of 4.3% and 3.5% for 2003 and 2002, respectively. |
Recoverability of PVFP is evaluated periodically by comparing the current estimate of expected future gross profits to the unamortized asset balance. If such comparison indicates that the expected gross profits will not be sufficient to recover PVFP, the difference is charged to expense. No such expense was recorded in 2003 or 2002.
Amortization expense for PVFP in future periods will be affected by acquisitions, realized capital gains/losses or other factors affecting the ultimate amount of gross profits realized from certain lines of business. Similarly, future amortization expense for other intangibles will depend on acquisition activity and other business transactions.
The amount of goodwill amortization included in net earnings (net of income taxes) in 2001 was $499 million and $552 million for GE and GECS, respectively.
The effects on earnings and earnings per share of excluding such goodwill amortization from 2001 follow.
| 2001 | |||||||||
(In millions; per-share amounts in dollars) | Consolidated | GE | GECS | ||||||
Net earnings, as reported | $ | 13,684 | $ | 13,684 | $ | 5,417 | |||
Net earnings, excluding goodwill amortization | 14,735 | 14,735 | 5,969 | ||||||
| Diluted | Basic | |||||
Earnings per share, as reported | $ | 1.37 | $ | 1.38 | ||
Earnings per share, excluding goodwill amortization | 1.47 | 1.48 | ||||
Changes in goodwill balances, net of accumulated amortization, follow.
| 2003 | 2002 | ||||||||||||||||||||||||||||
(In millions) | Balance January 1 | Acquisitions/ purchase accounting adjustments(a) | Foreign exchange and other | Balance December 31 | Balance January 1 | Transition impairment | Acquisitions/ purchase accounting adjustments(a) | Foreign exchange and other | Balance December 31 | ||||||||||||||||||||
Advanced Materials | $ | 2,077 | $ | 720 | $ | 13 | $ | 2,810 | $ | 1,923 | $ | — | $ | 151 | $ | 3 | $ | 2,077 | |||||||||||
Commercial Finance | 8,360 | 183 | 84 | 8,627 | 6,598 | — | 1,681 | 81 | 8,360 | ||||||||||||||||||||
Consumer Finance | 5,562 | 1,294 | 923 | 7,779 | 3,826 | — | 1,286 | 450 | 5,562 | ||||||||||||||||||||
Consumer & Industrial | 720 | 15 | 60 | 795 | 602 | — | 102 | 16 | 720 | ||||||||||||||||||||
Energy | 3,374 | 450 | 388 | 4,212 | 2,195 | — | 974 | 205 | 3,374 | ||||||||||||||||||||
Equipment & Other Services | 996 | 29 | 4 | 1,029 | 2,137 | (1,204 | ) | 34 | 29 | 996 | |||||||||||||||||||
Healthcare | 2,898 | 1,846 | 22 | 4,766 | 2,408 | — | 430 | 60 | 2,898 | ||||||||||||||||||||
Infrastructure | 3,192 | 365 | 168 | 3,725 | 316 | — | 2,875 | 1 | 3,192 | ||||||||||||||||||||
Insurance | 4,176 | 12 | (96 | ) | 4,092 | 3,372 | — | 542 | 262 | 4,176 | |||||||||||||||||||
NBC | 4,941 | 1,507 | — | 6,448 | 2,568 | — | 2,373 | — | 4,941 | ||||||||||||||||||||
Transportation | 2,842 | 354 | 8 | 3,204 | 2,342 | — | 472 | 28 | 2,842 | ||||||||||||||||||||
Total | $ | 39,138 | $ | 6,775 | $ | 1,574 | $ | 47,487 | $ | 28,287 | $ | (1,204 | ) | $ | 10,920 | $ | 1,135 | $ | 39,138 | ||||||||||
| (a) | The amount of goodwill related to new acquisitions recorded during 2003 was $6,602 million, the largest of which were Instrumentarium ($1,754 million) by Healthcare, Bravo ($1,473 million) by NBC and First National Bank ($680 million) by Consumer Finance. The amount of goodwill related to purchase accounting adjustments during 2003 was $173 million, primarily associated with the 2002 acquisitions of several businesses at Infrastructure, Australian Guarantee Corporation at Consumer Finance and Security Capital Group at Commercial Finance. The amount of goodwill related to new acquisitions recorded during 2002 was $9,641 million, the largest of which were Telemundo Communications Group ($2,159 million) by NBC, Betz-Dearborn ($1,422 million) and Interlogix ($888 million) by Infrastructure and Australian Guarantee Corporation ($621 million) by Consumer Finance. The amount of goodwill related to purchase accounting adjustments during 2002 was $1,279 million, primarily associated with the 2001 acquisition of Heller Financial, Inc. Upon closing an acquisition, we estimate the fair values of assets and liabilities acquired and consolidate the acquisition as quickly as possible. Given the time it takes to obtain pertinent information to finalize the acquired company’s balance sheet (frequently with implications for the price of the acquisition), then to adjust the acquired company’s policies, procedures, books and records to our standards, it is often several quarters before we are able to finalize those initial fair value estimates. Accordingly, it is not uncommon for our initial estimates to be subsequently revised. |
NOTE 27
OPERATING SEGMENTS
REVENUES
For the years ended December 31 (In millions) | Total revenues | Intersegment revenues | External revenues | ||||||||||||||||||||||||||||||||
| 2003 | 2002 | 2001 | 2003 | 2002 | 2001 | 2003 | 2002 | 2001 | |||||||||||||||||||||||||||
Advanced Materials | $ | 7,078 | $ | 6,963 | $ | 7,069 | $ | 31 | $ | 25 | $ | 21 | $ | 7,047 | $ | 6,938 | $ | 7,048 | |||||||||||||||||
Commercial Finance | 20,813 | 19,592 | 17,723 | 195 | 128 | 99 | 20,618 | 19,464 | 17,624 | ||||||||||||||||||||||||||
Consumer Finance | 12,845 | 10,266 | 9,508 | 23 | 12 | 12 | 12,822 | 10,254 | 9,496 | ||||||||||||||||||||||||||
Consumer & Industrial | 12,843 | 12,887 | 13,063 | 290 | 347 | 212 | 12,553 | 12,540 | 12,851 | ||||||||||||||||||||||||||
Energy | 19,082 | 23,633 | 21,030 | 213 | 287 | 254 | 18,869 | 23,346 | 20,776 | ||||||||||||||||||||||||||
Equipment & Other Services | 4,427 | 5,545 | 7,735 | (241 | ) | (142 | ) | (124 | ) | 4,668 | 5,687 | 7,859 | |||||||||||||||||||||||
Healthcare | 10,198 | 8,955 | 8,409 | 2 | 2 | 2 | 10,196 | 8,953 | 8,407 | ||||||||||||||||||||||||||
Infrastructure | 3,078 | 1,901 | 392 | 85 | 84 | 93 | 2,993 | 1,817 | 299 | ||||||||||||||||||||||||||
Insurance | 26,194 | 23,296 | 23,890 | 23 | 2 | 13 | 26,171 | 23,294 | 23,877 | ||||||||||||||||||||||||||
NBC | 6,871 | 7,149 | 5,769 | — | — | — | 6,871 | 7,149 | 5,769 | ||||||||||||||||||||||||||
Transportation | 13,515 | 13,685 | 13,885 | 772 | 1,044 | 1,315 | 12,743 | 12,641 | 12,570 | ||||||||||||||||||||||||||
Corporate items and eliminations | (2,757 | ) | (1,662 | ) | (2,057 | ) | (1,393 | ) | (1,789 | ) | (1,897 | ) | (1,364 | ) | 127 | (160 | ) | ||||||||||||||||||
Consolidated Revenues | $ | 134,187 | $ | 132,210 | $ | 126,416 | $ | — | $ | — | $ | — | $ | 134,187 | $ | 132,210 | $ | 126,416 | |||||||||||||||||
Revenues of GE businesses include income from sales of goods and services to customers and other income. Sales from one company component to another generally are priced at equivalent commercial selling prices.
Revenues originating from operations based in the United States were $84,795 million, $90,954 million and $85,999 million in 2003, 2002 and 2001, respectively. Revenues originating from operations based outside the United States were $49,392 million, $41,256 million and $40,417 million in 2003, 2002 and 2001, respectively.
Assets | Property, plant and equipment additions (including equipment leased to others) (a) | Depreciation and amortization | |||||||||||||||||||||||||
At December 31 | For the years ended December 31 | For the years ended December 31 | |||||||||||||||||||||||||
(In millions) | 2003 | 2002 | 2001 | 2003 | 2002 | 2001 | 2003 | 2002 | 2001 | ||||||||||||||||||
Advanced Materials | $ | 12,359 | $ | 11,372 | $ | 10,573 | $ | 797 | $ | 703 | $ | 814 | $ | 655 | $ | 632 | $ | 557 | |||||||||
Commercial Finance | 214,016 | 202,462 | 178,217 | 7,405 | 8,999 | 12,325 | 3,466 | 3,133 | 2,586 | ||||||||||||||||||
Consumer Finance | 106,530 | 76,965 | 62,978 | 191 | 221 | 195 | 276 | 232 | 178 | ||||||||||||||||||
Consumer & Industrial | 7,526 | 8,387 | 8,213 | 318 | 449 | 519 | 560 | 516 | 487 | ||||||||||||||||||
Energy | 17,121 | 16,372 | 13,837 | 514 | 734 | 779 | 555 | 517 | 343 | ||||||||||||||||||
Equipment & Other Services | 64,098 | 28,104 | 28,789 | 1,136 | 2,417 | 2,066 | 1,151 | 1,034 | 1,234 | ||||||||||||||||||
Healthcare | 10,816 | 7,573 | 6,625 | 289 | 170 | 177 | 278 | 247 | 177 | ||||||||||||||||||
Infrastructure | 5,977 | 4,998 | 919 | 177 | 388 | 41 | 120 | 113 | 10 | ||||||||||||||||||
Insurance | 169,882 | 182,297 | 155,500 | 35 | 71 | 37 | 469 | 432 | 502 | ||||||||||||||||||
NBC | 11,619 | 10,401 | 5,572 | 121 | 252 | 64 | 117 | 109 | 94 | ||||||||||||||||||
Transportation | 13,285 | 12,599 | 12,030 | 595 | 348 | 454 | 412 | 377 | 373 | ||||||||||||||||||
Corporate items and eliminations(b) | 14,254 | 13,714 | 11,770 | 179 | 121 | 141 | 126 | 165 | 1,413 | ||||||||||||||||||
Consolidated totals | $ | 647,483 | $ | 575,244 | $ | 495,023 | $ | 11,757 | $ | 14,873 | $ | 17,612 | $ | 8,185 | $ | 7,507 | $ | 7,954 | |||||||||
| (a) | Additions to property, plant and equipment include amounts relating to principal businesses purchased. |
| (b) | In 2001, depreciation and amortization included $1,316 million of goodwill amortization. |
Property, plant and equipment associated with operations based in the United States were $20,790 million, $19,778 million and $18,557 million at year-end 2003, 2002 and 2001, respectively. Property, plant and equipment associated with operations based outside the United States were $32,592 million, $29,295 million and $25,386 million at year-end 2003, 2002 and 2001, respectively.
Basis for presentation
Our operating businesses are organized based on the nature of products and services provided. Segment accounting policies are the same as described in note 1.
A description of our operating segments can be found on pages 112-113 of exhibit 99(d) and details of segment profit by operating segment can be found on page 48 of exhibit 99(d).
OUR BUSINESSES
A description of operating segments for General Electric Company and consolidated affiliates as of December 31, 2003, and the basis for presentation in this report, follows.
Advanced Materials
High-performance engineered plastics used in a variety of applications such as automotive parts, computer enclosures, telecommunication equipment and construction materials. Products also include structured products, silicones and high-purity quartzware. Products and services are sold worldwide to a diverse customer base consisting mainly of manufacturers.
Commercial Finance
Loans, leases, and other financial services to customers, including manufacturers, distributors and end-users for a variety of equipment and major capital assets. These assets include industrial and energy-related facilities and equipment; commercial and residential real estate; vehicles; aircraft; and equipment used in many industries including the construction, manufacturing, telecommunications, and healthcare industries.
Consumer Finance
Card receivables, installment loans, auto loans and leases, and residential mortgages for customers on a global basis.
Consumer & Industrial
Major appliances and related services for products such as refrigerators, freezers, electric and gas ranges, cooktops, dishwashers, clothes washers and dryers, microwave ovens, room air conditioners and residential water system products. Distributed to both retail outlets and direct to consumers, mainly for the replacement market, and to building contractors and distributors for new installations. Lighting products include a wide variety of lamps, lighting fixtures and wiring devices. Electrical distribution and control equipment includes power delivery and control products such as transformers, meters, relays, capacitors and arresters. Also includes GE Supply, a network of electrical supply houses. Products and services are sold in North America and in global markets under various GE and private-label brands.
Energy
Power plant products and services, including design, installation, operation and maintenance services sold into global markets. Gas, steam and aeroderivative turbines, generators, combined cycle systems, controls and related services including total asset optimization solutions, equipment upgrades and contractual services are sold to power generation and other industrial customers. Renewable energy solutions including wind turbines and hydro turbines and generators. Advanced turbomachinery products and related services for the oil and gas market, including total pipeline integrity solutions. Substation automation and network solutions sold to power transmission and distribution customers. Also includes portable and rental power plants, nuclear reactors, fuel and nuclear support services.
Equipment & Other Services
Rentals, leases, sales, asset management services and loans for portfolios of commercial and transportation equipment, including tractors, trailers, railroad rolling stock, modular space units, inter-modal shipping containers, computer networks, marine containers and autos. Also included in the segment are activities and businesses that are not measured within one of the other financial services segments—for example corporate expenses, liquidating businesses and other non-segment aligned operations, including GE Equity, the consolidation of certain entities in our financial statements as a result of our July 1, 2003, adoption of FIN 46; and the U.S. Auto and Home business, which was sold in the third quarter of 2003.
Healthcare
Medical imaging systems such as magnetic resonance (MR) and computed tomography (CT) scanners, x-ray, nuclear imaging and ultrasound, as well as diagnostic cardiology and patient monitoring devices; related services, including equipment monitoring and repair, computerized data management and customer productivity services. Products and services are sold worldwide to hospitals and medical facilities.
Infrastructure
Chemical water treatment program services and equipment; measurement and sensing equipment (products and subsystems for sensing temperatures, humidity and pressure); security equipment and systems (including card access systems, video and sensor monitoring equipment, integrated facility monitoring systems and explosive detection systems); a broad range of automation hardware and software. Markets are extremely diverse. Products and services are sold to commercial and industrial end-users, including utilities; original equipment manufacturers; electrical distributors; retail outlets; railways; and transit authorities. Increasingly, products and services are developed for and sold in global markets.
Insurance
U.S. and international multiple-line property and casualty reinsurance, certain directly written specialty insurance and life reinsurance, consumer investment, insurance and retirement services, private mortgage insurance and, before its sale in the fourth quarter of 2003, financial guaranty insurance, principally on municipal bonds and asset-backed securities.
NBC
Principal businesses are the furnishing of U.S. network television services to more than 230 affiliated stations, production of television programs, operation of 29 VHF and UHF television broadcasting stations, operation of four cable/satellite networks around the world, and investment and programming activities in the Internet, multimedia and cable television.
Transportation
Jet engines and replacement parts and repair and maintenance services for all categories of commercial aircraft (short/medium, intermediate and long-range); for a wide variety of military aircraft, including fighters, bombers, tankers and helicopters; and for executive and regional aircraft. Products and services are sold worldwide to airframe manufacturers, airlines and government agencies. Also includes aircraft engine derivatives used as marine propulsion and industrial power sources; the latter is also reported in Energy. Rail systems products and maintenance services including diesel and electric locomotives, transit propulsion equipment, motorized wheels for off-highway vehicles, and railway signaling communications systems.