Exhibit 99.2
Full Year and Fourth Quarter Earnings March 13, 2007 3:30 p.m. ET Contact GMAC Investor Relations at (866) 710-4623 or investor.relations@gm.com |
Forward Looking Statements In the presentation that follows and in related comments by GMAC LLC ("GMAC") management, our use of the words "expect", "anticipate", "estimate", "forecast", "objective", "plan", "could", "should", "would", "may", "goal", "project", "outlook", "priorities", "targets", "intend", "evaluate", "pursue", "seek" and similar expressions is intended to identify forward looking statements. While these statements represent our current judgment on what the future may hold, and we believe these judgments are reasonable, actual results may differ materially due to numerous important factors that are described in GMAC's most recent report on SEC Form 10-K, which may be revised or supplemented in subsequent reports on SEC Forms 10-Q and 8-K. Such factors include, among others, the following: securing low cost funding to sustain growth for GMAC and ResCap and maintaining the mutually beneficial relationship between GMAC and General Motors; changes in economic conditions, currency exchange rates, significant terrorist attacks or political instability in the major markets where we operate; recent developments in the residential mortgage market, especially in the nonprime sector; changes in the laws, regulations, policies or other activities of governments, agencies and similar organizations where such actions may affect the production, licensing, distribution or sale of our products, the cost thereof or applicable tax rates; and the outbreak or escalation of hostilities between the United States and any foreign power or territory and changes in international political conditions may continue to affect both the United States and the global economy and may increase other risks. Investors are cautioned not to place undue reliance on forward-looking statements. GMAC undertakes no obligation to update or revise any forward-looking statements unless required by law. A reconciliation of non-GAAP financial measures included within this presentation is provided in the supplemental charts. Use of the term "loans" describes products associated with direct and indirect lending activities of GMAC's global operations. The specific products include retail installment sales contracts, loans, lines of credit, leases or other financing products. The term "originate" refers to GMAC's purchase, acquisition or direct origination of various "loan" products. 2 |

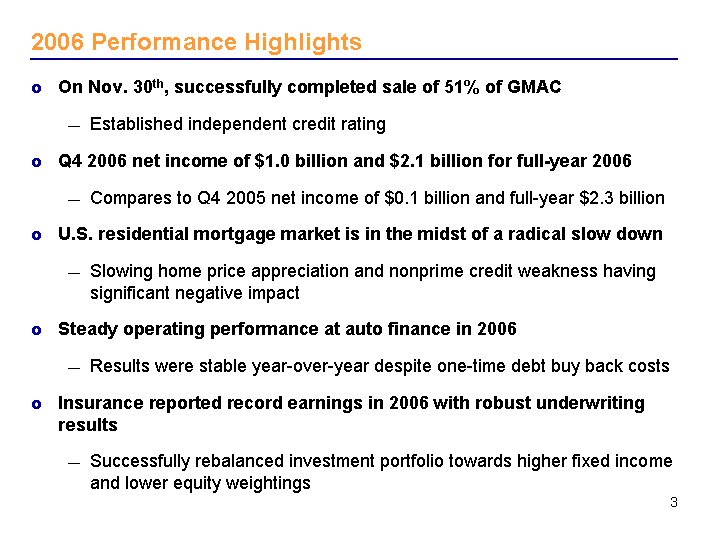
2006 Performance Highlights On Nov. 30th, successfully completed sale of 51% of GMAC Established independent credit rating Q4 2006 net income of $1.0 billion and $2.1 billion for full-year 2006 Compares to Q4 2005 net income of $0.1 billion and full-year $2.3 billion U.S. residential mortgage market is in the midst of a radical slow down Slowing home price appreciation and nonprime credit weakness having significant negative impact Steady operating performance at auto finance in 2006 Results were stable year-over-year despite one-time debt buy back costs Insurance reported record earnings in 2006 with robust underwriting results Successfully rebalanced investment portfolio towards higher fixed income and lower equity weightings 3 |
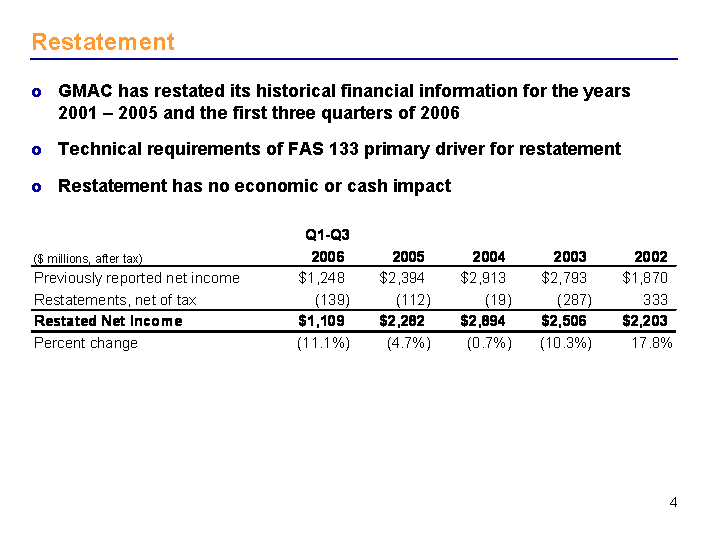
Restatement GMAC has restated its historical financial information for the years 2001 - 2005 and the first three quarters of 2006 Technical requirements of FAS 133 primary driver for restatement Restatement has no economic or cash impact 4 |
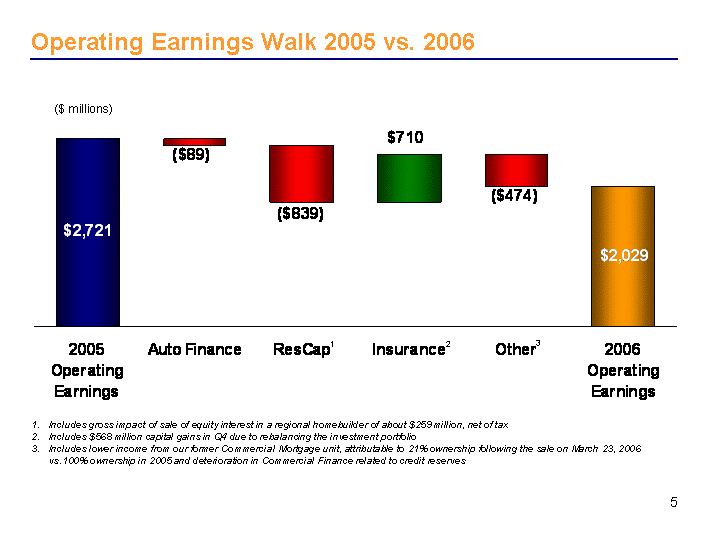
Includes gross impact of sale of equity interest in a regional homebuilder of about $259 million, net of tax Includes $568 million capital gains in Q4 due to rebalancing the investment portfolio Includes lower income from our former Commercial Mortgage unit, attributable to 21% ownership following the sale on March 23, 2006 vs.100% ownership in 2005 and deterioration in Commercial Finance related to credit reserves Operating Earnings Walk 2005 vs. 2006 ($ millions) 1 2 3 5 |
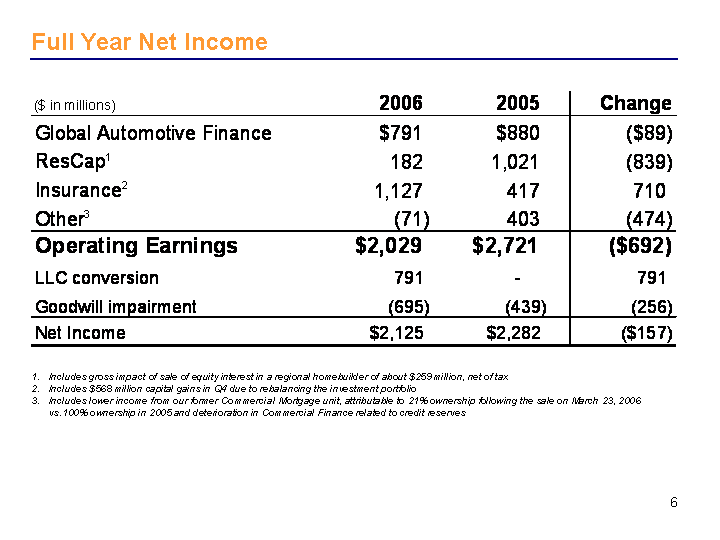
Full Year Net Income 6 Includes gross impact of sale of equity interest in a regional homebuilder of about $259 million, net of tax Includes $568 million capital gains in Q4 due to rebalancing the investment portfolio Includes lower income from our former Commercial Mortgage unit, attributable to 21% ownership following the sale on March 23, 2006 vs.100% ownership in 2005 and deterioration in Commercial Finance related to credit reserves |
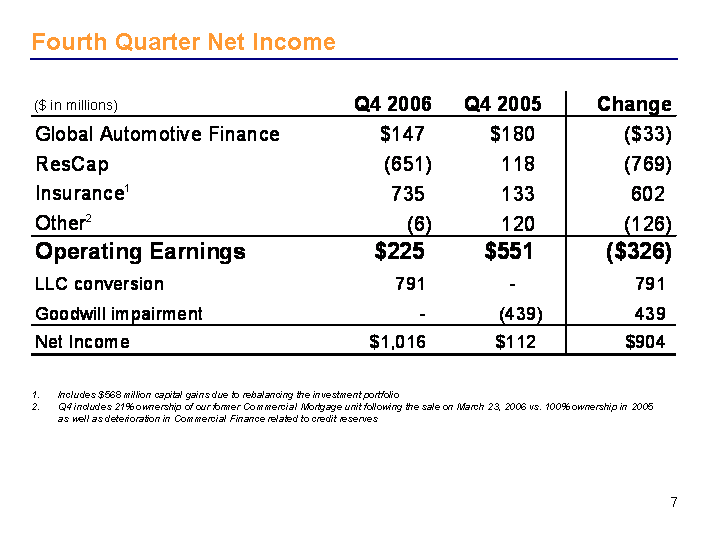
Fourth Quarter Net Income Includes $568 million capital gains due to rebalancing the investment portfolio Q4 includes 21% ownership of our former Commercial Mortgage unit following the sale on March 23, 2006 vs. 100% ownership in 2005 as well as deterioration in Commercial Finance related to credit reserves 7 |
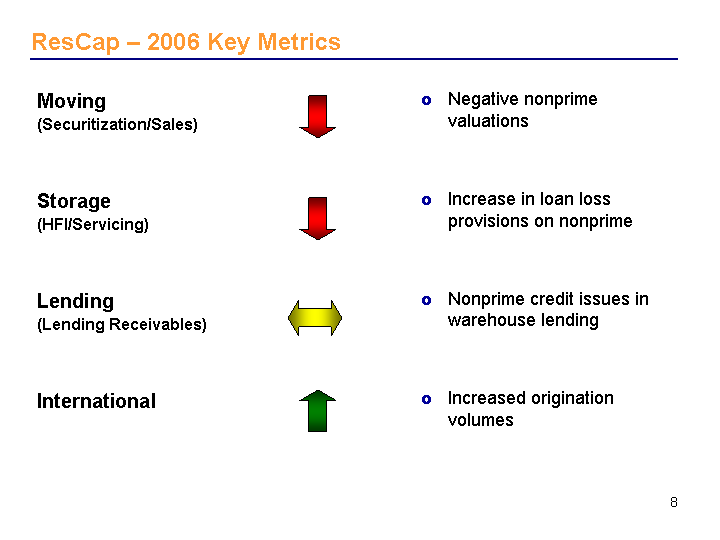
Moving (Securitization/Sales) Storage (HFI/Servicing) Lending (Lending Receivables) International ResCap - 2006 Key Metrics 8 Negative nonprime valuations Increase in loan loss provisions on nonprime Nonprime credit issues in warehouse lending Increased origination volumes |
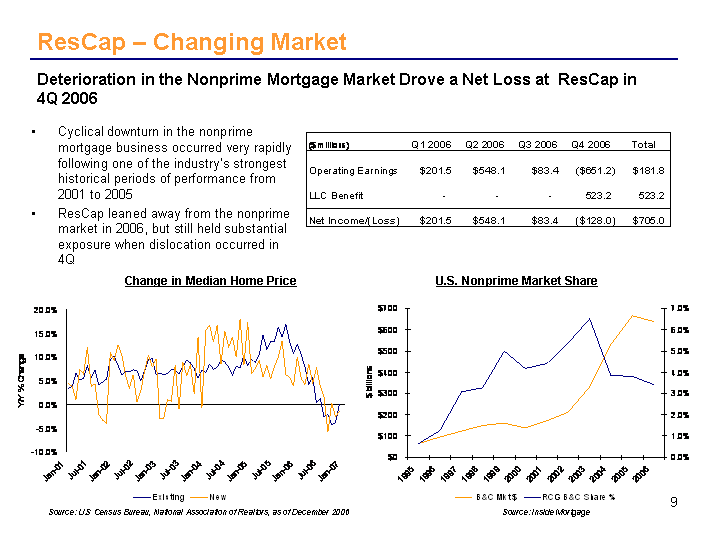
Cyclical downturn in the nonprime mortgage business occurred very rapidly following one of the industry's strongest historical periods of performance from 2001 to 2005 ResCap leaned away from the nonprime market in 2006, but still held substantial exposure when dislocation occurred in 4Q ResCap - Changing Market Deterioration in the Nonprime Mortgage Market Drove a Net Loss at ResCap in 4Q 2006 Change in Median Home Price U.S. Nonprime Market Share Source: U.S Census Bureau, National Association of Realtors, as of December 2006 9 Source: Inside Mortgage |
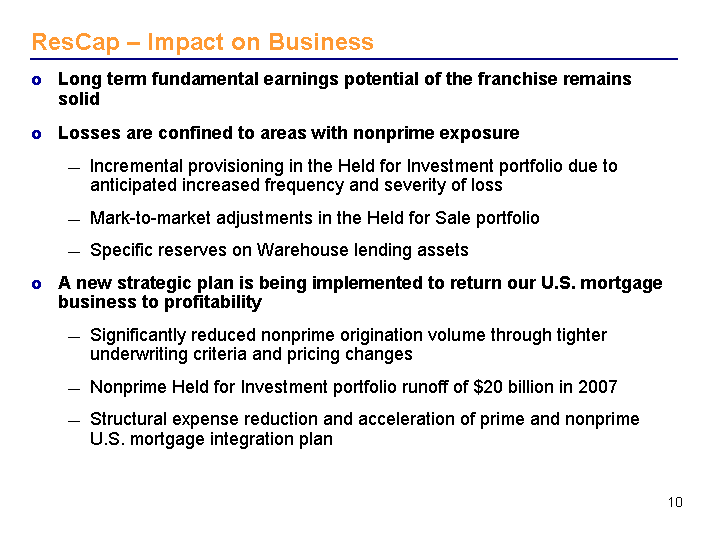
ResCap - Impact on Business Long term fundamental earnings potential of the franchise remains solid Losses are confined to areas with nonprime exposure Incremental provisioning in the Held for Investment portfolio due to anticipated increased frequency and severity of loss Mark-to-market adjustments in the Held for Sale portfolio Specific reserves on Warehouse lending assets A new strategic plan is being implemented to return our U.S. mortgage business to profitability Significantly reduced nonprime origination volume through tighter underwriting criteria and pricing changes Nonprime Held for Investment portfolio runoff of $20 billion in 2007 Structural expense reduction and acceleration of prime and nonprime U.S. mortgage integration plan 10 |
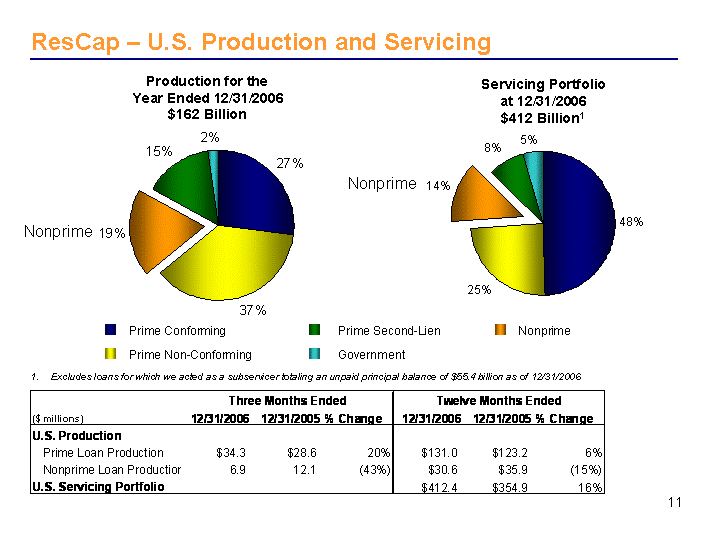
Production for the Year Ended 12/31/2006 $162 Billion Prime Second-Lien Prime Non-Conforming Nonprime Prime Conforming Excludes loans for which we acted as a subservicer totaling an unpaid principal balance of $55.4 billion as of 12/31/2006 ResCap - U.S. Production and Servicing Servicing Portfolio at 12/31/2006 $412 Billion1 Nonprime Nonprime 11 |
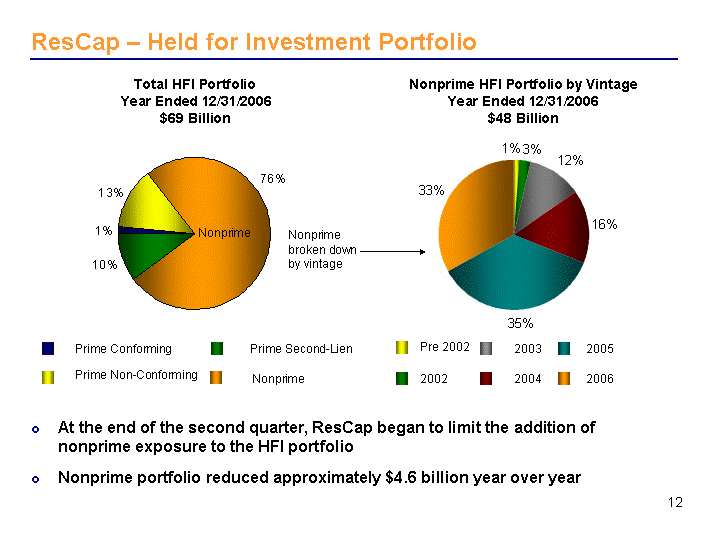
Nonprime HFI Portfolio by Vintage Year Ended 12/31/2006 $48 Billion ResCap - Held for Investment Portfolio At the end of the second quarter, ResCap began to limit the addition of nonprime exposure to the HFI portfolio Nonprime portfolio reduced approximately $4.6 billion year over year Total HFI Portfolio Year Ended 12/31/2006 $69 Billion Prime Conforming Prime Non-Conforming Nonprime Prime Second-Lien Nonprime broken down by vintage Nonprime 12 Pre 2002 2002 2003 2004 2005 2006 |
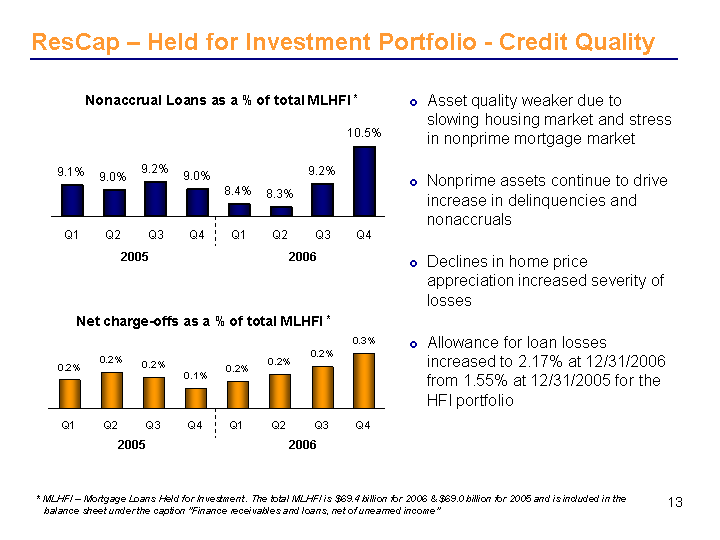
Asset quality weaker due to slowing housing market and stress in nonprime mortgage market Nonprime assets continue to drive increase in delinquencies and nonaccruals Declines in home price appreciation increased severity of losses Allowance for loan losses increased to 2.17% at 12/31/2006 from 1.55% at 12/31/2005 for the HFI portfolio ResCap - Held for Investment Portfolio - Credit Quality * MLHFI - Mortgage Loans Held for Investment. The total MLHFI is $69.4 billion for 2006 & $69.0 billion for 2005 and is included in the balance sheet under the caption "Finance receivables and loans, net of unearned income" Nonaccrual Loans as a % of total MLHFI * Net charge-offs as a % of total MLHFI * 2005 2006 2005 2006 13 |
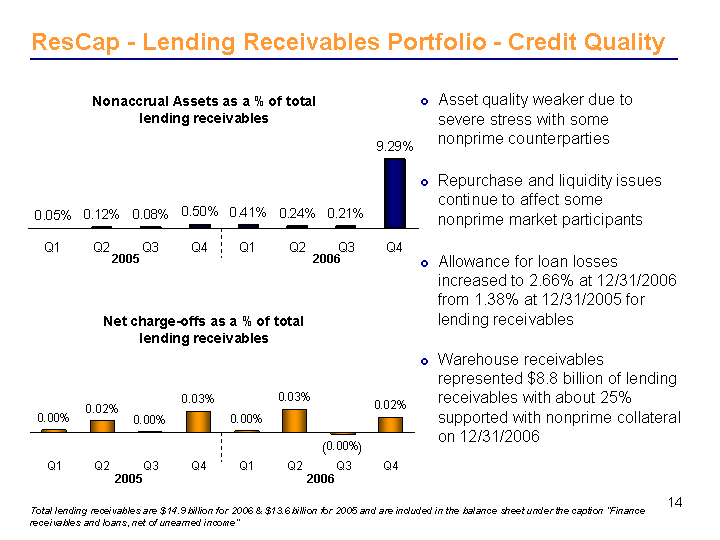
Asset quality weaker due to severe stress with some nonprime counterparties Repurchase and liquidity issues continue to affect some nonprime market participants Allowance for loan losses increased to 2.66% at 12/31/2006 from 1.38% at 12/31/2005 for lending receivables Warehouse receivables represented $8.8 billion of lending receivables with about 25% supported with nonprime collateral on 12/31/2006 ResCap - Lending Receivables Portfolio - Credit Quality Total lending receivables are $14.9 billion for 2006 & $13.6 billion for 2005 and are included in the balance sheet under the caption "Finance receivables and loans, net of unearned income" Net charge-offs as a % of total lending receivables 14 Nonaccrual Assets as a % of total lending receivables 2006 2005 2005 2006 ( ) |
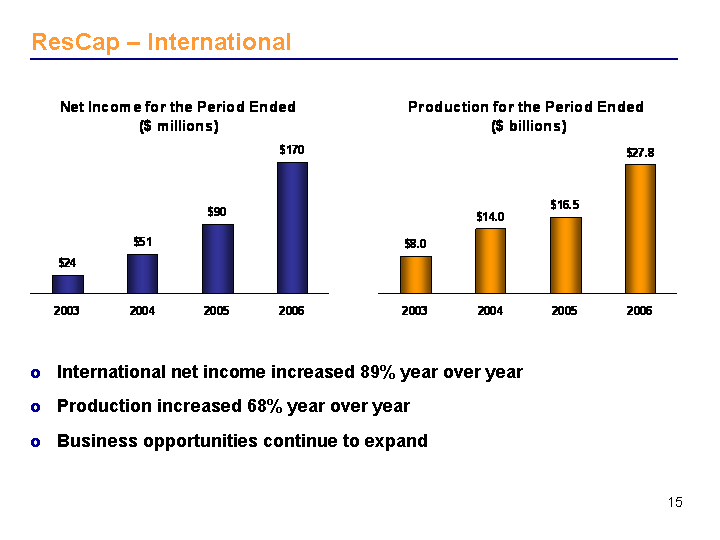
ResCap - International 2003 2004 2005 2006 Net Income 24 51 90 170 2003 2004 2005 2006 Production 8 14 16.5 27.8 International net income increased 89% year over year Production increased 68% year over year Business opportunities continue to expand 15 |
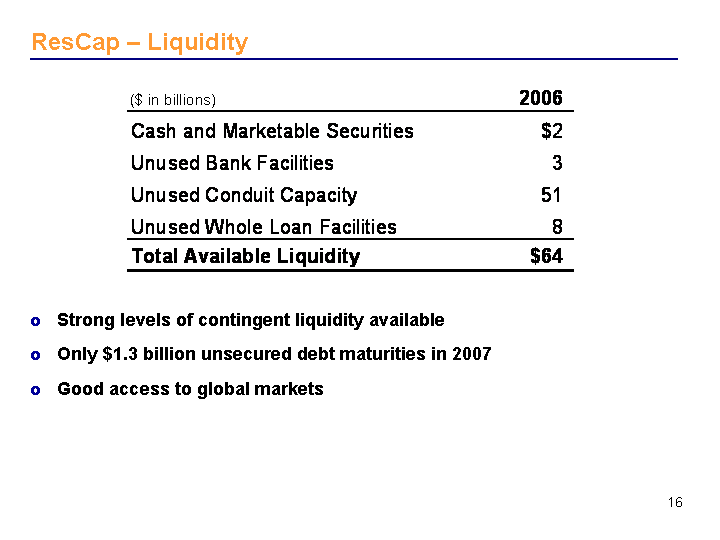
ResCap - Liquidity Strong levels of contingent liquidity available Only $1.3 billion unsecured debt maturities in 2007 Good access to global markets 16 |
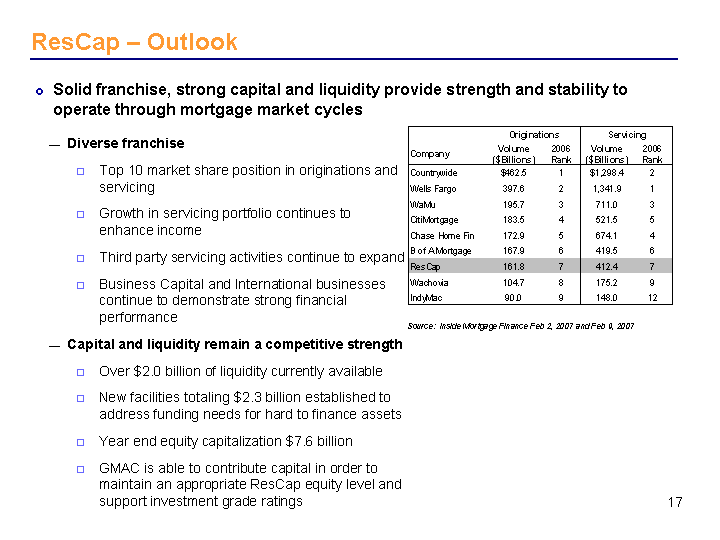
ResCap - Outlook Solid franchise, strong capital and liquidity provide strength and stability to operate through mortgage market cycles Diverse franchise Top 10 market share position in originations and servicing Growth in servicing portfolio continues to enhance income Third party servicing activities continue to expand Business Capital and International businesses continue to demonstrate strong financial performance Capital and liquidity remain a competitive strength Over $2.0 billion of liquidity currently available New facilities totaling $2.3 billion established to address funding needs for hard to finance assets Year end equity capitalization $7.6 billion GMAC is able to contribute capital in order to maintain an appropriate ResCap equity level and support investment grade ratings 17 Source: Inside Mortgage Finance Feb 2, 2007 and Feb 9, 2007 |
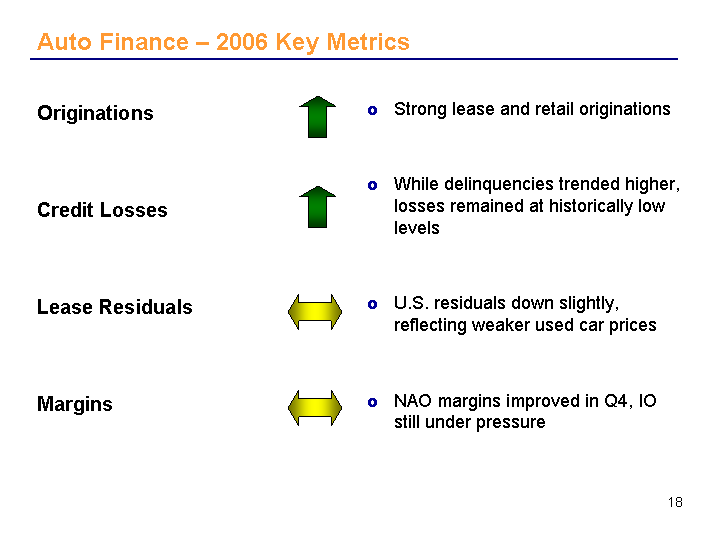
Strong lease and retail originations While delinquencies trended higher, losses remained at historically low levels U.S. residuals down slightly, reflecting weaker used car prices NAO margins improved in Q4, IO still under pressure Auto Finance - 2006 Key Metrics Originations Credit Losses Lease Residuals Margins 18 |
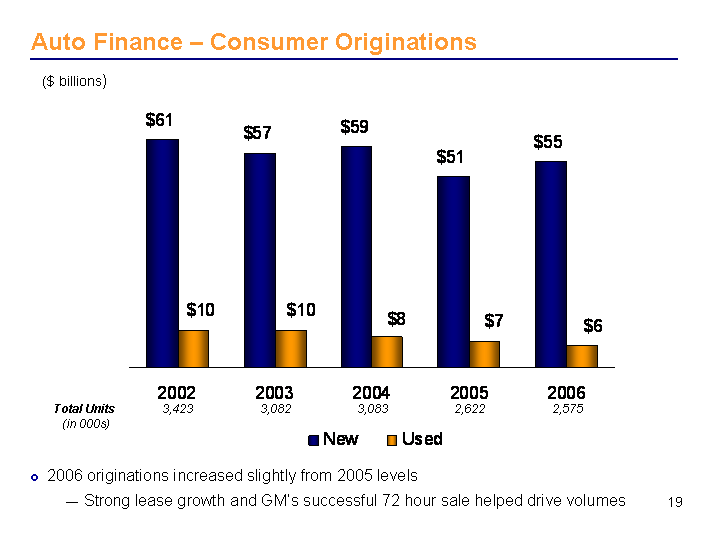
Auto Finance - Consumer Originations 2006 originations increased slightly from 2005 levels Strong lease growth and GM's successful 72 hour sale helped drive volumes ($ billions) Total Units 3,423 3,082 3,083 2,622 2,575 (in 000s) 19 |
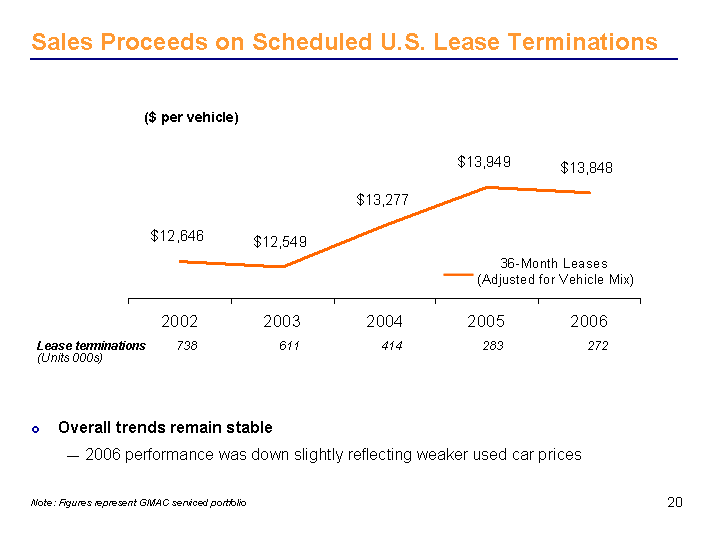
Sales Proceeds on Scheduled U.S. Lease Terminations Overall trends remain stable 2006 performance was down slightly reflecting weaker used car prices Note: Figures represent GMAC serviced portfolio 1 Lease terminations 738 611 414 283 272 (Units 000s) ($ per vehicle) 20 |
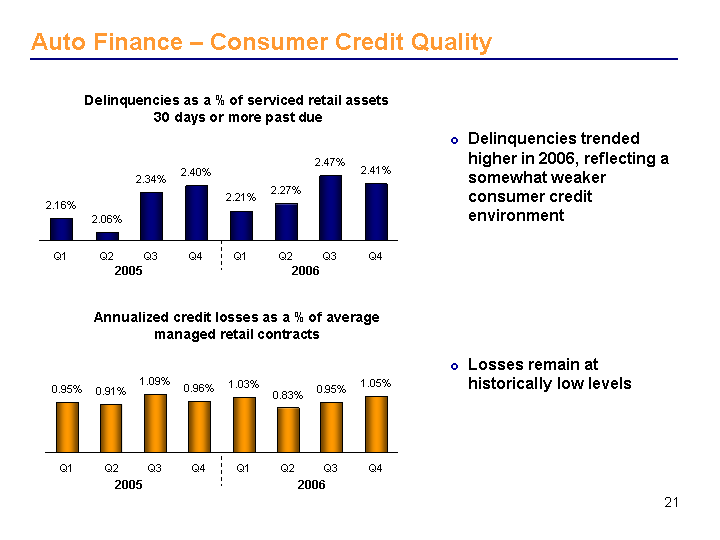
Auto Finance - Consumer Credit Quality Delinquencies trended higher in 2006, reflecting a somewhat weaker consumer credit environment Losses remain at historically low levels 2005 2006 Annualized credit losses as a % of average managed retail contracts 2005 2006 Delinquencies as a % of serviced retail assets 30 days or more past due 2006 2005 21 |
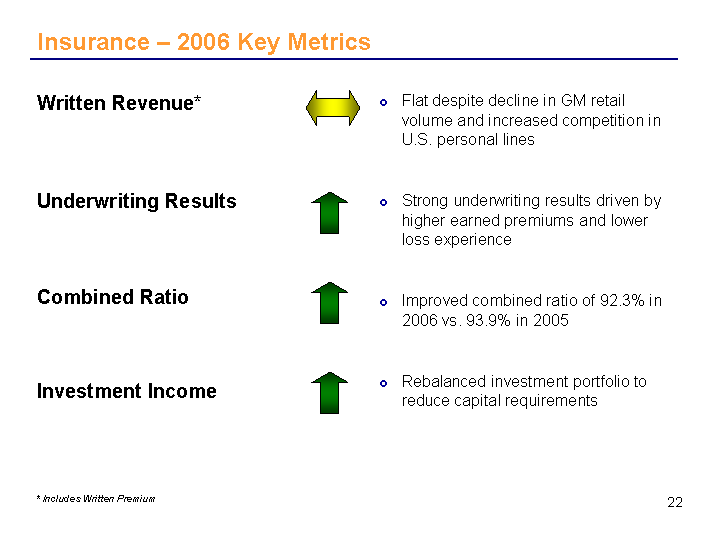
Insurance - 2006 Key Metrics Written Revenue* Underwriting Results Combined Ratio Investment Income Flat despite decline in GM retail volume and increased competition in U.S. personal lines Strong underwriting results driven by higher earned premiums and lower loss experience Improved combined ratio of 92.3% in 2006 vs. 93.9% in 2005 Rebalanced investment portfolio to reduce capital requirements * Includes Written Premium 22 |
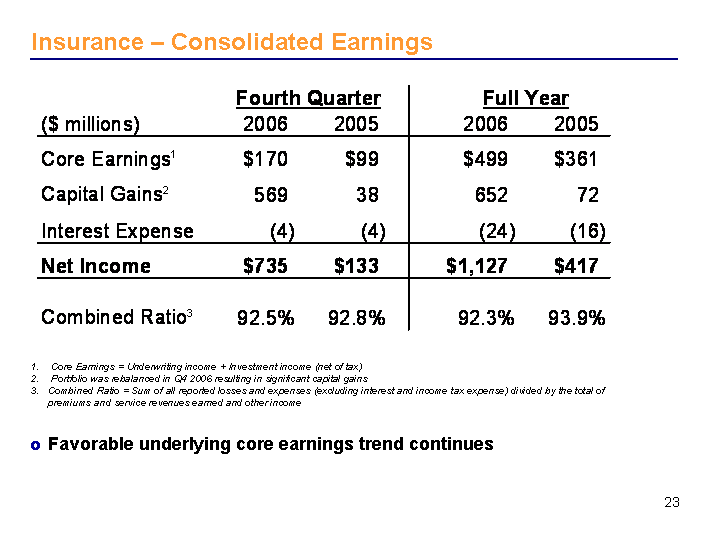
Insurance - Consolidated Earnings Favorable underlying core earnings trend continues Core Earnings = Underwriting income + Investment income (net of tax) Portfolio was rebalanced in Q4 2006 resulting in significant capital gains Combined Ratio = Sum of all reported losses and expenses (excluding interest and income tax expense) divided by the total of premiums and service revenues earned and other income 23 |
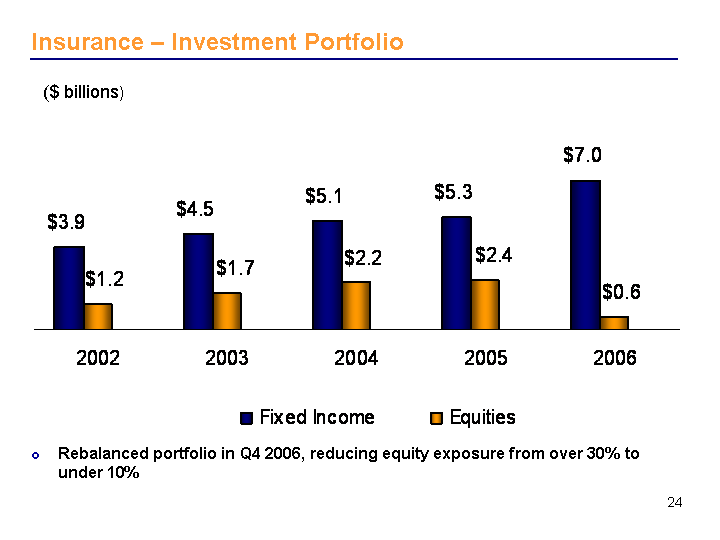
Insurance - Investment Portfolio Rebalanced portfolio in Q4 2006, reducing equity exposure from over 30% to under 10% ($ billions) 24 |
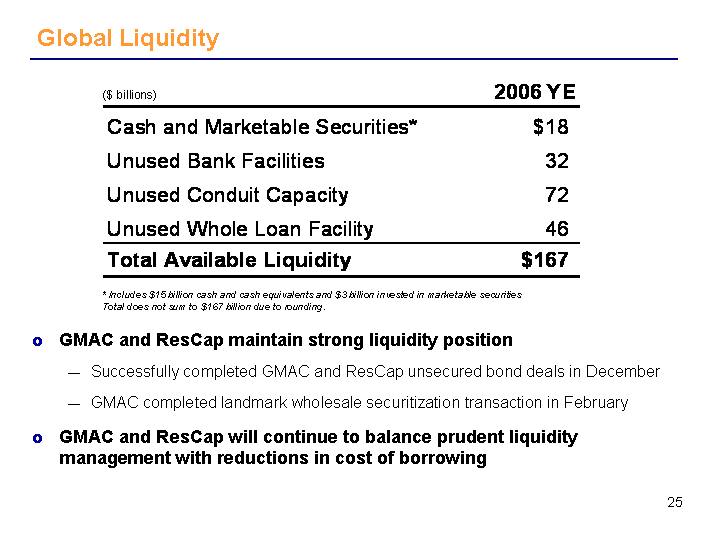
GMAC and ResCap maintain strong liquidity position Successfully completed GMAC and ResCap unsecured bond deals in December GMAC completed landmark wholesale securitization transaction in February GMAC and ResCap will continue to balance prudent liquidity management with reductions in cost of borrowing Global Liquidity ($ billions) * Includes $15 billion cash and cash equivalents and $3 billion invested in marketable securities Total does not sum to $167 billion due to rounding. 25 |
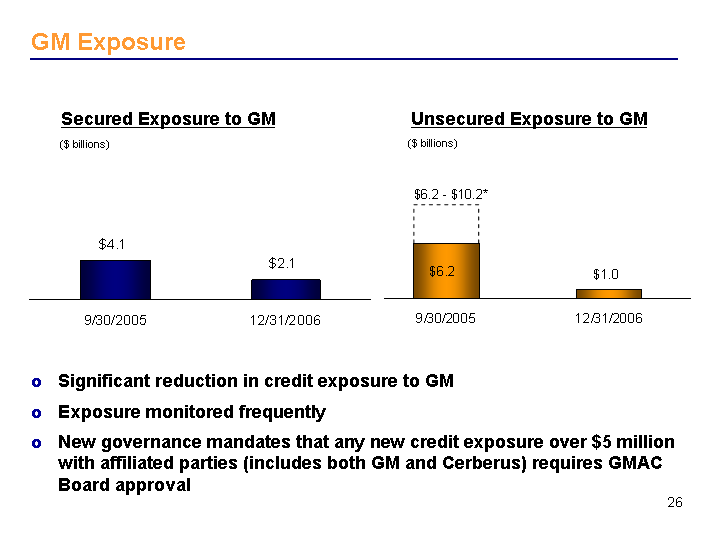
GM Exposure Significant reduction in credit exposure to GM Exposure monitored frequently New governance mandates that any new credit exposure over $5 million with affiliated parties (includes both GM and Cerberus) requires GMAC Board approval Secured Exposure to GM Unsecured Exposure to GM ($ billions) ($ billions) * Represents $4B undrawn GM credit line that expired on Sept. 30, 2006 $6.2 - $10.2* 26 |
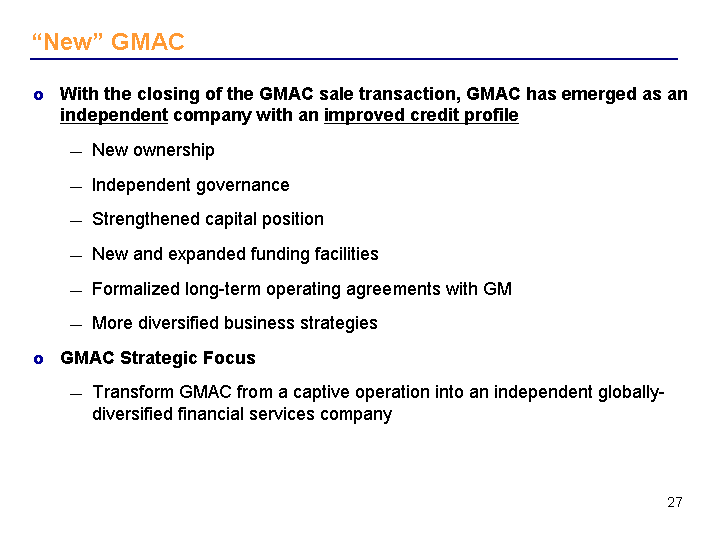
With the closing of the GMAC sale transaction, GMAC has emerged as an independent company with an improved credit profile New ownership Independent governance Strengthened capital position New and expanded funding facilities Formalized long-term operating agreements with GM More diversified business strategies GMAC Strategic Focus Transform GMAC from a captive operation into an independent globally- diversified financial services company "New" GMAC 27 |
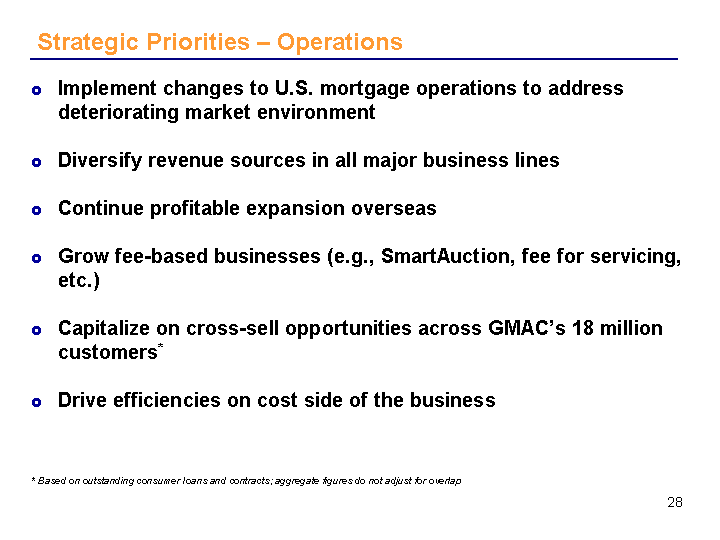
Implement changes to U.S. mortgage operations to address deteriorating market environment Diversify revenue sources in all major business lines Continue profitable expansion overseas Grow fee-based businesses (e.g., SmartAuction, fee for servicing, etc.) Capitalize on cross-sell opportunities across GMAC's 18 million customers* Drive efficiencies on cost side of the business Strategic Priorities - Operations * Based on outstanding consumer loans and contracts; aggregate figures do not adjust for overlap 28 |
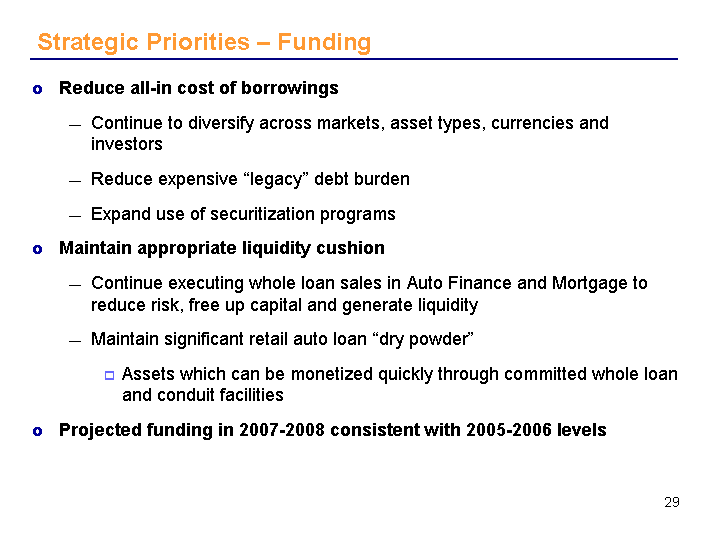
Reduce all-in cost of borrowings Continue to diversify across markets, asset types, currencies and investors Reduce expensive "legacy" debt burden Expand use of securitization programs Maintain appropriate liquidity cushion Continue executing whole loan sales in Auto Finance and Mortgage to reduce risk, free up capital and generate liquidity Maintain significant retail auto loan "dry powder" Assets which can be monetized quickly through committed whole loan and conduit facilities Projected funding in 2007-2008 consistent with 2005-2006 levels Strategic Priorities - Funding 29 |
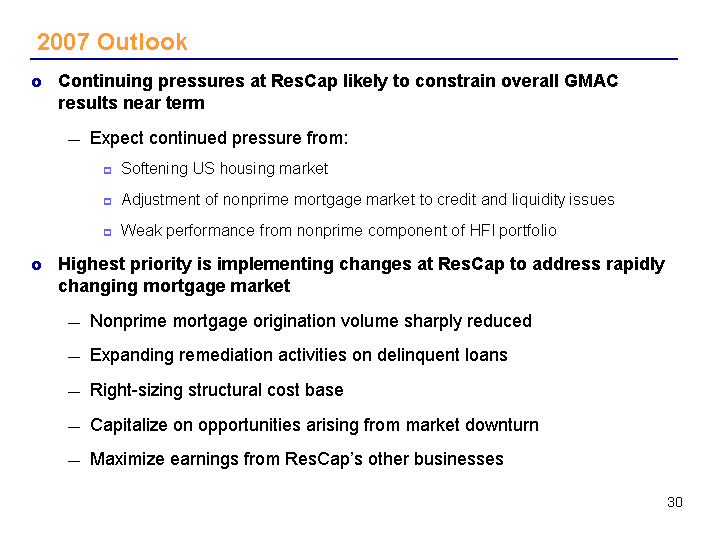
Continuing pressures at ResCap likely to constrain overall GMAC results near term Expect continued pressure from: Softening US housing market Adjustment of nonprime mortgage market to credit and liquidity issues Weak performance from nonprime component of HFI portfolio Highest priority is implementing changes at ResCap to address rapidly changing mortgage market Nonprime mortgage origination volume sharply reduced Expanding remediation activities on delinquent loans Right-sizing structural cost base Capitalize on opportunities arising from market downturn Maximize earnings from ResCap's other businesses 2007 Outlook 30 |
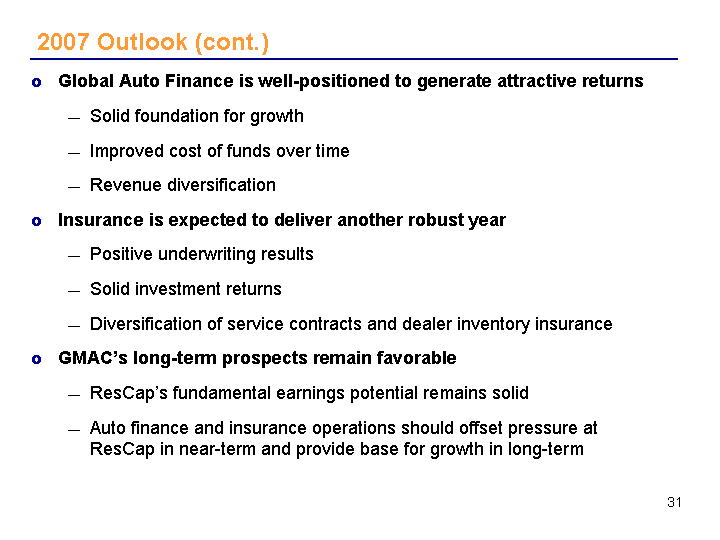
Global Auto Finance is well-positioned to generate attractive returns Solid foundation for growth Improved cost of funds over time Revenue diversification Insurance is expected to deliver another robust year Positive underwriting results Solid investment returns Diversification of service contracts and dealer inventory insurance GMAC's long-term prospects remain favorable ResCap's fundamental earnings potential remains solid Auto finance and insurance operations should offset pressure at ResCap in near-term and provide base for growth in long-term 2007 Outlook (cont.) 31 |
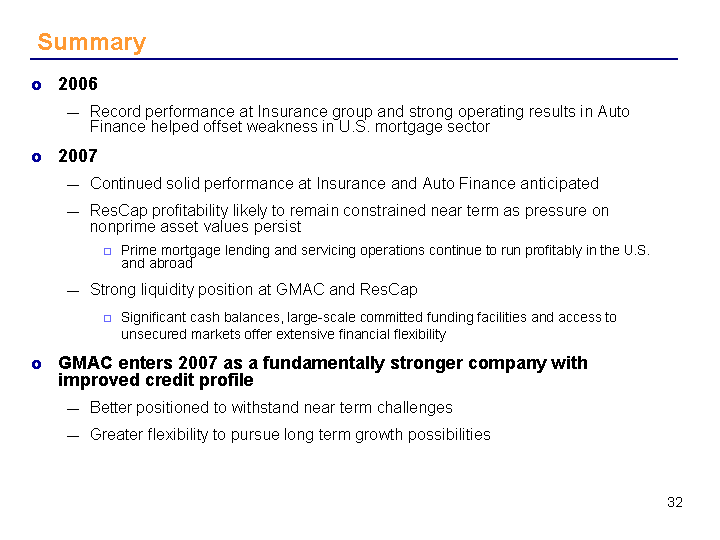
2006 Record performance at Insurance group and strong operating results in Auto Finance helped offset weakness in U.S. mortgage sector 2007 Continued solid performance at Insurance and Auto Finance anticipated ResCap profitability likely to remain constrained near term as pressure on nonprime asset values persist Prime mortgage lending and servicing operations continue to run profitably in the U.S. and abroad Strong liquidity position at GMAC and ResCap Significant cash balances, large-scale committed funding facilities and access to unsecured markets offer extensive financial flexibility GMAC enters 2007 as a fundamentally stronger company with improved credit profile Better positioned to withstand near term challenges Greater flexibility to pursue long term growth possibilities Summary 32 |
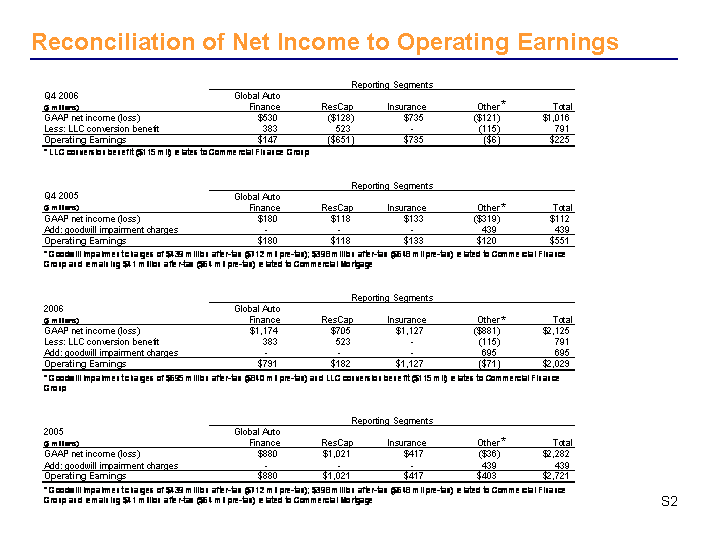
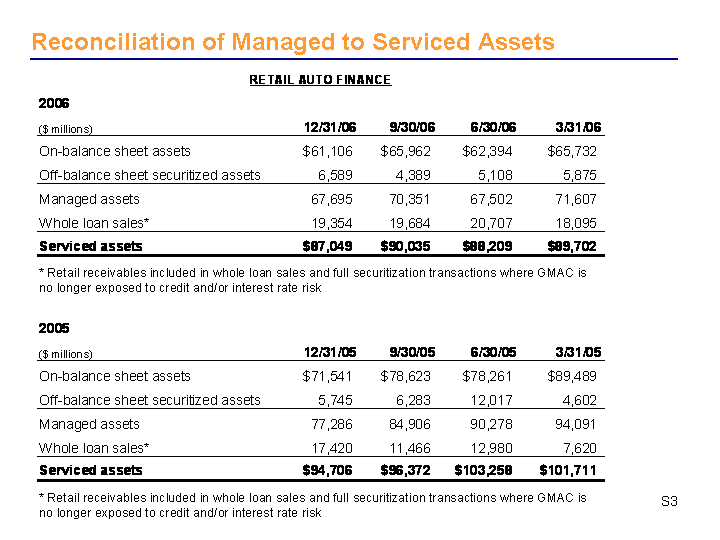
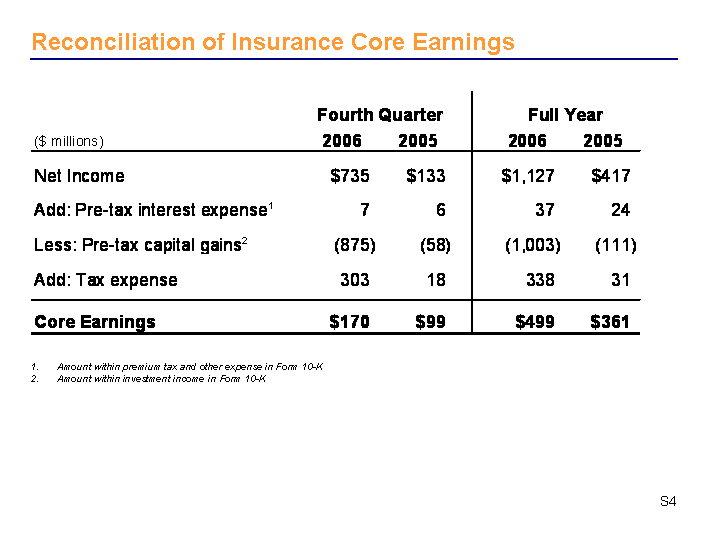
Supplemental Charts The following supplemental charts are provided to reconcile adjusted financial data comprehended in the primary chart set with GAAP-based data (per GMAC's financial statements) and/or provide clarification with regard to definition of non-GAAP terminology |
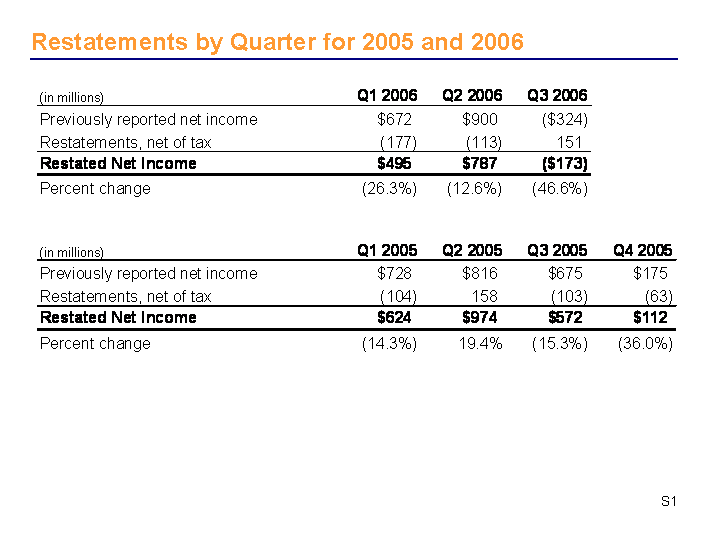
Restatements by Quarter for 2005 and 2006 S1 S1 |
Reconciliation of Net Income to Operating Earnings S2 * * * * |
Reconciliation of Managed to Serviced Assets S3 |
Reconciliation of Insurance Core Earnings Amount within premium tax and other expense in Form 10-K Amount within investment income in Form 10-K S4 |