 Preliminary
2009 First Quarter Results
May 5, 2009
9:00 AM EDT
Contact GMAC Investor Relations at (866) 710-4623 or investor.relations@gmacfs.com
 Forward-Looking Statements In the presentation that follows and related comments by GMAC LLC (“GMAC”) management, the use of the words “expect,” “anticipate,”
“estimate,” “forecast,” “initiative,” “objective,” “plan,” “goal,” “project,” “outlook,” “priorities,” “target,” “intend,” “evaluate,” “pursue,” “seek,” “may,”
“would,” “could,” “should,” “believe,” “potential,” “continue,” or similar expressions is intended to identify forward-looking statements. All
statements herein and in related management comments, other than statements of historical fact, including without limitation, statements about
future events and financial performance, are forward-looking statements that involve certain risks and uncertainties. While these statements
represent our current judgment on what the future may hold, and we believe these judgments are reasonable, these statements are not
guarantees of any events or financial results, and GMAC’s and Residential Capital, LLC’s (“ResCap”) actual results may differ materially due
to numerous important factors that are described in the most recent reports on SEC Forms 10-K and 10-Q for GMAC and ResCap, each of
which may be revised or supplemented in subsequent reports on SEC Forms 10-Q and 8-K. Such factors include, among others, the following:
the inability or unwillingness of the U.S. government to provide the additional liquidity and capital necessary for us to finance Chrysler LLC
(“Chrysler”) dealers and customers, and uncertainty around the ultimate form, amount and terms of such capital; our inability to successfully
accommodate the additional risk exposure relating to providing wholesale and retail financing to Chrysler dealers and customers and the
resulting impact to our financial stability; uncertainty related to Chrysler’s bankruptcy process and its proposed industrial alliance with Fiat SpA;
the success or lack thereof of Chrysler’s bankruptcy process and its proposed industrial alliance with Fiat SpA; our ability to recover any
payments or obligations owed to us by Chrysler during Chrysler’s bankruptcy process; uncertainty related to the new financing arrangement
between GMAC and Chrysler; securing low cost funding for GMAC and ResCap and maintaining the mutually beneficial relationship between
GMAC, General Motors Corporation (“GM”) and Chrysler; our ability to maintain an appropriate level of debt; the profitability and financial
condition of GM and Chrysler; our ability to realize the anticipated benefits associated with our recent conversion to a bank holding company,
and the increased regulation and restrictions that we will be subject to; uncertainty concerning our ability to access additional federal liquidity
programs; continued challenges in the residential mortgage and capital markets; continued deterioration in the residual value of off-lease
vehicles; the continuing negative impact on ResCap of the decline in the U.S. housing market; changes in U.S. government-sponsored
mortgage programs or disruptions in the markets in which our mortgage subsidiaries operate; disruptions in the market in which we fund
GMAC’s and ResCap’s operations, with resulting negative impact on our liquidity; changes in our accounting assumptions that may require or
that result from changes in the accounting rules or their application, which could result in an impact on earnings; changes in the credit ratings
of ResCap, GMAC, Chrysler or GM; changes in economic conditions, currency exchange rates or political stability in the markets in which we
operate; and changes in the existing or the adoption of new laws, regulations, policies or other activities of governments, agencies and similar
organizations. Investors are cautioned not to place undue reliance on forward-looking statements. GMAC undertakes no obligation to update
publicly or otherwise revise any forward-looking statements except where expressly required by law. A reconciliation of certain non-GAAP
financial measures included within this presentation is provided in the supplemental charts. Use of the term “loans” describes products associated with direct and indirect lending activities of GMAC’s global operations. The specific
products include retail installment sales contracts, loans, lines of credit, leases or other financing products. The term “originate” refers to
GMAC’s purchase, acquisition or direct origination of various “loan” products. 2
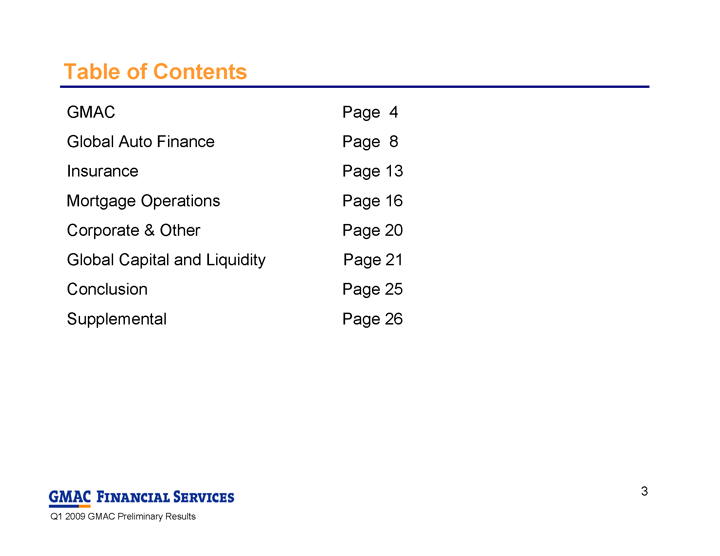 Table of Contents GMAC Page 4 Global Auto Finance Page 8 Insurance Page 13 Mortgage Operations Page 16 Corporate & Other Page 20 Global Capital and Liquidity Page 21 Conclusion Page 25 Supplemental Page 26 3
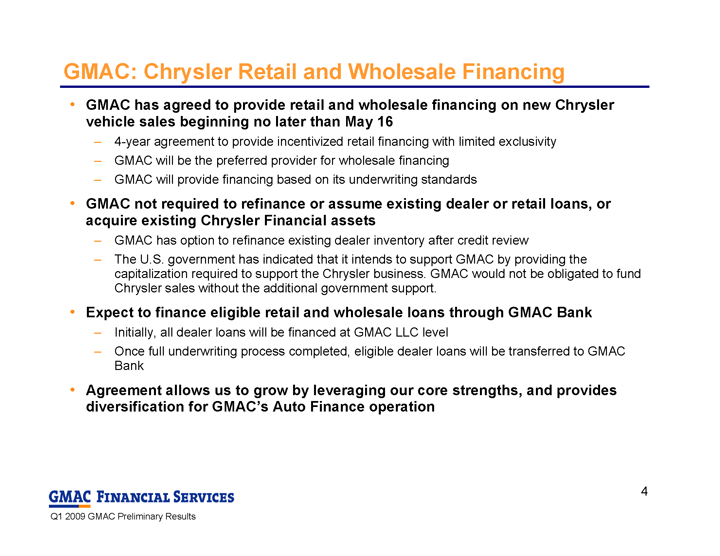 GMAC: Chrysler Retail and Wholesale Financing GMAC has agreed to provide retail and wholesale financing on new Chrysler
vehicle sales beginning no later than May 16 4-year agreement to provide incentivized retail financing with limited exclusivity GMAC will be the preferred provider for wholesale financing GMAC will provide financing based on its underwriting standards GMAC not required to refinance or assume existing dealer or retail loans, or
acquire existing Chrysler Financial assets GMAC has option to refinance existing dealer inventory after credit review The U.S. government has indicated that it intends to support GMAC by providing the
capitalization required to support the Chrysler business. GMAC would not be obligated to fund
Chrysler sales without the additional government support. Expect to finance eligible retail and wholesale loans through GMAC Bank Initially, all dealer loans will be financed at GMAC LLC level Once full underwriting process completed, eligible dealer loans will be transferred to GMAC
Bank Agreement allows us to grow by leveraging our core strengths, and provides
diversification for GMAC’s Auto Finance operation 4
 GMAC: Exposure to GM 1 – Secured exposure amounts primarily include various global wholesale funding activities. 2 – Unsecured exposure amounts primarily include residual risk sharing and other arrangements. Amounts include current amounts payable to GMAC by GM as well as
estimates of probable future amounts owed by GM. Note: Amounts include best estimates based on variables and assumptions and are subject to change based on new facts and circumstances. GMAC is heavily dependent on GM Many of our customers are those of GM, GM dealers and other GM-related employees GM’s level of automobile production and sales directly impacts our auto finance volume The resale value of GM vehicles affects the remarketing proceeds we receive upon the sale of
repossessed vehicles and off-lease vehicles at lease termination GMAC has credit exposure to GM Under the terms of certain agreements between GMAC and GM, GMAC has the right to offset
certain of its exposures to GM against amounts GMAC owes to GM Certain funding facilities have GM bankruptcy triggers SWIFT XI dealer floor plan securitization $11.4 billion secured revolver A GM bankruptcy does not trigger a GMAC bankruptcy filing Note: See GMAC 2008 10-K for additional disclosures ($ billions) 3/31/09 12/31/08 Global Secured Exposures 1 $2.0 $2.5 Global Unsecured Exposures (net) 2 $2.0 $1.9 5
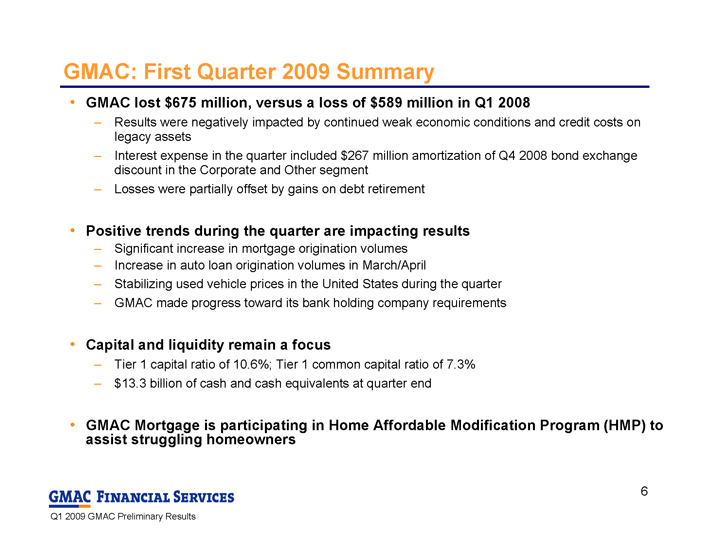 GMAC: First Quarter 2009 Summary GMAC lost $675 million, versus a loss of $589 million in Q1 2008 Results were negatively impacted by continued weak economic conditions and credit costs on
legacy assets Interest expense in the quarter included $267 million amortization of Q4 2008 bond exchange
discount in the Corporate and Other segment Losses were partially offset by gains on debt retirement Positive trends during the quarter are impacting results Significant increase in mortgage origination volumes Increase in auto loan origination volumes in March/April Stabilizing used vehicle prices in the United States during the quarter GMAC made progress toward its bank holding company requirements Capital and liquidity remain a focus Tier 1 capital ratio of 10.6%; Tier 1 common capital ratio of 7.3% $13.3 billion of cash and cash equivalents at quarter end GMAC Mortgage is participating in Home Affordable Modification Program (HMP) to
assist struggling homeowners 6
 GMAC: Net Income by Segment 1 - Corporate and Other segment includes Commercial Finance, equity investments and other corporate activities. Global Auto Finance results driven by weaker credit, partially offset by lower interest
expense Lower income at Insurance due to lower contract volumes and impairment of certain
investments Mortgage Operations results driven by gains on debt extinguishment and reduced MSR
valuations Corporate and Other segment results reflect the negative impact of valuation
adjustments and inter-company eliminations, partially offset by gains on debt
extinguishment ($ millions) Q1 '09 Q1 '08 North America $259 $154 International (34) 104 Global Automotive Finance 225 258 Insurance 50 132 Mortgage Operations (125) (859) Corporate and Other 1 (825) (120) Consolidated net income / (loss) ($675) ($589) 7
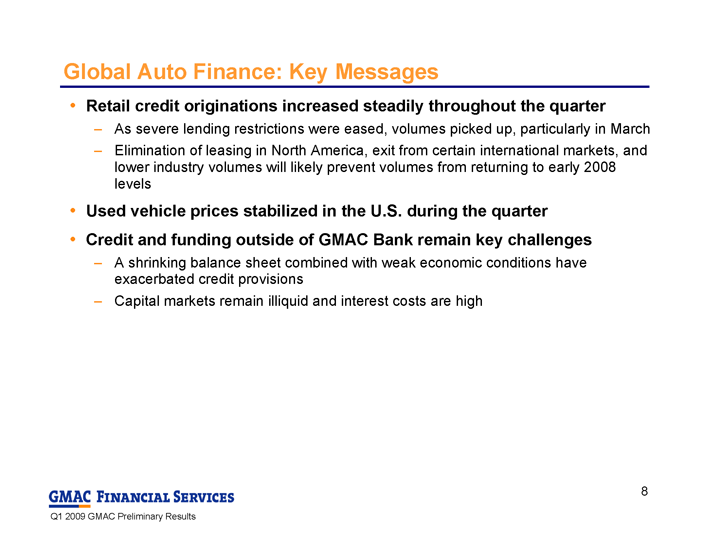 Global Auto Finance: Key Messages Retail credit originations increased steadily throughout the quarter As severe lending restrictions were eased, volumes picked up, particularly in March Elimination of leasing in North America, exit from certain international markets, and
lower industry volumes will likely prevent volumes from returning to early 2008
levels Used vehicle prices stabilized in the U.S. during the quarter Credit and funding outside of GMAC Bank remain key challenges A shrinking balance sheet combined with weak economic conditions have
exacerbated credit provisions Capital markets remain illiquid and interest costs are high 8
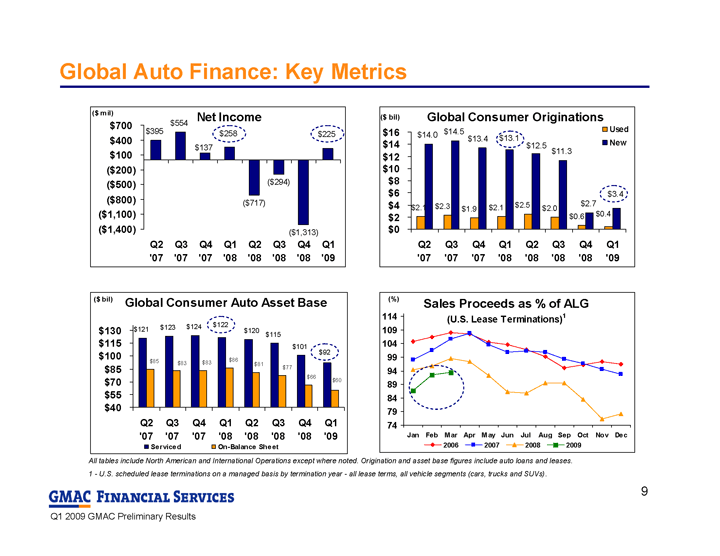 Global Auto Finance: Key Metrics ($ bil) All tables include North American and International Operations except where noted. Origination and asset base figures include auto loans and leases. 1 - U.S. scheduled lease terminations on a managed basis by termination year - all lease terms, all vehicle segments (cars, trucks and SUVs). Net Income $395 $554 ($717) ($294) ($1,313) $225 $258 $137 ($1,400) ($1,100) ($800) ($500) ($200) $100 $400 $700 Q2 '07 Q3 '07 Q4 '07 Q1 '08 Q2 '08 Q3 '08 Q4 '08 Q1 '09 ($ mil) Global Consumer Originations $14.0 $14.5 $11.3 $2.7 $2.1 $2.3 $1.9 $2.1 $2.5 $2.0 $0.4 $0.6 $3.4 $12.5 $13.4 $13.1 $0 $2 $4 $6 $8 $10 $12 $14 $16 Q2 '07 Q3 '07 Q4 '07 Q1 '08 Q2 '08 Q3 '08 Q4 '08 Q1 '09 Used New Global Consumer Auto Asset Base $121 $123 $124 $115 $101 $120 $122 $92 $85 $83 $83 $86 $81 $77 $66 $60 $40 $55 $70 $85 $100 $115 $130 Q2 '07 Q3 '07 Q4 '07 Q1 '08 Q2 '08 Q3 '08 Q4 '08 Q1 '09 Serviced On-Balance Sheet ($ bil) Sales Proceeds as % of ALG (U.S. Lease Terminations) 1 74 79 84 89 94 99 104 109 114 Jan Feb Mar Apr May Jun Jul Aug Sep Oct Nov Dec 2006 2007 2008 2009 (%) 9
 Global Auto Finance: Condensed Income Statement Notable Items (Pre-Tax) ($ millions) Q1 2009 Q1 2008 Revenue Total financing revenue and other interest income $3,388 $4,316 Interest expense 1,524 2,176 Depreciation expense on operating lease assets 1,153 1,396 Net financing revenue 711 744 Other revenue Servicing fees 67 78 Gain on automotive loans, net 106 148 Gain on extinguishment of debt 6 0 Other income (loss) on investments 20 (9) Other income 158 273 Total other revenue 357 490 Total net revenue 1,068 1,234 Provision for loan losses 189 172 Noninterest expense 674 766 (Loss) income before income tax (benefit) expense 205 296 Income tax (benefit) expense (20) 38 Net (loss) income $225 $258 ($ millions) Q1 2009 Q1 2008 Realized Losses and Impairment Charges on International Operating Leases (36) 0 Mark to Market on Retained Interests and Derivatives (103) 25 Credit Loss Provision for Retail Balloon Contract Residuals 57 (46) 10
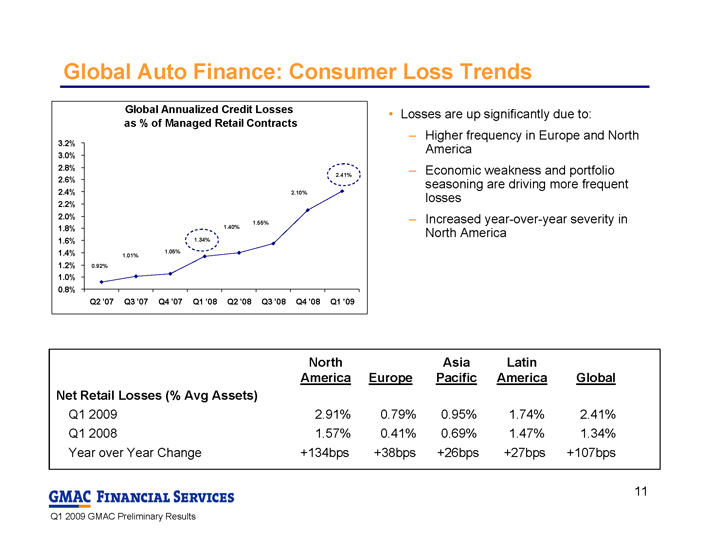 Global Auto Finance: Consumer Loss Trends Net Retail Losses (% Avg Assets) Q1 2009 2.91% 0.79% 0.95% 1.74% 2.41% Q1 2008 1.57% 0.41% 0.69% 1.47% 1.34% Year over Year Change +134bps +38bps +26bps +27bps +107bps North Asia Latin
America EuropePacific America Global Losses are up significantly due to: Higher frequency in Europe and North
America Economic weakness and portfolio
seasoning are driving more frequent
losses Increased year-over-year severity in
North America 1.55% 1.40% 1.34% 1.01% 1.05% 2.10% 0.92% 2.41% 0.8% 1.0% 1.2% 1.4% 1.6% 1.8% 2.0% 2.2% 2.4% 2.6% 2.8% 3.0% 3.2% Q2 '07 Q3 '07 Q4 '07 Q1 '08 Q2 '08 Q3 '08 Q4 '08 Q1 '09 Global Annualized Credit Losses as % of Managed Retail Contracts 11
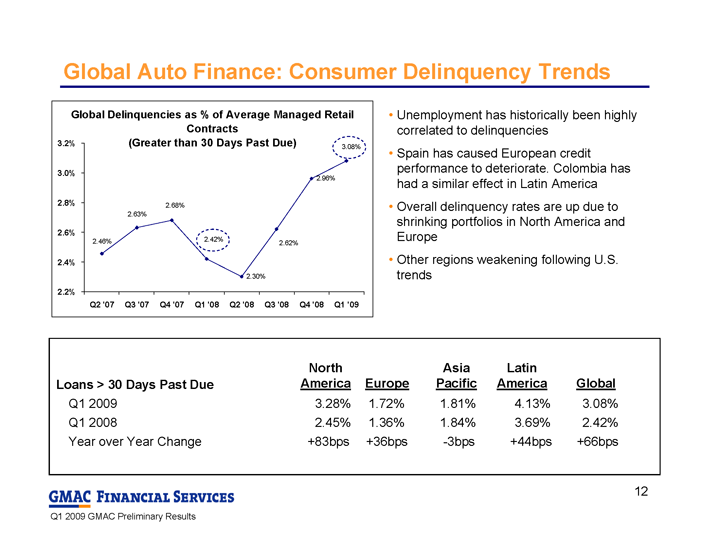 Global Auto Finance: Consumer Delinquency Trends Loans > 30 Days Past Due Q1 2009 3.28% 1.72% 1.81% 4.13% 3.08% Q1 2008 2.45% 1.36% 1.84% 3.69% 2.42% Year over Year Change +83bps +36bps -3bps +44bps +66bps North Asia Latin
AmericaEuropePacific America Global Unemployment has historically been highly
correlated to delinquencies Spain has caused European credit
performance to deteriorate. Colombia has
had a similar effect in Latin America Overall delinquency rates are up due to
shrinking portfolios in North America and
Europe Other regions weakening following U.S.
trends 2.30% 2.96% 2.46% 2.62% 2.63% 2.68% 3.08% 2.42% 2.2% 2.4% 2.6% 2.8% 3.0% 3.2% Q2 '07 Q3 '07 Q4 '07 Q1 '08 Q2 '08 Q3 '08 Q4 '08 Q1 '09 Global Delinquencies as % of Average Managed Retail Contracts (Greater than 30 Days Past Due) 12
 Insurance: Key Messages Written premium volumes are declining Weak economic conditions and low auto sales volumes are driving down written
premiums Sale of GMAC Reinsurance in Q4 2008 has also contributed to the decline The combined ratio has increased slightly Higher reserves for international book were a primary factor in the increase Adjusting product lines to reflect changing market and capture new business Exploring new products for international markets Exiting non-core business lines 13
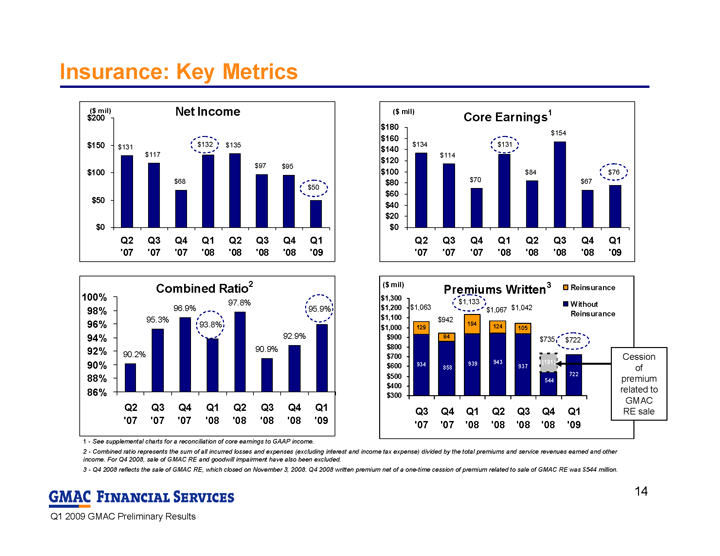 Insurance: Key Metrics ($ mil) 1 - See supplemental charts for a reconciliation of core earnings to GAAP income. 2 - Combined ratio represents the sum of all incurred losses and expenses (excluding interest and income tax expense) divided by the total premiums and service revenues earned and other
income. For Q4 2008, sale of GMAC RE and goodwill impairment have also been excluded. 3 - Q4 2008 reflects the sale of GMAC RE, which closed on November 3, 2008. Q4 2008 written premium net of a one-time cession of premium related to sale of GMAC RE was $544 million. Cession
of
premium
related to
GMAC
RE sale Net Income $131 $117 $68 $135 $97 $95 $132 $50 $0 $50 $100 $150 $200 Q2 '07 Q3 '07 Q4 '07 Q1 '08 Q2 '08 Q3 '08 Q4 '08 Q1 '09 ($ mil) Core Earnings 1 $134 $114 $70 $84 $154 $67 $76 $131 $0 $20 $40 $60 $80 $100 $120 $140 $160 $180 Q2 '07 Q3 '07 Q4 '07 Q1 '08 Q2 '08 Q3 '08 Q4 '08 Q1 '09 Combined Ratio 2 95.3% 96.9% 97.8% 90.9% 92.9% 95.9% 93.8% 90.2% 86% 88% 90% 92% 94% 96% 98% 100% Q2 '07 Q3 '07 Q4 '07 Q1 '08 Q2 '08 Q3 '08 Q4 '08 Q1 '09 Premiums Written 3 129 84 194 124 105 722 943 937 544 939 934 858 (191) $735 $722 $1,042 $1,067 $1,133 $942 $1,063 $300 $400 $500 $600 $700 $800 $900 $1,000 $1,100 $1,200 $1,300 Q3 '07 Q4 '07 Q1 '08 Q2 '08 Q3 '08 Q4 '08 Q1 '09 0 500 1000 1500 Reinsurance Without Reinsurance Insurance Total ($ mil) 14
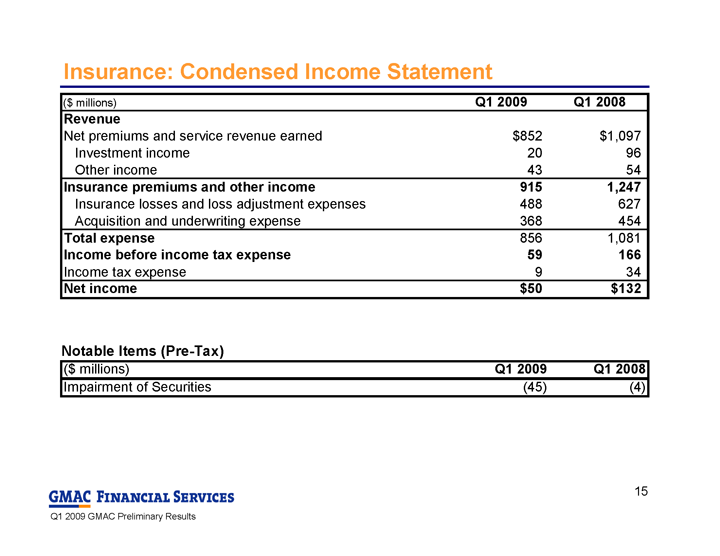 Insurance: Condensed Income Statement Notable Items (Pre-Tax) ($ millions) Q1 2009 Q1 2008 Revenue Net premiums and service revenue earned $852 $1,097 Investment income 20 96 Other income 43 54 Insurance premiums and other income 915 1,247 Insurance losses and loss adjustment expenses 488 627 Acquisition and underwriting expense 368 454 Total expense 856 1,081 Income before income tax expense 59 166 Income tax expense 9 34 Net income $50 $132 ($ millions) Q1 2009 Q1 2008 Impairment of Securities (45) (4) 15
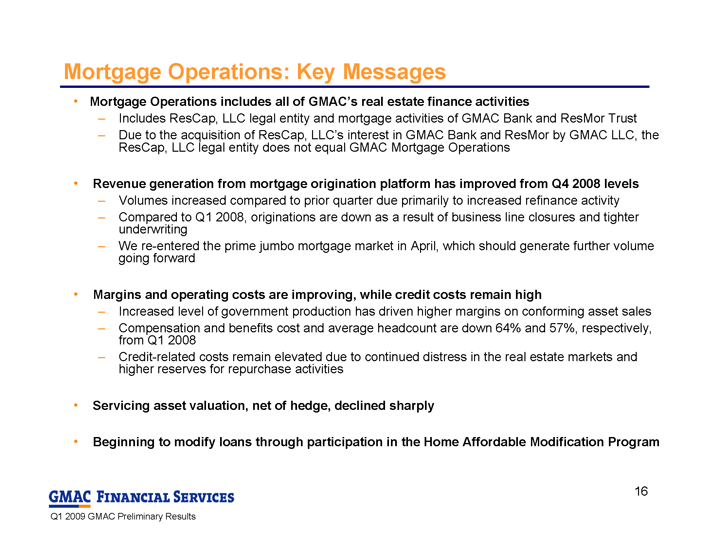 Mortgage Operations: Key Messages Mortgage Operations includes all of GMAC’s real estate finance activities Includes ResCap, LLC legal entity and mortgage activities of GMAC Bank and ResMor Trust Due to the acquisition of ResCap, LLC’s interest in GMAC Bank and ResMor by GMAC LLC, the
ResCap, LLC legal entity does not equal GMAC Mortgage Operations Revenue generation from mortgage origination platform has improved from Q4 2008 levels Volumes increased compared to prior quarter due primarily to increased refinance activity Compared to Q1 2008, originations are down as a result of business line closures and tighter
underwriting We re-entered the prime jumbo mortgage market in April, which should generate further volume
going forward Margins and operating costs are improving, while credit costs remain high Increased level of government production has driven higher margins on conforming asset sales Compensation and benefits cost and average headcount are down 64% and 57%, respectively,
from Q1 2008 Credit-related costs remain elevated due to continued distress in the real estate markets and
higher reserves for repurchase activities Servicing asset valuation, net of hedge, declined sharply Beginning to modify loans through participation in the Home Affordable Modification Program 16
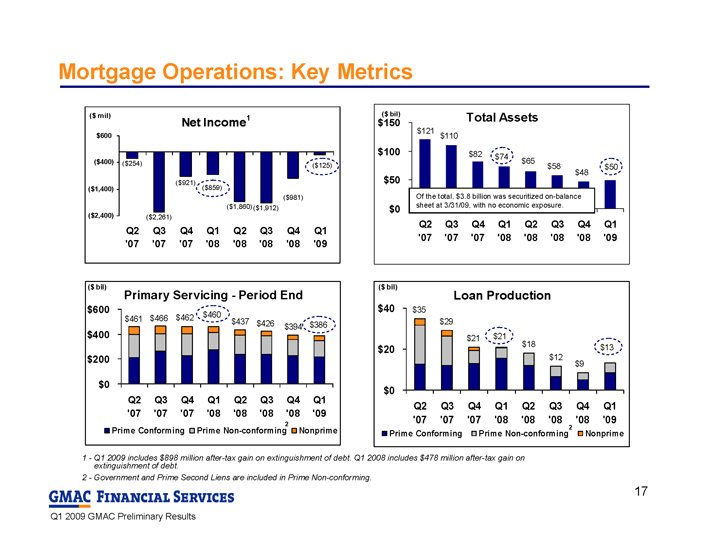 Mortgage Operations: Key Metrics 2 1 - Q1 2009 includes $898 million after-tax gain on extinguishment of debt. Q1 2008 includes $478 million after-tax gain on
extinguishment of debt. 2 - Government and Prime Second Liens are included in Prime Non-conforming. Of the total, $3.8 billion was securitized on-balance
sheet at 3/31/09, with no economic exposure. 2 2 Net Income 1 ($125) ($981) ($1,912) ($1,860) ($254) ($2,261) ($921) ($859) ($2,400) ($1,400) ($400) $600 Q2 '07 Q3 '07 Q4 '07 Q1 '08 Q2 '08 Q3 '08 Q4 '08 Q1 '09 ($ mil) Total Assets $121 $110 $82 $74 $65 $58 $48 $50 $0 $50 $100 $150 Q2 '07 Q3 '07 Q4 '07 Q1 '08 Q2 '08 Q3 '08 Q4 '08 Q1 '09 ($ bil) Primary Servicing - Period End $461 $466 $462 $460 $437 $426 $386 $394 $0 $200 $400 $600 Q2 '07 Q3 '07 Q4 '07 Q1 '08 Q2 '08 Q3 '08 Q4 '08 Q1 '09 Prime Conforming Prime Non-conforming Nonprime ($ bil) Loan Production $13 $9 $12 $18 $21 $21 $29 $35 $0 $20 $40 Q2 '07 Q3 '07 Q4 '07 Q1 '08 Q2 '08 Q3 '08 Q4 '08 Q1 '09 Prime Conforming Prime Non-conforming Nonprime ($ bil) 17
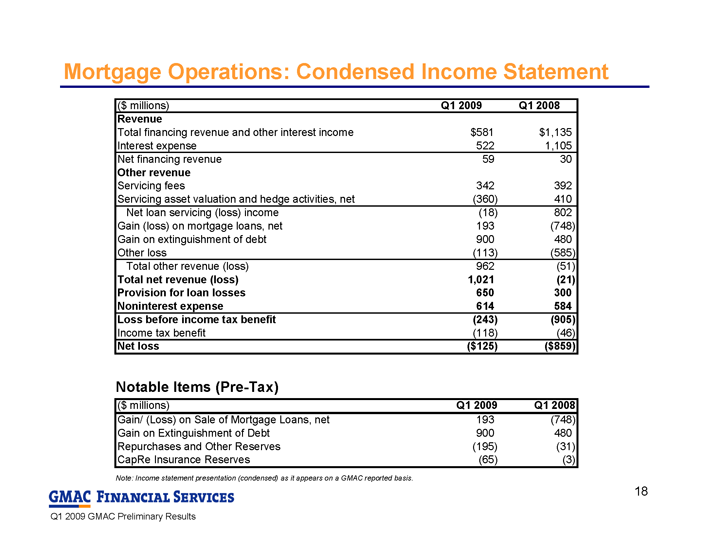 Mortgage Operations: Condensed Income Statement Note: Income statement presentation (condensed) as it appears on a GMAC reported basis. Notable Items (Pre-Tax) ($ millions) Q1 2009 Q1 2008 Revenue Total financing revenue and other interest income $581 $1,135 Interest expense 522 1,105 Net financing revenue 59 30 Other revenue Servicing fees 342 392 Servicing asset valuation and hedge activities, net (360) 410 Net loan servicing (loss) income (18) 802 Gain (loss) on mortgage loans, net 193 (748) Gain on extinguishment of debt 900 480 Other loss (113) (585) Total other revenue (loss) 962 (51) Total net revenue (loss) 1,021 (21) Provision for loan losses 650 300 Noninterest expense 614 584 Loss before income tax benefit (243) (905) Income tax benefit (118) (46) Net loss ($125) ($859) ($ millions) Q1 2009 Q1 2008 Gain/ (Loss) on Sale of Mortgage Loans, net 193 (748) Gain on Extinguishment of Debt 900 480 Repurchases and Other Reserves (195) (31) CapRe Insurance Reserves (65) (3) 18
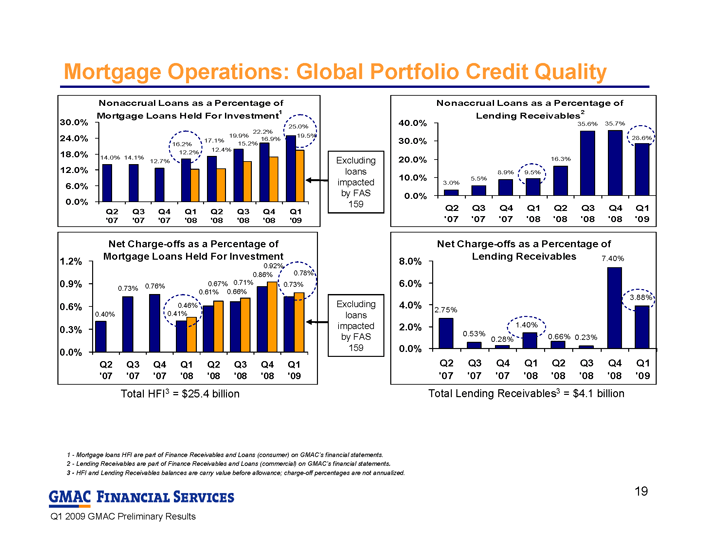 Mortgage Operations: Global Portfolio Credit Quality Excluding
loans
impacted
by FAS
159 Excluding
loans
impacted
by FAS
159 Total HFI3 = $25.4 billion Total Lending Receivables3 = $4.1 billion 1 - Mortgage loans HFI are part of Finance Receivables and Loans (consumer) on GMAC’s financial statements. 2 - Lending Receivables are part of Finance Receivables and Loans (commercial) on GMAC’s financial statements. 3 - HFI and Lending Receivables balances are carry value before allowance; charge-off percentages are not annualized. Nonaccrual Loans as a Percentage of Mortgage Loans Held For Investment 1 14.1% 12.7% 17.1% 16.2% 19.9% 22.2% 25.0% 14.0% 12.2% 12.4% 15.2% 16.9% 19.5% 0.0% 6.0% 12.0% 18.0% 24.0% 30.0% Q2 '07 Q3 '07 Q4 '07 Q1 '08 Q2 '08 Q3 '08 Q4 '08 Q1 '09 Nonaccrual Loans as a Percentage of Lending Receivables 2 3.0% 5.5% 8.9% 16.3% 35.6% 35.7% 28.6% 9.5% 0.0% 10.0% 20.0% 30.0% 40.0% Q2 '07 Q3 '07 Q4 '07 Q1 '08 Q2 '08 Q3 '08 Q4 '08 Q1 '09 Net Charge-offs as a Percentage of Mortgage Loans Held For Investment 0.73% 0.76% 0.61% 0.41% 0.66% 0.86% 0.40% 0.73% 0.46% 0.67% 0.71% 0.92% 0.78% 0.0% 0.3% 0.6% 0.9% 1.2% Q2 '07 Q3 '07 Q4 '07 Q1 '08 Q2 '08 Q3 '08 Q4 '08 Q1 '09 Net Charge-offs as a Percentage of Lending Receivables 2.75% 0.53% 0.23% 3.88% 7.40% 0.28% 1.40% 0.66% 0.0% 2.0% 4.0% 6.0% 8.0% Q2 '07 Q3 '07 Q4 '07 Q1 '08 Q2 '08 Q3 '08 Q4 '08 Q1 '09 19
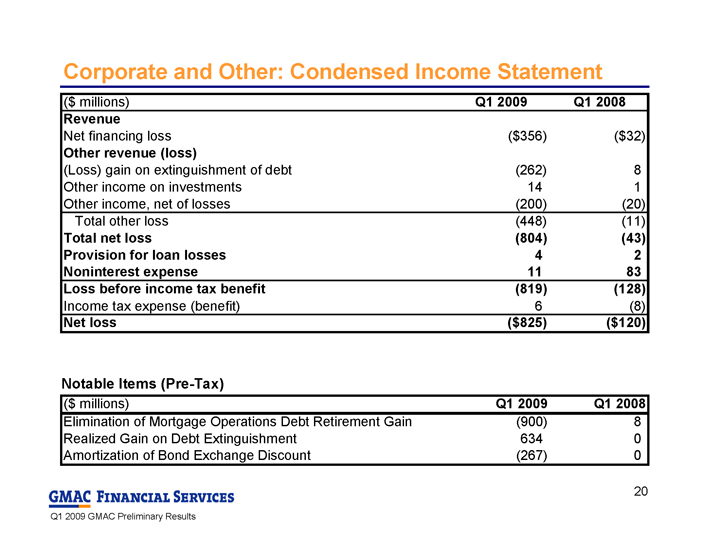 Corporate and Other: Condensed Income Statement Notable Items (Pre-Tax) ($ millions) Q1 2009 Q1 2008 Revenue Net financing loss ($356) ($32) Other revenue (loss) (Loss) gain on extinguishment of debt (262) 8 Other income on investments 14 1 Other income, net of losses (200) (20) Total other loss (448) (11) Total net loss (804) (43) Provision for loan losses 4 2 Noninterest expense 11 83 Loss before income tax benefit (819) (128) Income tax expense (benefit) 6 (8) Net loss ($825) ($120) ($ millions) Q1 2009 Q1 2008 Elimination of Mortgage Operations Debt Retirement Gain (900) 8 Realized Gain on Debt Extinguishment 634 0 Amortization of Bond Exchange Discount (267) 0 20
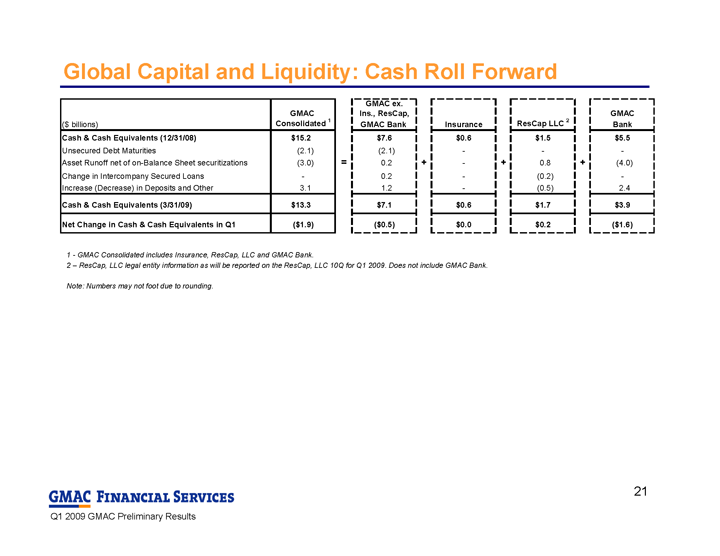 Global Capital and Liquidity: Cash Roll Forward 1 - GMAC Consolidated includes Insurance, ResCap, LLC and GMAC Bank. 2 – ResCap, LLC legal entity information as will be reported on the ResCap, LLC 10Q for Q1 2009. Does not include GMAC Bank. Note: Numbers may not foot due to rounding. GMAC ex. GMAC Ins., ResCap, GMAC ($ billions) Consolidated 1 GMAC Bank Insurance ResCap LLC 2 Bank Cash & Cash Equivalents (12/31/08) $15.2 $7.6 $0.6 $1.5 $5.5 Unsecured Debt Maturities (2.1) (2.1) - - - Asset Runoff net of on-Balance Sheet securitizations (3.0) = 0.2 + - + 0.8 + (4.0) Change in Intercompany Secured Loans - 0.2 - (0.2) - Increase (Decrease) in Deposits and Other 3.1 1.2 - (0.5) 2.4 Cash & Cash Equivalents (3/31/09) $13.3 $7.1 $0.6 $1.7 $3.9 Net Change in Cash & Cash Equivalents in Q1 ($1.9) ($0.5) $0.0 $0.2 ($1.6) 21
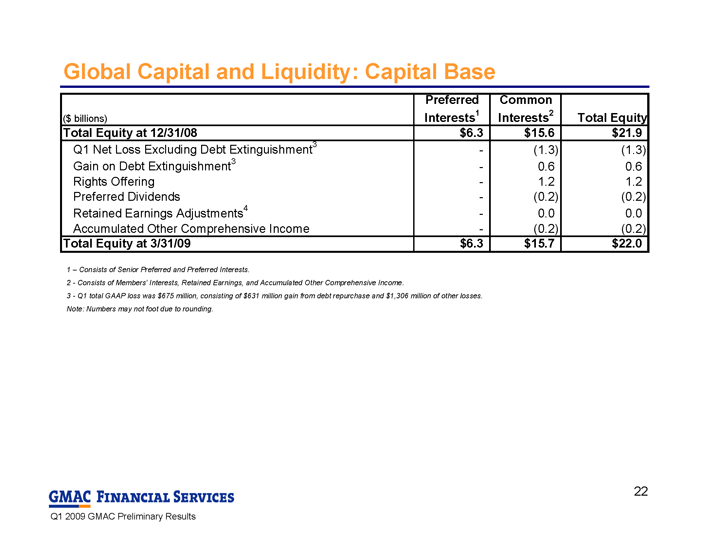 Global Capital and Liquidity: Capital Base 1 – Consists of Senior Preferred and Preferred Interests. 2 - Consists of Members’ Interests, Retained Earnings, and Accumulated Other Comprehensive Income. 3 - Q1 total GAAP loss was $675 million, consisting of $631 million gain from debt repurchase and $1,306 million of other losses. Note: Numbers may not foot due to rounding. ($ billions) Preferred Interests 1 Common Interests 2 Total Equity Total Equity at 12/31/08 $6.3 $15.6 $21.9 Q1 Net Loss Excluding Debt Extinguishment 3 - (1.3) (1.3) Gain on Debt Extinguishment 3 - 0.6 0.6 Rights Offering - 1.2 1.2 Preferred Dividends - (0.2) (0.2) Retained Earnings Adjustments 4 - 0.0 0.0 Accumulated Other Comprehensive Income - (0.2) (0.2) Total Equity at 3/31/09 $6.3 $15.7 $22.0 22
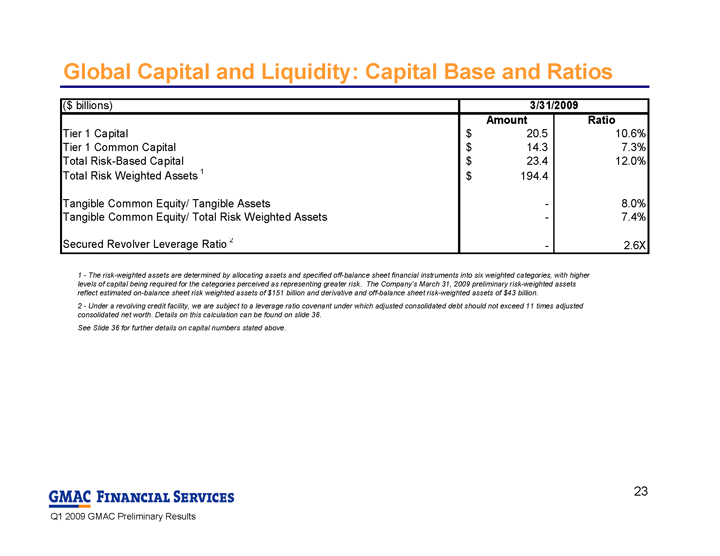 Global Capital and Liquidity: Capital Base and Ratios 1 - The risk-weighted assets are determined by allocating assets and specified off-balance sheet financial instruments into six weighted categories, with higher
levels of capital being required for the categories perceived as representing greater risk. The Company’s March 31, 2009 preliminary risk-weighted assets
reflect estimated on-balance sheet risk weighted assets of $151 billion and derivative and off-balance sheet risk-weighted assets of $43 billion. 2 - Under a revolving credit facility, we are subject to a leverage ratio covenant under which adjusted consolidated debt should not exceed 11 times adjusted
consolidated net worth. Details on this calculation can be found on slide 36. See Slide 36 for further details on capital numbers stated above. ($ billions) Amount Ratio Tier 1 Capital 20.5 $ 10.6% Tier 1 Common Capital 14.3 $ 7.3% Total Risk-Based Capital 23.4 $ 12.0% Total Risk Weighted Assets 1 194.4 $ Tangible Common Equity/ Tangible Assets - 8.0% Tangible Common Equity/ Total Risk Weighted Assets - 7.4% Secured Revolver Leverage Ratio 2 - 2.6X 3/31/2009 23
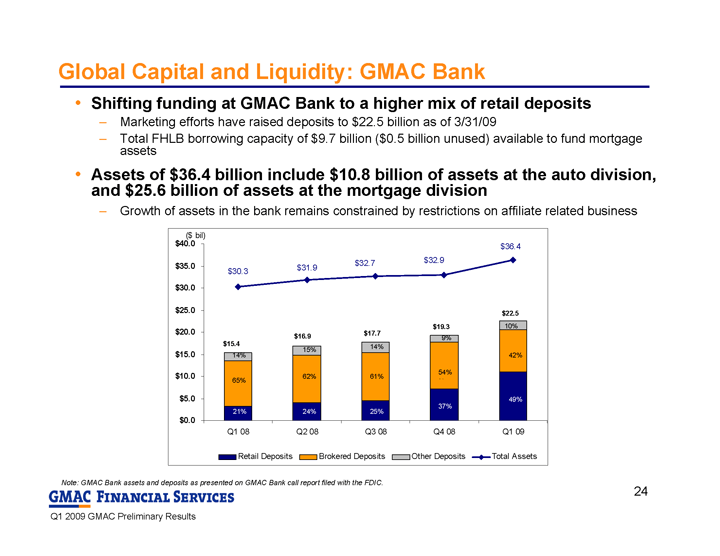 Global Capital and Liquidity: GMAC Bank Shifting funding at GMAC Bank to a higher mix of retail deposits Marketing efforts have raised deposits to $22.5 billion as of 3/31/09 Total FHLB borrowing capacity of $9.7 billion ($0.5 billion unused) available to fund mortgage
assets Assets of $36.4 billion include $10.8 billion of assets at the auto division,
and $25.6 billion of assets at the mortgage division Growth of assets in the bank remains constrained by restrictions on affiliate related business Note: GMAC Bank assets and deposits as presented on GMAC Bank call report filed with the FDIC. $30.3 $31.9 $32.7 $32.9 $36.4 $0.0 $5.0 $10.0 $15.0 $20.0 $25.0 $30.0 $35.0 $40.0 Q1 08 Q2 08 Q3 08 Q4 08 Q1 09 Retail Deposits Brokered Deposits Other Deposits Total Assets ($ bil) 14% 65% 49% 21% 42% 10% 37% 54% % 9% 25% 61% 14% 24% 62% 15% $15.4 $17.7 $19.3 $22.5 $16.9 24
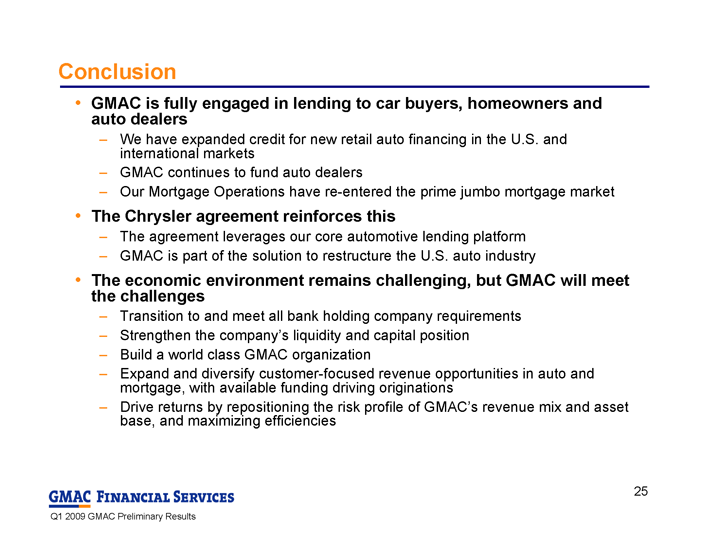 Conclusion GMAC is fully engaged in lending to car buyers, homeowners and
auto dealers We have expanded credit for new retail auto financing in the U.S. and
international markets GMAC continues to fund auto dealers Our Mortgage Operations have re-entered the prime jumbo mortgage market The Chrysler agreement reinforces this The agreement leverages our core automotive lending platform GMAC is part of the solution to restructure the U.S. auto industry The economic environment remains challenging, but GMAC will meet
the challenges Transition to and meet all bank holding company requirements Strengthen the company’s liquidity and capital position Build a world class GMAC organization Expand and diversify customer-focused revenue opportunities in auto and
mortgage, with available funding driving originations Drive returns by repositioning the risk profile of GMAC’s revenue mix and asset
base, and maximizing efficiencies 25
 Supplemental Charts
26
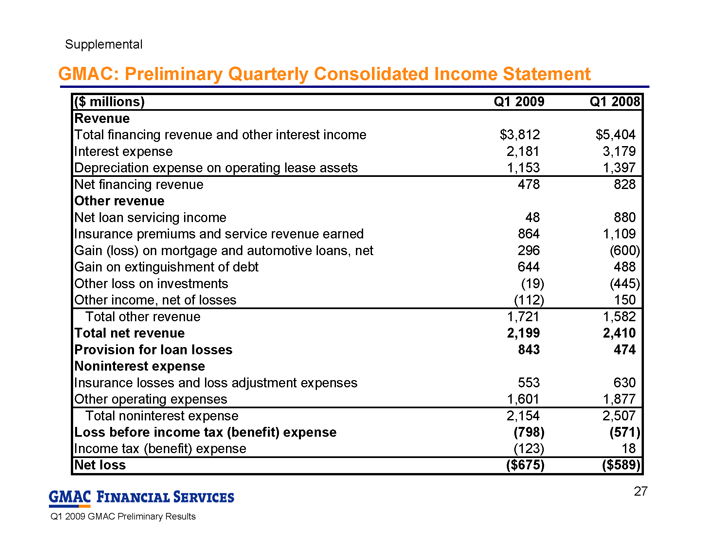 GMAC: Preliminary Quarterly Consolidated Income Statement Supplemental ($ millions) Q1 2009 Q1 2008 Revenue Total financing revenue and other interest income $3,812 $5,404 Interest expense 2,181 3,179 Depreciation expense on operating lease assets 1,153 1,397 Net financing revenue 478 828 Other revenue Net loan servicing income 48 880 Insurance premiums and service revenue earned 864 1,109 Gain (loss) on mortgage and automotive loans, net 296 (600) Gain on extinguishment of debt 644 488 Other loss on investments (19) (445) Other income, net of losses (112) 150 Total other revenue 1,721 1,582 Total net revenue 2,199 2,410 Provision for loan losses 843 474 Noninterest expense Insurance losses and loss adjustment expenses 553 630 Other operating expenses 1,601 1,877 Total noninterest expense 2,154 2,507 Loss before income tax (benefit) expense (798) (571) Income tax (benefit) expense (123) 18 Net loss ($675) ($589) 27
 GMAC: Preliminary Consolidated Balance Sheet Supplemental ($ billions) 3/31/2009 12/31/2008 Assets Cash and cash equivalents $13.3 $15.2 Investment securities 7.9 7.7 Loans held-for-sale 10.4 7.9 Finance receivables and loans, net of unearned income 96.0 100.1 Allowance for loan losses (3.6) (3.4) Investment in operating leases, net 23.5 26.4 Other assets 32.1 35.6 Total assets $179.6 $189.5 Liabilities Unsecured debt $49.2 $53.2 Secured debt 64.2 73.1 Total debt 113.4 126.3 Deposit liabilities 23.2 19.8 Other liabilities 21.0 21.5 Total liabilities 157.6 167.6 Equity 22.0 21.9 Total liabilities and equity $179.6 $189.5 28
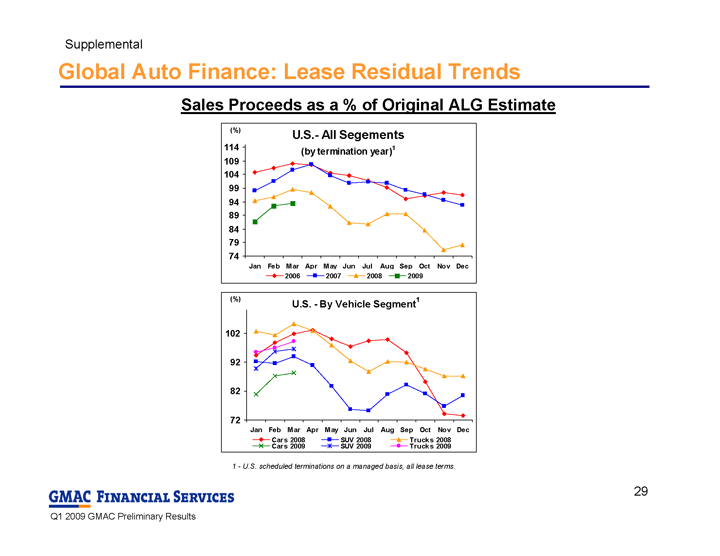 Global Auto Finance: Lease Residual Trends Sales Proceeds as a % of Original ALG Estimate 1 - U.S. scheduled terminations on a managed basis, all lease terms. Supplemental U.S.- All Segements (by termination year) 1 74 79 84 89 94 99 104 109 114 Jan Feb Mar Apr May Jun Jul Aug Sep Oct Nov Dec 2006 2007 2008 2009 (%) U.S. - By Vehicle Segment 1 72 82 92 102 Jan Feb Mar Apr May Jun Jul Aug Sep Oct Nov Dec Cars 2008 SUV 2008 Trucks 2008 Cars 2009 SUV 2009 Trucks 2009 (%) 29
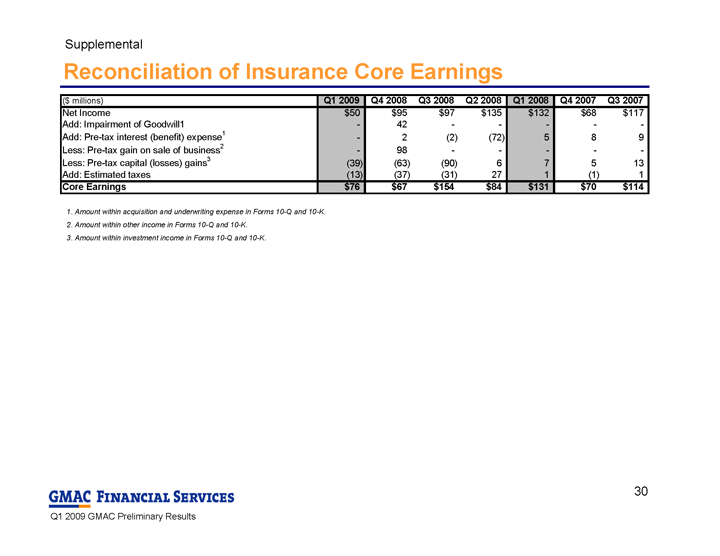 Reconciliation of Insurance Core Earnings Supplemental 3. Amount within investment income in Forms 10-Q and 10-K. 2. Amount within other income in Forms 10-Q and 10-K. 1. Amount within acquisition and underwriting expense in Forms 10-Q and 10-K. ($ millions) Q1 2009 Q4 2008 Q3 2008 Q2 2008 Q1 2008 Q4 2007 Q3 2007 Net Income $50 $95 $97 $135 $132 $68 $117 Add: Impairment of Goodwill1 - 42 - - - - - Add: Pre-tax interest (benefit) expense 1 - 2 (2) (72) 5 8 9 Less: Pre-tax gain on sale of business 2 - 98 - - - - - Less: Pre-tax capital (losses) gains 3 (39) (63) (90) 6 7 5 13 Add: Estimated taxes (13) (37) (31) 27 1 (1) 1 Core Earnings $76 $67 $154 $84 $131 $70 $114 30
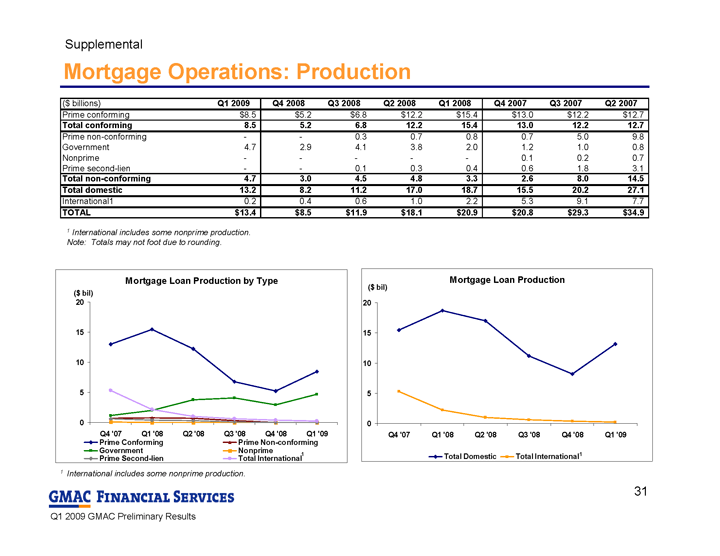 Mortgage Operations: Production 1 International includes some nonprime production. 1 1 Supplemental 1 International includes some nonprime production.
Note: Totals may not foot due to rounding. ($ billions) Q1 2009 Q4 2008 Q3 2008 Q2 2008 Q1 2008 Q4 2007 Q3 2007 Q2 2007 Prime conforming $8.5 $5.2 $6.8 $12.2 $15.4 $13.0 $12.2 $12.7 Total conforming 8.5 5.2 6.8 12.2 15.4 13.0 12.2 12.7 Prime non-conforming - - 0.3 0.7 0.8 0.7 5.0 9.8 Government 4.7 2.9 4.1 3.8 2.0 1.2 1.0 0.8 Nonprime - - - - - 0.1 0.2 0.7 Prime second-lien - - 0.1 0.3 0.4 0.6 1.8 3.1 Total non-conforming 4.7 3.0 4.5 4.8 3.3 2.6 8.0 14.5 Total domestic 13.2 8.2 11.2 17.0 18.7 15.5 20.2 27.1 International1 0.2 0.4 0.6 1.0 2.2 5.3 9.1 7.7 TOTAL $13.4 $8.5 $11.9 $18.1 $20.9 $20.8 $29.3 $34.9 Mortgage Loan Production by Type 0 5 10 15 20 Q4 '07 Q1 '08 Q2 '08 Q3 '08 Q4 '08 Q1 '09 Prime Conforming Prime Non-conforming Government Nonprime Prime Second-lien Total International ($ bil) Mortgage Loan Production 0 5 10 15 20 Q4 '07 Q1 '08 Q2 '08 Q3 '08 Q4 '08 Q1 '09 Total Domestic Total International ($ bil) 31
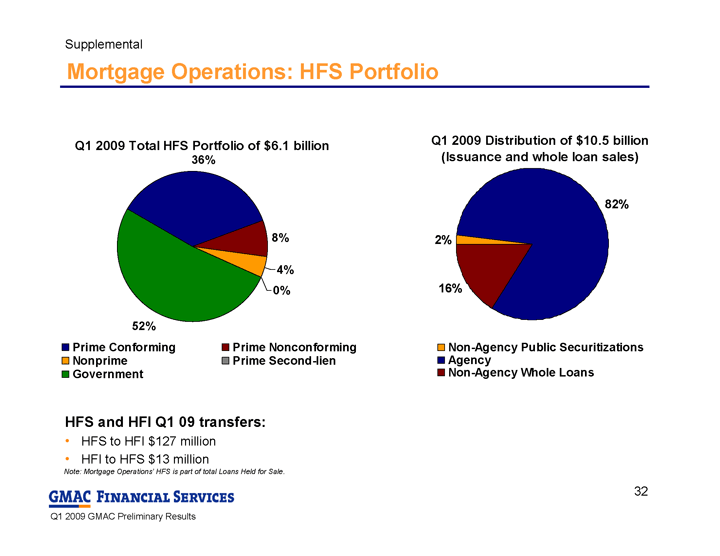 HFS and HFI Q1 09 transfers: HFS to HFI $127 million HFI to HFS $13 million Mortgage Operations: HFS Portfolio Supplemental Note: Mortgage Operations’ HFS is part of total Loans Held for Sale. Q1 2009 Total HFS Portfolio of $6.1 billion 36% 8% 4% 0% 52% Prime Conforming Prime Nonconforming Nonprime Prime Second-lien Government Q1 2009 Distribution of $10.5 billion (Issuance and whole loan sales) 2% 82% 16% Non-Agency Public Securitizations Agency Non-Agency Whole Loans 32
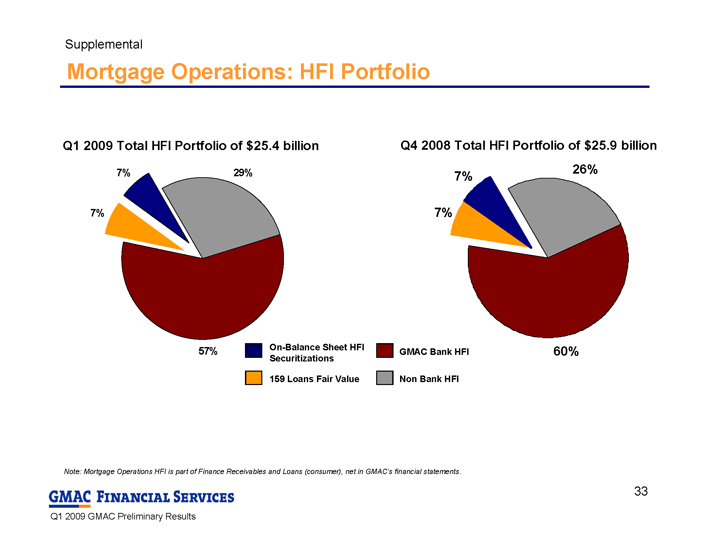 Mortgage Operations: HFI Portfolio GMAC Bank HFI On-Balance Sheet HFI
Securitizations Non Bank HFI 159 Loans Fair Value Supplemental Note: Mortgage Operations HFI is part of Finance Receivables and Loans (consumer), net in GMAC’s financial statements. Q1 2009 Total HFI Portfolio of $25.4 billion 29% 57% 7% 7% 7% 7% 33
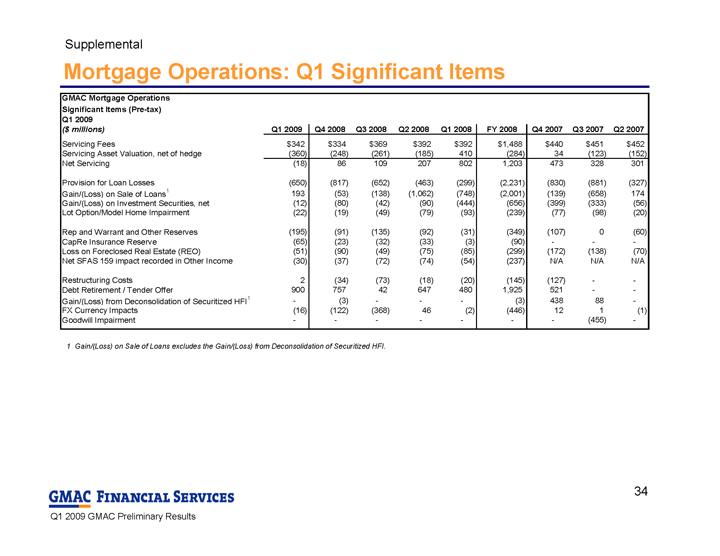 Mortgage Operations: Q1 Significant Items 1 Gain/(Loss) on Sale of Loans excludes the Gain/(Loss) from Deconsolidation of Securitized HFI. Supplemental GMAC Mortgage Operations Significant Items (Pre-tax) Q1 2009 ($ millions) Q1 2009 Q4 2008 Q3 2008 Q2 2008 Q1 2008 FY 2008 Q4 2007 Q3 2007 Q2 2007 Servicing Fees $342 $334 $369 $392 $392 $1,488 $440 $451 $452 Servicing Asset Valuation, net of hedge (360) (248) (261) (185) 410 (284) 34 (123) (152) Net Servicing (18) 86 109 207 802 1,203 473 328 301 Provision for Loan Losses (650) (817) (652) (463) (299) (2,231) (830) (881) (327) Gain/(Loss) on Sale of Loans 1 193 (53) (138) (1,062) (748) (2,001) (139) (658) 174 Gain/(Loss) on Investment Securities, net (12) (80) (42) (90) (444) (656) (399) (333) (56) Lot Option/Model Home Impairment (22) (19) (49) (79) (93) (239) (77) (98) (20) Rep and Warrant and Other Reserves (195) (91) (135) (92) (31) (349) (107) 0 (60) CapRe Insurance Reserve (65) (23) (32) (33) (3) (90) - - - Loss on Foreclosed Real Estate (REO) (51) (90) (49) (75) (85) (299) (172) (138) (70) Net SFAS 159 impact recorded in Other Income (30) (37) (72) (74) (54) (237) N/A N/A N/A Restructuring Costs 2 (34) (73) (18) (20) (145) (127) - - Debt Retirement / Tender Offer 900 757 42 647 480 1,925 521 - - Gain/(Loss) from Deconsolidation of Securitized HFI 1 - (3) - - - (3) 438 88 - FX Currency Impacts (16) (122) (368) 46 (2) (446) 12 1 (1) Goodwill Impairment - - - - - - - (455) - 34
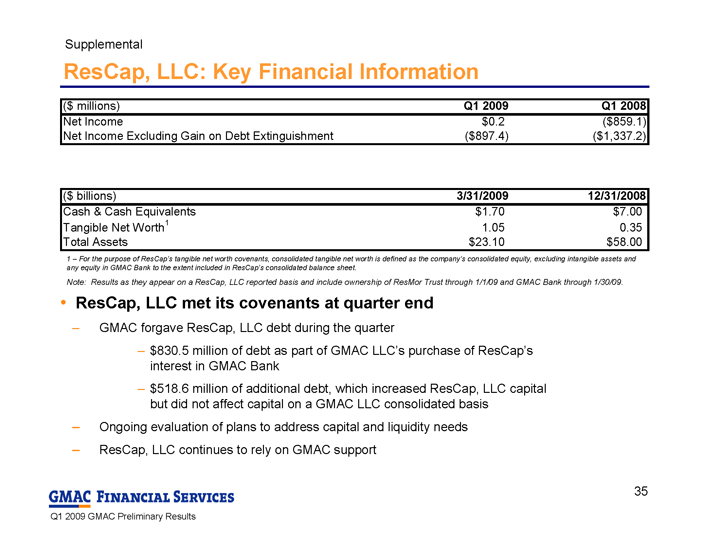 ResCap, LLC: Key Financial Information 1 – For the purpose of ResCap’s tangible net worth covenants, consolidated tangible net worth is defined as the company’s consolidated equity, excluding intangible assets and
any equity in GMAC Bank to the extent included in ResCap’s consolidated balance sheet. Note: Results as they appear on a ResCap, LLC reported basis and include ownership of ResMor Trust through 1/1/09 and GMAC Bank through 1/30/09. Supplemental ResCap, LLC met its covenants at quarter end GMAC forgave ResCap, LLC debt during the quarter $830.5 million of debt as part of GMAC LLC’s purchase of ResCap’s
interest in GMAC Bank $518.6 million of additional debt, which increased ResCap, LLC capital
but did not affect capital on a GMAC LLC consolidated basis Ongoing evaluation of plans to address capital and liquidity needs ResCap, LLC continues to rely on GMAC support ($ millions) Q1 2009 Q1 2008 Net Income $0.2 ($859.1) Net Income Excluding Gain on Debt Extinguishment ($897.4) ($1,337.2) ($ billions) 3/31/2009 12/31/2008 Cash & Cash Equivalents $1.70 $7.00 Tangible Net Worth 1 1.05 0.35 Total Assets $23.10 $58.00 35
 GMAC: Capital Measures as of 3/31/09 Supplemental Note: Numbers may not foot due to rounding. 1 - Mortgage Ops includes our current mortgage operations, which includes ResCap, LLC, as well as the mortgage
operations of GMAC Bank and Resmor Trust. Less: Adjusted ($ millions) GMAC LLC Mortgage Ops 1 leverage metrics Consolidated borrowed funds: Total debt $113,424 $27,565 $85,859 Less: Obligations of bankruptcy-remote SPEs (47,191) (3,415) (43,776) Intersegment eliminations - (5,297) 5,297 Consolidated borrowed funds used for leverage ratio 66,233 18,853 47,380 Consolidated net worth: Total equity 22,021 2,961 19,060 Less: Intersegment credit extensions (655) - (655) Consolidated net worth used for leverage ratio 21,366 2,961 18,405 Leverage ratio 2.6 Capital 3/31/2009 ($ billions) Shareholders’ equity 22.0 Less: Goodwill and certain other intangibles (1.4) Unrealized (gains) losses and other adjustments (0.1) Total Tier I Capital 20.5 Total tier I capital 20.5 Less: Senior Preferred (5.0) Preferred Interest (1.3) Tier 1 Common 14.3 Total tier I capital 20.5 Add: Qualifying subordinated debt and redeemable preferred stock 0.2 Allowance for loan and lease losses includible in Tier 2 capital 2.6 Total Risk-Based Capital 23.4 Total Equity 22.0 Less: Preferred Equity (6.3) Goodwill and intangible assets (1.4) Tangible Common Equity 14.3 Total Assets 179.6 Less: Goodwill and intangible assets (1.4) Tangible Assets 178.1 36
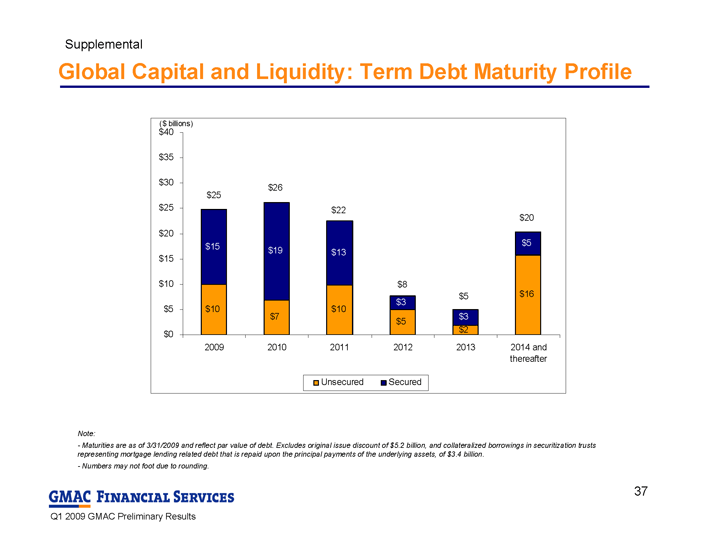 Global Capital and Liquidity: Term Debt Maturity Profile Supplemental Note: - Maturities are as of 3/31/2009 and reflect par value of debt. Excludes original issue discount of $5.2 billion, and collateralized borrowings in securitization trusts
representing mortgage lending related debt that is repaid upon the principal payments of the underlying assets, of $3.4 billion. - Numbers may not foot due to rounding. $10 $7 $10 $5 $2 $16 $15 $19 $13 $3 $3 $5 $5 $25 $26 $22 $20 $8 $0 $5 $10 $15 $20 $25 $30 $35 $40 2009 2010 2011 2012 2013 2014 and thereafter Unsecured Secured ($ billions) 37
 Preliminary
 Forward-Looking Statements In the presentation that follows and related comments by GMAC LLC (“GMAC”) management, the use of the words “expect,” “anticipate,”
 Table of Contents GMAC Page 4 Global Auto Finance Page 8 Insurance Page 13 Mortgage Operations Page 16 Corporate & Other Page 20 Global Capital and Liquidity Page 21 Conclusion Page 25 Supplemental Page 26 3
 GMAC: Chrysler Retail and Wholesale Financing GMAC has agreed to provide retail and wholesale financing on new Chrysler
 GMAC: Exposure to GM 1 – Secured exposure amounts primarily include various global wholesale funding activities. 2 – Unsecured exposure amounts primarily include residual risk sharing and other arrangements. Amounts include current amounts payable to GMAC by GM as well as
 GMAC: First Quarter 2009 Summary GMAC lost $675 million, versus a loss of $589 million in Q1 2008 Results were negatively impacted by continued weak economic conditions and credit costs on
 GMAC: Net Income by Segment 1 - Corporate and Other segment includes Commercial Finance, equity investments and other corporate activities. Global Auto Finance results driven by weaker credit, partially offset by lower interest
 Global Auto Finance: Key Messages Retail credit originations increased steadily throughout the quarter As severe lending restrictions were eased, volumes picked up, particularly in March Elimination of leasing in North America, exit from certain international markets, and
 Global Auto Finance: Key Metrics ($ bil) All tables include North American and International Operations except where noted. Origination and asset base figures include auto loans and leases. 1 - U.S. scheduled lease terminations on a managed basis by termination year - all lease terms, all vehicle segments (cars, trucks and SUVs). Net Income $395 $554 ($717) ($294) ($1,313) $225 $258 $137 ($1,400) ($1,100) ($800) ($500) ($200) $100 $400 $700 Q2 '07 Q3 '07 Q4 '07 Q1 '08 Q2 '08 Q3 '08 Q4 '08 Q1 '09 ($ mil) Global Consumer Originations $14.0 $14.5 $11.3 $2.7 $2.1 $2.3 $1.9 $2.1 $2.5 $2.0 $0.4 $0.6 $3.4 $12.5 $13.4 $13.1 $0 $2 $4 $6 $8 $10 $12 $14 $16 Q2 '07 Q3 '07 Q4 '07 Q1 '08 Q2 '08 Q3 '08 Q4 '08 Q1 '09 Used New Global Consumer Auto Asset Base $121 $123 $124 $115 $101 $120 $122 $92 $85 $83 $83 $86 $81 $77 $66 $60 $40 $55 $70 $85 $100 $115 $130 Q2 '07 Q3 '07 Q4 '07 Q1 '08 Q2 '08 Q3 '08 Q4 '08 Q1 '09 Serviced On-Balance Sheet ($ bil) Sales Proceeds as % of ALG (U.S. Lease Terminations) 1 74 79 84 89 94 99 104 109 114 Jan Feb Mar Apr May Jun Jul Aug Sep Oct Nov Dec 2006 2007 2008 2009 (%) 9
 Global Auto Finance: Condensed Income Statement Notable Items (Pre-Tax) ($ millions) Q1 2009 Q1 2008 Revenue Total financing revenue and other interest income $3,388 $4,316 Interest expense 1,524 2,176 Depreciation expense on operating lease assets 1,153 1,396 Net financing revenue 711 744 Other revenue Servicing fees 67 78 Gain on automotive loans, net 106 148 Gain on extinguishment of debt 6 0 Other income (loss) on investments 20 (9) Other income 158 273 Total other revenue 357 490 Total net revenue 1,068 1,234 Provision for loan losses 189 172 Noninterest expense 674 766 (Loss) income before income tax (benefit) expense 205 296 Income tax (benefit) expense (20) 38 Net (loss) income $225 $258 ($ millions) Q1 2009 Q1 2008 Realized Losses and Impairment Charges on International Operating Leases (36) 0 Mark to Market on Retained Interests and Derivatives (103) 25 Credit Loss Provision for Retail Balloon Contract Residuals 57 (46) 10
 Global Auto Finance: Consumer Loss Trends Net Retail Losses (% Avg Assets) Q1 2009 2.91% 0.79% 0.95% 1.74% 2.41% Q1 2008 1.57% 0.41% 0.69% 1.47% 1.34% Year over Year Change +134bps +38bps +26bps +27bps +107bps North Asia Latin
  Global Auto Finance: Consumer Delinquency Trends Loans > 30 Days Past Due Q1 2009 3.28% 1.72% 1.81% 4.13% 3.08% Q1 2008 2.45% 1.36% 1.84% 3.69% 2.42% Year over Year Change +83bps +36bps -3bps +44bps +66bps North Asia Latin
  Insurance: Key Messages Written premium volumes are declining Weak economic conditions and low auto sales volumes are driving down written
 Insurance: Key Metrics ($ mil) 1 - See supplemental charts for a reconciliation of core earnings to GAAP income. 2 - Combined ratio represents the sum of all incurred losses and expenses (excluding interest and income tax expense) divided by the total premiums and service revenues earned and other
 Insurance: Condensed Income Statement Notable Items (Pre-Tax) ($ millions) Q1 2009 Q1 2008 Revenue Net premiums and service revenue earned $852 $1,097 Investment income 20 96 Other income 43 54 Insurance premiums and other income 915 1,247 Insurance losses and loss adjustment expenses 488 627 Acquisition and underwriting expense 368 454 Total expense 856 1,081 Income before income tax expense 59 166 Income tax expense 9 34 Net income $50 $132 ($ millions) Q1 2009 Q1 2008 Impairment of Securities (45) (4) 15
 Mortgage Operations: Key Messages Mortgage Operations includes all of GMAC’s real estate finance activities Includes ResCap, LLC legal entity and mortgage activities of GMAC Bank and ResMor Trust Due to the acquisition of ResCap, LLC’s interest in GMAC Bank and ResMor by GMAC LLC, the
 Mortgage Operations: Key Metrics 2 1 - Q1 2009 includes $898 million after-tax gain on extinguishment of debt. Q1 2008 includes $478 million after-tax gain on
 Mortgage Operations: Condensed Income Statement Note: Income statement presentation (condensed) as it appears on a GMAC reported basis. Notable Items (Pre-Tax) ($ millions) Q1 2009 Q1 2008 Revenue Total financing revenue and other interest income $581 $1,135 Interest expense 522 1,105 Net financing revenue 59 30 Other revenue Servicing fees 342 392 Servicing asset valuation and hedge activities, net (360) 410 Net loan servicing (loss) income (18) 802 Gain (loss) on mortgage loans, net 193 (748) Gain on extinguishment of debt 900 480 Other loss (113) (585) Total other revenue (loss) 962 (51) Total net revenue (loss) 1,021 (21) Provision for loan losses 650 300 Noninterest expense 614 584 Loss before income tax benefit (243) (905) Income tax benefit (118) (46) Net loss ($125) ($859) ($ millions) Q1 2009 Q1 2008 Gain/ (Loss) on Sale of Mortgage Loans, net 193 (748) Gain on Extinguishment of Debt 900 480 Repurchases and Other Reserves (195) (31) CapRe Insurance Reserves (65) (3) 18
 Mortgage Operations: Global Portfolio Credit Quality Excluding
 Corporate and Other: Condensed Income Statement Notable Items (Pre-Tax) ($ millions) Q1 2009 Q1 2008 Revenue Net financing loss ($356) ($32) Other revenue (loss) (Loss) gain on extinguishment of debt (262) 8 Other income on investments 14 1 Other income, net of losses (200) (20) Total other loss (448) (11) Total net loss (804) (43) Provision for loan losses 4 2 Noninterest expense 11 83 Loss before income tax benefit (819) (128) Income tax expense (benefit) 6 (8) Net loss ($825) ($120) ($ millions) Q1 2009 Q1 2008 Elimination of Mortgage Operations Debt Retirement Gain (900) 8 Realized Gain on Debt Extinguishment 634 0 Amortization of Bond Exchange Discount (267) 0 20
 Global Capital and Liquidity: Cash Roll Forward 1 - GMAC Consolidated includes Insurance, ResCap, LLC and GMAC Bank. 2 – ResCap, LLC legal entity information as will be reported on the ResCap, LLC 10Q for Q1 2009. Does not include GMAC Bank. Note: Numbers may not foot due to rounding. GMAC ex. GMAC Ins., ResCap, GMAC ($ billions) Consolidated 1 GMAC Bank Insurance ResCap LLC 2 Bank Cash & Cash Equivalents (12/31/08) $15.2 $7.6 $0.6 $1.5 $5.5 Unsecured Debt Maturities (2.1) (2.1) - - - Asset Runoff net of on-Balance Sheet securitizations (3.0) = 0.2 + - + 0.8 + (4.0) Change in Intercompany Secured Loans - 0.2 - (0.2) - Increase (Decrease) in Deposits and Other 3.1 1.2 - (0.5) 2.4 Cash & Cash Equivalents (3/31/09) $13.3 $7.1 $0.6 $1.7 $3.9 Net Change in Cash & Cash Equivalents in Q1 ($1.9) ($0.5) $0.0 $0.2 ($1.6) 21
 Global Capital and Liquidity: Capital Base 1 – Consists of Senior Preferred and Preferred Interests. 2 - Consists of Members’ Interests, Retained Earnings, and Accumulated Other Comprehensive Income. 3 - Q1 total GAAP loss was $675 million, consisting of $631 million gain from debt repurchase and $1,306 million of other losses. Note: Numbers may not foot due to rounding. ($ billions) Preferred Interests 1 Common Interests 2 Total Equity Total Equity at 12/31/08 $6.3 $15.6 $21.9 Q1 Net Loss Excluding Debt Extinguishment 3 - (1.3) (1.3) Gain on Debt Extinguishment 3 - 0.6 0.6 Rights Offering - 1.2 1.2 Preferred Dividends - (0.2) (0.2) Retained Earnings Adjustments 4 - 0.0 0.0 Accumulated Other Comprehensive Income - (0.2) (0.2) Total Equity at 3/31/09 $6.3 $15.7 $22.0 22
 Global Capital and Liquidity: Capital Base and Ratios 1 - The risk-weighted assets are determined by allocating assets and specified off-balance sheet financial instruments into six weighted categories, with higher
 Global Capital and Liquidity: GMAC Bank Shifting funding at GMAC Bank to a higher mix of retail deposits Marketing efforts have raised deposits to $22.5 billion as of 3/31/09 Total FHLB borrowing capacity of $9.7 billion ($0.5 billion unused) available to fund mortgage
 Conclusion GMAC is fully engaged in lending to car buyers, homeowners and
 Supplemental Charts
 GMAC: Preliminary Quarterly Consolidated Income Statement Supplemental ($ millions) Q1 2009 Q1 2008 Revenue Total financing revenue and other interest income $3,812 $5,404 Interest expense 2,181 3,179 Depreciation expense on operating lease assets 1,153 1,397 Net financing revenue 478 828 Other revenue Net loan servicing income 48 880 Insurance premiums and service revenue earned 864 1,109 Gain (loss) on mortgage and automotive loans, net 296 (600) Gain on extinguishment of debt 644 488 Other loss on investments (19) (445) Other income, net of losses (112) 150 Total other revenue 1,721 1,582 Total net revenue 2,199 2,410 Provision for loan losses 843 474 Noninterest expense Insurance losses and loss adjustment expenses 553 630 Other operating expenses 1,601 1,877 Total noninterest expense 2,154 2,507 Loss before income tax (benefit) expense (798) (571) Income tax (benefit) expense (123) 18 Net loss ($675) ($589) 27
 GMAC: Preliminary Consolidated Balance Sheet Supplemental ($ billions) 3/31/2009 12/31/2008 Assets Cash and cash equivalents $13.3 $15.2 Investment securities 7.9 7.7 Loans held-for-sale 10.4 7.9 Finance receivables and loans, net of unearned income 96.0 100.1 Allowance for loan losses (3.6) (3.4) Investment in operating leases, net 23.5 26.4 Other assets 32.1 35.6 Total assets $179.6 $189.5 Liabilities Unsecured debt $49.2 $53.2 Secured debt 64.2 73.1 Total debt 113.4 126.3 Deposit liabilities 23.2 19.8 Other liabilities 21.0 21.5 Total liabilities 157.6 167.6 Equity 22.0 21.9 Total liabilities and equity $179.6 $189.5 28
 Global Auto Finance: Lease Residual Trends Sales Proceeds as a % of Original ALG Estimate 1 - U.S. scheduled terminations on a managed basis, all lease terms. Supplemental U.S.- All Segements (by termination year) 1 74 79 84 89 94 99 104 109 114 Jan Feb Mar Apr May Jun Jul Aug Sep Oct Nov Dec 2006 2007 2008 2009 (%) U.S. - By Vehicle Segment 1 72 82 92 102 Jan Feb Mar Apr May Jun Jul Aug Sep Oct Nov Dec Cars 2008 SUV 2008 Trucks 2008 Cars 2009 SUV 2009 Trucks 2009 (%) 29
 Reconciliation of Insurance Core Earnings Supplemental 3. Amount within investment income in Forms 10-Q and 10-K. 2. Amount within other income in Forms 10-Q and 10-K. 1. Amount within acquisition and underwriting expense in Forms 10-Q and 10-K. ($ millions) Q1 2009 Q4 2008 Q3 2008 Q2 2008 Q1 2008 Q4 2007 Q3 2007 Net Income $50 $95 $97 $135 $132 $68 $117 Add: Impairment of Goodwill1 - 42 - - - - - Add: Pre-tax interest (benefit) expense 1 - 2 (2) (72) 5 8 9 Less: Pre-tax gain on sale of business 2 - 98 - - - - - Less: Pre-tax capital (losses) gains 3 (39) (63) (90) 6 7 5 13 Add: Estimated taxes (13) (37) (31) 27 1 (1) 1 Core Earnings $76 $67 $154 $84 $131 $70 $114 30
 Mortgage Operations: Production 1 International includes some nonprime production. 1 1 Supplemental 1 International includes some nonprime production.
 HFS and HFI Q1 09 transfers: HFS to HFI $127 million HFI to HFS $13 million Mortgage Operations: HFS Portfolio Supplemental Note: Mortgage Operations’ HFS is part of total Loans Held for Sale. Q1 2009 Total HFS Portfolio of $6.1 billion 36% 8% 4% 0% 52% Prime Conforming Prime Nonconforming Nonprime Prime Second-lien Government Q1 2009 Distribution of $10.5 billion (Issuance and whole loan sales) 2% 82% 16% Non-Agency Public Securitizations Agency Non-Agency Whole Loans 32
 Mortgage Operations: HFI Portfolio GMAC Bank HFI On-Balance Sheet HFI
 Mortgage Operations: Q1 Significant Items 1 Gain/(Loss) on Sale of Loans excludes the Gain/(Loss) from Deconsolidation of Securitized HFI. Supplemental GMAC Mortgage Operations Significant Items (Pre-tax) Q1 2009 ($ millions) Q1 2009 Q4 2008 Q3 2008 Q2 2008 Q1 2008 FY 2008 Q4 2007 Q3 2007 Q2 2007 Servicing Fees $342 $334 $369 $392 $392 $1,488 $440 $451 $452 Servicing Asset Valuation, net of hedge (360) (248) (261) (185) 410 (284) 34 (123) (152) Net Servicing (18) 86 109 207 802 1,203 473 328 301 Provision for Loan Losses (650) (817) (652) (463) (299) (2,231) (830) (881) (327) Gain/(Loss) on Sale of Loans 1 193 (53) (138) (1,062) (748) (2,001) (139) (658) 174 Gain/(Loss) on Investment Securities, net (12) (80) (42) (90) (444) (656) (399) (333) (56) Lot Option/Model Home Impairment (22) (19) (49) (79) (93) (239) (77) (98) (20) Rep and Warrant and Other Reserves (195) (91) (135) (92) (31) (349) (107) 0 (60) CapRe Insurance Reserve (65) (23) (32) (33) (3) (90) - - - Loss on Foreclosed Real Estate (REO) (51) (90) (49) (75) (85) (299) (172) (138) (70) Net SFAS 159 impact recorded in Other Income (30) (37) (72) (74) (54) (237) N/A N/A N/A Restructuring Costs 2 (34) (73) (18) (20) (145) (127) - - Debt Retirement / Tender Offer 900 757 42 647 480 1,925 521 - - Gain/(Loss) from Deconsolidation of Securitized HFI 1 - (3) - - - (3) 438 88 - FX Currency Impacts (16) (122) (368) 46 (2) (446) 12 1 (1) Goodwill Impairment - - - - - - - (455) - 34
 ResCap, LLC: Key Financial Information 1 – For the purpose of ResCap’s tangible net worth covenants, consolidated tangible net worth is defined as the company’s consolidated equity, excluding intangible assets and
 GMAC: Capital Measures as of 3/31/09 Supplemental Note: Numbers may not foot due to rounding. 1 - Mortgage Ops includes our current mortgage operations, which includes ResCap, LLC, as well as the mortgage
 Global Capital and Liquidity: Term Debt Maturity Profile Supplemental Note: - Maturities are as of 3/31/2009 and reflect par value of debt. Excludes original issue discount of $5.2 billion, and collateralized borrowings in securitization trusts