 Contact GMAC Investor Relations at (866) 710-4623 or investor.relations@gmacfs.com Preliminary
2010
First Quarter
Results
May 3, 2010
10:00 AM EDT
 Forward-Looking Statements In the presentation that follows and related comments by GMAC Inc. (“GMAC”) management, the use of the words “expect,” “anticipate,”
“estimate,” “forecast,” “initiative,” “objective,” “plan,” “goal,” “project,” “outlook,” “priorities,” “target,” “explore,” “positions,” “intend,” “evaluate,”
“pursue,” “seek,” “may,” “would,” “could,” “should,” “believe,” “potential,” “continue,” or similar expressions is intended to identify forward-
looking statements. All statements herein and in related management comments, other than statements of historical fact, including without
limitation, statements about future events and financial performance, are forward-looking statements that involve certain risks and
uncertainties. While these statements represent our current judgment on what the future may hold, and we believe these judgments are
reasonable, these statements are not guarantees of any events or financial results, and GMAC’s actual results may differ materially due to
numerous important factors that are described in the most recent reports on SEC Forms 10-K and 10-Q for GMAC, each of which may be
revised or supplemented in subsequent reports on SEC Forms 10-Q and 8-K. Such factors include, among others, the following: uncertainty of
GMAC's ability to enter into transactions or execute strategic alternatives to realize the value of its Residential Capital, LLC (“ResCap”)
operations; our inability to repay our outstanding obligations to the U.S. Department of the Treasury, or to do so in a timely fashion and without
disruption to our business; our inability to successfully accommodate the additional risk exposure relating to providing wholesale and retail
financing to Chrysler dealers and customers and the resulting impact to our financial stability; uncertainty related to Chrysler’s and GM’s recent
exits from bankruptcy; uncertainty related to the new financing arrangement between GMAC and Chrysler; securing low cost funding for
GMAC and ResCap and maintaining the mutually beneficial relationship between GMAC and GM, and GMAC and Chrysler; our ability to
maintain an appropriate level of debt and capital; the profitability and financial condition of GM and Chrysler; our ability to realize the
anticipated benefits associated with our recent conversion to a bank holding company, and the increased regulation and restrictions that we
are now subject to; continued challenges in the residential mortgage and capital markets; the potential for deterioration in the residual value of
off-lease vehicles; the continuing negative impact on ResCap of the decline in the U.S. housing market; changes in U.S. government-
sponsored mortgage programs or disruptions in the markets in which our mortgage subsidiaries operate; disruptions in the market in which we
fund GMAC’s and ResCap’s operations, with resulting negative impact on our liquidity; changes in our accounting assumptions that may
require or that result from changes in the accounting rules or their application, which could result in an impact on earnings; changes in the
credit ratings of ResCap, GMAC, Chrysler or GM; changes in economic conditions, currency exchange rates or political stability in the markets
in which we operate; and changes in the existing or the adoption of new laws, regulations, policies or other activities of governments, agencies
and similar organizations. Investors are cautioned not to place undue reliance on forward-looking statements. GMAC undertakes no obligation
to update publicly or otherwise revise any forward-looking statements except where expressly required by law. A reconciliation of certain non-
GAAP financial measures included within this presentation is provided in the supplemental charts. Use of the term “loans” describes products associated with direct and indirect lending activities of GMAC’s global operations. The specific
products include retail installment sales contracts, loans, lines of credit, leases or other financing products. The term “originate” refers to
GMAC’s purchase, acquisition or direct origination of various “loan” products. 2
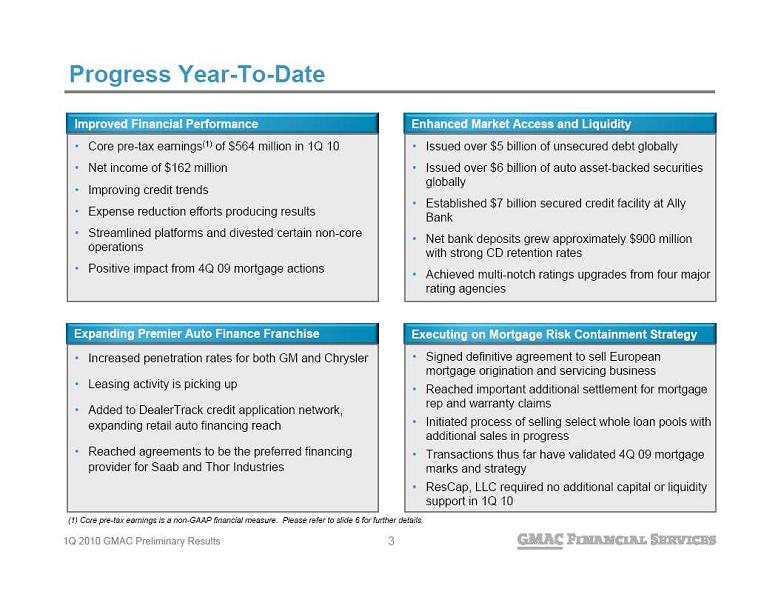 Progress Year-To-Date Improved Financial Performance Core pre-tax earnings(1) of $564 million in 1Q 10 Net income of $162 million Improving credit trends Expense reduction efforts producing results Streamlined platforms and divested certain non-core
operations Positive impact from 4Q 09 mortgage actions Enhanced Market Access and Liquidity Issued over $5 billion of unsecured debt globally Issued over $6 billion of auto asset-backed securities
globally Established $7 billion secured credit facility at Ally
Bank Net bank deposits grew approximately $900 million
with strong CD retention rates Achieved multi-notch ratings upgrades from four major
rating agencies Expanding Premier Auto Finance Franchise Increased penetration rates for both GM and Chrysler Leasing activity is picking up Added to DealerTrack credit application network,
expanding retail auto financing reach Reached agreements to be the preferred financing
provider for Saab and Thor Industries Executing on Mortgage Risk Containment Strategy Signed definitive agreement to sell European
mortgage origination and servicing business Reached important additional settlement for mortgage
rep and warranty claims Initiated process of selling select whole loan pools with
additional sales in progress Transactions thus far have validated 4Q 09 mortgage
marks and strategy ResCap, LLC required no additional capital or liquidity
support in 1Q 10 (1) Core pre-tax earnings is a non-GAAP financial measure. Please refer to slide 6 for further details 3
 Rebranding as Ally Financial Transformation GMAC Inc. to be rebranded as Ally Financial Inc. on
May 10, 2010 Investing in a brand that is company-owned Supports efforts toward becoming more customer-
focused 4
 Strategic Objectives Become the premier global auto finance provider for dealers and consumers Improve our cost structure and efficiency Demonstrate consistent and diversified access to capital markets Fully transition to a bank holding company model Improve our liquidity position by building a stable deposit base at Ally Bank Continue to de-risk our mortgage business and define a viable long-term strategy for our
mortgage origination and servicing business Focusing on these key objectives will assist GMAC in achieving the necessary milestones for
timely repayment of the U.S. Treasury investments 5
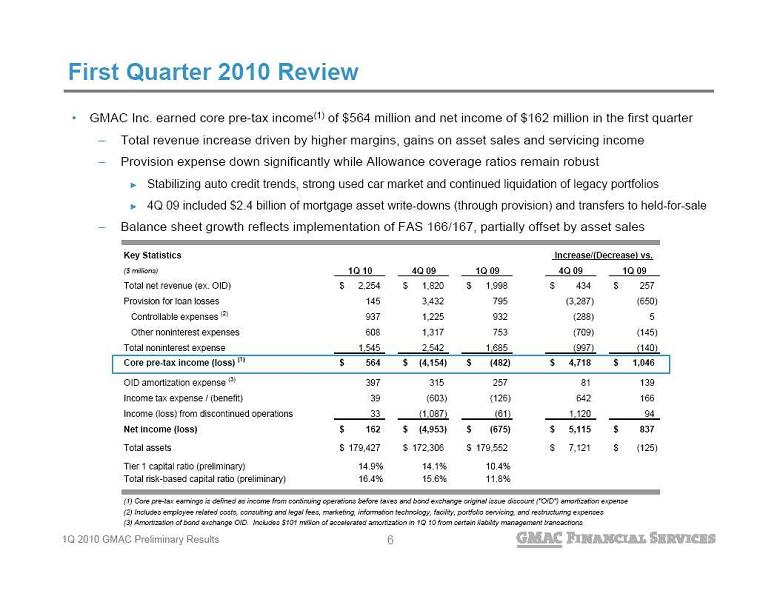 First Quarter 2010 Review GMAC Inc. earned core pre-tax income(1) of $564 million and net income of $162 million in the first quarter Total revenue increase driven by higher margins, gains on asset sales and servicing income Provision expense down significantly while Allowance coverage ratios remain robust Stabilizing auto credit trends, strong used car market and continued liquidation of legacy portfolios 4Q 09 included $2.4 billion of mortgage asset write-downs (through provision) and transfers to held-for-sale Balance sheet growth reflects implementation of FAS 166/167, partially offset by asset sales 6 Key Statistics ($ millions) 1Q 10 4Q 09 1Q 09 4Q 09 1Q 09 Total net revenue (ex. OID) 2,254 $ 1,820 $ 1,998 $ 434 $ 257 $ Provision for loan losses 145 3,432 795 (3,287) (650) Controllable expenses (2) 937 1,225 932 (288) 5 Other noninterest expenses 608 1,317 753 (709) (145) Total noninterest expense 1,545 2,542 1,685 (997) (140) Core pre-tax income (loss) (1) 564 $ (4,154) $ (482) $ 4,718 $ 1,046 $ OID amortization expense (3) 397 315 257 81 139 Income tax expense / (benefit) 39 (603) (126) 642 166 Income (loss) from discontinued operations 33 (1,087) (61) 1,120 94 Net income (loss) 162 $ (4,953) $ (675) $ 5,115 $ 837 $ Total assets 179,427 $ 172,306 $ 179,552 $ 7,121 $ (125) $ Tier 1 capital ratio (preliminary) 14.9% 14.1% 10.4% Total risk-based capital ratio (preliminary) 16.4% 15.6% 11.8% (1) Core pre-tax earnings is defined as income from continuing operations before taxes and bond exchange original issue discount ("OID") amortization expense (2) Includes employee related costs, consulting and legal fees, marketing, information technology, facility, portfolio servicing, and restructuring expenses (3) Amortization of bond exchange OID. Includes $101 million of accelerated amortization in 1Q 10 from certain liability management transactions Increase/(Decrease) vs. 6
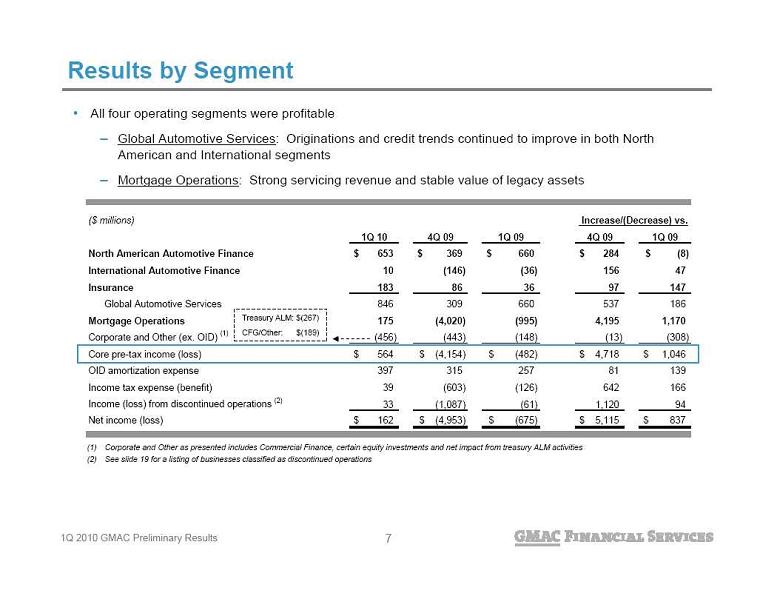 Results by Segment (1) Corporate and Other as presented includes Commercial Finance, certain equity investments and net impact from treasury ALM activities (2) See slide 19 for a listing of businesses classified as discontinued operations All four operating segments were profitable Global Automotive Services: Originations and credit trends continued to improve in both North
American and International segments Mortgage Operations: Strong servicing revenue and stable value of legacy assets Treasury ALM: $(267) CFG/Other: $(189) 7 ($ millions) 1Q 10 4Q 09 1Q 09 4Q 09 1Q 09 North American Automotive Finance 653 $ 369 $ 660 $ 284 $ (8) $ International Automotive Finance 10 (146) (36) 156 47 Insurance 183 86 36 97 147 Global Automotive Services 846 309 660 537 186 Mortgage Operations 175 (4,020) (995) 4,195 1,170 Corporate and Other (ex. OID) (1) (456) (443) (148) (13) (308) Core pre-tax income (loss) 564 $ (4,154) $ (482) $ 4,718 $ 1,046 $ OID amortization expense 397 315 257 81 139 Income tax expense (benefit) 39 (603) (126) 642 166 Income (loss) from discontinued operations (2) 33 (1,087) (61) 1,120 94 Net income (loss) 162 $ (4,953) $ (675) $ 5,115 $ 837 $ Increase/(Decrease) vs. 7
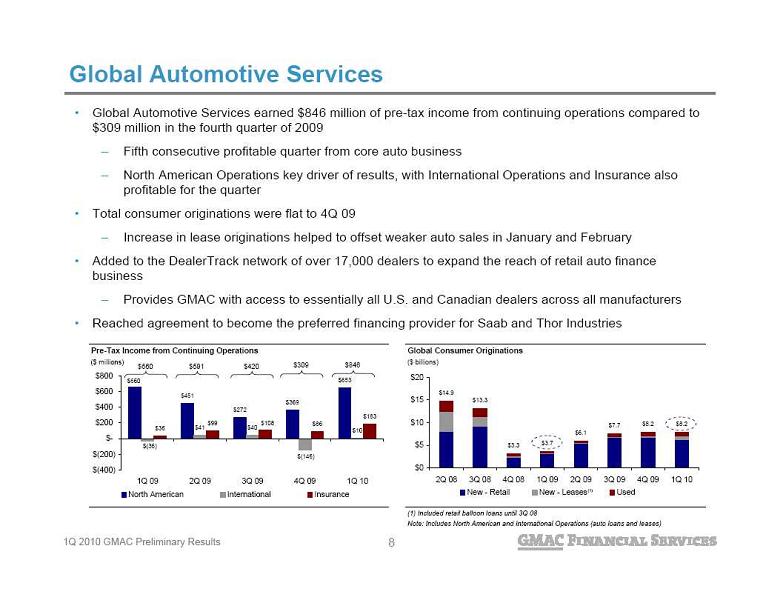 Global Automotive Services Global Automotive Services earned $846 million of pre-tax income from continuing operations compared to
$309 million in the fourth quarter of 2009 Fifth consecutive profitable quarter from core auto business North American Operations key driver of results, with International Operations and Insurance also
profitable for the quarter Total consumer originations were flat to 4Q 09 Increase in lease originations helped to offset weaker auto sales in January and February Added to the DealerTrack network of over 17,000 dealers to expand the reach of retail auto finance
business Provides GMAC with access to essentially all U.S. and Canadian dealers across all manufacturers Reached agreement to become the preferred financing provider for Saab and Thor Industries $309 $846 $660 (1) $420 $591 Pre-Tax Income from Continuing Operations Global Consumer Originations ($ millions) ($ billions) (1) Included retail balloon loans until 3Q 08 Note: Includes North American and International Operations (auto loans and leases) $451 $272 $369 $653 $40 $(146) $10 $36 $99 $86 $183 $660 $41 $(36) $108 $(400) $(200) $- $200 $400 $600 $800 1Q 09 2Q 09 3Q 09 4Q 09 1Q 10 North American International Insurance $14.9 $13.3 $3.3 $3.7 $6.1 $7.7 $8.2 $8.2 $0 $5 $10 $15 $20 2Q 08 3Q 08 4Q 08 1Q 09 2Q 09 3Q 09 4Q 09 1Q 10 New - Retail New - Leases Used Total 8
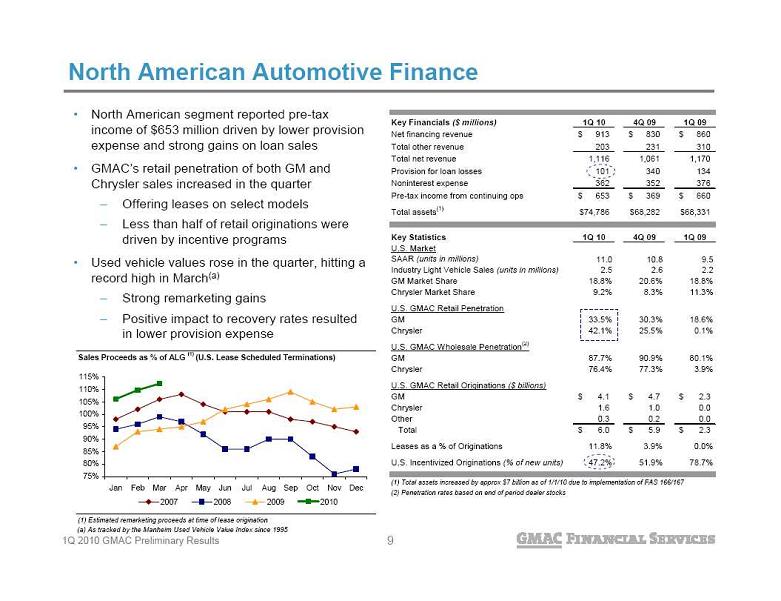 North American Automotive Finance North American segment reported pre-tax
income of $653 million driven by lower provision
expense and strong gains on loan sales GMAC’s retail penetration of both GM and
Chrysler sales increased in the quarter Offering leases on select models Less than half of retail originations were
driven by incentive programs Used vehicle values rose in the quarter, hitting a
record high in March(a) Strong remarketing gains Positive impact to recovery rates resulted
in lower provision expense (a) As tracked by the Manheim Used Vehicle Value Index since 1995 Sales Proceeds as % of ALG (1) (U.S. Lease Scheduled Terminations) (1) Estimated remarketing proceeds at time of lease origination 75% 80% 85% 90% 95% 100% 105% 110% 115% Jan Feb Mar Apr May Jun Jul Aug Sep Oct Nov Dec 2007 2008 2009 2010 Key Financials ($ millions) 1Q 10 4Q 09 1Q 09 Net financing revenue 913 $ 830 $ 860 $ Total other revenue 203 231 310 Total net revenue 1,116 1,061 1,170 Provision for loan losses 101 340 134 Noninterest expense 362 352 376 Pre-tax income from continuing ops 653 $ 369 $ 660 $ Total assets (1) 74,786 $ 68,282 $ 68,331 $ Key Statistics 1Q 10 4Q 09 1Q 09 U.S. Market SAAR (units in millions) 11.0 10.8 9.5 Industry Light Vehicle Sales (units in millions) 2.5 2.6 2.2 GM Market Share 18.8% 20.6% 18.8% Chrysler Market Share 9.2% 8.3% 11.3% U.S. GMAC Retail Penetration GM 33.5% 30.3% 18.6% Chrysler 42.1% 25.5% 0.1% U.S. GMAC Wholesale Penetration (2) GM 87.7% 90.9% 80.1% Chrysler 76.4% 77.3% 3.9% U.S. GMAC Retail Originations ($ billions) GM 4.1 $ 4.7 $ 2.3 $ Chrysler 1.6 1.0 0.0 Other 0.3 0.2 0.0 Total 6.0 $ 5.9 $ 2.3 $ Leases as a % of Originations 11.8% 3.9% 0.0% U.S. Incentivized Originations (% of new units) 47.2% 51.9% 78.7% (1) Total assets increased by approx $7 billion as of 1/1/10 due to implementation of FAS 166/167 (2) Penetration rates based on end of period dealer stocks 9
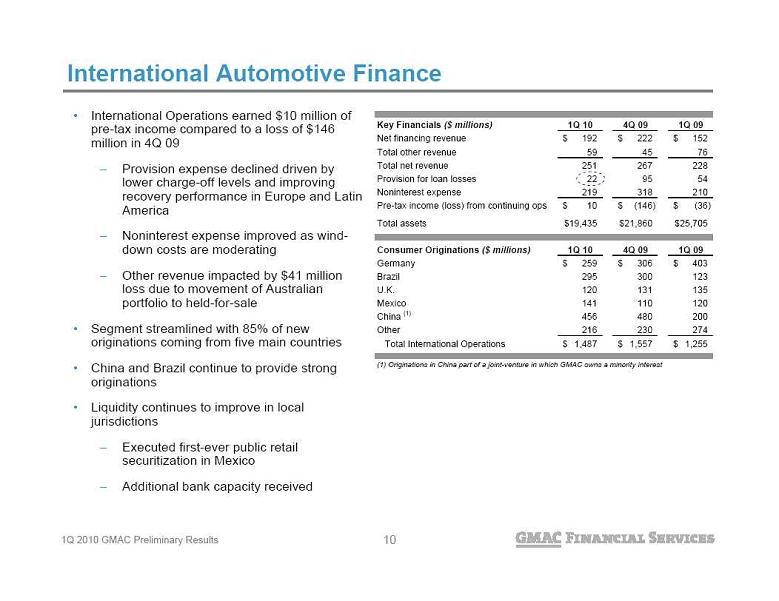 International Automotive Finance International Operations earned $10 million of
pre-tax income compared to a loss of $146
million in 4Q 09 Provision expense declined driven by
lower charge-off levels and improving
recovery performance in Europe and Latin
America Noninterest expense improved as wind-
down costs are moderating Other revenue impacted by $41 million
loss due to movement of Australian
portfolio to held-for-sale Segment streamlined with 85% of new
originations coming from five main countries China and Brazil continue to provide strong
originations Liquidity continues to improve in local
jurisdictions Executed first-ever public retail
securitization in Mexico Additional bank capacity received Key Financials ($ millions) 1Q 10 4Q 09 1Q 09 Net financing revenue 192 $ 222 $ 152 $ Total other revenue 59 45 76 Total net revenue 251 267 228 Provision for loan losses 22 95 54 Noninterest expense 219 318 210 Pre-tax income (loss) from continuing ops 10 $ (146) $ (36) $ Total assets 19,435 $ 21,860 $ 25,705 $ Consumer Originations ($ millions) 1Q 10 4Q 09 1Q 09 Germany 259 $ 306 $ 403 $ Brazil 295 300 123 U.K. 120 131 135 Mexico 141 110 120 China (1) 456 480 200 Other 216 230 274 Total International Operations 1,487 $ 1,557 $ 1,255 $ (1) Originations in China part of a joint-venture in which GMAC owns a minority interest 10
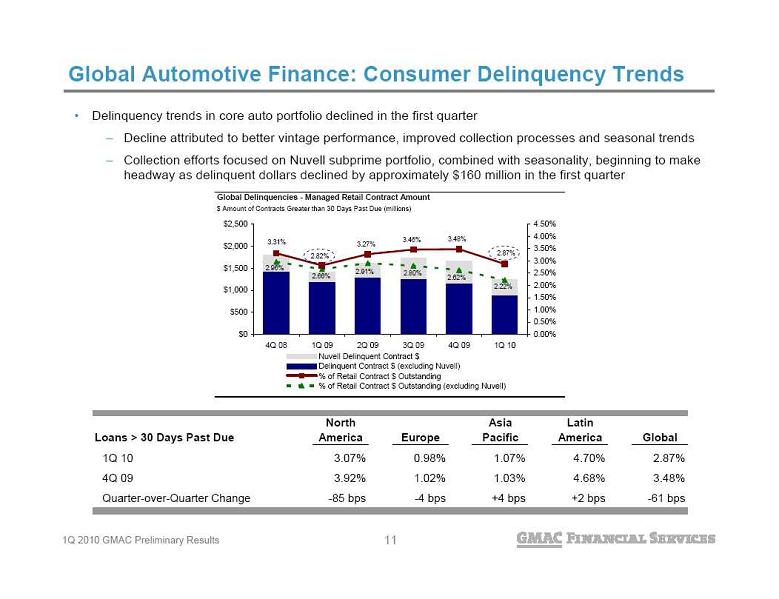 Delinquency trends in core auto portfolio declined in the first quarter Decline attributed to better vintage performance, improved collection processes and seasonal trends Collection efforts focused on Nuvell subprime portfolio, combined with seasonality, beginning to make
headway as delinquent dollars declined by approximately $160 million in the first quarter Global Automotive Finance: Consumer Delinquency Trends Global Delinquencies - Managed Retail Contract Amount $ Amount of Contracts Greater than 30 Days Past Due (millions) 2.22% 2.62% 2.80% 2.91% 2.66% 2.96% 3.31% 2.82% 3.27% 3.46% 3.48% 2.87% $0 $500 $1,000 $1,500 $2,000 $2,500 4Q 08 1Q 09 2Q 09 3Q 09 4Q 09 1Q 10 0.00% 0.50% 1.00% 1.50% 2.00% 2.50% 3.00% 3.50% 4.00% 4.50% Nuvell Delinquent Contract $ Delinquent Contract $ (excluding Nuvell) % of Retail Contract $ Outstanding % of Retail Contract $ Outstanding (excluding Nuvell) Loans > 30 Days Past Due North America Europe Asia Pacific Latin America Global 1Q 10 3.07% 0.98% 1.07% 4.70% 2.87% 4Q 09 3.92% 1.02% 1.03% 4.68% 3.48% Quarter-over-Quarter Change -85 bps -4 bps +4 bps +2 bps -61 bps 11
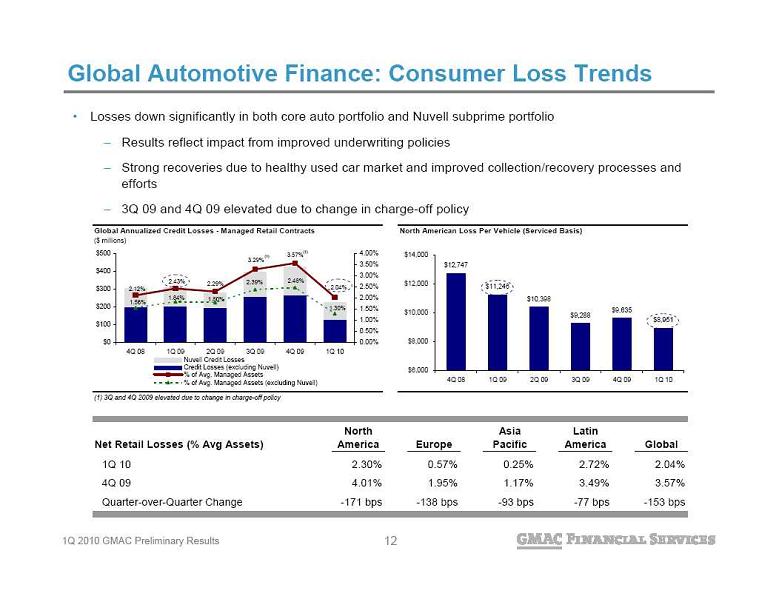 Global Automotive Finance: Consumer Loss Trends Losses down significantly in both core auto portfolio and Nuvell subprime portfolio Results reflect impact from improved underwriting policies Strong recoveries due to healthy used car market and improved collection/recovery processes and
efforts 3Q 09 and 4Q 09 elevated due to change in charge-off policy Global Annualized Credit Losses - Managed Retail Contracts North American Loss Per Vehicle (Serviced Basis) ($ millions) (1) 3Q and 4Q 2009 elevated due to change in charge-off policy 1.56% 1.84% 1.80% 2.39% 2.48% 1.30% 2.04% 3.57% 3.29% 2.29% 2.43% 2.12% $0 $100 $200 $300 $400 $500 4Q 08 1Q 09 2Q 09 3Q 09 4Q 09 1Q 10 0.00% 0.50% 1.00% 1.50% 2.00% 2.50% 3.00% 3.50% 4.00% Nuvell Credit Losses Credit Losses (excluding Nuvell) % of Avg. Managed Assets % of Avg. Managed Assets (excluding Nuvell) Delinquent Contracts Delinquencies as a % of Managed Contracts $12,747 $11,246 $10,398 $9,288 $9,635 $8,951 $6,000 $8,000 $10,000 $12,000 $14,000 4Q 08 1Q 09 2Q 09 3Q 09 4Q 09 1Q 10 (1) (1) Net Retail Losses (% Avg Assets) North America Europe Asia Pacific Latin America Global 1Q 10 2.30% 0.57% 0.25% 2.72% 2.04% 4Q 09 4.01% 1.95% 1.17% 3.49% 3.57% Quarter-over-Quarter Change -171 bps -138 bps -93 bps -77 bps -153 bps 12
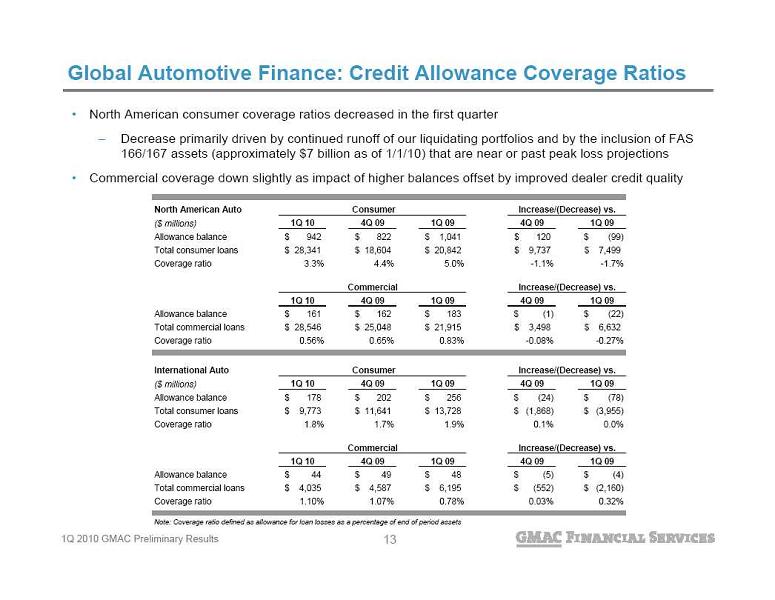 Global Automotive Finance: Credit Allowance Coverage Ratios North American consumer coverage ratios decreased in the first quarter Decrease primarily driven by continued runoff of our liquidating portfolios and by the inclusion of FAS
166/167 assets (approximately $7 billion as of 1/1/10) that are near or past peak loss projections Commercial coverage down slightly as impact of higher balances offset by improved dealer credit quality North American Auto Consumer ($ millions) 1Q 10 4Q 09 1Q 09 4Q 09 1Q 09 Allowance balance 942 $ 822 $ 1,041 $ 120 $ (99) $ Total consumer loans 28,341 $ 18,604 $ 20,842 $ 9,737 $ 7,499 $ Coverage ratio 3.3% 4.4% 5.0% -1.1% -1.7% Commercial 1Q 10 4Q 09 1Q 09 4Q 09 1Q 09 Allowance balance 161 $ 162 $ 183 $ (1) $ (22) $ Total commercial loans 28,546 $ 25,048 $ 21,915 $ 3,498 $ 6,632 $ Coverage ratio 0.56% 0.65% 0.83% -0.08% -0.27% International Auto Consumer ($ millions) 1Q 10 4Q 09 1Q 09 4Q 09 1Q 09 Allowance balance 178 $ 202 $ 256 $ (24) $ (78) $ Total consumer loans 9,773 $ 11,641 $ 13,728 $ (1,868) $ (3,955) $ Coverage ratio 1.8% 1.7% 1.9% 0.1% 0.0% Commercial 1Q 10 4Q 09 1Q 09 4Q 09 1Q 09 Allowance balance 44 $ 49 $ 48 $ (5) $ (4) $ Total commercial loans 4,035 $ 4,587 $ 6,195 $ (552) $ (2,160) $ Coverage ratio 1.10% 1.07% 0.78% 0.03% 0.32% Note: Coverage ratio defined as allowance for loan losses as a percentage of end of period assets Increase/(Decrease) vs. Increase/(Decrease) vs. Increase/(Decrease) vs. Increase/(Decrease) vs. 13
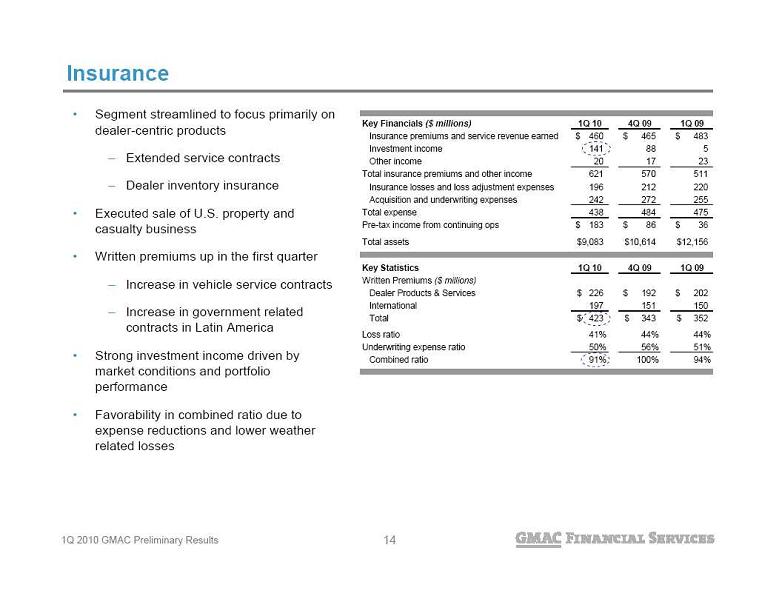 Insurance Segment streamlined to focus primarily on
dealer-centric products Extended service contracts Dealer inventory insurance Executed sale of U.S. property and
casualty business Written premiums up in the first quarter Increase in vehicle service contracts Increase in government related
contracts in Latin America Strong investment income driven by
market conditions and portfolio
performance Favorability in combined ratio due to
expense reductions and lower weather
related losses Key Financials ($ millions) 1Q 10 4Q 09 1Q 09 Insurance premiums and service revenue earned 460 $ 465 $ 483 $ Investment income 141 88 5 Other income 20 17 23 Total insurance premiums and other income 621 570 511 Insurance losses and loss adjustment expenses 196 212 220 Acquisition and underwriting expenses 242 272 255 Total expense 438 484 475 Pre-tax income from continuing ops 183 $ 86 $ 36 $ Total assets 9,083 $ 10,614 $ 12,156 $ Key Statistics 1Q 10 4Q 09 1Q 09 Written Premiums ($ millions) Dealer Products & Services 226 $ 192 $ 202 $ International 197 151 150 Total 423 $ 343 $ 352 $ Loss ratio 41% 44% 44% Underwriting expense ratio 50% 56% 51% Combined ratio 91% 100% 94% 14
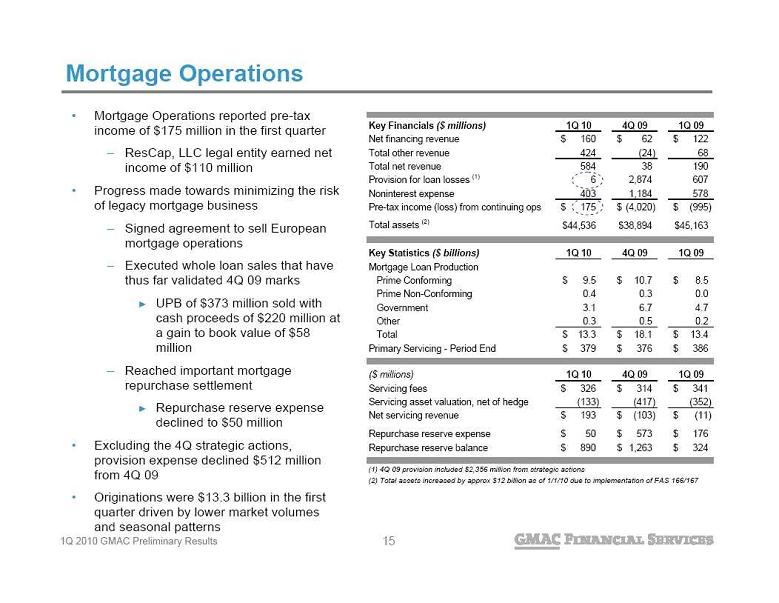 Mortgage Operations Mortgage Operations reported pre-tax
income of $175 million in the first quarter ResCap, LLC legal entity earned net
income of $110 million Progress made towards minimizing the risk
of legacy mortgage business Signed agreement to sell European
mortgage operations Executed whole loan sales that have
thus far validated 4Q 09 marks UPB of $373 million sold with
cash proceeds of $220 million at
a gain to book value of $58
million Reached important mortgage
repurchase settlement Repurchase reserve expense
declined to $50 million Excluding the 4Q strategic actions,
provision expense declined $512 million
from 4Q 09 Originations were $13.3 billion in the first
quarter driven by lower market volumes
and seasonal patterns Key Financials ($ millions) 1Q 10 4Q 09 1Q 09 Net financing revenue 160 $ 62 $ 122 $ Total other revenue 424 (24) 68 Total net revenue 584 38 190 Provision for loan losses (1) 6 2,874 607 Noninterest expense 403 1,184 578 Pre-tax income (loss) from continuing ops 175 $ (4,020) $ (995) $ Total assets (2) 44,536 $ 38,894 $ 45,163 $ Key Statistics ($ billions) 1Q 10 4Q 09 1Q 09 Mortgage Loan Production Prime Conforming 9.5 $ 10.7 $ 8.5 $ Prime Non-Conforming 0.4 0.3 0.0 Government 3.1 6.7 4.7 Other 0.3 0.5 0.2 Total 13.3 $ 18.1 $ 13.4 $ Primary Servicing - Period End 379 $ 376 $ 386 $ ($ millions) 1Q 10 4Q 09 1Q 09 Servicing fees 326 $ 314 $ 341 $ Servicing asset valuation, net of hedge (133) (417) (352) Net servicing revenue 193 $ (103) $ (11) $ Repurchase reserve expense 50 $ 573 $ 176 $ Repurchase reserve balance 890 $ 1,263 $ 324 $ (1) 4Q 09 provision included $2,356 million from strategic actions (2) Total assets increased by approx $12 billion as of 1/1/10 due to implementation of FAS 166/167 15
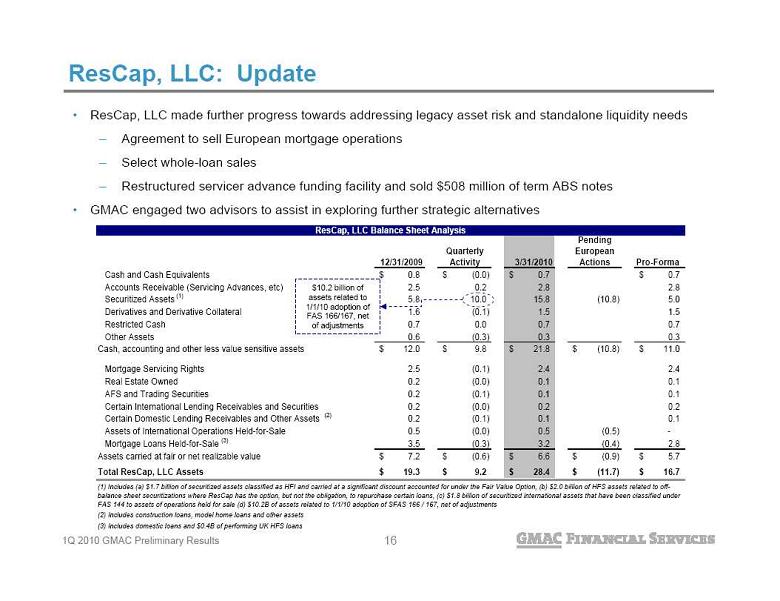 ResCap, LLC: Update ResCap, LLC made further progress towards addressing legacy asset risk and standalone liquidity needs Agreement to sell European mortgage operations Select whole-loan sales Restructured servicer advance funding facility and sold $508 million of term ABS notes GMAC engaged two advisors to assist in exploring further strategic alternatives $10.2 billion of
assets related to
1/1/10 adoption of
FAS 166/167, net
of adjustments 12/31/2009 Quarterly Activity 3/31/2010 Pending European Actions Pro-Forma Cash and Cash Equivalents 0.8 $ (0.0) $ 0.7 $ 0.7 $ Accounts Receivable (Servicing Advances, etc) 2.5 0.2 2.8 2.8 Securitized Assets (1) 5.8 10.0 15.8 (10.8) 5.0 Derivatives and Derivative Collateral 1.6 (0.1) 1.5 1.5 Restricted Cash 0.7 0.0 0.7 0.7 Other Assets 0.6 (0.3) 0.3 0.3 Cash, accounting and other less value sensitive assets 12.0 $ 9.8 $ 21.8 $ (10.8) $ 11.0 $ Mortgage Servicing Rights 2.5 (0.1) 2.4 2.4 Real Estate Owned 0.2 (0.0) 0.1 0.1 AFS and Trading Securities 0.2 (0.1) 0.1 0.1 Certain International Lending Receivables and Securities 0.2 (0.0) 0.2 0.2 Certain Domestic Lending Receivables and Other Assets (2) 0.2 (0.1) 0.1 0.1 Assets of International Operations Held-for-Sale 0.5 (0.0) 0.5 (0.5) - Mortgage Loans Held-for-Sale (3) 3.5 (0.3) 3.2 (0.4) 2.8 Assets carried at fair or net realizable value 7.2 $ (0.6) $ 6.6 $ (0.9) $ 5.7 $ Total ResCap, LLC Assets 19.3 $ 9.2 $ 28.4 $ (11.7) $ 16.7 $ ResCap, LLC Balance Sheet Analysis (1) Includes (a) $1.7 billion of securitized assets classified as HFI and carried at a significant discount accounted for under the Fair Value Option, (b) $2.0 billion of HFS assets related to off- balance sheet securitizations where ResCap has the option, but not the obligation, to repurchase certain loans, (c) $1.8 billion of securitized international assets that have been classified under FAS 144 to assets of operations held for sale (d) $10.2B of assets related to 1/1/10 adoption of SFAS 166 / 167, net of adjustments (3) Includes domestic loans and $0.4B of performing UK HFS loans (2) Includes construction loans, model home loans and other assets 16
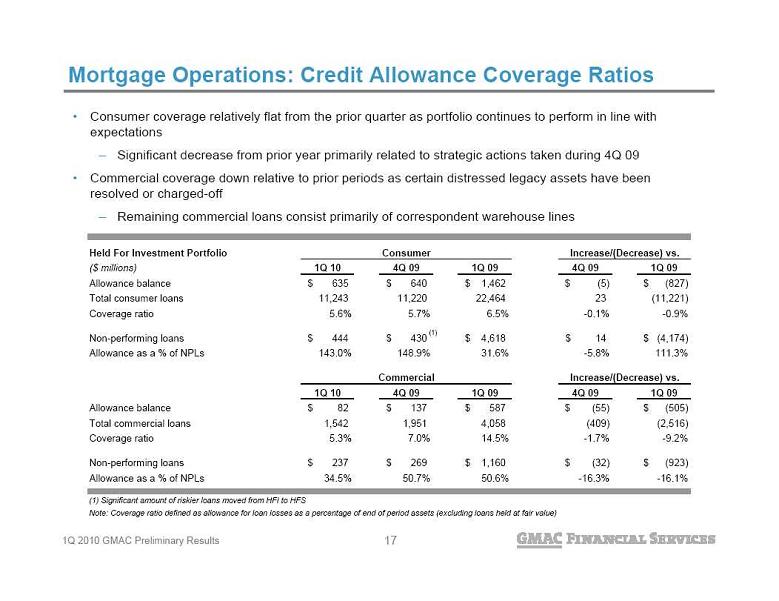 Mortgage Operations: Credit Allowance Coverage Ratios Consumer coverage relatively flat from the prior quarter as portfolio continues to perform in line with
expectations Significant decrease from prior year primarily related to strategic actions taken during 4Q 09 Commercial coverage down relative to prior periods as certain distressed legacy assets have been
resolved or charged-off Remaining commercial loans consist primarily of correspondent warehouse lines Held For Investment Portfolio Consumer ($ millions) 1Q 10 4Q 09 1Q 09 4Q 09 1Q 09 Allowance balance 635 $ 640 $ 1,462 $ (5) $ (827) $ Total consumer loans 11,243 11,220 22,464 23 (11,221) Coverage ratio 5.6% 5.7% 6.5% -0.1% -0.9% Non-performing loans 444 $ 430 $ 4,618 $ 14 $ (4,174) $ Allowance as a % of NPLs 143.0% 148.9% 31.6% -5.8% 111.3% Commercial 1Q 10 4Q 09 1Q 09 4Q 09 1Q 09 Allowance balance 82 $ 137 $ 587 $ (55) $ (505) $ Total commercial loans 1,542 1,951 4,058 (409) (2,516) Coverage ratio 5.3% 7.0% 14.5% -1.7% -9.2% Non-performing loans 237 $ 269 $ 1,160 $ (32) $ (923) $ Allowance as a % of NPLs 34.5% 50.7% 50.6% -16.3% -16.1% (1) Significant amount of riskier loans moved from HFI to HFS Note: Coverage ratio defined as allowance for loan losses as a percentage of end of period assets (excluding loans held at fair value) Increase/(Decrease) vs. Increase/(Decrease) vs. (1) 17
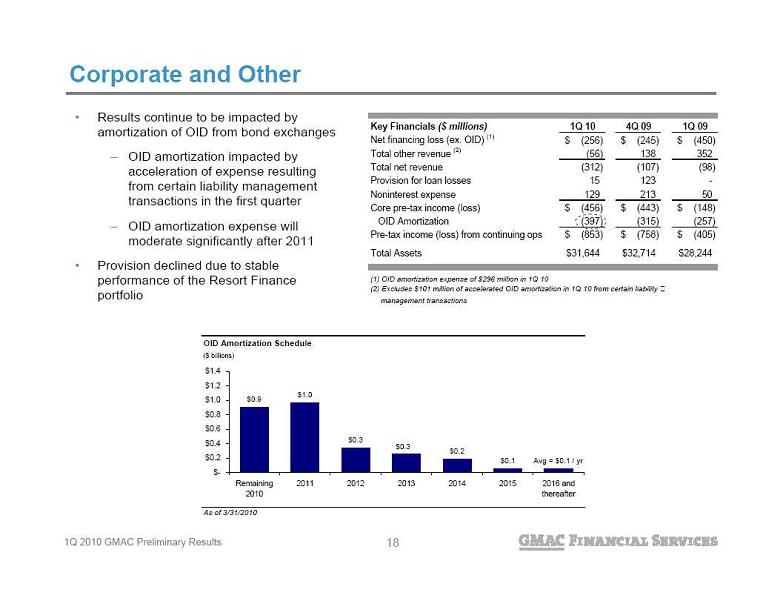 Corporate and Other Results continue to be impacted by
amortization of OID from bond exchanges OID amortization impacted by
acceleration of expense resulting
from certain liability management
transactions in the first quarter OID amortization expense will
moderate significantly after 2011 Provision declined due to stable
performance of the Resort Finance
portfolio Key Financials ($ millions) 1Q 10 4Q 09 1Q 09 Net financing loss (ex. OID) (1) (256) $ (245) $ (450) $ Total other revenue (2) (56) 138 352 Total net revenue (312) (107) (98) Provision for loan losses 15 123 - Noninterest expense 129 213 50 Core pre-tax income (loss) (456) $ (443) $ (148) $ OID Amortization (397) (315) (257) Pre-tax income (loss) from continuing ops (853) $ (758) $ (405) $ Total Assets 31,644 $ 32,714 $ 28,244 $ (1) OID amortization expense of $296 million in 1Q 10 (2) Excludes $101 million of accelerated OID amortization in 1Q 10 from certain liability management transactions OID Amortization Schedule ($ billions) As of 3/31/2010 $0.9 $1.0 $0.3 $0.2 $0.1 Avg = $0.1 / yr $0.3 $- $0.2 $0.4 $0.6 $0.8 $1.0 $1.2 $1.4 Remaining 2010 2011 2012 2013 2014 2015 2016 and thereafter 18
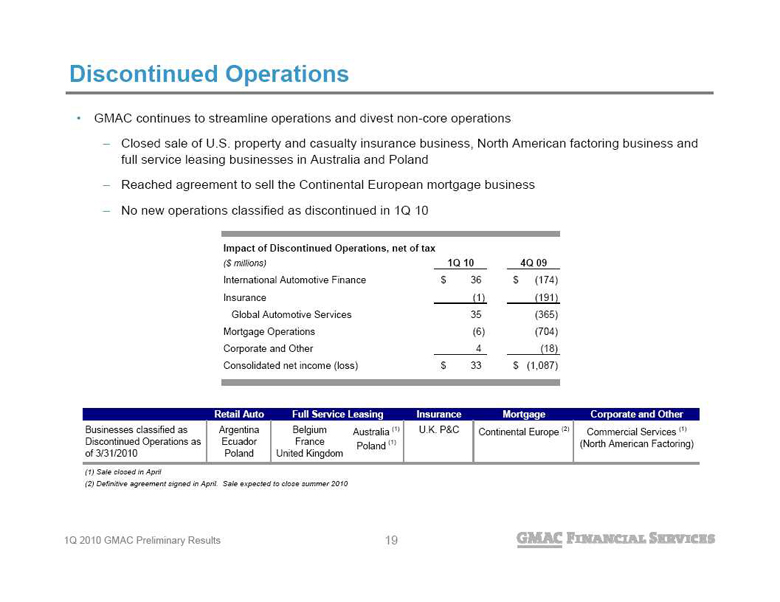 Discontinued Operations GMAC continues to streamline operations and divest non-core operations Closed sale of U.S. property and casualty insurance business, North American factoring business and
full service leasing businesses in Australia and Poland Reached agreement to sell the Continental European mortgage business No new operations classified as discontinued in 1Q 10 19 Impact of Discontinued Operations, net of tax ($ millions) 1Q 10 4Q 09 International Automotive Finance 36 $ (174) $ Insurance (1) (191) Global Automotive Services 35 (365) Mortgage Operations (6) (704) Corporate and Other 4 (18) Consolidated net income (loss) 33 $ (1,087) $ Retail Auto Insurance Mortgage Corporate and Other Businesses classified as Discontinued Operations as of 3/31/2010 Argentina Ecuador Poland Belgium France United Kingdom Australia (1) Poland (1) U.K. P&C Continental Europe (2) Commercial Services (1) (North American Factoring) (1) Sale closed in April (2) Definitive agreement signed in April. Sale expected to close summer 2010 Full Service Leasing 19
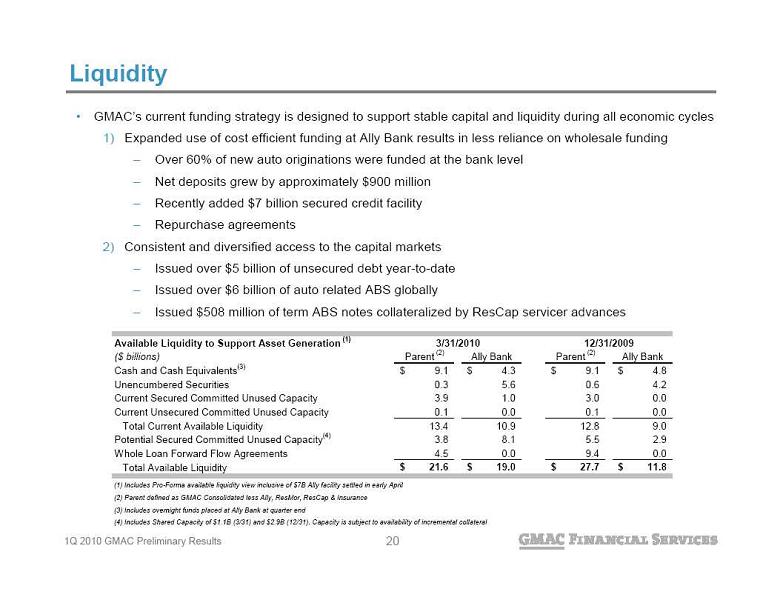 Liquidity GMAC’s current funding strategy is designed to support stable capital and liquidity during all economic cycles 1)Expanded use of cost efficient funding at Ally Bank results in less reliance on wholesale funding Over 60% of new auto originations were funded at the bank level Net deposits grew by approximately $900 million Recently added $7 billion secured credit facility Repurchase agreements 2) Consistent and diversified access to the capital markets Issued over $5 billion of unsecured debt year-to-date Issued over $6 billion of auto related ABS globally Issued $508 million of term ABS notes collateralized by ResCap servicer advances Available Liquidity to Support Asset Generation (1) ($ billions) Parent (2) Ally Bank Parent (2) Ally Bank Cash and Cash Equivalents (3) 9.1 $ 4.3 $ 9.1 $ 4.8 $ Unencumbered Securities 0.3 5.6 0.6 4.2 Current Secured Committed Unused Capacity 3.9 1.0 3.0 0.0 Current Unsecured Committed Unused Capacity 0.1 0.0 0.1 0.0 Total Current Available Liquidity 13.4 10.9 12.8 9.0 Potential Secured Committed Unused Capacity (4) 3.8 8.1 5.5 2.9 Whole Loan Forward Flow Agreements 4.5 0.0 9.4 0.0 Total Available Liquidity 21.6 $ 19.0 $ 27.7 $ 11.8 $ (1) Includes Pro-Forma available liquidity view inclusive of $7B Ally facility settled in early April (2) Parent defined as GMAC Consolidated less Ally, ResMor, ResCap & Insurance (3) Includes overnight funds placed at Ally Bank at quarter end (4) Includes Shared Capacity of $1.1B (3/31) and $2.9B (12/31). Capacity is subject to availability of incremental collateral 3/31/2010 12/31/2009 20
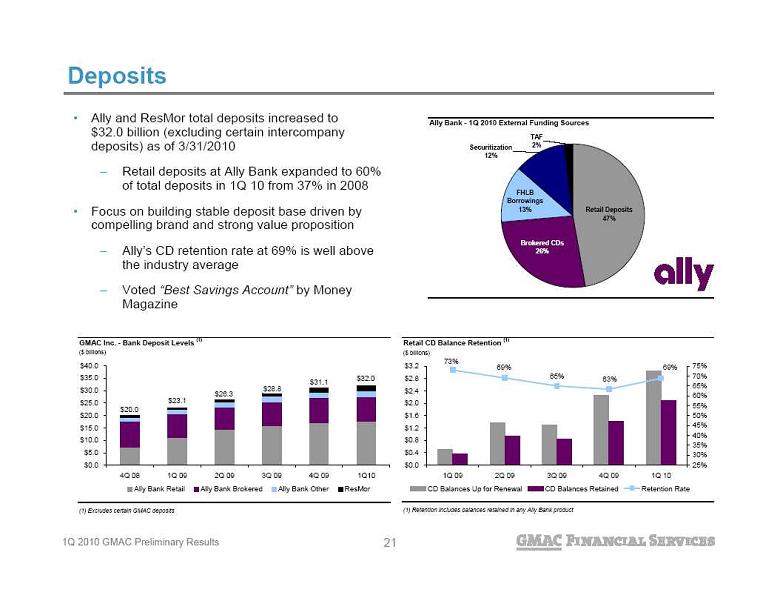 Ally and ResMor total deposits increased to
$32.0 billion (excluding certain intercompany
deposits) as of 3/31/2010 Retail deposits at Ally Bank expanded to 60%
of total deposits in 1Q 10 from 37% in 2008 Focus on building stable deposit base driven by
compelling brand and strong value proposition Ally’s CD retention rate at 69% is well above
the industry average Voted “Best Savings Account” by Money
Magazine Deposits Ally Bank - 1Q 2010 External Funding Sources TAF 2% Securitization 12% Brokered CDs 26% Retail Deposits 47% FHLB Borrowings 13% GMAC Inc. - Bank Deposit Levels (1) ($ billions) (1) Excludes certain GMAC deposits $20.0 $23.1 $26.3 $28.8 $31.1 $32.0 $0.0 $5.0 $10.0 $15.0 $20.0 $25.0 $30.0 $35.0 $40.0 4Q 08 1Q 09 2Q 09 3Q 09 4Q 09 1Q10 Ally Bank Retail Ally Bank Brokered Ally Bank Other ResMor Retail CD Balance Retention (1) ($ billions) (1) Retention includes balances retained in any Ally Bank product 69% 63% 65% 69% 73% $0.0 $0.4 $0.8 $1.2 $1.6 $2.0 $2.4 $2.8 $3.2 1Q 09 2Q 09 3Q 09 4Q 09 1Q 10 25% 30% 35% 40% 45% 50% 55% 60% 65% 70% 75% CD Balances Up for Renewal CD Balances Retained Retention Rate 21
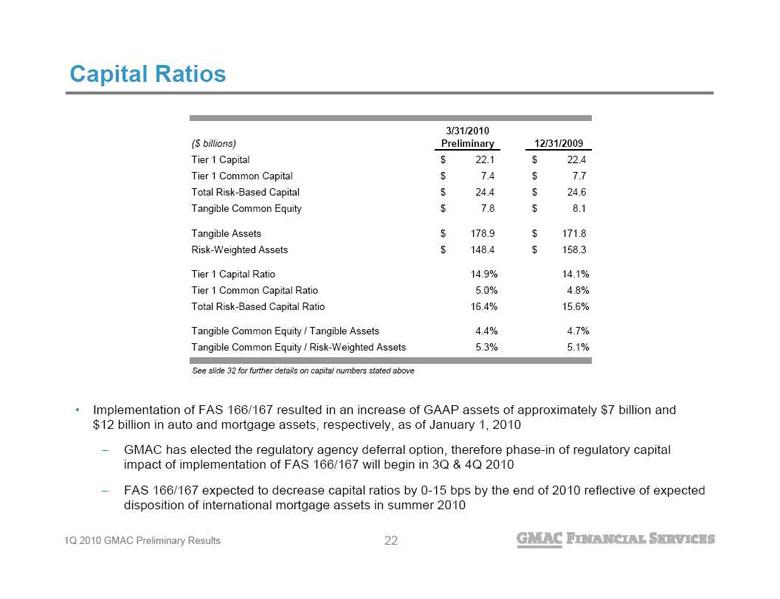 Capital Ratios See slide 32 for further details on capital numbers stated above Implementation of FAS 166/167 resulted in an increase of GAAP assets of approximately $7 billion and
$12 billion in auto and mortgage assets, respectively, as of January 1, 2010 GMAC has elected the regulatory agency deferral option, therefore phase-in of regulatory capital
impact of implementation of FAS 166/167 will begin in 3Q & 4Q 2010 FAS 166/167 expected to decrease capital ratios by 0-15 bps by the end of 2010 reflective of expected
disposition of international mortgage assets in summer 2010 22 ($ billions) 3/31/2010 Preliminary 12/31/2009 Tier 1 Capital 22.1 $ 22.4 $ Tier 1 Common Capital 7.4 $ 7.7 $ Total Risk-Based Capital 24.4 $ 24.6 $ Tangible Common Equity 7.8 $ 8.1 $ Tangible Assets 178.9 $ 171.8 $ Risk-Weighted Assets 148.4 $ 158.3 $ Tier 1 Capital Ratio 14.9% 14.1% Tier 1 Common Capital Ratio 5.0% 4.8% Total Risk-Based Capital Ratio 16.4% 15.6% Tangible Common Equity / Tangible Assets 4.4% 4.7% Tangible Common Equity / Risk-Weighted Assets 5.3% 5.1% 22
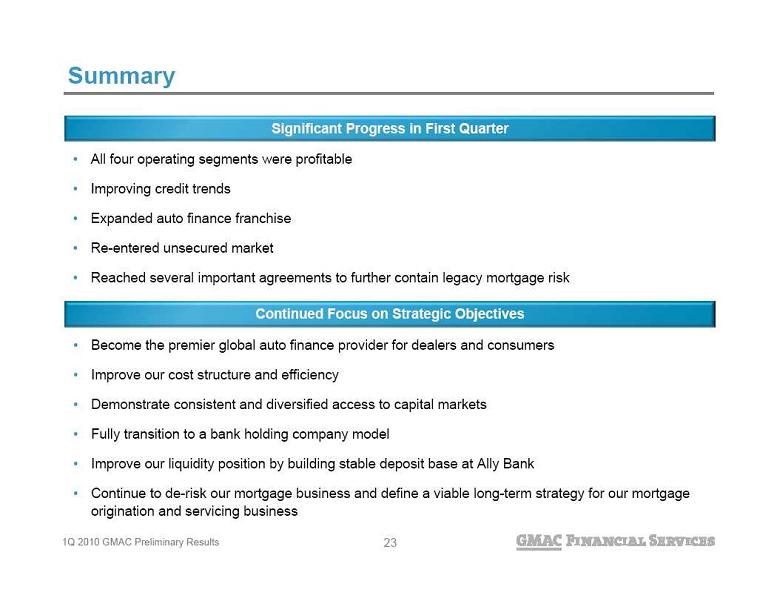 Summary All four operating segments were profitable Improving credit trends Expanded auto finance franchise Re-entered unsecured market Reached several important agreements to further contain legacy mortgage risk Significant Progress in First Quarter Continued Focus on Strategic Objectives Become the premier global auto finance provider for dealers and consumers Improve our cost structure and efficiency Demonstrate consistent and diversified access to capital markets Fully transition to a bank holding company model Improve our liquidity position by building stable deposit base at Ally Bank Continue to de-risk our mortgage business and define a viable long-term strategy for our mortgage
origination and servicing business 23
 Supplemental Charts
24
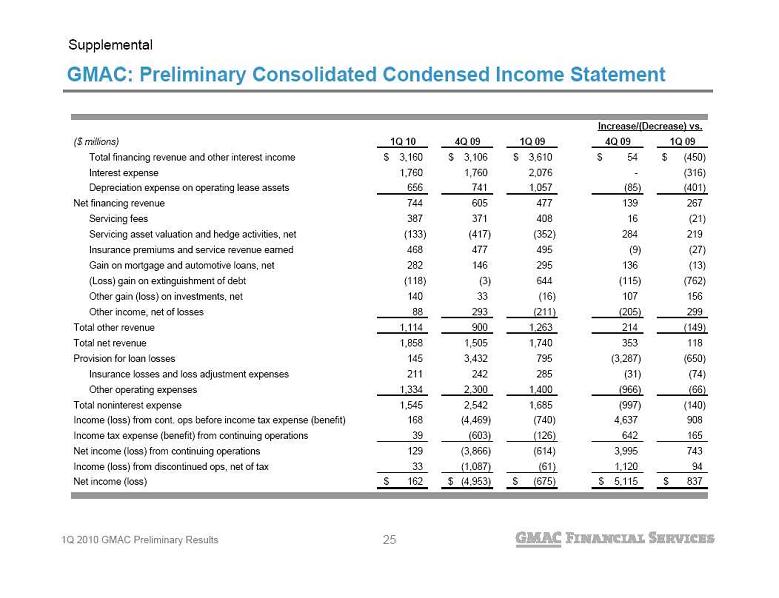 GMAC: Preliminary Consolidated Condensed Income Statement Supplemental ($ millions) 1Q 10 4Q 09 1Q 09 4Q 09 1Q 09 Total financing revenue and other interest income 3,160 $ 3,106 $ 3,610 $ 54 $ (450) $ Interest expense 1,760 1,760 2,076 - (316) Depreciation expense on operating lease assets 656 741 1,057 (85) (401) Net financing revenue 744 605 477 139 267 Servicing fees 387 371 408 16 (21) Servicing asset valuation and hedge activities, net (133) (417) (352) 284 219 Insurance premiums and service revenue earned 468 477 495 (9) (27) Gain on mortgage and automotive loans, net 282 146 295 136 (13) (Loss) gain on extinguishment of debt (118) (3) 644 (115) (762) Other gain (loss) on investments, net 140 33 (16) 107 156 Other income, net of losses 88 293 (211) (205) 299 Total other revenue 1,114 900 1,263 214 (149) Total net revenue 1,858 1,505 1,740 353 118 Provision for loan losses 145 3,432 795 (3,287) (650) Insurance losses and loss adjustment expenses 211 242 285 (31) (74) Other operating expenses 1,334 2,300 1,400 (966) (66) Total noninterest expense 1,545 2,542 1,685 (997) (140) Income (loss) from cont. ops before income tax expense (benefit) 168 (4,469) (740) 4,637 908 Income tax expense (benefit) from continuing operations 39 (603) (126) 642 165 Net income (loss) from continuing operations 129 (3,866) (614) 3,995 743 Income (loss) from discontinued ops, net of tax 33 (1,087) (61) 1,120 94 Net income (loss) 162 $ (4,953) $ (675) $ 5,115 $ 837 $ Increase/(Decrease) vs. 25
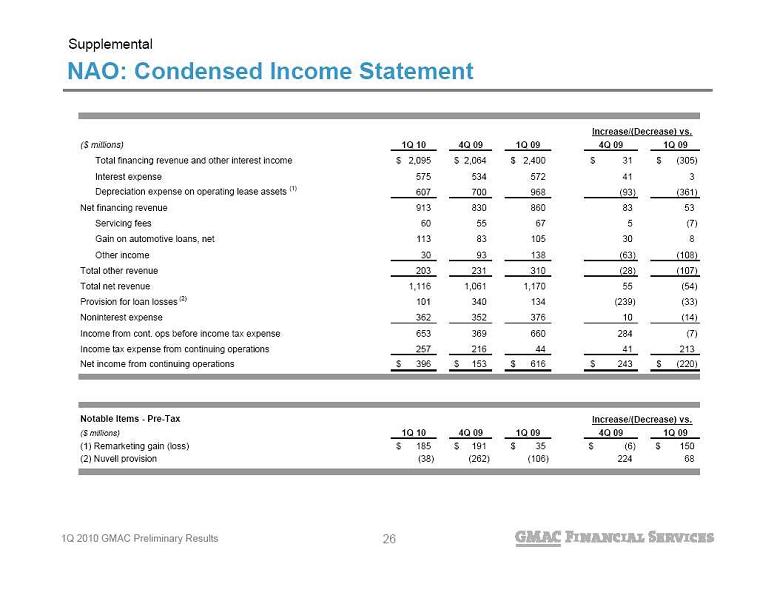 NAO: Condensed Income Statement Supplemental ($ millions) 1Q 10 4Q 09 1Q 09 4Q 09 1Q 09 Total financing revenue and other interest income 2,095 $ 2,064 $ 2,400 $ 31 $ (305) $ Interest expense 575 534 572 41 3 Depreciation expense on operating lease assets (1) 607 700 968 (93) (361) Net financing revenue 913 830 860 83 53 Servicing fees 60 55 67 5 (7) Gain on automotive loans, net 113 83 105 30 8 Other income 30 93 138 (63) (108) Total other revenue 203 231 310 (28) (107) Total net revenue 1,116 1,061 1,170 55 (54) Provision for loan losses (2) 101 340 134 (239) (33) Noninterest expense 362 352 376 10 (14) Income from cont. ops before income tax expense 653 369 660 284 (7) Income tax expense from continuing operations 257 216 44 41 213 Net income from continuing operations 396 $ 153 $ 616 $ 243 $ (220) $ Notable Items - Pre-Tax ($ millions) 1Q 10 4Q 09 1Q 09 4Q 09 1Q 09 (1) Remarketing gain (loss) 185 $ 191 $ 35 $ (6) $ 150 $ (2) Nuvell provision (38) (262) (106) 224 68 Increase/(Decrease) vs. Increase/(Decrease) vs. 26
 IO: Condensed Income Statement Supplemental ($ millions) 1Q 10 4Q 09 1Q 09 4Q 09 1Q 09 Total financing revenue and other interest income 487 $ 557 $ 608 $ (70) $ (121) $ Interest expense 246 295 367 (49) (121) Depreciation expense on operating lease assets 49 40 89 9 (40) Net financing revenue 192 222 152 (30) 40 Loss on automotive loans, net (1) (33) (56) - 23 (33) Other income 92 101 76 (9) 16 Total other revenue 59 45 76 14 (17) Total net revenue 251 267 228 (16) 23 Provision for loan losses 22 95 54 (73) (32) Noninterest expense (2) 219 318 210 (99) 9 Income (loss) from cont. ops before income tax benefit 10 (146) (36) 156 46 Income tax benefit from continuing operations (11) (53) (6) 42 (5) Net income (loss) from continuing operations 21 $ (93) $ (30) $ 114 $ 51 $ Notable Items - Pre-Tax ($ millions) 1Q 10 4Q 09 1Q 09 4Q 09 1Q 09 (1) Movement from HFI to HFS (34) $ (55) $ - $ 21 $ (34) $ (2) Restructuring charges (3) (36) - 33 (3) Increase/(Decrease) vs. Increase/(Decrease) vs. 27
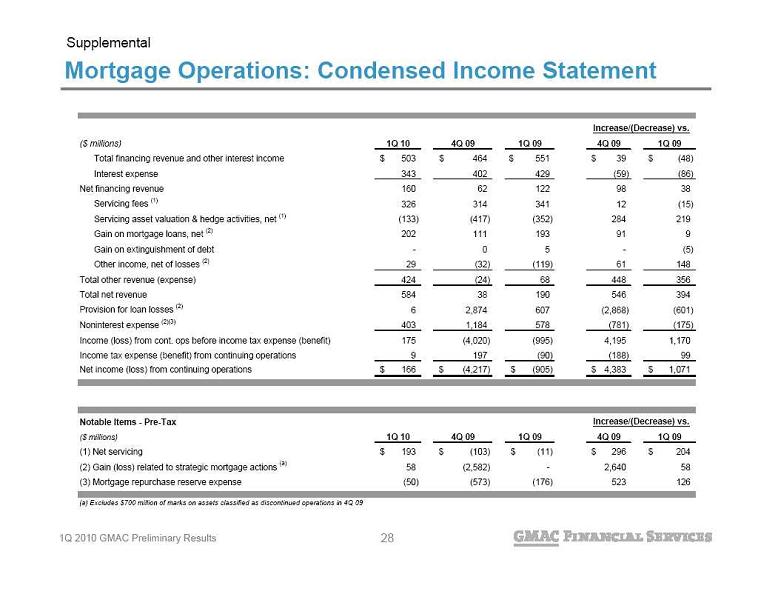 Mortgage Operations: Condensed Income Statement Supplemental ($ millions) 1Q 10 4Q 09 1Q 09 4Q 09 1Q 09 Total financing revenue and other interest income 503 $ 464 $ 551 $ 39 $ (48) $ Interest expense 343 402 429 (59) (86) Net financing revenue 160 62 122 98 38 Servicing fees (1) 326 314 341 12 (15) Servicing asset valuation & hedge activities, net (1) (133) (417) (352) 284 219 Gain on mortgage loans, net (2) 202 111 193 91 9 Gain on extinguishment of debt - 0 5 - (5) Other income, net of losses (2) 29 (32) (119) 61 148 Total other revenue (expense) 424 (24) 68 448 356 Total net revenue 584 38 190 546 394 Provision for loan losses (2) 6 2,874 607 (2,868) (601) Noninterest expense (2)(3) 403 1,184 578 (781) (175) Income (loss) from cont. ops before income tax expense (benefit) 175 (4,020) (995) 4,195 1,170 Income tax expense (benefit) from continuing operations 9 197 (90) (188) 99 Net income (loss) from continuing operations 166 $ (4,217) $ (905) $ 4,383 $ 1,071 $ Notable Items - Pre-Tax ($ millions) 1Q 10 4Q 09 1Q 09 4Q 09 1Q 09 (1) Net servicing 193 $ (103) $ (11) $ 296 $ 204 $ (2) Gain (loss) related to strategic mortgage actions (a) 58 (2,582) - 2,640 58 (3) Mortgage repurchase reserve expense (50) (573) (176) 523 126 (a) Excludes $700 million of marks on assets classified as discontinued operations in 4Q 09 Increase/(Decrease) vs. Increase/(Decrease) vs. 28
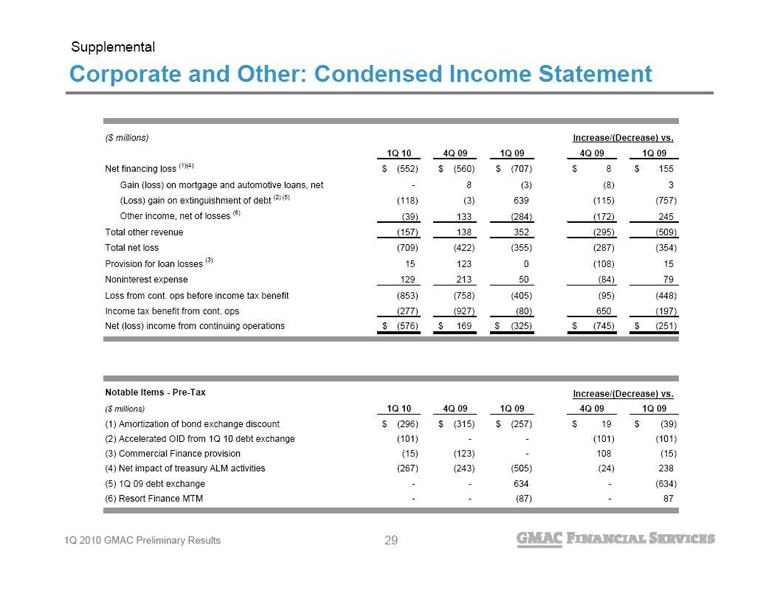 Corporate and Other: Condensed Income Statement Supplemental 29 ($ millions) 1Q 10 4Q 09 1Q 09 4Q 09 1Q 09 Net financing loss (1)(4) (552) $ (560) $ (707) $ 8 $ 155 $ Gain (loss) on mortgage and automotive loans, net - 8 (3) (8) 3 (Loss) gain on extinguishment of debt (2) (5) (118) (3) 639 (115) (757) Other income, net of losses (6) (39) 133 (284) (172) 245 Total other revenue (157) 138 352 (295) (509) Total net loss (709) (422) (355) (287) (354) Provision for loan losses (3) 15 123 0 (108) 15 Noninterest expense 129 213 50 (84) 79 Loss from cont. ops before income tax benefit (853) (758) (405) (95) (448) Income tax benefit from cont. ops (277) (927) (80) 650 (197) Net (loss) income from continuing operations (576) $ 169 $ (325) $ (745) $ (251) $ Notable Items - Pre-Tax ($ millions) 1Q 10 4Q 09 1Q 09 4Q 09 1Q 09 (1) Amortization of bond exchange discount (296) $ (315) $ (257) $ 19 $ (39) $ (2) Accelerated OID from 1Q 10 debt exchange (101) - - (101) (101) (3) Commercial Finance provision (15) (123) - 108 (15) (4) Net impact of treasury ALM activities (267) (243) (505) (24) 238 (5) 1Q 09 debt exchange - - 634 - (634) (6) Resort Finance MTM - - (87) - 87 Increase/(Decrease) vs. Increase/(Decrease) vs. 29
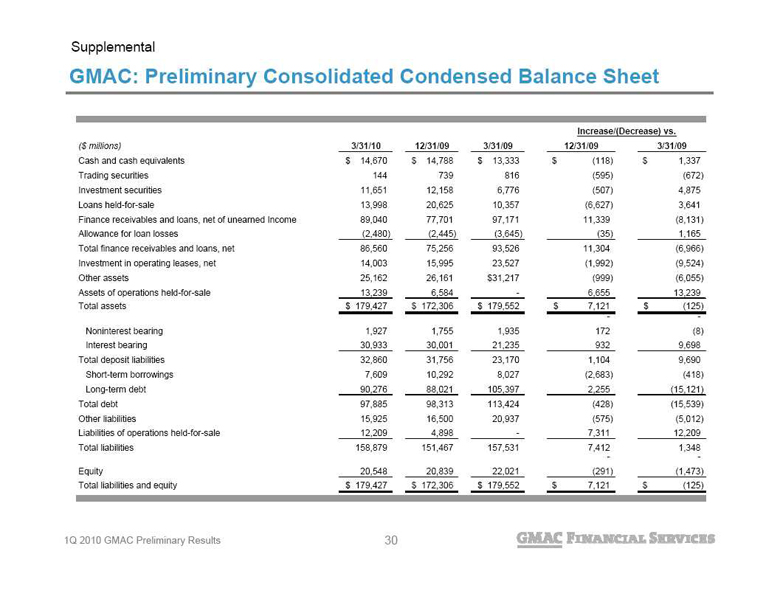 GMAC: Preliminary Consolidated Condensed Balance Sheet Supplemental 30 ($ millions) 3/31/10 12/31/09 3/31/09 12/31/09 3/31/09 Cash and cash equivalents 14,670 $ 14,788 $ 13,333 $ (118) $ 1,337 $ Trading securities 144 739 816 (595) (672) Investment securities 11,651 12,158 6,776 (507) 4,875 Loans held-for-sale 13,998 20,625 10,357 (6,627) 3,641 Finance receivables and loans, net of unearned Income 89,040 77,701 97,171 11,339 (8,131) Allowance for loan losses (2,480) (2,445) (3,645) (35) 1,165 Total finance receivables and loans, net 86,560 75,256 93,526 11,304 (6,966) Investment in operating leases, net 14,003 15,995 23,527 (1,992) (9,524) Other assets 25,162 26,161 $31,217 (999) (6,055) Assets of operations held-for-sale 13,239 6,584 - 6,655 13,239 Total assets 179,427 $ 172,306 $ 179,552 $ 7,121 $ (125) $ - - Noninterest bearing 1,927 1,755 1,935 172 (8) Interest bearing 30,933 30,001 21,235 932 9,698 Total deposit liabilities 32,860 31,756 23,170 1,104 9,690 Short-term borrowings 7,609 10,292 8,027 (2,683) (418) Long-term debt 90,276 88,021 105,397 2,255 (15,121) Total debt 97,885 98,313 113,424 (428) (15,539) Other liabilities 15,925 16,500 20,937 (575) (5,012) Liabilities of operations held-for-sale 12,209 4,898 - 7,311 12,209 Total liabilities 158,879 151,467 157,531 7,412 1,348 - - Equity 20,548 20,839 22,021 (291) (1,473) Total liabilities and equity 179,427 $ 172,306 $ 179,552 $ 7,121 $ (125) $ Increase/(Decrease) vs. 30
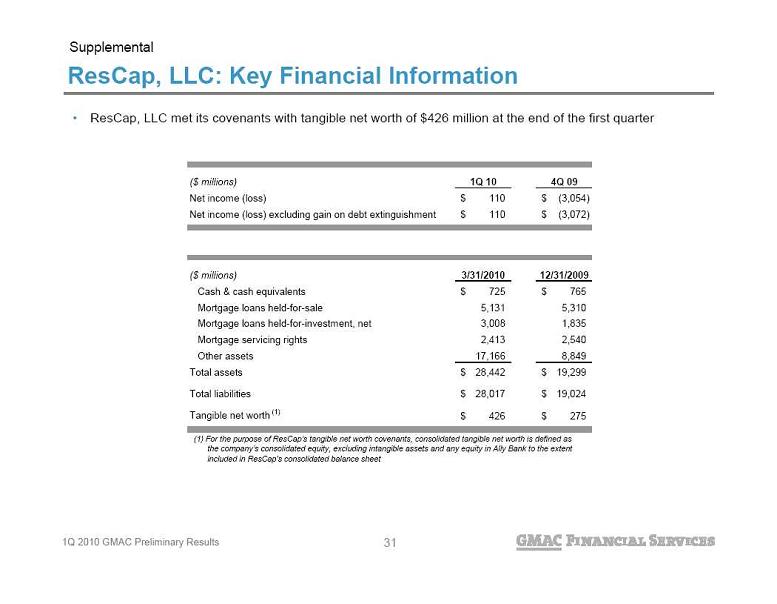 ResCap, LLC: Key Financial Information ResCap, LLC met its covenants with tangible net worth of $426 million at the end of the first quarter (1) For the purpose of ResCap’s tangible net worth covenants, consolidated tangible net worth is defined as
the company’s consolidated equity, excluding intangible assets and any equity in Ally Bank to the extent
included in ResCap’s consolidated balance sheet Supplemental ($ millions) 1Q 10 4Q 09 Net income (loss) 110 $ (3,054) $ Net income (loss) excluding gain on debt extinguishment 110 $ (3,072) $ ($ millions) 3/31/2010 12/31/2009 Cash & cash equivalents 725 $ 765 $ Mortgage loans held-for-sale 5,131 5,310 Mortgage loans held-for-investment, net 3,008 1,835 Mortgage servicing rights 2,413 2,540 Other assets 17,166 8,849 Total assets 28,442 $ 19,299 $ Total liabilities 28,017 $ 19,024 $ Tangible net worth (1) 426 $ 275 $ 31
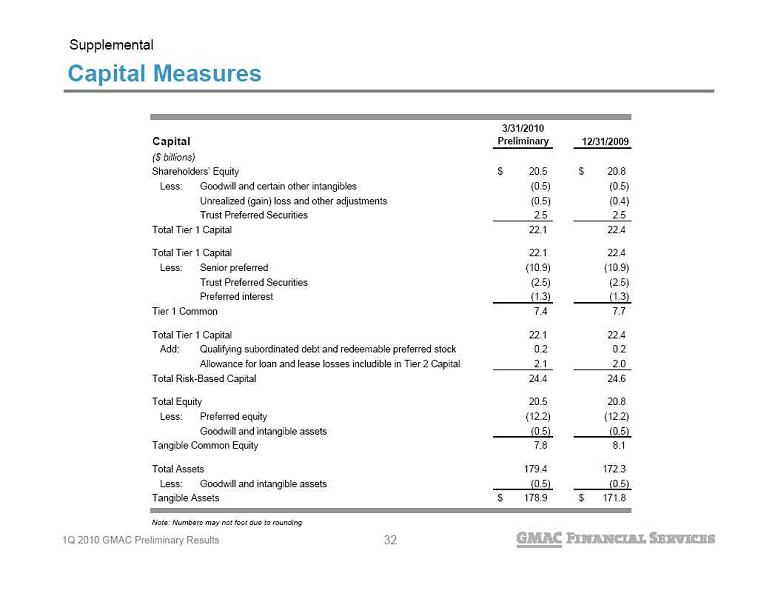 Capital Measures Supplemental Capital 3/31/2010 Preliminary 12/31/2009 Shareholders’ Equity 20.5 $ 20.8 $ Less: Goodwill and certain other intangibles (0.5) (0.5) Unrealized (gain) loss and other adjustments (0.5) (0.4) Trust Preferred Securities 2.5 2.5 Total Tier 1 Capital 22.1 22.4 Total Tier 1 Capital 22.1 22.4 Less: Senior preferred (10.9) (10.9) Trust Preferred Securities (2.5) (2.5) Preferred interest (1.3) (1.3) Tier 1 Common 7.4 7.7 Total Tier 1 Capital 22.1 22.4 Add: Qualifying subordinated debt and redeemable preferred stock 0.2 0.2 Allowance for loan and lease losses includible in Tier 2 Capital 2.1 2.0 Total Risk-Based Capital 24.4 24.6 Total Equity 20.5 20.8 Less: Preferred equity (12.2) (12.2) Goodwill and intangible assets (0.5) (0.5) Tangible Common Equity 7.8 8.1 Total Assets 179.4 172.3 Less: Goodwill and intangible assets (0.5) (0.5) Tangible Assets 178.9 $ 171.8 $ Note: Numbers may not foot due to rounding ($ billions) 32
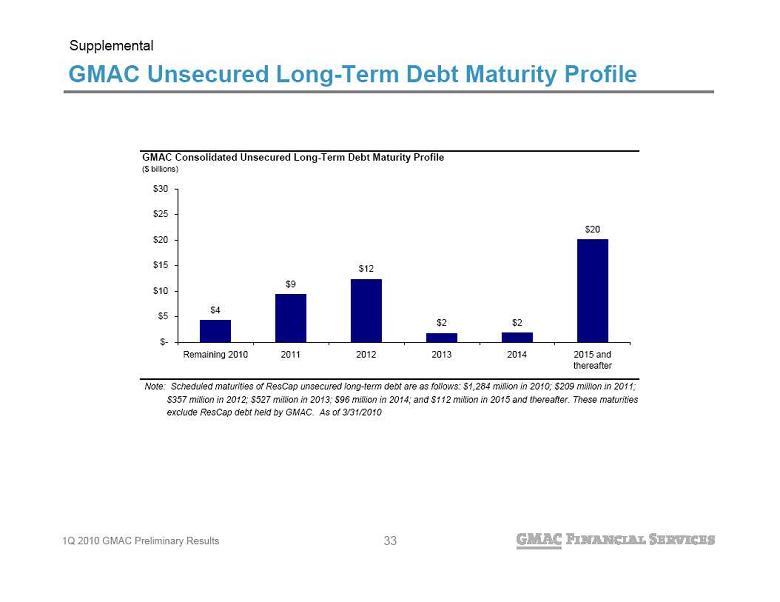 GMAC Unsecured Long-Term Debt Maturity Profile Supplemental Note: Scheduled maturities of ResCap unsecured long-term debt are as follows: $1,284 million in 2010; $209 million in 2011;
$357 million in 2012; $527 million in 2013; $96 million in 2014; and $112 million in 2015 and thereafter. These maturities
exclude ResCap debt held by GMAC. As of 3/31/2010 GMAC Consolidated Unsecured Long-Term Debt Maturity Profile ($ billions) $4 $9 $12 $2 $2 $20 $- $5 $10 $15 $20 $25 $30 Remaining 2010 2011 2012 2013 2014 2015 and thereafter 33
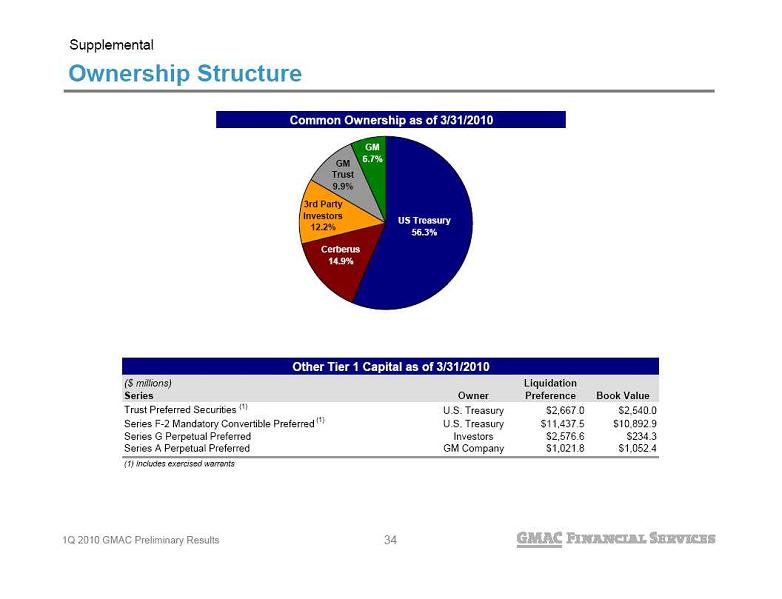 Ownership Structure Supplemental Common Ownership as of 3/31/2010 US Treasury 56.3% Cerberus 14.9% 3rd Party Investors 12.2% GM Trust 9.9% GM 6.7% ($ millions) Series Owner Liquidation Preference Book Value Trust Preferred Securities (1) U.S. Treasury $2,667.0 $2,540.0 Series F-2 Mandatory Convertible Preferred (1) U.S. Treasury $11,437.5 $10,892.9 Series G Perpetual Preferred Investors $2,576.6 $234.3 Series A Perpetual Preferred GM Company $1,021.8 $1,052.4 (1) Includes exercised warrants Other Tier 1 Capital as of 3/31/2010 34