 Ally Financial Inc. 2Q10 Earnings Review August 3, 2010 Contact Ally Investor Relations at (866) 710-4623 or investor.relations@ally.com
 Forward-Looking Statements and Additional Information The following should be read in conjunction with the financial statements, notes and other information contained in the Company’s 2009 Annual
Report on Form 10-K, Quarterly Reports on Form 10-Q, and Current Reports on Form 8-K. This information is preliminary and based on company data available at the time of the presentation In the presentation that follows and related comments by Ally Financial Inc. (“Ally”) management, the use of the words “expect,” “anticipate,”
“estimate,” “forecast,” “initiative,” “objective,” “plan,” “goal,” “project,” “outlook,” “priorities,” “target,” “intend,” “evaluate,” “pursue,” “seek,” “may,”
“would,” “could,” “should,” “believe,” “potential,” “continue,” or similar expressions is intended to identify forward-looking statements. All statements
herein and in related management comments, other than statements of historical fact, including without limitation, statements about future events
and financial performance, are forward-looking statements that involve certain risks and uncertainties. While these statements represent our
current judgment on what the future may hold, and we believe these judgments are reasonable, these statements are not guarantees of any
events or financial results, and Ally’s actual results may differ materially due to numerous important factors that are described in the most recent
reports on SEC Forms 10-K and 10-Q for Ally, each of which may be revised or supplemented in subsequent reports on SEC Forms 10-Q and 8-
K. Such factors include, among others, the following: our inability to repay our outstanding obligations to the U.S. Department of the Treasury, or to
do so in a timely fashion and without disruption to our business; uncertainty of Ally's ability to enter into transactions or execute strategic
alternatives to realize the value of its Residential Capital, LLC (“ResCap”) operations; our inability to successfully accommodate the additional risk
exposure relating to providing wholesale and retail financing to Chrysler dealers and customers and the resulting impact to our financial stability;
uncertainty related to Chrysler’s and GM’s recent exits from bankruptcy; uncertainty related to the new financing arrangement between Ally and
Chrysler; securing low cost funding for Ally and ResCap and maintaining the mutually beneficial relationship between Ally and GM, and Ally and
Chrysler; our ability to maintain an appropriate level of debt and capital; the profitability and financial condition of GM and Chrysler; our ability to
realize the anticipated benefits associated with our recent conversion to a bank holding company, and the increased regulation and restrictions
that we are now subject to; continued challenges in the residential mortgage and capital markets; the potential for deterioration in the residual
value of off-lease vehicles; the continuing negative impact on ResCap of the decline in the U.S. housing market; changes in U.S. government-
sponsored mortgage programs or disruptions in the markets in which our mortgage subsidiaries operate; disruptions in the market in which we
fund Ally’s and ResCap’s operations, with resulting negative impact on our liquidity; changes in our accounting assumptions that may require or
that result from changes in the accounting rules or their application, which could result in an impact on earnings; changes in the credit ratings of
ResCap, Ally, Chrysler or GM; changes in economic conditions, currency exchange rates or political stability in the markets in which we operate;
and changes in the existing or the adoption of new laws, regulations, policies or other activities of governments, agencies and similar organizations
(including as a result of the recently enacted financial regulatory reform bill). Investors are cautioned not to place undue reliance on forward-
looking statements. Ally undertakes no obligation to update publicly or otherwise revise any forward-looking statements except where expressly
required by law. A reconciliation of certain non-GAAP financial measures included within this presentation is provided in the supplemental charts. Use of the term “loans” describes products associated with direct and indirect lending activities of Ally’s global operations. The specific products
include retail installment sales contracts, loans, lines of credit, leases or other financing products. The term “originate” refers to Ally’s purchase,
acquisition or direct origination of various “loan” products. 2
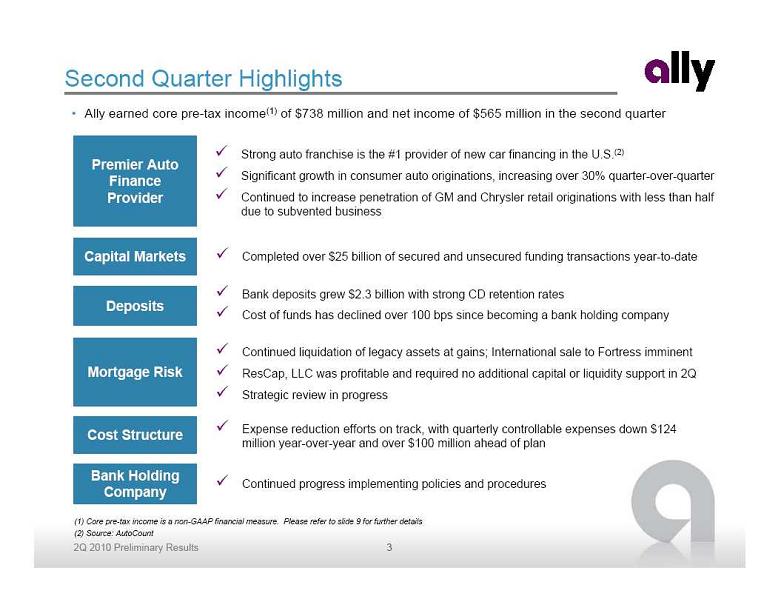 Second Quarter Highlights Ally earned core pre-tax income(1) of $738 million and net income of $565 million in the second quarter Premier Auto
Finance
Provider Capital Markets Mortgage Risk Cost Structure Deposits Bank Holding
Company Strong auto franchise is the #1 provider of new car financing in the U.S.(2) Significant growth in consumer auto originations, increasing over 30% quarter-over-quarter Continued to increase penetration of GM and Chrysler retail originations with less than half
due to subvented business Completed over $25 billion of secured and unsecured funding transactions year-to-date Continued liquidation of legacy assets at gains; International sale to Fortress imminent ResCap, LLC was profitable and required no additional capital or liquidity support in 2Q Strategic review in progress Expense reduction efforts on track, with quarterly controllable expenses down $124
million year-over-year and over $100 million ahead of plan Bank deposits grew $2.3 billion with strong CD retention rates Cost of funds has declined over 100 bps since becoming a bank holding company Continued progress implementing policies and procedures (1) Core pre-tax income is a non-GAAP financial measure. Please refer to slide 9 for further details (2) Source: AutoCount 3
 Auto Franchise Momentum Ally will continue to leverage competitive advantages to evolve as a leading market driven competitor Uniquely positioned with long-standing dealer relationships and over 90 years of industry experience Leading provider across a full spectrum of products for dealers and their customers Robust infrastructure integrated with dealers and OEMs Focus on competitive rates and high quality service provided to dealers and their customers Bank holding company structure provides added stability and cost-efficient funding Vehicle Service Contracts Full Service Platform Finance Products Insurance Products Retail Loans Retail Leases Floorplan Financing Working Capital Loans Smart- Auction Floorplan Insurance GAP Protection U.S. Consumer Auto Originations and Manufacturer Penetration ($ billions) $0 $1 $2 $3 $4 $5 $6 $7 $8 $9 $10 2Q 08 3Q 08 4Q 08 1Q 09 2Q 09 3Q 09 4Q 09 1Q 10 2Q 10 0% 10% 20% 30% 40% 50% 60% U.S. Consumer Originations GM Penetration Chrysler Penetration 4
 -39% 22.5% 14.4% 13.8% - Next 5 Largest Competitors -44% 7.8% 4.8% 4.4% - Next Largest Competitor % of GM/Chrysler Consumer Sales
Financed by: 124% 17.0% 27.7% 38.1% % of GM/Chrysler Consumer Sales
Financed by Ally 107% 189,767 314,541 392,484 # of New GM/Chrysler Vehicles Financed
for Consumers by Ally 42% 59% 81% 84% % of GM/Chrysler Sales Through Dealers
Financed (Wholesale Penetration) 4% 504,441 485,983 525,307 Outstanding # of New Vehicles Financed
for Dealers by Ally (Period End) 0.4% 5,043 5,411 5,061 # of Dealers Financed by Ally
(Floorplan) (1)(2) 1H 2010 2H 2009 1H 2009 1H10 vs. 1H09
Growth (%) (1) Total number of dealers financed by Ally calculated by taking average of the number of dealers financed at the end of each of the two quarters that comprise each respective period (2) While total number of dealers declined from 2H09, Ally’s percentage of active dealers remains consistent Source: Internal Ally data and AutoCount Ally has Fulfilled its Mission of Supporting U.S. Auto Industry 5
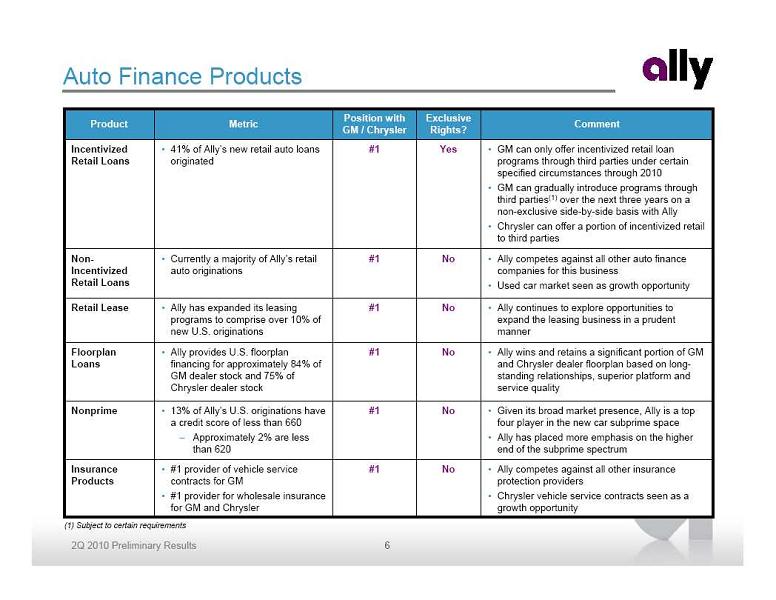 Auto Finance Products Given its broad market presence, Ally is a top
four player in the new car subprime space Ally has placed more emphasis on the higher
end of the subprime spectrum No #1 13% of Ally’s U.S. originations have
a credit score of less than 660 Approximately 2% are less
than 620 Nonprime #1 #1 #1 #1 #1 Position with
GM / Chrysler Ally wins and retains a significant portion of GM
and Chrysler dealer floorplan based on long-
standing relationships, superior platform and
service quality No Ally provides U.S. floorplan
financing for approximately 84% of
GM dealer stock and 75% of
Chrysler dealer stock Floorplan
Loans Ally competes against all other auto finance
companies for this business Used car market seen as growth opportunity No Currently a majority of Ally’s retail
auto originations Non-
Incentivized
Retail Loans Ally competes against all other insurance
protection providers Chrysler vehicle service contracts seen as a
growth opportunity No #1 provider of vehicle service
contracts for GM #1 provider for wholesale insurance
for GM and Chrysler Insurance
Products Ally continues to explore opportunities to
expand the leasing business in a prudent
manner No Ally has expanded its leasing
programs to comprise over 10% of
new U.S. originations Retail Lease GM can only offer incentivized retail loan
programs through third parties under certain
specified circumstances through 2010 GM can gradually introduce programs through
third parties(1) over the next three years on a
non-exclusive side-by-side basis with Ally Chrysler can offer a portion of incentivized retail
to third parties Yes 41% of Ally’s new retail auto loans
originated Incentivized
Retail Loans Comment Exclusive
Rights? Metric Product (1) Subject to certain requirements 6
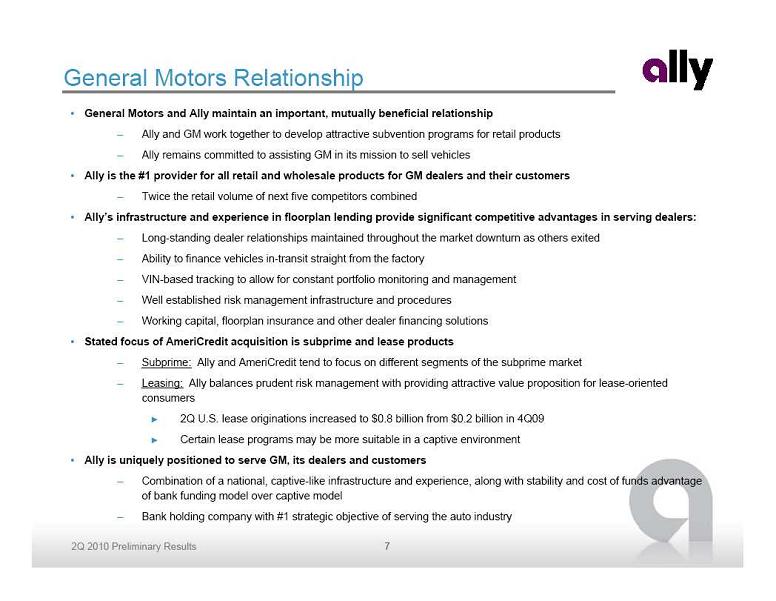 General Motors Relationship General Motors and Ally maintain an important, mutually beneficial relationship Ally and GM work together to develop attractive subvention programs for retail products Ally remains committed to assisting GM in its mission to sell vehicles Ally is the #1 provider for all retail and wholesale products for GM dealers and their customers Twice the retail volume of next five competitors combined Ally’s infrastructure and experience in floorplan lending provide significant competitive advantages in serving dealers: Long-standing dealer relationships maintained throughout the market downturn as others exited Ability to finance vehicles in-transit straight from the factory VIN-based tracking to allow for constant portfolio monitoring and management Well established risk management infrastructure and procedures Working capital, floorplan insurance and other dealer financing solutions Stated focus of AmeriCredit acquisition is subprime and lease products Subprime: Ally and AmeriCredit tend to focus on different segments of the subprime market Leasing: Ally balances prudent risk management with providing attractive value proposition for lease-oriented
consumers 2Q U.S. lease originations increased to $0.8 billion from $0.2 billion in 4Q09 Certain lease programs may be more suitable in a captive environment Ally is uniquely positioned to serve GM, its dealers and customers Combination of a national, captive-like infrastructure and experience, along with stability and cost of funds advantage
of bank funding model over captive model Bank holding company with #1 strategic objective of serving the auto industry 7
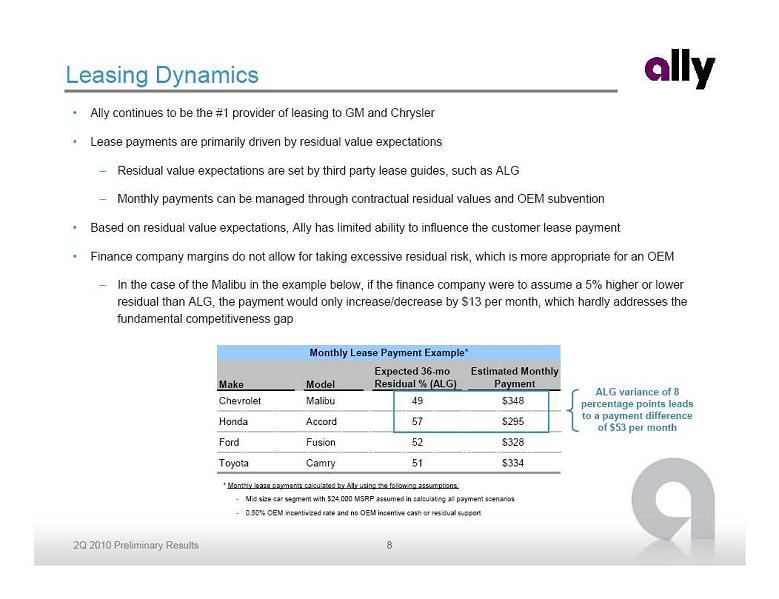 Leasing Dynamics Ally continues to be the #1 provider of leasing to GM and Chrysler Lease payments are primarily driven by residual value expectations Residual value expectations are set by third party lease guides, such as ALG Monthly payments can be managed through contractual residual values and OEM subvention Based on residual value expectations, Ally has limited ability to influence the customer lease payment Finance company margins do not allow for taking excessive residual risk, which is more appropriate for an OEM In the case of the Malibu in the example below, if the finance company were to assume a 5% higher or lower
residual than ALG, the payment would only increase/decrease by $13 per month, which hardly addresses the
fundamental competitiveness gap * Monthly lease payments calculated by Ally using the following assumptions: Mid size car segment with $24,000 MSRP assumed in calculating all payment scenarios 0.50% OEM incentivized rate and no OEM incentive cash or residual support ALG variance of 8
percentage points leads
to a payment difference
of $53 per month Make Model Expected 36-mo Residual % (ALG) Estimated Monthly Payment Chevrolet Malibu 49 $348 Honda Accord 57 $295 Ford Fusion 52 $328 Toyota Camry 51 $334 Monthly Lease Payment Example* 8
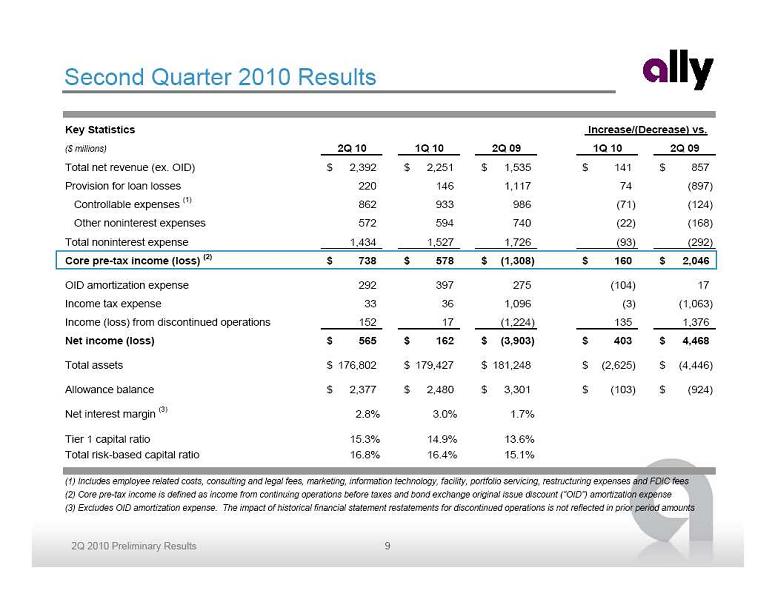 Second Quarter 2010 Results Key Statistics ($ millions) 2Q 10 1Q 10 2Q 09 1Q 10 2Q 09 Total net revenue (ex. OID) 2,392 $ 2,251 $ 1,535 $ 141 $ 857 $ Provision for loan losses 220 146 1,117 74 (897) Controllable expenses (1) 862 933 986 (71) (124) Other noninterest expenses 572 594 740 (22) (168) Total noninterest expense 1,434 1,527 1,726 (93) (292) Core pre-tax income (loss) (2) 738 $ 578 $ (1,308) $ 160 $ 2,046 $ OID amortization expense 292 397 275 (104) 17 Income tax expense 33 36 1,096 (3) (1,063) Income (loss) from discontinued operations 152 17 (1,224) 135 1,376 Net income (loss) 565 $ 162 $ (3,903) $ 403 $ 4,468 $ Total assets 176,802 $ 179,427 $ 181,248 $ (2,625) $ (4,446) $ Allowance balance 2,377 $ 2,480 $ 3,301 $ (103) $ (924) $ Net interest margin (3) 2.8% 3.0% 1.7% Tier 1 capital ratio 15.3% 14.9% 13.6% Total risk-based capital ratio 16.8% 16.4% 15.1% (1) Includes employee related costs, consulting and legal fees, marketing, information technology, facility, portfolio servicing, restructuring expenses and FDIC fees (2) Core pre-tax income is defined as income from continuing operations before taxes and bond exchange original issue discount ("OID") amortization expense (3) Excludes OID amortization expense. The impact of historical financial statement restatements for discontinued operations is not reflected in prior period amounts Increase/(Decrease) vs. 9
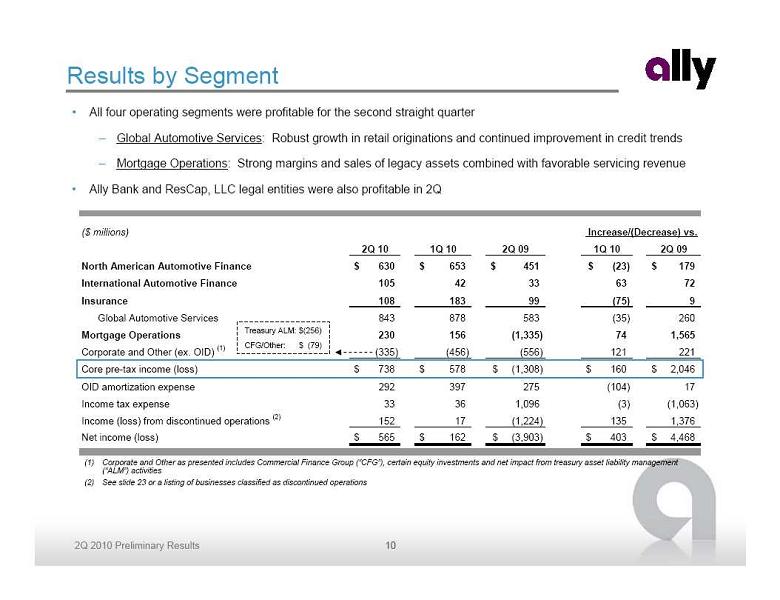 Results by Segment All four operating segments were profitable for the second straight quarter Global Automotive Services: Robust growth in retail originations and continued improvement in credit trends Mortgage Operations: Strong margins and sales of legacy assets combined with favorable servicing revenue (1) Ally Bank and ResCap, LLC legal entities were also profitable in 2Q (2) Corporate and Other as presented includes Commercial Finance Group (“CFG”), certain equity investments and net impact from treasury asset liability management
(“ALM”) activities See slide 23 or a listing of businesses classified as discontinued operations Treasury ALM: $(256) CFG/Other: $ (79) ($ millions) 2Q 10 1Q 10 2Q 09 1Q 10 2Q 09 North American Automotive Finance 630 $ 653 $ 451 $ (23) $ 179 $ International Automotive Finance 105 42 33 63 72 Insurance 108 183 99 (75) 9 Global Automotive Services 843 878 583 (35) 260 Mortgage Operations 230 156 (1,335) 74 1,565 Corporate and Other (ex. OID) (1) (335) (456) (556) 121 221 Core pre-tax income (loss) 738 $ �� 578 $ (1,308) $ 160 $ 2,046 $ OID amortization expense 292 397 275 (104) 17 Income tax expense 33 36 1,096 (3) (1,063) Income (loss) from discontinued operations (2) 152 17 (1,224) 135 1,376 Net income (loss) 565 $ 162 $ (3,903) $ 403 $ 4,468 $ Increase/(Decrease) vs. 10
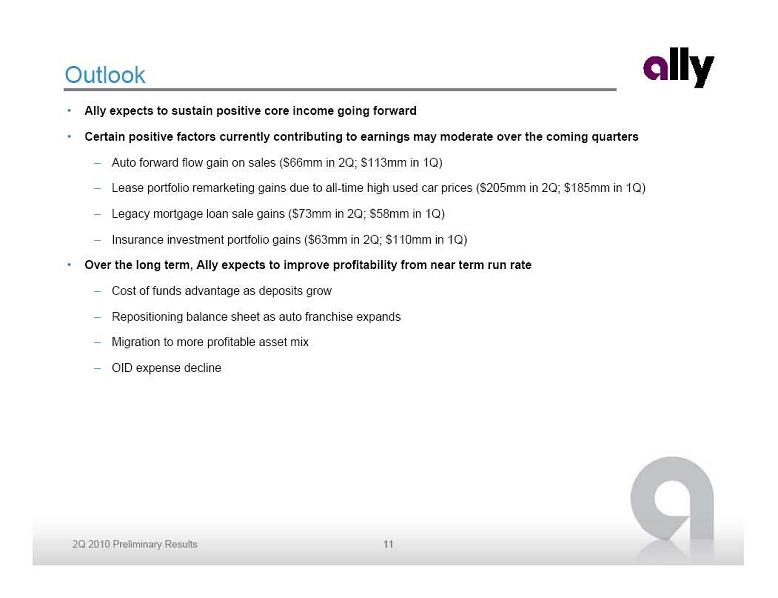 Outlook Ally expects to sustain positive core income going forward Certain positive factors currently contributing to earnings may moderate over the coming quarters Auto forward flow gain on sales ($66mm in 2Q; $113mm in 1Q) Lease portfolio remarketing gains due to all-time high used car prices ($205mm in 2Q; $185mm in 1Q) Legacy mortgage loan sale gains ($73mm in 2Q; $58mm in 1Q) Insurance investment portfolio gains ($63mm in 2Q; $110mm in 1Q) Over the long term, Ally expects to improve profitability from near term run rate Cost of funds advantage as deposits grow Repositioning balance sheet as auto franchise expands Migration to more profitable asset mix OID expense decline 11
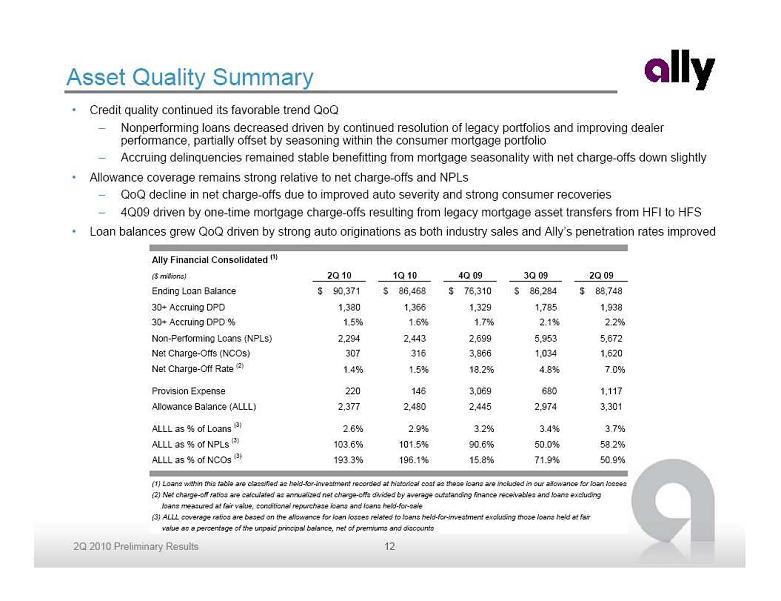 Asset Quality Summary Credit quality continued its favorable trend QoQ Nonperforming loans decreased driven by continued resolution of legacy portfolios and improving dealer
performance, partially offset by seasoning within the consumer mortgage portfolio Accruing delinquencies remained stable benefitting from mortgage seasonality with net charge-offs down slightly Allowance coverage remains strong relative to net charge-offs and NPLs QoQ decline in net charge-offs due to improved auto severity and strong consumer recoveries 4Q09 driven by one-time mortgage charge-offs resulting from legacy mortgage asset transfers from HFI to HFS Loan balances grew QoQ driven by strong auto originations as both industry sales and Ally’s penetration rates improved Ally Financial Consolidated (1) ($ millions) 2Q 10 1Q 10 4Q 09 3Q 09 2Q 09 Ending Loan Balance 90,371 $ 86,468 $ 76,310 $ 86,284 $ 88,748 $ 30+ Accruing DPD 1,380 1,366 1,329 1,785 1,938 30+ Accruing DPD % 1.5% 1.6% 1.7% 2.1% 2.2% Non-Performing Loans (NPLs) 2,294 2,443 2,699 5,953 5,672 Net Charge-Offs (NCOs) 307 316 3,866 1,034 1,620 Net Charge-Off Rate (2) 1.4% 1.5% 18.2% 4.8% 7.0% Provision Expense 220 146 3,069 680 1,117 Allowance Balance (ALLL) 2,377 2,480 2,445 2,974 3,301 ALLL as % of Loans (3) 2.6% 2.9% 3.2% 3.4% 3.7% ALLL as % of NPLs (3) 103.6% 101.5% 90.6% 50.0% 58.2% ALLL as % of NCOs (3) 193.3% 196.1% 15.8% 71.9% 50.9% (1) Loans within this table are classified as held-for-investment recorded at historical cost as these loans are included in our allowance for loan losses (2) Net charge-off ratios are calculated as annualized net charge-offs divided by average outstanding finance receivables and loans excluding loans measured at fair value, conditional repurchase loans and loans held-for-sale (3) ALLL coverage ratios are based on the allowance for loan losses related to loans held-for-investment excluding those loans held at fair value as a percentage of the unpaid principal balance, net of premiums and discounts 12
 Global Automotive Services Global Automotive Services earned $843 million of pre-tax income from continuing operations in 2Q Sixth consecutive profitable quarter from core auto business North American Operations continued to drive results and International Operations performance improved Robust growth in total retail consumer originations in the quarter General improvement in the auto market GM and Chrysler gained market share while Ally increased penetration of both Growth in used vehicle originations Leasing volume remained consistent Brazil and China continued to grow originations $303 $878 $411 $583 $843 Pre-Tax Income from Continuing Operations Global Consumer Auto Originations ($ millions) ($ billions) Note: Includes North American and International Operations $272 $369 $653 $630 $(152) $42 $99 $108 $183 $451 $105 $33 $31 $108 $86 $(400) $(200) $- $200 $400 $600 $800 2Q 09 3Q 09 4Q 09 1Q 10 2Q 10 North American International Insurance $3.3 $3.7 $6.1 $7.7 $8.2 $8.2 $10.7 $0 $2 $4 $6 $8 $10 $12 4Q 08 1Q 09 2Q 09 3Q 09 4Q 09 1Q 10 2Q 10 New - Retail New - Leases Used 13
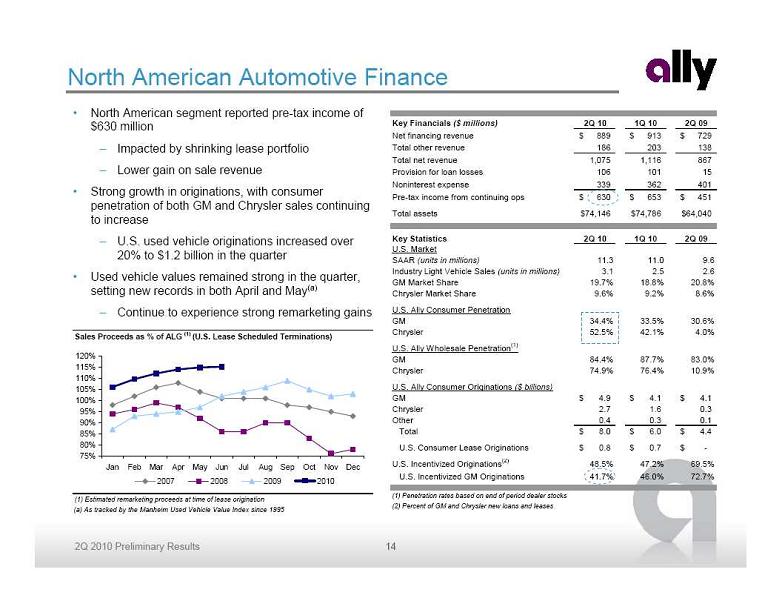 North American Automotive Finance North American segment reported pre-tax income of
$630 million Impacted by shrinking lease portfolio Lower gain on sale revenue Strong growth in originations, with consumer
penetration of both GM and Chrysler sales continuing
to increase U.S. used vehicle originations increased over
20% to $1.2 billion in the quarter Used vehicle values remained strong in the quarter,
setting new records in both April and May(a) Continue to experience strong remarketing gains (a) As tracked by the Manheim Used Vehicle Value Index since 1995 Sales Proceeds as % of ALG (1) (U.S. Lease Scheduled Terminations) (1) Estimated remarketing proceeds at time of lease origination 75% 80% 85% 90% 95% 100% 105% 110% 115% 120% Jan Feb Mar Apr May Jun Jul Aug Sep Oct Nov Dec 2007 2008 2009 2010 Key Financials ($ millions) 2Q 10 1Q 10 2Q 09 Net financing revenue 889 $ 913 $ 729 $ Total other revenue 186 203 138 Total net revenue 1,075 1,116 867 Provision for loan losses 106 101 15 Noninterest expense 339 362 401 Pre-tax income from continuing ops 630 $ 653 $ 451 $ Total assets 74,146 $ 74,786 $ 64,040 $ Key Statistics 2Q 10 1Q 10 2Q 09 U.S. Market SAAR (units in millions) 11.3 11.0 9.6 Industry Light Vehicle Sales (units in millions) 3.1 2.5 2.6 GM Market Share 19.7% 18.8% 20.8% Chrysler Market Share 9.6% 9.2% 8.6% U.S. Ally Consumer Penetration GM 34.4% 33.5% 30.6% Chrysler 52.5% 42.1% 4.0% U.S. Ally Wholesale Penetration (1) GM 84.4% 87.7% 83.0% Chrysler 74.9% 76.4% 10.9% U.S. Ally Consumer Originations ($ billions) GM 4.9 $ 4.1 $ 4.1 $ Chrysler 2.7 1.6 0.3 Other 0.4 0.3 0.1 Total 8.0 $ 6.0 $ 4.4 $ U.S. Consumer Lease Originations 0.8 $ 0.7 $ - $ U.S. Incentivized Originations (2) 48.5% 47.2% 69.5% U.S. Incentivized GM Originations 41.7% 46.0% 72.7% (1) Penetration rates based on end of period dealer stocks (2) Percent of GM and Chrysler new loans and leases 14
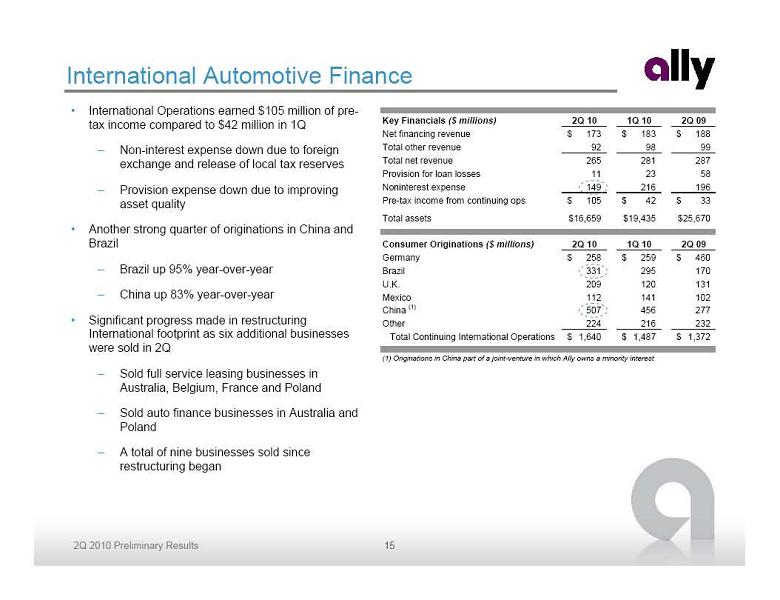 International Operations earned $105 million of pre-
tax income compared to $42 million in 1Q Non-interest expense down due to foreign
exchange and release of local tax reserves Provision expense down due to improving
asset quality Another strong quarter of originations in China and
Brazil Brazil up 95% year-over-year China up 83% year-over-year Significant progress made in restructuring
International footprint as six additional businesses
were sold in 2Q Sold full service leasing businesses in
Australia, Belgium, France and Poland Sold auto finance businesses in Australia and
Poland A total of nine businesses sold since
restructuring began International Automotive Finance Key Financials ($ millions) 2Q 10 1Q 10 2Q 09 Net financing revenue 173 $ 183 $ 188 $ Total other revenue 92 98 99 Total net revenue 265 281 287 Provision for loan losses 11 23 58 Noninterest expense 149 216 196 Pre-tax income from continuing ops 105 $ 42 $ 33 $ Total assets 16,659 $ 19,435 $ 25,670 $ Consumer Originations ($ millions) 2Q 10 1Q 10 2Q 09 Germany 258 $ 259 $ 460 $ Brazil 331 295 170 U.K. 209 120 131 Mexico 112 141 102 China (1) 507 456 277 Other 224 216 232 Total Continuing International Operations 1,640 $ 1,487 $ 1,372 $ (1) Originations in China part of a joint-venture in which Ally owns a minority interest 15
 Global Auto Finance – Consumer Credit Trends Delinquency trends remained relatively stable in
the second quarter Reflective of improved collection processes,
more stable economic conditions and
increased quality of newer vintages Excluding the Nuvell portfolio, delinquencies
continued to fall in the quarter Nuvell delinquencies elevated due to a
change in nonaccrual policy Both the core auto portfolio and Nuvell subprime
portfolio experienced significant declines in losses Results driven by used car market strength,
lower frequency of loss, post loss recoveries
and stronger performance on newer vintages Continued focus on Nuvell portfolio with
losses declining over 500 bps in the quarter Nuvell portfolio balance declined by
$400 million to $3.1 billion Global Delinquencies - Managed Retail Contract Amount $ Amount of Accruing Contracts Greater than 30 Days Past Due (millions) 2.16% 2.22% 2.62% 2.80% 2.91% 2.66% 2.82% 3.27% 3.46% 3.48% 2.87% 2.93% $0 $500 $1,000 $1,500 $2,000 $2,500 1Q 09 2Q 09 3Q 09 4Q 09 1Q 10 2Q 10 0.00% 0.50% 1.00% 1.50% 2.00% 2.50% 3.00% 3.50% Nuvell Delinquent Contract $ Delinquent Contract $ (excluding Nuvell) % of Retail Contract $ Outstanding % of Retail Contract $ Outstanding (excluding Nuvell) Global Annualized Credit Losses - Managed Retail Contracts ($ millions) (1) 3Q and 4Q 2009 elevated due to change in charge-off policy 1.84% 1.80% 2.39% 2.48% 1.30% 0.77% 1.05% 2.04% 3.57% 3.29% 2.29% 2.43% $0 $100 $200 $300 $400 $500 1Q 09 2Q 09 3Q 09 4Q 09 1Q 10 2Q 10 0.00% 0.50% 1.00% 1.50% 2.00% 2.50% 3.00% 3.50% 4.00% Nuvell Credit Losses Credit Losses (excluding Nuvell) % of Avg. Managed Assets % of Avg. Managed Assets (excluding Nuvell) (1) (1) 16
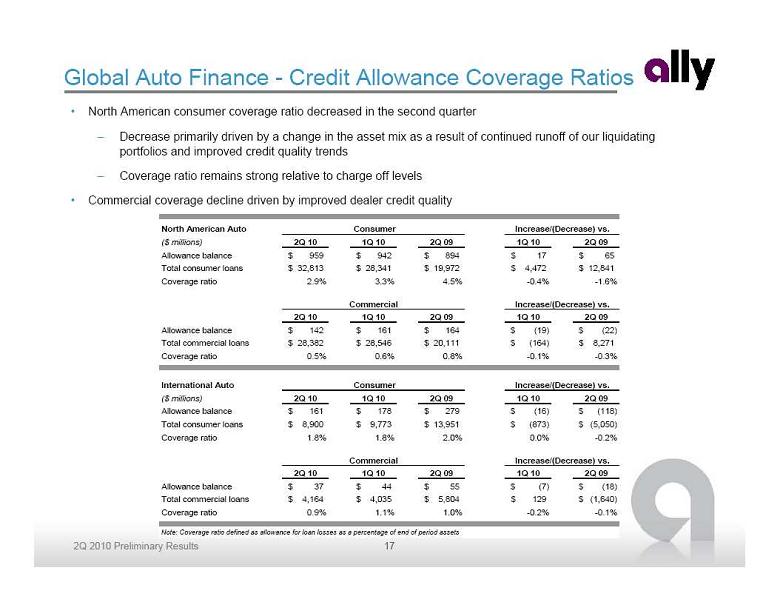 Global Auto Finance - Credit Allowance Coverage Ratios North American consumer coverage ratio decreased in the second quarter Decrease primarily driven by a change in the asset mix as a result of continued runoff of our liquidating
portfolios and improved credit quality trends Coverage ratio remains strong relative to charge off levels Commercial coverage decline driven by improved dealer credit quality North American Auto Consumer ($ millions) 2Q 10 1Q 10 2Q 09 1Q 10 2Q 09 Allowance balance 959 $ 942 $ 894 $ 17 $ 65 $ Total consumer loans 32,813 $ 28,341 $ 19,972 $ 4,472 $ 12,841 $ Coverage ratio 2.9% 3.3% 4.5% -0.4% -1.6% Commercial 2Q 10 1Q 10 2Q 09 1Q 10 2Q 09 Allowance balance 142 $ 161 $ 164 $ (19) $ (22) $ Total commercial loans 28,382 $ 28,546 $ 20,111 $ (164) $ 8,271 $ Coverage ratio 0.5% 0.6% 0.8% -0.1% -0.3% International Auto Consumer ($ millions) 2Q 10 1Q 10 2Q 09 1Q 10 2Q 09 Allowance balance 161 $ 178 $ 279 $ (16) $ (118) $ Total consumer loans 8,900 $ 9,773 $ 13,951 $ (873) $ (5,050) $ Coverage ratio 1.8% 1.8% 2.0% 0.0% -0.2% Commercial 2Q 10 1Q 10 2Q 09 1Q 10 2Q 09 Allowance balance 37 $ 44 $ 55 $ (7) $ (18) $ Total commercial loans 4,164 $ 4,035 $ 5,804 $ 129 $ (1,640) $ Coverage ratio 0.9% 1.1% 1.0% -0.2% -0.1% Note: Coverage ratio defined as allowance for loan losses as a percentage of end of period assets Increase/(Decrease) vs. Increase/(Decrease) vs. Increase/(Decrease) vs. Increase/(Decrease) vs. 17
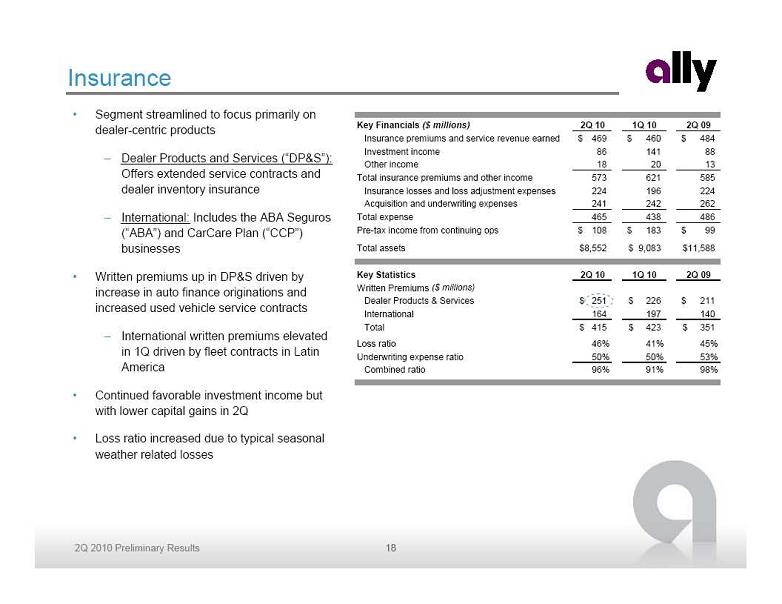 Insurance Segment streamlined to focus primarily on
dealer-centric products Dealer Products and Services (“DP&S”):
Offers extended service contracts and
dealer inventory insurance International: Includes the ABA Seguros
(“ABA”) and CarCare Plan (“CCP”)
businesses Written premiums up in DP&S driven by
increase in auto finance originations and
increased used vehicle service contracts International written premiums elevated
in 1Q driven by fleet contracts in Latin
America Continued favorable investment income but
with lower capital gains in 2Q Loss ratio increased due to typical seasonal
weather related losses Key Financials ($ millions) 2Q 10 1Q 10 2Q 09 Insurance premiums and service revenue earned 469 $ 460 $ 484 $ Investment income 86 141 88 Other income 18 20 13 Total insurance premiums and other income 573 621 585 Insurance losses and loss adjustment expenses 224 196 224 Acquisition and underwriting expenses 241 242 262 Total expense 465 438 486 Pre-tax income from continuing ops 108 $ 183 $ 99 $ Total assets 8,552 $ 9,083 $ 11,588 $ Key Statistics 2Q 10 1Q 10 2Q 09 Written Premiums ($ millions) Dealer Products & Services 251 $ 226 $ 211 $ International 164 197 140 Total 415 $ 423 $ 351 $ Loss ratio 46% 41% 45% Underwriting expense ratio 50% 50% 53% Combined ratio 96% 91% 98% 18
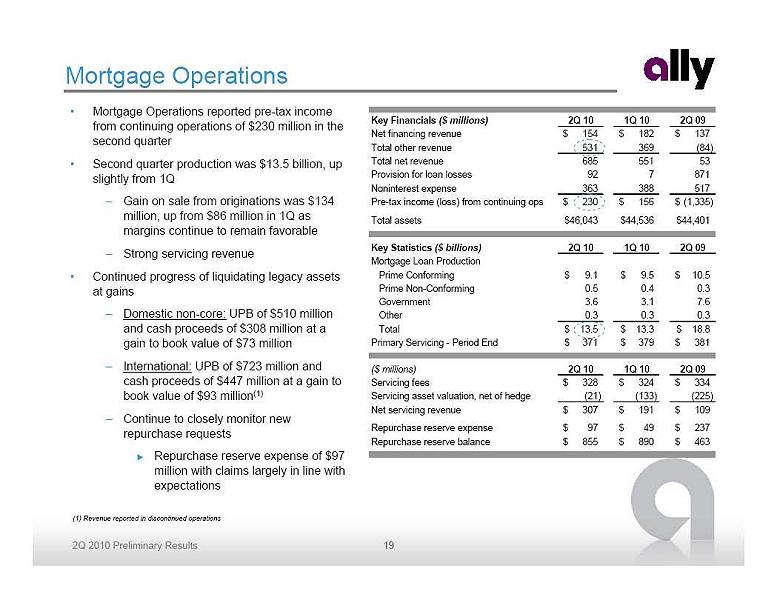 Mortgage Operations Mortgage Operations reported pre-tax income
from continuing operations of $230 million in the
second quarter Second quarter production was $13.5 billion, up
slightly from 1Q Gain on sale from originations was $134
million, up from $86 million in 1Q as
margins continue to remain favorable Strong servicing revenue Continued progress of liquidating legacy assets
at gains Domestic non-core: UPB of $510 million
and cash proceeds of $308 million at a
gain to book value of $73 million International: UPB of $723 million and
cash proceeds of $447 million at a gain to
book value of $93 million(1) Continue to closely monitor new
repurchase requests Repurchase reserve expense of $97
million with claims largely in line with
expectations (1) Revenue reported in discontinued operations Key Financials ($ millions) 2Q 10 1Q 10 2Q 09 Net financing revenue 154 $ 182 $ 137 $ Total other revenue 531 369 (84) Total net revenue 685 551 53 Provision for loan losses 92 7 871 Noninterest expense 363 388 517 Pre-tax income (loss) from continuing ops 230 $ 156 $ (1,335) $ Total assets 46,043 $ 44,536 $ 44,401 $ Key Statistics ($ billions) 2Q 10 1Q 10 2Q 09 Mortgage Loan Production Prime Conforming 9.1 $ 9.5 $ 10.5 $ Prime Non-Conforming 0.5 0.4 0.3 Government 3.6 3.1 7.6 Other 0.3 0.3 0.3 Total 13.5 $ 13.3 $ 18.8 $ Primary Servicing - Period End 371 $ 379 $ 381 $ ($ millions) 2Q 10 1Q 10 2Q 09 Servicing fees 328 $ 324 $ 334 $ Servicing asset valuation, net of hedge (21) (133) (225) Net servicing revenue 307 $ 191 $ 109 $ Repurchase reserve expense 97 $ 49 $ 237 $ Repurchase reserve balance 855 $ 890 $ 463 $ 19
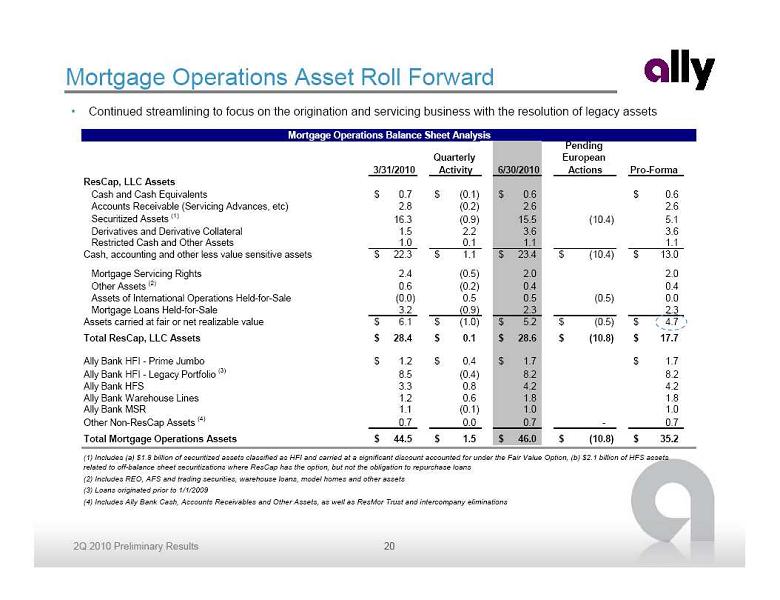 Mortgage Operations Asset Roll Forward Continued streamlining to focus on the origination and servicing business with the resolution of legacy assets 3/31/2010 Quarterly Activity 6/30/2010 Pending European Actions Pro-Forma ResCap, LLC Assets Cash and Cash Equivalents 0.7 $ (0.1) $ 0.6 $ 0.6 $ Accounts Receivable (Servicing Advances, etc) 2.8 (0.2) 2.6 2.6 Securitized Assets (1) 16.3 (0.9) 15.5 (10.4) 5.1 Derivatives and Derivative Collateral 1.5 2.2 3.6 3.6 Restricted Cash and Other Assets 1.0 0.1 1.1 1.1 Cash, accounting and other less value sensitive assets 22.3 $ 1.1 $ 23.4 $ (10.4) $ 13.0 $ Mortgage Servicing Rights 2.4 (0.5) 2.0 2.0 Other Assets (2) 0.6 (0.2) 0.4 0.4 Assets of International Operations Held-for-Sale (0.0) 0.5 0.5 (0.5) 0.0 Mortgage Loans Held-for-Sale 3.2 (0.9) 2.3 2.3 Assets carried at fair or net realizable value 6.1 $ (1.0) $ 5.2 $ (0.5) $ 4.7 $ Total ResCap, LLC Assets 28.4 $ 0.1 $ 28.6 $ (10.8) $ 17.7 $ Ally Bank HFI - Prime Jumbo 1.2 $ 0.4 $ 1.7 $ 1.7 $ Ally Bank HFI - Legacy Portfolio (3) 8.5 (0.4) 8.2 8.2 Ally Bank HFS 3.3 0.8 4.2 4.2 Ally Bank Warehouse Lines 1.2 0.6 1.8 1.8 Ally Bank MSR 1.1 (0.1) 1.0 1.0 Other Non-ResCap Assets (4) 0.7 0.0 0.7 - 0.7 Total Mortgage Operations Assets 44.5 $ 1.5 $ 46.0 $ (10.8) $ 35.2 $ (3) Loans originated prior to 1/1/2009 (4) Includes Ally Bank Cash, Accounts Receivables and Other Assets, as well as ResMor Trust and intercompany eliminations Mortgage Operations Balance Sheet Analysis (1) Includes (a) $1.8 billion of securitized assets classified as HFI and carried at a significant discount accounted for under the Fair Value Option, (b) $2.1 billion of HFS assets related to off-balance sheet securitizations where ResCap has the option, but not the obligation to repurchase loans (2) Includes REO, AFS and trading securities, warehouse loans, model homes and other assets 20
 Mortgage Operations - Credit Allowance Coverage Ratios Allowance balance and HFI portfolio down from prior year driven by strategic actions taken in 2009 Consumer coverage up slightly as HFI portfolio seasons and performs in line with expectations Commercial coverage down relative to prior periods as certain distressed legacy assets have been resolved or
charged-off Remaining commercial loans consist primarily of high quality correspondent warehouse lines at Ally Bank Held For Investment Portfolio Consumer ($ millions) 2Q 10 1Q 10 2Q 09 1Q 10 2Q 09 Allowance balance 659 $ 635 $ 1,133 $ 24 $ (474) $ Total consumer loans 11,286 11,243 20,917 43 (9,631) Coverage ratio 5.8% 5.6% 5.4% 0.2% 0.4% Non-performing loans 624 $ 446 $ 2,052 $ 178 $ (1,428) $ Allowance as a % of NPLs 105.6% 142.3% 55.2% -36.7% 50.4% Commercial 2Q 10 1Q 10 2Q 09 1Q 10 2Q 09 Allowance balance 70 $ 82 $ 536 $ (12) $ (466) $ Total commercial loans 2,002 1,542 3,412 460 (1,410) Coverage ratio 3.5% 5.3% 15.7% -1.8% -12.2% Non-performing loans 167 $ 237 $ 1,047 $ (70) $ (880) $ Allowance as a % of NPLs 41.9% 34.5% 51.2% 7.5% -9.3% Note: Coverage ratio defined as allowance for loan losses as a percentage of end of period assets (excluding loans held at fair value) Increase/(Decrease) vs. Increase/(Decrease) vs. 21
 Corporate and Other Results in the segment reflect amortization of
OID from bond exchanges Approximately $600 million of OID
amortization expense remains for 2010,
with expense moderating significantly after
2011 Favorability from prior quarter driven by Mark-to-market on deferred purchase price
asset related to auto forward flow
commitments Lower restructuring charges Hedge favorability Additional OID amortization expense in 1Q Key Financials ($ millions) 2Q 10 1Q 10 2Q 09 Net financing loss (ex. OID) (1) (237) $ (256) $ (439) $ Total other revenue (2) 36 (56) 188 Total net revenue (201) (312) (251) Provision for loan losses 11 15 173 Noninterest expense 123 129 132 Core pre-tax loss (335) $ (456) $ (556) $ OID Amortization (292) (397) (275) Pre-tax loss from continuing ops (627) $ (853) $ (831) $ Total Assets 31,465 $ 31,644 $ 35,622 $ (1) OID amortization expense of $296 million in 1Q10 (2) Excludes $101 million of accelerated OID amortization expense in 1Q10 OID Amortization Schedule ($ billions) As of 6/30/2010 $0.6 $1.0 $0.3 $0.2 $0.1 Avg = $0.1 / yr $0.3 $- $0.2 $0.4 $0.6 $0.8 $1.0 $1.2 $1.4 Remaining 2010 2011 2012 2013 2014 2015 2016 and thereafter 22
 Discontinued Operations Continued streamlining operations with seven additional businesses sold in 2Q Asset sales generating gains driven by improved market conditions Sale of U.K. mortgage assets generated net gain of $93 million Sale of European mortgage business expected to close in 3Q10 Impact of Discontinued Operations, net of tax ($ millions) 2Q 10 1Q 10 International Automotive Finance 44 $ 2 $ Insurance (4) (1) Global Automotive Services 40 1 Mortgage Operations 98 12 Corporate and Other 14 4 Consolidated net income (loss) 152 $ 17 $ Insurance Mortgage Corporate and Other Discontinued Operations sold in 2Q Australia Poland Australia Belgium France Poland Commercial Services (North American Factoring) Businesses classified as Discontinued Operations as of 6/30/2010 Argentina Ecuador Russia U.K. P&C U.K. and Continental Europe (1) (1) Definitive agreement signed in April. Sale expected to close in 3Q 2010 Auto Finance United Kingdom Full Service Leasing 23
 Liquidity 1) Ally utilizes a two-pronged funding strategy designed to support
stable liquidity and diversify funding sources Cost efficient funding at Ally Bank Over 65% of new auto originations were funded at
the bank level 2) Net bank deposits grew by $2.3 billion with strong CD
retention rates Consistent and diversified access to the capital markets Over $25 billion YTD of funding in the U.S. and
abroad Ally Financial Funding Transactions - 2Q 2010 ($ billions) ABS - Public / 144A (1) 2.7 $ ABS - Private / Other 1.1 Revolving Bank Facilities (2) 8.6 Unsecured Issuances 1.4 Total 2Q Funding Transactions 13.8 $ (1) Includes $674 million at ResCap (2) Includes $600 million at ResCap Available Liquidity 6/30/2010 3/31/2010 ($ billions) Parent (1)(2) Ally Bank Parent (1)(2) Ally Bank Cash and Cash Equivalents 10.3 $ 2.6 $ 9.0 $ 4.3 $ Unencumbered Securities (3) 1.1 3.8 0.3 3.4 Secured Committed Unused Capacity (4) 10.5 6.9 12.7 1.6 Unsecured Committed Unused Capacity 0.1 - 0.1 - Total Current Available Liquidity 22.0 $ 13.3 $ 22.1 $ 9.3 $ Whole Loan Forward Flow Agreements 1.5 - 4.5 - Total Available Liquidity 23.5 $ 13.3 $ 26.6 $ 9.3 $ (1) Parent defined as Ally Consolidated less Ally Bank, ResCap (not shown) and Insurance (not shown) (2) Includes overnight funds placed at Ally Bank at quarter-end (3) Includes UST, Agency debt and Agency MBS (4) Includes equal allocation of shared capacity totaling $3.0 billion in 2Q and $2.1 billion in 1Q that can be used by Ally Bank or the parent company 24
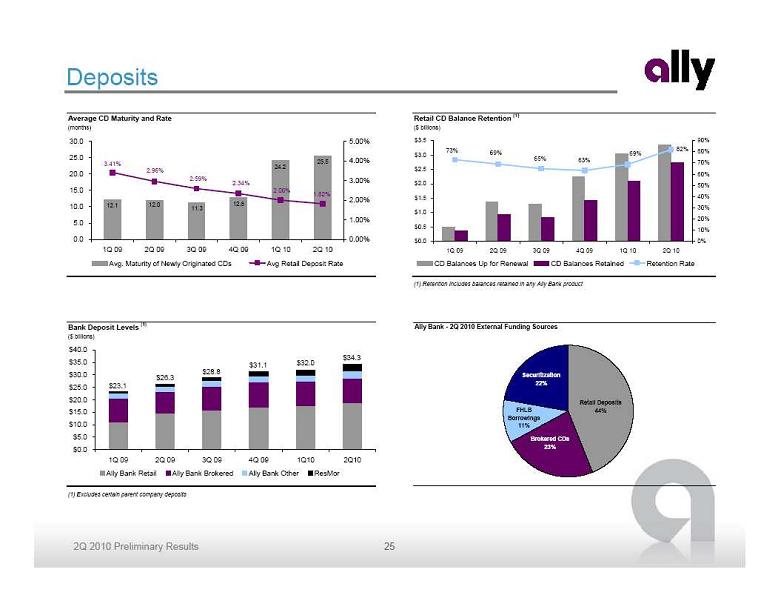 Deposits Average CD Maturity and Rate Retail CD Balance Retention (1) (months) ($ billions) (1) Retention includes balances retained in any Ally Bank product 25.5 24.2 12.8 11.3 12.0 12.1 1.82% 2.00% 2.34% 2.59% 2.96% 3.41% 0.0 5.0 10.0 15.0 20.0 25.0 30.0 1Q 09 2Q 09 3Q 09 4Q 09 1Q 10 2Q 10 0.00% 1.00% 2.00% 3.00% 4.00% 5.00% Avg. Maturity of Newly Originated CDs Avg Retail Deposit Rate 82% 73% 69% 65% 63% 69% $0.0 $0.5 $1.0 $1.5 $2.0 $2.5 $3.0 $3.5 1Q 09 2Q 09 3Q 09 4Q 09 1Q 10 2Q 10 0% 10% 20% 30% 40% 50% 60% 70% 80% 90% CD Balances Up for Renewal CD Balances Retained Retention Rate Bank Deposit Levels (1) ($ billions) (1) Excludes certain parent company deposits $34.3 $32.0 $31.1 $28.8 $26.3 $23.1 $0.0 $5.0 $10.0 $15.0 $20.0 $25.0 $30.0 $35.0 $40.0 1Q 09 2Q 09 3Q 09 4Q 09 1Q10 2Q10 Ally Bank Retail Ally Bank Brokered Ally Bank Other ResMor Ally Bank - 2Q 2010 External Funding Sources FHLB Borrowings 11% Retail Deposits 44% Brokered CDs 23% Securitization 22% 25
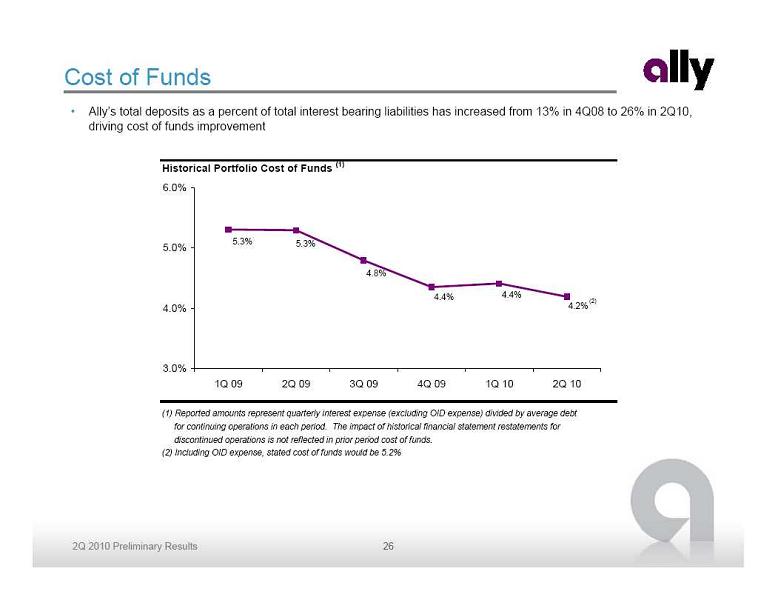 Cost of Funds Ally’s total deposits as a percent of total interest bearing liabilities has increased from 13% in 4Q08 to 26% in 2Q10,
driving cost of funds improvement Historical Portfolio Cost of Funds (1) (1) Reported amounts represent quarterly interest expense (excluding OID expense) divided by average debt for continuing operations in each period. The impact of historical financial statement restatements for discontinued operations is not reflected in prior period cost of funds. (2) Including OID expense, stated cost of funds would be 5.2% 4.2% 4.4% 4.4% 4.8% 5.3% 5.3% 3.0% 4.0% 5.0% 6.0% 1Q 09 2Q 09 3Q 09 4Q 09 1Q 10 2Q 10 Cost of Funds Cost of Funds (2) 26
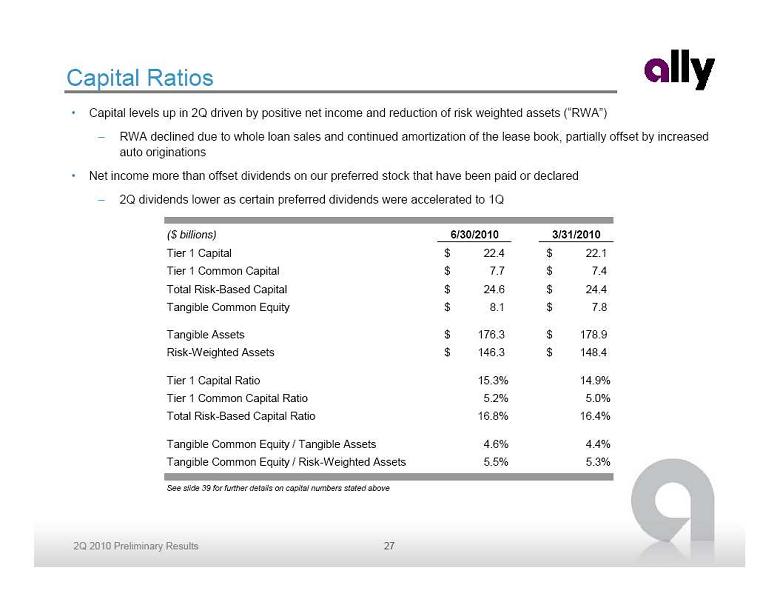 Capital Ratios See slide 39 for further details on capital numbers stated above Capital levels up in 2Q driven by positive net income and reduction of risk weighted assets (“RWA”) RWA declined due to whole loan sales and continued amortization of the lease book, partially offset by increased
auto originations Net income more than offset dividends on our preferred stock that have been paid or declared 2Q dividends lower as certain preferred dividends were accelerated to 1Q ($ billions) 6/30/2010 3/31/2010 Tier 1 Capital 22.4 $ 22.1 $ Tier 1 Common Capital 7.7 $ 7.4 $ Total Risk-Based Capital 24.6 $ 24.4 $ Tangible Common Equity 8.1 $ 7.8 $ Tangible Assets 176.3 $ 178.9 $ Risk-Weighted Assets 146.3 $ 148.4 $ Tier 1 Capital Ratio 15.3% 14.9% Tier 1 Common Capital Ratio 5.2% 5.0% Total Risk-Based Capital Ratio 16.8% 16.4% Tangible Common Equity / Tangible Assets 4.6% 4.4% Tangible Common Equity / Risk-Weighted Assets 5.5% 5.3% 27
 Summary All four operating segments were profitable, along with Ally Bank and ResCap legal entities Credit trends continued to improve Continued progress reducing legacy mortgage risk Liquidity significantly strengthened Cost of funds advantage of deposit base materializing Second Quarter Progress Continued Focus on Strategic Objectives Become the premier global auto finance provider for dealers and consumers Demonstrate consistent and diversified access to capital markets Improve our liquidity position by building stable deposit base at Ally Bank Continue to de-risk our mortgage business and define a viable long-term strategy for our mortgage origination and
servicing business Improve our cost structure and efficiency Fully transition to a bank holding company model 28
 Supplemental Charts
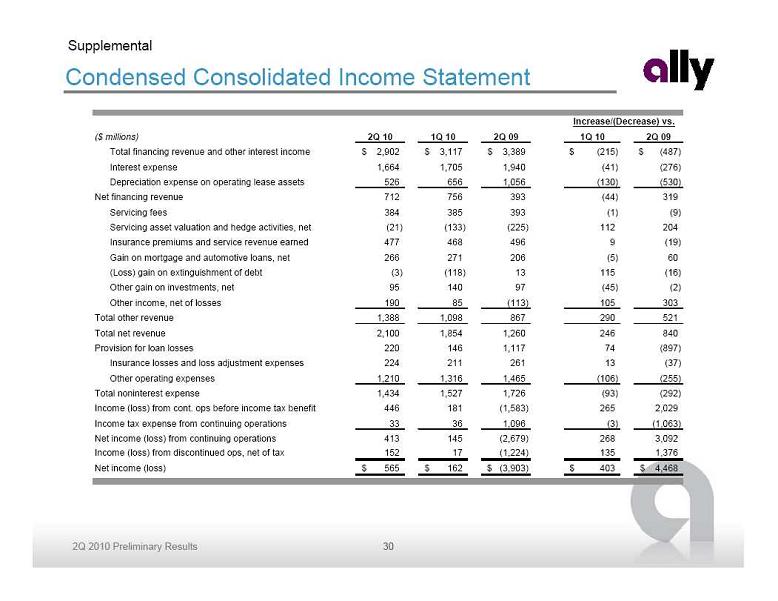 Condensed Consolidated Income Statement Supplemental ($ millions) 2Q 10 1Q 10 2Q 09 1Q 10 2Q 09 Total financing revenue and other interest income 2,902 $ 3,117 $ 3,389 $ (215) $ (487) $ Interest expense 1,664 1,705 1,940 (41) (276) Depreciation expense on operating lease assets 526 656 1,056 (130) (530) Net financing revenue 712 756 393 (44) 319 Servicing fees 384 385 393 (1) (9) Servicing asset valuation and hedge activities, net (21) (133) (225) 112 204 Insurance premiums and service revenue earned 477 468 496 9 (19) Gain on mortgage and automotive loans, net 266 271 206 (5) 60 (Loss) gain on extinguishment of debt (3) (118) 13 115 (16) Other gain on investments, net 95 140 97 (45) (2) Other income, net of losses 190 85 (113) 105 303 Total other revenue 1,388 1,098 867 290 521 Total net revenue 2,100 1,854 1,260 246 840 Provision for loan losses 220 146 1,117 74 (897) Insurance losses and loss adjustment expenses 224 211 261 13 (37) Other operating expenses 1,210 1,316 1,465 (106) (255) Total noninterest expense 1,434 1,527 1,726 (93) (292) Income (loss) from cont. ops before income tax benefit 446 181 (1,583) 265 2,029 Income tax expense from continuing operations 33 36 1,096 (3) (1,063) Net income (loss) from continuing operations 413 145 (2,679) 268 3,092 Income (loss) from discontinued ops, net of tax 152 17 (1,224) 135 1,376 Net income (loss) 565 $ 162 $ (3,903) $ 403 $ 4,468 $ Increase/(Decrease) vs. 30
 North American Auto - Condensed Income Statement Supplemental ($ millions) 2Q 10 1Q 10 2Q 09 1Q 10 2Q 09 Total financing revenue and other interest income 1,943 $ 2,095 $ 2,292 $ (152) $ (349) $ Interest expense 568 575 573 (7) (5) Depreciation expense on operating lease assets (1) 486 607 990 (121) (504) Net financing revenue 889 913 729 (24) 160 Servicing fees 55 60 58 (5) (3) Gain on automotive loans, net 66 113 46 (47) 20 Other income 65 30 34 35 31 Total other revenue 186 203 138 (17) 48 Total net revenue 1,075 1,116 867 (41) 208 Provision for loan losses 106 101 15 5 91 Noninterest expense 339 362 401 (23) (62) Income from cont. ops before income tax expense 630 653 451 (23) 179 Income tax expense from continuing operations (2) 176 257 972 (81) (796) Net income (loss) from continuing operations 454 $ 396 $ (521) $ 58 $ 975 $ Notable Items - Pre-Tax ($ millions) 2Q 10 1Q 10 2Q 09 1Q 10 2Q 09 (1) Remarketing gain (loss) 205 $ 185 $ 134 $ 20 $ 71 $ (2) Tax impact of incorporation - - (1,051) - 1,051 Increase/(Decrease) vs. Increase/(Decrease) vs. 31
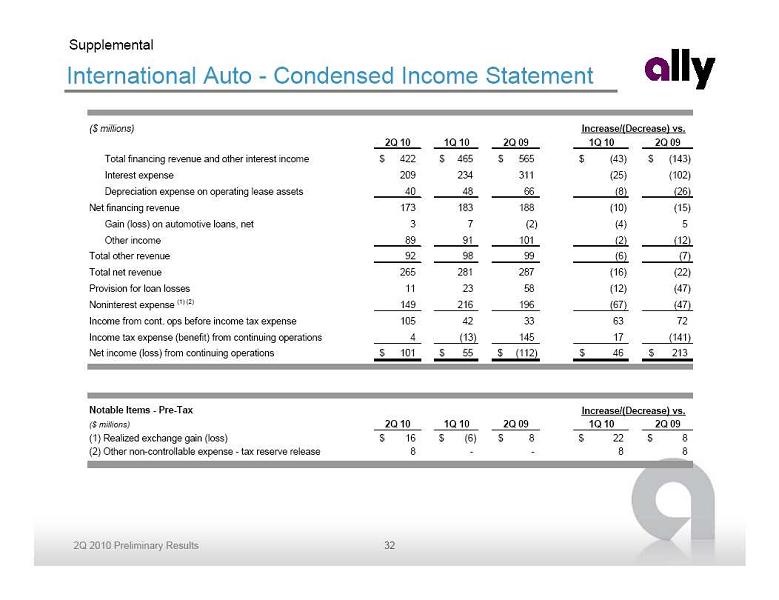 International Auto - Condensed Income Statement Supplemental ($ millions) 2Q 10 1Q 10 2Q 09 1Q 10 2Q 09 Total financing revenue and other interest income 422 $ 465 $ 565 $ (43) $ (143) $ Interest expense 209 234 311 (25) (102) Depreciation expense on operating lease assets 40 48 66 (8) (26) Net financing revenue 173 183 188 (10) (15) Gain (loss) on automotive loans, net 3 7 (2) (4) 5 Other income 89 91 101 (2) (12) Total other revenue 92 98 99 (6) (7) Total net revenue 265 281 287 (16) (22) Provision for loan losses 11 23 58 (12) (47) Noninterest expense (1) (2) 149 216 196 (67) (47) Income from cont. ops before income tax expense 105 42 33 63 72 Income tax expense (benefit) from continuing operations 4 (13) 145 17 (141) Net income (loss) from continuing operations 101 $ 55 $ (112) $ 46 $ 213 $ Notable Items - Pre-Tax ($ millions) 2Q 10 1Q 10 2Q 09 1Q 10 2Q 09 (1) Realized exchange gain (loss) 16 $ (6) $ 8 $ 22 $ 8 $ (2) Other non-controllable expense - tax reserve release 8 - - 8 8 Increase/(Decrease) vs. Increase/(Decrease) vs. 32
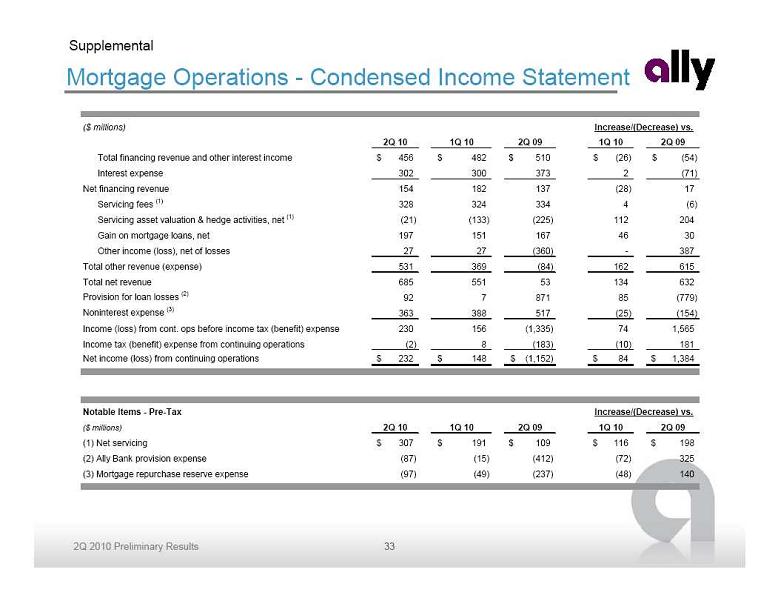 Mortgage Operations - Condensed Income Statement Supplemental ($ millions) 2Q 10 1Q 10 2Q 09 1Q 10 2Q 09 Total financing revenue and other interest income 456 $ 482 $ 510 $ (26) $ (54) $ Interest expense 302 300 373 2 (71) Net financing revenue 154 182 137 (28) 17 Servicing fees (1) 328 324 334 4 (6) Servicing asset valuation & hedge activities, net (1) (21) (133) (225) 112 204 Gain on mortgage loans, net 197 151 167 46 30 Other income (loss), net of losses 27 27 (360) - 387 Total other revenue (expense) 531 369 (84) 162 615 Total net revenue 685 551 53 134 632 Provision for loan losses (2) 92 7 871 85 (779) Noninterest expense (3) 363 388 517 (25) (154) Income (loss) from cont. ops before income tax (benefit) expense 230 156 (1,335) 74 1,565 Income tax (benefit) expense from continuing operations (2) 8 (183) (10) 181 Net income (loss) from continuing operations 232 $ 148 $ (1,152) $ 84 $ 1,384 $ Notable Items - Pre-Tax ($ millions) 2Q 10 1Q 10 2Q 09 1Q 10 2Q 09 (1) Net servicing 307 $ 191 $ 109 $ 116 $ 198 $ (2) Ally Bank provision expense (87) (15) (412) (72) 325 (3) Mortgage repurchase reserve expense (97) (49) (237) (48) 140 Increase/(Decrease) vs. Increase/(Decrease) vs. 33
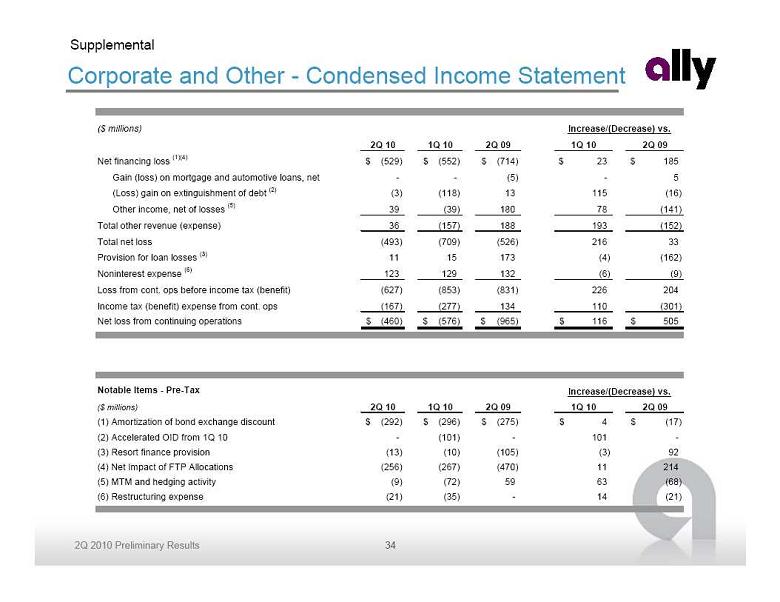 Corporate and Other - Condensed Income Statement Supplemental ($ millions) 2Q 10 1Q 10 2Q 09 1Q 10 2Q 09 Net financing loss (1)(4) (529) $ (552) $ (714) $ 23 $ 185 $ Gain (loss) on mortgage and automotive loans, net - - (5) - 5 (Loss) gain on extinguishment of debt (2) (3) (118) 13 115 (16) Other income, net of losses (5) 39 (39) 180 78 (141) Total other revenue (expense) 36 (157) 188 193 (152) Total net loss (493) (709) (526) 216 33 Provision for loan losses (3) 11 15 173 (4) (162) Noninterest expense (6) 123 129 132 (6) (9) Loss from cont. ops before income tax (benefit) (627) (853) (831) 226 204 Income tax (benefit) expense from cont. ops (167) (277) 134 110 (301) Net loss from continuing operations (460) $ (576) $ (965) $ 116 $ 505 $ Notable Items - Pre-Tax ($ millions) 2Q 10 1Q 10 2Q 09 1Q 10 2Q 09 (1) Amortization of bond exchange discount (292) $ (296) $ (275) $ 4 $ (17) $ (2) Accelerated OID from 1Q 10 - (101) - 101 - (3) Resort finance provision (13) (10) (105) (3) 92 (4) Net Impact of FTP Allocations (256) (267) (470) 11 214 (5) MTM and hedging activity (9) (72) 59 63 (68) (6) Restructuring expense (21) (35) - 14 (21) Increase/(Decrease) vs. Increase/(Decrease) vs. 34
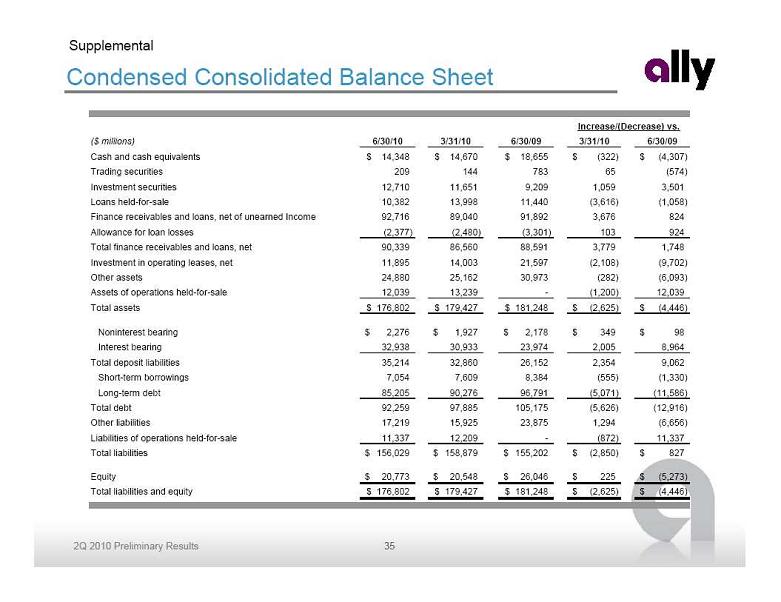 Condensed Consolidated Balance Sheet Supplemental ($ millions) 6/30/10 3/31/10 6/30/09 3/31/10 6/30/09 Cash and cash equivalents 14,348 $ 14,670 $ 18,655 $ (322) $ (4,307) $ Trading securities 209 144 783 65 (574) Investment securities 12,710 11,651 9,209 1,059 3,501 Loans held-for-sale 10,382 13,998 11,440 (3,616) (1,058) Finance receivables and loans, net of unearned Income 92,716 89,040 91,892 3,676 824 Allowance for loan losses (2,377) (2,480) (3,301) 103 924 Total finance receivables and loans, net 90,339 86,560 88,591 3,779 1,748 Investment in operating leases, net 11,895 14,003 21,597 (2,108) (9,702) Other assets 24,880 25,162 30,973 (282) (6,093) Assets of operations held-for-sale 12,039 13,239 - (1,200) 12,039 Total assets 176,802 $ 179,427 $ 181,248 $ (2,625) $ (4,446) $ Noninterest bearing 2,276 $ 1,927 $ 2,178 $ 349 $ 98 $ Interest bearing 32,938 30,933 23,974 2,005 8,964 Total deposit liabilities 35,214 32,860 26,152 2,354 9,062 Short-term borrowings 7,054 7,609 8,384 (555) (1,330) Long-term debt 85,205 90,276 96,791 (5,071) (11,586) Total debt 92,259 97,885 105,175 (5,626) (12,916) Other liabilities 17,219 15,925 23,875 1,294 (6,656) Liabilities of operations held-for-sale 11,337 12,209 - (872) 11,337 Total liabilities 156,029 $ 158,879 $ 155,202 $ (2,850) $ 827 $ Equity 20,773 $ 20,548 $ 26,046 $ 225 $ (5,273) $ Total liabilities and equity 176,802 $ 179,427 $ 181,248 $ (2,625) $ (4,446) $ Increase/(Decrease) vs. 35
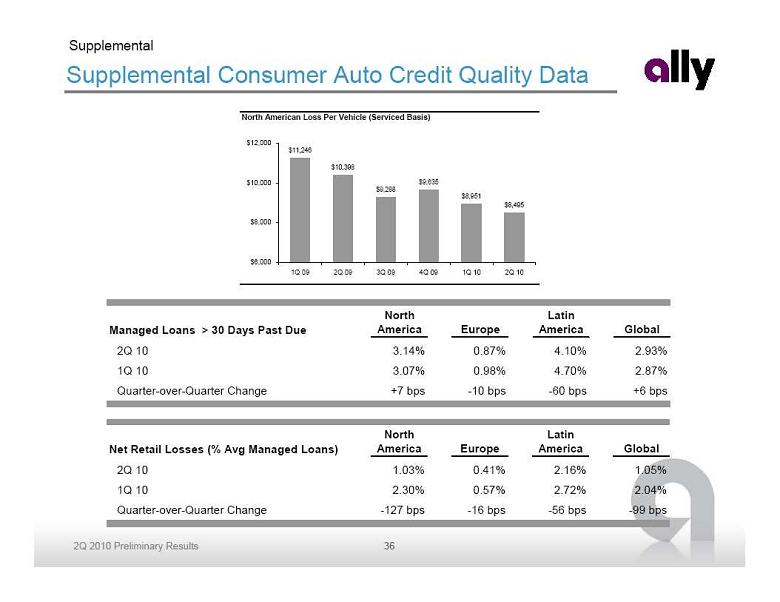 Supplemental Consumer Auto Credit Quality Data Supplemental North American Loss Per Vehicle (Serviced Basis) $11,246 $10,398 $9,288 $9,635 $8,951 $8,495 $6,000 $8,000 $10,000 $12,000 1Q 09 2Q 09 3Q 09 4Q 09 1Q 10 2Q 10 Managed Loans > 30 Days Past Due North America Europe Latin America Global 2Q 10 3.14% 0.87% 4.10% 2.93% 1Q 10 3.07% 0.98% 4.70% 2.87% Quarter-over-Quarter Change +7 bps -10 bps -60 bps +6 bps Net Retail Losses (% Avg Managed Loans) North America Europe Latin America Global 2Q 10 1.03% 0.41% 2.16% 1.05% 1Q 10 2.30% 0.57% 2.72% 2.04% Quarter-over-Quarter Change -127 bps -16 bps -56 bps -99 bps 36
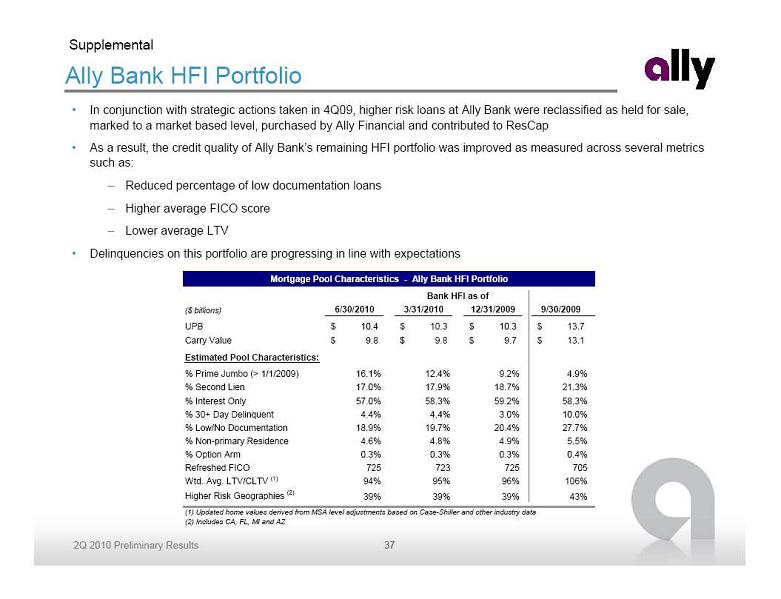 Ally Bank HFI Portfolio In conjunction with strategic actions taken in 4Q09, higher risk loans at Ally Bank were reclassified as held for sale,
marked to a market based level, purchased by Ally Financial and contributed to ResCap As a result, the credit quality of Ally Bank’s remaining HFI portfolio was improved as measured across several metrics
such as: Reduced percentage of low documentation loans Higher average FICO score Lower average LTV Delinquencies on this portfolio are progressing in line with expectations Supplemental ($ billions) 6/30/2010 3/31/2010 12/31/2009 9/30/2009 UPB 10.4 $ 10.3 $ 10.3 $ 13.7 $ Carry Value 9.8 $ 9.8 $ 9.7 $ 13.1 $ Estimated Pool Characteristics: % Prime Jumbo (> 1/1/2009) 16.1% 12.4% 9.2% 4.9% % Second Lien 17.0% 17.9% 18.7% 21.3% % Interest Only 57.0% 58.3% 59.2% 58.3% % 30+ Day Delinquent 4.4% 4.4% 3.0% 10.0% % Low/No Documentation 18.9% 19.7% 20.4% 27.7% % Non-primary Residence 4.6% 4.8% 4.9% 5.5% % Option Arm 0.3% 0.3% 0.3% 0.4% Refreshed FICO 725 723 725 705 Wtd. Avg. LTV/CLTV (1) 94% 95% 96% 106% Higher Risk Geographies (2) 39% 39% 39% 43% (1) Updated home values derived from MSA level adjustments based on Case-Shiller and other industry data (2) Includes CA, FL, MI and AZ Mortgage Pool Characteristics - Ally Bank HFI Portfolio Bank HFI as of 37
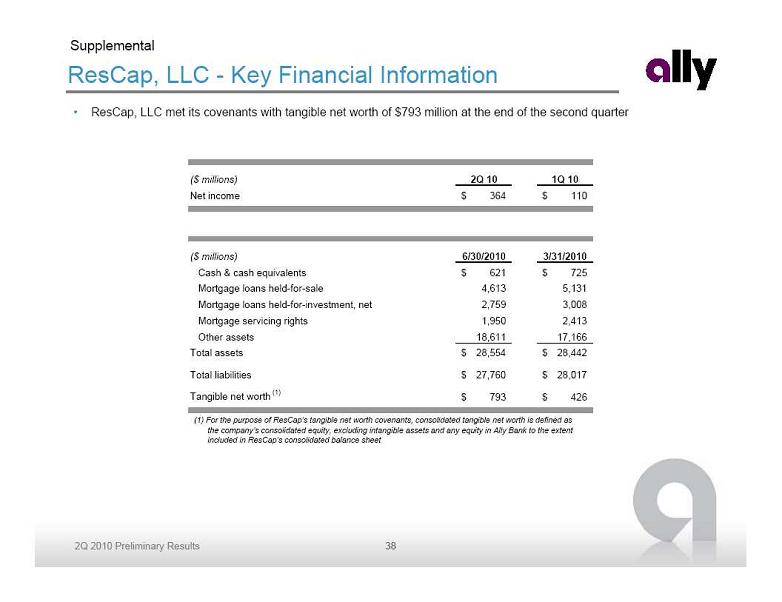 ResCap, LLC - Key Financial Information ResCap, LLC met its covenants with tangible net worth of $793 million at the end of the second quarter (1) For the purpose of ResCap’s tangible net worth covenants, consolidated tangible net worth is defined as
the company’s consolidated equity, excluding intangible assets and any equity in Ally Bank to the extent
included in ResCap’s consolidated balance sheet Supplemental ($ millions) 2Q 10 1Q 10 Net income 364 $ 110 $ ($ millions) 6/30/2010 3/31/2010 Cash & cash equivalents 621 $ 725 $ Mortgage loans held-for-sale 4,613 5,131 Mortgage loans held-for-investment, net 2,759 3,008 Mortgage servicing rights 1,950 2,413 Other assets 18,611 17,166 Total assets 28,554 $ 28,442 $ Total liabilities 27,760 $ 28,017 $ Tangible net worth (1) 793 $ 426 $ 38
 Capital Measures Supplemental Capital 6/30/2010 3/31/2010 Shareholders’ Equity 20.8 $ 20.5 $ Less: Goodwill and certain other intangibles (0.5) (0.5) Unrealized (gain) loss and other adjustments (0.4) (0.5) Add: Trust Preferred Securities 2.5 2.5 Total Tier 1 Capital 22.4 22.1 Total Tier 1 Capital 22.4 22.1 Less: Preferred Securities (12.2) (12.2) Trust Preferred Securities (2.5) (2.5) Total Tier 1 Common Capital 7.7 7.4 Total Tier 1 Capital 22.4 22.1 Add: Qualifying subordinated debt and redeemable preferred stock 0.2 0.2 Allowance for loan and lease losses includible in Tier 2 Capital 2.0 2.1 Total Risk-Based Capital 24.6 24.4 Total Equity 20.8 20.5 Less: Preferred equity (12.2) (12.2) Goodwill and intangible assets (0.5) (0.5) Tangible Common Equity 8.1 7.8 Total Assets 176.8 179.4 Less: Goodwill and intangible assets (0.5) (0.5) Tangible Assets 176.3 $ 178.9 $ Note: Numbers may not foot due to rounding ($ billions) 39
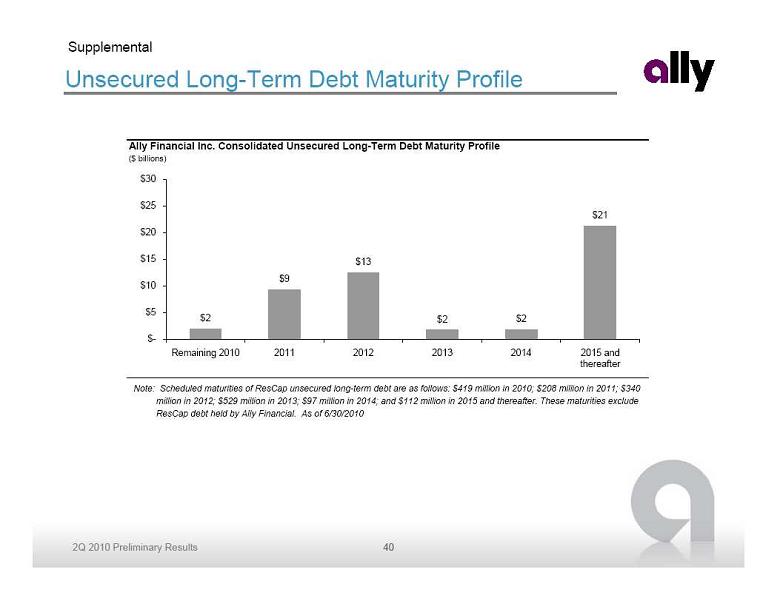 Unsecured Long-Term Debt Maturity Profile Note: Scheduled maturities of ResCap unsecured long-term debt are as follows: $419 million in 2010; $208 million in 2011; $340
million in 2012; $529 million in 2013; $97 million in 2014; and $112 million in 2015 and thereafter. These maturities exclude
ResCap debt held by Ally Financial. As of 6/30/2010 Supplemental Ally Financial Inc. Consolidated Unsecured Long-Term Debt Maturity Profile ($ billions) $2 $9 $13 $2 $2 $21 $- $5 $10 $15 $20 $25 $30 Remaining 2010 2011 2012 2013 2014 2015 and thereafter 40
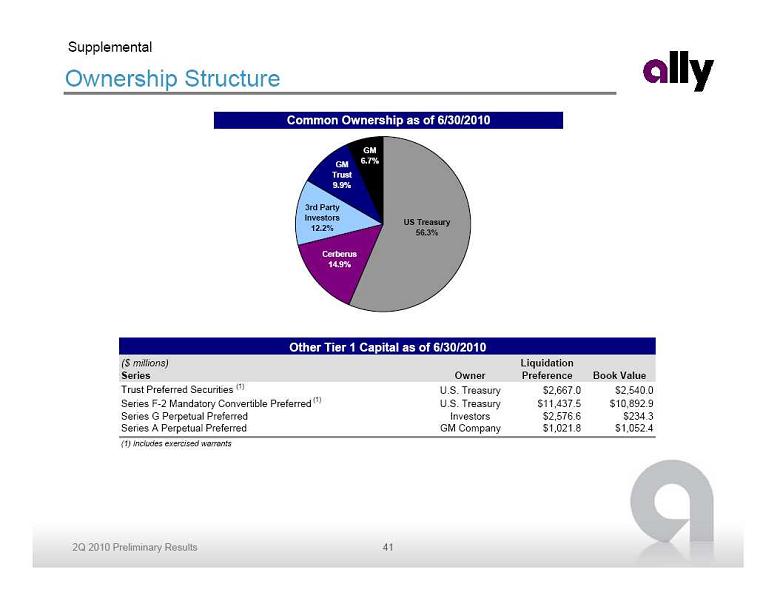 Ownership Structure Supplemental Common Ownership as of 6/30/2010 GM 6.7% GM Trust 9.9% 3rd Party Investors 12.2% Cerberus 14.9% US Treasury 56.3% ($ millions) Series Owner Liquidation Preference Book Value Trust Preferred Securities (1) U.S. Treasury $2,667.0 $2,540.0 Series F-2 Mandatory Convertible Preferred (1) U.S. Treasury $11,437.5 $10,892.9 Series G Perpetual Preferred Investors $2,576.6 $234.3 Series A Perpetual Preferred GM Company $1,021.8 $1,052.4 (1) Includes exercised warrants Other Tier 1 Capital as of 6/30/2010 41