Ally Financial Inc. 4Q and Full Year 2010 Earnings Review February 1, 2011 Contact Ally Investor Relations at (866) 710-4623 or investor .relations@ally ..com
Forward - -Looking Statements and Additional Information The following should be read in conjunction with the financial statements, notes and other information contained in the Company’s 2009 Annual Report on Form 10-K, Quarterly Reports on Form 10-Q, and Current Reports on Form 8-K. This information is preliminary and based on company data available at the time of the presentation In the presentation that follows and related comments by Ally Financial Inc. (“Ally”) management, the use of the words “expect,” “anticipate,” “estimate,” “forecast,” “initiative,” “objective,” “plan,” “goal,” “project,” “outlook,” “priorities,” “target,” “intend,” “evaluate,” “pursue,” “seek,” “may,” “would,” “could,” “should,” “believe,” “potential,” “continue,” or similar expressions is intended to identify forward -looking statements . All statements herein and in related management comments, other than statements of historical fact, including without limitation, statements about future events and financial performance, are forward -looking statements that involve certain risks and uncertainties . While these statements represent our current judgment on what the future may hold, and we believe these judgments are reasonable, these statements are not guarantees of any events or financial results, and Ally’s actual results may differ materially due to numerous important factors that are described in the most recent reports on SEC Forms 10-K and 10-Q for Ally, each of which may be revised or supplemented in subsequent reports on SEC Forms 10-Q and 8-K. Such factors include, among others, the following: our inability to repay our outstanding obligations to the U.S. Department of the Treasury, or to do so in a timely fashion and without disruption to our business or increase cost to Ally; uncertainty related to Chrysler’s and GM’s recent exits from bankruptcy; securing low cost funding for Ally and Residential Capital, LLC (“ResCap”) and maintaining the mutually beneficial relationship between Ally and GM, and Ally and Chrysler; our ability to maintain an appropriate level of debt and capital; the profitability and financial condition of GM and Chrysler; our ability to realize the anticipated benefits associated with our conversion to a bank holding company, and the increased regulation and restrictions that we are now subject to; continued challenges in the residential mortgage and capital markets; the potential for deterioration in the residual value of off-lease vehicles; the continuing negative impact on ResCap of the decline in the U.S. housing market; any impact resulting from delayed foreclosure sales or related matters; the potential for legal liability resulting from claims related to the sale of private label mortgage -backed securities; changes in U.S. government - -sponsored mortgage programs or disruptions in the markets in which our mortgage subsidiaries operate; disruptions in the market in which we fund Ally’s and ResCap’s operations, with resulting negative impact on our liquidity; changes in our accounting assumptions that may require or that result from changes in the accounting rules or their application, which could result in an impact on earnings; changes in the credit ratings of ResCap, Ally, Chrysler or GM; changes in economic conditions, interest rates, currency exchange rates or political stability in the markets in which we operate; and changes in the existing or the adoption of new laws, regulations, policies or other activities of governments, agencies and similar organizations (including as a result of the recently enacted financial regulatory reform bill). Investors are cautioned not to place undue reliance on forward -looking statements . Ally undertakes no obligation to update publicly or otherwise revise any forward -looking statements except where expressly required by law. Reconciliation of non-GAAP financial measures included within this presentation are provided in this presentation . Use of the term “loans” describes products associated with direct and indirect lending activities of Ally’s global operations . The specific products include retail installment sales contracts, loans, lines of credit, leases or other financing products . The term “originate” refers to Ally’s purchase, acquisition or direct origination of various “loan” products.
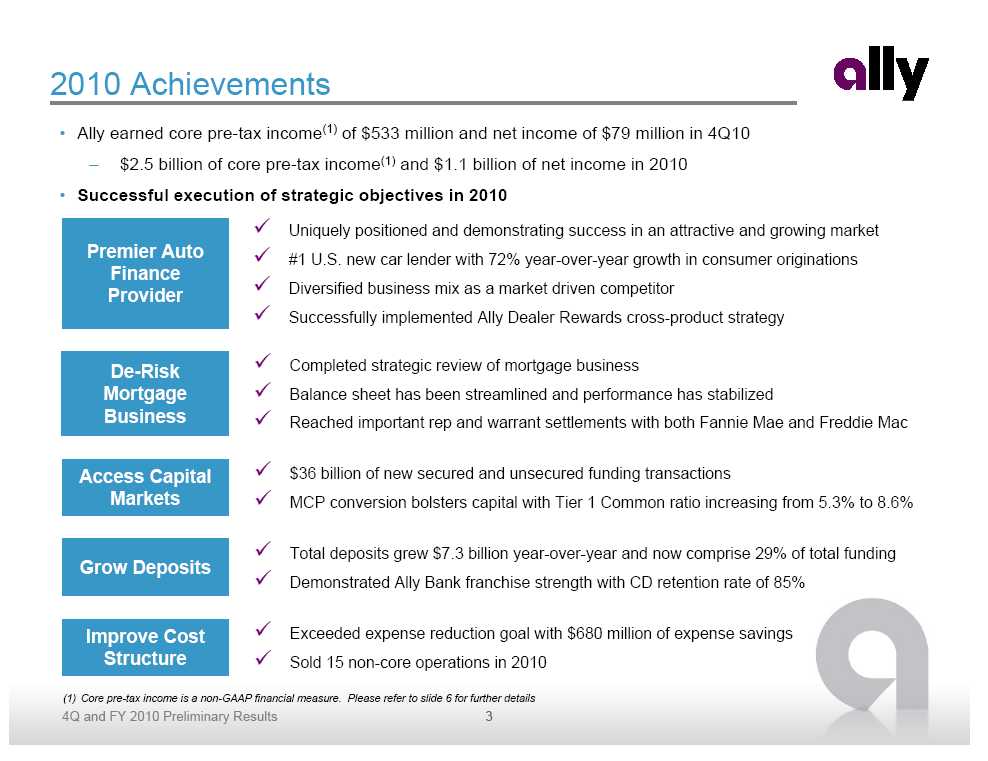
2010 Achievements • Ally earned core pre-tax income (1) of $533 million and net income of $79 million in 4Q10 – $2.5 billion of core pre-tax income (1) and $1.1 billion of net income in 2010 • Successful execution of strategic objectives in 2010 Premier Auto Finance Provider De-Risk Mortgage Business Access Capital Markets Grow Deposits Improve Cost Structure Uniquely positioned and demonstrating success in an attractive and growing market #1 U.S. new car lender with 72% year-over-year growth in consumer originations Diversified business mix as a market driven competitor Successfully implemented Ally Dealer Rewards cross-product strategy Completed strategic review of mortgage business Balance sheet has been streamlined and performance has stabilized Reached important rep and warrant settlements with both Fannie Mae and Freddie Mac $36 billion of new secured and unsecured funding transactions MCP conversion bolsters capital with Tier 1 Common ratio increasing from 5.3% to 8.6% Total deposits grew $7.3 billion year-over-year and now comprise 29% of total funding Demonstrated Ally Bank franchise strength with CD retention rate of 85% Exceeded expense reduction goal with $680 million of expense savings Sold 15 non-core operations in 2010 (1) Core pre-tax income is a non-GAAP financial measure . Please refer to slide 6 for further details
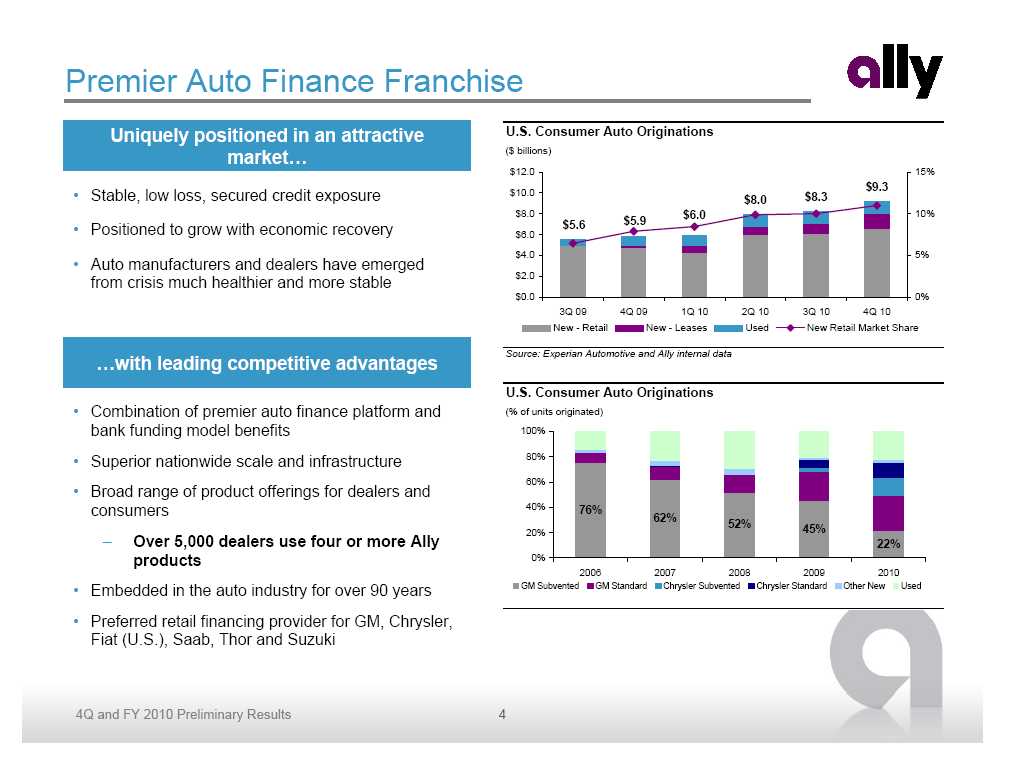
Premier Auto Finance Franchise Uniquely positioned in an attractive market … • Stable, low loss, secured credit exposure • Positioned to grow with economic recovery • Auto manufacturers and dealers have emerged from crisis much healthier and more stable with leading competitive advantages • Combination of premier auto finance platform and bank funding model benefits • Superior nationwide scale and infrastructure • Broad range of product offerings for dealers and consumers – Over 5,000 dealers use four or more Ally products • Embedded in the auto industry for over 90 years • Preferred retail financing provider for GM, Chrysler, Fiat (U.S.), Saab, Thor and Suzuki U.S. Consumer Auto Originations ($ billions) $12.0 15% $9.3 $10.0 $8.3 $8.0 $8.0 $6.0 10% $5.6 $5.9 $6.0 $4.0 5% $2.0 $0.0 0% 3Q 09 4Q 09 1Q 10 2Q 10 3Q 10 4Q 10 New - Retail New - Leases Used New Retail Market Share Source: Experian Automotive and Ally internal data U.S. Consumer Auto Originations (% of units originated) 100% 80% 60% 40% 76% 62% 52% 45% 20% 22% 0% 2006 2007 2008 2009 2010 GM Subvented GM Standard Chrysler Subvented Chrysler Standard Other New Used Trick Trick 4

MCP Conversion Represents Critical Milestone • On December 30, 2010, Ally Financial and the U.S. Treasury agreed to convert $5.5 billion of the $11.4 billion of mandatory convertible preferred (“MCP”) securities into common equity shares • This action represents a critical step along Ally’s path to full repayment of U.S. Treasury investments Improves Capital and Credit Profile Broadens Access to Ally Bank Funding Enhances Overall Enterprise Value • Improves Tier 1 Common ratio from 5.3% to 8.6% at 12/31/2010 • U.S. Treasury common equity ownership increases to 74% • Normalizes capital structure in line with investment grade banks • Resolves General Motors 23A affiliate status • Brings General Motors’ beneficial ownership to 9.9% • High quality assets will continue to be originated at Ally Bank • Reduces dividends by $500 million per year and assists with capital preservation • Improves long term profitability with lower cost of funds • Enhances the Ally value proposition for third party business counterparts
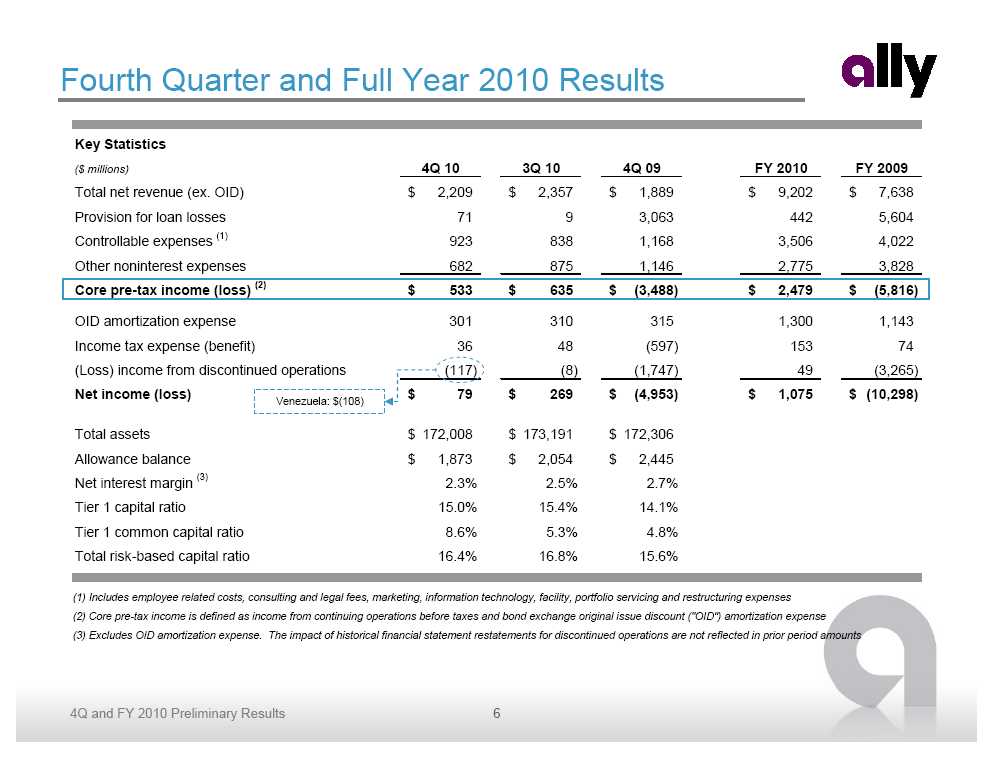
Fourth Quarter and Full Year 2010 Results Key Statistics ($ millions) 4Q 10 3Q 10 4Q 09 FY 2010 FY 2009 Total net revenue (ex. OID) $ 2,209 $ 2,357 $ 1,889 $ 9,202 $ 7,638 Provision for loan losses 71 9 3,063 442 5,604 Controllable expenses (1) 923 838 1,168 3,506 4,022 Other noninterest expenses 682 875 1,146 2,775 3,828 Core pre-tax income (loss)(2) $ 533 $ 635 $ (3,488) $ 2,479 $ (5,816) OID amortization expense 301 310 315 1,300 1,143 Income tax expense (benefit) 36 48 (597) 153 74 (Loss) income from discontinued operations (117) (8) (1,747) 49 (3,265) Net income (loss) Venezuela: $(108) $ 79 $ 269 $ (4,953) $ 1,075 $ (10,298) Total assets $ 172,008 $ 173,191 $ 172,306 Allowance balance $ 1,873 $ 2,054 $ 2,445 Net interest margin (3) 2.3% 2.5% 2.7% Tier 1 capital ratio 15.0% 15.4% 14.1% Tier 1 common capital ratio 8.6% 5.3% 4.8% Total risk-based capital ratio 16.4% 16.8% 15.6% (1) Includes employee related costs, consulting and legal fees, marketing, information technology, facility, portfolio servicing and restructuring expenses (2) Core pre-tax income is defined as income from continuing operations before taxes and bond exchange original issue discount ("OID") amortization expense (3) Excludes OID amortization expense . The impact of historical financial statement restatements for discontinued operations are not reflected in prior period amounts
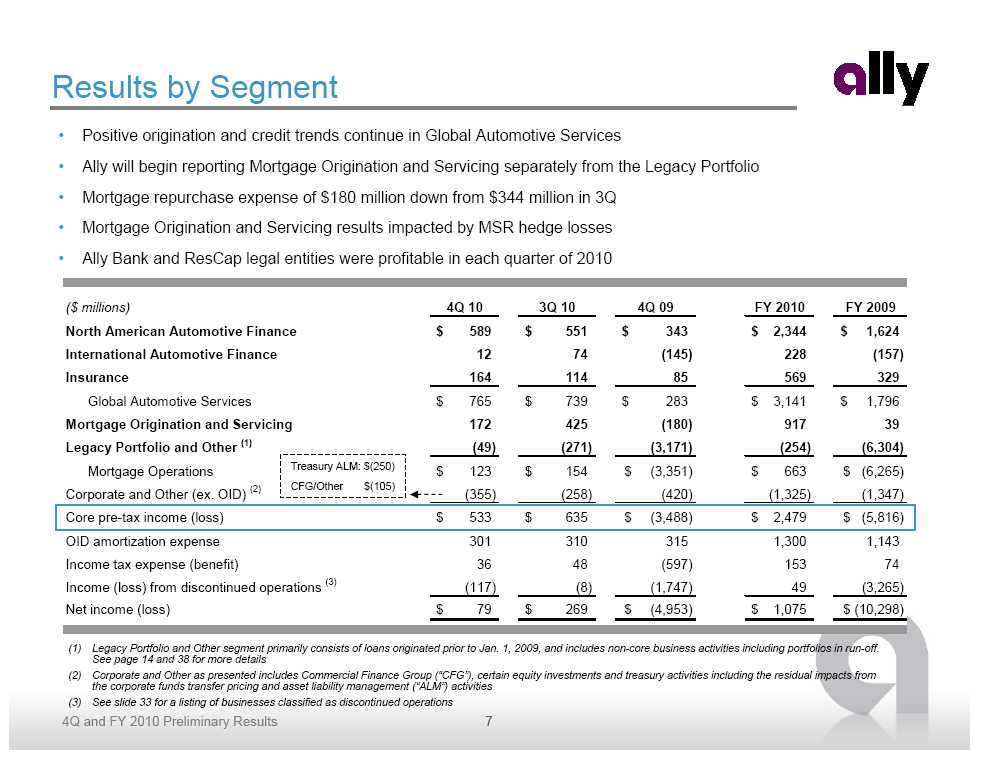
Results by Segment • Positive origination and credit trends continue in Global Automotive Services • Ally will begin reporting Mortgage Origination and Servicing separately from the Legacy Portfolio • Mortgage repurchase expense of $180 million down from $344 million in 3Q • Mortgage Origination and Servicing results impacted by MSR hedge losses • Ally Bank and ResCap legal entities were profitable in each quarter of 2010 ($ millions) 4Q 10 3Q 10 4Q 09 FY 2010 FY 2009 North American Automotive Finance $ 589 $ 551 $ 343 $ 2,344 $ 1,624 International Automotive Finance 12 74 (145) 228 (157) Insurance 164 114 85 569 329 Global Automotive Services $ 765 $ 739 $ 283 $ 3,141 $ 1,796 Mortgage Origination and Servicing 172 425 (180) 917 39 Legacy Portfolio and Other (1) (49) (271) (3,171) (254) (6,304) Mortgage Operations Treasury ALM: $(250) $ 123 $ 154 $ (3,351) $ 663 $ (6,265) CFG/Other $(105) Corporate and Other (ex. OID) (2) (355) (258) (420) (1,325) (1,347) Core pre-tax income (loss) $ 533 $ 635 $ (3,488) $ 2,479 $ (5,816) OID amortization expense 301 310 315 1,300 1,143 Income tax expense (benefit) 36 48 (597) 153 74 Income (loss) from discontinued operations (3) (117) (8) (1,747) 49 (3,265) Net income (loss) $ 79 $ 269 $ (4,953) $ 1,075 $ (10,298) (1) Legacy Portfolio and Other segment primarily consists of loans originated prior to Jan. 1, 2009, and includes non-core business activities including portfolios in run-off. See page 14 and 38 for more details (2) Corporate and Other as presented includes Commercial Finance Group (“CFG”), certain equity investments and treasury activities including the residual impacts from the corporate funds transfer pricing and asset liability management (“ALM”) activities (3) See slide 33 for a listing of businesses classified as discontinued operations
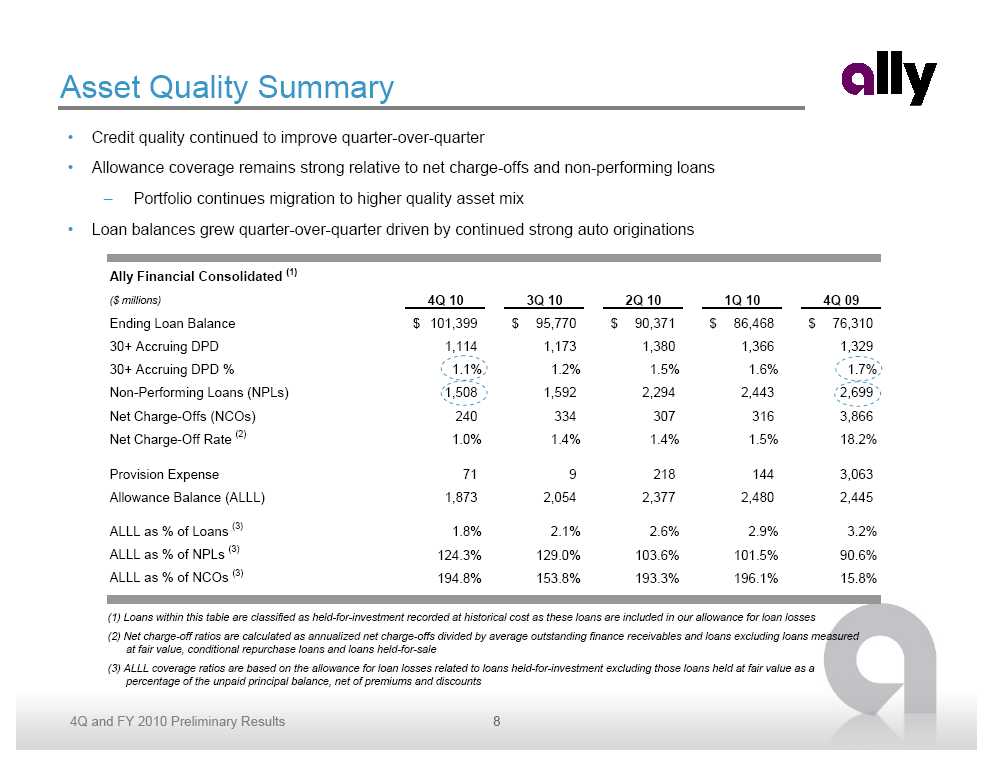
Asset Quality Summary • Credit quality continued to improve quarter -over-quarter • Allowance coverage remains strong relative to net charge -offs and non-performing loans – Portfolio continues migration to higher quality asset mix • Loan balances grew quarter -over-quarter driven by continued strong auto originations Ally Financial Consolidated (1) ($ millions) 4Q 10 3Q 10 2Q 10 1Q 10 4Q 09 Ending Loan Balance $ 101,399 $ 95,770 $ 90,371 $ 86,468 $ 76,310 30+ Accruing DPD 1,114 1,173 1,380 1,366 1,329 30+ Accruing DPD % 1.1% 1.2% 1.5% 1.6% 1.7% Non-Performing Loans (NPLs) 1,508 1,592 2,294 2,443 2,699 Net Charge - -Offs (NCOs) 240 334 307 316 3,866 Net Charge -Off Rate (2) 1.0% 1.4% 1.4% 1.5% 18.2% Provision Expense 71 9 218 144 3,063 Allowance Balance (ALLL) 1,873 2,054 2,377 2,480 2,445 ALLL as % of Loans (3) 1.8% 2.1% 2.6% 2.9% 3.2% ALLL as % of NPLs (3) 124.3% 129.0% 103.6% 101.5% 90.6% ALLL as % of NCOs (3) 194.8% 153.8% 193.3% 196.1% 15.8% (1) Loans within this table are classified as held-for-investment recorded at historical cost as these loans are included in our allowance for loan losses (2) Net charge -off ratios are calculated as annualized net charge -offs divided by average outstanding finance receivables and loans excluding loans measured at fair value, conditional repurchase loans and loans held-for-sale (3) ALLL coverage ratios are based on the allowance for loan losses related to loans held-for-investment excluding those loans held at fair value as a percentage of the unpaid principal balance, net of premiums and discounts
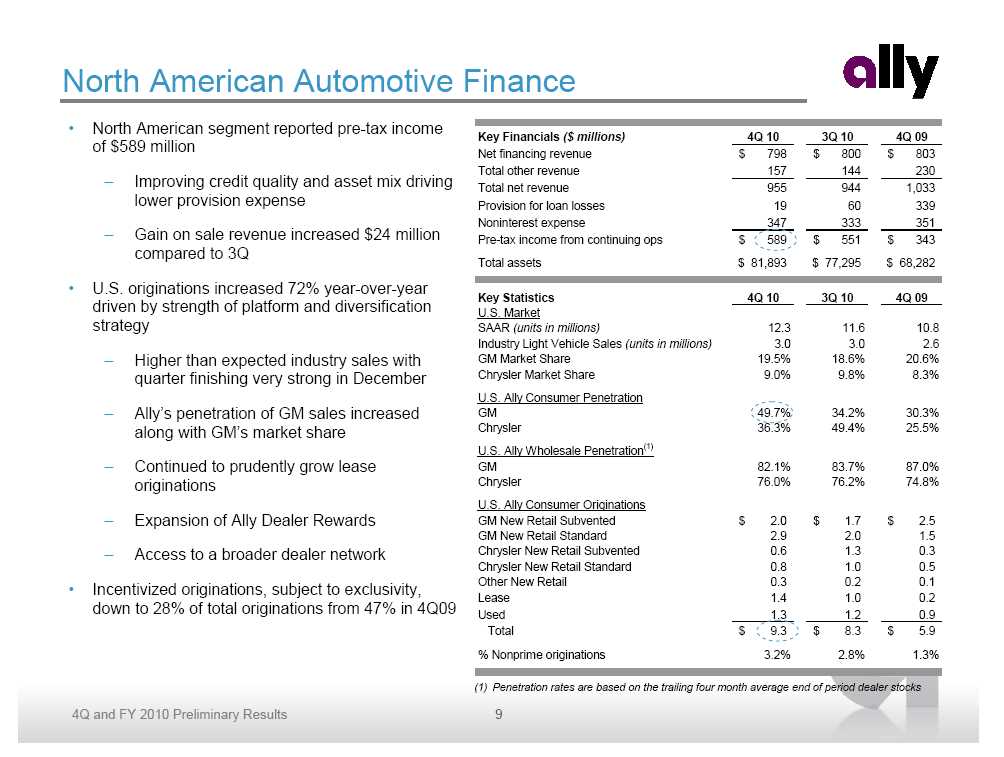
North American Automotive Finance • North American segment reported pre-tax income of $589 million – Improving credit quality and asset mix driving lower provision expense – Gain on sale revenue increased $24 million compared to 3Q • U.S. originations increased 72% year-over-year driven by strength of platform and diversification strategy – Higher than expected industry sales with quarter finishing very strong in December – Ally’s penetration of GM sales increased along with GM’s market share – Continued to prudently grow lease originations – Expansion of Ally Dealer Rewards – Access to a broader dealer network • Incentivized originations, subject to exclusivity, down to 28% of total originations from 47% in 4Q09 Key Financials ($ millions) 4Q 10 3Q 10 4Q 09 Net financing revenue $ 798 $ 800 $ 803 Total other revenue 157 144 230 Total net revenue 955 944 1,033 Provision for loan losses 19 60 339 Noninterest expense 347 333 351 Pre-tax income from continuing ops $ 589 $ 551 $ 343 Total assets $ 81,893 $ 77,295 $ 68,282 Key Statistics 4Q 10 3Q 10 4Q 09 U.S. Market SAAR (units in millions) 12.3 11.6 10.8 Industry Light Vehicle Sales(units in millions) 3.0 3.0 2.6 GM Market Share 19.5% 18.6% 20.6% Chrysler Market Share 9.0% 9.8% 8.3% U.S. Ally Consumer Penetration GM 49.7% 34.2% 30.3% Chrysler 36.3% 49.4% 25.5% U.S. Ally Wholesale Penetration (1) GM 82.1% 83.7% 87.0% Chrysler 76.0% 76.2% 74.8% U.S. Ally Consumer Originations GM New Retail Subvented $ 2.0 $ 1.7 $ 2.5 GM New Retail Standard 2.9 2.0 1.5 Chrysler New Retail Subvented 0.6 1.3 0.3 Chrysler New Retail Standard 0.8 1.0 0.5 Other New Retail 0.3 0.2 0.1 Lease 1.4 1.0 0.2 Used 1.3 1.2 0.9 Total $ 9.3 $ 8.3 $ 5.9 % Nonprime originations 3.2% 2.8% 1.3% (1) Penetration rates are based on the trailing four month average end of period dealer stocks

International Automotive Finance • International operations earned $12 million of pre-tax income compared to $74 million in 3Q – Net revenue lower by $29 million, primarily driven by foreign exchange and one-time items from operations in wind down – 3Q provision expense includes favorable adjustment to coverage ratios reflecting positive charge -off trends • Another strong quarter of originations in key international markets – China up 97% year-over-year – Brazil up 100% year-over-year – Mexico up 54% year-over-year • Continued focus on streamlining auto business – Reclassified Venezuela auto finance to discontinued operations Key Financials ($ millions) 4Q 10 3Q 10 4Q 09 Net financing revenue $ 158 $ 174 $ 213 Total other revenue 63 76 37 Total net revenue 221 250 250 Provision for loan losses 29 (5) 91 Noninterest expense 180 181 304 Pre-tax income (loss) from continuing ops $ 12 $ 74 $ (145) Total assets $ 15,979 $ 17,500 $ 21,802 Consumer Originations ($ millions) 4Q 10 3Q 10 4Q 09 Germany $ 326 $ 277 $ 306 Brazil 599 488 300 U.K. 195 210 131 Mexico 169 118 110 China (1) 944 679 480 Other 255 225 229 Total Continuing International Operations $ 2,488 $ 1,997 $ 1,557 (1) Originations in China part of a joint-venture in which Ally owns a minority interest
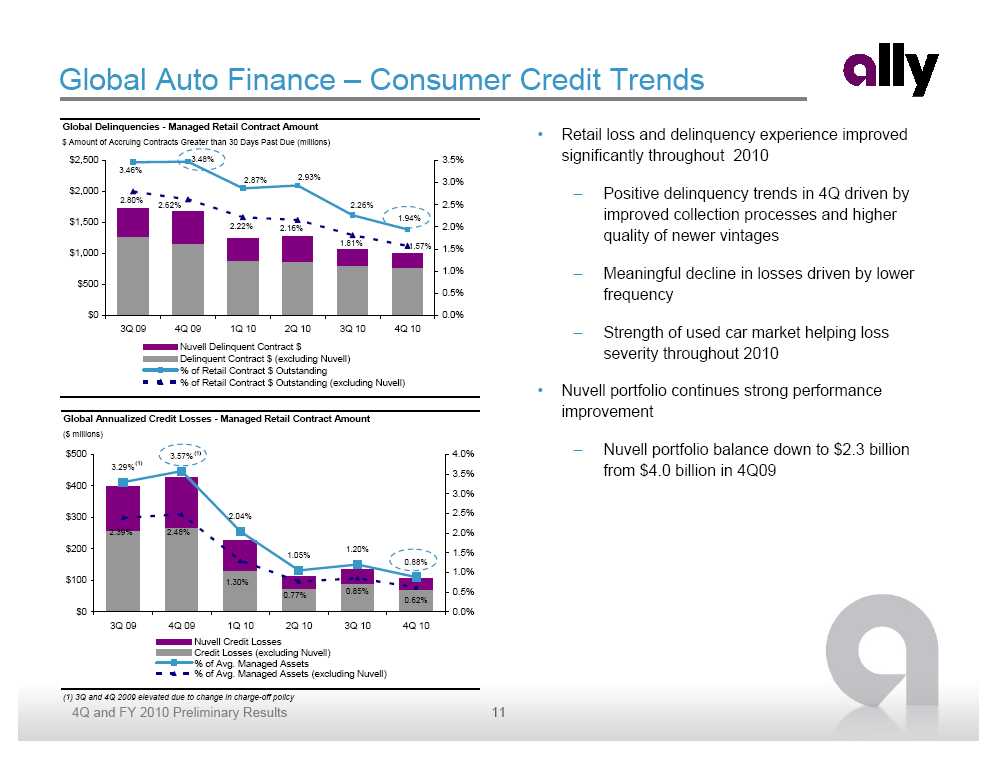
Global Auto Finance – Consumer Credit Trends Global Delinquencies - Managed Retail Contract Amount • Retail loss and delinquency experience improved $ Amount of Accruing Contracts Greater than 30 Days Past Due (millions) $2,500 3.48% 3.5% significantly throughout 2010 3.46% 2.87% 2.93% 3.0% $2,000 – Positive delinquency trends in 4Q driven by 2.80% 2.62% 2.26% 2.5% 1.94% improved collection processes and higher $1,500 2.22% 2.16% 2.0% quality of newer vintages 1.81% 1.57% 1.5% $1,000 1.0% – Meaningful decline in losses driven by lower $500 0.5% frequency $0 0.0% 3Q 09 4Q 09 1Q 10 2Q 10 3Q 10 4Q 10 – Strength of used car market helping loss Nuvell Delinquent Contract $ severity throughout 2010 Delinquent Contract $ (excluding Nuvell) % of Retail Contract $ Outstanding % of Retail Contract $ Outstanding (excluding Nuvell) • Nuvell portfolio continues strong performance improvement Global Annualized Credit Losses - Managed Retail Contract Amount ($ millions) $500 (1) 4.0% – Nuvell portfolio balance down to $2.3 billion 3.57% (1) 3.29% from $4.0 billion in 4Q09 3.5% $400 3.0% $300 2.04% 2.5% 2.39% 2.48% 2.0% $200 1.20% 1.5% 1.05% 0.88% 1.0% $100 1.30% 0.85% 0.5% 0.77% 0.62% $0 0.0% 3Q 09 4Q 09 1Q 10 2Q 10 3Q 10 4Q 10 Nuvell Credit Losses Credit Losses (excluding Nuvell) % of Avg. Managed Assets % of Avg. Managed Assets (excluding Nuvell) (1) 3Q and 4Q 2009 elevated due to change in charge -off policy
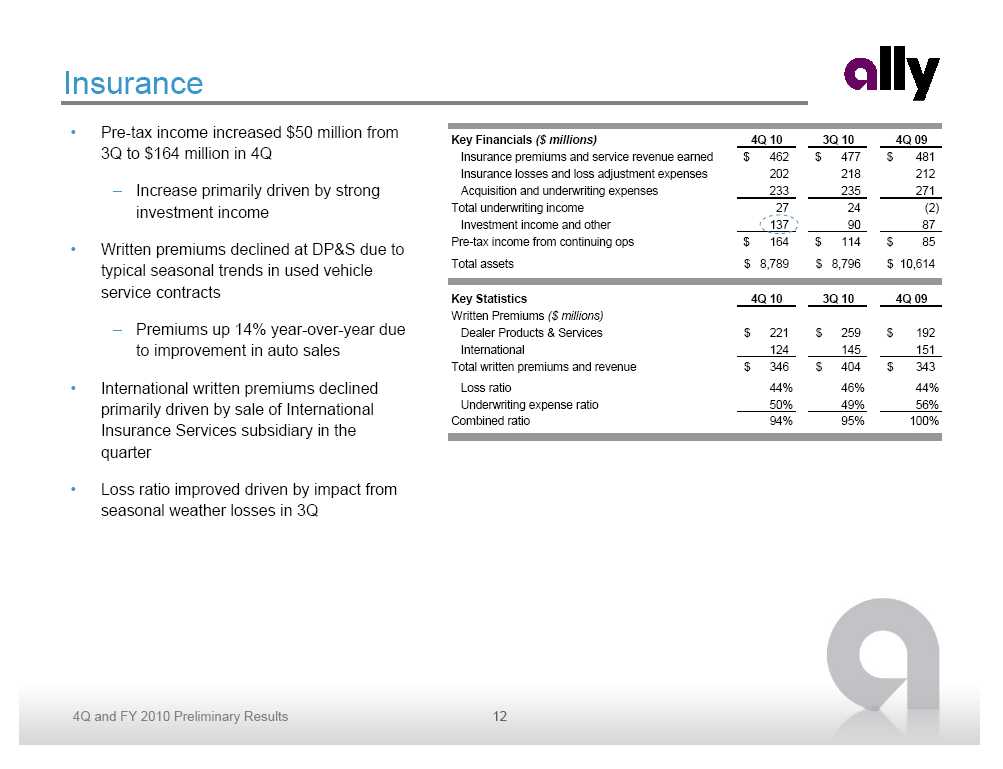
Insurance • Pre-tax income increased $50 million from 3Q to $164 million in 4Q – Increase primarily driven by strong investment income • Written premiums declined at DP&S due to typical seasonal trends in used vehicle service contracts – Premiums up 14% year-over-year due to improvement in auto sales • International written premiums declined primarily driven by sale of International Insurance Services subsidiary in the quarter • Loss ratio improved driven by impact from seasonal weather losses in 3Q Key Financials ($ millions) 4Q 10 3Q 10 4Q 09 Insurance premiums and service revenue earned $ 462 $ 477 $ 481 Insurance losses and loss adjustment expenses 202 218 212 Acquisition and underwriting expenses 233 235 271 Total underwriting income 27 24 (2) Investment income and other 137 90 87 Pre-tax income from continuing ops $ 164 $ 114 $ 85 Total assets $ 8,789 $ 8,796 $ 10,614 Key Statistics 4Q 10 3Q 10 4Q 09 Written Premiums ($ millions) Dealer Products & Services $ 221 $ 259 $ 192 International 124 145 151 Total written premiums and revenue $ 346 $ 404 $ 343 Loss ratio 44% 46% 44% Underwriting expense ratio 50% 49% 56% Combined ratio 94% 95% 100%
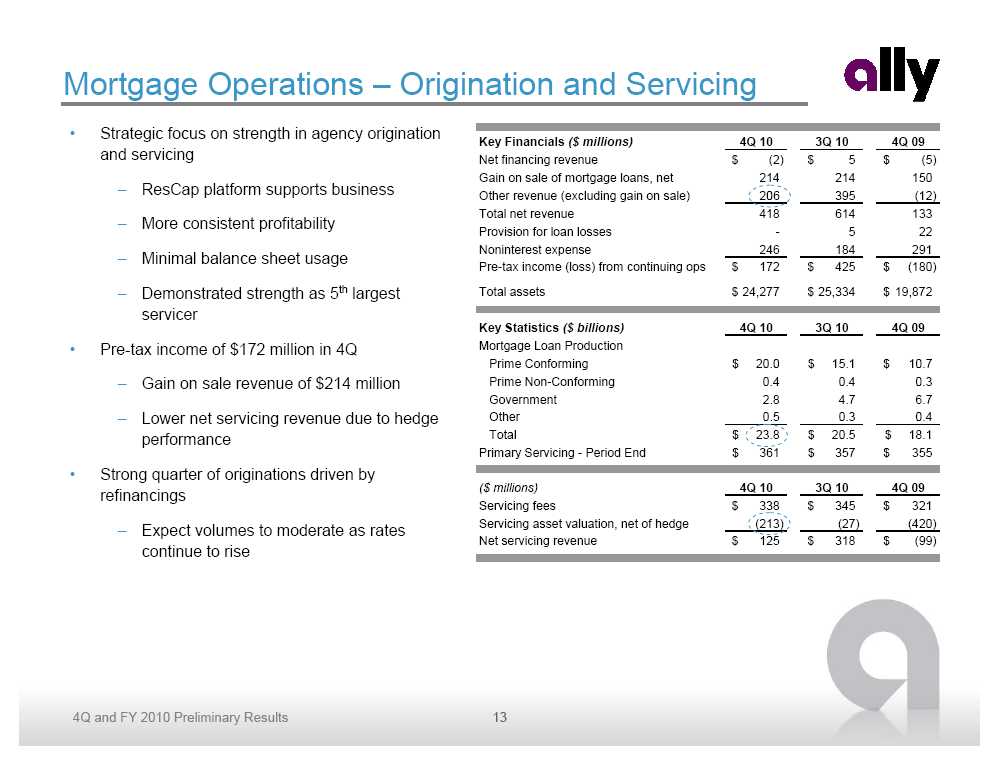
Mortgage Operations – Origination and Servicing • Strategic focus on strength in agency origination and servicing – ResCap platform supports business – More consistent profitability – Minimal balance sheet usage – Demonstrated strength as 5th largest servicer • Pre-tax income of $172 million in 4Q – Gain on sale revenue of $214 million – Lower net servicing revenue due to hedge performance • Strong quarter of originations driven by refinancings – Expect volumes to moderate as rates continue to rise Key Financials ($ millions) 4Q 10 3Q 10 4Q 09 Net financing revenue $ (2) $ 5 $ (5) Gain on sale of mortgage loans, net 214 214 150 Other revenue (excluding gain on sale) 206 395 (12) Total net revenue 418 614 133 Provision for loan losses - 5 22 Noninterest expense 246 184 291 Pre-tax income (loss) from continuing ops $ 172 $ 425 $ (180) Total assets $ 24,277 $ 25,334 $ 19,872 Key Statistics ($ billions) 4Q 10 3Q 10 4Q 09 Mortgage Loan Production Prime Conforming $ 20.0 $ 15.1 $ 10.7 Prime Non-Conforming 0.4 0.4 0.3 Government 2.8 4.7 6.7 Other 0.5 0.3 0.4 Total $ 23.8 $ 20.5 $ 18.1 Primary Servicing - Period End $ 361 $ 357 $ 355 ($ millions) 4Q 10 3Q 10 4Q 09 Servicing fees $ 338 $ 345 $ 321 Servicing asset valuation, net of hedge (213) (27) (420) Net servicing revenue $ 125 $ 318 $ (99)
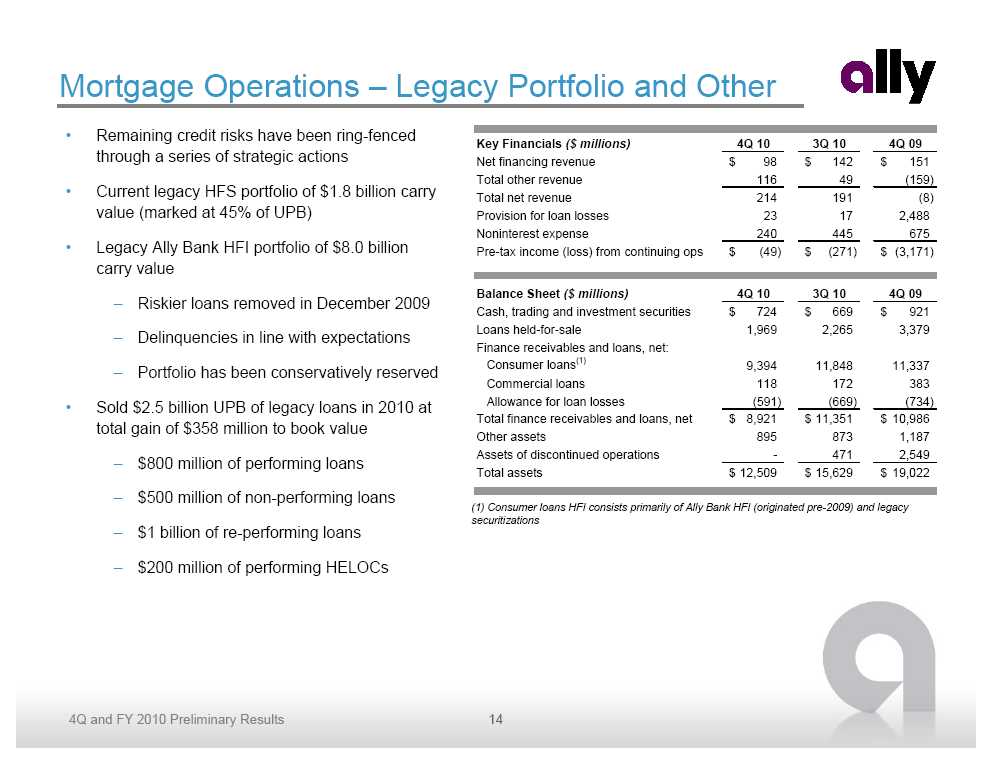
Mortgage Operations – Legacy Portfolio and Other • Remaining credit risks have been ring-fenced through a series of strategic actions • Current legacy HFS portfolio of $1.8 billion carry value (marked at 45% of UPB) • Legacy Ally Bank HFI portfolio of $8.0 billion carry value – Riskier loans removed in December 2009 – Delinquencies in line with expectations – Portfolio has been conservatively reserved • Sold $2.5 billion UPB of legacy loans in 2010 at total gain of $358 million to book value – $800 million of performing loans – $500 million of non-performing loans – $1 billion of re-performing loans – $200 million of performing HELOCs Key Financials ($ millions) 4Q 10 3Q 10 4Q 09 Net financing revenue $ 98 $ 142 $ 151 Total other revenue 116 49 (159) Total net revenue 214 191 (8) Provision for loan losses 23 17 2,488 Noninterest expense 240 445 675 Pre-tax income (loss) from continuing ops $ (49) $ (271) $ (3,171) Balance Sheet ($ millions) 4Q 10 3Q 10 4Q 09 Cash, trading and investment securities $ 724 $ 669 $ 921 Loans held-for-sale 1,969 2,265 3,379 Finance receivables and loans, net: Consumer loans(1) 9,394 11,848 11,337 Commercial loans 118 172 383 Allowance for loan losses (591) (669) (734) Total finance receivables and loans, net $ 8,921 $ 11,351 $ 10,986 Other assets 895 873 1,187 Assets of discontinued operations - 471 2,549 Total assets $ 12,509 $ 15,629 $ 19,022 (1) Consumer loans HFI consists primarily of Ally Bank HFI (originated pre-2009) and legacy securitizations
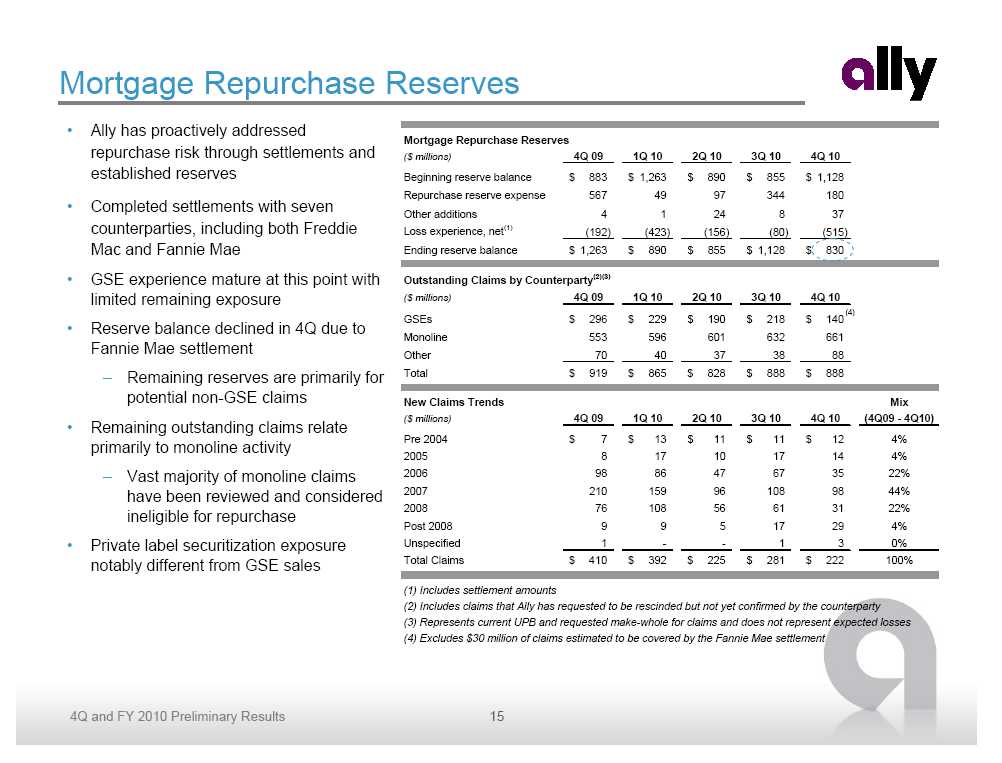
Mortgage Repurchase Reserves • Ally has proactively addressed repurchase risk through settlements and established reserves • Completed settlements with seven counterparties, including both Freddie Mac and Fannie Mae • GSE experience mature at this point with limited remaining exposure • Reserve balance declined in 4Q due to Fannie Mae settlement – Remaining reserves are primarily for potential non-GSE claims • Remaining outstanding claims relate primarily to monoline activity – Vast majority of monoline claims have been reviewed and considered ineligible for repurchase • Private label securitization exposure notably different from GSE sales Mortgage Repurchase Reserves ($ millions) 4Q 09 1Q 10 2Q 10 3Q 10 4Q 10 Beginning reserve balance $ 883 $ 1,263 $ 890 $ 855 $ 1,128 Repurchase reserve expense 567 49 97 344 180 Other additions 4 1 24 8 37 Loss experience, net (1) (192) (423) (156) (80) (515) Ending reserve balance $ 1,263 $ 890 $ 855 $ 1,128 $ 830 Outstanding Claims by Counterparty (2)(3) ($ millions) 4Q 09 1Q 10 2Q 10 3Q 10 4Q 10 (4) GSEs $ 296 $ 229 $ 190 $ 218 $ 140 Monoline 553 596 601 632 661 Other 70 40 37 38 88 Total $ 919 $ 865 $ 828 $ 888 $ 888 New Claims Trends Mix ($ millions) 4Q 09 1Q 10 2Q 10 3Q 10 4Q 10 (4Q09 - 4Q10) Pre 2004 $ 7 $ 13 $ 11 $ 11 $ 12 4% 2005 8 17 10 17 14 4% 2006 98 86 47 67 35 22% 2007 210 159 96 108 98 44% 2008 76 108 56 61 31 22% Post 2008 9 9 5 17 29 4% Unspecified 1 - - 1 3 0% Total Claims $ 410 $ 392 $ 225 $ 281 $ 222 100% (1) Includes settlement amounts (2) Includes claims that Ally has requested to be rescinded but not yet confirmed by the counterparty (3) Represents current UPB and requested make-whole for claims and does not represent expected losses (4) Excludes $30 million of claims estimated to be covered by the Fannie Mae settlement

Ally is Proactively Addressing Repurchase Risk Settlement Summary • Settlements reached with two primary mortgage counterparties in 2010, which resolve material agency repurchase risk • Freddie Mac settlement covers all ResCap serviced agency loans sold prior to January 1, 2009 • Fannie Mae settlement addresses broader scope of issues – All ResCap serviced loans sold prior to June 30, 2010 (approximately $292 billion of original UPB, $130 billion of which is from 2004-2008 vintages) – Private label MBS (“PLS”) purchased by Fannie Mae – FHFA PLS subpoena (as it relates to Fannie Mae) withdrawn • Agency settlements include existing and future origination claims in the covered population • Additionally, settled with 5 whole loan counterparties in 2009 and 2010 Agency Repurchase Loss and Settlement Experience ($ billions) Original Original UPB Total Loss as % UPB Covered Total Loss of Original UPB Covered (04 - 08 Vintages) Experience (1) (04 - 08 Vintages) $382 $191 $1.42 0.74% (1) Loss numbers include previous repurchase experience as well as full amount of settlement payments . Includes all FNMA/FHLMC repurchase related losses taken since 1/1/2008 for loans within as well as outside of the covered population

Private Label Securitizations Notable Differences from GSE Sales • Underwriting exceptions disclosed • Breach must be proven to be “material and adverse” • Representations and warranties not as comprehensive • Different fraud representation and warranty standards • Collateral segregated into different programs to highlight risks • Timeline could be lengthy • Many transactions included overcollateralization • Logistical hurdles Historical Private Label Issuance (2005-2007) Original Current ($ billions) UPB UPB Prime Jumbo (RFMSI) $ 18.8 $ 9.2 Alt-A (RALI) 60.1 28.9 Scratch and Dent and other (RAMP) 37.4 12.0 Subprime (RASC) 29.2 8.3 Second Lien (RFMSII) 0.7 0.2 Total $ 146.2 $ 58.6 Note: Excludes approximately $26 billion of monoline wrapped transactions, vast majority of which were from the RFMSII platform . Data as of December 2010 • Fannie Mae settlement covers their exposure in private label securitizations
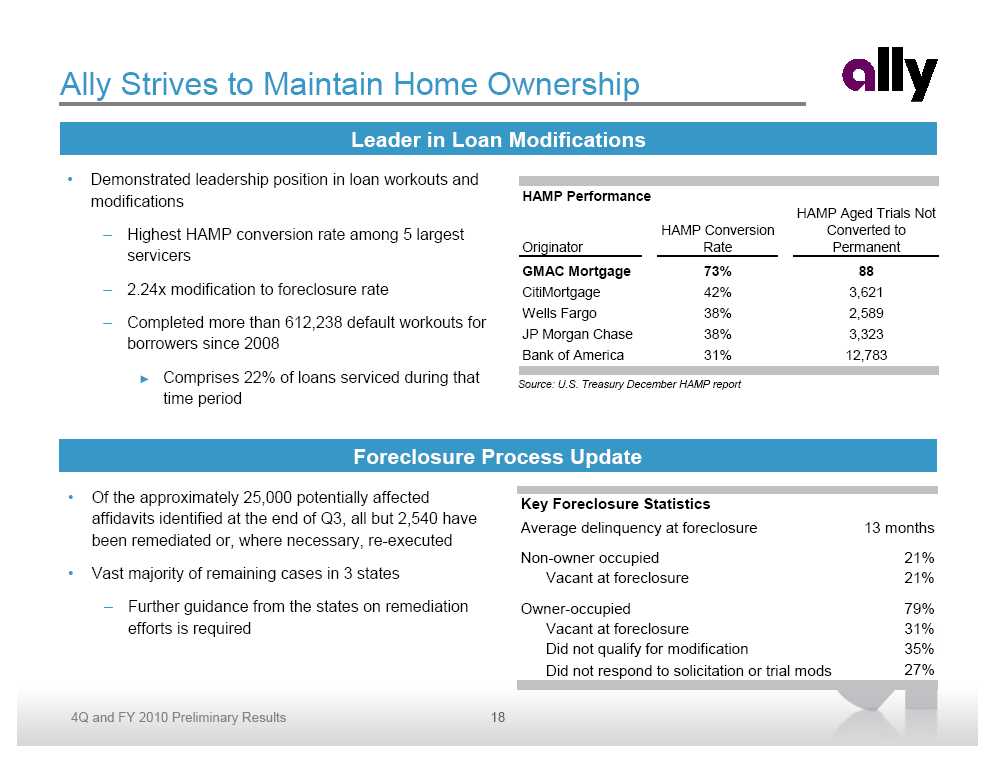
Ally Strives to Maintain Home Ownership Leader in Loan Modifications • Demonstrated leadership position in loan workouts and modifications – Highest HAMP conversion rate among 5 largest servicers – 2.24x modification to foreclosure rate – Completed more than 612,238 default workouts for borrowers since 2008 o Comprises 22% of loans serviced during that time period HAMP Performance HAMP Aged Trials Not HAMP Conversion Converted to Originator Rate Permanent GMAC Mortgage 73% 88 CitiMortgage 42% 3,621 Wells Fargo 38% 2,589 JP Morgan Chase 38% 3,323 Bank of America 31% 12,783 Source: U.S. Treasury December HAMP report Foreclosure Process Update • Of the approximately 25,000 potentially affected Key Foreclosure Statistics affidavits identified at the end of Q3, all but 2,540 have Average delinquency at foreclosure 13 months been remediated or, where necessary, re-executed Non-owner occupied 21% • Vast majority of remaining cases in 3 states Vacant at foreclosure 21% – Further guidance from the states on remediation Owner-occupied 79% efforts is required Vacant at foreclosure 31% Did not qualify for modification 35% Did not respond to solicitation or trial mods 27%
Ally Bank Franchise Strategy Brand and Marketing Strategy • Do Right – Advocate, strive for customer satisfaction • Be Obviously Better – Intelligent experience, win-win, be a challenger • Operate in a safe and sound manner at all times Compelling Value Proposition • Full spectrum of product offerings • Products designed to address customer needs • Online banking now the preferred banking channel by consumers • Voted “Best Savings Account” by Money Magazine in 2010 Differentiate the Customer Experience • Access to customer representatives 24/7 • Ease of Use – Streamlined account opening process, easy navigation on website • No hidden fees, rules or penalties Competitive Pricing • Ally Bank offers an attractive alternative to traditional money center banks • Competitive pricing but not a price leader • 100% of recent deposit growth has been from non-brokered products
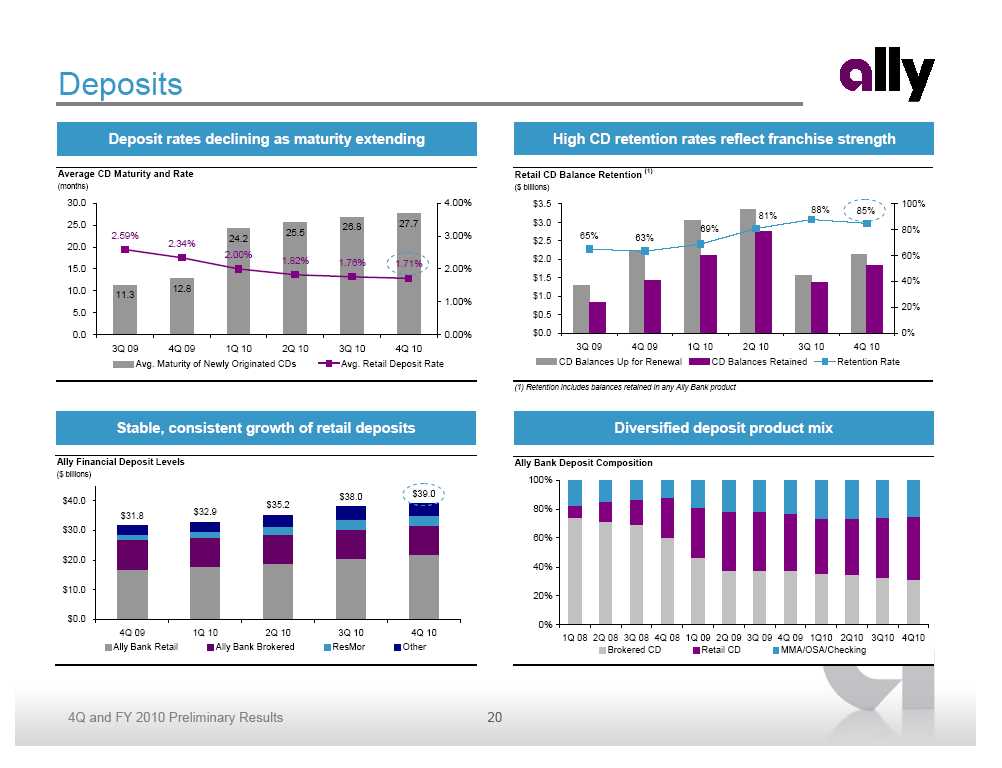
Deposits Deposit rates declining as maturity extending Average CD Maturity and Rate (months) 30.0 4.00% 25.0 26.8 27.7 2.59% 25.5 3.00% 24.2 20.0 2.34% 2.00% 1.82% 1.76% 1.71% 15.0 2.00% 10.0 12.8 11.3 1.00% 5.0 0.0 0.00% 3Q 09 4Q 09 1Q 10 2Q 10 3Q 10 4Q 10 Avg. Maturity of Newly Originated CDs Avg. Retail Deposit Rate Trick Stable, consistent growth of retail deposits Ally Financial Deposit Levels ($ billions) $38.0 $39.0 $40.0 $35.2 $31.8 $32.9 $30.0 $20.0 $10.0 $0.0 4Q 09 1Q 10 2Q 10 3Q 10 4Q 10 Ally Bank Retail Ally Bank Brokered ResMor Other High CD retention rates reflect franchise strength Retail CD Balance Retention (1) ($ billions) $3.5 100% 88% 85% 81% $3.0 69% 80% 65% 63% $2.5 $2.0 60% $1.5 40% $1.0 20% $0.5 $0.0 0% 3Q 09 4Q 09 1Q 10 2Q 10 3Q 10 4Q 10 CD Balances Up for Renewal CD Balances Retained Retention Rate (1) Retention includes balances retained in any Ally Bank product Diversified deposit product mix Ally Bank Deposit Composition 100% 80% 60% 40% 20% 0% 1Q 08 2Q 08 3Q 08 4Q 08 1Q 09 2Q 09 3Q 09 4Q 09 1Q10 2Q10 3Q10 4Q10 Brokered CD Retail CD MMA/OSA/Checking
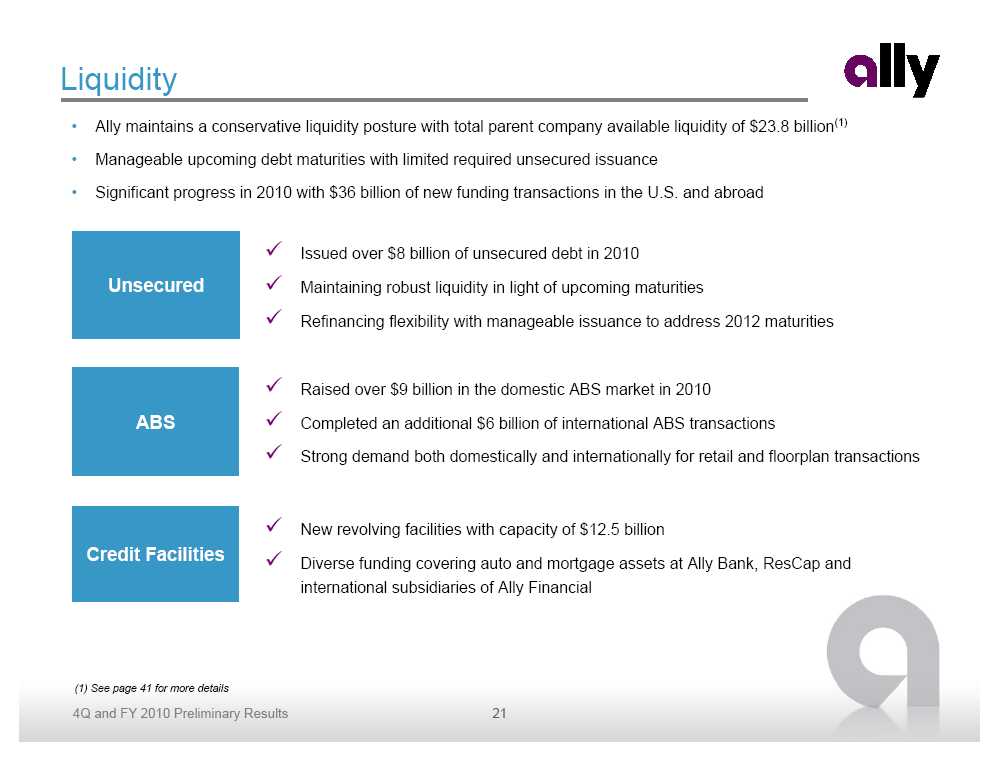
Liquidity • Ally maintains a conservative liquidity posture with total parent company available liquidity of $23.8 billion(1) • Manageable upcoming debt maturities with limited required unsecured issuance • Significant progress in 2010 with $36 billion of new funding transactions in the U.S. and abroad Issued over $8 billion of unsecured debt in 2010 Unsecured Maintaining robust liquidity in light of upcoming maturities Refinancing flexibility with manageable issuance to address 2012 maturities Raised over $9 billion in the domestic ABS market in 2010 ABS Completed an additional $6 billion of international ABS transactions Strong demand both domestically and internationally for retail and floorplan transactions New revolving facilities with capacity of $12.5 billion Credit Facilities Diverse funding covering auto and mortgage assets at Ally Bank, ResCap and international subsidiaries of Ally Financial (1) See page 41 for more details
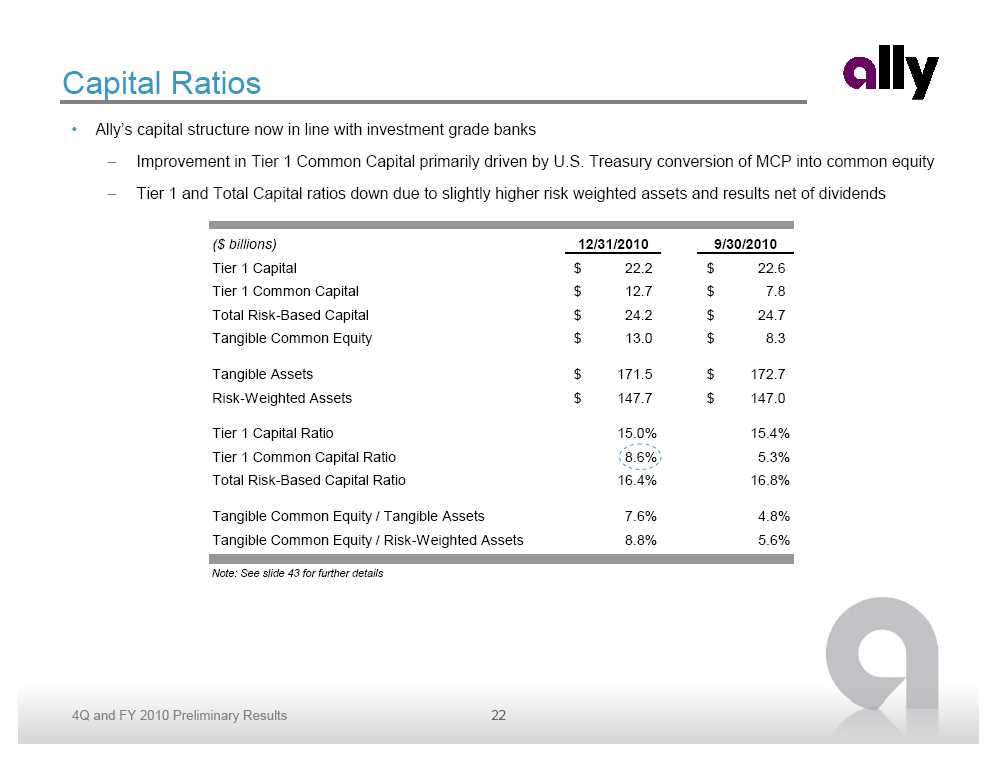
Capital Ratios • Ally’s capital structure now in line with investment grade banks – Improvement in Tier 1 Common Capital primarily driven by U.S. Treasury conversion of MCP into common equity – Tier 1 and Total Capital ratios down due to slightly higher risk weighted assets and results net of dividends ($ billions) 12/31/2010 9/30/2010 Tier 1 Capital $ 22.2 $ 22.6 Tier 1 Common Capital $ 12.7 $ 7.8 Total Risk-Based Capital $ 24.2 $ 24.7 Tangible Common Equity $ 13.0 $ 8.3 Tangible Assets $ 171.5 $ 172.7 Risk-Weighted Assets $ 147.7 $ 147.0 Tier 1 Capital Ratio 15.0% 15.4% Tier 1 Common Capital Ratio 8.6% 5.3% Total Risk-Based Capital Ratio 16.4% 16.8% Tangible Common Equity / Tangible Assets 7.6% 4.8% Tangible Common Equity / Risk-Weighted Assets 8.8% 5.6% Note: See slide 43 for further details
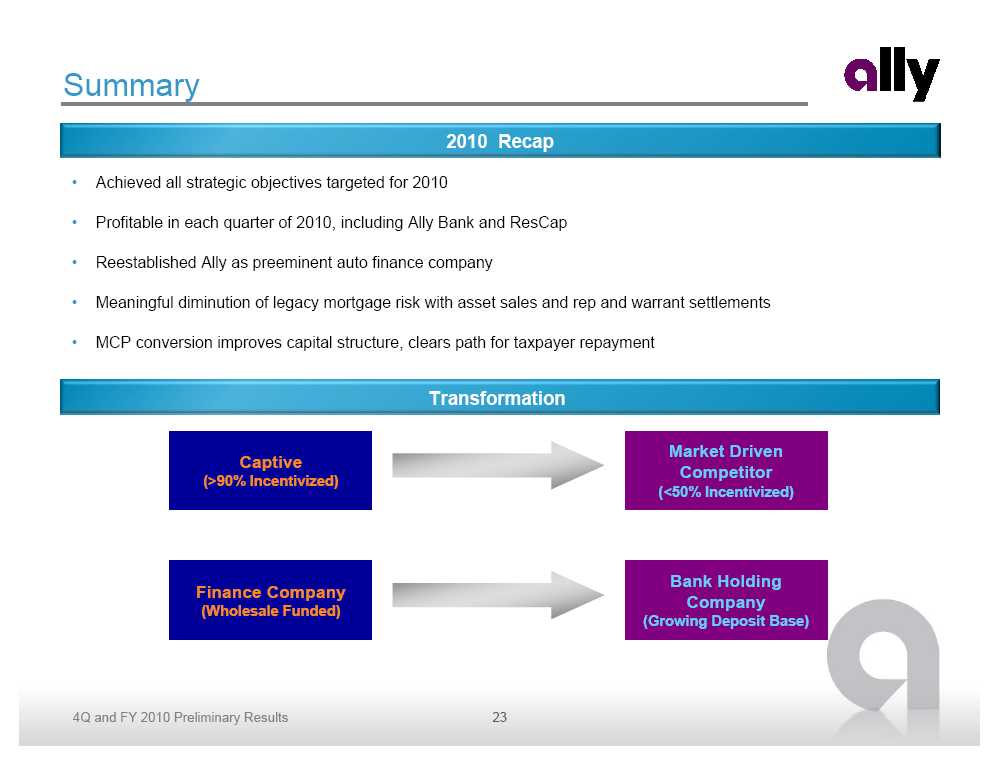
Summary 2010 Recap • Achieved all strategic objectives targeted for 2010 • Profitable in each quarter of 2010, including Ally Bank and ResCap • Reestablished Ally as preeminent auto finance company • Meaningful diminution of legacy mortgage risk with asset sales and rep and warrant settlements • MCP conversion improves capital structure, clears path for taxpayer repayment Transformation Market Driven Captive Competitor (>90% Incentivized) (<50% Incentivized) Bank Holding Finance Company Company (Wholesale Funded) (Growing Deposit Base)


Supplemental Condensed Consolidated Income Statement ($ millions) 4Q 10 3Q 10 4Q 09 FY 2010 FY 2009 Total financing revenue and other interest income $ 2,662 $ 2,777 $ 3,043 $ 11,447 $ 13,100 Interest expense 1,738 1,733 1,626 6,836 7,274 Depreciation expense on operating lease assets 394 454 741 2,030 3,748 Net financing revenue 530 590 676 2,581 2,078 Servicing fees 390 404 373 1,563 1,549 Servicing asset valuation and hedge activities, net (213) (27) (417) (394) (1,104) Insurance premiums and service revenue earned 450 470 476 1,865 1,977 Gain on mortgage and automotive loans, net 404 326 145 1,267 811 (Loss) gain on extinguishment of debt - (2) (2) (123) 665 Other income on investments, net 150 100 52 505 166 Other income, net of losses 197 186 271 638 353 Total other revenue 1,378 1,457 898 5,321 4,417 Total net revenue 1,908 2,047 1,574 7,902 6,495 Provision for loan losses 71 9 3,063 442 5,604 Insurance losses and loss adjustment expenses 212 229 242 876 1,042 Other operating expenses 1,393 1,484 2,072 5,405 6,808 Total noninterest expense 1,605 1,713 2,314 6,281 7,850 Income (loss) from cont. ops before income tax expense (benefit) $ 232 $ 325 $ (3,803) $ 1,179 $ (6,959)

Supplemental North American Auto - Condensed Income Statement ($ millions) 4Q 10 3Q 10 4Q 09 FY 2010 FY 2009 Total financing revenue and other interest income $ 1,747 $ 1,810 $ 2,063 $ 7,595 $ 8,937 Interest expense 575 580 559 2,377 2,363 Depreciation expense on operating lease assets 374 430 701 1,897 3,500 Net financing revenue 798 800 803 3,321 3,074 Servicing fees 51 60 56 226 238 Gain on automotive loans, net 47 23 82 249 220 Other income 59 61 92 215 299 Total other revenue 157 144 230 690 757 Total net revenue 955 944 1,033 4,011 3,831 Provision for loan losses 19 60 339 286 611 Noninterest expense 347 333 351 1,381 1,596 Income from cont. ops before income tax expense $ 589 $ 551 $ 343 $ 2,344 $ 1,624
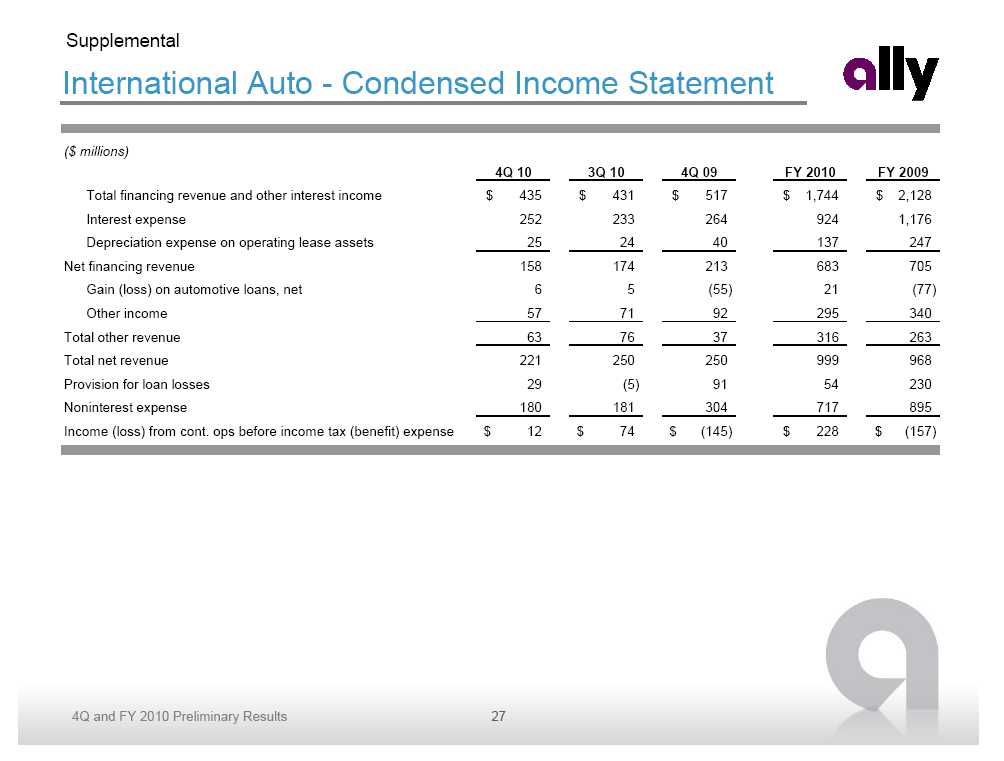
Supplemental International Auto - Condensed Income Statement ($ millions) 4Q 10 3Q 10 4Q 09 FY 2010 FY 2009 Total financing revenue and other interest income $ 435 $ 431 $ 517 $ 1,744 $ 2,128 Interest expense 252 233 264 924 1,176 Depreciation expense on operating lease assets 25 24 40 137 247 Net financing revenue 158 174 213 683 705 Gain (loss) on automotive loans, net 6 5 (55) 21 (77) Other income 57 71 92 295 340 Total other revenue 63 76 37 316 263 Total net revenue 221 250 250 999 968 Provision for loan losses 29 (5) 91 54 230 Noninterest expense 180 181 304 717 895 Income (loss) from cont. ops before income tax (benefit) expense $ 12 $ 74 $ (145) $ 228 $ (157)

Supplemental Mortgage Origination and Servicing - Condensed Income Statement ($ millions) 4Q 10 3Q 10 4Q 09 FY 2010 FY 2009 Total financing revenue and other interest income $ 135 $ 130 $ 99 $ 460 $ 362 Interest expense 137 125 104 486 420 Net financing revenue (2) 5 (5) (26) (58) Servicing fees 338 345 321 1,340 1,322 Servicing asset valuation & hedge activities, net (213) (27) (420) (394) (1,113) Gain on mortgage loans, net 214 214 150 616 654 Other income, net of losses 81 77 87 272 266 Total other revenue 420 609 138 1,834 1,129 Total net revenue 418 614 133 1,808 1,071 Provision for loan losses - 5 22 (29) 41 Noninterest expense 246 184 291 920 991 Income (loss) from cont. ops before income tax expense $ 172 $ 425 $ (180) $ 917 $ 39

Supplemental Legacy Portfolio and Other - Condensed Income Statement ($ millions) 4Q 10 3Q 10 4Q 09 FY 2010 FY 2009 Total financing revenue and other interest income $ 264 $ 325 $ 342 $ 1,332 $ 1,559 Interest expense 166 183 191 727 933 Net financing revenue 98 142 151 605 626 Servicing fees (1) (2) (4) (8) (10) Servicing asset valuation & hedge activities, net - - 3 - 9 Gain (loss) on mortgage loans, net 136 84 (39) 380 14 Other income, net of losses (19) (33) (119) (112) (764) Total other revenue (expense) 116 49 (159) 260 (751) Total net revenue 214 191 (8) 865 (125) Provision for loan losses 23 17 2,488 173 4,231 Noninterest expense 240 445 675 946 1,948 Loss from cont. ops before income tax expense $ (49) $ (271) $ (3,171) $ (254) $ (6,304)
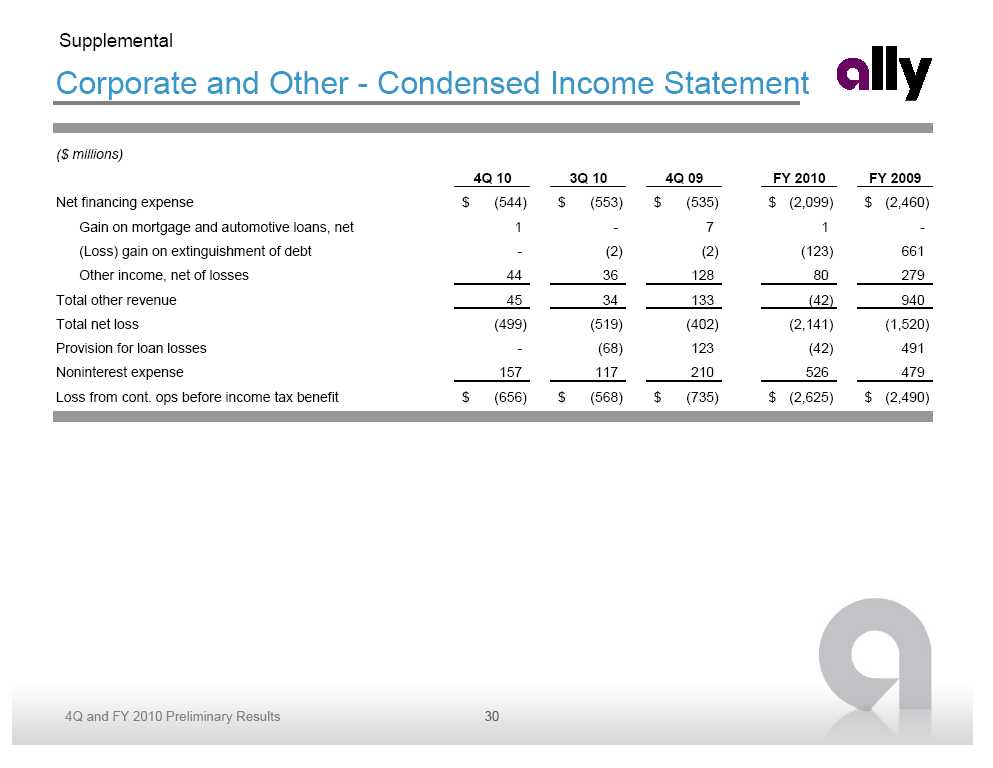
Supplemental Corporate and Other - Condensed Income Statement ($ millions) 4Q 10 3Q 10 4Q 09 FY 2010 FY 2009 Net financing expense $ (544) $ (553) $ (535) $ (2,099) $ (2,460) Gain on mortgage and automotive loans, net 1 - 7 1 -(Loss) gain on extinguishment of debt - (2) (2) (123) 661 Other income, net of losses 44 36 128 80 279 Total other revenue 45 34 133 (42) 940 Total net loss (499) (519) (402) (2,141) (1,520) Provision for loan losses - (68) 123 (42) 491 Noninterest expense 157 117 210 526 479 Loss from cont. ops before income tax benefit $ (656) $ (568) $ (735) $ (2,625) $ (2,490)
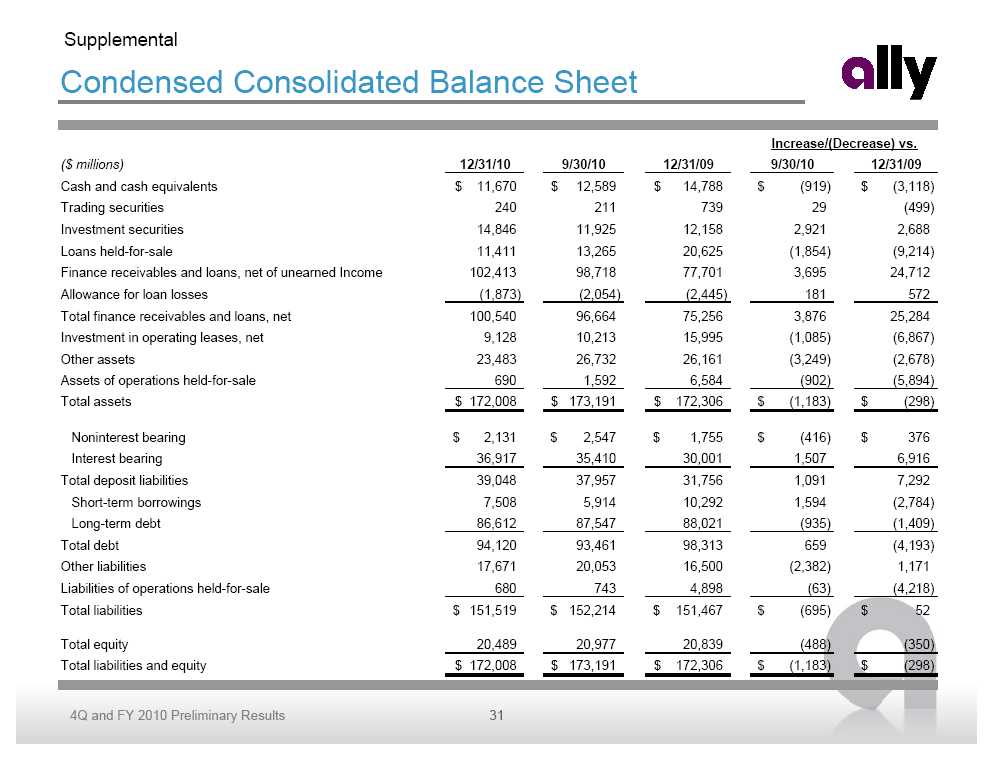
Supplemental Condensed Consolidated Balance Sheet Increase/(Decrease) vs. ($ millions) 12/31/10 9/30/10 12/31/09 9/30/10 12/31/09 Cash and cash equivalents $ 11,670 $ 12,589 $ 14,788 $ (919) $ (3,118) Trading securities 240 211 739 29 (499) Investment securities 14,846 11,925 12,158 2,921 2,688 Loans held-for-sale 11,411 13,265 20,625 (1,854) (9,214) Finance receivables and loans, net of unearned Income 102,413 98,718 77,701 3,695 24,712 Allowance for loan losses (1,873) (2,054) (2,445) 181 572 Total finance receivables and loans, net 100,540 96,664 75,256 3,876 25,284 Investment in operating leases, net 9,128 10,213 15,995 (1,085) (6,867) Other assets 23,483 26,732 26,161 (3,249) (2,678) Assets of operations held-for-sale 690 1,592 6,584 (902) (5,894) Total assets $ 172,008 $ 173,191 $ 172,306 $ (1,183) $ (298) Noninterest bearing $ 2,131 $ 2,547 $ 1,755 $ (416) $ 376 Interest bearing 36,917 35,410 30,001 1,507 6,916 Total deposit liabilities 39,048 37,957 31,756 1,091 7,292 Short-term borrowings 7,508 5,914 10,292 1,594 (2,784) Long-term debt 86,612 87,547 88,021 (935) (1,409) Total debt 94,120 93,461 98,313 659 (4,193) Other liabilities 17,671 20,053 16,500 (2,382) 1,171 Liabilities of operations held-for-sale 680 743 4,898 (63) (4,218) Total liabilities $ 151,519 $ 152,214 $ 151,467 $ (695) $ 52 Total equity 20,489 20,977 20,839 (488) (350) Total liabilities and equity $ 172,008 $ 173,191 $ 172,306 $ (1,183) $ (298)
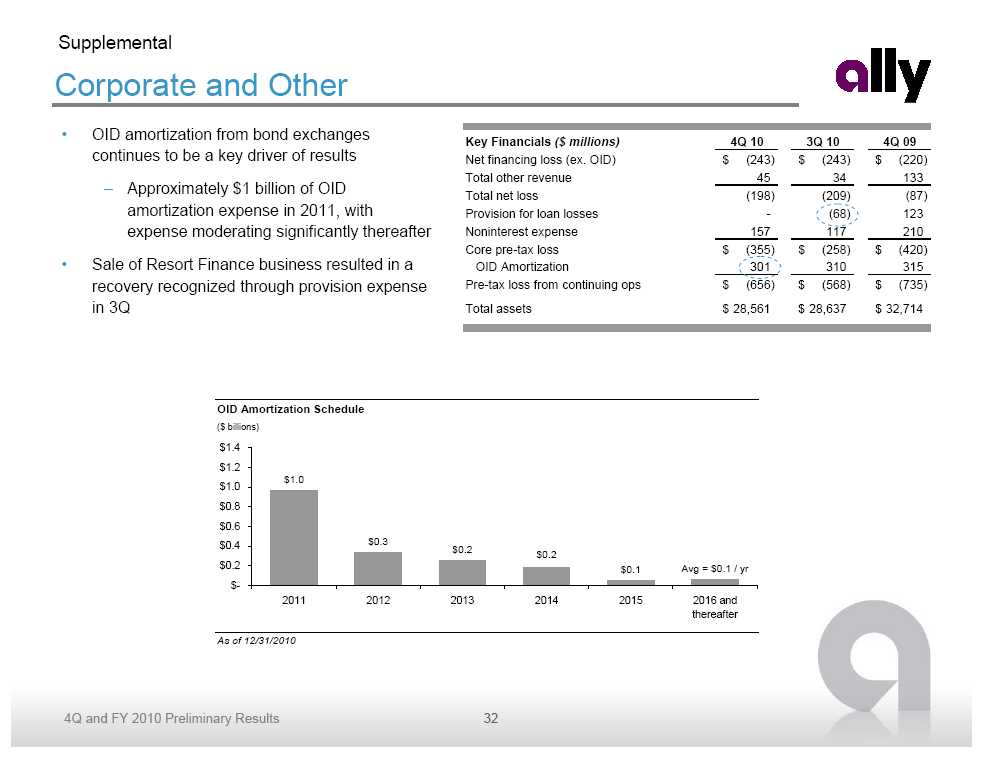
Supplemental Corporate and Other • OID amortization from bond exchanges continues to be a key driver of results – Approximately $1 billion of OID amortization expense in 2011, with expense moderating significantly thereafter • Sale of Resort Finance business resulted in a recovery recognized through provision expense in 3Q OID Amortization Schedule ($ billions) Key Financials ($ millions) 4Q 10 3Q 10 4Q 09 Net financing loss (ex. OID) $ (243) $ (243) $ (220) Total other revenue 45 34 133 Total net loss (198) (209) (87) Provision for loan losses - (68) 123 Noninterest expense 157 117 210 Core pre-tax loss $ (355) $ (258) $ (420) OID Amortization 301 310 315 Pre-tax loss from continuing ops $ (656) $ (568) $ (735) Total assets $ 28,561 $ 28,637 $ 32,714 $1.4 $1.2 $1.0 $1.0 $0.8 $0.6 $0.4 $0.3 $0.2 $0.2 $0.2 $0.1 Avg = $0.1 / yr $-2011 2012 2013 2014 2015 2016 and thereafter As of 12/31/2010
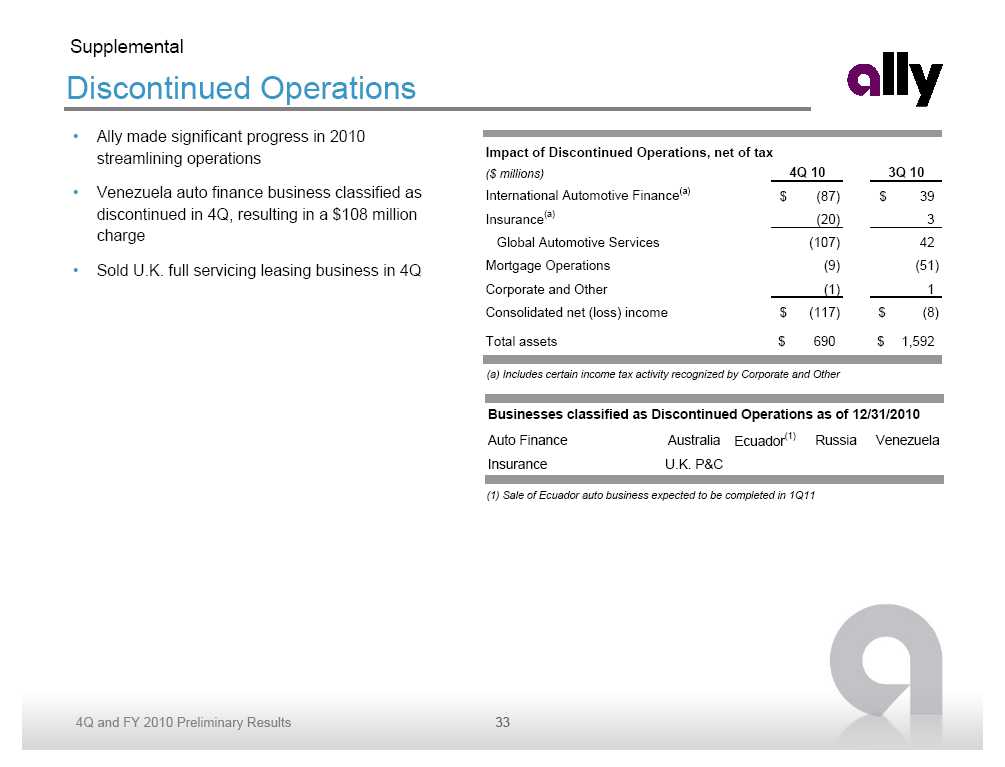
Supplemental Discontinued Operations • Ally made significant progress in 2010 streamlining operations • Venezuela auto finance business classified as discontinued in 4Q, resulting in a $108 million charge • Sold U.K. full servicing leasing business in 4Q Impact of Discontinued Operations, net of tax ($ millions) 4Q 10 3Q 10 International Automotive Finance (a) $ (87) $ 39 Insurance (a) (20) 3 Global Automotive Services (107) 42 Mortgage Operations (9) (51) Corporate and Other (1) 1 Consolidated net (loss) income $ (117) $ (8) Total assets $ 690 $ 1,592 (a) Includes certain income tax activity recognized by Corporate and Other Businesses classified as Discontinued Operations as of 12/31/2010 Auto Finance Australia Ecuador (1) Russia Venezuela Insurance U.K. P&C (1) Sale of Ecuador auto business expected to be completed in 1Q11

Supplemental High Quality Balance Sheet Liquid Assets ($ millions) Total % of Total Comments Cash and Cash Equivalents $ 11,670 6.8% Conservative liquidity posture Investment and Trading Securities 15,086 8.8 26,756 15.6 Loan and Lease Assets Retail Auto 51,255 29.8 0.88% annualized credit losses Commercial Auto 35,548 20.7 0.24% annualized credit losses Auto Lease 9,128 5.3 Vintage portfolio liquidating at gains Ally Bank Mortgage HFI 10,080 5.9 728 avg. FICO; riskier assets removed in 4Q09 Ally Bank Mortgage HFS 6,402 3.7 Conforming pipeline assets ResCap Mortgage HFS 2,148 1.2 On average marked to 45% of UPB Securitized Mortgage Assets and Other(1) 4,543 2.6 Primarily non-recourse securitized assets Commercial Mortgages 1,775 1.0 Warehouse lines collateralized by conforming mortgages Commercial Asset Based Lending 1,589 0.9 High quality collateralized transactions Allowance for Loan Losses (1,873) (1.1) 1.8% ALLL as a % of loans; 1.0% NCO rate 120,595 70.1 Other Assets Mortgage Servicing Rights 3,738 2.2 Carried at fair value Insurance Premiums Receivable and Other Insurance Assets 2,181 1.3 Capitalized future premiums due FV of Derivative Contracts 3,966 2.3 Presented on a gross basis Restricted Cash/Collateral 5,765 3.4 Largely cash held in securitization trusts awaiting release Servicer Advances 2,137 1.2 High quality revolving asset at top of securitization waterfall Other (2) 6,180 3.6 Various low risk assets, some marked to market based levels Assets of Operations HFS 690 0.4 Assets and businesses held at fair value and positioned for sale 24,657 14.3 Total Assets 12/31/10 $ 172,008 100% Note: Please refer to slide 43 for more detail (1) Includes $2.5 billion of domestic HFS assets related to off-balance sheet securitizations where ResCap has the option, but not the obligation to repurchase loans (2) Includes $484 million Notes Receivables from General Motors, net property and equipment, debt issuance costs, prepaid expenses and deposits, goodwill, interests retained in financial asset sales, inventory in used vehicle HFS, accrued interest and rent receivable, other accounts receivable, and other small assets

Supplemental Global Auto Finance - Allowance Coverage Ratios • North American consumer coverage ratio decreased primarily driven by a change in the asset mix as a result of continued runoff of liquidating portfolios and improved credit quality trends – Coverage ratio remains strong relative to charge -off levels and non-performing assets North American Auto Consumer Increase/(Decrease) vs. ($ millions) 4Q 10 3Q 10 4Q 09 3Q 10 4Q 09 Allowance balance $ 813 $ 900 $ 823 $ (87) $ (10) Total consumer loans $ 41,895 $ 36,717 $ 18,604 $ 5,178 $ 23,291 Coverage ratio 1.9% 2.5% 4.4% -0.5% -2.5% Commercial Increase/(Decrease) vs. 4Q 10 3Q 10 4Q 09 3Q 10 4Q 09 Allowance balance $ 132 $ 126 $ 162 $ 6 $ (30) Total commercial loans $ 31,229 $ 29,623 $ 25,048 $ 1,606 $ 6,181 Coverage ratio 0.4% 0.4% 0.6% 0.0% -0.2% International Auto Consumer Increase/(Decrease) vs. ($ millions) 4Q 10 3Q 10 4Q 09 3Q 10 4Q 09 Allowance balance $ 156 $ 150 $ 202 $ 6 $ (46) Total consumer loans $ 9,359 $ 9,378 $ 11,641 $ (19) $ (2,282) Coverage ratio 1.7% 1.6% 1.7% 0.1% 0.0% Commercial Increase/(Decrease) vs. 4Q 10 3Q 10 4Q 09 3Q 10 4Q 09 Allowance balance $ 30 $ 28 $ 49 $ 2 $ (19) Total commercial loans $ 4,400 $ 4,263 $ 4,725 $ 137 $ (325) Coverage ratio 0.7% 0.6% 1.0% 0.1% -0.3% Note: Coverage ratio defined as allowance for loan losses as a percentage of end of period assets
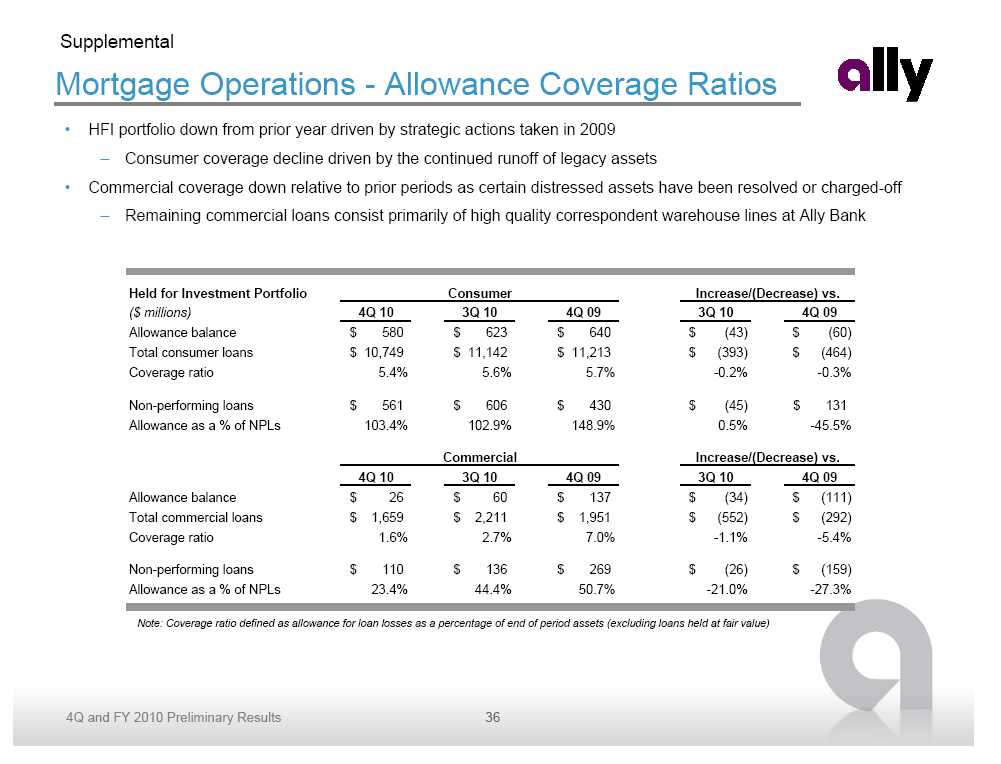
Supplemental Mortgage Operations - Allowance Coverage Ratios • HFI portfolio down from prior year driven by strategic actions taken in 2009 – Consumer coverage decline driven by the continued runoff of legacy assets • Commercial coverage down relative to prior periods as certain distressed assets have been resolved or charged -off – Remaining commercial loans consist primarily of high quality correspondent warehouse lines at Ally Bank Held for Investment Portfolio Consumer Increase/(Decrease) vs. ($ millions) 4Q 10 3Q 10 4Q 09 3Q 10 4Q 09 Allowance balance $ 580 $ 623 $ 640 $ (43) $ (60) Total consumer loans $ 10,749 $ 11,142 $ 11,213 $ (393) $ (464) Coverage ratio 5.4% 5.6% 5.7% -0.2% - -0.3% Non-performing loans $ 561 $ 606 $ 430 $ (45) $ 131 Allowance as a % of NPLs 103.4% 102.9% 148.9% 0.5% -45.5% Commercial Increase/(Decrease) vs. 4Q 10 3Q 10 4Q 09 3Q 10 4Q 09 Allowance balance $ 26 $ 60 $ 137 $ (34) $ (111) Total commercial loans $ 1,659 $ 2,211 $ 1,951 $ (552) $ (292) Coverage ratio 1.6% 2.7% 7.0% -1.1% -5.4% Non-performing loans $ 110 $ 136 $ 269 $ (26) $ (159) Allowance as a % of NPLs 23.4% 44.4% 50.7% -21.0% - -27.3% Note: Coverage ratio defined as allowance for loan losses as a percentage of end of period assets (excluding loans held at fair value) Consumer Coverage Ratios 1 0.9 0.8 0.7 0.6 0.5 0.4 0.3 0.2 0.1 0 0
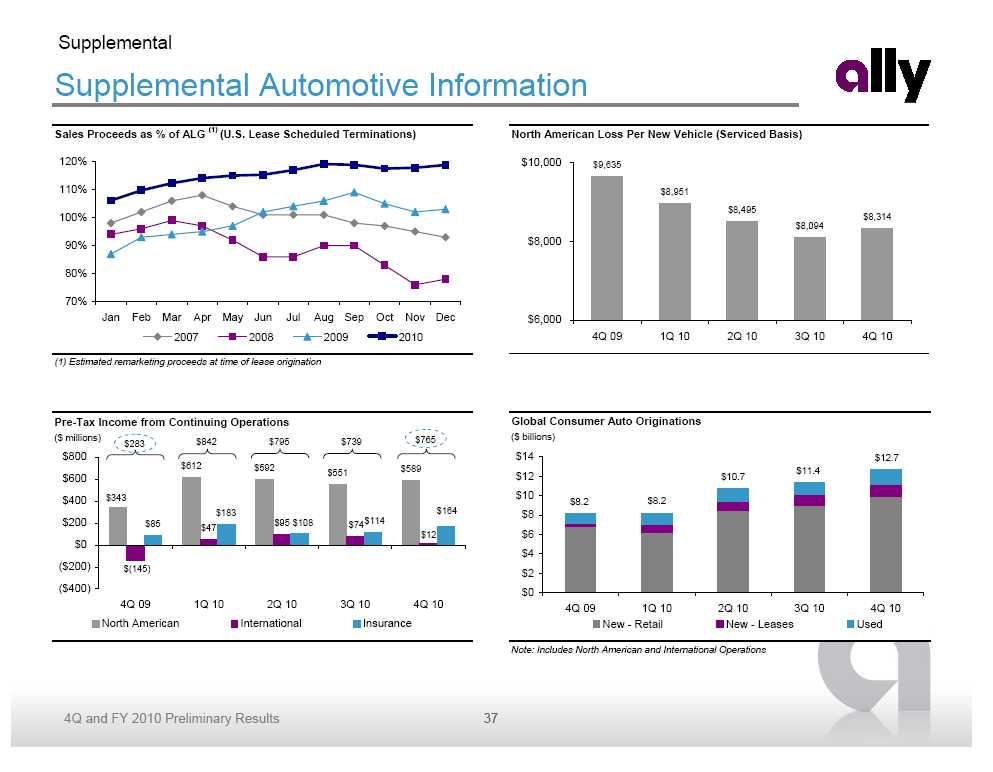
Supplemental Supplemental Automotive Information Sales Proceeds as % of ALG(1) (U.S. Lease Scheduled Terminations) 120% 110% 100% 90% 80% 70% Jan Feb Mar Apr May Jun Jul Aug Sep Oct Nov Dec 2007 2008 2009 2010 (1) Estimated remarketing proceeds at time of lease origination Pre-Tax Income from Continuing Operations ($ millions) $842 $795 $739 $765 $283 $800 $612 $592 $589 $551 $600 $400 $343 $183 $164 $200 $85 $95 $108 $114 $47 $74 $12 $0 ($200) $(145) ($400) 4Q 09 1Q 10 2Q 10 3Q 10 4Q 10 North American International Insurance Trick North American Loss Per New Vehicle (Serviced Basis) $10,000 $9,635 $8,951 $8,495 $8,314 $8,094 $8,000 $6,000 4Q 09 1Q 10 2Q 10 3Q 10 4Q 10 Trick Global Consumer Auto Originations ($ billions) $14 $12.7 $11.4 $12 $10.7 $10 $8.2 $8.2 $8 $6 $4 $2 $0 4Q 09 1Q 10 2Q 10 3Q 10 4Q 10 New - Retail New - Leases Used Note: Includes North American and International Operations

Supplemental Mortgage Operations Asset Breakout • $5.3 billion of legacy assets remain at ResCap, consisting primarily of accounting assets and HFS loans marked at 45% of UPB Mortgage Operations Balance Sheet Analysis Origination and Legacy Total Total Servicing Portfolio 12/31/10 9/30/10 ResCap, LLC Assets Cash and cash equivalents $ 0.0 $ 0.7 $ 0.7 $ 0.6 Accounts receivable (servicing advances, etc) 2.4 0.1 2.5 2.4 Securitized assets (1) 2.5 1.5 3.9 6.3 Derivatives and derivative collateral 4.0 0.5 4.5 5.3 Restricted cash and other assets 0.2 0.5 0.7 1.1 Cash, accounting and other less value sensitive assets $ 9.1 $ 3.2 $ 12.3 $ 15.6 Mortgage servicing rights $ 2.0 $ - $ 2.0 $ 1.7 Other assets (2) 0.0 0.3 0.3 0.3 Assets of international operations held-for-sale - - - 0.2 Mortgage loans held-for-sale 0.3 1.8 2.1 2.7 Assets carried at fair or net realizable value $ 2.3 $ 2.1 $ 4.4 $ 4.9 Total ResCap, LLC Assets $ 11.5 $ 5.3 $ 16.8 $ 20.5 Ally Bank HFI (3) $ 2.1 $ 7.5 $ 9.5 $ 9.7 Ally Bank HFS 6.4 0.0 6.4 7.0 Ally Bank warehouse lines 1.5 - 1.5 2.0 Ally Bank MSR 1.7 - 1.7 1.1 Other non-ResCap assets (4) 1.0 (0.3) 0.7 0.7 Total Mortgage Operations Assets $ 24.3 $ 12.5 $ 36.8 $ 41.0 (1) 12/31/2010 includes domestic securitized assets of $0.9 billion, international securitized assets of $0.5 billion and $2.5 billion of domestic HFS assets related to off-balance sheet securitizations where ResCap has the option, but not the obligation to repurchase loans (2) Includes REO, AFS, trading securities, warehouse loans, model homes and other assets (3) 12/31/2010 Legacy amount primarily consists of loans originated prior to 1/1/2009 (4) Includes Ally Bank Cash, Accounts Receivables and Other Assets, as well as ResMor Trust and intercompany eliminations

Supplemental Ally Bank HFI Portfolio • Legacy assets running off with reinvestment in high quality prime jumbo originations • Delinquency trends continue to perform in line with expectations Mortgage Pool Characteristics - Ally Bank HFI Portfolio ($ billions) 12/31/2010 9/30/2010 12/31/2009 9/30/2009 Gross Carry Value $ 10.1 $ 10.3 $ 10.3 $ 13.8 Net Carry Value $ 9.5 $ 9.7 $ 9.7 $ 13.1 Estimated Pool Characteristics: % Prime Jumbo (> 1/1/2009) 20.6% 18.7% 9.2% 5.0% % Second Lien 15.9% 16.4% 18.7% 21.4% % Interest Only 36.5% 38.6% 41.8% 44.4% % 30+ Day Delinquent 3.9% 3.8% 2.7% 9.5% % Low/No Documentation 18.0% 18.3% 20.4% 27.7% % Non-primary Residence 4.3% 4.5% 4.9% 5.5% Refreshed FICO 728 730 730 705 Wtd. Avg. LTV/CLTV (1) 96% 94% 96% 106% Higher Risk Geographies (2) 39% 39% 39% 43% (1) Updated home values derived from MSA level adjustments based on Case-Shiller and other industry data (2) Includes CA, FL, MI and AZ
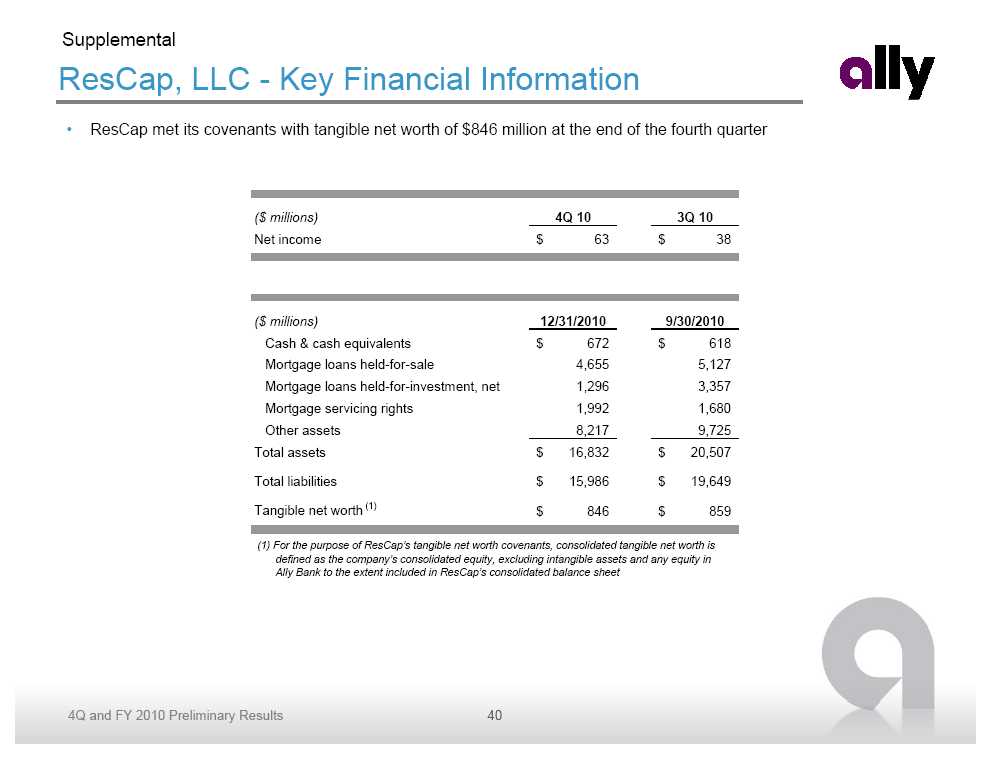
Supplemental ResCap, LLC - Key Financial Information • ResCap met its covenants with tangible net worth of $846 million at the end of the fourth quarter ($ millions) 4Q 10 3Q 10 Net income $ 63 $ 38 ($ millions) 12/31/2010 9/30/2010 Cash & cash equivalents $ 672 $ 618 Mortgage loans held-for-sale 4,655 5,127 Mortgage loans held-for-investment, net 1,296 3,357 Mortgage servicing rights 1,992 1,680 Other assets 8,217 9,725 Total assets $ 16,832 $ 20,507 Total liabilities $ 15,986 $ 19,649 Tangible net worth(1) $ 846 $ 859 (1) For the purpose of ResCap’s tangible net worth covenants, consolidated tangible net worth is defined as the company’s consolidated equity, excluding intangible assets and any equity in Ally Bank to the extent included in ResCap’s consolidated balance sheet
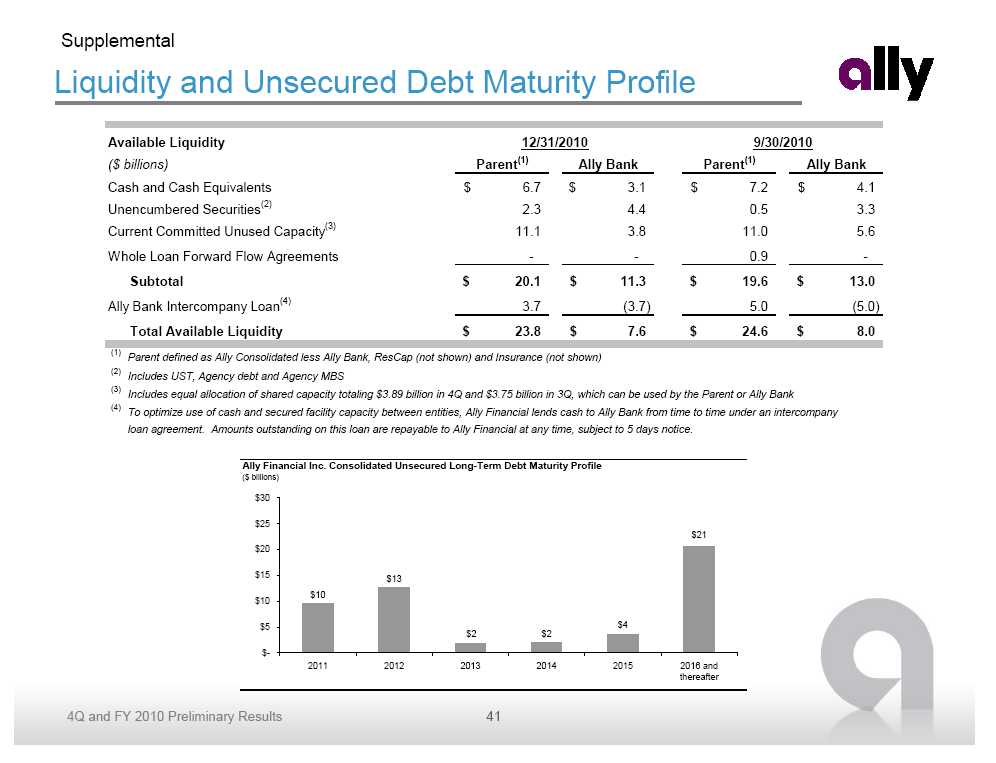
Supplemental Liquidity and Unsecured Debt Maturity Profile Available Liquidity 12/31/2010 9/30/2010 ($ billions) Parent (1) Ally Bank Parent (1) Ally Bank Cash and Cash Equivalents $ 6.7 $ 3.1 $ 7.2 $ 4.1 Unencumbered Securities (2) 2.3 4.4 0.5 3.3 Current Committed Unused Capacity (3) 11.1 3.8 11.0 5.6 Whole Loan Forward Flow Agreements - - 0.9 - Subtotal $ 20.1 $ 11.3 $ 19.6 $ 13.0 Ally Bank Intercompany Loan(4) 3.7 (3.7) 5.0 (5.0) Total Available Liquidity $ 23.8 $ 7.6 $ 24.6 $ 8.0 (1) Parent defined as Ally Consolidated less Ally Bank, ResCap (not shown) and Insurance (not shown) (2) Includes UST, Agency debt and Agency MBS (3) Includes equal allocation of shared capacity totaling $3.89 billion in 4Q and $3.75 billion in 3Q, which can be used by the Parent or Ally Bank (4) To optimize use of cash and secured facility capacity between entities, Ally Financial lends cash to Ally Bank from time to time under an intercompany loan agreement . Amounts outstanding on this loan are repayable to Ally Financial at any time, subject to 5 days notice. Ally Financial Inc. Consolidated Unsecured Long-Term Debt Maturity Profile ($ billions) $30 $25 $21 $20 $15 $13 $10 $10 $5 $4 $2 $2 $- 2011 2012 2013 2014 2015 2016 and thereafter
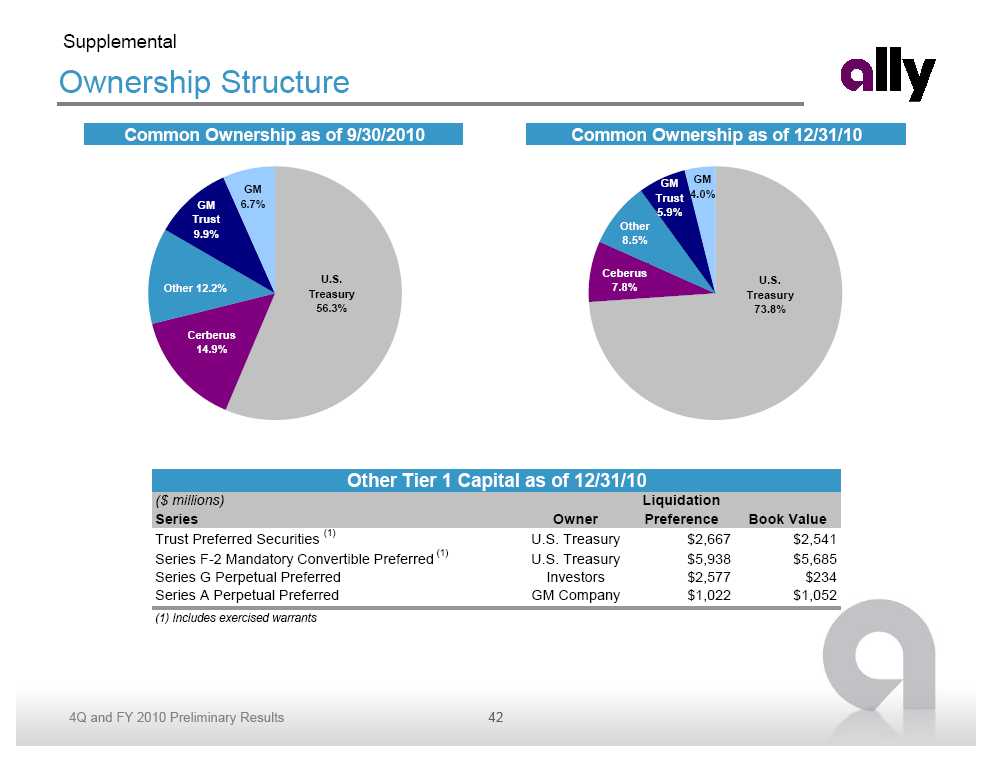
Supplemental Ownership Structure Common Ownership as of 9/30/2010 Common Ownership as of 12/31/10 GM GM GM 4.0% Trust GM 6.7% 5.9% Trust Other 9.9% 8.5% Ceberus U.S. U.S. Other 12.2% 7.8% Treasury Treasury 56.3% 73.8% Cerberus 14.9% Other Tier 1 Capital as of 12/31/10 ($ millions) Liquidation Series Owner Preference Book Value Trust Preferred Securities (1) U.S. Treasury $2,667 $2,541 Series F-2 Mandatory Convertible Preferred (1) U.S. Treasury $5,938 $5,685 Series G Perpetual Preferred Investors $2,577 $234 Series A Perpetual Preferred GM Company $1,022 $1,052 (1) Includes exercised warrants

Supplemental Notes on Non-GAAP Financial Measures and Other Slide 3 • Non-core operations sold in 2010 include: auto finance operations in Argentina, Australia, New Zealand, and Poland; full-service leasing operations in Australia, Belgium, France, Poland and the U.K.; European mortgage operations; Resort Finance business; U.S. consumer property and casualty insurance business; International Insurance Services; Commercial Finance U.K. portfolio and North American factoring business Slide 22 • Tier 1 Common Capital is defined as Tier 1 Capital less elements of capital not in the form of common equity, including: Preferred Equity ($7.0 billion) and Trust Preferred Securities ($2.5 billion) • Tangible Common Equity is calculated as Shareholders’ Equity less Preferred Equity ($7.0 billion) less Goodwill and Intangible Assets ($0.5 billion) • Tangible Assets is calculated as Total Assets less Goodwill and Intangible Assets ($0.5 billion) Slide 34 • Included in Loans Held for Sale: Ally Bank Mortgage HFS, ResCap Mortgage HFS and Securitized Mortgage Assets and Other ($4,543) • Included in Finance Receivables and Loans, net (Consumer): Ally Bank Mortgage HFI and Securitized Mortgage Assets and Other ($4,543) • Included in Finance Receivables and Loans, net (Commercial): Commercial Auto, Commercial Mortgages and Commercial Asset Based Lending • Included in Other Assets: FV of Derivative Contracts, Restricted Cash/Collateral, Servicer Advances and Other ($5,696)