Ally Financial Inc . 2Q Earnings Review August 2, 2011 Contact Ally Investor Relations at (866) 710-4623 or investor .relations@ally .com

Forward -Looking Statements and Additional Information The following should be read in conjunction with the financial statements, notes and other information contained in the Company’s 2010 Annual Report on Form 10-K, Quarterly Reports on Form 10-Q, and Current Reports on Form 8-K. This information is preliminary and based on company data available at the time of the presentationIn the presentation that follows and related comments by Ally Financial Inc. (“Ally”) management, the use of the words “expect,” “anticipate,” “estimate,” “forecast,” “initiative,” “objective,” “plan,” “goal,” “project,” “outlook,” “priorities,” “target,” “intend,” “evaluate,” “pursue,” “seek,” “may,” “would,” “could,” “should,” “believe,” “potential,” “continue,” or similar expressions is intended to identify forward -looking statements . All statements herein and in related management comments, other than statements of historical fact, including without limitation, statements about future events and financial performance, are forward -looking statements that involve certain risks and uncertainties . While these statements represent our current judgment on what the future may hold, and we believe these judgments are reasonable, these statements are not guarantees of any events or financial results, and Ally’s actual results may differ materially due to numerous important factors that are described in the most recent reports on SEC Forms 10-K and 10-Q for Ally, each of which may be revised or supplemented in subsequent reports on SEC Forms 10-Q and 8-K. Such factors include, among others, the following: maintaining the mutually beneficial relationship between Ally and General Motors (“GM”), and Ally and Chrysler; the profitability and financial condition of GM and Chrysler; securing low cost funding for us and Residential Capital, LLC (“ResCap”); our ability to realize the anticipated benefits associated with being a bank holding company, and the increased regulation and restrictions that we are now subject to; any impact resulting from delayed foreclosure sales or related matters; the potential for legal liability resulting from claims related to the sale of private-label mortgage -backed securities; risks related to potential repurchase obligations due to alleged breaches of representations and warranties in mortgage securitization transactions; changes in U.S. government -sponsored mortgage programs or disruptions in the markets in which our mortgage subsidiaries operate; continued challenges in the residential mortgage markets; the continuing negative impact on ResCap and our mortgage business generally due to the recent decline in the U.S. housing market; uncertainty of our ability to enter into transactions or execute strategic alternatives to realize the value of our ResCap operations; the potential for deterioration in the residual value of off-lease vehicles; disruptions in the market in which we fund our operations, with resulting negative impact on our liquidity; changes in our accounting assumptions that may require or that result from changes in the accounting rules or their application, which could result in an impact on earnings; changes in the credit ratings of Ally, ResCap, Chrysler, or GM; changes in economic conditions, currency exchange rates or political stability in the markets in which we operate; and changes in the existing or the adoption of new laws, regulations, policies or other activities of governments, agencies and similar organizations (including as a result of the Dodd-Frank Act). Investors are cautioned not to place undue reliance on forward -looking statements . Ally undertakes no obligation to update publicly or otherwise revise any forward -looking statements except where expressly required by law. Reconciliation of non-GAAP financial measures included within this presentation are provided in this presentation . Use of the term “loans” describes products associated with direct and indirect lending activities of Ally’s global operations . The specific products include retail installment sales contracts, loans, lines of credit, leases or other financing products . The term “originate” refers to Ally’s purchase, acquisition or direct origination of various “loan” products . 2Q 2011 Preliminary Results 2
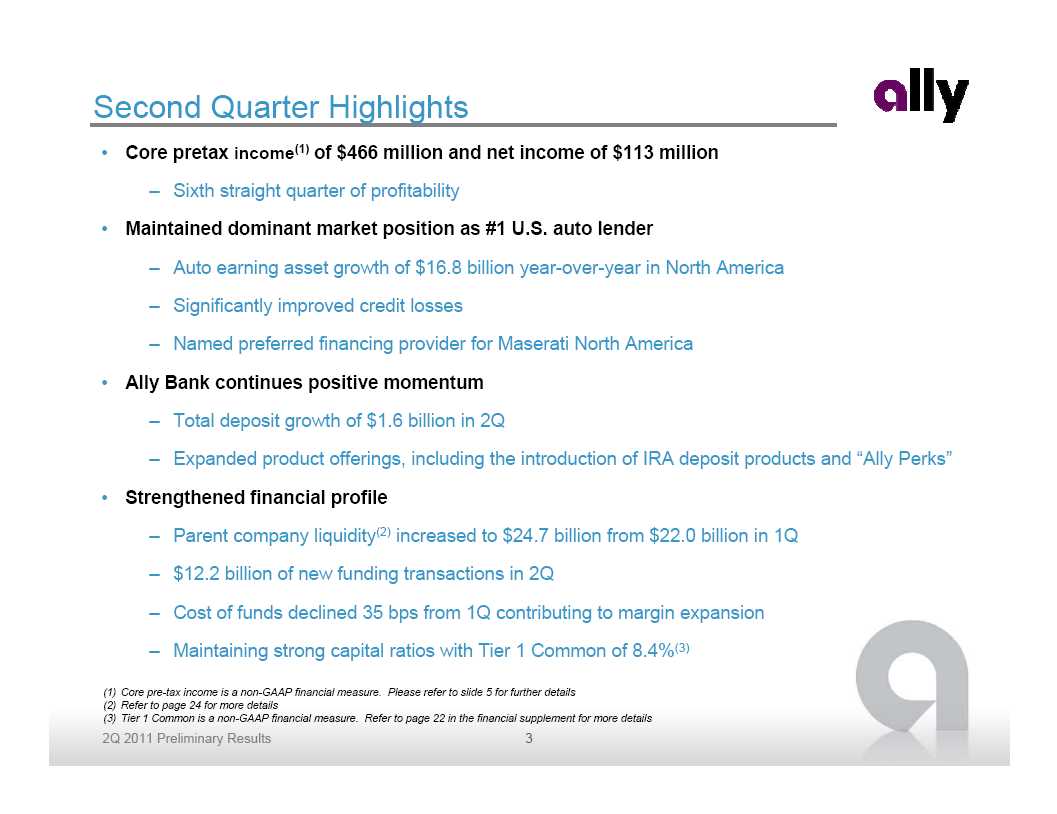
Second Quarter Highlights • Core pretax income (1) of $466 million and net income of $113 million – Sixth straight quarter of profitability • Maintained dominant market position as #1 U.S. auto lender – Auto earning asset growth of $16.8 billion year-over-year in North America – Significantly improved credit losses – Named preferred financing provider for Maserati North America • Ally Bank continues positive momentum – Total deposit growth of $1.6 billion in 2Q – Expanded product offerings, including the introduction of IRA deposit products and “Ally Perks” • Strengthened financial profile – Parent company liquidity (2) increased to $24.7 billion from $22.0 billion in 1Q – $12.2 billion of new funding transactions in 2Q – Cost of funds declined 35 bps from 1Q contributing to margin expansion – Maintaining strong capital ratios with Tier 1 Common of 8.4%(3) (1) Core pre-tax income is a non-GAAP financial measure. Please refer to slide 5 for further details (2) Refer to page 24 for more details (3) Tier 1 Common is a non-GAAP financial measure. Refer to page 22 in the financial supplement for more details2Q 2011 Preliminary Results 3
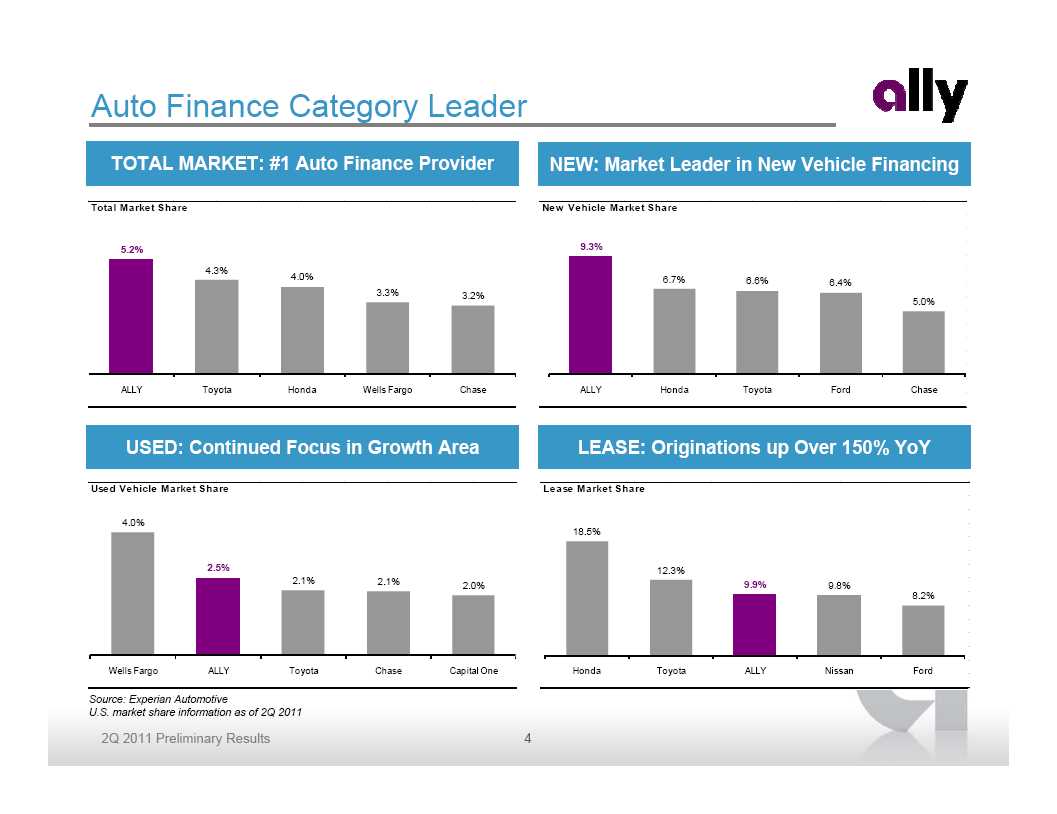
Auto Finance Category Leader TOTAL MARKET: #1 Auto Finance Provider NEW: Market Leader in New Vehicle Financing Total Market Share New Vehicle Market Share 12.0% 5.2% 10.0% 9.3% 4.3% 8.0% 4.0% 6.7% 6.6% 6.4% 3.3% 3.2% 6.0% 5.0% 4.0% 2.0% 0.0% ALLY Toyota Honda Wells Fargo Chase ALLY Honda Toyota Ford Chase USED: Continued Focus in Growth Area LEASE: Originations up Over 150% YoY Used Vehicle Market Share Lease Market Share 24.0% 4.0% 22.0% 20.0% 18.5% 18.0% 16.0% 2.5% 14.0% 12.3% 2.1% 2.1% 12.0% 9.9% 2.0% 9.8% 10.0% 8.2% 8.0% 6.0% 4.0% 2.0% 0.0% Wells Fargo ALLY Toyota Chase Capital One Honda Toyota ALLY Nissan Ford Source: Experian Automotive U.S. market share information as of 2Q 20112Q 2011 Preliminary Results 4
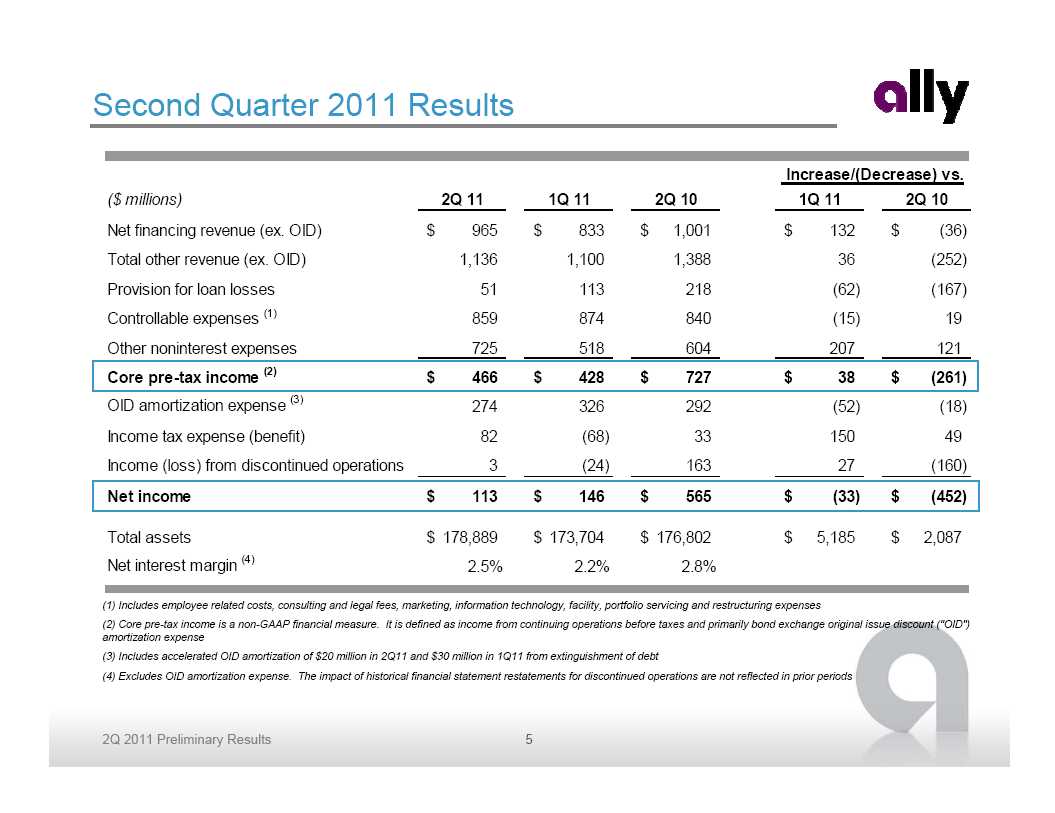
Second Quarter 2011 Results Increase/(Decrease) vs. ($ millions) 2Q 11 1Q 11 2Q 10 1Q 11 2Q 10 Net financing revenue (ex. OID) $ 965 $ 833 $ 1,001 $ 132 $ (36) Total other revenue (ex. OID) 1,136 1,100 1,388 36 (252) Provision for loan losses 51 113 218 (62) (167) Controllable expenses (1) 859 874 840 (15) 19 Other noninterest expenses 725 518 604 207 121 Core pre-tax income (2) $ 466 $ 428 $ 727 $ 38 $ (261) OID amortization expense (3) 274 326 292 (52) (18) Income tax expense (benefit) 82 (68) 33 150 49 Income (loss) from discontinued operations 3 (24) 163 27 (160) Net income $ 113 $ 146 $ 565 $ (33) $ (452) Total assets $ 178,889 $ 173,704 $ 176,802 $ 5,185 $ 2,087 Net interest margin (4) 2.5% 2.2% 2.8% (1) Includes employee related costs, consulting and legal fees, marketing, information technology, facility, portfolio servicing and restructuring expenses (2) Core pre-tax income is a non-GAAP financial measure. It is defined as income from continuing operations before taxes and primarily bond exchange original issue discount ("OID") amortization expense (3) Includes accelerated OID amortization of $20 million in 2Q11 and $30 million in 1Q11 from extinguishment of debt (4) Excludes OID amortization expense. The impact of historical financial statement restatements for discontinued operations are not reflected in prior periods2Q 2011 Preliminary Results 5

Results by Segment • Positive credit trends and asset growth in Global Automotive Services – Partially offset by weather losses in Insurance • Mortgage Operations impacted by legacy repurchase expense • Corporate and Other favorable due to lower funding costs and early settlement of a loss holdback provision under certain historical auto whole-loan forward flow agreements Pre-Tax Income Increase/(Decrease) vs ($ millions) 2Q 11 1Q 11 2Q 10 1Q 11 2Q 10 North American Automotive Finance $ 559 $ 518 $ 592 $ 41 $ (33) International Automotive Finance 71 40 95 31 (24) Insurance 73 134 108 (61) (35) Global Automotive Services $ 703 $ 692 $ 795 $ 11 $ (92) Mortgage Origination and Servicing 47 73 249 (26) (202) Legacy Portfolio and Other (1) (174) (39) (19) (135) (155) Mortgage Operations $ (127) $ 34 $ 230 $ (161) $ (357) Corporate and Other (ex. OID) (2) (110) (298) (298) 188 188 Core pre-tax income (3) $ 466 $ 428 $ 727 $ 38 $ (261) (1) Legacy Portfolio and Other segment primarily consists of loans originated prior to Jan. 1, 2009, and includes non-core business activities including portfolios in run off (2) Corporate and Other as presented includes Commercial Finance Group (“CFG”), certain equity investments and treasury activities including the residual impacts from the corporate funds transfer pricing and asset liability management (“ALM”) activities (3) Core pre-tax income is a non-GAAP financial measure. Please refer to slide 5 for further details2Q 2011 Preliminary Results 6
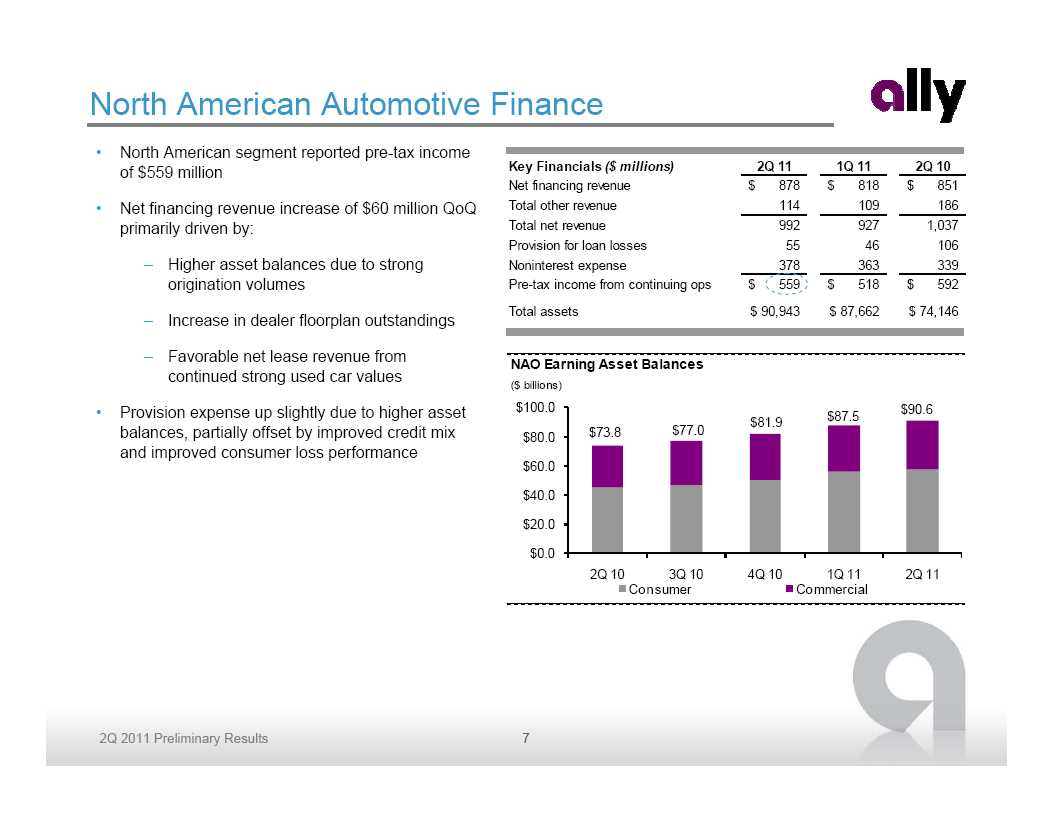
North American Automotive Finance • North American segment reported pre-tax income of $559 million Key Financials ($ millions) 2Q 11 1Q 11 2Q 10 Net financing revenue $ 878 $ 818 $ 851 • Net financing revenue increase of $60 million QoQ Total other revenue 114 109 186 primarily driven by: Total net revenue 992 927 1,037 Provision for loan losses 55 46 106 – Higher asset balances due to strong Noninterest expense 378 363 339 origination volumes Pre-tax income from continuing ops $ 559 $ 518 $ 592 Total assets $ 90,943 $ 87,662 $ 74,146 – Increase in dealer floorplan outstandings – Favorable net lease revenue from NAO Earning Asset Balancescontinued strong used car values ($ billions) • Provision expense up slightly due to higher asset $100.0 $90.6 $81.9 $87.5 balances, partially offset by improved credit mix $73.8 $77.0 $80.0 and improved consumer loss performance $60.0 $40.0 $20.0 $0.0 2Q 10 3Q 10 4Q 10 1Q 11 2Q 11 Consumer Commercial 2Q 2011 Preliminary Results 7

U.S. Auto Originations • Strong growth in originations year-over-year U.S. Consumer Originations Inc/(Dec) vs. – Diversified originations up 118% YoY ($ billions) 2Q 11 1Q 11 2Q 10 2Q 10 GM Retail Subvented $ 1.4 $ 1.8 $ 1.6 -13% – Lease originations up 155% YoY GM Retail Standard 2.1 3.3 2.0 6% Chrysler Retail Subvented 0.5 0.5 1.3 -63% – Used originations up 74% YoY Chrysler Retail Standard 0.9 1.0 0.9 0% Diversified New 0.4 0.5 0.2 118% • Total originations down from 1Q as expected due Lease (1) 2.1 2.2 0.8 155% to reduction in OEM marketing programs Used 2.1 2.3 1.2 74% Total $ 9.5 $ 11.6 $ 8.0 18% – GM retail penetration returning to (1) Includes GM and Chrysler lease originations normalized levels U.S. Originations - Select Segments U.S. Penetration Rates($ billions) 100% 5.0 $4.3 $4.4 GM Floorplan 4.0 75% Chrysler Floorplan 3.0 $2.2 50% 2.0 $1.5 GM Consumer $0.8 25% Chrysler Consumer 1.0 $0.3 0.0 0% Diversified New Lease Used 2Q 10 3Q 10 4Q 10 1Q 11 2Q11 1H 2010 1H 2011 2Q 2011 Preliminary Results 8

International Automotive Finance • International operations earned $71 million of pre-tax income compared to $40 million in 1Q Key Financials ($ millions) 2Q 11 1Q 11 2Q 10 Net financing revenue $ 176 $ 171 $ 173 – Provision expense favorable driven by a Total other revenue 65 75 85 1Q reserve build that did not repeat Total net revenue 241 246 258 Provision for loan losses 7 37 9 • Originations up 19% QoQ and 38% YoY Noninterest expense 163 169 154 Pre-tax income from continuing ops $ 71 $ 40 $ 95 – 70% growth in Germany originations QoQ Total assets $ 16,582 $ 16,295 $ 16,596 driven by successful Opel marketing programs International Consumer Auto Originations (Continuing Operations) – China originations up 22% QoQ ($ billions) $3.0 $2.5 GM market share gains and increase in $2.5 $2.3 $2.0 $1.9 diversified volume $2.0 $1.6 $1.5 1Q11 lower due to seasonality $1.0 $0.5 $0.0 2Q 10 3Q 10 4Q 10 1Q 11 2Q 11 China Brazil Germany U.K. Mexico Other Note: Originations in China part of a joint-venture in which Ally owns a minority interest2Q 2011 Preliminary Results 9
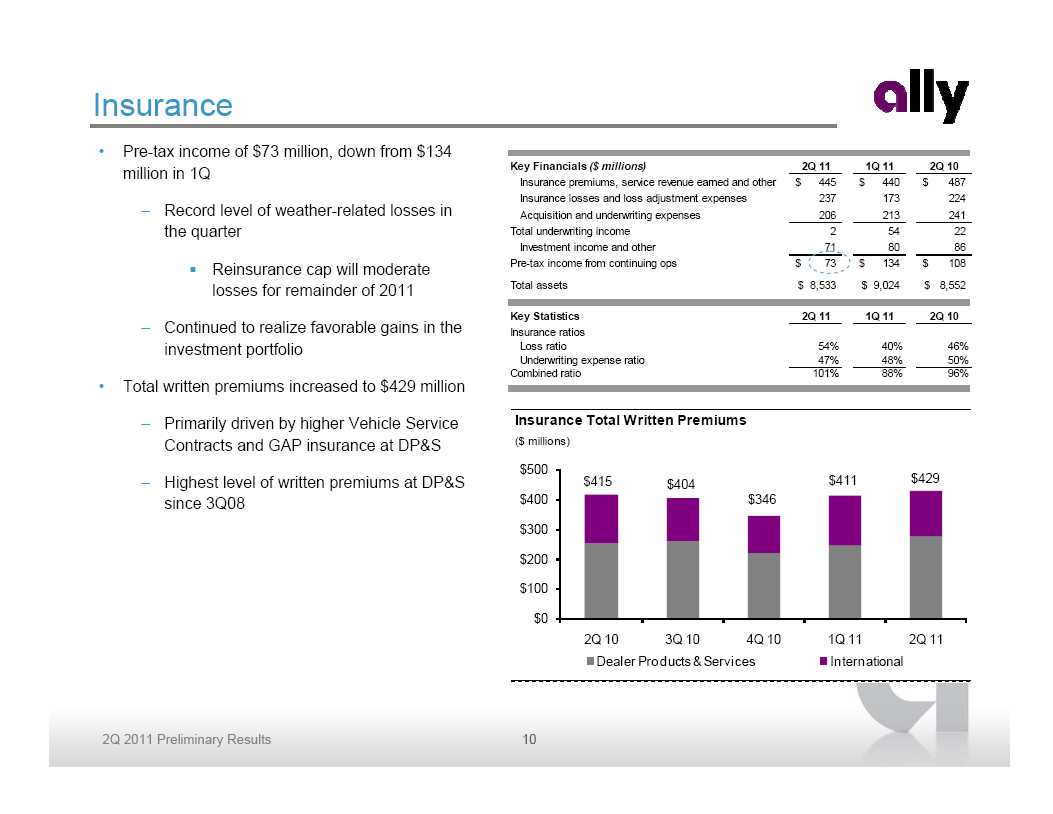
Insurance • Pre-tax income of $73 million, down from $134 million in 1Q Key Financials ($ millions) 2Q 11 1Q 11 2Q 10 Insurance premiums, service revenue earned and other $ 445 $ 440 $ 487 Insurance losses and loss adjustment expenses 237 173 224 – Record level of weather -related losses in Acquisition and underwriting expenses 206 213 241 the quarter Total underwriting income 2 54 22 Investment income and other 71 80 86 Reinsurance cap will moderate Pre-tax income from continuing ops $ 73 $ 134 $ 108 losses for remainder of 2011 Total assets $ 8,533 $ 9,024 $ 8,552 Key Statistics 2Q 11 1Q 11 2Q 10 – Continued to realize favorable gains in the Insurance ratios investment portfolio Loss ratio 54% 40% 46% Underwriting expense ratio 47% 48% 50% Combined ratio 101% 88% 96% • Total written premiums increased to $429 million – Primarily driven by higher Vehicle Service Insurance Total Written PremiumsContracts and GAP insurance at DP&S ($ millions) $500 – Highest level of written premiums at DP&S $415 $411 $429 $404 since 3Q08 $400 $346 $300 $200 $100 $0 2Q 10 3Q 10 4Q 10 1Q 11 2Q 11 Dealer Products & Services International 2Q 2011 Preliminary Results 10

Mortgage Operations – Origination and Servicing • Origination and Servicing earned $47 million of Key Financials ($ millions) 2Q 11 1Q 11 2Q 10 pre-tax income Net financing revenue $ (18) $ (30) $ (18) Gain on sale of mortgage loans, net 62 74 102 • Gain on sale down from 1Q primarily due to Other revenue (excluding gain on sale) 260 277 357 lower margins driven by market technicals Total net revenue 304 321 441 Provision for loan losses - 2 (35) • Loan production of $12.6 billion is up from $12.2 Noninterest expense 257 246 227 billion in 1Q, but down from $13.5 billion in 2Q10 Pre-tax income from continuing ops $ 47 $ 73 $ 249 – Non-correspondent originations increased Total assets $ 20,010 $ 19,164 $ 20,014 Primary servicing - EOP ($ billions) $ 360 $ 359 $ 353 to 17%, up from 13% in 1Q and 11% in 2Q10 ($ millions) 2Q 11 1Q 11 2Q 10 Servicing fees $ 313 $ 327 $ 331 • Servicing revenue impacted by regular MSR Servicing asset valuation, net of hedge (105) (87) (21) valuation adjustments Net servicing revenue $ 208 $ 240 $ 310 • Submitted response to Consent Order to the Origination and Servicing Mortgage Loan ProductionFederal Reserve and other U.S. regulators on ($ billions) July 12 $30 – Continued focus on home preservation $23.8 $25 $20.5 and loan modification leadership $20 $13.5 $12.2 $12.6 $15 $10 $5 $0 2Q 10 3Q 10 4Q 10 1Q 11 2Q 11 Prime Conforming Government Prime Non-Conforming Other 2Q 2011 Preliminary Results 11
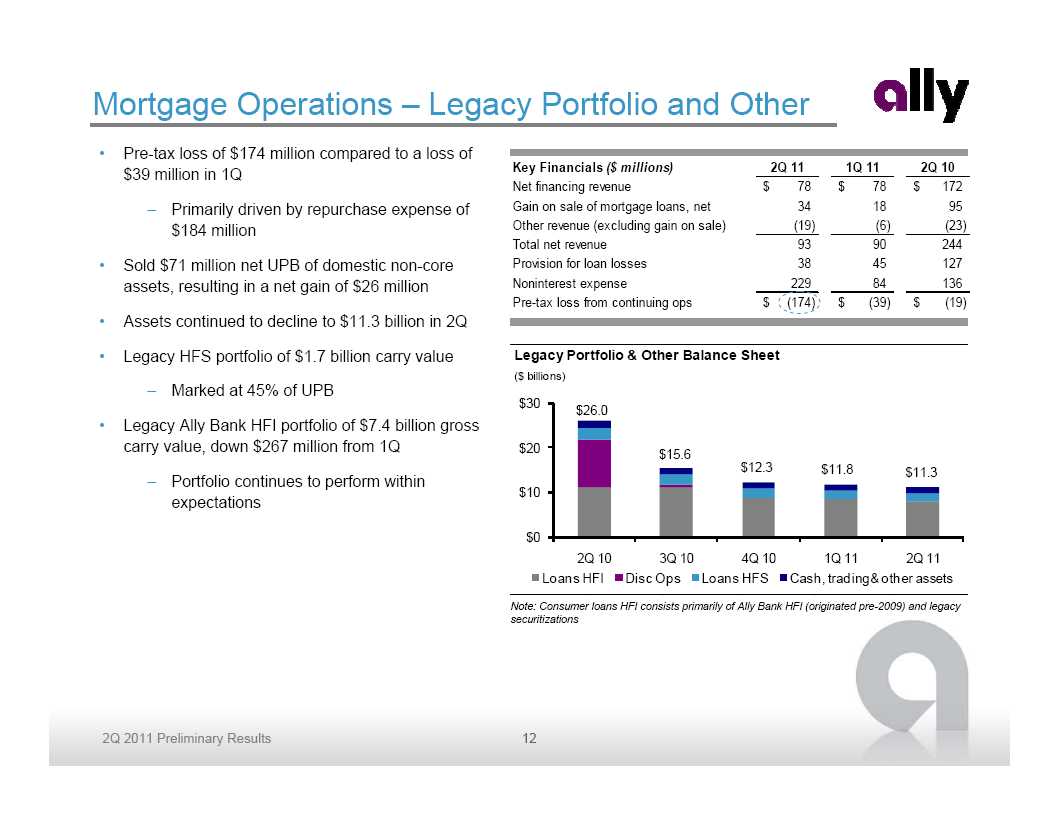
Mortgage Operations – Legacy Portfolio and Other • Pre-tax loss of $174 million compared to a loss of $39 million in 1Q Key Financials ($ millions) 2Q 11 1Q 11 2Q 10 Net financing revenue $ 78 $ 78 $ 172 – Primarily driven by repurchase expense of Gain on sale of mortgage loans, net 34 18 95 $184 million Other revenue (excluding gain on sale) (19) (6) (23) Total net revenue 93 90 244 • Sold $71 million net UPB of domestic non-core Provision for loan losses 38 45 127 assets, resulting in a net gain of $26 million Noninterest expense 229 84 136 Pre-tax loss from continuing ops $ (174) $ (39) $ (19) • Assets continued to decline to $11.3 billion in 2Q • Legacy HFS portfolio of $1.7 billion carry value Legacy Portfolio & Other Balance Sheet ($ billions) – Marked at 45% of UPB $30 $26.0 • Legacy Ally Bank HFI portfolio of $7.4 billion gross carry value, down $267 million from 1Q $20 $15.6 $12.3 $11.8 $11.3 – Portfolio continues to perform within $10 expectations $0 2Q 10 3Q 10 4Q 10 1Q 11 2Q 11 Loans HFI Disc Ops Loans HFS Cash, trading & other assets Note: Consumer loans HFI consists primarily of Ally Bank HFI (originated pre-2009) and legacy securitizations2Q 2011 Preliminary Results 12
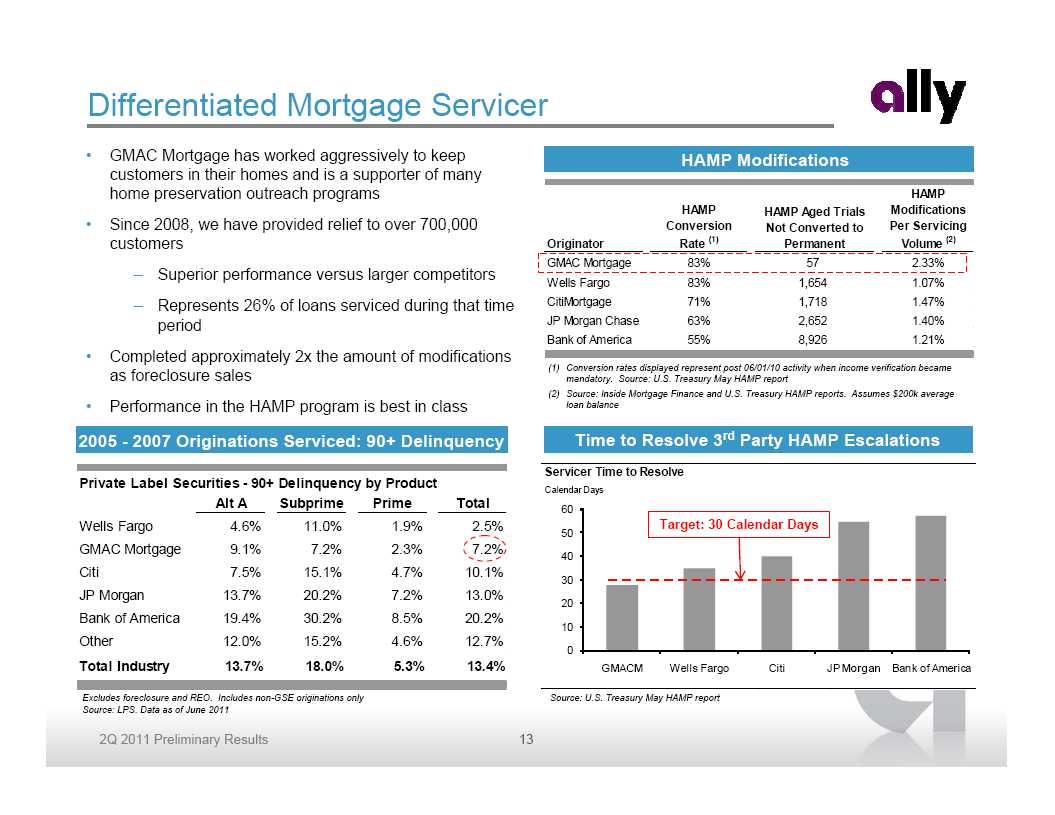
Differentiated Mortgage Servicer • GMAC Mortgage has worked aggressively to keep HAMP Modifications customers in their homes and is a supporter of many home preservation outreach programs HAMP HAMP HAMP Aged Trials Modifications • Since 2008, we have provided relief to over 700,000 Conversion Not Converted to Per Servicing customers Originator Rate (1) Permanent Volume (2) GMAC Mortgage 83% 57 2.33% – Superior performance versus larger competitors Wells Fargo 83% 1,654 1.07% – Represents 26% of loans serviced during that time CitiMortgage 71% 1,718 1.47% period JP Morgan Chase 63% 2,652 1.40% Bank of America 55% 8,926 1.21% • Completed approximately 2x the amount of modifications as foreclosure sales (1) Conversion rates displayed represent post 06/01/10 activity when income verification became mandatory. Source: U.S. Treasury May HAMP report (2) Source: Inside Mortgage Finance and U.S. Treasury HAMP reports. Assumes $200k average • Performance in the HAMP program is best in class loan balance 2005 - 2007 Originations Serviced: 90+ Delinquency Time to Resolve 3rd Party HAMP Escalations Servicer Time to Resolve Private Label Securities - 90+ Delinquency by Product Calendar Days Alt A Subprime Prime Total 60 Wells Fargo 4.6% 11.0% 1.9% 2.5% Target: 30 Calendar Days 50 GMAC Mortgage 9.1% 7.2% 2.3% 7.2% 40 Citi 7.5% 15.1% 4.7% 10.1% 30 JP Morgan 13.7% 20.2% 7.2% 13.0% 20 Bank of America 19.4% 30.2% 8.5% 20.2% 10 Other 12.0% 15.2% 4.6% 12.7% 0 Total Industry 13.7% 18.0% 5.3% 13.4% GMACM Wells Fargo Citi JP Morgan Bank of America Excludes foreclosure and REO. Includes non-GSE originations only Source: U.S. Treasury May HAMP report Source: LPS. Data as of June 20112Q 2011 Preliminary Results 13
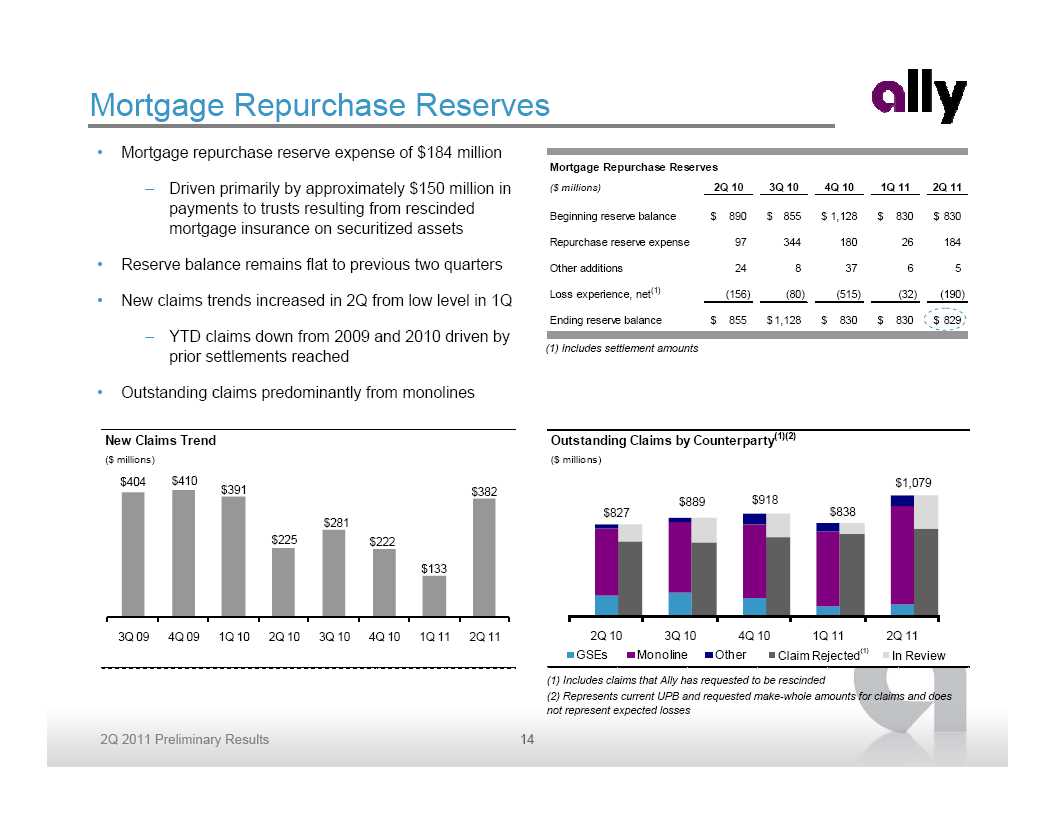
Mortgage Repurchase Reserves • Mortgage repurchase reserve expense of $184 million Mortgage Repurchase Reserves – Driven primarily by approximately $150 million in ($ millions) 2Q 10 3Q 10 4Q 10 1Q 11 2Q 11 payments to trusts resulting from rescinded Beginning reserve balance $ 890 $ 855 $ 1,128 $ 830 $ 830 mortgage insurance on securitized assets Repurchase reserve expense 97 344 180 26 184 • Reserve balance remains flat to previous two quarters Other additions 24 8 37 6 5 • New claims trends increased in 2Q from low level in 1Q Loss experience, net(1) (156) (80) (515) (32) (190) Ending reserve balance $ 855 $ 1,128 $ 830 $ 830 $ 829 – YTD claims down from 2009 and 2010 driven by (1) Includes settlement amounts prior settlements reached • Outstanding claims predominantly from monolines New Claims Trend Outstanding Claims by Counterparty (1)(2) ($ millions) ($ millions) $404 $410 $1,079 $391 $382 $889 $918 $827 $838 $281 $225 $222 $133 3Q 09 4Q 09 1Q 10 2Q 10 3Q 10 4Q 10 1Q 11 2Q 11 2Q 10 2Q 10 3Q 10 3Q 10 4Q 10 4Q 10 1Q 11 1Q 11 2Q 11 2Q 11 GSEs Monoline Other Claim Rejected(1) In Review (1) Includes claims that Ally has requested to be rescinded (2) Represents current UPB and requested make-whole amounts for claims and does not represent expected losses2Q 2011 Preliminary Results 14
Proactive Approach to Legacy Mortgage Risk • Ally has consistently taken a proactive approach to addressing legacy mortgage risk: – Began substantial repurchase reserve build in 2009 – Marked riskier balance sheet assets to market in December 2009 – Reached comprehensive settlements with Fannie Mae (December 2010) and Freddie Mac (March 2010) Total losses of 0.74% of covered Original UPB Covers past, present and future claims Fannie Mae settlement covered our exposure in private label securitizations – Reached settlements with five whole loan counterparties – Aggressively and proactively addressing foreclosure affidavit issue • Private label repurchase risk is notably different than GSE experience:– Representations and warranties less stringent and disclosure tailored to specific loan pools – Logistical hurdles – Significant upfront cost with uncertain return – Timeline could be lengthy – Collateral segregated into different programs to highlight risks 2Q 2011 Preliminary Results 15
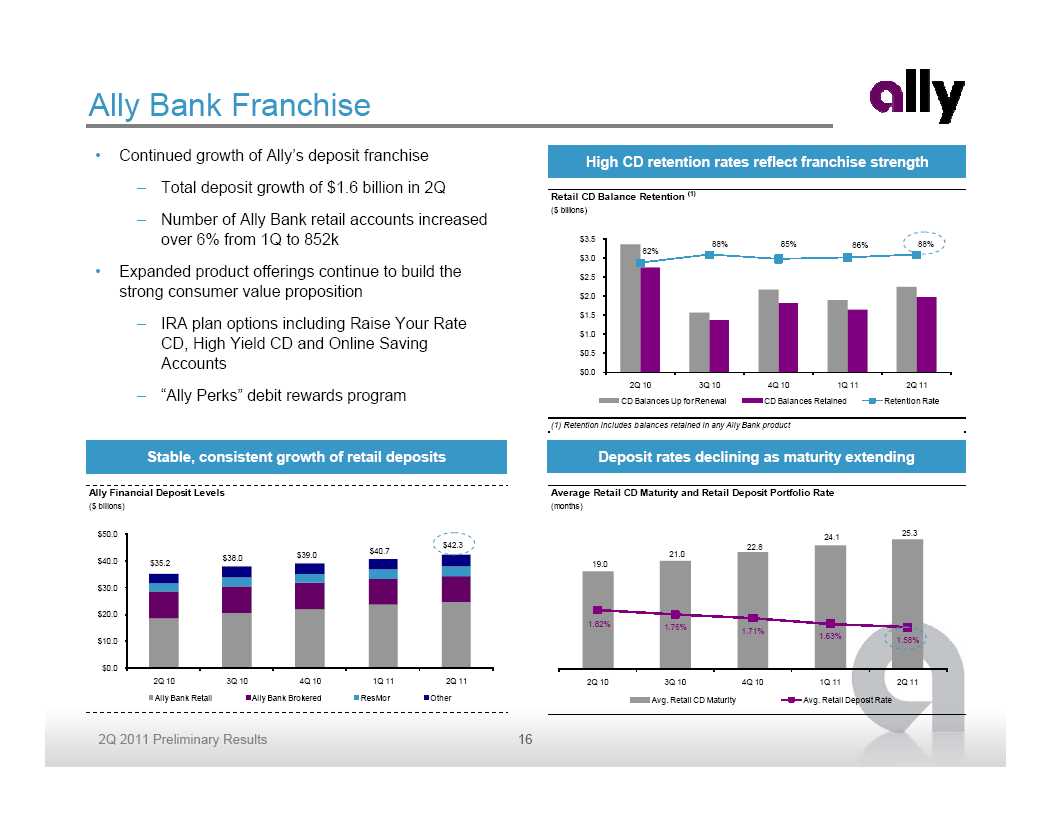
Ally Bank Franchise • Continued growth of Ally’s deposit franchise High CD retention rates reflect franchise strength – Total deposit growth of $1.6 billion in 2Q Retail CD Balance Retention (1) ($ billions) – Number of Ally Bank retail accounts increased over 6% from 1Q to 852k $3.5 88% 85% 86% 88% 82% $3.0 • Expanded product offerings continue to build the FHLB $2.5 Borrowin g strong consumer value proposition $2.0 10%Br $1.5 – IRA plan options including Raise Your Rate $1.0 CD, High Yield CD and Online Saving $0.5 Accounts $0.0 2Q 10 3Q 10 4Q 10 1Q 11 2Q 11 – “Ally Perks” debit rewards program CD Balances Up for Renewal CD Balances Retained Retention Rate (1) Retention includes balances retained in any Ally Bank product Stable, consistent growth of retail deposits Deposit rates declining as maturity extending Ally Financial Deposit Levels Average Retail CD Maturity and Retail Deposit Portfolio Rate($ billions) (months) $50.0 25.3 24.1 $42.3 22.8 $40.7 21.0 $38.0 $39.0 $40.0 $35.2 19.0 $30.0 $20.0 1.82% 1.76% 1.71% 1.63% 1.58% $10.0 $0.0 2Q 10 3Q 10 4Q 10 1Q 11 2Q 11 2Q 10 3Q 10 4Q 10 1Q 11 2Q 11 Ally Bank Retail Ally Bank Brokered ResMor Other Avg. Retail CD Maturity Avg. Retail Deposit Rate 2Q 2011 Preliminary Results 16
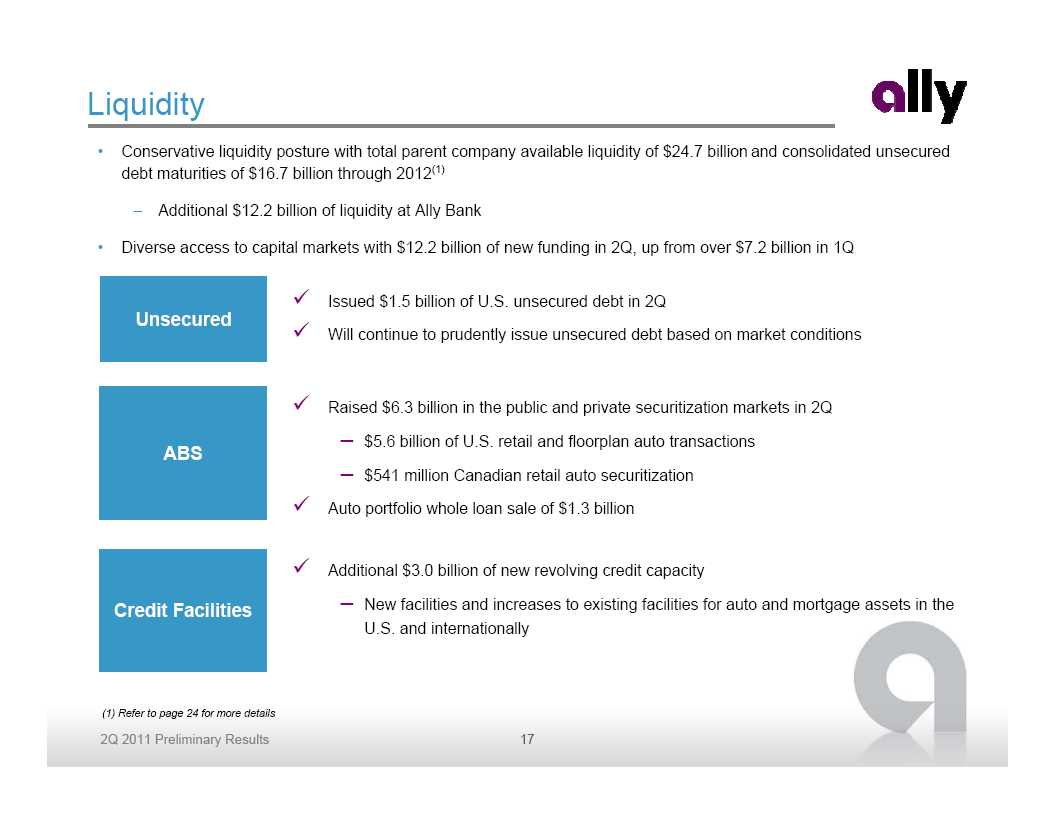
Liquidity • Conservative liquidity posture with total parent company available liquidity of $24.7 billion and consolidated unsecured debt maturities of $16.7 billion through 2012(1) – Additional $12.2 billion of liquidity at Ally Bank • Diverse access to capital markets with $12.2 billion of new funding in 2Q, up from over $7.2 billion in 1Q 9 Issued $1.5 billion of U.S. unsecured debt in 2Q Unsecured 9 Will continue to prudently issue unsecured debt based on market conditions 9 Raised $6.3 billion in the public and private securitization markets in 2Q – $5.6 billion of U.S. retail and floorplan auto transactions ABS – $541 million Canadian retail auto securitization 9 Auto portfolio whole loan sale of $1.3 billion 9 Additional $3.0 billion of new revolving credit capacity Credit Facilities – New facilities and increases to existing facilities for auto and mortgage assets in the U.S. and internationally (1) Refer to page 24 for more details2Q 2011 Preliminary Results 17

Capital • Capital ratios remain among the highest in the industry – Ratios slightly lower due to increase in risk-weighted assets, driven by strong growth in auto originations • Ally is well positioned to achieve the enhanced Basel III capital requirements in advance of the proposed timelines – Estimated 2Q 2011 Basel III Tier 1 Common Ratio of 10.8% on a fully converted basis(1) ($ billions) 6/30/2011 3/31/2011 6/30/2010 Tier 1 Capital $ 22.1 $ 22.1 $ 22.4 Tier 1 Common Capital $ 12.6 $ 12.7 $ 7.7 Total Risk-Based Capital $ 24.0 $ 24.1 $ 24.6 Tangible Common Equity $ 13.0 $ 12.9 $ 8.1 Tangible Assets $ 178.4 $ 173.2 $ 176.3 Risk-Weighted Assets $ 151.0 $ 150.8 $ 146.2 Tier 1 Capital Ratio 14.6% 14.7% 15.3% Tier 1 Common Capital Ratio 8.4% 8.4% 5.2% Total Risk-Based Capital Ratio 15.9% 16.0% 16.8% Tangible Common Equity / Tangible Assets 7.3% 7.5% 4.6% Tangible Common Equity / Risk-Weighted Assets 8.6% 8.6% 5.5% Note: Tier 1 Common and Tangible Common Equity are non-GAAP financial measures . Refer to page 22 of the financial supplement for additional details (1) Pro forma calculation assumes full conversion of remaining MCP to common equity and is based on management’s current interpretation of Basel III capital proposals. This pro forma calculation is subject to change depending on final Basel III rulemaking and interpretations thereof by regulatory authorities.2Q 2011 Preliminary Results 18

Asset Quality: Summary • Positive credit quality trends continue • Continue to maintain strong allowance coverage ratios relative to net charge -offs and non-performing loans – Over 3.5x coverage of net charge -offs • Loan balance continues to grow driven by strong auto originations Ally Financial Consolidated (1) ($ millions) 2Q11 1Q 11 4Q 10 3Q 10 2Q 10 Ending Loan Balance $ 109,779 $ 106,488 $ 101,398 $ 95,770 $ 90,371 30+ Accruing DPD 979 963 1,114 1,173 1,380 30+ Accruing DPD % 0.9% 0.9% 1.1% 1.2% 1.5% Non-Performing Loans (NPLs) 1,191 1,244 1,508 1,592 2,294 Net Charge -Offs (NCOs) 121 189 240 334 307 Net Charge -Off Rate (2) 0.4% 0.7% 1.0% 1.4% 1.4% Provision Expense 51 113 71 9 218 Allowance Balance (ALLL) 1,739 1,806 1,873 2,054 2,377 ALLL as % of Loans (3) 1.6% 1.7% 1.8% 2.1% 2.6% ALLL as % of NPLs (3) 146.0% 145.2% 124.3% 129.0% 103.6% ALLL as % of NCOs (3) 358.0% 239.1% 194.8% 153.8% 193.3% (1) Loans within this table are classified as held-for-investment recorded at historical cost as these loans are included in our allowance for loan losses (2) Net charge-off ratios are calculated as annualized net charge-offs divided by average outstanding finance receivables and loans excluding loans measured at fair value and loans held-for-sale (3) ALLL coverage ratios are based on the allowance for loan losses related to loans held-for-investment excluding those loans held at fair value as a percentage of the unpaid principal balance, net of premiums and discounts2Q 2011 Preliminary Results 19
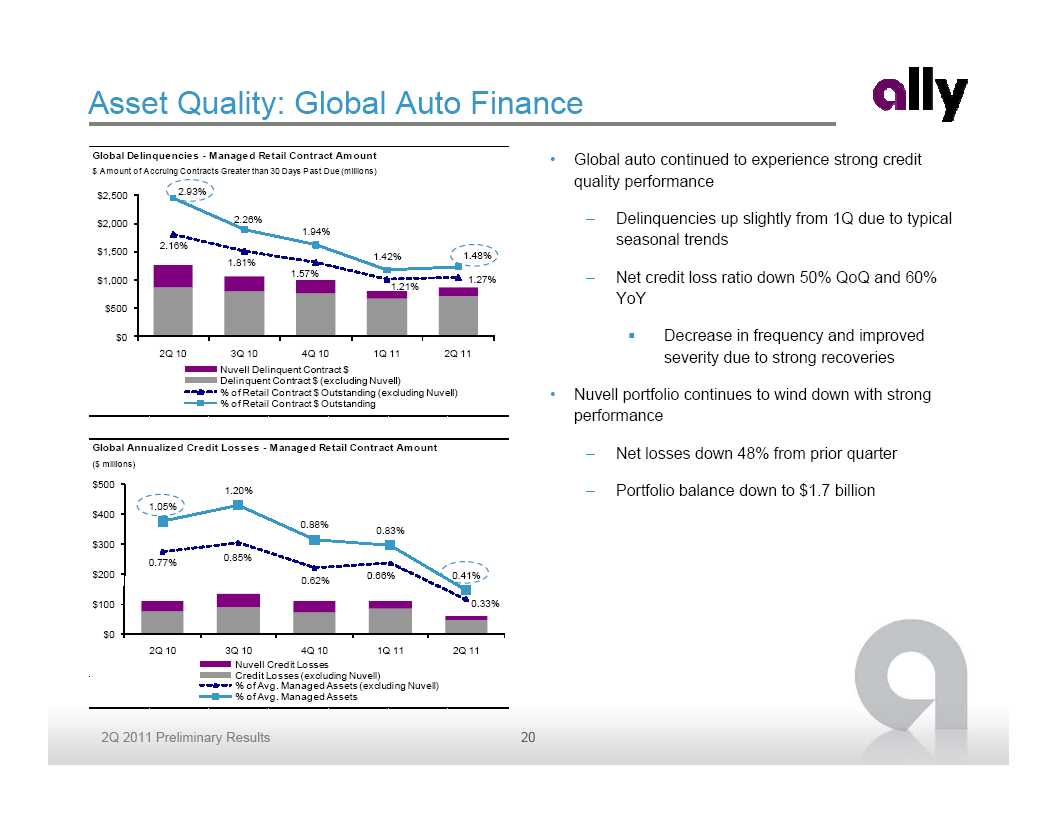
Asset Quality: Global Auto Finance Global Delinquencies - Managed Retail Contract Amount • Global auto continued to experience strong credit $ Amount of Accruing Contracts Greater than 30 Days Past Due (millions) quality performance $2,500 2.93% $2,000 2.26% – Delinquencies up slightly from 1Q due to typical 1.94% 2.16% seasonal trends $1,500 1.42% 1.48% 1.81% 1.57% – Net credit loss ratio down 50% QoQ and 60% $1,000 1.27% 1.21% YoY $500 $0 Decrease in frequency and improved 2Q 10 3Q 10 4Q 10 1Q 11 2Q 11 severity due to strong recoveries Nuvell Delinquent Contract $ Delinquent Contract $ (excluding Nuvell) % of Retail Contract $ Outstanding (excluding Nuvell) • Nuvell portfolio continues to wind down with strong % of Retail Contract $ Outstanding performance Global Annualized Credit Losses - Managed Retail Contract Amount– Net losses down 48% from prior quarter ($ millions) $500 1.20% – Portfolio balance down to $1.7 billion 1.05% $400 0.88% 0.83% $300 0.85% 0.77% $200 0.66% 0.41% 0.62% $100 0.33% $0 2Q 10 3Q 10 4Q 10 1Q 11 2Q 11 Nuvell Credit Losses Credit Losses (excluding Nuvell) % of Avg. Managed Assets (excluding Nuvell) % of Avg. Managed Assets 2Q 2011 Preliminary Results 20
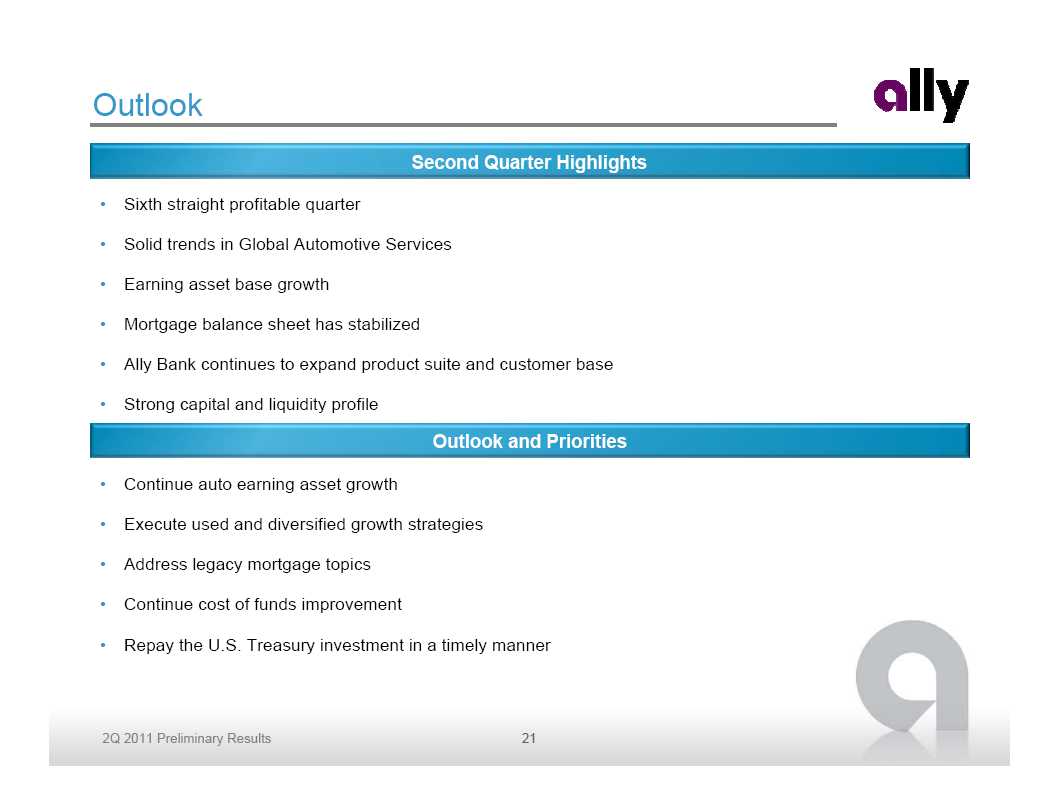
Outlook Second Quarter Highlights • Sixth straight profitable quarter • Solid trends in Global Automotive Services • Earning asset base growth • Mortgage balance sheet has stabilized • Ally Bank continues to expand product suite and customer base • Strong capital and liquidity profile Outlook and Priorities• Continue auto earning asset growth • Execute used and diversified growth strategies • Address legacy mortgage topics • Continue cost of funds improvement • Repay the U.S. Treasury investment in a timely manner 2Q 2011 Preliminary Results 21
Supplemental Charts
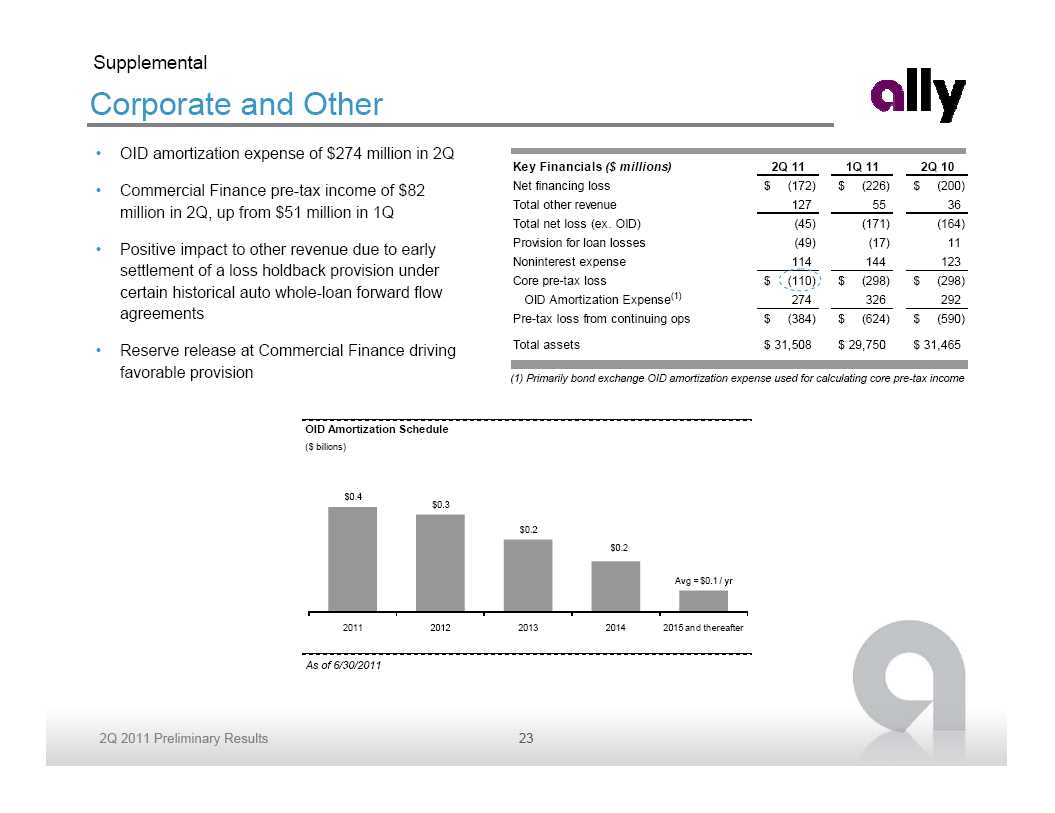
Supplemental Corporate and Other • OID amortization expense of $274 million in 2Q Key Financials ($ millions) 2Q 11 1Q 11 2Q 10 • Commercial Finance pre-tax income of $82 Net financing loss $ (172) $ (226) $ (200) Total other revenue 127 55 36 million in 2Q, up from $51 million in 1Q Total net loss (ex. OID) (45) (171) (164) • Positive impact to other revenue due to early Provision for loan losses (49) (17) 11 Noninterest expense 114 144 123 settlement of a loss holdback provision under Core pre-tax loss $ (110) $ (298) $ (298) certain historical auto whole -loan forward flow (1) OID Amortization Expense 274 326 292 agreements Pre-tax loss from continuing ops $ (384) $ (624) $ (590) • Reserve release at Commercial Finance driving Total assets $ 31,508 $ 29,750 $ 31,465 favorable provision (1) Primarily bond exchange OID amortization expense used for calculating core pre-tax income OID Amortization Schedule ($ billions) $0.4 $0.3 $0.2 $0.2 Avg = $0.1 / yr 2011 2012 2013 2014 2015 and thereafter As of 6/30/20112Q 2011 Preliminary Results 23

Supplemental Liquidity and Unsecured Debt Maturity Profile Available Liquidity 6/30/2011 3/31/2011 ($ billions) Parent (1) Ally Bank Parent (1) Ally Bank Cash and Cash Equivalents $ 9.5 $ 3.6 $ 7.6 $ 3.7 Unencumbered Securities (2) 0.9 5.8 1.2 5.1 Current Committed Unused Capacity (3) 12.0 5.1 10.9 4.9 Subtotal $ 22.4 $ 14.5 $ 19.7 $ 13.7 Ally Bank Intercompany Loan(4) 2.3 (2.3) 2.3 (2.3) Total Available Liquidity $ 24.7 $ 12.2 $ 22.0 $ 11.5 (1) Parent defined as Ally Consolidated less Ally Bank, ResCap (not shown) and Insurance (not shown) (2) Includes UST, Agency debt and Agency MBS (3) Includes equal allocation of shared unused capacity totaling $3.96 billion in 2Q and $3.93 billion in 1Q, which can be used by Ally Bank or the Parent (including international subsidiaries) (4) To optimize use of cash and secured facility capacity between entities, Ally Financial lends cash to Ally Bank from time to time under an intercompany loan agreement . Amounts outstanding on this loan are repayable to Ally Financial at any time, subject to 5 days notice Ally Financial Inc. Consolidated Unsecured Long-Term Debt Maturity Profile ($ billions) $20 $12 $4 $6 $4 $2 2011 2012 2013 2014 2015 2016 and thereafter As of 6/30/2011 2Q 2011 Preliminary Results 24