Ally Financial Inc . 3Q Earnings Review November 2, 2011 Contact Ally Investor Relations at (866) 710-4623 or investor .relations@ally .com
Forward -Looking Statements and Additional Information The following should be read in conjunction with the financial statements, notes and other information contained in the Company’s 2010 Annual Report on Form 10-K, Quarterly Reports on Form 10-Q, and Current Reports on Form 8-K. This information is preliminary and based on company data available at the time of the presentation In the presentation that follows and related comments by Ally Financial Inc. (“Ally”) management, the use of the words “expect,” “anticipate,” “estimate,” “forecast,” “initiative,” “objective,” “plan,” “goal,” “project,” “outlook,” “priorities,” “target,” “intend,” “evaluate,” “pursue,” “seek,” “may,” “would,” “could,” “should,” “believe,” “potential,” “continue,” or similar expressions is intended to identify forward -looking statements . All statements herein and in related management comments, other than statements of historical fact, including without limitation, statements about future events and financial performance, are forward -looking statements that involve certain risks and uncertainties . While these statements represent our current judgment on what the future may hold, and we believe these judgments are reasonable, these statements are not guarantees of any events or financial results, and Ally’s actual results may differ materially due to numerous important factors that are described in the most recent reports on SEC Forms 10-K and 10-Q for Ally, each of which may be revised or supplemented in subsequent reports on SEC Forms 10-Q and 8-K. Such factors include, among others, the following: maintaining the mutually beneficial relationship between Ally and General Motors (“GM”), and Ally and Chrysler; the profitability and financial condition of GM and Chrysler; securing low cost funding for us and Residential Capital, LLC (“ResCap”); our ability to realize the anticipated benefits associated with being a bank holding company, and the increased regulation and restrictions that we are now subject to; any impact resulting from delayed foreclosure sales or related matters; the potential for legal liability resulting from claims related to the sale of private-label mortgage -backed securities; risks related to potential repurchase obligations due to alleged breaches of representations and warranties in mortgage securitization transactions; changes in U.S. government -sponsored mortgage programs or disruptions in the markets in which our mortgage subsidiaries operate; continued challenges in the residential mortgage markets; the continuing negative impact on ResCap and our mortgage business generally due to the recent decline in the U.S. housing market; uncertainty of our ability to enter into transactions or execute strategic alternatives to realize the value of our ResCap operations; the potential for deterioration in the residual value of off-lease vehicles; disruptions in the market in which we fund our operations, with resulting negative impact on our liquidity; changes in our accounting assumptions that may require or that result from changes in the accounting rules or their application, which could result in an impact on earnings; changes in the credit ratings of Ally, ResCap, Chrysler, or GM; changes in economic conditions, currency exchange rates or political stability in the markets in which we operate; and changes in the existing or the adoption of new laws, regulations, policies or other activities of governments, agencies and similar organizations (including as a result of the Dodd-Frank Act). Investors are cautioned not to place undue reliance on forward -looking statements . Ally undertakes no obligation to update publicly or otherwise revise any forward -looking statements except where expressly required by law. Reconciliation of non-GAAP financial measures included within this presentation are provided in this presentation . Use of the term “loans” describes products associated with direct and indirect lending activities of Ally’s global operations . The specific products include retail installment sales contracts, loans, lines of credit, leases or other financing products . The term “originate” refers to Ally’s purchase, acquisition or direct origination of various “loan” products . 3Q 2011 Preliminary Results 2
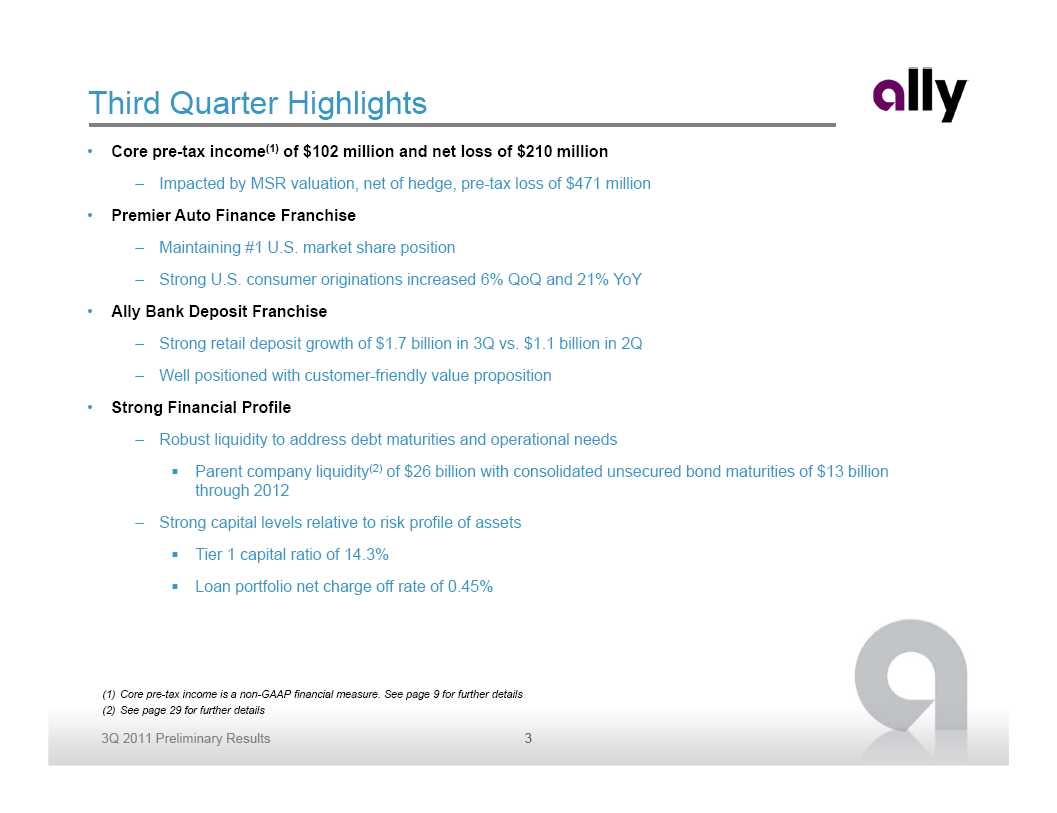
Third Quarter Highlights • Core pre-tax income (1) of $102 million and net loss of $210 million – Impacted by MSR valuation, net of hedge, pre-tax loss of $471 million • Premier Auto Finance Franchise – Maintaining #1 U.S. market share position – Strong U.S. consumer originations increased 6% QoQ and 21% YoY • Ally Bank Deposit Franchise – Strong retail deposit growth of $1.7 billion in 3Q vs. $1.1 billion in 2Q – Well positioned with customer -friendly value proposition • Strong Financial Profile – Robust liquidity to address debt maturities and operational needs Parent company liquidity (2) of $26 billion with consolidated unsecured bond maturities of $13 billion through 2012 – Strong capital levels relative to risk profile of assets Tier 1 capital ratio of 14.3% Loan portfolio net charge off rate of 0.45% (1) Core pre-tax income is a non-GAAP financial measure. See page 9 for further details (2) See page 29 for further details 3Q 2011 Preliminary Results 3
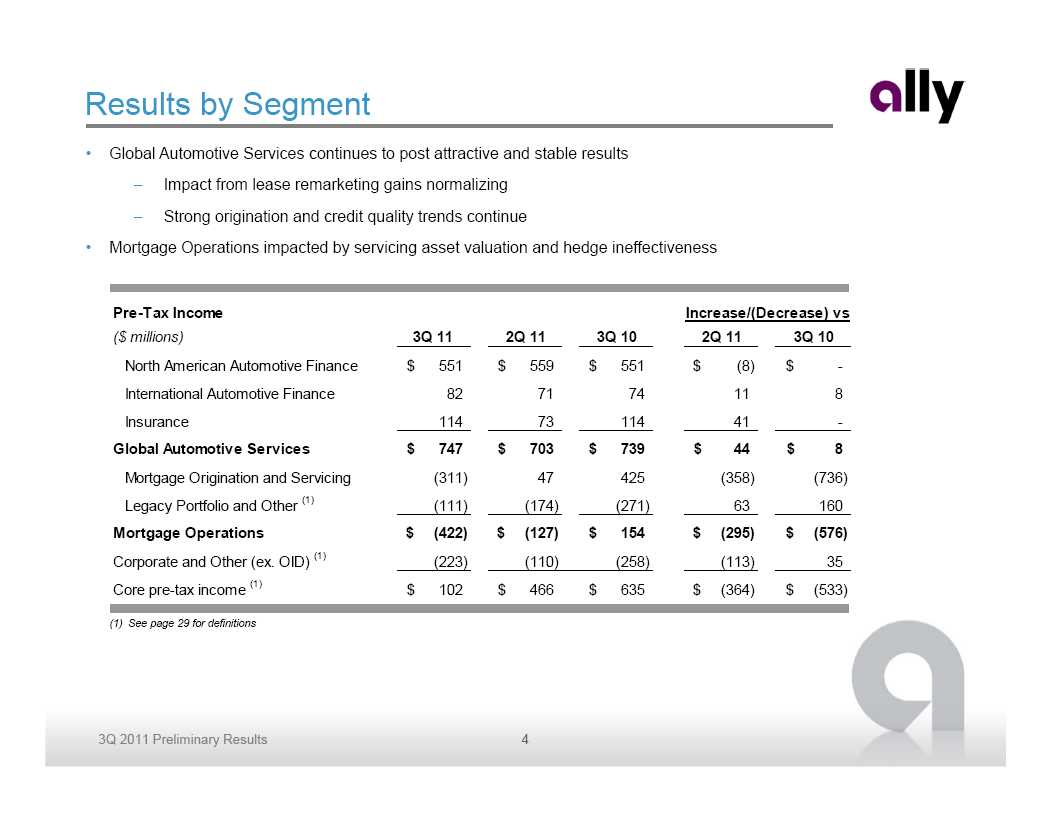
Results by Segment • Global Automotive Services continues to post attractive and stable results – Impact from lease remarketing gains normalizing – Strong origination and credit quality trends continue • Mortgage Operations impacted by servicing asset valuation and hedge ineffectiveness Pre-Tax Income Increase/(Decrease) vs ($ millions) 3Q 11 2Q 11 3Q 10 2Q 11 3Q 10 North American Automotive Finance $ 551 $ 559 $ 551 $ (8) $ -International Automotive Finance 82 71 74 11 8 Insurance 114 73 114 41 - Global Automotive Services $ 747 $ 703 $ 739 $ 44 $ 8 Mortgage Origination and Servicing (311) 47 425 (358) (736) Legacy Portfolio and Other (1) (111) (174) (271) 63 160 Mortgage Operations $ (422) $ (127) $ 154 $ (295) $ (576) Corporate and Other (ex. OID) (1) (223) (110) (258) (113) 35 Core pre-tax income (1) $ 102 $ 466 $ 635 $ (364) $ (533) (1) See page 29 for definitions 3Q 2011 Preliminary Results 4
Mortgage Business Model Update • Evolving landscape creating challenges in the mortgage business model – Highly competitive, low margin business – Servicing costs are rising – MSR implications Basel III capital deductions Size relative to balance sheet and capital Volatility of asset value • Announcing a significant reduction of originations in the correspondent mortgage channel – Focus on maintaining relationships with key clients that produce high quality collateral and leverage our full service capabilities – Actions are similar to other industry participants • Continued participation in retail and broker lending channel – Higher margins – Direct customer touch points • Focus liquidity and capital deployment on premier auto finance franchise 3Q 2011 Preliminary Results 5
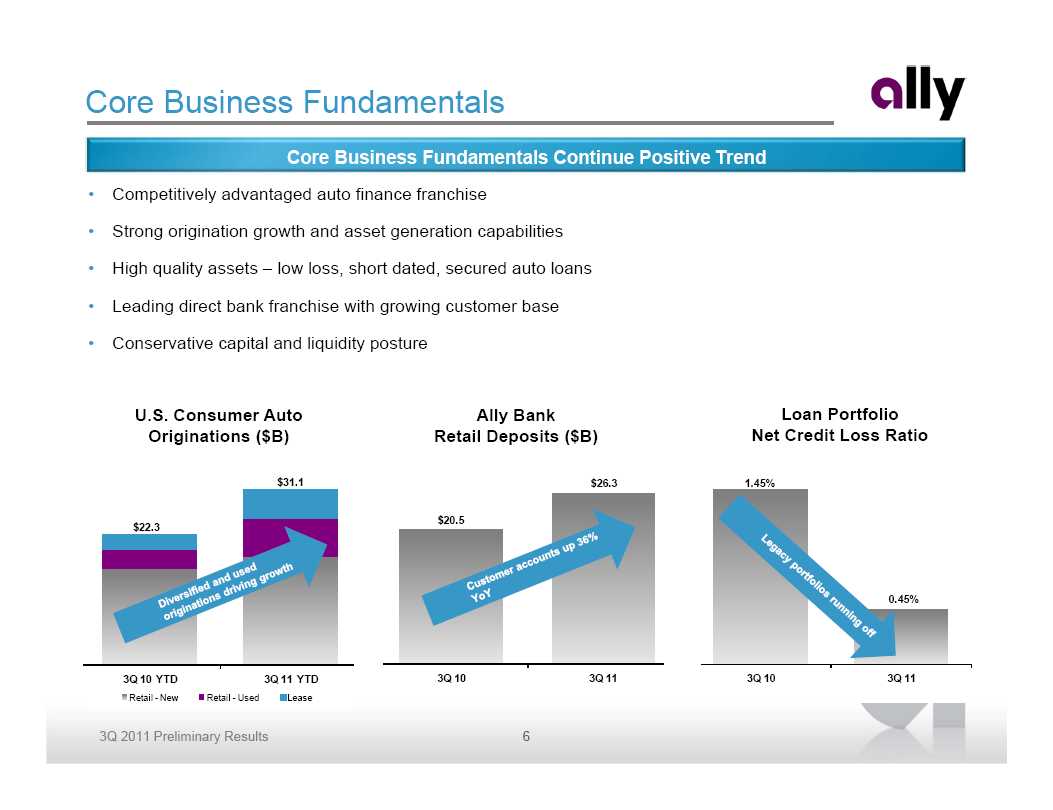
Core Business Fundamentals Core Business Fundamentals Continue Positive Trend • Competitively advantaged auto finance franchise • Strong origination growth and asset generation capabilities • High quality assets – low loss, short dated, secured auto loans • Leading direct bank franchise with growing customer base • Conservative capital and liquidity posture U.S. Consumer Auto Ally Bank Loan Portfolio Originations ($B) Retail Deposits ($B) Net Credit Loss Ratio $31.1 $26.3 1.45% $20.5 $22.3 0.45% 3Q 10 YTD 3Q 11 YTD 3Q 10 3Q 11 3Q 10 3Q 11 Retail - New Retail - Used Lease 3Q 2011 Preliminary Results 6
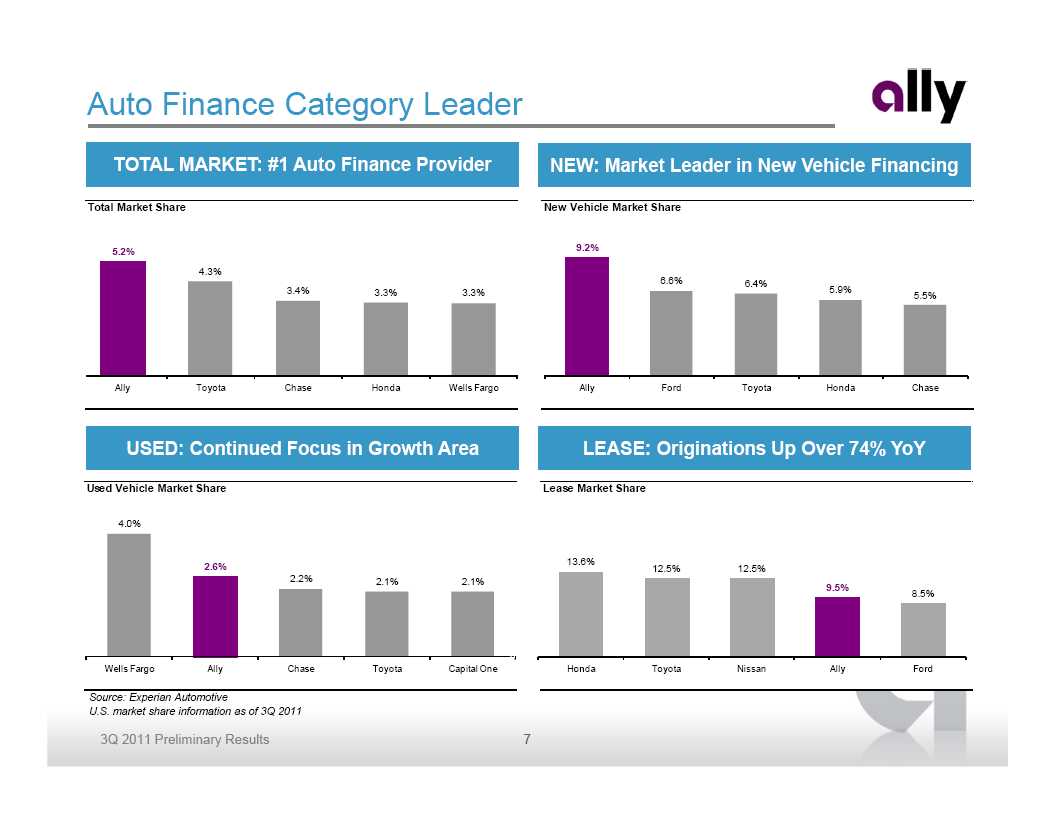
Auto Finance Category Leader TOTAL MARKET: #1 Auto Finance Provider NEW: Market Leader in New Vehicle Financing Total Market Share New Vehicle Market Share 12.0% 5.2% 10.0% 9.2% 4.3% 8.0% 6.6% 6.4% 3.4% 3.3% 3.3% 5.9% 6.0% 5.5% 4.0% 2.0% 0.0% Ally Toyota Chase Honda Wells Fargo Ally Ford Toyota Honda Chase USED: Continued Focus in Growth Area LEASE: Originations Up Over 74% YoY Used Vehicle Market Share Lease Market Share 24.0% 4.0% 22.0% 20.0% 18.0% 16.0% 13.6% 2.6% 14.0% 12.5% 12.5% 2.2% 2.1% 2.1% 12.0% 9.5% 10.0% 8.5% 8.0% 6.0% 4.0% 2.0% 0.0% Wells Fargo Ally Chase Toyota Capital One Honda Toyota Nissan Ally Ford Source: Experian Automotive U.S. market share information as of 3Q 2011 3Q 2011 Preliminary Results 7
Outlook and Priorities • Challenging environment continues … – Competition in auto finance space – Returns under pressure in near term – Volatile capital markets – Mortgage topics • …We’ll continue to be successful by focusing on expanding our premier auto finance franchise – Leverage competitively advantaged, dealer-centric business model – More diversified market -driven competitor – Maintain conservative liquidity posture – Proactive risk management – Improve cost of funds and manage operating costs 3Q 2011 Preliminary Results 8
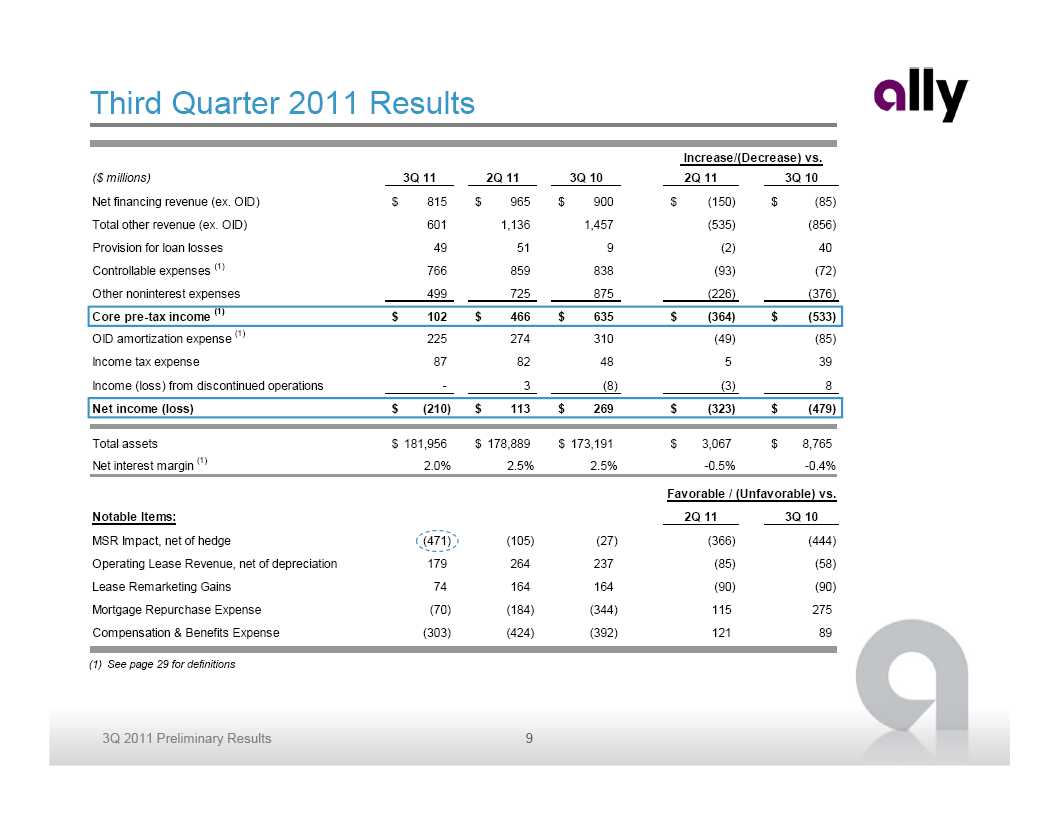
Third Quarter 2011 Results Increase/(Decrease) vs. ($ millions) 3Q 11 2Q 11 3Q 10 2Q 11 3Q 10 Net financing revenue (ex. OID) $ 815 $ 965 $ 900 $ (150) $ (85) Total other revenue (ex. OID) 601 1,136 1,457 (535) (856) Provision for loan losses 49 51 9 (2) 40 Controllable expenses (1) 766 859 838 (93) (72) Other noninterest expenses 499 725 875 (226) (376) Core pre-tax income (1) $ 102 $ 466 $ 635 $ (364) $ (533) OID amortization expense (1) 225 274 310 (49) (85) Income tax expense 87 82 48 5 39 Income (loss) from discontinued operations - 3 (8) (3) 8 Net income (loss) $ (210) $ 113 $ 269 $ (323) $ (479) Total assets $ 181,956 $ 178,889 $ 173,191 $ 3,067 $ 8,765 Net interest margin (1) 2.0% 2.5% 2.5% -0.5% -0.4% Favorable / (Unfavorable) vs. Notable Items: 2Q 11 3Q 10 MSR Impact, net of hedge (471) (105) (27) (366) (444) Operating Lease Revenue, net of depreciation 179 264 237 (85) (58) Lease Remarketing Gains 74 164 164 (90) (90) Mortgage Repurchase Expense (70) (184) (344) 115 275 Compensation & Benefits Expense (303) (424) (392) 121 89 (1) See page 29 for definitions 3Q 2011 Preliminary Results 9
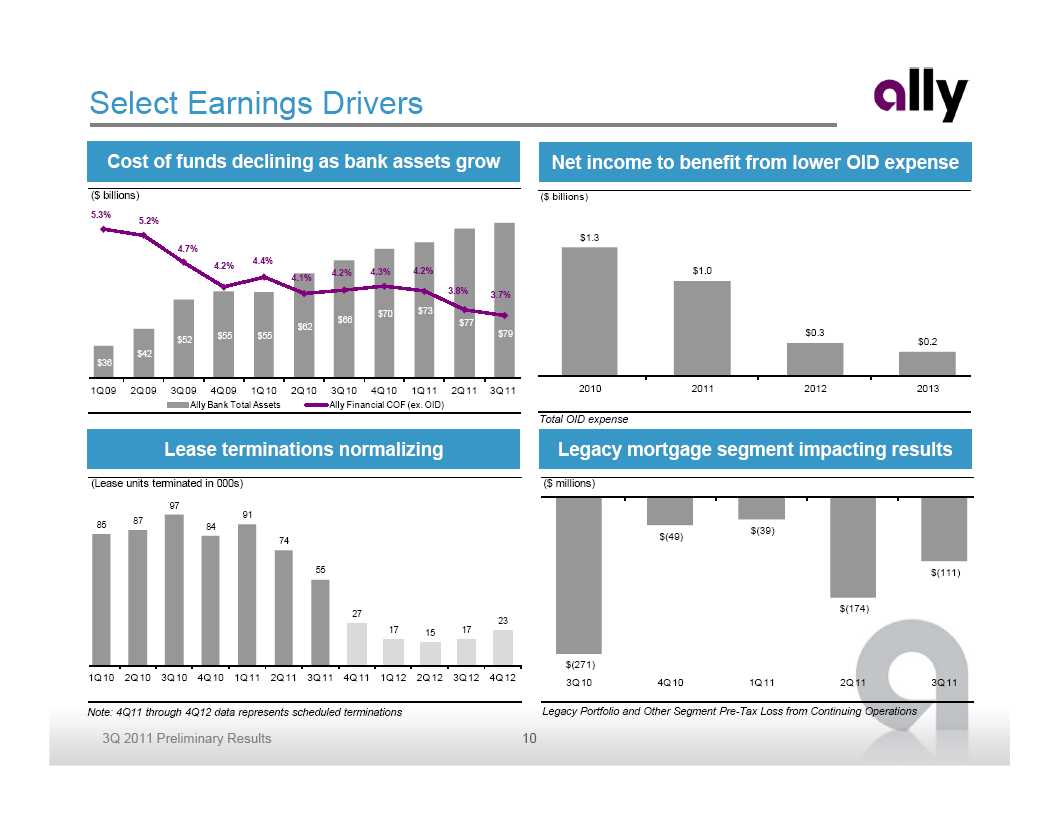
Select Earnings Drivers Cost of funds declining as bank assets grow Net income to benefit from lower OID expense ($ billions) ($ billions) 5.3% 5.2% $1.3 4.7% 4.4% 4.2% 4.2% 4.3% 4.2% $1.0 4.1% 3.8% 3.7% $70 $73 $66 $77 $62 $55 $55 $79 $0.3 $52 $0.2 $42 $36 1Q 09 2Q 09 3Q 09 4Q 09 1Q 10 2Q 10 3Q 10 4Q 10 1Q 11 2Q 11 3Q 11 2010 2011 2012 2013 Ally Bank Total Assets Ally Financial COF (ex. OID) Total OID expense Lease terminations normalizing Legacy mortgage segment impacting results (Lease units terminated in 000s) ($ millions) 97 91 87 85 84 $(39) $(49) 74 55 $(111) $(174) 27 23 17 15 17 $(271) 1Q 10 2Q 10 3Q 10 4Q 10 1Q 11 2Q 11 3Q 11 4Q 11 1Q 12 2Q 12 3Q 12 4Q 12 3Q 10 4Q 10 1Q 11 2Q 11 3Q 11 Note: 4Q11 through 4Q12 data represents scheduled terminations Legacy Portfolio and Other Segment Pre-Tax Loss from Continuing Operations 3Q 2011 Preliminary Results 10
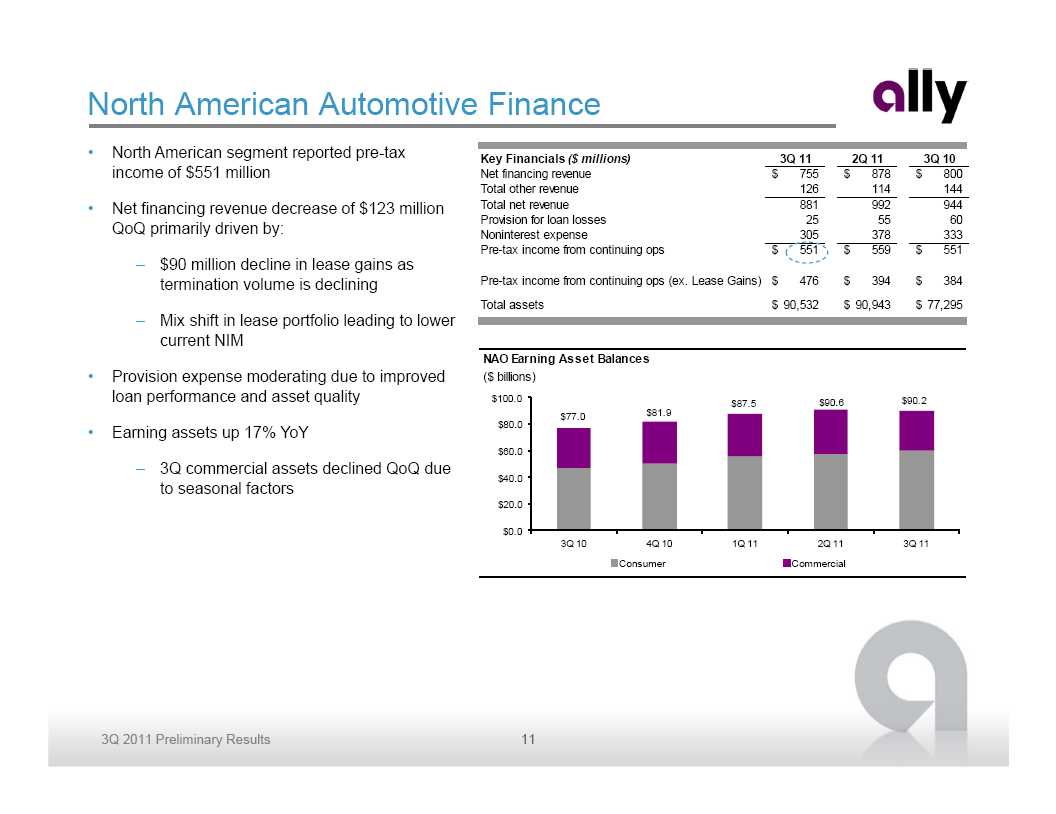
North American Automotive Finance • North American segment reported pre-tax Key Financials ($ millions) 3Q 11 2Q 11 3Q 10 income of $551 million Net financing revenue $ 755 $ 878 $ 800 Total other revenue 126 114 144 • Net financing revenue decrease of $123 million Total net revenue 881 992 944 Provision for loan losses 25 55 60 QoQ primarily driven by: Noninterest expense 305 378 333 Pre-tax income from continuing ops $ 551 $ 559 $ 551 – $90 million decline in lease gains as termination volume is declining Pre-tax income from continuing ops (ex. Lease Gains) $ 476 $ 394 $ 384 Total assets $ 90,532 $ 90,943 $ 77,295 – Mix shift in lease portfolio leading to lower current NIM NAO Earning Asset Balances • Provision expense moderating due to improved ($ billions) loan performance and asset quality $100.0 $90.6 $90.2 $87.5 $77.0 $81.9 • Earning assets up 17% YoY $80.0 $60.0 – 3Q commercial assets declined QoQ due $40.0 to seasonal factors $20.0 $0.0 3Q 10 4Q 10 1Q 11 2Q 11 3Q 11 Consumer Commercial 3Q 2011 Preliminary Results 11

North American Auto Finance – Key Metrics U.S. Consumer Originations U.S. Origination Mix ($ billions) (% of $ originations) $11.6 17% 23% $10.0 $9.3 $9.5 12% 2% 17% $8.0 $8.3 11% 4% 10% $6.0 12% 9% 27% 19% 22% 15% 1Q 10 2Q 10 3Q 10 4Q 10 1Q 11 2Q 11 3Q 11 1Q 10 2Q 10 3Q 10 4Q 10 1Q 11 2Q 11 3Q 11 GM Subvented GM Standard Chrysler Subvented Chrysler Standard Retail - New Retail - Used Lease (1) Diversified New Lease Used (1) Includes GM and Chrysler lease originations NAO Consumer Serviced Assets NAO Commercial Serviced Assets ($ billions) ($ billions) $74.5 $31.2 $31.6 $33.0 $71.8 $72.6 $29.6 $30.4 $67.0 $67.1 $68.8 $28.5 $28.4 $67.3 1Q 10 2Q 10 3Q 10 4Q 10 1Q 11 2Q 11 3Q 11 1Q 10 2Q 10 3Q 10 4Q 10 1Q 11 2Q 11 3Q 11 On Balance Sheet Sold 3Q 2011 Preliminary Results 12
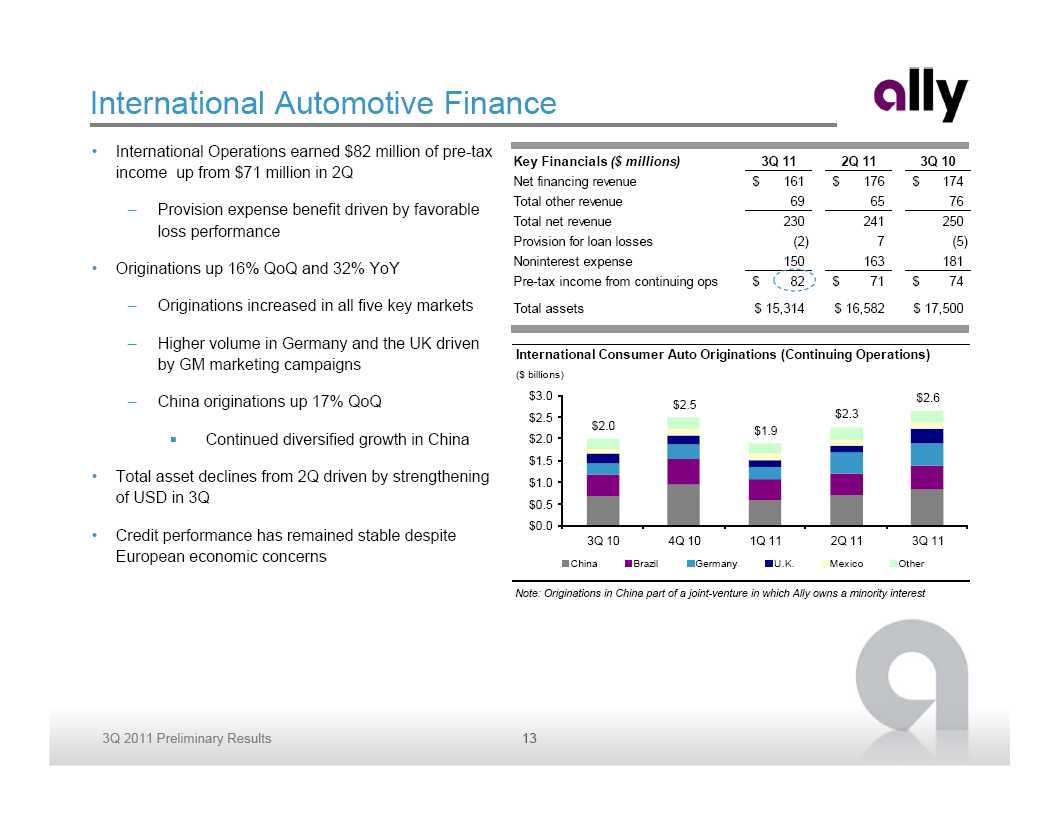
International Automotive Finance • International Operations earned $82 million of pre-tax Key Financials ($ millions) 3Q 11 2Q 11 3Q 10 income up from $71 million in 2Q Net financing revenue $ 161 $ 176 $ 174 Total other revenue 69 65 76 – Provision expense benefit driven by favorable Total net revenue 230 241 250 loss performance Provision for loan losses (2) 7 (5) • Originations up 16% QoQ and 32% YoY Noninterest expense 150 163 181 Pre-tax income from continuing ops $ 82 $ 71 $ 74 – Originations increased in all five key markets Total assets $ 15,314 $ 16,582 $ 17,500 – Higher volume in Germany and the UK driven International Consumer Auto Originations (Continuing Operations) by GM marketing campaigns ($ billions) – China originations up 17% QoQ $3.0 $2.6 $2.5 $2.5 $2.3 $2.0 $1.9 Continued diversified growth in China $2.0 $1.5 • Total asset declines from 2Q driven by strengthening $1.0 of USD in 3Q $0.5 $0.0 • Credit performance has remained stable despite 3Q 10 4Q 10 1Q 11 2Q 11 3Q 11 European economic concerns China Brazil Germany U.K. Mexico Other Note: Originations in China part of a joint-venture in which Ally owns a minority interest 3Q 2011 Preliminary Results 13

Insurance • Pre-tax income of $114 million, up from $73 Key Financials ($ millions) 3Q 11 2Q 11 3Q 10 million in 2Q Insurance premiums, service revenue earned and other $ 437 $ 445 $ 478 Insurance losses and loss adjustment expenses 183 237 218 – Weather losses improved from 2Q due to Acquisition and underwriting expenses 186 206 235 seasonal trends and reinsurance Total underwriting income 68 2 25 arrangement Investment income and other 46 71 89 Pre-tax income from continuing ops $ 114 $ 73 $ 114 – Realized gains from investment portfolio Total assets $ 8,215 $ 8,533 $ 8,796 moderated from prior periods Key Statistics 3Q 11 2Q 11 3Q 10 Insurance ratios • Written premiums declined QoQ due to lower Loss ratio 42% 54% 46% international renewal activity Underwriting expense ratio 43% 47% 49% Combined ratio 85% 101% 95% – Dealer Products and Services premiums increased slightly QoQ and remain at Insurance Total Written Premiums highest level since 3Q08 ($ millions) $500 $429 $404 $411 $410 $400 $346 $300 $200 $100 $0 3Q 10 4Q 10 1Q 11 2Q 11 3Q 11 Dealer Products & Services International 3Q 2011 Preliminary Results 14
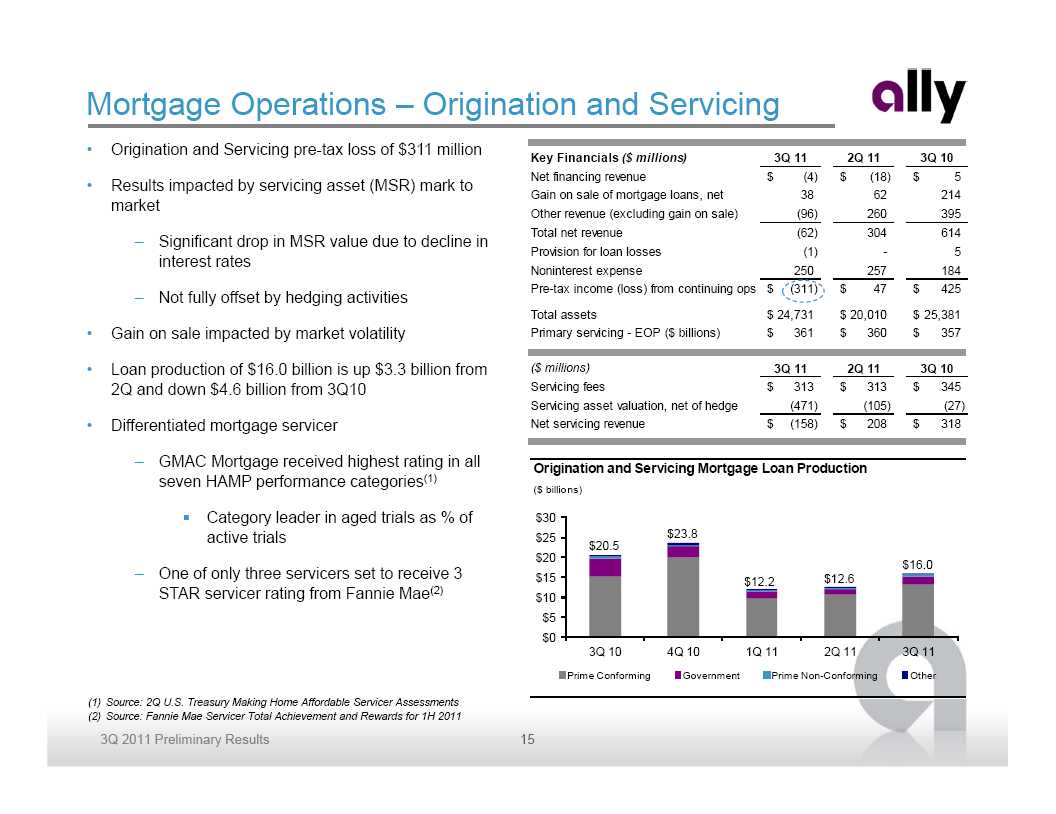
Mortgage Operations – Origination and Servicing • Origination and Servicing pre-tax loss of $311 million Key Financials ($ millions) 3Q 11 2Q 11 3Q 10 Net financing revenue $ (4) $ (18) $ 5 • Results impacted by servicing asset (MSR) mark to Gain on sale of mortgage loans, net 38 62 214 market Other revenue (excluding gain on sale) (96) 260 395 Total net revenue (62) 304 614 – Significant drop in MSR value due to decline in Provision for loan losses (1) - 5 interest rates Noninterest expense 250 257 184 Pre-tax income (loss) from continuing ops $ (311) $ 47 $ 425 – Not fully offset by hedging activities Total assets $ 24,731 $ 20,010 $ 25,381 • Gain on sale impacted by market volatility Primary servicing - EOP ($ billions) $ 361 $ 360 $ 357 • Loan production of $16.0 billion is up $3.3 billion from ($ millions) 3Q 11 2Q 11 3Q 10 2Q and down $4.6 billion from 3Q10 Servicing fees $ 313 $ 313 $ 345 Servicing asset valuation, net of hedge (471) (105) (27) • Differentiated mortgage servicer Net servicing revenue $ (158) $ 208 $ 318 – GMAC Mortgage received highest rating in all Origination and Servicing Mortgage Loan Production seven HAMP performance categories (1) ($ billions) Category leader in aged trials as % of $30 active trials $25 $23.8 $20.5 $20 $16.0 – One of only three servicers set to receive 3 $15 $12.6 $12.2 STAR servicer rating from Fannie Mae(2) $10 $5 $0 3Q 10 4Q 10 1Q 11 2Q 11 3Q 11 Prime Conforming Government Prime Non-Conforming Other (1) Source: 2Q U.S. Treasury Making Home Affordable Servicer Assessments (2) Source: Fannie Mae Servicer Total Achievement and Rewards for 1H 2011 3Q 2011 Preliminary Results 15
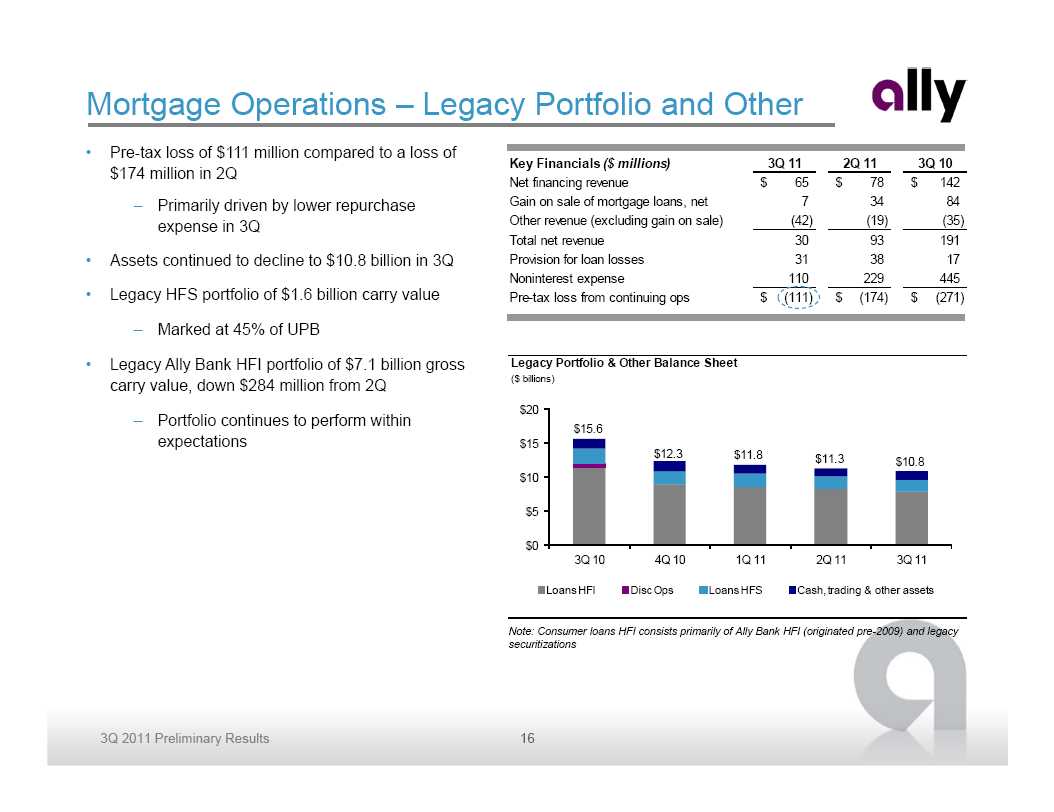
Mortgage Operations – Legacy Portfolio and Other • Pre-tax loss of $111 million compared to a loss of Key Financials ($ millions) 3Q 11 2Q 11 3Q 10 $174 million in 2Q Net financing revenue $ 65 $ 78 $ 142 – Primarily driven by lower repurchase Gain on sale of mortgage loans, net 7 34 84 expense in 3Q Other revenue (excluding gain on sale) (42) (19) (35) Total net revenue 30 93 191 • Assets continued to decline to $10.8 billion in 3Q Provision for loan losses 31 38 17 Noninterest expense 110 229 445 • Legacy HFS portfolio of $1.6 billion carry value Pre-tax loss from continuing ops $ (111) $ (174) $ (271) – Marked at 45% of UPB • Legacy Ally Bank HFI portfolio of $7.1 billion gross Legacy Portfolio & Other Balance Sheet carry value, down $284 million from 2Q ($ billions) $20 – Portfolio continues to perform within $15.6 expectations $15 $12.3 $11.8 $11.3 $10.8 $10 $5 $0 3Q 10 4Q 10 1Q 11 2Q 11 3Q 11 Loans HFI Disc Ops Loans HFS Cash, trading & other assets Note: Consumer loans HFI consists primarily of Ally Bank HFI (originated pre-2009) and legacy securitizations 3Q 2011 Preliminary Results 16
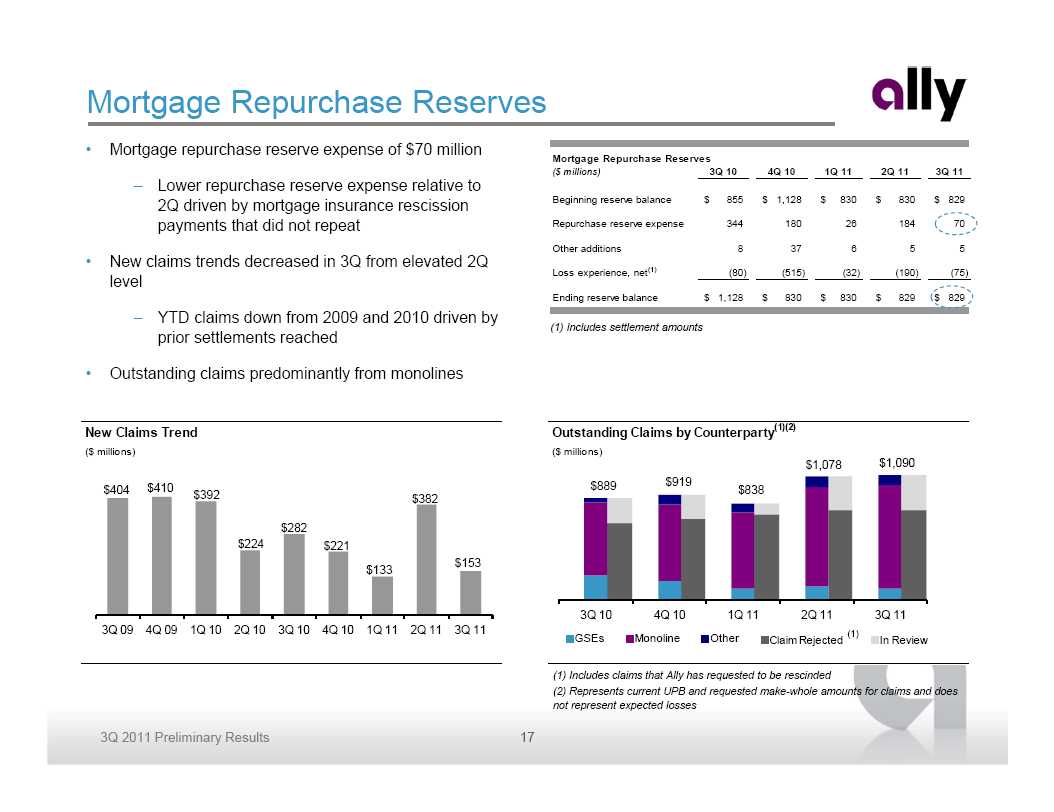
Mortgage Repurchase Reserves • Mortgage repurchase reserve expense of $70 million Mortgage Repurchase Reserves ($ millions) 3Q 10 4Q 10 1Q 11 2Q 11 3Q 11 – Lower repurchase reserve expense relative to 2Q driven by mortgage insurance rescission Beginning reserve balance $ 855 $ 1,128 $ 830 $ 830 $ 829 payments that did not repeat Repurchase reserve expense 344 180 26 184 70 Other additions 8 37 6 5 5 • New claims trends decreased in 3Q from elevated 2Q Loss experience, net(1) (80) (515) (32) (190) (75) level Ending reserve balance $ 1,128 $ 830 $ 830 $ 829 $ 829 – YTD claims down from 2009 and 2010 driven by (1) Includes settlement amounts prior settlements reached • Outstanding claims predominantly from monolines New Claims Trend Outstanding Claims by Counterparty (1)(2) ($ millions) ($ millions) $1,078 $1,090 $889 $919 $404 $410 $838 $392 $382 $282 $224 $221 $153 $133 3Q 10 3Q 10 4Q 10 4Q 10 1Q 11 1Q 11 2Q 11 2Q 11 3Q 11 3Q 11 3Q 09 4Q 09 1Q 10 2Q 10 3Q 10 4Q 10 1Q 11 2Q 11 3Q 11 (1) GSEs Monoline Other Claim Rejected In Review (1) Includes claims that Ally has requested to be rescinded (2) Represents current UPB and requested make-whole amounts for claims and does not represent expected losses 3Q 2011 Preliminary Results 17

Ally Bank Franchise Momentum • Market shift to direct banking model continues Direct banking preferred by customers • Ally is already well positioned to benefit Preferred Banking Channel 72% • No legacy burden of branch network overhead and high- 59% turnover staffing models • Number of Ally Bank retail customer accounts increased 34% 28% 8% from 2Q and 36% from 3Q10 to 920k • Customer friendly approach resonating with consumers 2007 2007 2011 2011 – ATM fee reimbursement and no debit card fees Branches/ATM Direct Channels – Ally Bank recognized as “Best Online Package” Source: American Bankers Association – MONEY ® Magazine, September 2011 Consistently building customer base – Named #1 online account two years running by (1) Ally Bank Deposit Levels Change Sciences ($ billions) $40 $38.9 1,000 $36.9 $35.4 $33.0 $33.9 – Introduced “No Nonsense” marketing campaign $30.8 $28.8 $29.3 $30 $27.4 750 $24.8 $22.0 $20 500 $10 250 $0 0 1Q 09 2Q 09 3Q 09 4Q 09 1Q 10 2Q 10 3Q 10 4Q 10 1Q 11 2Q 11 3Q 11 Ally Bank Deposits Number of Retail Accounts (000s) (1) Excludes intercompany deposits 3Q 2011 Preliminary Results 18
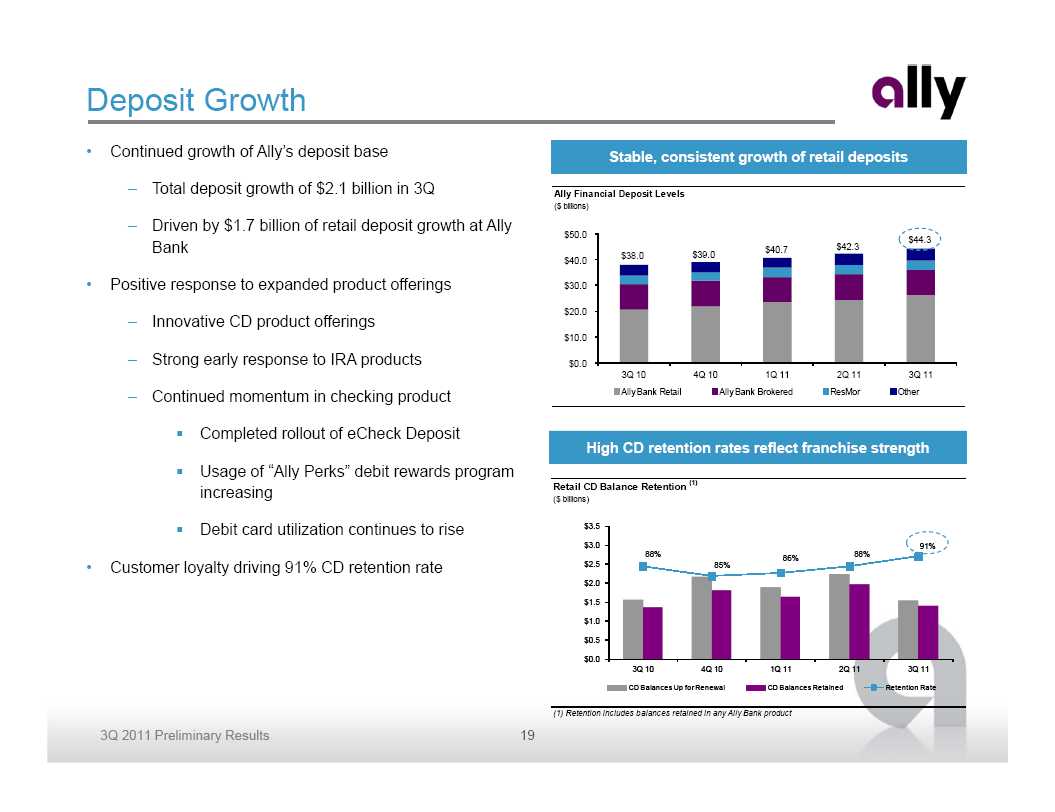
Deposit Growth • Continued growth of Ally’s deposit base Stable, consistent growth of retail deposits – Total deposit growth of $2.1 billion in 3Q Ally Financial Deposit Levels ($ billions) – Driven by $1.7 billion of retail deposit growth at Ally $50.0 $44.3 Bank $40.7 $42.3 $38.0 $39.0 $40.0 • Positive response to expanded product offerings $30.0 $20.0 – Innovative CD product offerings $10.0 – Strong early response to IRA products $0.0 3Q 10 4Q 10 1Q 11 2Q 11 3Q 11 – Continued momentum in checking product Ally Bank Retail Ally Bank Brokered ResMor Other Completed rollout of eCheck Deposit High CD retention rates reflect franchise strength Usage of “Ally Perks” debit rewards program increasing Retail CD Balance Retention (1) ($ billions) Debit card utilization continues to rise $3.5 $3.0 91% 88% 88% 86% FHLB • Customer loyalty driving 91% CD retention rate $2.5 85% Borrowing $2.0 10% B $1.5 $1.0 $0.5 $0.0 3Q 10 4Q 10 1Q 11 2Q 11 3Q 11 CD Balances Up for Renewal CD Balances Retained Retention Rate (1) Retention includes balances retained in any Ally Bank product 3Q 2011 Preliminary Results 19
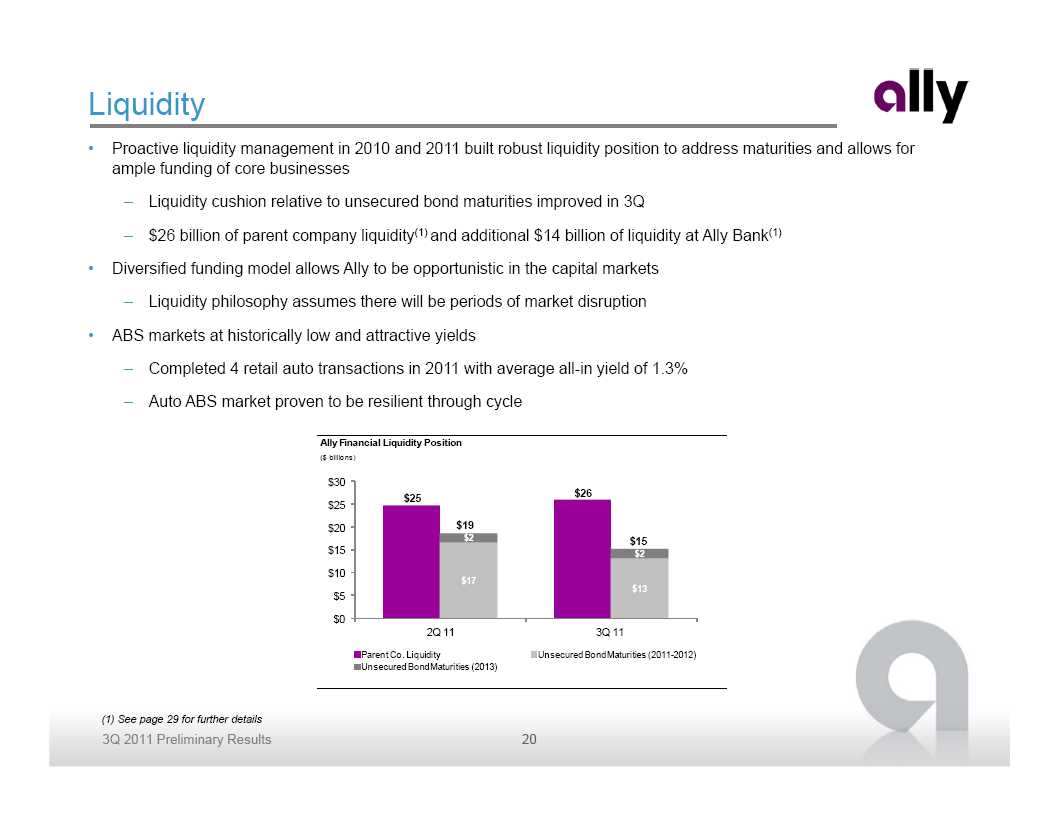
Liquidity • Proactive liquidity management in 2010 and 2011 built robust liquidity position to address maturities and allows for ample funding of core businesses – Liquidity cushion relative to unsecured bond maturities improved in 3Q – $26 billion of parent company liquidity (1) and additional $14 billion of liquidity at Ally Bank(1) • Diversified funding model allows Ally to be opportunistic in the capital markets – Liquidity philosophy assumes there will be periods of market disruption • ABS markets at historically low and attractive yields – Completed 4 retail auto transactions in 2011 with average all-in yield of 1.3% – Auto ABS market proven to be resilient through cycle Ally Financial Liquidity Position ($ billions) $30 $26 $25 $25 $20 $19 $2 $15 $15 $2 $10 $17 $13 $5 $0 2Q 11 3Q 11 Parent Co. Liquidity Unsecured Bond Maturities (2011-2012) Unsecured Bond Maturities (2013) (1) See page 29 for further details 3Q 2011 Preliminary Results 20
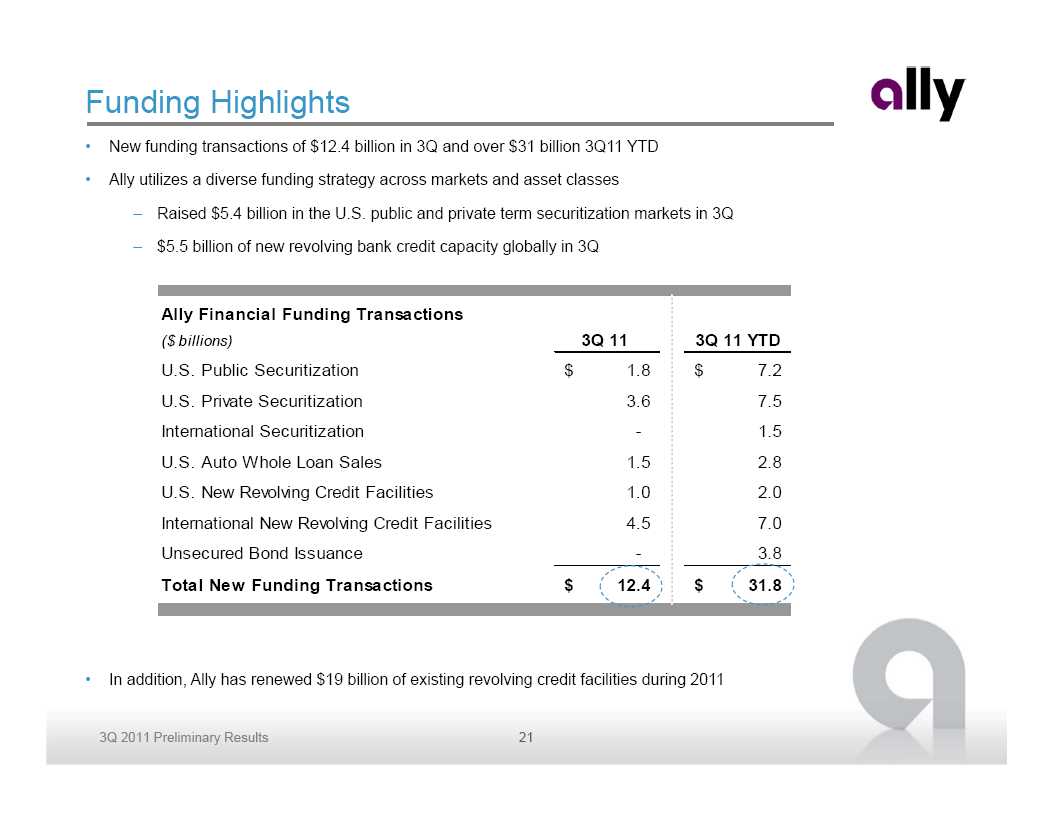
Funding Highlights • New funding transactions of $12.4 billion in 3Q and over $31 billion 3Q11 YTD • Ally utilizes a diverse funding strategy across markets and asset classes – Raised $5.4 billion in the U.S. public and private term securitization markets in 3Q – $5.5 billion of new revolving bank credit capacity globally in 3Q Ally Financial Funding Transactions ($ billions) 3Q 11 3Q 11 YTD U.S. Public Securitization $ 1.8 $ 7.2 U.S. Private Securitization 3.6 7.5 International Securitization - 1.5 U.S. Auto Whole Loan Sales 1.5 2.8 U.S. New Revolving Credit Facilities 1.0 2.0 International New Revolving Credit Facilities 4.5 7.0 Unsecured Bond Issuance - 3.8 Total New Funding Transactions $ 12.4 $ 31.8 • In addition, Ally has renewed $19 billion of existing revolving credit facilities during 2011 3Q 2011 Preliminary Results 21
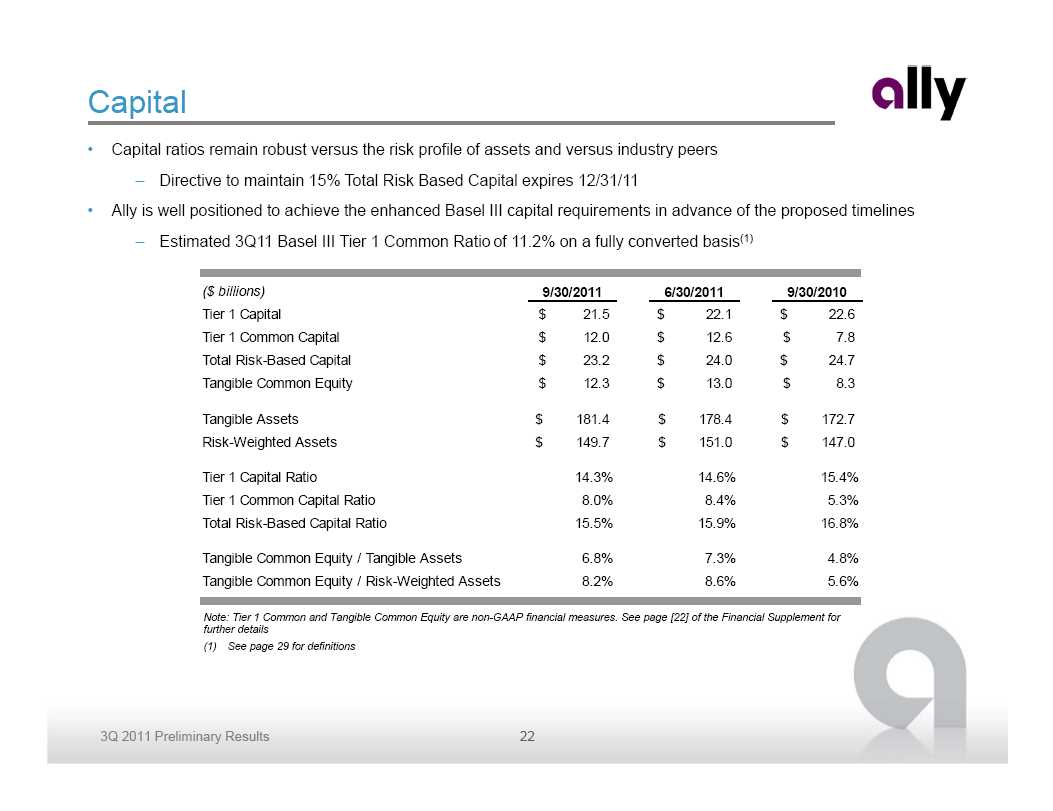
Capital • Capital ratios remain robust versus the risk profile of assets and versus industry peers – Directive to maintain 15% Total Risk Based Capital expires 12/31/11 • Ally is well positioned to achieve the enhanced Basel III capital requirements in advance of the proposed timelines – Estimated 3Q11 Basel III Tier 1 Common Ratio of 11.2% on a fully converted basis(1) ($ billions) 9/30/2011 6/30/2011 9/30/2010 Tier 1 Capital $ 21.5 $ 22.1 $ 22.6 Tier 1 Common Capital $ 12.0 $ 12.6 $ 7.8 Total Risk-Based Capital $ 23.2 $ 24.0 $ 24.7 Tangible Common Equity $ 12.3 $ 13.0 $ 8.3 Tangible Assets $ 181.4 $ 178.4 $ 172.7 Risk-Weighted Assets $ 149.7 $ 151.0 $ 147.0 Tier 1 Capital Ratio 14.3% 14.6% 15.4% Tier 1 Common Capital Ratio 8.0% 8.4% 5.3% Total Risk-Based Capital Ratio 15.5% 15.9% 16.8% Tangible Common Equity / Tangible Assets 6.8% 7.3% 4.8% Tangible Common Equity / Risk-Weighted Assets 8.2% 8.6% 5.6% Note: Tier 1 Common and Tangible Common Equity are non-GAAP financial measures . See page [22] of the Financial Supplement for further details (1) See page 29 for definitions 3Q 2011 Preliminary Results 22
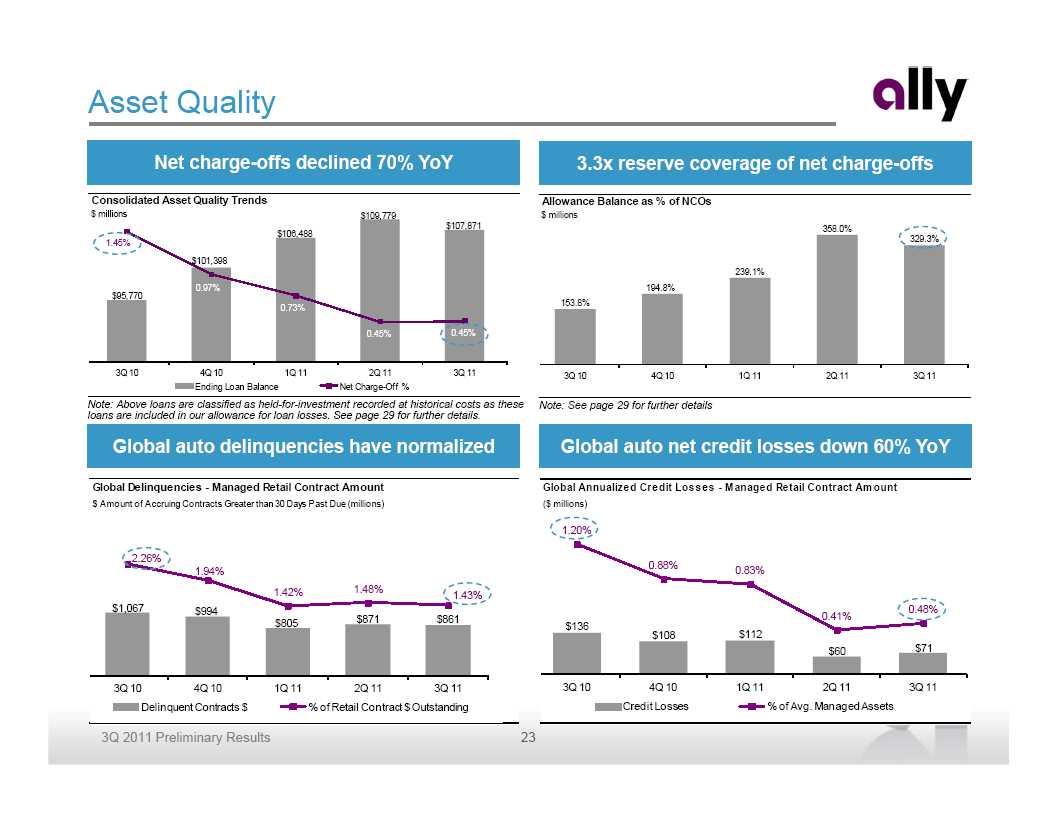
Asset Quality Net charge -offs declined 70% YoY 3.3x reserve coverage of net charge -offs Consolidated Asset Quality Trends Allowance Balance as % of NCOs $ millions $109,779 $ millions 1 $107,871 358.0% $106,488 1 329.3% 1.45% 1 $101,398 1 239.1% 0.97% 0 194.8% $95,770 153.8% 0.73% 0 0 0.45% 0.45% 0 0 3Q 10 4Q 10 1Q 11 2Q 11 3Q 11 3Q 10 4Q 10 1Q 11 2Q 11 3Q 11 Ending Loan Balance Net Charge-Off % Note: Above loans are classified as held-for-investment recorded at historical costs as these Note: See page 29 for further details loans are included in our allowance for loan losses. See page 29 for further details. Global auto delinquencies have normalized Global auto net credit losses down 60% YoY Global Delinquencies - Managed Retail Contract Amount Global Annualized Credit Losses - Managed Retail Contract Amount $ Amount of Accruing Contracts Greater than 30 Days Past Due (millions) ($ millions) 1.20% 2.26% 0.88% 1.94% 0.83% 1.42% 1.48% 1.43% $1,067 $994 0.48% $871 $861 0.41% $805 $136 $108 $112 $60 $71 3Q 10 4Q 10 1Q 11 2Q 11 3Q 11 3Q 10 4Q 10 1Q 11 2Q 11 3Q 11 Delinquent Contracts $ % of Retail Contract $ Outstanding Credit Losses % of Avg. Managed Assets 3Q 2011 Preliminary Results 23
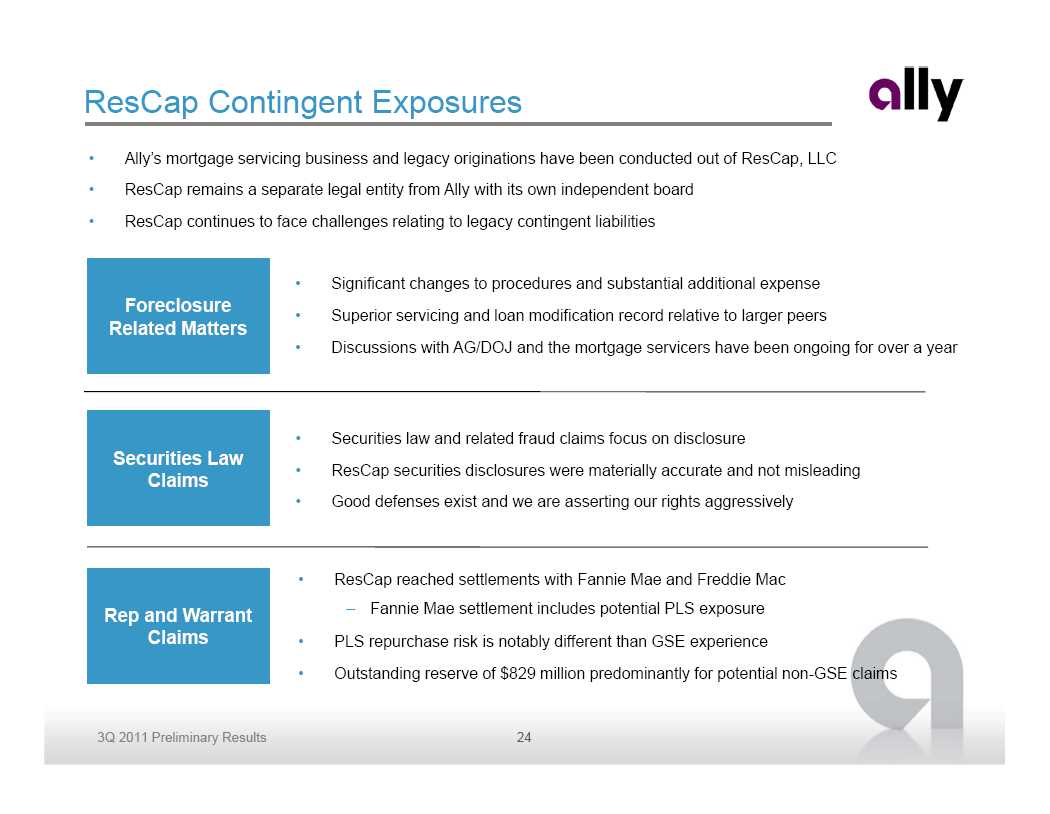
ResCap Contingent Exposures • Ally’s mortgage servicing business and legacy originations have been conducted out of ResCap, LLC • ResCap remains a separate legal entity from Ally with its own independent board • ResCap continues to face challenges relating to legacy contingent liabilities • Significant changes to procedures and substantial additional expense Foreclosure • Superior servicing and loan modification record relative to larger peers Related Matters • Discussions with AG/DOJ and the mortgage servicers have been ongoing for over a year • Securities law and related fraud claims focus on disclosure Securities Law • ResCap securities disclosures were materially accurate and not misleading Claims • Good defenses exist and we are asserting our rights aggressively • ResCap reached settlements with Fannie Mae and Freddie Mac Rep and Warrant – Fannie Mae settlement includes potential PLS exposure Claims • PLS repurchase risk is notably different than GSE experience • Outstanding reserve of $829 million predominantly for potential non-GSE claims 3Q 2011 Preliminary Results 24
Conclusion • Challenging operating environment • Core fundamentals continue positive trends • Mortgage issues are a ‘cloud’ that are being addressed • Focus on continued expansion of auto finance platform • Ally Bank deposit franchise well positioned for continued growth • Conservative capital and liquidity posture • Repay the U.S. Treasury investment in a timely manner 3Q 2011 Preliminary Results 25
Supplemental Charts
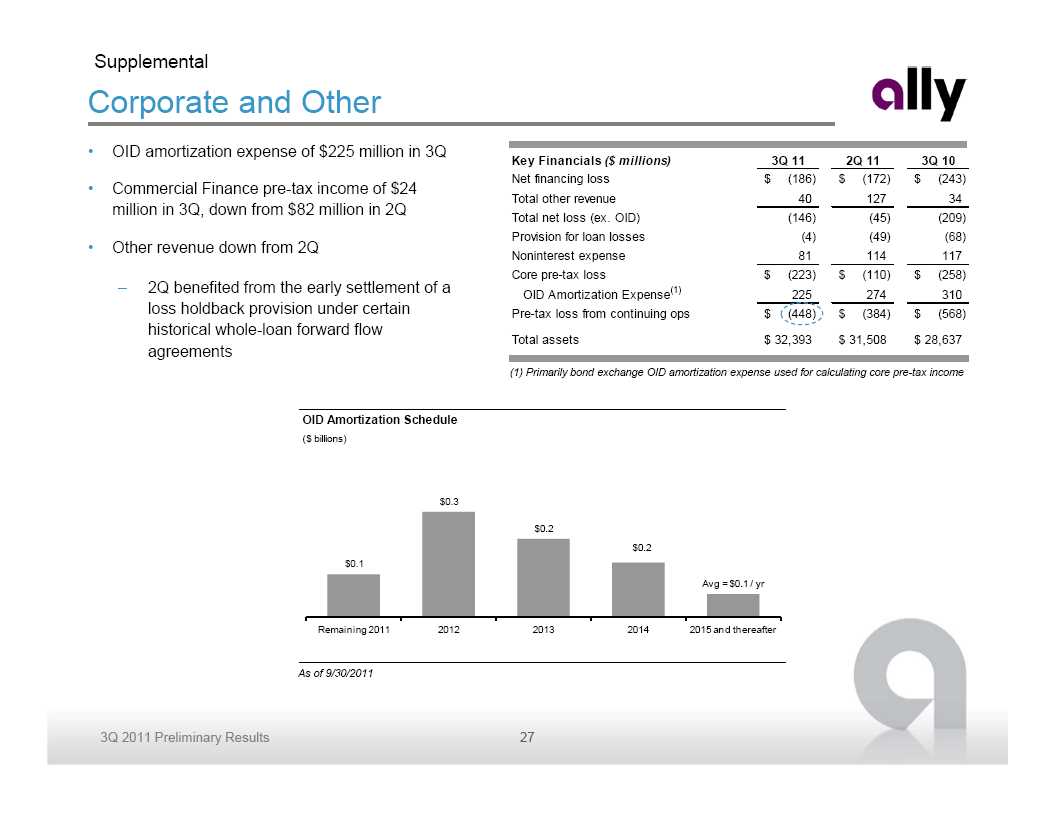
Supplemental Corporate and Other • OID amortization expense of $225 million in 3Q Key Financials ($ millions) 3Q 11 2Q 11 3Q 10 Net financing loss $ (186) $ (172) $ (243) • Commercial Finance pre-tax income of $24 Total other revenue 40 127 34 million in 3Q, down from $82 million in 2Q Total net loss (ex. OID) (146) (45) (209) Provision for loan losses (4) (49) (68) • Other revenue down from 2Q Noninterest expense 81 114 117 Core pre-tax loss $ (223) $ (110) $ (258) – 2Q benefited from the early settlement of a (1) OID Amortization Expense 225 274 310 loss holdback provision under certain Pre-tax loss from continuing ops $ (448) $ (384) $ (568) historical whole -loan forward flow Total assets $ 32,393 $ 31,508 $ 28,637 agreements (1) Primarily bond exchange OID amortization expense used for calculating core pre-tax income OID Amortization Schedule ($ billions) $0.3 $0.2 $0.2 $0.1 Avg = $0.1 / yr Remaining 2011 2012 2013 2014 2015 and thereafter As of 9/30/2011 3Q 2011 Preliminary Results 27
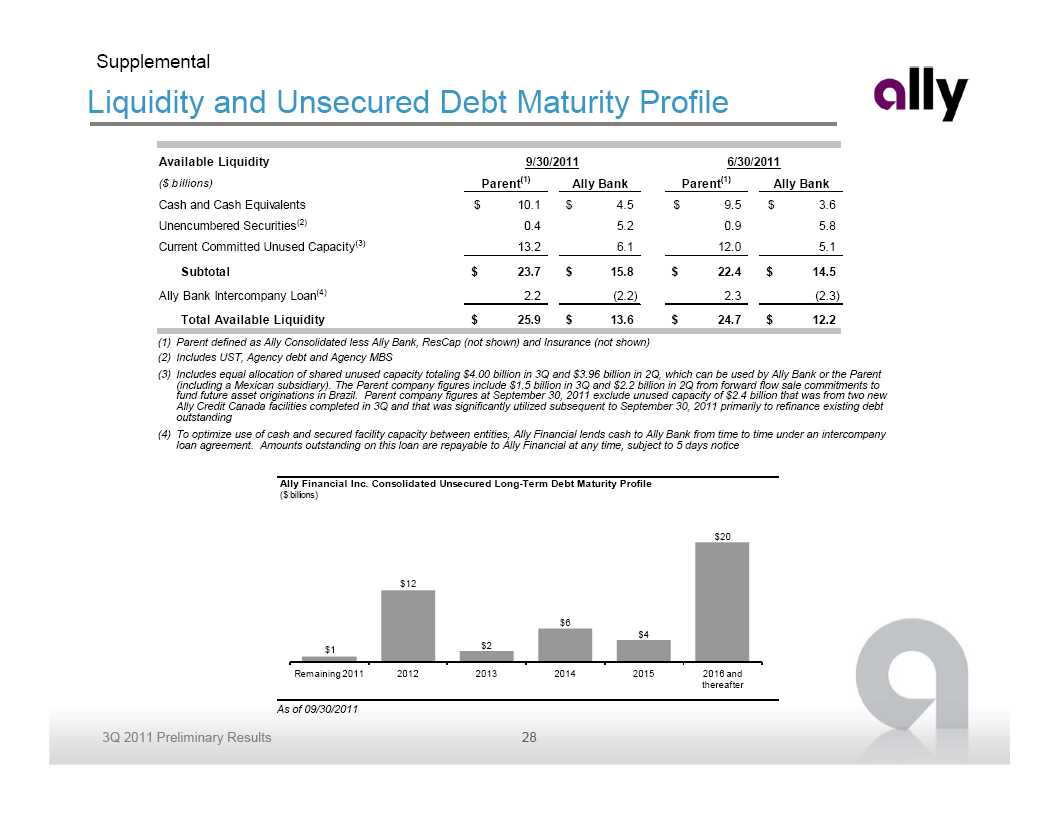
Supplemental Liquidity and Unsecured Debt Maturity Profile Available Liquidity 9/30/2011 6/30/2011 ($ billions) Parent (1) Ally Bank Parent (1) Ally Bank Cash and Cash Equivalents $ 10.1 $ 4.5 $ 9.5 $ 3.6 Unencumbered Securities (2) 0.4 5.2 0.9 5.8 Current Committed Unused Capacity (3) 13.2 6.1 12.0 5.1 Subtotal $ 23.7 $ 15.8 $ 22.4 $ 14.5 Ally Bank Intercompany Loan(4) 2.2 (2.2) 2.3 (2.3) Total Available Liquidity $ 25.9 $ 13.6 $ 24.7 $ 12.2 (1) Parent defined as Ally Consolidated less Ally Bank, ResCap (not shown) and Insurance (not shown) (2) Includes UST, Agency debt and Agency MBS (3) Includes equal allocation of shared unused capacity totaling $4.00 billion in 3Q and $3.96 billion in 2Q, which can be used by Ally Bank or the Parent (including a Mexican subsidiary) . The Parent company figures include $1.5 billion in 3Q and $2.2 billion in 2Q from forward flow sale commitments to fund future asset originations in Brazil. Parent company figures at September 30, 2011 exclude unused capacity of $2.4 billion that was from two new Ally Credit Canada facilities completed in 3Q and that was significantly utilized subsequent to September 30, 2011 primarily to refinance existing debt outstanding (4) To optimize use of cash and secured facility capacity between entities, Ally Financial lends cash to Ally Bank from time to time under an intercompany loan agreement . Amounts outstanding on this loan are repayable to Ally Financial at any time, subject to 5 days notice Ally Financial Inc. Consolidated Unsecured Long-Term Debt Maturity Profile ($ billions) $20 $12 $6 $4 $1 $2 Remaining 2011 2012 2013 2014 2015 2016 and thereafter As of 09/30/2011 3Q 2011 Preliminary Results 28

Supplemental Notes on non -GAAP and other financial measures (1) Core pre-tax income is a non-GAAP financial measure . It is defined as income from continuing operations before taxes and primarily bond exchange original issue discount ("OID") amortization expense . (2) Controllable expenses includes employee related costs, consulting and legal fees, marketing, information technology, facility, portfolio servicing and restructuring expenses . (3) OID amortization expense includes accelerated OID amortization of $20 million in 2Q11 from extinguishment of debt. (4) Net Interest Margin excludes OID amortization expense . The impact of historical financial statement restatements for discontinued operations are not reflected in prior periods . (5) Legacy Portfolio and Other segment primarily consists of loans originated prior to Jan. 1, 2009, and includes non core business activities including portfolios in run off. (6) Corporate and Other as presented includes Commercial Finance Group (“CFG”), certain equity investments and treasury activities including the residual impacts from the corporate funds transfer pricing and asset liability management (“ALM”) activities . (7) Contingent Tier 1 Common calculation assumes full conversion of MCP to common equity and is based on management’s current interpretation of Basel III capital proposals . This proforma capital calculation is subject to change based on final Basel III rulemaking and interpretations thereof by regulatory authorities . (8) Net charge -off ratios are calculated as annualized net charge -offs divided by average outstanding finance receivables and loans excluding loans measured at fair value and loans held-for-sale. (9) Allowance coverage ratios are based on the allowance for loan losses related to loans held-for-investment excluding those loans held at fair value as a percentage of the unpaid principal balance, net of premiums and discounts . 3Q 2011 Preliminary Results 29