Ally Financial Inc. 1Q Earnings Review Contact Ally Investor Relations at (866) 710 - 4623 or investor.relations@ally.com April 26, 2012
2 1Q 2012 Preliminary Results Forward - Looking Statements and Additional Information The following should be read in conjunction with the financial statements, notes and other information contained in the Compa ny’ s 2011 Annual Report on Form 10 - K, Quarterly Reports on Form 10 - Q, and Current Reports on Form 8 - K. This information is preliminary and based on company data available at the time of the presentation In the presentation that follows and related comments by Ally Financial Inc. (“Ally”) management, the use of the words “expec t,” “anticipate,” “estimate,” “forecast,” “initiative,” “objective,” “plan,” “goal,” “project,” “outlook,” “priorities,” “target,” “intend,” “e val uate,” “pursue,” “seek,” “may,” “would,” “could,” “should,” “believe,” “potential,” “continue,” or similar expressions is intended to identify forward - looking s tatements. All statements herein and in related management comments, other than statements of historical fact, including without limitation, statements ab out future events and financial performance, are forward - looking statements that involve certain risks and uncertainties. While these statements r epresent our current judgment on what the future may hold, and we believe these judgments are reasonable, these statements are not guarant ees of any events or financial results, and Ally’s actual results may differ materially due to numerous important factors that are descr ibe d in the most recent reports on SEC Forms 10 - K and 10 - Q for Ally, each of which may be revised or supplemented in subsequent reports filed with the SEC. Such factors include, among others, the following: maintaining the mutually beneficial relationship between Ally and General Moto rs (“GM”), and Ally and Chrysler Group LLC (“Chrysler”); the profitability and financial condition of GM and Chrysler; securing low cost funding for us and Residential Capital, LLC (“ResCap”); our ability to realize the anticipated benefits associated with being a bank holding company, and th e i ncreased regulation and restrictions that we are now subject to; any additional future impact resulting from delayed foreclosure sales or related matters; the potential for legal liability resulting from claims related to the sale of private - label mortgage - backed securities; risks related to pote ntial repurchase obligations due to alleged breaches of representations and warranties in mortgage securitization transactions; changes in U.S . g overnment - sponsored mortgage programs or disruptions in the markets in which our mortgage subsidiaries operate; continued challenges in th e residential mortgage markets; the continuing negative impact on ResCap and our mortgage business generally due to the declines in the U.S. housing market; uncertainty of our ability to enter into transactions or execute strategic alternatives to realize the value of our R esC ap operations; the potential for deterioration in the residual value of off - lease vehicles; disruptions in the market in which we fund our operatio ns, with resulting negative impact on our liquidity; changes in our accounting assumptions that may require or that result from changes in the a cco unting rules or their application, which could result in an impact on earnings; changes in the credit ratings of Ally, ResCap, Chrysler, or G M; changes in economic conditions, currency exchange rates or political stability in the markets in which we operate; and changes in the existing or th e adoption of new laws, regulations, policies or other activities of governments, agencies and similar organizations (including as a result of the Dodd - Frank Act and Basel III). Investors are cautioned not to place undue reliance on forward - looking statements. Ally undertakes no obligation to update publi cly or otherwise revise any forward - looking statements except where expressly required by law. Reconciliation of non - GAAP financial measures incl uded within this presentation are provided in this presentation. Use of the term “loans” describes products associated with direct and indirect lending activities of Ally’s global operations . The specific products include retail installment sales contracts, loans, lines of credit, leases or other financing products. The term “originate” re fers to Ally’s purchase, acquisition or direct origination of various “loan” products.
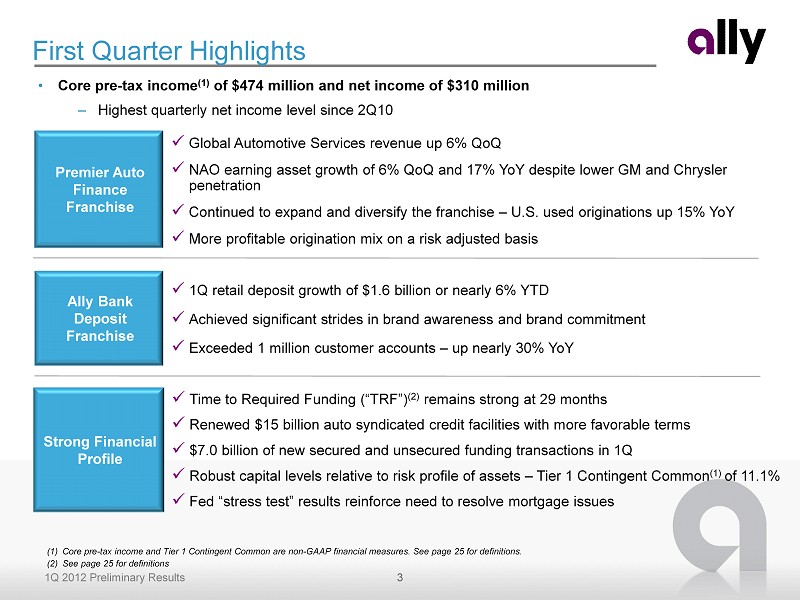
3 1Q 2012 Preliminary Results x 1Q retail deposit growth of $1.6 billion or nearly 6% YTD x Achieved significant strides in brand awareness and brand commitment x Exceeded 1 million customer accounts – up nearly 30% YoY Premier Auto Finance Franchise x Time to Required Funding (“TRF”) (2) remains strong at 29 months x Renewed $15 billion auto syndicated credit facilities with more favorable terms x $7.0 billion of new secured and unsecured funding transactions in 1Q x Robust capital levels relative to risk profile of assets – Tier 1 Contingent Common (1) of 11.1% x Fed “stress test” results reinforce need to resolve mortgage issues Strong Financial Profile Ally Bank Deposit Franchise x Global Automotive Services revenue up 6% QoQ x NAO earning asset growth of 6% QoQ and 17% YoY despite lower GM and Chrysler penetration x Continued to expand and diversify the franchise – U.S. used originations up 15% YoY x More profitable origination mix on a risk adjusted basis First Quarter Highlights (1) Core pre - tax income and Tier 1 Contingent Common are non - GAAP financial measures. See page 25 for definitions. (2) See page 25 for definitions • Core pre - tax income (1) of $474 million and net income of $310 million – Highest quarterly net income level since 2Q10

4 1Q 2012 Preliminary Results Pre-Tax Income ($ millions) 1Q 12 4Q 11 1Q 11 4Q 11 1Q 11 North American Automotive Finance 442$ 478$ 518$ (36)$ (76)$ International Automotive Finance 45 21 31 24 14 Insurance 124 93 131 31 (7) Global Automotive Services 611$ 592$ 680$ 19$ (69)$ Mortgage Origination and Servicing 217 (193) 85 410 132 Legacy Portfolio and Other (1) (26) (65) (42) 39 16 Mortgage Operations 191$ (258)$ 43$ 449$ 148$ Corporate and Other (ex. OID) (1) (328) (314) (298) (14) (30) Core pre-tax income (2) 474$ 20$ 425$ 454$ 49$ Increase/(Decrease) vs. Results by Segment (1) See page 25 for definitions (2) Core pre - tax income is a non - GAAP financial measure. See page 25 for definitions. • Global Automotive Services continues to post attractive and stable results – Expect continued revenue growth – Impact from lease remarketing gains has normalized • Mortgage Operations impacted by favorable MSR performance and higher consumer lending channel originations

5 1Q 2012 Preliminary Results Premier Auto Finance Franchise • Ally continues to successfully transform its business model from a captive to an independent market driven competitor • Ally has diversified and expanded its business across several dimensions: – Dealer relationships – Product offerings – Credit spectrum – Manufacturer relationships • While Ally maintains important and close relationships with manufacturers, the auto dealer is Ally’s primary customer which drives success • As expected, Chrysler has provided notification that the agreement relating to subvented loan rights will not be extended after April 2013 – Only subvented loans are covered by the contract – Ally already competes for all other products in the marketplace – Subvented Chrysler retail loans currently comprise only 3% of Ally’s earning assets – We expect to continue to play a significant role with the Chrysler dealer network Expanding relationships as diversified, independent company Maintaining strong dealer penetration despite aggressive competition Diversifying key dealer relationships 1Q 12 1Q 11 U.S. Dealer Relationships 13,870 12,732 Dealers using 4 or more Ally products 5,239 5,210 Non-GM Dealers using 4 or more Ally products 1,648 1,524
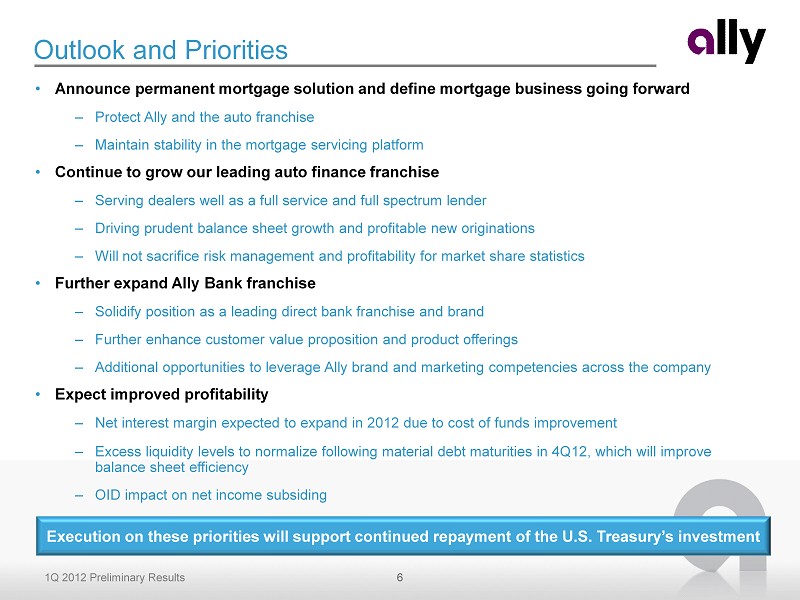
6 1Q 2012 Preliminary Results Outlook and Priorities • Announce permanent mortgage solution and define mortgage business going forward – Protect Ally and the auto franchise – Maintain stability in the mortgage servicing platform • Continue to grow our leading auto finance franchise – Serving dealers well as a full service and full spectrum lender – Driving prudent balance sheet growth and profitable new originations – Will not sacrifice risk management and profitability for market share statistics • Further expand Ally Bank franchise – Solidify position as a leading direct bank franchise and brand – Further enhance customer value proposition and product offerings – Additional opportunities to leverage Ally brand and marketing competencies across the company • Expect improved profitability – Net interest margin expected to expand in 2012 due to cost of funds improvement – Excess liquidity levels to normalize following material debt maturities in 4Q12, which will improve balance sheet efficiency – OID impact on net income subsiding Execution on these priorities will support continued repayment of the U.S. Treasury’s investment

7 1Q 2012 Preliminary Results ($ millions) 1Q 12 4Q 11 1Q 11 4Q 11 1Q 11 Net financing revenue (ex. OID) 777$ 743$ 840$ 34$ (63)$ Total other revenue (ex. OID) 1,187 977 1,038 210 149 Provision for loan losses 140 6 113 134 27 Controllable expenses (1) 906 965 835 (59) 71 Other noninterest expenses 444 729 505 (285) (61) - - Core pre-tax income(1) 474$ 20$ 425$ 454$ 49$ OID amortization expense (1) 108 137 326 (29) (218) Income tax expense 64 73 (70) (9) 134 Income (loss) from discontinued operations 8 (16) (23) 24 31 Net income (loss) 310$ (206)$ 146$ 516$ 164$ (206)$ # 146$ Notable Items: 1Q 12 4Q 11 1Q 11 4Q 11 1Q 11 Net operating lease revenue 247 199 385 48 (138) Net mortgage servicing revenue 290 166 225 124 65 Mortgage repurchase expense (19) (44) (26) 25 7 Foreclosure settlement expense accrual - (226) - 226 - Increase/(Decrease) vs. Favorable / (Unfavorable) vs. First Quarter Results (1) See page 25 for definitions
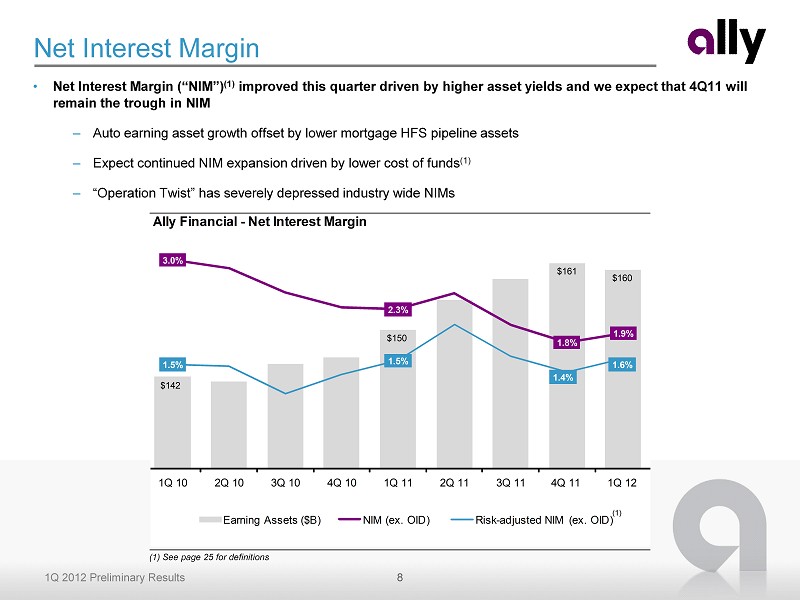
8 1Q 2012 Preliminary Results Ally Financial - Net Interest Margin $142 $150 $161 $160 3.0% 2.3% 1.8% 1.9% 1.5% 1.5% 1.4% 1.6% 1Q 10 2Q 10 3Q 10 4Q 10 1Q 11 2Q 11 3Q 11 4Q 11 1Q 12 Earning Assets ($B) NIM (ex. OID) Risk - adjusted NIM (ex. OID) Net Interest Margin • Net Interest Margin (“NIM”) (1) improved this quarter driven by higher asset yields and we expect that 4Q11 will remain the trough in NIM – Auto earning asset growth offset by lower mortgage HFS pipeline assets – Expect continued NIM expansion driven by lower cost of funds (1) – “Operation Twist ” has severely depressed industry wide NIMs (1) See page 25 for definitions (1)
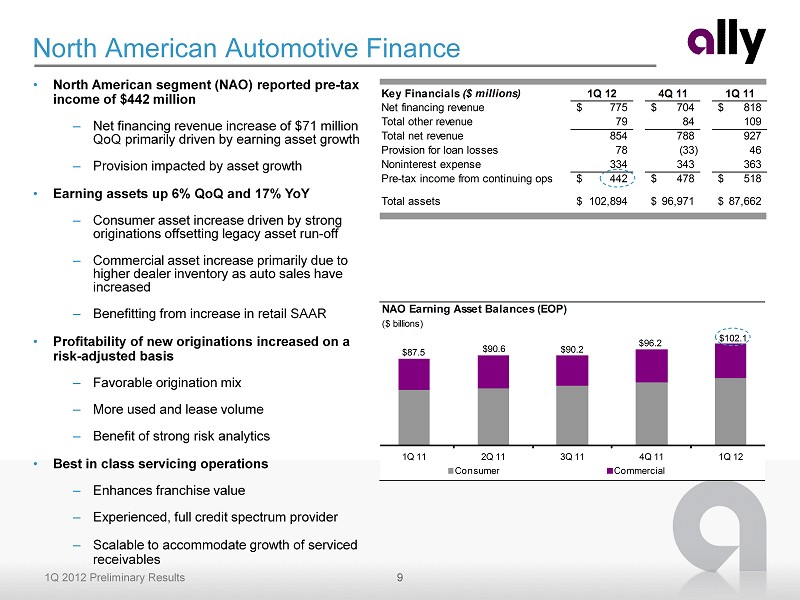
9 1Q 2012 Preliminary Results NAO Earning Asset Balances (EOP) ($ billions) $87.5 $90.6 $90.2 $96.2 $102.1 1Q 11 2Q 11 3Q 11 4Q 11 1Q 12 Consumer Commercial Key Financials ($ millions) 1Q 12 4Q 11 1Q 11 Net financing revenue 775$ 704$ 818$ Total other revenue 79 84 109 Total net revenue 854 788 927 Provision for loan losses 78 (33) 46 Noninterest expense 334 343 363 Pre-tax income from continuing ops 442$ 478$ 518$ Total assets 102,894$ 96,971$ 87,662$ • North American segment (NAO) reported pre - tax income of $442 million – Net financing revenue increase of $71 million QoQ primarily driven by earning asset growth – Provision impacted by asset growth • Earning assets up 6% QoQ and 17% YoY – Consumer asset increase driven by strong originations offsetting legacy asset run - off – Commercial asset increase primarily due to higher dealer inventory as auto sales have increased – Benefitting from increase in retail SAAR • Profitability of new originations increased on a risk - adjusted basis – Favorable origination mix – More used and lease volume – Benefit of strong risk analytics • Best in class servicing operations – Enhances franchise value – Experienced, full credit spectrum provider – Scalable to accommodate growth of serviced receivables North American Automotive Finance
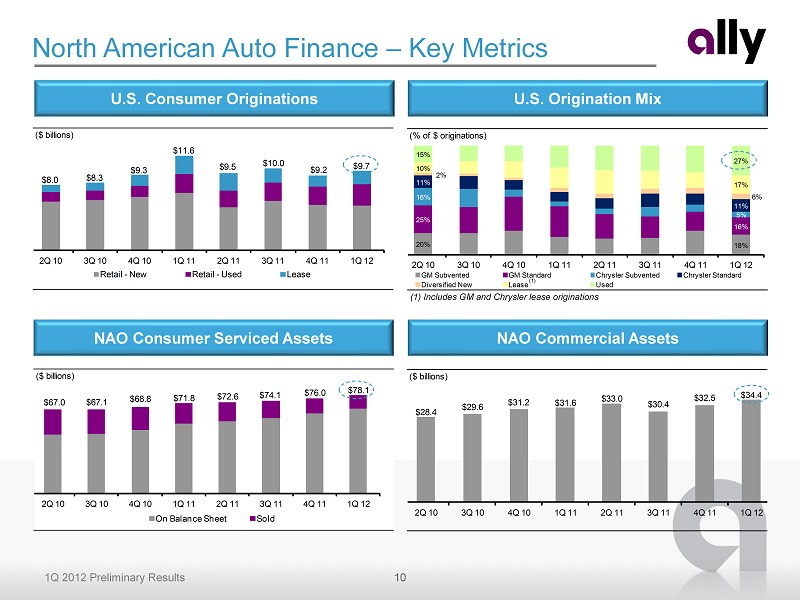
10 1Q 2012 Preliminary Results ($ billions) $67.0 $67.1 $68.8 $71.8 $72.6 $74.1 $76.0 $78.1 2Q 10 3Q 10 4Q 10 1Q 11 2Q 11 3Q 11 4Q 11 1Q 12 On Balance Sheet Sold (% of $ originations) 20% 18% 25% 16% 16% 5% 11% 11% 2% 6% 10% 17% 15% 27% 2Q 10 3Q 10 4Q 10 1Q 11 2Q 11 3Q 11 4Q 11 1Q 12 GM Subvented GM Standard Chrysler Subvented Chrysler Standard Diversified New Lease Used ($ billions) $8.0 $8.3 $9.3 $11.6 $9.5 $10.0 $9.2 $9.7 2Q 10 3Q 10 4Q 10 1Q 11 2Q 11 3Q 11 4Q 11 1Q 12 Retail - New Retail - Used Lease ($ billions) $28.4 $29.6 $31.2 $31.6 $33.0 $30.4 $32.5 $34.4 2Q 10 3Q 10 4Q 10 1Q 11 2Q 11 3Q 11 4Q 11 1Q 12 North American Auto Finance – Key Metrics (1) Includes GM and Chrysler lease originations (1) NAO Consumer Serviced Assets NAO Commercial Assets U.S. Consumer Originations U.S. Origination Mix
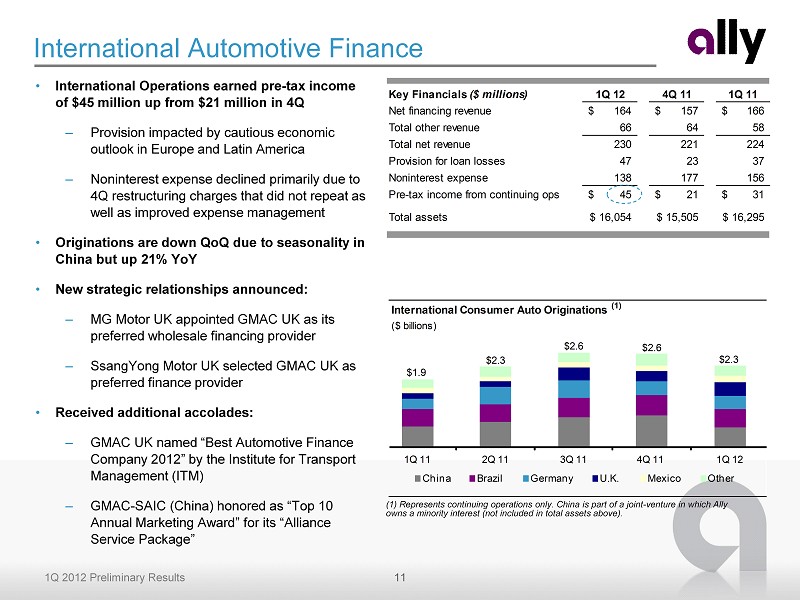
11 1Q 2012 Preliminary Results Key Financials ($ millions) 1Q 12 4Q 11 1Q 11 Net financing revenue 164$ 157$ 166$ Total other revenue 66 64 58 Total net revenue 230 221 224 Provision for loan losses 47 23 37 Noninterest expense 138 177 156 Pre-tax income from continuing ops 45$ 21$ 31$ Total assets 16,054$ 15,505$ 16,295$ • International Operations earned pre - tax income of $45 million up from $21 million in 4Q – Provision impacted by cautious economic outlook in Europe and Latin America – Noninterest expense declined primarily due to 4Q restructuring charges that did not repeat as well as improved expense management • Originations are down QoQ due to seasonality in China but up 21% YoY • New strategic relationships announced: – MG Motor UK appointed GMAC UK as its preferred wholesale financing provider – SsangYong Motor UK selected GMAC UK as preferred finance provider • Received additional accolades: – GMAC UK named “Best Automotive Finance Company 2012” by the Institute for Transport Management (ITM) – GMAC - SAIC (China) honored as “Top 10 Annual Marketing Award” for its “Alliance Service Package” International Automotive Finance (1) Represents continuing operations only. China is part of a joint - venture in which Ally owns a minority interest (not included in total assets above). International Consumer Auto Originations (1) ($ billions) $1.9 $2.3 $2.6 $2.6 $2.3 1Q 11 2Q 11 3Q 11 4Q 11 1Q 12 China Brazil Germany U.K. Mexico Other
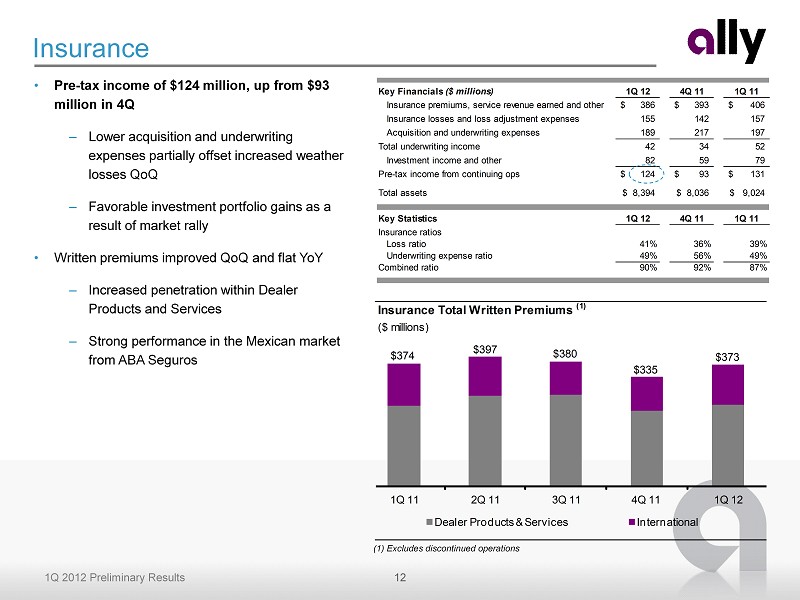
12 1Q 2012 Preliminary Results Key Financials ($ millions) 1Q 12 4Q 11 1Q 11 Insurance premiums, service revenue earned and other 386$ 393$ 406$ Insurance losses and loss adjustment expenses 155 142 157 Acquisition and underwriting expenses 189 217 197 Total underwriting income 42 34 52 Investment income and other 82 59 79 Pre-tax income from continuing ops 124$ 93$ 131$ Total assets 8,394$ 8,036$ 9,024$ Key Statistics 1Q 12 4Q 11 1Q 11 Insurance ratios Loss ratio 41% 36% 39% Underwriting expense ratio 49% 56% 49% Combined ratio 90% 92% 87% Insurance • Pre - tax income of $124 million, up from $93 million in 4Q – Lower acquisition and underwriting expenses partially offset increased weather losses QoQ – Favorable investment portfolio gains as a result of market rally • Written premiums improved QoQ and flat YoY – Increased penetration within Dealer Products and Services – Strong performance in the Mexican market from ABA Seguros (1) Excludes discontinued operations Insurance Total Written Premiums (1) ($ millions) $374 $397 $380 $335 $373 1Q 11 2Q 11 3Q 11 4Q 11 1Q 12 Dealer Products & Services International
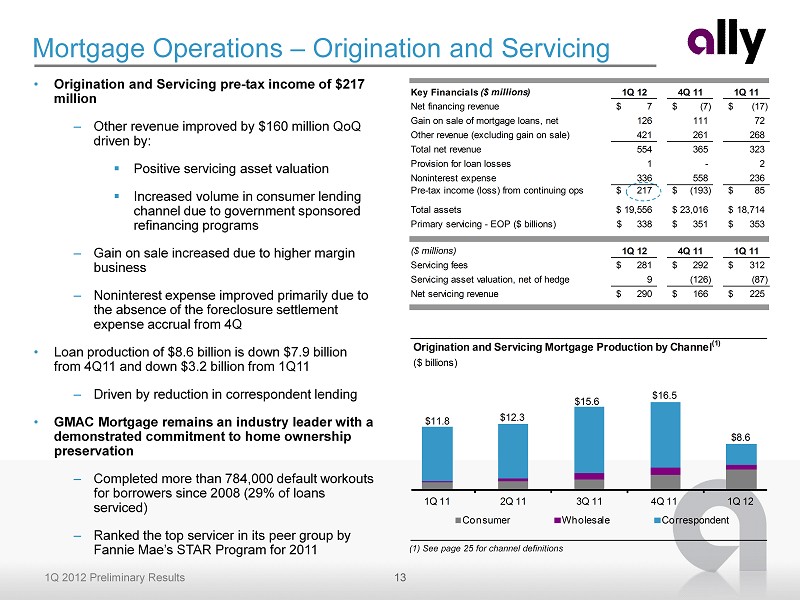
13 1Q 2012 Preliminary Results Key Financials ($ millions) 1Q 12 4Q 11 1Q 11 Net financing revenue 7$ (7)$ (17)$ Gain on sale of mortgage loans, net 126 111 72 Other revenue (excluding gain on sale) 421 261 268 Total net revenue 554 365 323 Provision for loan losses 1 - 2 Noninterest expense 336 558 236 Pre-tax income (loss) from continuing ops 217$ (193)$ 85$ Total assets 19,556$ 23,016$ 18,714$ Primary servicing - EOP ($ billions) 338$ 351$ 353$ TRUE ($ millions) 1Q 12 4Q 11 1Q 11 Servicing fees 281$ 292$ 312$ Servicing asset valuation, net of hedge 9 (126) (87) Net servicing revenue 290$ 166$ 225$ Mortgage Operations – Origination and Servicing • Origination and Servicing pre - tax income of $217 million – Other revenue improved by $160 million QoQ driven by: ▪ Positive servicing asset valuation ▪ Increased volume in consumer lending channel due to government sponsored refinancing programs – Gain on sale increased due to higher margin business – Noninterest expense improved primarily due to the absence of the foreclosure settlement expense accrual from 4Q • Loan production of $8.6 billion is down $7.9 billion from 4Q11 and down $3.2 billion from 1Q11 – Driven by reduction in correspondent lending • GMAC Mortgage remains an industry leader with a demonstrated commitment to home ownership preservation – Completed more than 784,000 default workouts for borrowers since 2008 (29% of loans serviced) – Ranked the top servicer in its peer group by Fannie Mae’s STAR Program for 2011 (1) See page 25 for channel definitions Origination and Servicing Mortgage Production by Channel (1) ($ billions) $11.8 $12.3 $15.6 $16.5 $8.6 1Q 11 2Q 11 3Q 11 4Q 11 1Q 12 Consumer Wholesale Correspondent
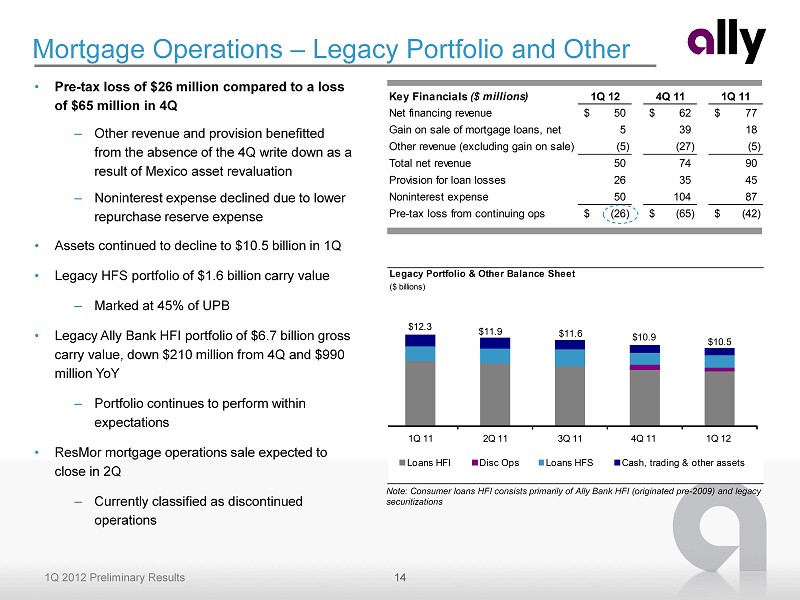
14 1Q 2012 Preliminary Results Legacy Portfolio & Other Balance Sheet ($ billions) $12.3 $11.9 $11.6 $10.9 $10.5 1Q 11 2Q 11 3Q 11 4Q 11 1Q 12 Loans HFI Disc Ops Loans HFS Cash, trading & other assets Key Financials ($ millions) 1Q 12 4Q 11 1Q 11 Net financing revenue 50$ 62$ 77$ Gain on sale of mortgage loans, net 5 39 18 Other revenue (excluding gain on sale) (5) (27) (5) Total net revenue 50 74 90 Provision for loan losses 26 35 45 Noninterest expense 50 104 87 Pre-tax loss from continuing ops (26)$ (65)$ (42)$ Mortgage Operations – Legacy Portfolio and Other • Pre - tax loss of $26 million compared to a loss of $65 million in 4Q – Other revenue and provision benefitted from the absence of the 4Q write down as a result of Mexico asset revaluation – Noninterest expense declined due to lower repurchase reserve expense • Assets continued to decline to $10.5 billion in 1Q • Legacy HFS portfolio of $1.6 billion carry value – Marked at 45% of UPB • Legacy Ally Bank HFI portfolio of $6.7 billion gross carry value, down $210 million from 4Q and $990 million YoY – Portfolio continues to perform within expectations • ResMor mortgage operations sale expected to close in 2Q – Currently classified as discontinued operations Note: Consumer loans HFI consists primarily of Ally Bank HFI (originated pre - 2009) and legacy securitizations
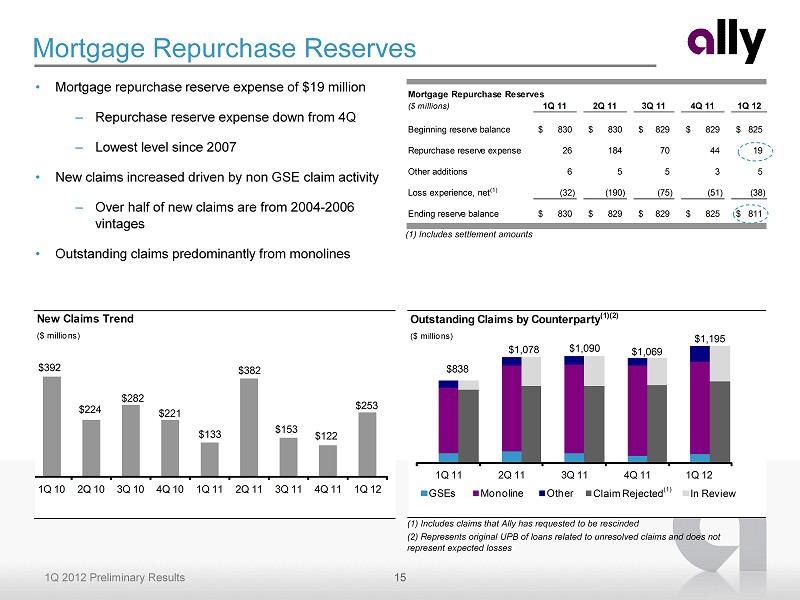
15 1Q 2012 Preliminary Results Mortgage Repurchase Reserves ($ millions) 1Q 11 2Q 11 3Q 11 4Q 11 1Q 12 Beginning reserve balance 830$ 830$ 829$ 829$ 825$ Repurchase reserve expense 26 184 70 44 19 Other additions 6 5 5 3 5 Loss experience, net (1) (32) (190) (75) (51) (38) Ending reserve balance 830$ 829$ 829$ 825$ 811$ Outstanding Claims by Counterparty (1)(2) ($ millions) 1Q 11 2Q 11 3Q 11 4Q 11 1Q 12 Claim Rejected In Review $838 $1,078 $1,090 $1,069 $1,195 1Q 11 2Q 11 3Q 11 4Q 11 1Q 12 GSEs Monoline Other Mortgage Repurchase Reserves • Mortgage repurchase reserve expense of $19 million – Repurchase reserve expense down from 4Q – Lowest level since 2007 • New claims increased driven by non GSE claim activity – Over half of new claims are from 2004 - 2006 vintages • Outstanding claims predominantly from monolines (1) Includes claims that Ally has requested to be rescinded (2) Represents original UPB of loans related to unresolved claims and does not represent expected losses (1) Includes settlement amounts (1) New Claims Trend ($ millions) $392 $224 $282 $221 $133 $382 $153 $122 $253 1Q 10 2Q 10 3Q 10 4Q 10 1Q 11 2Q 11 3Q 11 4Q 11 1Q 12
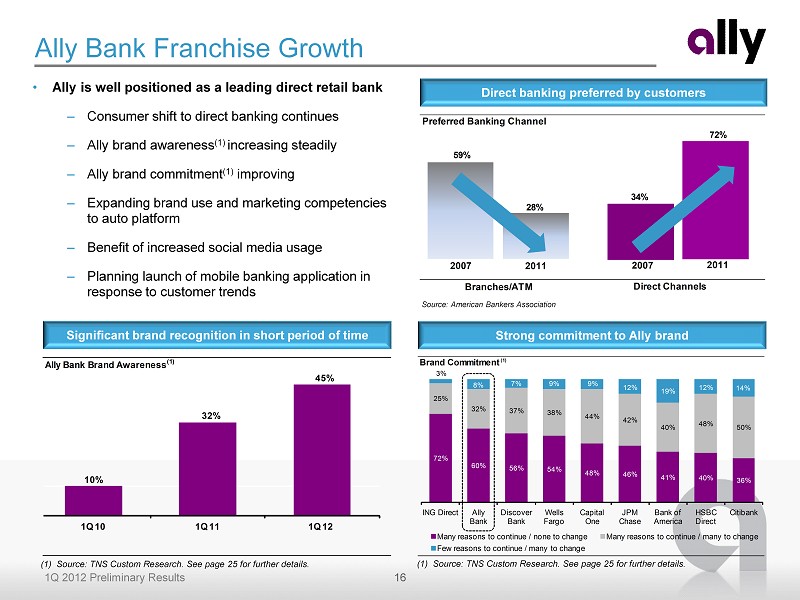
16 1Q 2012 Preliminary Results • Ally is well positioned as a leading direct retail bank – Consumer shift to direct banking continues – Ally brand awareness (1) increasing steadily – Ally brand commitment (1) improving – Expanding brand use and marketing competencies to auto platform – Benefit of increased social media usage – Planning launch of mobile banking application in response to customer trends Ally Bank Franchise Growth Direct banking preferred by customers Strong commitment to Ally brand Source: American Bankers Association Preferred Banking Channel 59% 34% 28% 72% 2011 2011 2007 Direct Channels 2007 Branches/ ATM (1) Source: TNS Custom Research. See page 25 for further details. Significant brand recognition in short period of time (1) Source: TNS Custom Research. See page 25 for further details. Brand Commitment (1) 72% 60% 56% 54% 48% 46% 41% 40% 36% 25% 32% 37% 38% 44% 42% 40% 48% 50% 3% 8% 7% 9% 9% 12% 19% 12% 14% 0% 20% 40% 60% 80% 100% ING Direct Ally Bank Discover Bank Wells Fargo Capital One JPM Chase Bank of America HSBC Direct Citibank Many reasons to continue / none to change Many reasons to continue / many to change Few reasons to continue / many to change Ally Bank Brand Awareness (1) 10% 32% 45% 1Q 10 1Q 11 1Q 12
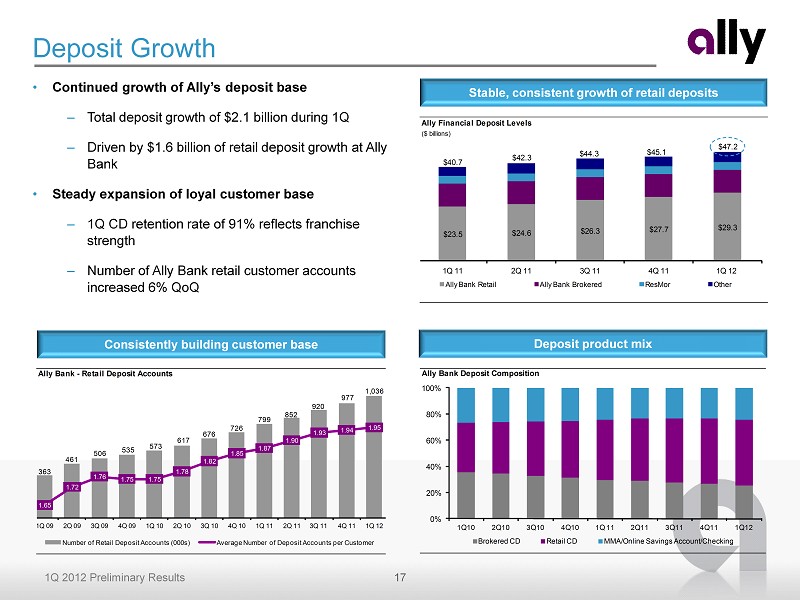
17 1Q 2012 Preliminary Results Ally Financial Deposit Levels ($ billions) $23.5 $24.6 $26.3 $27.7 $29.3 $40.7 $42.3 $44.3 $45.1 $47.2 1Q 11 2Q 11 3Q 11 4Q 11 1Q 12 Ally Bank Retail Ally Bank Brokered ResMor Other Deposit Growth • Continued growth of Ally’s deposit base – Total deposit growth of $2.1 billion during 1Q – Driven by $1.6 billion of retail deposit growth at Ally Bank • Steady expansion of loyal customer base – 1Q CD retention rate of 91% reflects franchise strength – Number of Ally Bank retail customer accounts increased 6% QoQ Stable, consistent growth of retail deposits Deposit product mix Consistently building customer base Ally Bank - Retail Deposit Accounts 363 461 506 535 573 617 676 726 799 852 920 977 1,036 1.65 1.72 1.76 1.75 1.75 1.78 1.82 1.85 1.87 1.90 1.93 1.94 1.95 1Q 09 2Q 09 3Q 09 4Q 09 1Q 10 2Q 10 3Q 10 4Q 10 1Q 11 2Q 11 3Q 11 4Q 11 1Q 12 Number of Retail Deposit Accounts (000s) Average Number of Deposit Accounts per Customer Ally Bank Deposit Composition 0% 20% 40% 60% 80% 100% 1Q10 2Q10 3Q10 4Q10 1Q 11 2Q11 3Q11 4Q11 1Q12 Brokered CD Retail CD MMA/Online Savings Account/Checking
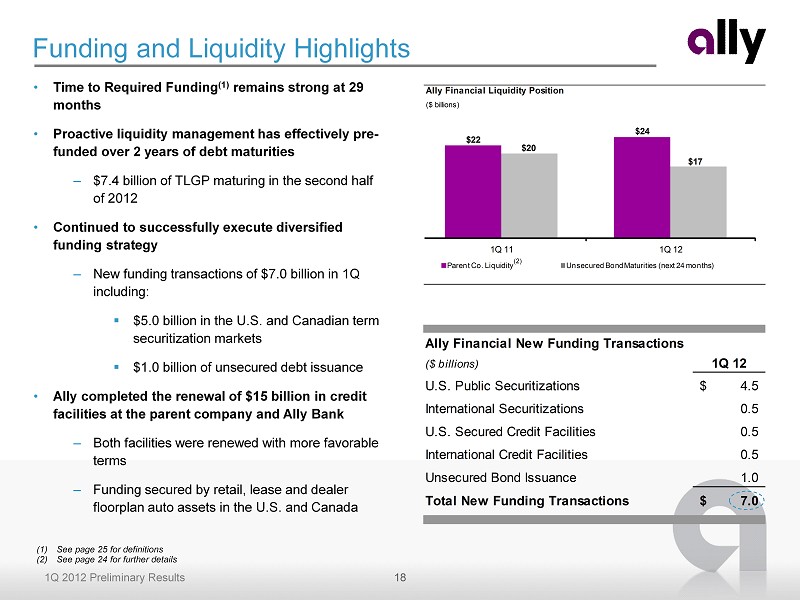
18 1Q 2012 Preliminary Results Ally Financial Liquidity Position ($ billions) $22 $24 1Q 11 1Q 12 Parent Co. Liquidity Unsecured Bond Maturities (next 24 months) $20 $17 Ally Financial New Funding Transactions ($ billions) 1Q 12 U.S. Public Securitizations 4.5$ International Securitizations 0.5 U.S. Secured Credit Facilities 0.5 International Credit Facilities 0.5 Unsecured Bond Issuance 1.0 Total New Funding Transactions 7.0$ • Time to Required Funding (1) remains strong at 29 months • Proactive liquidity management has effectively pre - funded over 2 years of debt maturities – $7.4 billion of TLGP maturing in the second half of 2012 • Continued to successfully execute diversified funding strategy – New funding transactions of $7.0 billion in 1Q including: ▪ $5.0 billion in the U.S. and Canadian term securitization markets ▪ $1.0 billion of unsecured debt issuance • Ally completed the renewal of $15 billion in credit facilities at the parent company and Ally Bank – Both facilities were renewed with more favorable terms – Funding secured by retail, lease and dealer floorplan auto assets in the U.S. and Canada Funding and Liquidity Highlights (1) See page 25 for definitions (2) See page 24 for further details (2)
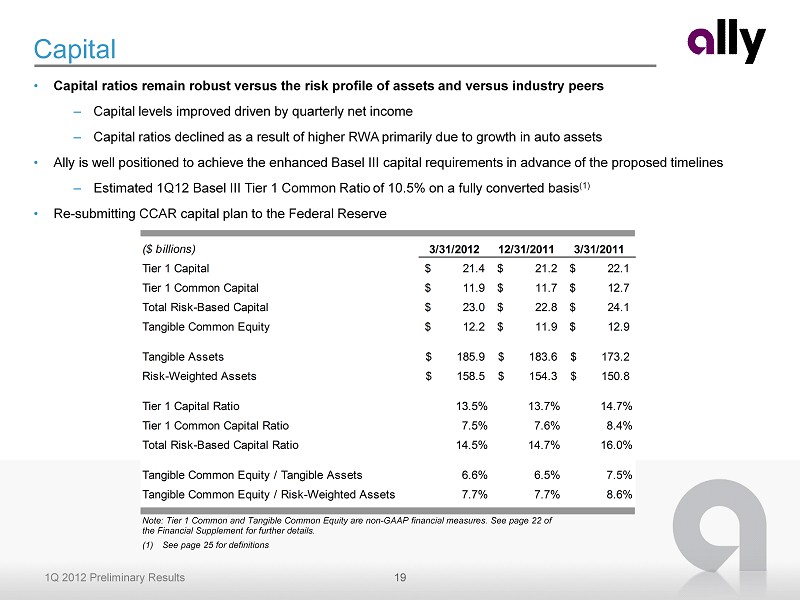
19 1Q 2012 Preliminary Results Capital • Capital ratios remain robust versus the risk profile of assets and versus industry peers – Capital levels improved driven by quarterly net income – Capital ratios declined as a result of higher RWA primarily due to growth in auto assets • Ally is well positioned to achieve the enhanced Basel III capital requirements in advance of the proposed timelines – Estimated 1Q12 Basel III Tier 1 Common Ratio of 10.5% on a fully converted basis (1 ) • Re - submitting CCAR capital plan to the Federal Reserve Note: Tier 1 Common and Tangible Common Equity are non - GAAP financial measures. See page 22 of the Financial Supplement for further details. (1) See page 25 for definitions ($ billions) 3/31/2012 12/31/2011 3/31/2011 Tier 1 Capital 21.4$ 21.2$ 22.1$ Tier 1 Common Capital 11.9$ 11.7$ 12.7$ Total Risk-Based Capital 23.0$ 22.8$ 24.1$ Tangible Common Equity 12.2$ 11.9$ 12.9$ Tangible Assets 185.9$ 183.6$ 173.2$ Risk-Weighted Assets 158.5$ 154.3$ 150.8$ Tier 1 Capital Ratio 13.5% 13.7% 14.7% Tier 1 Common Capital Ratio 7.5% 7.6% 8.4% Total Risk-Based Capital Ratio 14.5% 14.7% 16.0% Tangible Common Equity / Tangible Assets 6.6% 6.5% 7.5% Tangible Common Equity / Risk-Weighted Assets 7.7% 7.7% 8.6%

20 1Q 2012 Preliminary Results Global Auto Delinquencies - Managed Retail Contract Amount $ Amount of Accruing Contracts Greater than 30 Days Past Due (millions) $805 $871 $861 $937 $705 1.42% 1.48% 1.43% 1.47% 1.04% 1Q 11 2Q 11 3Q 11 4Q 11 1Q 12 Delinquent Contracts $ % of Retail Contract $ Outstanding Global Auto Annualized Credit Losses - Managed Retail Contract Amount ($ millions) $112 $60 $71 $78 $73 0.83% 0.41% 0.48% 0.51% 0.44% 1Q 11 2Q 11 3Q 11 4Q 11 1Q 12 Credit Losses % of Avg. Managed Assets Consolidated Asset Quality Trends $ millions $106,488 $109,779 $107,871 $113,920 $118,986 0.73% 0.45% 0.45% 0.43% 0.37% 0.00% 0.10% 0.20% 0.30% 0.40% 0.50% 0.60% 0.70% 0.80% 1Q 11 2Q 11 3Q 11 4Q 11 1Q 12 Ending Loan Balance Net Charge - Off % Allowance Balance as % of NCOs $ millions 239.1% 358.0% 329.3% 313.8% 361.2% 1Q 11 2Q 11 3Q 11 4Q 11 1Q 12 Net charge - off ratio declined 50% YoY 3.6x reserve coverage of net charge - offs Asset Quality Global auto net credit loss ratio down 46% YoY Global auto delinquencies down seasonally Note: Above loans are classified as held - for - investment recorded at historical costs as these loans are included in our allowance for loan losses. See page 25 for further details . Note: See page 25 for further details
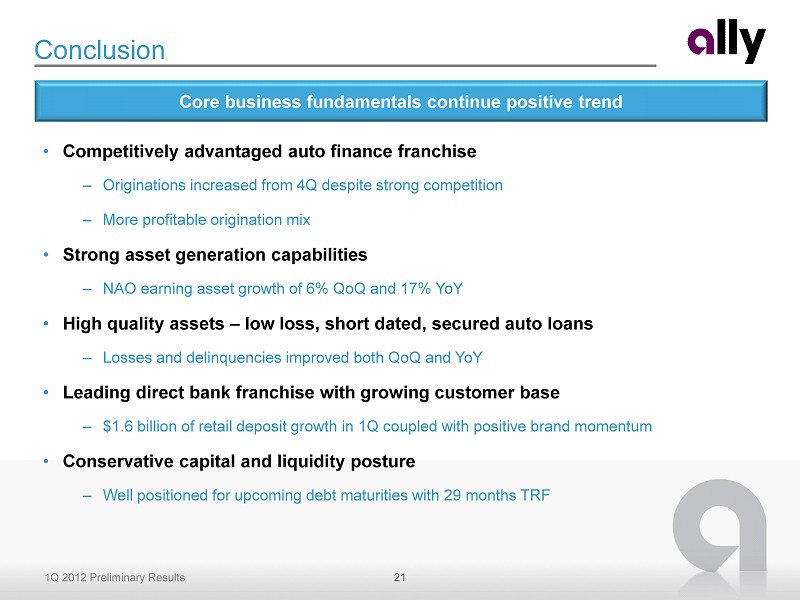
21 1Q 2012 Preliminary Results Conclusion • Competitively advantaged auto finance franchise – Originations increased from 4Q despite strong competition – More profitable origination mix • Strong asset generation capabilities – NAO earning asset growth of 6% QoQ and 17% YoY • High quality assets – low loss, short dated, secured auto loans – Losses and delinquencies improved both QoQ and YoY • Leading direct bank franchise with growing customer base – $1.6 billion of retail deposit growth in 1Q coupled with positive brand momentum • Conservative capital and liquidity posture – Well positioned for upcoming debt maturities with 29 months TRF Core business fundamentals continue positive trend
Supplemental Charts
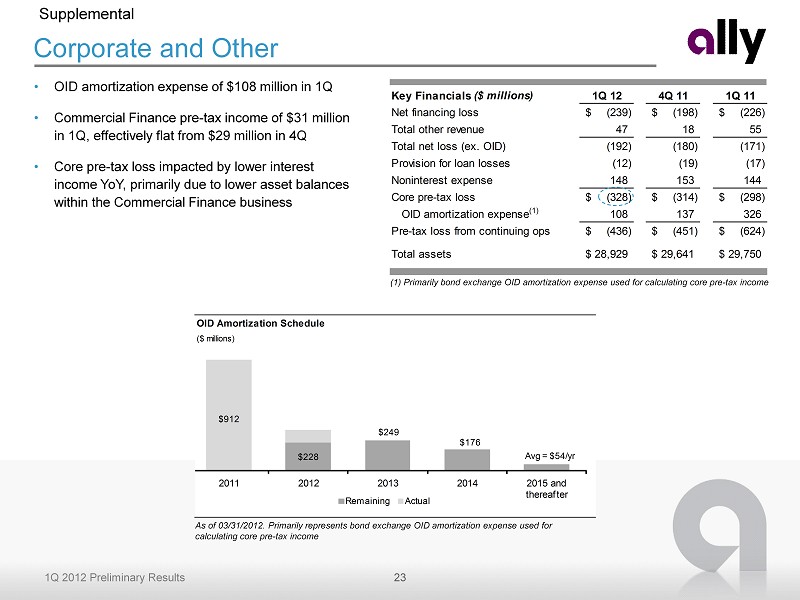
23 1Q 2012 Preliminary Results Key Financials ($ millions) 1Q 12 4Q 11 1Q 11 Net financing loss (239)$ (198)$ (226)$ Total other revenue 47 18 55 Total net loss (ex. OID) (192) (180) (171) Provision for loan losses (12) (19) (17) Noninterest expense 148 153 144 Core pre-tax loss (328)$ (314)$ (298)$ OID amortization expense (1) 108 137 326 Pre-tax loss from continuing ops (436)$ (451)$ (624)$ Total assets 28,929$ 29,641$ 29,750$ Corporate and Other • OID amortization expense of $108 million in 1Q • Commercial Finance pre - tax income of $31 million in 1Q , effectively flat from $29 million in 4Q • Core pre - tax loss impacted by lower interest income YoY, primarily due to lower asset balances within the Commercial Finance business Supplemental (1) Primarily bond exchange OID amortization expense used for calculating core pre - tax income As of 03/31/2012. Primarily represents bond exchange OID amortization expense used for calculating core pre - tax income OID Amortization Schedule ($ millions) $912 $228 $249 $176 Avg = $54/yr 2011 2012 2013 2014 2015 and thereafter Remaining Actual

24 1Q 2012 Preliminary Results Liquidity and Unsecured Debt Maturity Profile Supplemental (1) Parent defined as Ally Consolidated less Ally Bank, ResCap (not shown) and Insurance (not shown) (2) Includes UST, Agency debt and Agency MBS (3) Includes equal allocation of shared unused capacity totaling $3.8 billion in 1Q12, $2.5 billion in 4Q11 and $3.9 billion in 1 Q11 , which can be used by Ally Bank or the Parent (including a Mexican subsidiary). (4) To optimize use of cash and secured facility capacity between entities, Ally Financial lends cash to Ally Bank from time to time un der an intercompany loan agreement. Amounts outstanding on this loan are repayable to Ally Financial at any time, subject to 5 days notice. (5) Represents capacity from certain forward purchase commitments and committed secured facilities that are generally reliant upo n t he origination of future automotive receivables over the next 12 months. As of 03/31/2012 Ally Financial Inc. Consolidated Unsecured Long-Term Debt Maturity Profile ($ billions) $11 $3 $6 $4 $21 Remaining 2012 2013 2014 2015 2016 and thereafter Available Liquidity 3/31/2012 12/31/2011 3/31/2011 ($ billions) Parent (1) Ally Bank Parent (1) Ally Bank Parent (1) Ally Bank Cash and Cash Equivalents 6.8$ 4.4$ 8.0$ 3.6$ 7.6$ 3.7$ Highly Liquid Securities (2) 0.2 5.4 0.8 6.4 1.2 5.0 Current Committed Unused Capacity (3) 12.0 6.7 10.1 4.9 10.2 4.9 Subtotal 19.0$ 16.5$ 18.9$ 14.9$ 19.0$ 13.6$ Ally Bank Intercompany Loan (4) 3.0 (3.0) 4.9 (4.9) 2.3 (2.3) SubtotalTotal Current Available Liquidity 22.0$ 13.5$ 23.8$ 10.0$ 21.3$ 11.3$ Forward Committed Unused Capacity (5) 2.5 - 3.1 - 0.7 - Total Available Liquidity 24.5$ 13.5$ 26.9$ 10.0$ 22.0$ 11.3$
25 1Q 2012 Preliminary Results Notes on non - GAAP and other financial measures Supplemental (1) Core pre - tax income is a non - GAAP financial measure. It is defined as income from continuing operations before taxes and primarily bond exchange or iginal issue discount ("OID") amortization expense. (2) Time to Required funding (“TRF”) is a liquidity risk measure expressed as the number of months that Ally Financial can meet its ongoing liquidity needs as the y a rise without issuing unsecured debt. The TRF metric assumes that North American asset growth projections remain unchanged and that the aut o A BS markets remain open. (3) Basel III Tier 1 Contingent Common calculation assumes full conversion of MCP to common equity and is based on management’s current interpretation of Basel III capital proposals. This proforma capital calculation is subject to change based on final Basel III rulemaking and interpretations the reo f by regulatory authorities. Note, Basel I Tier 1 Contingent Common also assumes full conversion of MCP to common equity (4) Legacy Portfolio and Other segment primarily consists of loans originated prior to Jan. 1, 2009, and includes non core business activities including por tf olios in run off. (5) Corporate and Other primarily consists of centralized corporate treasury and deposit gathering activities, such as management of the cash and cor por ate investment securities portfolios, short and long term debt, retail and brokered deposit liabilities, derivative instruments, the amortization of th e d iscount associated with new debt issuances and bond exchanges, most notably from the December 2008 bond exchange, and the residual impacts of our corporate funds transfer pricin g ( FTP) and treasury asset liability management (ALM) activities. The segment also includes our Commercial Finance Group, certain equity investments and reclassifications and eliminations between the reportable operating segments. (6) Controllable expenses include employee related costs, consulting and legal fees, marketing, information technology, facility, portfolio servicing a nd restructuring expenses. (7) OID amortization expense includes accelerated OID amortization of $30 million in 1Q11 from extinguishment of debt. (8) Net Interest Margin (“NIM”) and Cost of Funds (“COF”) exclude OID amortization expense. The impact of historical financial statement restatements for discontinued operations are not reflected in prior periods . (9) Risk Adjusted NIM is calculated as net interest margin (ex. OID) less annualized net charge - off ratio. ( 10) U.S. Mortgage Loan Production Channels Correspondent – Loans purchased from correspondent lenders are originated or purchased by the correspondent lenders and subsequently sold to us. All of the purchases from correspondent lenders are conducted through Ally Bank. We qualify and approve lenders who participate in the loan purchase pr ogr ams. Consumer – Our direct - lending network consists of internet and telephone - based call center operations as well as our retail network. Virtua lly all of the residential mortgage loans of this channel are brokered to Ally Bank. Wholesale – Residential mortgage loans originated through mortgage brokers. We review and underwrite the application submitted by the mor tg age broker, approve or deny the application, set the interest rate and other terms of the loan and, upon acceptance by the borrower and the satisfaction of a ll conditions required by us, fund the loan through Ally Bank. We qualify and approve all mortgage brokers who generate mortgage loans and continually monitor their performance. (11) Brand Awareness and Brand Commitment provided by an outside firm, TNS Custom Research. TNS is the world's largest custom market research specialist, providing innovative market research expertise across the product life - cycle, in 80 countries. (12) Net charge - off ratios are calculated as annualized net charge - offs divided by average outstanding finance receivables and loans excluding loans measur ed at fair value and loans held - for - sale. (13) Allowance coverage ratios are based on the allowance for loan losses related to loans held - for - investment excluding those loans held at fair value as a p ercentage of the unpaid principal balance, net of premiums and discounts.