
Ally Financial Inc. 3Q Earnings Review Contact Ally Investor Relations at (866) 710 - 4623 or investor.relations@ally.com November 2, 2012
2 3Q 2012 Preliminary Results Forward - Looking Statements and Additional Information The following should be read in conjunction with the financial statements, notes and other information contained in the Compa ny’ s 2011 Annual Report on Form 10 - K, Quarterly Reports on Form 10 - Q, and Current Reports on Form 8 - K . This information is preliminary and based on company data available at the time of the presentation In the presentation that follows and related comments by Ally Financial Inc. (“Ally”) management, the use of the words “expec t,” “anticipate,” “estimate,” “forecast,” “initiative,” “objective,” “plan,” “goal,” “project,” “outlook,” “priorities,” “target,” “intend,” “e val uate,” “pursue,” “seek,” “may,” “ would, ” “ could, ” “ should, ” “ believe, ” “ potential, ” “ continue,” , or the negative of these words, or similar expressions is intended to identify forward - looking statements. All statements herein and in related management comments, other than statements of historical fact, including without limitation, statements about future events and financial performance, are forward - looking statements that involve certain risks and uncertainties. While these statements represent Ally’s current judgment on what the future may hold, and Ally believes these judgments are reasonable, these statements are not guarantees of any events or financial results, and Ally’s actual results may differ materially due to nume rou s important factors that are described in the most recent reports on SEC Forms 10 - K and 10 - Q for Ally, each of which may be revised or supplemented in subsequent reports filed with the SEC. Such factors include, among others, the following: maintaining the mutually beneficial relationsh ip between Ally and General Motors (“GM”), and Ally and Chrysler Group LLC (“Chrysler”); the profitability and financial condition of GM and Chry sle r; bankruptcy court approval of the plan and settlement related to the bankruptcy filings by Residential Capital, LLC and certain of its su bsi diaries; our ability to realize the anticipated benefits associated with being a bank holding company, and the increased regulation and restrictions tha t we are now subject to; the potential for deterioration in the residual value of off - lease vehicles; disruptions in the market in which we f und our operations, with resulting negative impact on our liquidity; changes in our accounting assumptions that may require or that result from change s i n the accounting rules or their application, which could result in an impact on earnings; changes in the credit ratings of Ally, Chrysler, or GM; changes in economic conditions, currency exchange rates or political stability in the markets in which we operate; and changes in the existing or th e adoption of new laws, regulations, policies or other activities of governments, agencies and similar organizations (including as a result of the Dodd - Frank Act and Basel III). Investors are cautioned not to place undue reliance on forward - looking statements. Ally undertakes no obligation to update publi cly or otherwise revise any forward - looking statements except where expressly required by law. Reconciliation of non - GAAP financial measures incl uded within this presentation are provided in this presentation. Use of the term “loans” describes products associated with direct and indirect lending activities of Ally’s global operations . T he specific products include retail installment sales contracts, loans, lines of credit, leases or other financing products. The term “originate” ref ers to Ally’s purchase, acquisition or direct origination of various “loan” products .
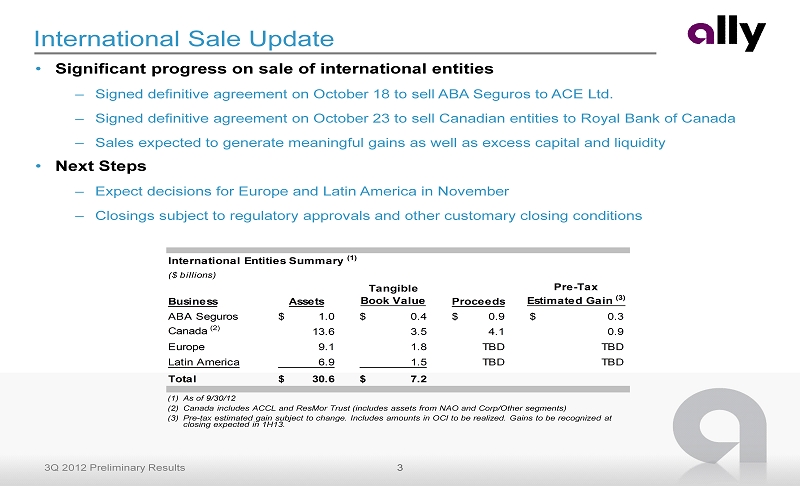
3 3Q 2012 Preliminary Results International Sale Update • Significant progress on sale of international entities – Signed definitive agreement on October 18 to sell ABA Seguros to ACE Ltd. – Signed definitive agreement on October 23 to sell Canadian entities to Royal Bank of Canada – Sales expected to generate meaningful gains as well as excess capital and liquidity • Next Steps – Expect decisions for Europe and Latin America in November – Closings subject to regulatory approvals and other customary closing conditions (1) As of 9/30/12 (2) Canada includes ACCL and ResMor Trust (includes assets from NAO and Corp/Other segments) (3) Pre - tax estimated gain subject to change. Includes amounts in OCI to be realized. Gains to be recognized at closing expected in 1H13. International Entities Summary (1) ($ billions) Business Assets Tangible Book Value Proceeds Pre-Tax Estimated Gain (3) ABA Seguros 1.0$ 0.4$ 0.9$ 0.3$ Canada (2) 13.6 3.5 4.1 0.9 Europe 9.1 1.8 TBD TBD Latin America 6.9 1.5 TBD TBD Total 30.6$ 7.2$
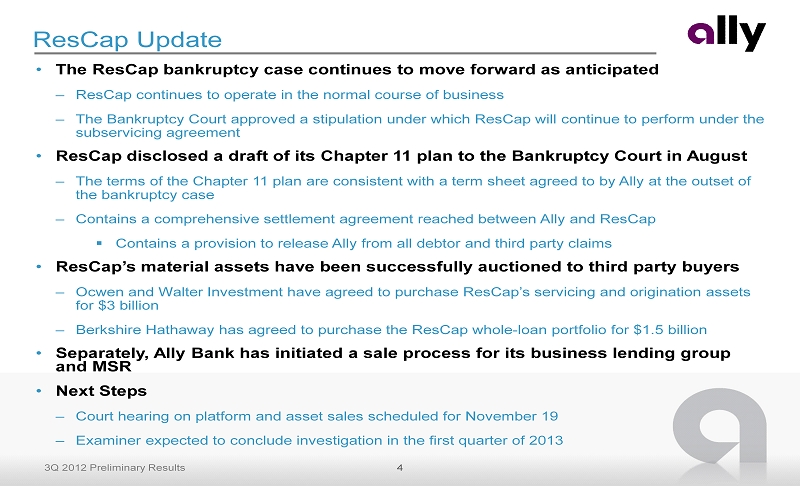
4 3Q 2012 Preliminary Results ResCap Update • The ResCap bankruptcy case continues to move forward as anticipated – ResCap continues to operate in the normal course of business – The Bankruptcy Court approved a stipulation under which ResCap will continue to perform under the subservicing agreement • ResCap disclosed a draft of its Chapter 11 plan to the Bankruptcy Court in August – The terms of the Chapter 11 plan are consistent with a term sheet agreed to by Ally at the outset of the bankruptcy case – Contains a comprehensive settlement agreement reached between Ally and ResCap ▪ Contains a provision to release Ally from all debtor and third party claims • ResCap’s material assets have been successfully auctioned to third party buyers – Ocwen and Walter Investment have agreed to purchase ResCap’s servicing and origination assets for $3 billion – Berkshire Hathaway has agreed to purchase the ResCap whole - loan portfolio for $1.5 billion • Separately, Ally Bank has initiated a sale process for its business lending group and MSR • Next Steps – Court hearing on platform and asset sales scheduled for November 19 – Examiner expected to conclude investigation in the first quarter of 2013
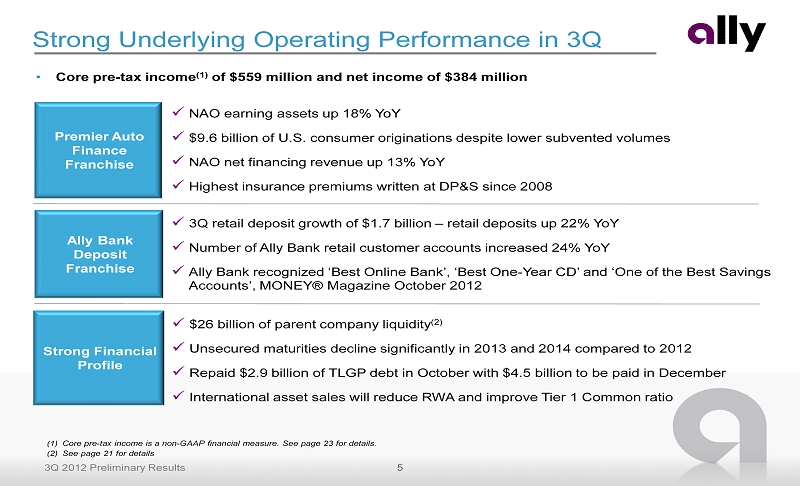
5 3Q 2012 Preliminary Results x 3Q retail deposit growth of $1.7 billion – retail deposits up 22% YoY x Number of Ally Bank retail customer accounts increased 24% YoY x Ally Bank recognized ‘Best Online Bank’, ‘Best One - Year CD’ and ‘One of the Best Savings Accounts’, MONEY® Magazine October 2012 Premier Auto Finance Franchise x $26 billion of parent company liquidity (2) x Unsecured maturities decline significantly in 2013 and 2014 compared to 2012 x Repaid $2.9 billion of TLGP debt in October with $4.5 billion to be paid in December x International asset sales will reduce RWA and improve Tier 1 Common ratio Strong Financial Profile Ally Bank Deposit Franchise x NAO earning assets up 18% YoY x $9.6 billion of U.S. consumer originations despite lower subvented volumes x NAO net financing revenue up 13% YoY x Highest insurance premiums written at DP&S since 2008 Strong Underlying Operating Performance in 3Q (1) Core pre - tax income is a non - GAAP financial measure. See page 23 for details. (2) See page 21 for details • Core pre - tax income (1) of $559 million and net income of $384 million
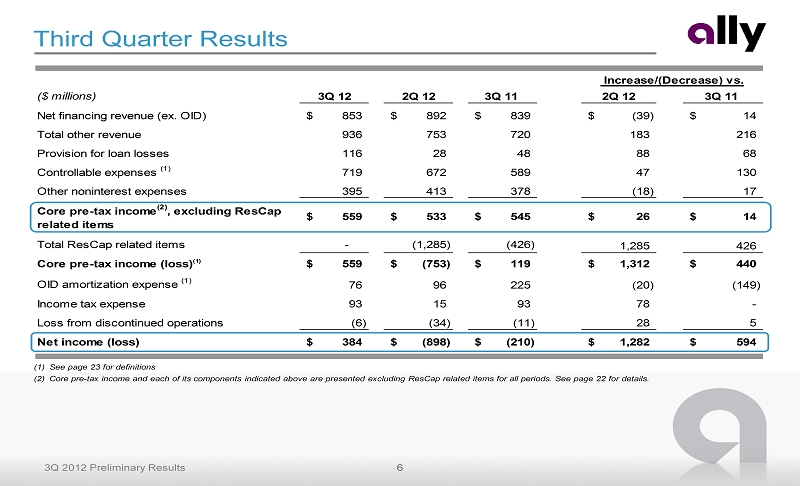
6 3Q 2012 Preliminary Results ($ millions) 3Q 12 2Q 12 3Q 11 2Q 12 3Q 11 Net financing revenue (ex. OID) 853$ 892$ 839$ (39)$ 14$ Total other revenue 936 753 720 183 216 Provision for loan losses 116 28 48 88 68 Controllable expenses (1) 719 672 589 47 130 Other noninterest expenses 395 413 378 (18) 17 - - Core pre-tax income (2) , excluding ResCap related items 559$ 533$ 545$ 26$ 14$ Total ResCap related items - (1,285) (426) 1,285 426 Core pre-tax income (loss)(1) 559$ (753)$ 119$ 1,312$ 440$ OID amortization expense (1) 76 96 225 (20) (149) Income tax expense 93 15 93 78 - Loss from discontinued operations (6) (34) (11) 28 5 Net income (loss) 384$ (898)$ (210)$ (898)$ 1,282$ 594$ Increase/(Decrease) vs. Third Quarter Results (1) See page 23 for definitions (2) Core pre - tax income and each of its components indicated above are presented excluding ResCap related items for all periods. See page 22 for details.
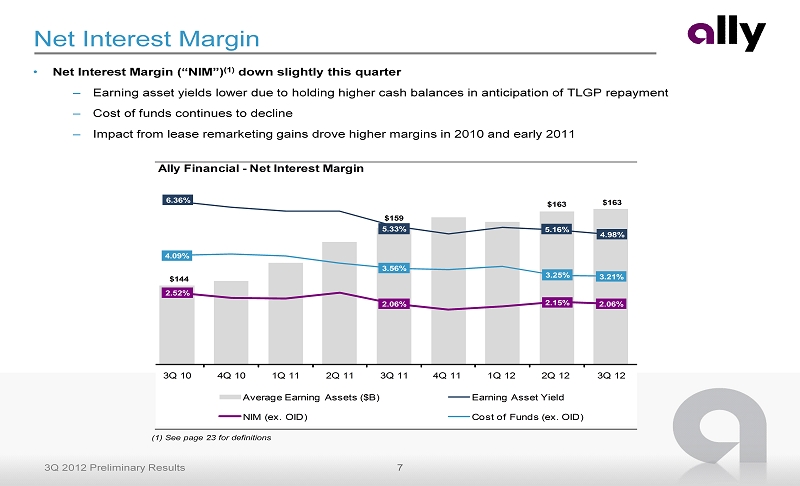
7 3Q 2012 Preliminary Results Net Interest Margin • Net Interest Margin (“NIM”) (1) down slightly this quarter – Earning asset yields lower due to holding higher cash balances in anticipation of TLGP repayment – Cost of funds continues to decline – Impact from lease remarketing gains drove higher margins in 2010 and early 2011 (1) See page 23 for definitions Ally Financial - Net Interest Margin $144 $159 $163 $163 6.36% 5.33% 5.16% 4.98% 2.52% 2.06% 2.15% 2.06% 4.09% 3.56% 3.25% 3.21% 3Q 10 4Q 10 1Q 11 2Q 11 3Q 11 4Q 11 1Q 12 2Q 12 3Q 12 Average Earning Assets ($B) Earning Asset Yield NIM (ex. OID) Cost of Funds (ex. OID)
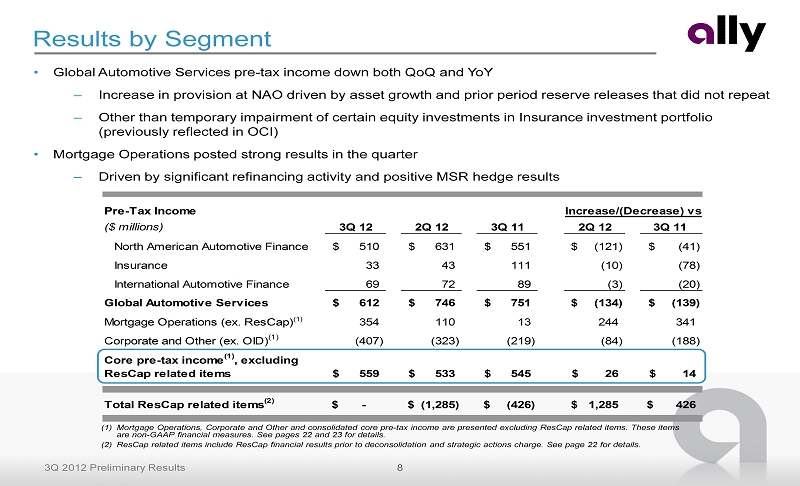
8 3Q 2012 Preliminary Results Pre-Tax Income ($ millions) 3Q 12 2Q 12 3Q 11 2Q 12 3Q 11 North American Automotive Finance 510$ 631$ 551$ (121)$ (41)$ Insurance 33 43 111 (10) (78) International Automotive Finance 69 72 89 (3) (20) Global Automotive Services 612$ 746$ 751$ (134)$ (139)$ Mortgage Operations (ex. ResCap) (1) 354 110 13 244 341 Corporate and Other (ex. OID) (1) (407) (323) (219) (84) (188) Core pre-tax income (1) , excluding ResCap related items 559$ 533$ 545$ 26$ 14$ Total ResCap related items (2) -$ (1,285)$ (426)$ 1,285$ 426$ Increase/(Decrease) vs. Results by Segment (1) Mortgage Operations, Corporate and Other and consolidated core pre - tax income are presented excluding ResCap related items. Thes e items are non - GAAP financial measures. See pages 22 and 23 for details. (2) ResCap related items include ResCap financial results prior to deconsolidation and strategic actions charge. See page 22 for det ails. • Global Automotive Services pre - tax income down both QoQ and YoY – Increase in provision at NAO driven by asset growth and prior period reserve releases that did not repeat – Other than temporary impairment of certain equity investments in Insurance investment portfolio (previously reflected in OCI) • Mortgage Operations posted strong results in the quarter – Driven by significant refinancing activity and positive MSR hedge results
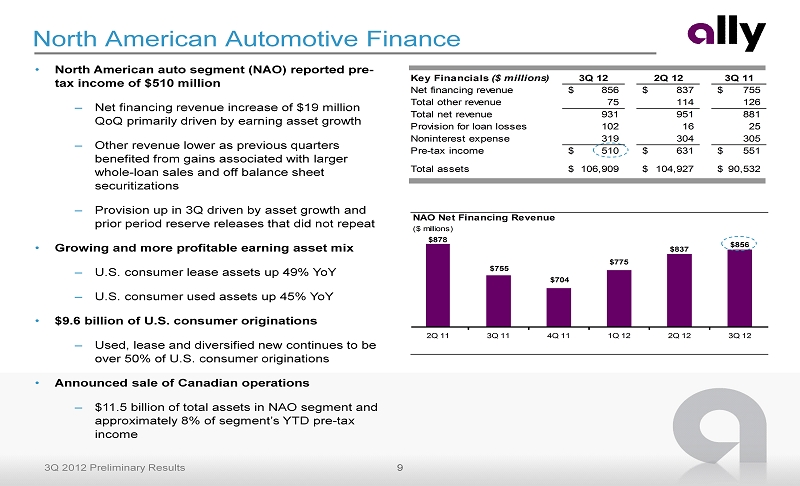
9 3Q 2012 Preliminary Results NAO Net Financing Revenue ($ millions) $878 $755 $704 $775 $837 $856 2Q 11 3Q 11 4Q 11 1Q 12 2Q 12 3Q 12 Key Financials ($ millions) 3Q 12 2Q 12 3Q 11 Net financing revenue 856$ 837$ 755$ Total other revenue 75 114 126 Total net revenue 931 951 881 Provision for loan losses 102 16 25 Noninterest expense 319 304 305 Pre-tax income 510$ 631$ 551$ Total assets 106,909$ 104,927$ 90,532$ • North American auto segment (NAO) reported pre - tax income of $510 million – Net financing revenue increase of $19 million QoQ primarily driven by earning asset growth – Other revenue lower as previous quarters benefited from gains associated with larger whole - loan sales and off balance sheet securitizations – Provision up in 3Q driven by asset growth and prior period reserve releases that did not repeat • Growing and more profitable earning asset mix – U.S. consumer lease assets up 49% YoY – U.S. consumer used assets up 45% YoY • $9.6 billion of U.S. consumer originations – Used, lease and diversified new continues to be over 50% of U.S. consumer originations • Announced sale of Canadian operations – $11.5 billion of total assets in NAO segment and approximately 8% of segment’s YTD pre - tax income North American Automotive Finance
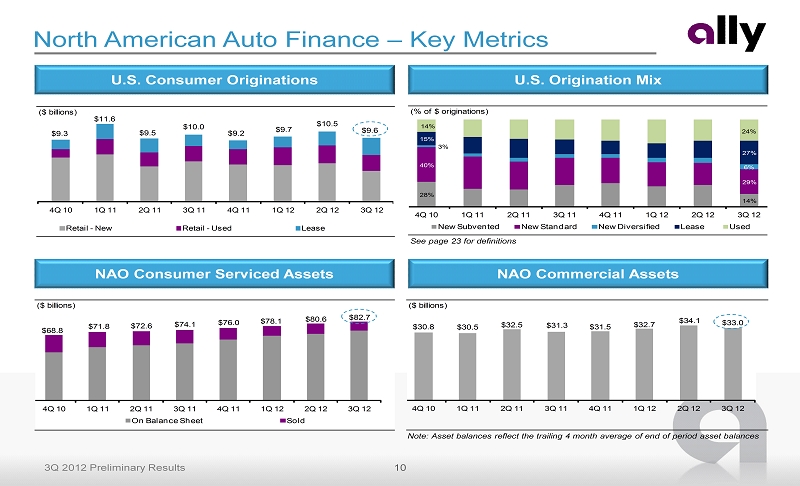
10 3Q 2012 Preliminary Results ($ billions) 4Q 10 1Q 11 2Q 11 3Q 11 4Q 11 1Q 12 2Q 12 3Q 12 Retail - New Retail - Used Lease $10.5 $9.7 $9.2 $10.0 $9.5 $11.6 $9.3 $9.6 (% of $ originations) 28% 14% 40% 29% 3% 6% 15% 27% 14% 24% 4Q 10 1Q 11 2Q 11 3Q 11 4Q 11 1Q 12 2Q 12 3Q 12 New Subvented New Standard New Diversified Lease Used ($ billions) $68.8 $71.8 $72.6 $74.1 $76.0 $78.1 $80.6 $82.7 4Q 10 1Q 11 2Q 11 3Q 11 4Q 11 1Q 12 2Q 12 3Q 12 On Balance Sheet Sold ($ billions) $30.8 $30.5 $32.5 $31.3 $31.5 $32.7 $34.1 $33.0 4Q 10 1Q 11 2Q 11 3Q 11 4Q 11 1Q 12 2Q 12 3Q 12 North American Auto Finance – Key Metrics See page 23 for definitions NAO Consumer Serviced Assets NAO Commercial Assets U.S. Consumer Originations U.S. Origination Mix Note: Asset balances reflect the trailing 4 month average of end of period asset balances
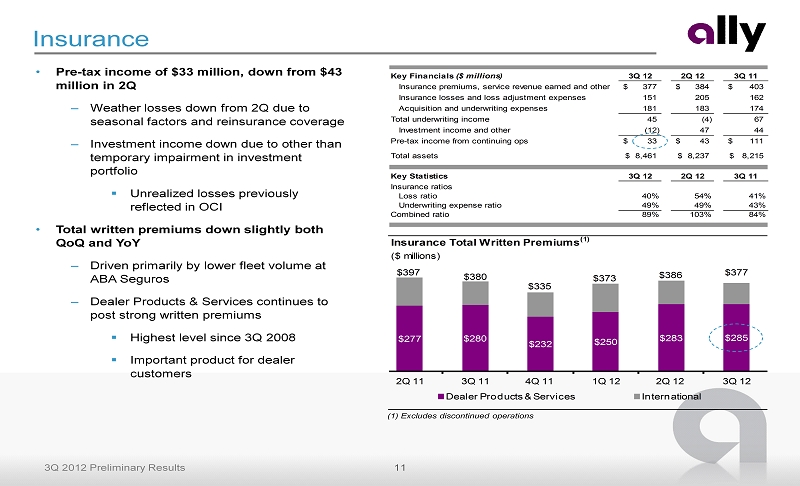
11 3Q 2012 Preliminary Results Key Financials ($ millions) 3Q 12 2Q 12 3Q 11 Insurance premiums, service revenue earned and other 377$ 384$ 403$ Insurance losses and loss adjustment expenses 151 205 162 Acquisition and underwriting expenses 181 183 174 Total underwriting income 45 (4) 67 Investment income and other (12) 47 44 Pre-tax income from continuing ops 33$ 43$ 111$ Total assets 8,461$ 8,237$ 8,215$ Key Statistics 3Q 12 2Q 12 3Q 11 Insurance ratios Loss ratio 40% 54% 41% Underwriting expense ratio 49% 49% 43% Combined ratio 89% 103% 84% Insurance Total Written Premiums (1) ($ millions) $277 $280 $232 $250 $283 $285 $397 $380 $335 $373 $386 $377 2Q 11 3Q 11 4Q 11 1Q 12 2Q 12 3Q 12 Dealer Products & Services International Insurance • Pre - tax income of $33 million, down from $43 million in 2Q – Weather losses down from 2Q due to seasonal factors and reinsurance coverage – Investment income down due to other than temporary impairment in investment portfolio ▪ Unrealized losses previously reflected in OCI • Total written premiums down slightly both QoQ and YoY – Driven primarily by lower fleet volume at ABA Seguros – Dealer Products & Services continues to post strong written premiums ▪ Highest level since 3Q 2008 ▪ Important product for dealer customers (1) Excludes discontinued operations

12 3Q 2012 Preliminary Results International Consumer Auto Originations (1) ($ billions) $2.3 $2.6 $2.6 $2.3 $2.3 $2.2 2Q 11 3Q 11 4Q 11 1Q 12 2Q 12 3Q 12 China Brazil Germany U.K. Mexico Other Key Financials ($ millions) 3Q 12 2Q 12 3Q 11 Net financing revenue 166$ 171$ 167$ Total other revenue 53 59 61 Total net revenue 219 230 228 Provision for loan losses 13 15 (2) Noninterest expense 137 143 141 Pre-tax income from continuing ops 69$ 72$ 89$ Total assets 16,211$ 15,467$ 15,314$ • International Operations earned pre - tax income of $69 million down from $72 million in 2Q – Net financing revenue decrease primarily due to impact of FX – Provision improved QoQ due to favorable loss outlook, primarily across Latin America • Originations are relatively flat QoQ and down $423 million YoY – YoY decline driven primarily by FX impacts and decrease of auto industry volumes across Europe • Pursuing possible sale of international entities – Operating business as usual – Priority to protect interests of dealers and manufacturers International Automotive Finance (1) Represents continuing operations only. China is part of a joint - venture in which Ally owns a minority interest (not included in total assets above).
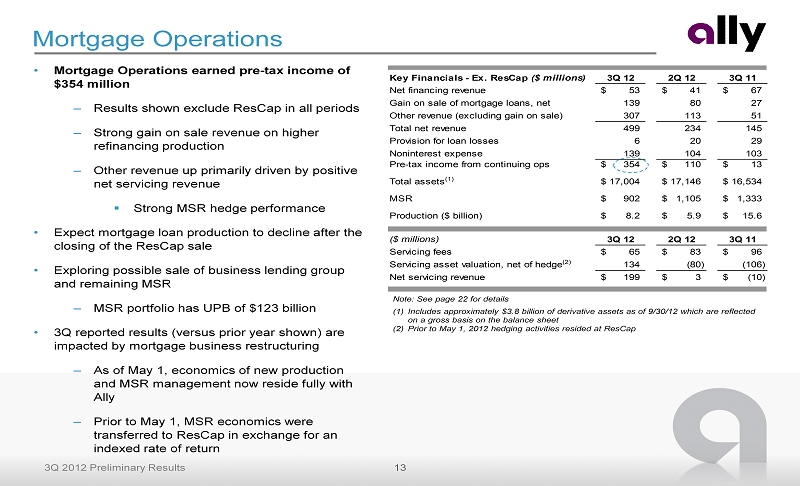
13 3Q 2012 Preliminary Results Key Financials - Ex. ResCap ($ millions) 3Q 12 2Q 12 3Q 11 Net financing revenue 53$ 41$ 67$ Gain on sale of mortgage loans, net 139 80 27 Other revenue (excluding gain on sale) 307 113 51 Total net revenue 499 234 145 Provision for loan losses 6 20 29 Noninterest expense 139 104 103 Pre-tax income from continuing ops 354$ 110$ 13$ Total assets (1) 17,004$ 17,146$ 16,534$ MSR 902$ 1,105$ 1,333$ Production ($ billion) 8.2$ 5.9$ 15.6$ TRUE ($ millions) 3Q 12 2Q 12 3Q 11 Servicing fees 65$ 83$ 96$ Servicing asset valuation, net of hedge (2) 134 (80) (106) Net servicing revenue 199$ 3$ (10)$ Mortgage Operations • Mortgage Operations earned pre - tax income of $354 million – Results shown exclude ResCap in all periods – Strong gain on sale revenue on higher refinancing production – Other revenue up primarily driven by positive net servicing revenue ▪ Strong MSR hedge performance • Expect mortgage loan production to decline after the closing of the ResCap sale • Exploring possible sale of business lending group and remaining MSR – MSR portfolio has UPB of $123 billion • 3Q reported results (versus prior year shown) are impacted by mortgage business restructuring – As of May 1, economics of new production and MSR management now reside fully with Ally – Prior to May 1, MSR economics were transferred to ResCap in exchange for an indexed rate of return Note: See page 22 for details (1) Includes approximately $3.8 billion of derivative assets as of 9/30/12 which are reflected on a gross basis on the balance sheet (2) Prior to May 1, 2012 hedging activities resided at ResCap
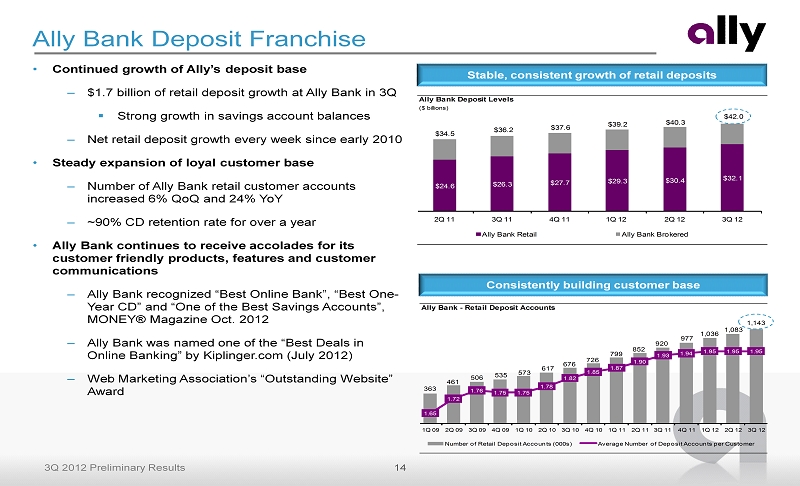
14 3Q 2012 Preliminary Results Ally Bank Deposit Levels ($ billions) $24.6 $26.3 $27.7 $29.3 $30.4 $32.1 $34.5 $36.2 $37.6 $39.2 $40.3 $42.0 2Q 11 3Q 11 4Q 11 1Q 12 2Q 12 3Q 12 Ally Bank Retail Ally Bank Brokered Ally Bank Deposit Franchise • Continued growth of Ally’s deposit base – $1.7 billion of retail deposit growth at Ally Bank in 3Q ▪ Strong growth in savings account balances – Net retail deposit growth every week since early 2010 • Steady expansion of loyal customer base – Number of Ally Bank retail customer accounts increased 6% QoQ and 24% YoY – ~90% CD retention rate for over a year • Ally Bank continues to receive accolades for its customer friendly products, features and customer communications – Ally Bank recognized “Best Online Bank”, “Best One - Year CD” and “One of the Best Savings Accounts”, MONEY® Magazine Oct. 2012 – Ally Bank was named one of the “Best Deals in Online Banking” by Kiplinger.com (July 2012) – Web Marketing Association’s “Outstanding Website” Award Stable, consistent growth of retail deposits Consistently building customer base Ally Bank - Retail Deposit Accounts 363 461 506 535 573 617 676 726 799 852 920 977 1,036 1,083 1,143 1.65 1.72 1.76 1.75 1.75 1.78 1.82 1.85 1.87 1.90 1.93 1.94 1.95 1.95 1.95 1Q 09 2Q 09 3Q 09 4Q 09 1Q 10 2Q 10 3Q 10 4Q 10 1Q 11 2Q 11 3Q 11 4Q 11 1Q 12 2Q 12 3Q 12 Number of Retail Deposit Accounts (000s) Average Number of Deposit Accounts per Customer
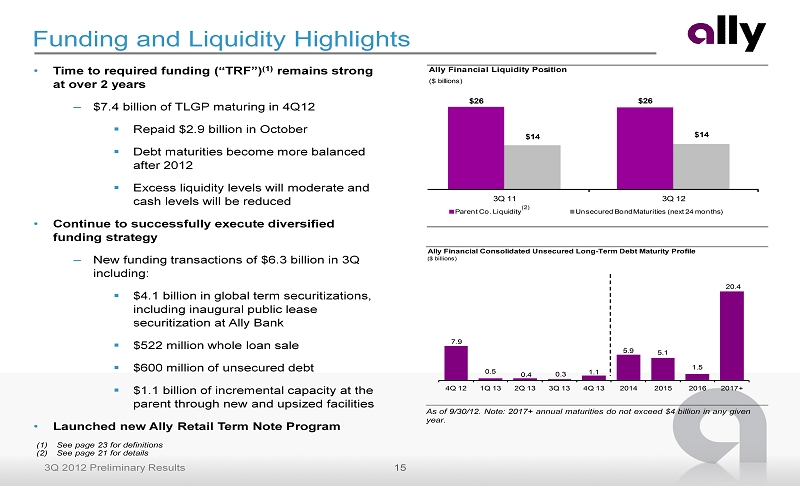
15 3Q 2012 Preliminary Results Ally Financial Consolidated Unsecured Long-Term Debt Maturity Profile ($ billions) 7.9 0.5 0.4 0.3 1.1 5.9 5.1 1.5 20.4 4Q 12 1Q 13 2Q 13 3Q 13 4Q 13 2014 2015 2016 2017+ Ally Financial Liquidity Position ($ billions) $26 $26 $14 $14 3Q 11 3Q 12 Parent Co. Liquidity Unsecured Bond Maturities (next 24 months) • Time to required funding (“TRF”) (1) remains strong at over 2 years – $7.4 billion of TLGP maturing in 4Q12 ▪ Repaid $2.9 billion in October ▪ Debt maturities become more balanced after 2012 ▪ Excess liquidity levels will moderate and cash levels will be reduced • Continue to successfully execute diversified funding strategy – New funding transactions of $6.3 billion in 3Q including: ▪ $4.1 billion in global term securitizations, including inaugural public lease securitization at Ally Bank ▪ $522 million whole loan sale ▪ $600 million of unsecured debt ▪ $1.1 billion of incremental capacity at the parent through new and upsized facilities • Launched new Ally Retail Term Note Program Funding and Liquidity Highlights (1) See page 23 for definitions (2) See page 21 for details (2) As of 9/30/12. Note: 2017+ annual maturities do not exceed $4 billion in any given year.
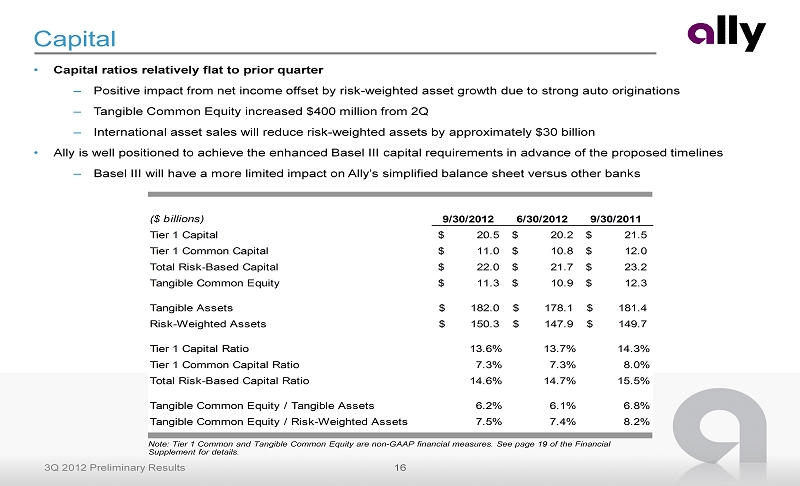
16 3Q 2012 Preliminary Results ($ billions) 9/30/2012 6/30/2012 9/30/2011 Tier 1 Capital 20.5$ 20.2$ 21.5$ Tier 1 Common Capital 11.0$ 10.8$ 12.0$ Total Risk-Based Capital 22.0$ 21.7$ 23.2$ Tangible Common Equity 11.3$ 10.9$ 12.3$ Tangible Assets 182.0$ 178.1$ 181.4$ Risk-Weighted Assets 150.3$ 147.9$ 149.7$ Tier 1 Capital Ratio 13.6% 13.7% 14.3% Tier 1 Common Capital Ratio 7.3% 7.3% 8.0% Total Risk-Based Capital Ratio 14.6% 14.7% 15.5% Tangible Common Equity / Tangible Assets 6.2% 6.1% 6.8% Tangible Common Equity / Risk-Weighted Assets 7.5% 7.4% 8.2% Capital • Capital ratios relatively flat to prior quarter – Positive impact from net income offset by risk - weighted asset growth due to strong auto originations – Tangible Common Equity increased $400 million from 2Q – International asset sales will reduce risk - weighted assets by approximately $30 billion • Ally is well positioned to achieve the enhanced Basel III capital requirements in advance of the proposed timelines – Basel III will have a more limited impact on Ally’s simplified balance sheet versus other banks Note: Tier 1 Common and Tangible Common Equity are non - GAAP financial measures. See page 19 of the Financial Supplement for details.
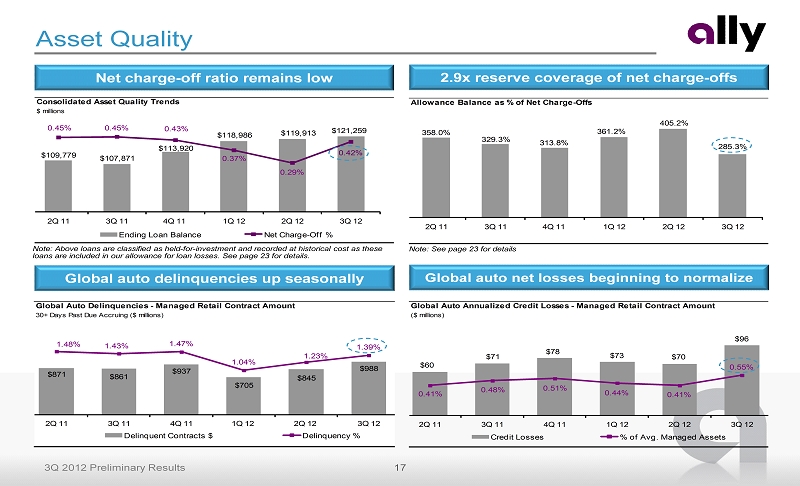
17 3Q 2012 Preliminary Results Global Auto Delinquencies - Managed Retail Contract Amount 30+ Days Past Due Accruing ($ millions) $871 $861 $937 $705 $845 $988 1.48% 1.43% 1.47% 1.04% 1.23% 1.39% 2Q 11 3Q 11 4Q 11 1Q 12 2Q 12 3Q 12 Delinquent Contracts $ Delinquency % Allowance Balance as % of Net Charge-Offs 358.0% 329.3% 313.8% 361.2% 405.2% 285.3% 2Q 11 3Q 11 4Q 11 1Q 12 2Q 12 3Q 12 Global Auto Annualized Credit Losses - Managed Retail Contract Amount ($ millions) $60 $71 $78 $73 $70 $96 0.41% 0.48% 0.51% 0.44% 0.41% 0.55% 2Q 11 3Q 11 4Q 11 1Q 12 2Q 12 3Q 12 Credit Losses % of Avg. Managed Assets Consolidated Asset Quality Trends $ millions $109,779 $107,871 $113,920 $118,986 $119,913 $121,259 0.45% 0.45% 0.43% 0.37% 0.29% 0.42% 0.00% 0.10% 0.20% 0.30% 0.40% 0.50% 2Q 11 3Q 11 4Q 11 1Q 12 2Q 12 3Q 12 Ending Loan Balance Net Charge - Off % Net charge - off ratio remains low 2.9x reserve coverage of net charge - offs Asset Quality Global auto net losses beginning to normalize Global auto delinquencies up seasonally Note: Above loans are classified as held - for - investment and recorded at historical cost as these loans are included in our allowance for loan losses. See page 23 for details . Note: See page 23 for details
18 3Q 2012 Preliminary Results Ally is Well Positioned for the Future Winning Combination of Premier U.S. Auto Finance Franchise and Leading Direct Bank • Preeminent auto finance franchise – Demonstrated strong positioning with dealer customers – Improving profitability of origination mix – Integrated insurance operations add to dealer value proposition • Leading direct bank franchise with growing customer base – $1.7 billion of retail deposit growth in 3Q – Differentiated customer - friendly brand • Strong credit profile – High quality assets – balance sheet dominated by low loss, short duration auto loans – Conservative capital and liquidity posture – More stable earnings profile going forward – Strategic actions will further enhance credit profile – Streamlining operations and rationalizing expense base

Supplemental Charts
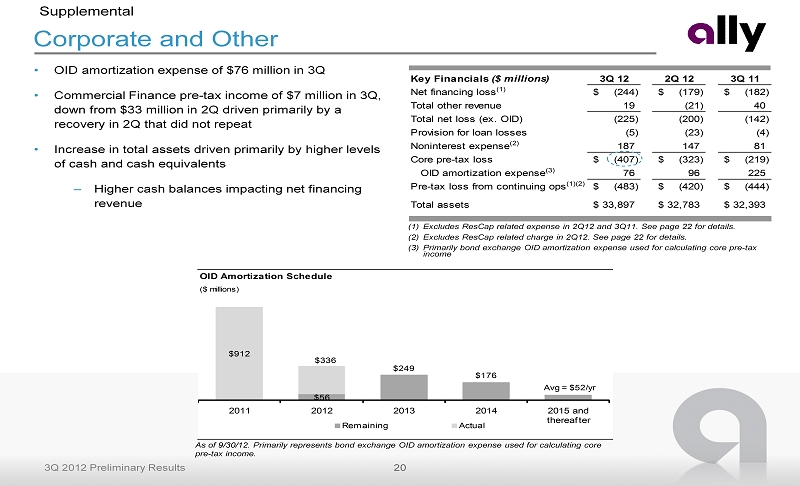
20 3Q 2012 Preliminary Results Key Financials ($ millions) 3Q 12 2Q 12 3Q 11 Net financing loss (1) (244)$ (179)$ (182)$ Total other revenue 19 (21) 40 Total net loss (ex. OID) (225) (200) (142) Provision for loan losses (5) (23) (4) Noninterest expense (2) 187 147 81 Core pre-tax loss (407)$ (323)$ (219)$ OID amortization expense (3) 76 96 225 Pre-tax loss from continuing ops (1)(2) (483)$ (420)$ (444)$ Total assets 33,897$ 32,783$ 32,393$ Corporate and Other • OID amortization expense of $76 million in 3Q • Commercial Finance pre - tax income of $7 million in 3Q, down from $33 million in 2Q driven primarily by a recovery in 2Q that did not repeat • Increase in total assets driven primarily by higher levels of cash and cash equivalents – Higher cash balances impacting net financing revenue Supplemental (1) Excludes ResCap related expense in 2Q12 and 3Q11. See page 22 for details. (2) Excludes ResCap related charge in 2Q12. See page 22 for details. (3) Primarily bond exchange OID amortization expense used for calculating core pre - tax income As of 9/30/12. Primarily represents bond exchange OID amortization expense used for calculating core pre - tax income. OID Amortization Schedule ($ millions) $912 $56 $249 $176 Avg = $52/yr 2011 2012 2013 2014 2015 and thereafter Remaining Actual $336

21 3Q 2012 Preliminary Results Liquidity Supplemental (1) Parent defined as Ally Consolidated less Ally Bank, ResCap (deconsolidated as of 05/14/12) and Insurance (not shown) (2) Includes UST, Agency debt and Agency MBS (3) Includes equal allocation of shared unused capacity totaling $4.0 billion in 3Q12, $3.8 billion in 2Q12 and $4.0 billion in 3 Q11 , which can be used by Ally Bank or the Parent (including a Mexican subsidiary). (4) To optimize use of cash and secured facility capacity between entities, Ally Financial lends cash to Ally Bank from time to time un der an intercompany loan agreement. Amounts outstanding on this loan are repayable to Ally Financial at any time, subject to 5 days notice. (5) Represents capacity from certain forward purchase commitments and committed secured facilities that are generally reliant upo n t he origination of future automotive receivables over the next 12 months . Available Liquidity 9/30/2012 6/30/2012 9/30/2011 ($ billions) Parent (1) Ally Bank Parent (1) Ally Bank Parent (1) Ally Bank Cash and Cash Equivalents 8.8$ 7.1$ 11.4$ 3.4$ 10.1$ 4.5$ Highly Liquid Securities (2) - 5.4 - 5.0 0.4 5.2 Current Committed Unused Capacity (3) 10.7 6.7 10.0 7.5 11.7 6.1 Subtotal 19.5$ 19.2$ 21.4$ 15.9$ 22.2$ 15.8$ Ally Bank Intercompany Loan (4) 3.4 (3.4) 2.4 (2.4) 2.2 (2.2) SubtotalTotal Current Available Liquidity 22.9$ 15.8$ 23.8$ 13.5$ 24.4$ 13.6$ Forward Committed Unused Capacity (5) 3.1 - 2.0 - 1.5 - Total Available Liquidity 26.0$ 15.8$ 25.8$ 13.5$ 25.9$ 13.6$
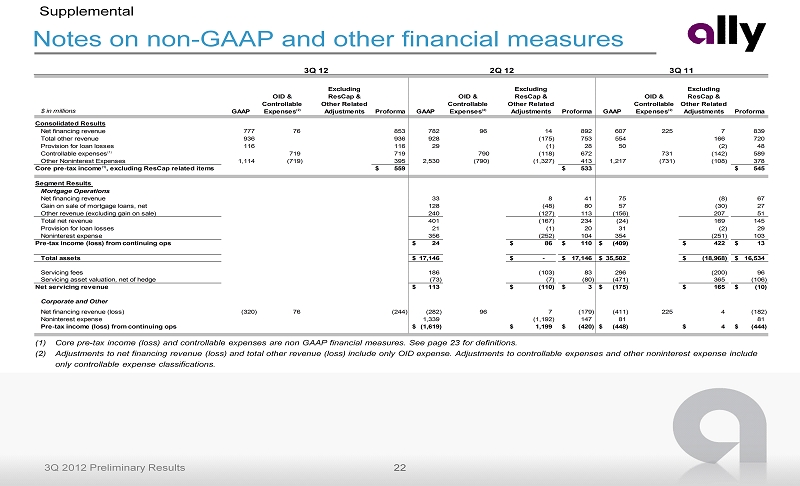
22 3Q 2012 Preliminary Results Notes on non - GAAP and other financial measures Supplemental (1) Core pre - tax income (loss) and controllable expenses are non GAAP financial measures. See page 23 for definitions. (2) Adjustments to net financing revenue (loss) and total other revenue (loss) include only OID expense. Adjustments to controlla ble expenses and other noninterest expense include only controllable expense classifications. $ in millions GAAP OID & Controllable Expenses(2) Excluding ResCap & Other Related Adjustments Proforma GAAP OID & Controllable Expenses(2) Excluding ResCap & Other Related Adjustments Proforma GAAP OID & Controllable Expenses(2) Excluding ResCap & Other Related Adjustments Proforma Consolidated Results Net financing revenue 777 76 853 782 96 14 892 607 225 7 839 Total other revenue 936 936 928 (175) 753 554 166 720 Provision for loan losses 116 116 29 (1) 28 50 (2) 48 Controllable expenses(1) 719 719 790 (118) 672 731 (142) 589 Other Noninterest Expenses 1,114 (719) 395 2,530 (790) (1,327) 413 1,217 (731) (108) 378 Core pre-tax income(1), excluding ResCap related items 559$ 533$ 545$ Segment Results Mortgage Operations Net financing revenue 33 8 41 75 (8) 67 Gain on sale of mortgage loans, net 128 (48) 80 57 (30) 27 Other revenue (excluding gain on sale) 240 (127) 113 (156) 207 51 Total net revenue 401 (167) 234 (24) 169 145 Provision for loan losses 21 (1) 20 31 (2) 29 Noninterest expense 356 (252) 104 354 (251) 103 Pre-tax income (loss) from continuing ops 24$ 86$ 110$ (409)$ 422$ 13$ Total assets 17,146$ -$ 17,146$ 35,502$ (18,968)$ 16,534$ Servicing fees 186 (103) 83 296 (200) 96 Servicing asset valuation, net of hedge (73) (7) (80) (471) 365 (106) Net servicing revenue 113$ (110)$ 3$ (175)$ 165$ (10)$ Corporate and Other Net financing revenue (loss) (320) 76 (244) (282) 96 7 (179) (411) 225 4 (182) Noninterest expense 1,339 (1,192) 147 81 81 Pre-tax income (loss) from continuing ops (1,619)$ 1,199$ (420)$ (448)$ 4$ (444)$ 3Q 12 3Q 112Q 12
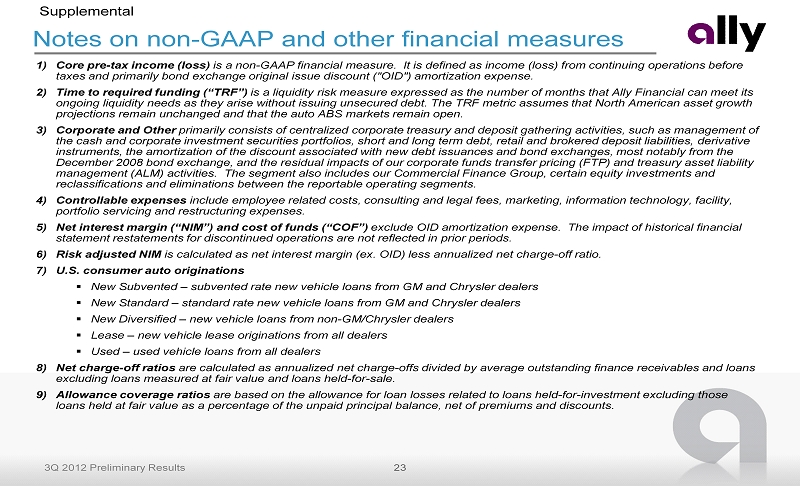
23 3Q 2012 Preliminary Results Notes on non - GAAP and other financial measures Supplemental 1) Core pre - tax income (loss) is a non - GAAP financial measure. It is defined as income (loss) from continuing operations before taxes and primarily bond exchange original issue discount ("OID") amortization expense. 2) Time to required funding (“TRF”) is a liquidity risk measure expressed as the number of months that Ally Financial can meet its ongoing liquidity needs as they arise without issuing unsecured debt. The TRF metric assumes that North American asset growth projections remain unchanged and that the auto ABS markets remain open. 3) Corporate and Other primarily consists of centralized corporate treasury and deposit gathering activities, such as management of the cash and corporate investment securities portfolios, short and long term debt, retail and brokered deposit liabilities, d eri vative instruments, the amortization of the discount associated with new debt issuances and bond exchanges, most notably from the December 2008 bond exchange, and the residual impacts of our corporate funds transfer pricing (FTP) and treasury asset liabil ity management (ALM) activities. The segment also includes our Commercial Finance Group, certain equity investments and reclassifications and eliminations between the reportable operating segments. 4) Controllable expenses include employee related costs, consulting and legal fees, marketing, information technology, facility, portfolio servicing and restructuring expenses. 5) Net interest margin (“NIM”) and cost of funds (“COF”) exclude OID amortization expense. The impact of historical financial statement restatements for discontinued operations are not reflected in prior periods . 6) Risk adjusted NIM is calculated as net interest margin (ex. OID) less annualized net charge - off ratio. 7) U.S. consumer auto originations ▪ New Subvented – subvented rate new vehicle loans from GM and Chrysler dealers ▪ New Standard – standard rate new vehicle loans from GM and Chrysler dealers ▪ New Diversified – new vehicle loans from non - GM/Chrysler dealers ▪ Lease – new vehicle lease originations from all dealers ▪ Used – used vehicle loans from all dealers 8) Net charge - off ratios are calculated as annualized net charge - offs divided by average outstanding finance receivables and loans excluding loans measured at fair value and loans held - for - sale. 9) Allowance coverage ratios are based on the allowance for loan losses related to loans held - for - investment excluding those loans held at fair value as a percentage of the unpaid principal balance, net of premiums and discounts.