
Ally Financial Inc. 4Q Earnings Review Contact Ally Investor Relations at (866) 710 - 4623 or investor.relations@ally.com February 5, 2013
2 4Q 2012 Preliminary Results Forward - Looking Statements and Additional Information The following should be read in conjunction with the financial statements, notes and other information contained in the Compa ny’ s Annual Reports on Form 10 - K, Quarterly Reports on Form 10 - Q, and Current Reports on Form 8 - K. This information is preliminary and based on company data available at the time of the presentation In the presentation that follows and related comments by Ally Financial Inc. (“Ally”) management, the use of the words “expec t,” “anticipate,” “estimate,” “forecast,” “initiative,” “objective,” “plan,” “goal,” “project,” “outlook,” “priorities,” “target,” “intend,” “e val uate,” “pursue,” “seek,” “may,” “would, ” “could, ” “should, ” “believe, ” “potential, ” “continue,” , or the negative of these words, or similar expressions is intended to identify forward - looking statements. All statements herein and in related management comments, other than statements of historical fact, including without limitation, statements about future events and financial performance, are forward - looking statements that involve certain risks and uncertainties. While these statements represent Ally’s current judgment on what the future may hold, and Ally believes these judgments are r eas onable, these statements are not guarantees of any events or financial results, and Ally’s actual results may differ materially due to nume rou s important factors that are described in the most recent reports on SEC Forms 10 - K and 10 - Q for Ally, each of which may be revised or supplemented in subsequent reports filed with the SEC. Such factors include, among others, the following: maintaining the mutually beneficial relationsh ip between Ally and General Motors (“GM”), and Ally and Chrysler Group LLC (“Chrysler”); the profitability and financial condition of GM and Chry sle r; bankruptcy court approval of the plan and settlement related to the bankruptcy filings by Residential Capital, LLC and certain of its su bsi diaries; our ability to realize the anticipated benefits associated with being a bank holding company, and the increased regulation and restrictions tha t we are now subject to; the potential for deterioration in the residual value of off - lease vehicles; disruptions in the market in which we f und our operations, with resulting negative impact on our liquidity; changes in our accounting assumptions that may require or that result from change s i n the accounting rules or their application, which could result in an impact on earnings; changes in the credit ratings of Ally, Chrysler, or GM; changes in economic conditions, currency exchange rates or political stability in the markets in which we operate; and changes in the existing or th e adoption of new laws, regulations, policies or other activities of governments, agencies and similar organizations (including as a result of the Dodd - Frank Act and Basel III). Investors are cautioned not to place undue reliance on forward - looking statements. Ally undertakes no obligation to update publi cly or otherwise revise any forward - looking statements except where expressly required by law. Reconciliation of non - GAAP financial measures incl uded within this presentation are provided in this presentation. Use of the term “loans” describes products associated with direct and indirect lending activities of Ally’s global operations . T he specific products include retail installment sales contracts, loans, lines of credit, leases or other financing products. The term “originate” ref ers to Ally’s purchase, acquisition or direct origination of various “loan” products.

3 4Q 2012 Preliminary Results Ally Momentum – 2012 Key Accomplishments x Full year 2012 net income of $1.2 billion vs. $157 million loss in 2011 – Full year core pre - tax income, excluding ResCap and repositioning items (1) , of $1.1 billion in 2012 vs. $865 million in 2011 x Strong and growing premier auto finance franchise – U.S. earning asset growth of 18% YoY – Net financing revenue increased every quarter in 2012 – More diversified and profitable origination mix x Significant Ally Bank brand momentum – Retail deposit growth accelerated to $7.4 billion in 2012 from $5.9 billion in 2011 – All - time high Brand Awareness, Customer Satisfaction (2) and CD retention rates x Strengthening Financial Profile – Strategic transformation streamlines company and provides CCAR capital benefits – International sales expected to improve Tier 1 common ratio to 10.1% on a pro forma basis – Resolved wall of debt maturities including $7.4 billion TLGP repayment (1) Core pre - tax income as presented excludes the impact of repositioning items, ResCap related items, OID amortization expense, taxes and discontinued operations. See slides 27 - 29 for details (2) See slide 29 for details

4 4Q 2012 Preliminary Results International Entities Summary (1) ($ billions) Business Assets Tangible Book Value (2) Proceeds (3) Premium to TBV ABA Seguros 0.9$ 0.3$ 0.7$ 0.4$ Canada (4) 12.6 3.3 3.9 0.6 Europe, Latin America and China JV 17.6 3.5 4.1 0.5 Total 31.0$ 7.0$ 8.6$ 1.6$ Strategic Transformation – International Sale Update • During the fourth quarter, Ally signed three definitive agreements to sell its international entities – Ally Credit Canada and ResMor sold to Royal Bank of Canada – ABA Seguros will be sold to ACE Group – Europe, Latin America and China JV will be sold to GM Financial • Aggregate sale price of $1.6 billion premium to Tangible Book Value, or 23% • Canada sale completed on February 1, representing 45% of total proceeds expected • Remaining transactions expected to close throughout 2013 • Upon closing, Ally will have effectively exited the international markets (1) As of 12/31/12 (2) Book value on a GAAP basis was approximately $7.5 billion, which included approximately $0.5 billion of associated goodwill (3) Proceeds (with the exception of ABA) subject to final Tangible Book Value. Does not include approximately $600 million of di vid ends and other contributions received from entities by Ally during 4Q12 (4) Canada includes ACCL and ResMor Trust (includes assets from Auto Finance and Corp/Other segments)
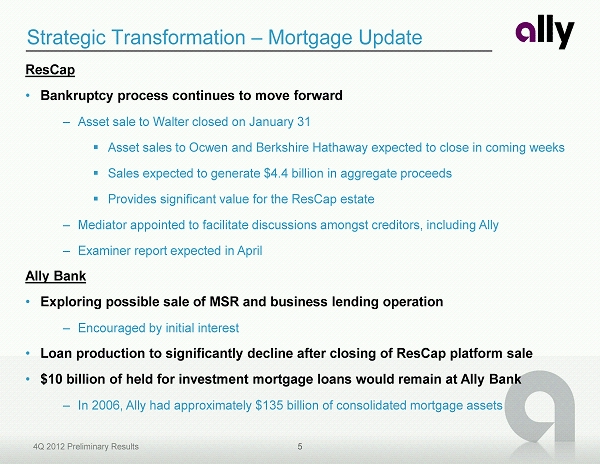
5 4Q 2012 Preliminary Results Strategic Transformation – Mortgage Update ResCap • Bankruptcy process continues to move forward – Asset sale to Walter closed on January 31 ▪ Asset sales to Ocwen and Berkshire Hathaway expected to close in coming weeks ▪ Sales expected to generate $4.4 billion in aggregate proceeds ▪ Provides significant value for the ResCap estate – Mediator appointed to facilitate discussions amongst creditors, including Ally – Examiner report expected in April Ally Bank • Exploring possible sale of MSR and business lending operation – Encouraged by initial interest • Loan production to significantly decline after closing of ResCap platform sale • $10 billion of held for investment mortgage loans would remain at Ally Bank – In 2006, Ally had approximately $135 billion of consolidated mortgage assets
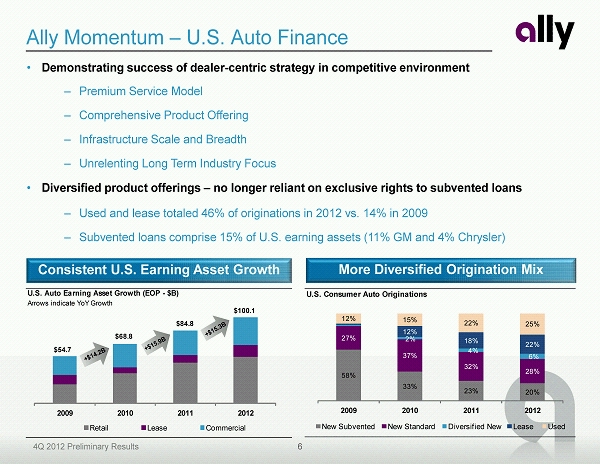
6 4Q 2012 Preliminary Results Ally Momentum – U.S. Auto Finance • Demonstrating success of dealer - centric strategy in competitive environment – Premium Service Model – Comprehensive Product Offering – Infrastructure Scale and Breadth – Unrelenting Long Term Industry Focus • Diversified product offerings – no longer reliant on exclusive rights to subvented loans – Used and lease totaled 46% of originations in 2012 vs. 14% in 2009 – Subvented loans comprise 15% of U.S. earning assets (11% GM and 4% Chrysler) More Diversified Origination Mix Consistent U.S. Earning Asset Growth U.S. Consumer Auto Originations 58% 33% 23% 20% 27% 37% 32% 28% 2% 4% 6% 12% 18% 22% 12% 15% 22% 25% 2009 2010 2011 2012 New Subvented New Standard Diversified New Lease Used U.S. Auto Earning Asset Growth (EOP - $B) Arrows indicate YoY Growth 2009 2010 2011 2012 Retail Lease Commercial $54.7 $68.8 $84.8 $100.1
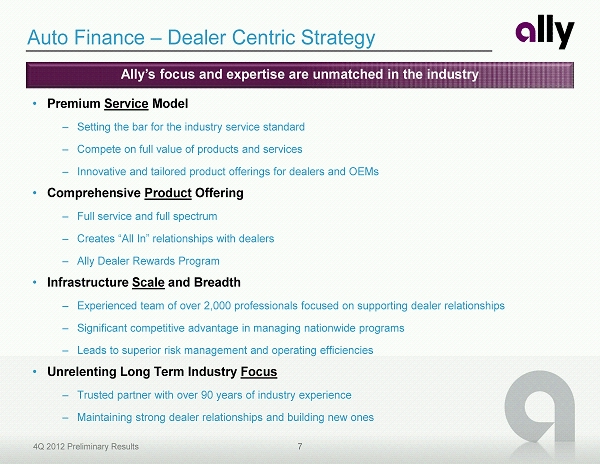
7 4Q 2012 Preliminary Results Auto Finance – Dealer Centric Strategy • Premium Service Model – Setting the bar for the industry service standard – Compete on full value of products and services – Innovative and tailored product offerings for dealers and OEMs • Comprehensive Product Offering – Full service and full spectrum – Creates “All In” relationships with dealers – Ally Dealer Rewards Program • Infrastructure Scale and Breadth – Experienced team of over 2,000 professionals focused on supporting dealer relationships – Significant competitive advantage in managing nationwide programs – Leads to superior risk management and operating efficiencies • Unrelenting Long Term Industry Focus – Trusted partner with over 90 years of industry experience – Maintaining strong dealer relationships and building new ones Ally’s focus and expertise are unmatched in the industry
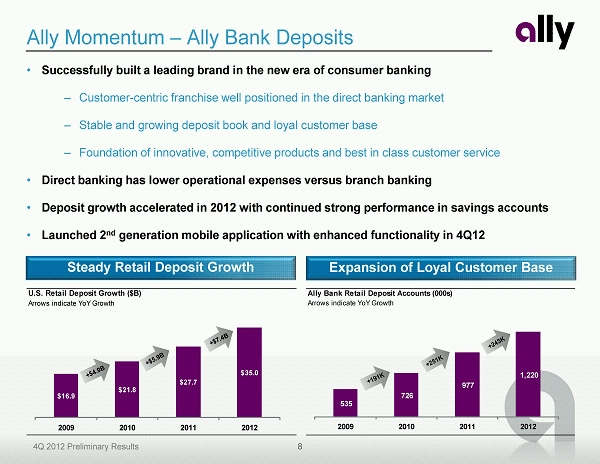
8 4Q 2012 Preliminary Results Ally Momentum – Ally Bank Deposits • Successfully built a leading brand in the new era of consumer banking – Customer - centric franchise well positioned in the direct banking market – Stable and growing deposit book and loyal customer base – Foundation of innovative, competitive products and best in class customer service • Direct banking has lower operational expenses versus branch banking • Deposit growth accelerated in 2012 with continued strong performance in savings accounts • Launched 2 nd generation mobile application with enhanced functionality in 4Q12 Steady Retail Deposit Growth Expansion of Loyal Customer Base Ally Bank Retail Deposit Accounts (000s) Arrows indicate YoY Growth 535 726 977 1,220 2009 2010 2011 2012 U.S. Retail Deposit Growth ($B) Arrows indicate YoY Growth $16.9 $21.8 $27.7 $35.0 2009 2010 2011 2012
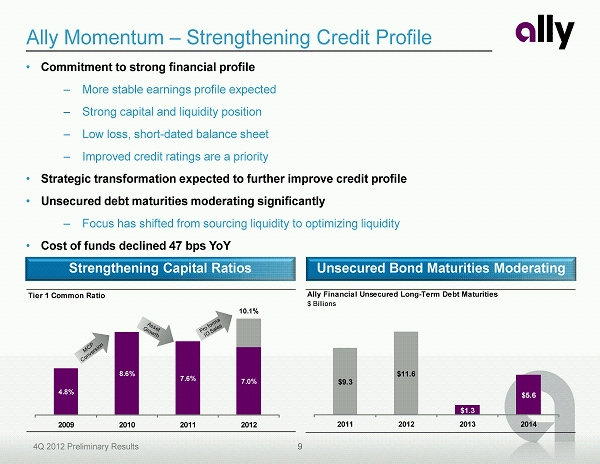
9 4Q 2012 Preliminary Results Ally Momentum – Strengthening Credit Profile • Commitment to strong financial profile – More stable earnings profile expected – Strong capital and liquidity position – Low loss, short - dated balance sheet – Improved credit ratings are a priority • Strategic transformation expected to further improve credit profile • Unsecured debt maturities moderating significantly – Focus has shifted from sourcing liquidity to optimizing liquidity • Cost of funds declined 47 bps YoY Strengthening Capital Ratios Unsecured Bond Maturities Moderating Ally Financial Unsecured Long-Term Debt Maturities $ Billions $9.3 $11.6 $1.3 $5.6 2011 2012 2013 2014 Tier 1 Common Ratio 4.8% 8.6% 7.6% 7.0% 10.1% 2009 2010 2011 2012
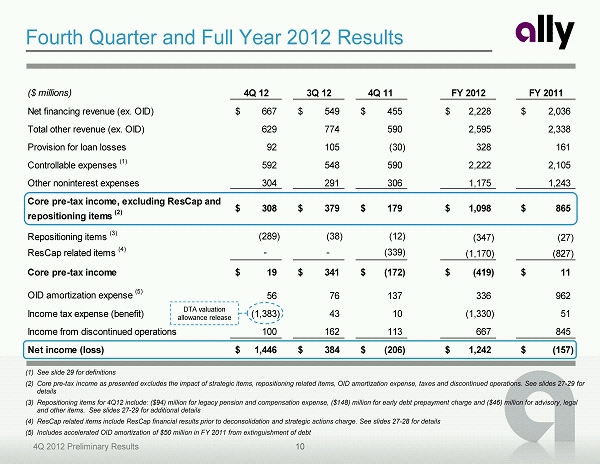
10 4Q 2012 Preliminary Results ($ millions) 4Q 12 3Q 12 4Q 11 FY 2012 FY 2011 Net financing revenue (ex. OID) 667$ 549$ 455$ 2,228$ 2,036$ Total other revenue (ex. OID) 629 774 590 2,595 2,338 Provision for loan losses 92 105 (30) 328 161 Controllable expenses (1) 592 548 590 2,222 2,105 Other noninterest expenses 304 291 306 1,175 1,243 Core pre-tax income, excluding ResCap and repositioning items (2) 308$ 379$ 179$ 1,098$ 865$ Repositioning items (3) (289) (38) (12) (347) (27) ResCap related items (4) - - (339) (1,170) (827) Core pre-tax income 19$ 341$ (172)$ (419)$ 11$ OID amortization expense (5) 56 76 137 336 962 Income tax expense (benefit) (1,383) 43 10 (1,330) 51 Income from discontinued operations 100 162 113 667 845 Net income (loss) 1,446$ 384$ (206)$ 1,242$ (157)$ Fourth Quarter and Full Year 2012 Results (1) See slide 29 for definitions (2) Core pre - tax income as presented excludes the impact of strategic items, repositioning related items, OID amortization expense, taxes and discontinued operations. See slides 27 - 29 for details (3) Repositioning items for 4Q12 include: ($94) million for legacy pension and compensation expense, ($148) million for early deb t p repayment charge and ($46) million for advisory, legal and other items. See slides 27 - 29 for additional details (4) ResCap related items include ResCap financial results prior to deconsolidation and strategic actions charge. See slides 27 - 28 fo r details (5) Includes accelerated OID amortization of $50 million in FY 2011 from extinguishment of debt DTA valuation allowance release

11 4Q 2012 Preliminary Results Ally Financial - Net Interest Margin $119 $132 $135 $136 5.30% 4.31% 4.42% 4.52% 1.70% 1.25% 1.60% 1.91% 3.66% 3.18% 2.95% 2.71% 1Q 11 2Q 11 3Q 11 4Q 11 1Q 12 2Q 12 3Q 12 4Q 12 Average Earning Assets ($B) Earning Asset Yield NIM (ex. OID) Cost of Funds (ex. OID) Net Interest Margin • Net Interest Margin (“NIM”) improved 31 bps QoQ and 67 bps YoY – Asset yields have remained fairly steady as competitive pressures are offset by a more profitable origination mix and lower cash levels – Cost of funds declined due to deposit growth and lower unsecured debt levels Note: Continuing operations only. See page 29 for definitions
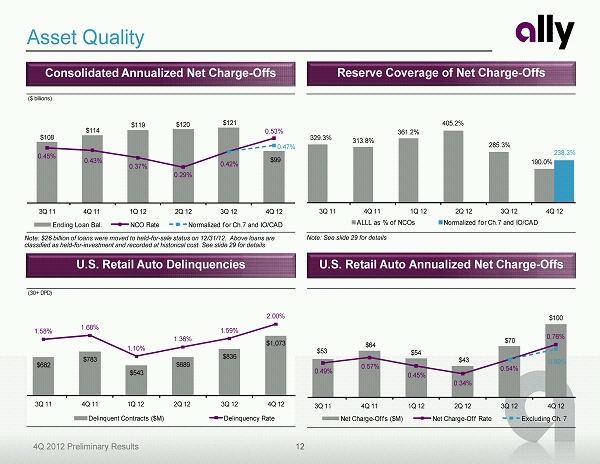
12 4Q 2012 Preliminary Results (30+ DPD) $682 $783 $543 $689 $836 $1,073 1.58% 1.68% 1.10% 1.36% 1.59% 2.00% 3Q 11 4Q 11 1Q 12 2Q 12 3Q 12 4Q 12 Delinquent Contracts ($M) Delinquency Rate Consolidated Annualized Net Charge - Offs Reserve Coverage of Net Charge - Offs Asset Quality U.S. Retail Auto Annualized Net Charge - Offs U.S. Retail Auto Delinquencies Note: $26 billion of loans were moved to held - for - sale status on 12/31/12. Above loans are classified as held - for - investment and recorded at historical cost. See slide 29 for details Note: See slide 29 for details $53 $64 $54 $43 $70 $100 0.49% 0.57% 0.45% 0.34% 0.54% 0.76% 0.69% 3Q 11 4Q 11 1Q 12 2Q 12 3Q 12 4Q 12 Net Charge - Offs ($M) Net Charge - Off Rate Excluding Ch. 7 ($ billions) $108 $114 $119 $120 $121 $99 0.45% 0.43% 0.37% 0.29% 0.42% 0.53% 0.47% 3Q 11 4Q 11 1Q 12 2Q 12 3Q 12 4Q 12 Ending Loan Bal. NCO Rate Normalized for Ch.7 and IO/CAD 329.3% 313.8% 361.2% 405.2% 285.3% 190.0% 238.3% 3Q 11 4Q 11 1Q 12 2Q 12 3Q 12 4Q 12 ALLL as % of NCOs Normalized for Ch.7 and IO/CAD
13 4Q 2012 Preliminary Results Pre-Tax Income ($ millions) 4Q 12 3Q 12 4Q 11 FY 2012 FY 2011 Automotive Finance 371$ 337$ 285$ 1,389$ 1,333$ Insurance 27 13 80 160 316 Dealer Financial Services 398$ 350$ 365$ 1,549$ 1,649$ Mortgage Operations 100 330 101 639 160 Corporate and Other (ex. OID) (1) (190) (301) (287) (1,090) (944) Core pre-tax income, excluding ResCap and repositioning items (2) 308$ 379$ 179$ 1,098$ 865$ • Ally will report results across three operating segments going forward: – Automotive Finance – positive results driven by earning asset and net financing revenue growth – Insurance – impacted by weather - related losses due to Superstorm Sandy – Mortgage Operations – Net servicing revenue declined from previous quarter • International businesses being sold have been moved to discontinued operations (see slide 25) • Segment results have been restated to allocate additional ongoing expenses to the operating segments from Corporate and Other (for example, deposit marketing expenses) (3) – Remaining Corporate and Other expenses, such as unallocated noninterest expense, are expected to diminish over time Results by Segment (1) Corporate and Other results exclude the impact of repositioning items, ResCap related items, and OID amortization expense. S ee slides 27 - 29 for details (2) Core pre - tax income as presented excludes the impact of repositioning items, ResCap related items, OID amortization expense, tax es and discontinued operations. See slides 27 - 29 for details (3) See slide 29 for more details
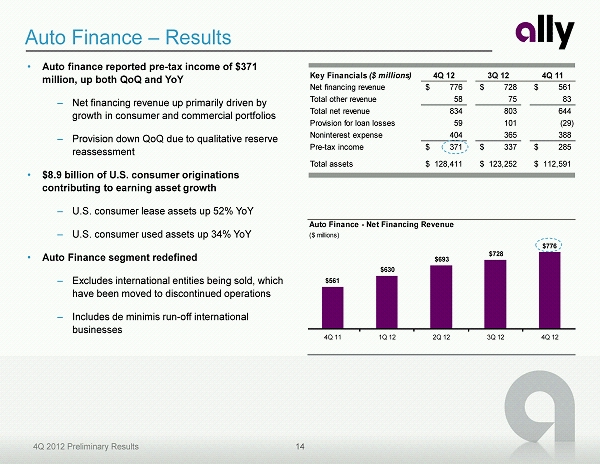
14 4Q 2012 Preliminary Results Key Financials ($ millions) 4Q 12 3Q 12 4Q 11 Net financing revenue 776$ 728$ 561$ Total other revenue 58 75 83 Total net revenue 834 803 644 Provision for loan losses 59 101 (29) Noninterest expense 404 365 388 Pre-tax income 371$ 337$ 285$ Total assets 128,411$ 123,252$ 112,591$ Auto Finance - Net Financing Revenue ($ millions) $561 $630 $693 $728 $776 4Q 11 1Q 12 2Q 12 3Q 12 4Q 12 • Auto finance reported pre - tax income of $371 million, up both QoQ and YoY – Net financing revenue up primarily driven by growth in consumer and commercial portfolios – Provision down QoQ due to qualitative reserve reassessment • $8.9 billion of U.S. consumer originations contributing to earning asset growth – U.S. consumer lease assets up 52% YoY – U.S. consumer used assets up 34% YoY • Auto Finance segment redefined – Excludes international entities being sold, which have been moved to discontinued operations – Includes de minimis run - off international businesses Auto Finance – Results
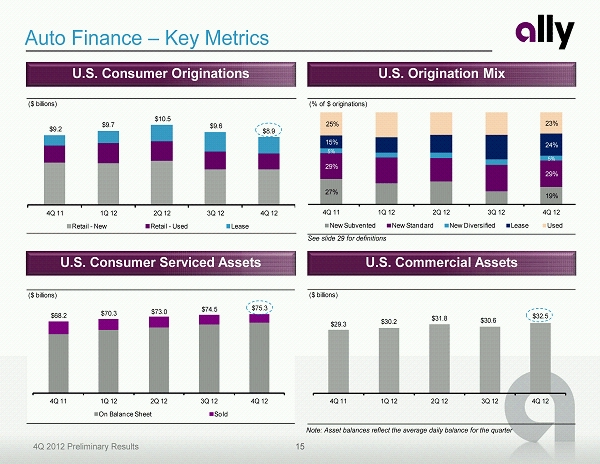
15 4Q 2012 Preliminary Results ($ billions) $68.2 $70.3 $73.0 $74.5 $75.3 4Q 11 1Q 12 2Q 12 3Q 12 4Q 12 On Balance Sheet Sold ($ billions) $29.3 $30.2 $31.8 $30.6 $32.5 4Q 11 1Q 12 2Q 12 3Q 12 4Q 12 (% of $ originations) 5% 5% 25% 23% 27% 19% 29% 29% 15% 24% 4Q 11 1Q 12 2Q 12 3Q 12 4Q 12 New Subvented New Standard New Diversified Lease Used ($ billions) $9.2 $9.7 $10.5 $9.6 $8.9 4Q 11 1Q 12 2Q 12 3Q 12 4Q 12 Retail - New Retail - Used Lease Auto Finance – Key Metrics See slide 29 for definitions U.S. Consumer Serviced Assets U.S. Commercial Assets U.S. Consumer Originations U.S. Origination Mix Note: Asset balances reflect the average daily balance for the quarter
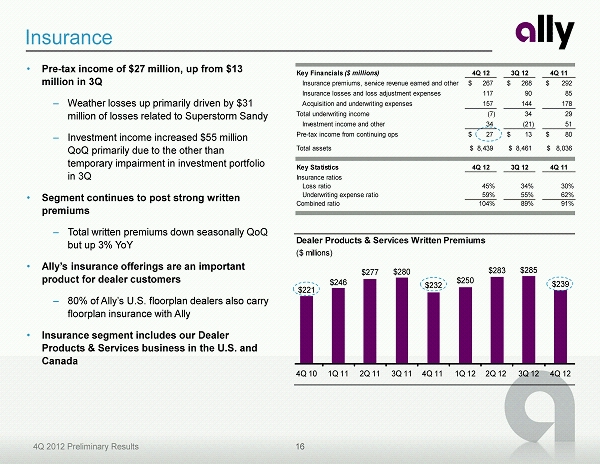
16 4Q 2012 Preliminary Results Key Financials ($ millions) 4Q 12 3Q 12 4Q 11 Insurance premiums, service revenue earned and other 267$ 268$ 292$ Insurance losses and loss adjustment expenses 117 90 85 Acquisition and underwriting expenses 157 144 178 Total underwriting income (7) 34 29 Investment income and other 34 (21) 51 Pre-tax income from continuing ops 27$ 13$ 80$ Total assets 8,439$ 8,461$ 8,036$ Key Statistics 4Q 12 3Q 12 4Q 11 Insurance ratios Loss ratio 45% 34% 30% Underwriting expense ratio 59% 55% 62% Combined ratio 104% 89% 91% Dealer Products & Services Written Premiums ($ millions) $221 $246 $277 $280 $232 $250 $283 $285 $239 4Q 10 1Q 11 2Q 11 3Q 11 4Q 11 1Q 12 2Q 12 3Q 12 4Q 12 Insurance • Pre - tax income of $27 million, up from $13 million in 3Q – Weather losses up primarily driven by $31 million of losses related to Superstorm Sandy – Investment income increased $55 million QoQ primarily due to the other than temporary impairment in investment portfolio in 3Q • Segment continues to post strong written premiums – Total written premiums down seasonally QoQ but up 3% YoY • Ally’s insurance offerings are an important product for dealer customers – 80% of Ally’s U.S. floorplan dealers also carry floorplan insurance with Ally • Insurance segment includes our Dealer Products & Services business in the U.S. and Canada
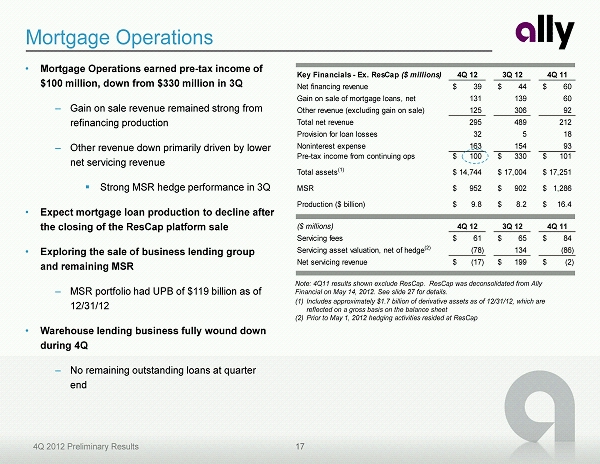
17 4Q 2012 Preliminary Results Key Financials - Ex. ResCap ($ millions) 4Q 12 3Q 12 4Q 11 Net financing revenue 39$ 44$ 60$ Gain on sale of mortgage loans, net 131 139 60 Other revenue (excluding gain on sale) 125 306 92 Total net revenue 295 489 212 Provision for loan losses 32 5 18 Noninterest expense 163 154 93 Pre-tax income from continuing ops 100$ 330$ 101$ Total assets (1) 14,744$ 17,004$ 17,251$ MSR 952$ 902$ 1,286$ Production ($ billion) 9.8$ 8.2$ 16.4$ TRUE ($ millions) 4Q 12 3Q 12 4Q 11 Servicing fees 61$ 65$ 84$ Servicing asset valuation, net of hedge (2) (78) 134 (86) Net servicing revenue (17)$ 199$ (2)$ Mortgage Operations • Mortgage Operations earned pre - tax income of $100 million, down from $330 million in 3Q – Gain on sale revenue remained strong from refinancing production – Other revenue down primarily driven by lower net servicing revenue ▪ Strong MSR hedge performance in 3Q • Expect mortgage loan production to decline after the closing of the ResCap platform sale • Exploring the sale of business lending group and remaining MSR – MSR portfolio had UPB of $119 billion as of 12/31/12 • Warehouse lending business fully wound down during 4Q – No remaining outstanding loans at quarter end Note: 4Q11 results shown exclude ResCap. ResCap was deconsolidated from Ally Financial on May 14, 2012. See slide 27 for details. (1) Includes approximately $1.7 billion of derivative assets as of 12/31/12, which are reflected on a gross basis on the balance sheet (2) Prior to May 1, 2012 hedging activities resided at ResCap
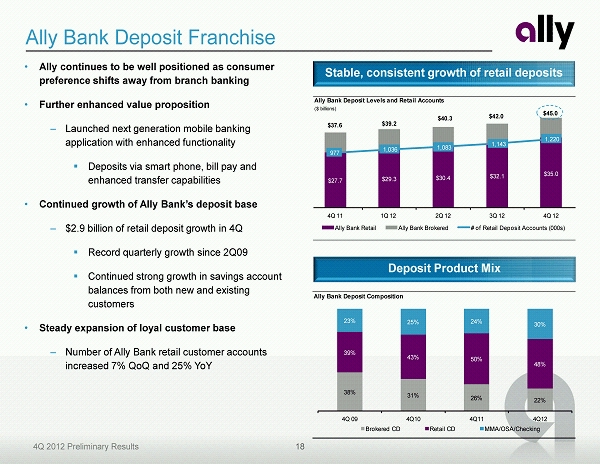
18 4Q 2012 Preliminary Results Ally Bank Deposit Levels and Retail Accounts ($ billions) $27.7 $29.3 $30.4 $32.1 $35.0 $37.6 $39.2 $40.3 $42.0 $45.0 977 1,036 1,083 1,143 1,220 4Q 11 1Q 12 2Q 12 3Q 12 4Q 12 Ally Bank Retail Ally Bank Brokered # of Retail Deposit Accounts (000s) Ally Bank Deposit Franchise • Ally continues to be well positioned as consumer preference shifts away from branch banking • Further enhanced value proposition – Launched next generation mobile banking application with enhanced functionality ▪ Deposits via smart phone, bill pay and enhanced transfer capabilities • Continued growth of Ally Bank’s deposit base – $2.9 billion of retail deposit growth in 4Q ▪ Record quarterly growth since 2Q09 ▪ Continued strong growth in savings account balances from both new and existing customers • Steady expansion of loyal customer base – Number of Ally Bank retail customer accounts increased 7% QoQ and 25% YoY Stable, consistent growth of retail deposits Deposit Product Mix Ally Bank Deposit Composition 38% 31% 26% 22% 39% 43% 50% 48% 23% 25% 24% 30% 4Q 09 4Q10 4Q11 4Q12 Brokered CD Retail CD MMA/OSA/Checking
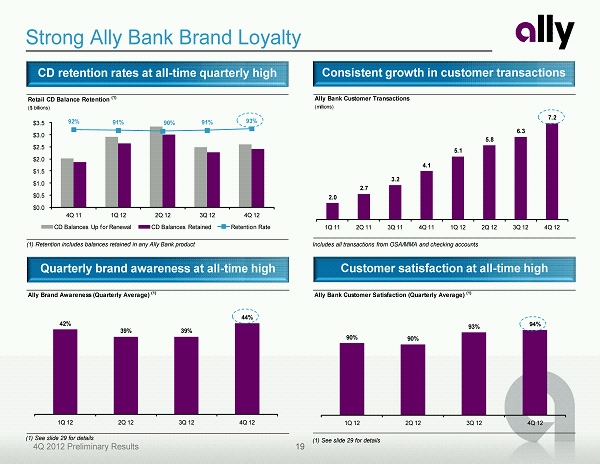
19 4Q 2012 Preliminary Results Ally Bank Customer Satisfaction (Quarterly Average) (1) 90% 90% 93% 94% 1Q 12 2Q 12 3Q 12 4Q 12 Strong Ally Bank Brand Loyalty Consistent growth in customer transactions Customer satisfaction at all - time high CD retention rates at all - time quarterly high Quarterly brand awareness at all - time high Retail CD Balance Retention (1) ($ billions) 92% 91% 90% 91% 93% $0.0 $0.5 $1.0 $1.5 $2.0 $2.5 $3.0 $3.5 4Q 11 1Q 12 2Q 12 3Q 12 4Q 12 CD Balances Up for Renewal CD Balances Retained Retention Rate (1) Retention includes balances retained in any Ally Bank product (1) See slide 29 for details (1) See slide 29 for details Ally Brand Awareness (Quarterly Average) (1) 42% 39% 39% 44% 1Q 12 2Q 12 3Q 12 4Q 12 Includes all transactions from OSA/MMA and checking accounts Ally Bank Customer Transactions (millions) 2.0 2.7 3.2 4.1 5.1 5.8 6.3 7.2 1Q 11 2Q 11 3Q 11 4Q 11 1Q 12 2Q 12 3Q 12 4Q 12
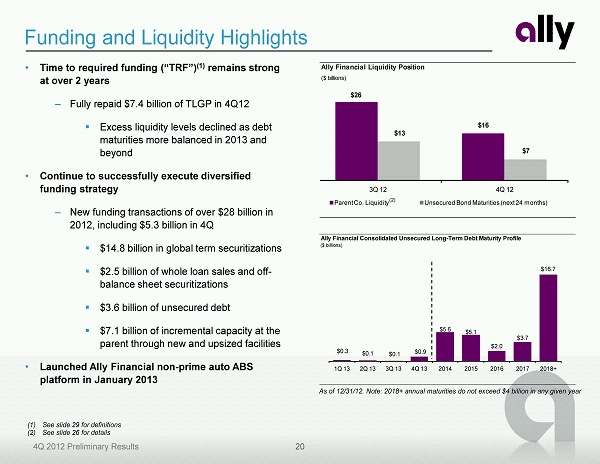
20 4Q 2012 Preliminary Results Ally Financial Liquidity Position ($ billions) $26 $16 $13 $7 3Q 12 4Q 12 Parent Co. Liquidity Unsecured Bond Maturities (next 24 months) Ally Financial Consolidated Unsecured Long-Term Debt Maturity Profile ($ billions) $0.3 $0.1 $0.1 $0.9 $5.6 $5.1 $2.0 $3.7 $16.7 1Q 13 2Q 13 3Q 13 4Q 13 2014 2015 2016 2017 2018+ • Time to required funding (“TRF”) (1) remains strong at over 2 years – Fully repaid $7.4 billion of TLGP in 4Q12 ▪ Excess liquidity levels declined as debt maturities more balanced in 2013 and beyond • Continue to successfully execute diversified funding strategy – New funding transactions of over $28 billion in 2012, including $5.3 billion in 4Q ▪ $14.8 billion in global term securitizations ▪ $2.5 billion of whole loan sales and off - balance sheet securitizations ▪ $3.6 billion of unsecured debt ▪ $7.1 billion of incremental capacity at the parent through new and upsized facilities • Launched Ally Financial non - prime auto ABS platform in January 2013 Funding and Liquidity Highlights (1) See slide 29 for definitions (2) See slide 26 for details (2) As of 12/31/12. Note: 2018+ annual maturities do not exceed $4 billion in any given year
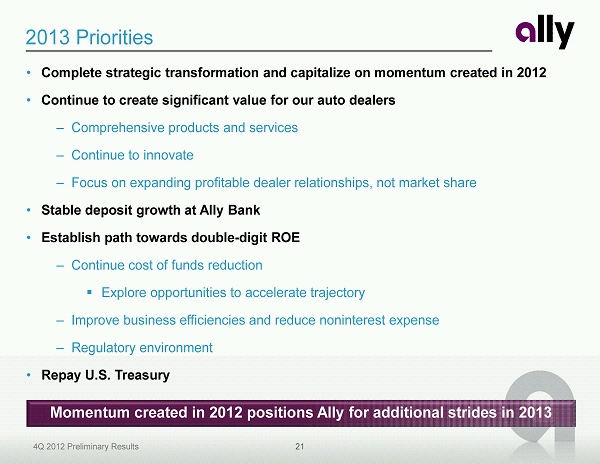
21 4Q 2012 Preliminary Results 2013 Priorities • Complete strategic transformation and capitalize on momentum created in 2012 • Continue to create significant value for our auto dealers – Comprehensive products and services – Continue to innovate – Focus on expanding profitable dealer relationships, not market share • Stable deposit growth at Ally Bank • Establish path towards double - digit ROE – Continue cost of funds reduction ▪ Explore opportunities to accelerate trajectory – Improve business efficiencies and reduce noninterest expense – Regulatory environment • Repay U.S. Treasury Momentum created in 2012 positions Ally for additional strides in 2013
Supplemental Charts
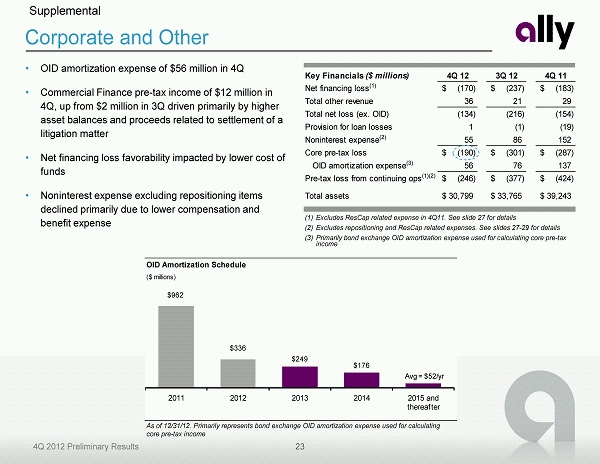
23 4Q 2012 Preliminary Results Key Financials ($ millions) 4Q 12 3Q 12 4Q 11 Net financing loss (1) (170)$ (237)$ (183)$ Total other revenue 36 21 29 Total net loss (ex. OID) (134) (216) (154) Provision for loan losses 1 (1) (19) Noninterest expense (2) 55 86 152 Core pre-tax loss (190)$ (301)$ (287)$ OID amortization expense (3) 56 76 137 Pre-tax loss from continuing ops (1)(2) (246)$ (377)$ (424)$ Total assets 30,799$ 33,765$ 39,243$ Corporate and Other • OID amortization expense of $56 million in 4Q • Commercial Finance pre - tax income of $12 million in 4Q, up from $2 million in 3Q driven primarily by higher asset balances and proceeds related to settlement of a litigation matter • Net financing loss favorability impacted by lower cost of funds • Noninterest expense excluding repositioning items declined primarily due to lower compensation and benefit expense Supplemental (1) Excludes ResCap related expense in 4Q11. See slide 27 for details (2) Excludes repositioning and ResCap related expenses. See slides 27 - 29 for details (3) Primarily bond exchange OID amortization expense used for calculating core pre - tax income As of 12/31/12. Primarily represents bond exchange OID amortization expense used for calculating core pre - tax income OID Amortization Schedule ($ millions) $962 $336 $249 $176 Avg = $52/yr 2011 2012 2013 2014 2015 and thereafter
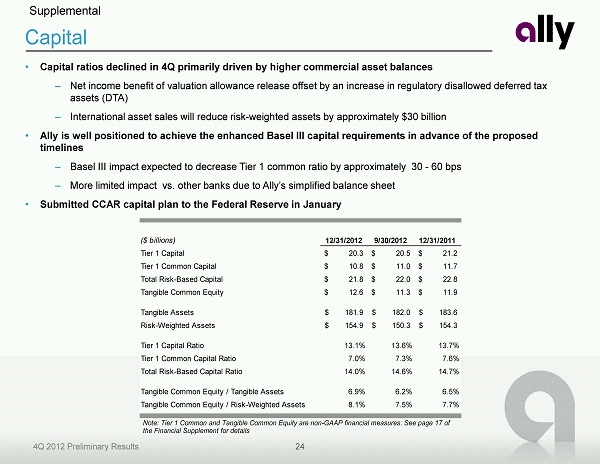
24 4Q 2012 Preliminary Results Capital • Capital ratios declined in 4Q primarily driven by higher commercial asset balances – Net income benefit of valuation allowance release offset by an increase in regulatory disallowed deferred tax assets (DTA) – International asset sales will reduce risk - weighted assets by approximately $30 billion • Ally is well positioned to achieve the enhanced Basel III capital requirements in advance of the proposed timelines – Basel III impact expected to decrease Tier 1 common ratio by approximately 30 - 60 bps – More limited impact vs. other banks due to Ally’s simplified balance sheet • Submitted CCAR capital plan to the Federal Reserve in January Note: Tier 1 Common and Tangible Common Equity are non - GAAP financial measures. See page 17 of the Financial Supplement for details Supplemental ($ billions) 12/31/2012 9/30/2012 12/31/2011 Tier 1 Capital 20.3$ 20.5$ 21.2$ Tier 1 Common Capital 10.8$ 11.0$ 11.7$ Total Risk-Based Capital 21.8$ 22.0$ 22.8$ Tangible Common Equity 12.6$ 11.3$ 11.9$ Tangible Assets 181.9$ 182.0$ 183.6$ Risk-Weighted Assets 154.9$ 150.3$ 154.3$ Tier 1 Capital Ratio 13.1% 13.6% 13.7% Tier 1 Common Capital Ratio 7.0% 7.3% 7.6% Total Risk-Based Capital Ratio 14.0% 14.6% 14.7% Tangible Common Equity / Tangible Assets 6.9% 6.2% 6.5% Tangible Common Equity / Risk-Weighted Assets 8.1% 7.5% 7.7%
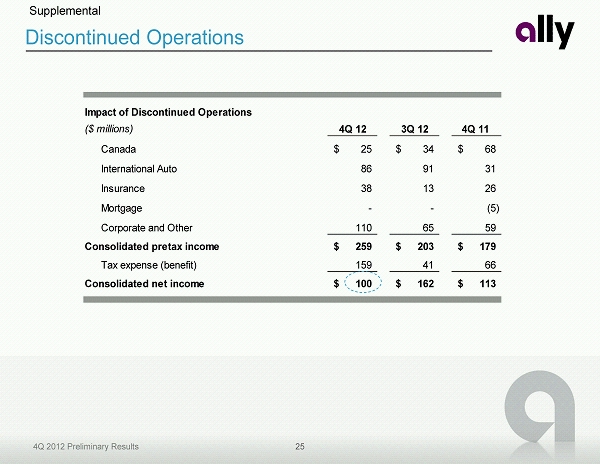
25 4Q 2012 Preliminary Results Impact of Discontinued Operations ($ millions) 4Q 12 3Q 12 4Q 11 Canada 25$ 34$ 68$ International Auto 86 91 31 Insurance 38 13 26 Mortgage - - (5) Corporate and Other 110 65 59 Consolidated pretax income 259$ 203$ 179$ Tax expense (benefit) 159 41 66 Consolidated net income 100$ 162$ 113$ Discontinued Operations Supplemental
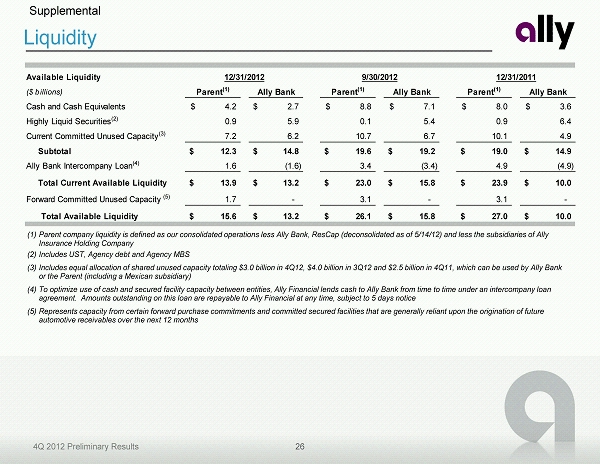
26 4Q 2012 Preliminary Results Liquidity Supplemental (1) Parent company liquidity is defined as our consolidated operations less Ally Bank, ResCap (deconsolidated as of 5/14/12) and les s the subsidiaries of Ally Insurance Holding Company (2) Includes UST, Agency debt and Agency MBS (3) Includes equal allocation of shared unused capacity totaling $3.0 billion in 4Q12, $4.0 billion in 3Q12 and $2.5 billion in 4 Q11 , which can be used by Ally Bank or the Parent (including a Mexican subsidiary) (4) To optimize use of cash and secured facility capacity between entities, Ally Financial lends cash to Ally Bank from time to t ime under an intercompany loan agreement. Amounts outstanding on this loan are repayable to Ally Financial at any time, subject to 5 days notice (5) Represents capacity from certain forward purchase commitments and committed secured facilities that are generally reliant upo n t he origination of future automotive receivables over the next 12 months Available Liquidity 12/31/2012 9/30/2012 12/31/2011 ($ billions) Parent (1) Ally Bank Parent (1) Ally Bank Parent (1) Ally Bank Cash and Cash Equivalents 4.2$ 2.7$ 8.8$ 7.1$ 8.0$ 3.6$ Highly Liquid Securities (2) 0.9 5.9 0.1 5.4 0.9 6.4 Current Committed Unused Capacity (3) 7.2 6.2 10.7 6.7 10.1 4.9 Subtotal 12.3$ 14.8$ 19.6$ 19.2$ 19.0$ 14.9$ Ally Bank Intercompany Loan (4) 1.6 (1.6) 3.4 (3.4) 4.9 (4.9) SubtotalTotal Current Available Liquidity 13.9$ 13.2$ 23.0$ 15.8$ 23.9$ 10.0$ Forward Committed Unused Capacity (5) 1.7 - 3.1 - 3.1 - Total Available Liquidity 15.6$ 13.2$ 26.1$ 15.8$ 27.0$ 10.0$
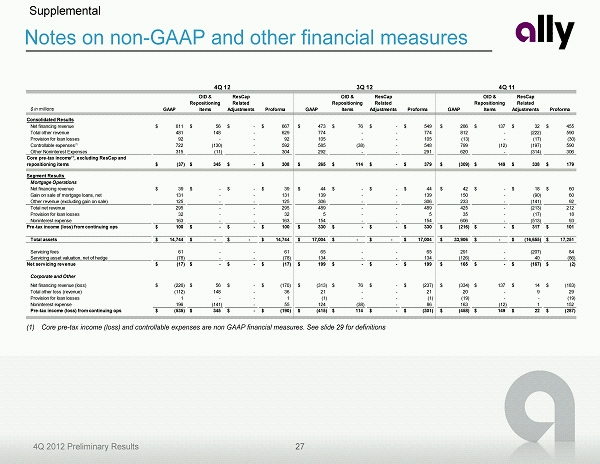
27 4Q 2012 Preliminary Results Notes on non - GAAP and other financial measures Supplemental (1) Core pre - tax income (loss) and controllable expenses are non GAAP financial measures. See slide 29 for definitions $ in millions GAAP OID & Repositioning Items ResCap Related Adjustments Proforma GAAP OID & Repositioning Items ResCap Related Adjustments Proforma GAAP OID & Repositioning Items ResCap Related Adjustments Proforma Consolidated Results Net financing revenue 611$ 56$ -$ 667$ 473$ 76$ -$ 549$ 286$ 137$ 32$ 455$ Total other revenue 481 148 - 629 774 - - 774 812 - (222) 590 Provision for loan losses 92 - - 92 105 - - 105 (13) - (17) (30) Controllable expenses(1) 722 (130) - 592 585 (38) - 548 799 (12) (197) 590 Other Noninterest Expenses 315 (11) - 304 292 - - 291 620 - (314) 306 Core pre-tax income(1), excluding ResCap and repositioning items (37)$ 345$ -$ 308$ 265$ 114$ -$ 379$ (309)$ 149$ 338$ 179$ Segment Results Mortgage Operations Net financing revenue 39$ -$ -$ 39$ 44$ -$ -$ 44$ 42$ -$ 18$ 60$ Gain on sale of mortgage loans, net 131 - - 131 139 - - 139 150 - (90) 60 Other revenue (excluding gain on sale) 125 - - 125 306 - - 306 233 - (141) 92 Total net revenue 295 - - 295 489 - - 489 425 - (213) 212 Provision for loan losses 32 - - 32 5 - - 5 35 - (17) 18 Noninterest expense 163 - - 163 154 - - 154 606 - (513) 93 Pre-tax income (loss) from continuing ops 100$ -$ -$ 100$ 330$ -$ -$ 330$ (216)$ -$ 317$ 101$ Total assets 14,744$ -$ -$ 14,744$ 17,004$ -$ -$ 17,004$ 33,906$ -$ (16,655)$ 17,251$ Servicing fees 61 - - 61 65 - - 65 291 - (207) 84 Servicing asset valuation, net of hedge (78) - - (78) 134 - - 134 (126) - 40 (86) Net servicing revenue (17)$ -$ -$ (17)$ 199$ -$ -$ 199$ 165$ -$ (167)$ (2)$ Corporate and Other Net financing revenue (loss) (226)$ 56$ -$ (170)$ (313)$ 76$ -$ (237)$ (334)$ 137$ 14$ (183)$ Total other loss (revenue) (112) 148 - 36 21 - - 21 20 - 9 29 Provision for loan losses 1 - - 1 (1) - - (1) (19) - - (19) Noninterest expense 196 (141) - 55 124 (38) - 86 163 (12) 1 152 Pre-tax income (loss) from continuing ops (535)$ 345$ -$ (190)$ (415)$ 114$ -$ (301)$ (458)$ 149$ 22$ (287)$ 4Q 12 3Q 12 4Q 11
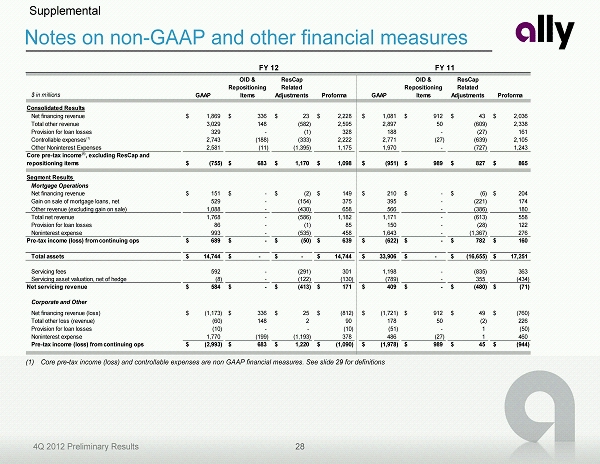
28 4Q 2012 Preliminary Results Notes on non - GAAP and other financial measures Supplemental (1) Core pre - tax income (loss) and controllable expenses are non GAAP financial measures. See slide 29 for definitions $ in millions GAAP OID & Repositioning Items ResCap Related Adjustments Proforma GAAP OID & Repositioning Items ResCap Related Adjustments Proforma Consolidated Results Net financing revenue 1,869$ 336$ 23$ 2,228$ 1,081$ 912$ 43$ 2,036$ Total other revenue 3,029 148 (582) 2,595 2,897 50 (609) 2,338 Provision for loan losses 329 - (1) 328 188 - (27) 161 Controllable expenses(1) 2,743 (188) (333) 2,222 2,771 (27) (639) 2,105 Other Noninterest Expenses 2,581 (11) (1,395) 1,175 1,970 - (727) 1,243 Core pre-tax income(1), excluding ResCap and repositioning items (755)$ 683$ 1,170$ 1,098$ (951)$ 989$ 827$ 865$ Segment Results Mortgage Operations Net financing revenue 151$ -$ (2)$ 149$ 210$ -$ (6)$ 204$ Gain on sale of mortgage loans, net 529 - (154) 375 395 - (221) 174 Other revenue (excluding gain on sale) 1,088 - (430) 658 566 - (386) 180 Total net revenue 1,768 - (586) 1,182 1,171 - (613) 558 Provision for loan losses 86 - (1) 85 150 - (28) 122 Noninterest expense 993 - (535) 458 1,643 - (1,367) 276 Pre-tax income (loss) from continuing ops 689$ -$ (50)$ 639$ (622)$ -$ 782$ 160$ Total assets 14,744$ -$ -$ 14,744$ 33,906$ -$ (16,655)$ 17,251$ Servicing fees 592 - (291) 301 1,198 - (835) 363 Servicing asset valuation, net of hedge (8) - (122) (130) (789) - 355 (434) Net servicing revenue 584$ -$ (413)$ 171$ 409$ -$ (480)$ (71)$ Corporate and Other Net financing revenue (loss) (1,173)$ 336$ 25$ (812)$ (1,721)$ 912$ 49$ (760)$ Total other loss (revenue) (60) 148 2 90 178 50 (2) 226 Provision for loan losses (10) - - (10) (51) - 1 (50) Noninterest expense 1,770 (199) (1,193) 378 486 (27) 1 460 Pre-tax income (loss) from continuing ops (2,993)$ 683$ 1,220$ (1,090)$ (1,978)$ 989$ 45$ (944)$ FY 12 FY 11
29 4Q 2012 Preliminary Results Notes on non - GAAP and other financial measures Supplemental 1) Core pre - tax income (loss) is a non - GAAP financial measure. It is defined as income (loss) from continuing operations before taxes and primarily bond exchange original issue discount ("OID") amortization expense. 2) Repositioning Items for 4Q12 include: ($94) million for legacy pension and compensation expense resulting from the company’s strategic decision t o d e - risk its long - term pension liability through lump - sum buy - outs and annuity placements for former subsidiaries; ($148) million incurre d for the early prepayment of certain Federal Home Loan Bank (FHLB) debt to further reduce Ally’s funding costs; and ($46) million in legal, advisory fees, an d other expenses related to the ResCap bankruptcy and disposition of our International Operations. 3) Time to required funding (“TRF”) is a liquidity risk measure expressed as the number of months that Ally Financial can meet its ongoing liquidity needs as they arise without issuing unsecured debt. The TRF metric assumes that auto asset growth projections remain unchanged and tha t t he auto ABS markets remain open. 4) Corporate and Other primarily consists of Ally’s centralized treasury activities, the residual impacts of the company’s corporate funds transfer pri cing and asset liability management activities, and the amortization of the discount associated with new debt issuances and bond excha nge s. Corporate and Other also includes the Commercial Finance business, certain equity investments and reclassifications, eliminations between the reportab le operating segments, and overhead previously allocated to operations that have since been sold or discontinued. 5) Controllable expenses include employee related costs, consulting and legal fees, marketing, information technology, facility, portfolio servicing a nd restructuring expenses. 6) Net interest margin (“NIM”) and cost of funds (“COF”) exclude OID amortization expense. 7) U.S. consumer auto originations ▪ New Subvented – subvented rate new vehicle loans from GM and Chrysler dealers ▪ New Standard – standard rate new vehicle loans from GM and Chrysler dealers ▪ New Diversified – new vehicle loans from non - GM/Chrysler dealers ▪ Lease – new vehicle lease originations from all dealers ▪ Used – used vehicle loans from all dealers 8) Net charge - off ratios are calculated as annualized net charge - offs divided by average outstanding finance receivables and loans excluding loans measur ed at fair value and loans held - for - sale. 9) Allowance coverage ratios are based on the allowance for loan losses related to loans held - for - investment excluding those loans held at fair value as a percentage of the unpaid principal balance, net of premiums and discounts. 10) Brand Awareness is a measure of Ally Bank recognition in the marketplace, measured by TNS Custom Research, a third party market research firm . 11) Customer Satisfaction is measured via an online banking survey presented to Ally Bank customers. 12) Segment Results have been restated for all periods shown to allocate expenses associated with deposit gathering activities and other addition al costs related to obtaining liquidity to the Auto Finance and Mortgage operations. These expenses were previously included within our Corpor ate and Other activities. Additionally, we began to include overhead that was previously allocated to operations that have since been sold or moved int o d iscontinued operations within our Corporate and Other activities. The new presentation is intended to reflect management's current view of the segments pre sen ted.