
Ally Financial Inc. 3Q Earnings Review Contact Ally Investor Relations at (866) 710 - 4623 or investor.relations@ally.com November 5, 2013
2 3Q 2013 Preliminary Results Forward - Looking Statements and Additional Information The following should be read in conjunction with the financial statements, notes and other information contained in the Compa ny’ s Annual Reports on Form 10 - K, Quarterly Reports on Form 10 - Q, and Current Reports on Form 8 - K . This information is preliminary and based on company data available at the time of the presentation In the presentation that follows and related comments by Ally Financial Inc. (“Ally”) management, the use of the words “expec t,” “anticipate,” “estimate,” “forecast,” “initiative,” “objective,” “plan,” “goal,” “project,” “outlook,” “priorities,” “target ,” “explore,” “positions,” “intend,” “evaluate,” “pursue,” “seek,” “may,” “ would, ” “ could, ” “ should, ” “ believe, ” “ potential, ” “ continue,” or the negative of these words, or similar expressions is intended to identify forward - looking statements. All statements herein and in related management comments, other than statements of historical fact, including without limitation, statements about future events and financial performance, are forward - looking statements tha t involve certain risks and uncertainties. While these statements represent our current judgment on what the future may hold, and we believe these judgments are reasonable, these statements are not guarantees of any events or financial results, and Ally’s actual results may differ mate ria lly due to numerous important factors that are described in the most recent reports on SEC Forms 10 - K and 10 - Q for Ally, each of which may be revise d or supplemented in subsequent reports filed with the SEC. Such factors include, among others, the following: maintaining the mut ual ly beneficial relationship between Ally and General Motors (“GM”), and Ally and Chrysler Group LLC (“Chrysler”); the profitability and fina nci al condition of GM and Chrysler; resolution of the bankruptcy filings by Residential Capital, LLC and certain of its subsidiaries; our ability to realize the anticipated benefits associated with being a bank holding company, and the increased regulation and restrictions that we are now subject to; the potential for deterioration in the residual value of off - lease vehicles; disruptions in the market in which we fund our operations, with resul ting negative impact on our liquidity; changes in our accounting assumptions that may require or that result from changes in the accounting rules or the ir application, which could result in an impact on earnings; changes in the credit ratings of Ally, Chrysler, or GM; changes in economic conditions , c urrency exchange rates or political stability in the markets in which we operate; and changes in the existing or the adoption of new laws, reg ula tions, policies or other activities of governments, agencies and similar organizations (including as a result of the Dodd - Frank Act and Basel III). Investors are cautioned not to place undue reliance on forward - looking statements. Ally undertakes no obligation to update publi cly or otherwise revise any forward - looking statements, whether as a result of new information, future events or other such factors that affect the subject of these statements, except where expressly required by law. Reconciliation of non - GAAP financial measures included within this presentation are provided in this presentation. Use of the term “loans” describes products associated with direct and indirect lending activities of Ally’s global operations . T he specific products include retail installment sales contracts, loans, lines of credit, leases or other financing products. The term “originate” ref ers to Ally’s purchase, acquisition or direct origination of various “loan” products .

3 3Q 2013 Preliminary Results Strong Core Business Trends x Private Placement of $1 billion of common equity, subject to certain closing conditions x Cost of funds (2) declined 57 bps YoY due to liability management actions x Net financing revenue (2) up 46% YoY x Net interest margin (2) up 74 bps YoY x Pro Forma Tier 1 Common ratio of 9.3% (3) x ResCap bankruptcy process nearing completion Strong Financial Profile x $9.6 billion of U.S. consumer auto originations x U.S. auto earning assets up 8% YoY x 3Q retail deposit growth of $1.8 billion x 754 thousand primary deposit customers, up 30% YoY x Ally Bank named 'Best Online Bank' for 3 rd straight year - MONEY ® Magazine Nov. 2013 Third Quarter Highlights (1) Core pre - tax income as presented excludes the impact of repositioning items, OID amortization expense, taxes and discontinued op erations. See slides 26 and 27 for details (2) Excluding OID (3) 3Q13 Tier 1 Common ratio pro forma for remaining international sales, impacts from MCP repurchase and $1 billion equity raise • Core pre - tax income, excluding repositioning items, (1) of $271 million and net income of $91 million

4 3Q 2013 Preliminary Results Common Equity Raise Recap • Private Placement of $1.0 billion of Ally common equity – Signed definitive agreements on August 19 – 12 institutional investors participated • Transaction to be completed in conjunction with : – Non - objection of CCAR Plan – Repurchase of Series F - 2 MCP – Elimination and settlement with respect to Share Adjustment Provision (“SAP”) • Transaction to settle on or before November 30 • MCP repurchase and SAP settlement would bring total U.S. Treasury repayment to $12.3 billion (1) – Remaining cash basis of $4.9 billion in the form of a 66% common equity ownership Transaction supports process of final monetization of U.S. Treasury’s investment (1) This amount also includes preferred stock dividends paid or declared, interest payments and proceeds received by the U.S. Treasury from its sale of Ally trust preferred securities
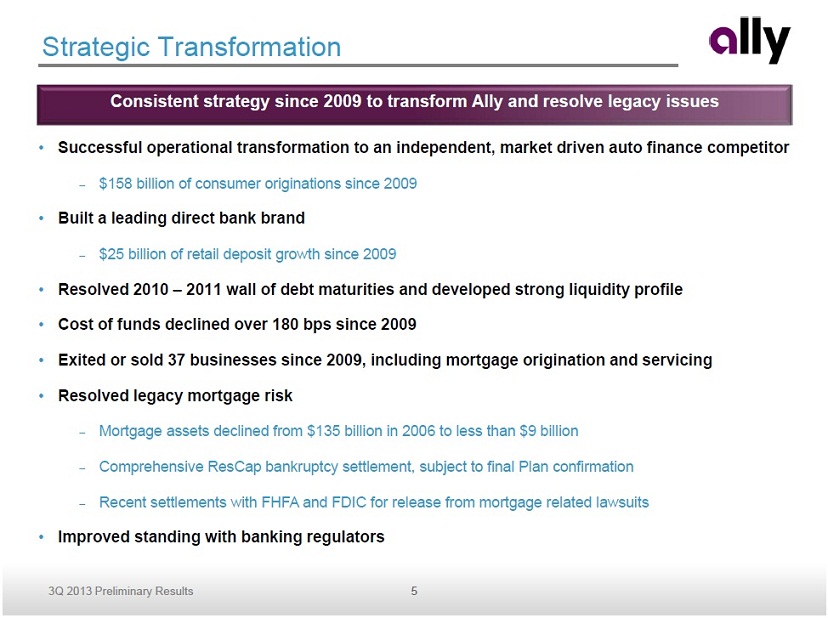
5 3Q 2013 Preliminary Results Strategic Transformation • Successful operational transformation to an independent, market driven auto finance competitor – $158 billion of consumer originations since 2009 • Built a leading direct bank brand – $25 billion of retail deposit growth since 2009 • Resolved 2010 – 2011 wall of debt maturities and developed strong liquidity profile • Cost of funds declined over 180 bps since 2009 • Exited or sold 37 businesses since 2009, including mortgage origination and servicing • Resolved legacy mortgage risk – Mortgage assets declined from $ 135 billion in 2006 to less than $9 billion – Comprehensive ResCap bankruptcy settlement, subject to final Plan confirmation – Recent settlements with FHFA and FDIC for release from mortgage related lawsuits • Improved standing with banking regulators Consistent strategy s ince 2009 to transform Ally and resolve l egacy i ssues

6 3Q 2013 Preliminary Results Visible Path to Improved Profitability • Volatility associated with the mortgage business has been substantially removed • Earnings are expected to be more stable and steadily improve over time – Meaningful core income growth • Improvement will be primarily driven by: As transformation is nearing completion, Ally is now fully focused on improving profitability Margin Expansion Noninterest Expense Reduction Regulatory Impacts ▪ Increasing utilization of low cost deposits and reductions in high - cost unsecured debt ▪ Liability management program well underway with cost of funds reduction already visible ▪ Reducing controllable expenses to reflect a more simplified corporate structure ▪ Streamlined from multi - national / multi - industry to domestic auto focused company ▪ Expanded use of Ally Bank to fund asset base ▪ Longer term capital rationalization Path to double digit return on equity is underway

7 3Q 2013 Preliminary Results ($ millions) 3Q 13 2Q 13 3Q 12 2Q 13 3Q 12 Net financing revenue (ex. OID) 801$ 689$ 548$ 112$ 253$ Total other revenue 367 411 774 (44) (408) Provision for loan losses 141 89 105 52 36 Controllable expenses (1) 488 498 545 (10) (57) Other noninterest expenses 268 300 292 (33) (24) Core pre-tax income, ex. repositioning (2) 271$ 211$ 380$ 60$ (109)$ Repositioning items (3) (2) (11) (7) 9 5 Core pre-tax income 269$ 201$ 373$ 68$ (104)$ OID amortization expense 64 61 76 3 (12) Income tax expense 28 40 46 (12) (18) (Loss) income from discontinued operations (4) (86) (1,027) 133 941 (219) Net income 91$ (927)$ 384$ 1,018$ (293)$ Increase/(Decrease) vs. Third Quarter Results (1) See slide 27 for definitions (2) Core pre - tax income as presented excludes the impact of repositioning items, OID amortization expense, taxes and discontinued op erations. See slides 26 and 27 for details (3) Repositioning items for 3Q13 are primarily related to exiting non - strategic mortgage activities. See slide 26 for additional details (4) Includes charge taken for FHFA and FDIC settlement

8 3Q 2013 Preliminary Results Results by Segment (1) Mortgage and Corporate and Other results exclude the impact of repositioning items. Corporate and Other excludes OID amortization expense. See slide 26 for details (2) Core pre - tax income as presented excludes the impact of repositioning items, OID amortization expense, taxes and discontinued operations. See slides 26 and 27 for details • Core pre - tax income, excluding repositioning items, up $60 million QoQ and down $109 million YoY – YoY decline driven by exiting the mortgage business – QoQ increase driven by continued steady performance in the core businesses and reduced cost of funds Pre-Tax Income ($ millions) 3Q 13 2Q 13 3Q 12 Automotive Finance 339$ (43)$ 2$ Insurance 83 38 70 Dealer Financial Services 422$ (5)$ 72$ Mortgage (1) (5) 21 (336) Corporate and Other (ex. OID) (1) (146) 43 155 Core pre-tax income, ex. repositioning (2) 271$ 60$ (109)$ Increase/(Decrease) vs.

9 3Q 2013 Preliminary Results Net Interest Margin • Net Interest Margin (“NIM”) improved 30 bps QoQ and 74 bps YoY • Cost of funds declined 34 bps QoQ and 57 bps YoY driven primarily by the redemption of high - cost legacy callable debt – Expect additional improvement as debt calls continue Note: Continuing operations only. See slide 27 for definitions Ally Financial - Net Interest Margin $135 $134 $135 4.42% 4.48% 4.47% 1.60% 2.04% 2.34% 2.95% 2.72% 2.38% 3Q 12 4Q 12 1Q 13 2Q 13 3Q 13 Average Earning Assets ($B) Earning Asset Yield NIM (ex. OID) Cost of Funds (ex. OID)
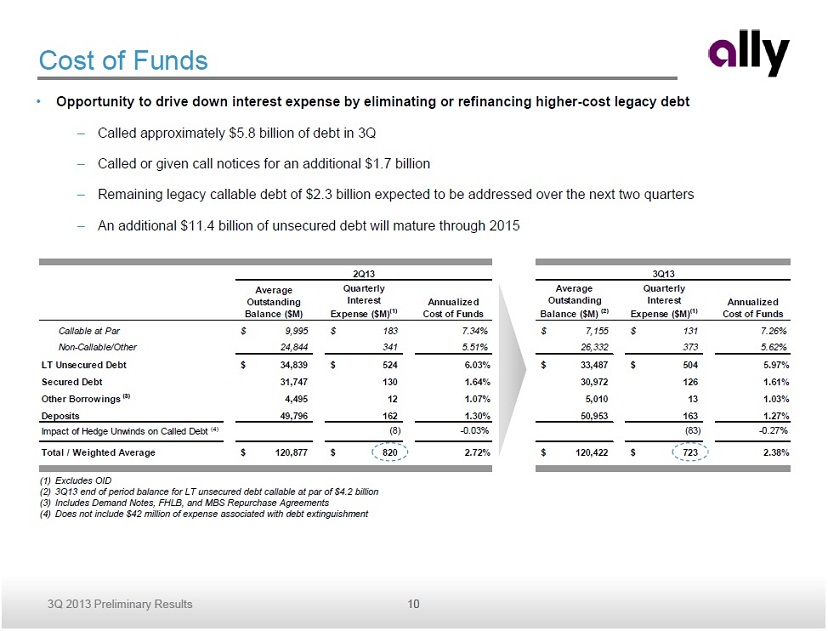
10 3Q 2013 Preliminary Results Average Outstanding Balance ($M) Quarterly Interest Expense ($M) (1) Annualized Cost of Funds Average Outstanding Balance ($M) (2) Quarterly Interest Expense ($M) (1) Annualized Cost of Funds Callable at Par 9,995$ 183$ 7.34% 7,155$ 131$ 7.26% Non-Callable/Other 24,844 341 5.51% 26,332 373 5.62% LT Unsecured Debt 34,839$ 524$ 6.03% 33,487$ 504$ 5.97% Secured Debt 31,747 130 1.64% 30,972 126 1.61% Other Borrowings (3) 4,495 12 1.07% 5,010 13 1.03% Deposits 49,796 162 1.30% 50,953 163 1.27% Impact of Hedge Unwinds on Called Debt (4) (8) -0.03% (83) -0.27% Total / Weighted Average 120,877$ 820$ 2.72% 120,422$ 723$ 2.38% 2Q13 3Q13 Cost of Funds • Opportunity to drive down interest expense by eliminating or refinancing higher - cost legacy debt – Called approximately $5.8 billion of debt in 3Q – Called or given call notices for an additional $1.7 billion – Remaining legacy callable debt of $2.3 billion expected to be addressed over the next two quarters – An additional $11.4 billion of unsecured debt will mature through 2015 (1) Excludes OID (2) 3Q13 end of period balance for LT unsecured debt callable at par of $4.2 billion (3) Includes Demand Notes, FHLB, and MBS Repurchase Agreements (4) Does not include $42 million of expense associated with debt extinguishment

11 3Q 2013 Preliminary Results Ally Financial Liquidity Position ($ billions) $24.0 $22.0 $11.5 $11.5 2Q 13 3Q 13 Parent Co. Liquidity Unsecured Bond Maturities (next 24 months) Ally Financial Consolidated Unsecured Long-Term Debt Maturity Profile ($ billions) $0.9 $5.5 $5.1 $2.3 $2.6 4Q 13 2014 2015 2016 2017 • Proactive liquidity management and proceeds from international sales have generated significant liquidity at the parent company – Absolute levels to decrease as a result of MCP repurchase and liability management transactions – C ontinue to maintain robust coverage of unsecured debt maturities with Time to Required Funding (1) over 24 months • Diversified funding strategy – Deposits now represent over 40% of Ally’s funding profile – Completed nearly $1.4 billion of retail auto and floorplan securitizations at the parent and Ally Bank in 3Q – Issued over $2.1 billion of unsecured debt in 3Q – Renewed over $5.6 billion of secured credit facilities in 3Q • Balanced unsecured debt maturity profile going forward Funding and Liquidity Highlights (1) See slide 27 for definitions (2) See slide 25 for details (2) As of 9/30/13. Total maturities for 2018 and beyond equal $13.9 billion and do not exceed $4 billion in any given year. Includes callable debt at final maturity

12 3Q 2013 Preliminary Results Ally Financial Capital $150 $154 $142 $127 $127 14.6% 14.1% 15.6% 16.5% 16.4% 13.6% 13.1% 14.6% 15.4% 15.4% 7.3% 7.0% 7.9% 8.0% 7.9% 9.3% 3Q 12 4Q 12 1Q 13 2Q 13 3Q 13 Risk-Weighted Assets Total Capital Ratio Tier 1 Ratio Tier 1 Common Ratio Pro Forma Tier 1 Common Ratio Capital • Capital ratios relatively flat QoQ with YoY increase driven largely by international sales • Resubmitted CCAR plan in September – Awaiting regulatory approval • $1 billion common equity raise and MCP repurchase will normalize capital structure – MCP repurchase will save over $ 530 million in annual dividends Tier 1 Common is a non - GAAP financial measure. See page 17 of the Financial Supplement for details (1) 3Q13 Tier 1 Common ratio pro forma for remaining international sales, impacts from MCP repurchase and $1 billion equity raise (1)
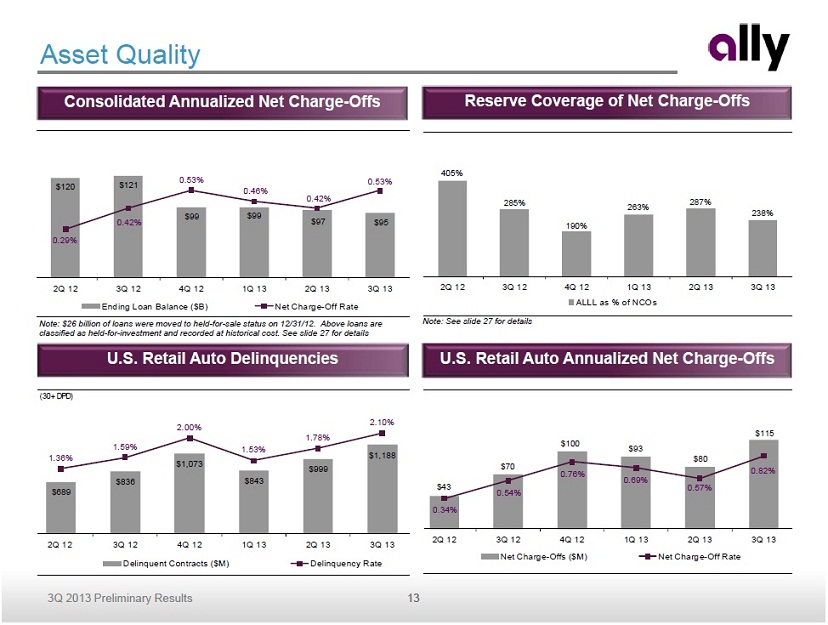
13 3Q 2013 Preliminary Results $120 $121 $99 $99 $97 $95 0.29% 0.42% 0.53% 0.46% 0.42% 0.53% 2Q 12 3Q 12 4Q 12 1Q 13 2Q 13 3Q 13 Ending Loan Balance ($B) Net Charge-Off Rate Consolidated Annualized Net Charge - Offs Reserve C overage of Net Charge - Offs Asset Quality U.S. Retail Auto Annualized Net Charge - Offs U.S. Retail Auto Delinquencies Note: $26 billion of loans were moved to held - for - sale status on 12/31/12. Above loans are classified as held - for - investment and recorded at historical cost. See slide 27 for details Note: See slide 27 for details (30+ DPD) $689 $836 $1,073 $843 $999 $1,188 1.36% 1.59% 2.00% 1.53% 1.78% 2.10% 2Q 12 3Q 12 4Q 12 1Q 13 2Q 13 3Q 13 Delinquent Contracts ($M) Delinquency Rate $43 $70 $100 $93 $80 $115 0.34% 0.54% 0.76% 0.69% 0.57% 0.82% 2Q 12 3Q 12 4Q 12 1Q 13 2Q 13 3Q 13 Net Charge-Offs ($M) Net Charge-Off Rate 405% 285% 190% 263% 287% 238% 2Q 12 3Q 12 4Q 12 1Q 13 2Q 13 3Q 13 ALLL as % of NCOs
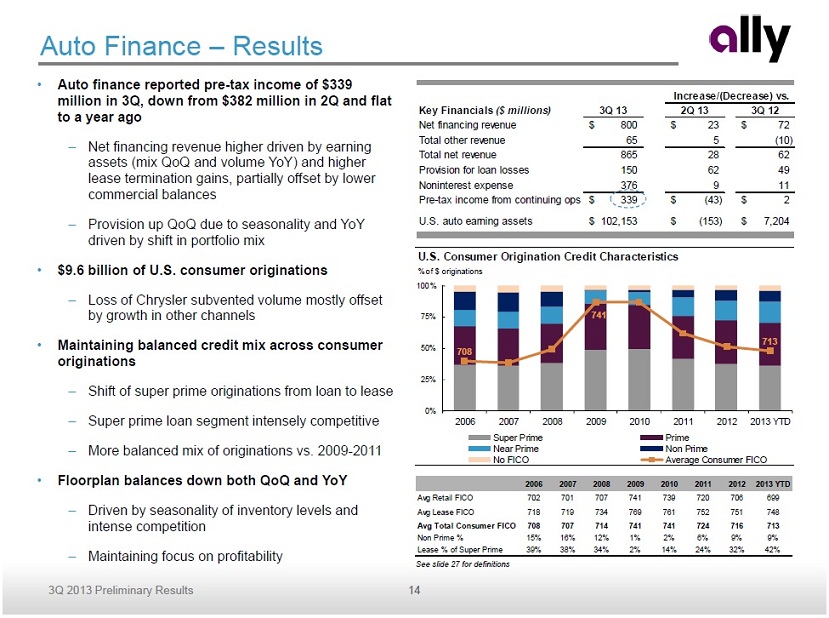
14 3Q 2013 Preliminary Results Key Financials ($ millions) 3Q 13 2Q 13 3Q 12 Net financing revenue 800$ 23$ 72$ Total other revenue 65 5 (10) Total net revenue 865 28 62 Provision for loan losses 150 62 49 Noninterest expense 376 9 11 Pre-tax income from continuing ops 339$ (43)$ 2$ U.S. auto earning assets 102,153$ (153)$ 7,204$ Increase/(Decrease) vs. • Auto finance reported pre - tax income of $339 million in 3Q, down from $382 million in 2Q and flat to a year ago – Net financing revenue higher driven by earning assets (mix QoQ and volume YoY ) and higher lease termination gains, partially offset by lower commercial balances – Provision up QoQ due to seasonality and YoY driven by shift in portfolio mix • $9.6 billion of U.S. consumer originations – Loss of Chrysler subvented volume mostly offset by growth in other channels • Maintaining balanced credit mix across consumer originations – Shift of super prime originations from loan to lease – Super prime loan segment intensely competitive – More balanced mix of originations vs. 2009 - 2011 • Floorplan balances down both QoQ and YoY – D riven by seasonality of inventory levels and intense competition – Maintaining focus on profitability Auto Finance – Results See slide 27 for definitions U.S. Consumer Origination Credit Characteristics % of $ originations 708 741 713 0% 25% 50% 75% 100% 2006 2007 2008 2009 2010 2011 2012 2013 YTD Super Prime Prime Near Prime Non Prime No FICO Average Consumer FICO 2006 2007 2008 2009 2010 2011 2012 2013 YTD Avg Retail FICO 702 701 707 741 739 720 706 699 Avg Lease FICO 718 719 734 769 761 752 751 748 Avg Total Consumer FICO 708 707 714 741 741 724 716 713 Non Prime % 15% 16% 12% 1% 2% 6% 9% 9% Lease % of Super Prime 39% 38% 34% 2% 14% 24% 32% 42%

15 3Q 2013 Preliminary Results ($ billions) $31.8 $30.6 $32.5 $32.0 $30.3 $28.1 2Q 12 3Q 12 4Q 12 1Q 13 2Q 13 3Q 13 ($ billions) $10.5 $9.6 $8.9 $9.7 $9.8 $9.6 2Q 12 3Q 12 4Q 12 1Q 13 2Q 13 3Q 13 Retail - New Retail - Used Lease ($ billions) $73.0 $74.5 $75.3 $76.5 $77.6 $78.2 2Q 12 3Q 12 4Q 12 1Q 13 2Q 13 3Q 13 On Balance Sheet Sold Auto Finance – Key Metrics See slide 27 for definitions U.S. Consumer Serviced Assets U.S. Commercial Assets U.S. Consumer Originations U.S. Origination Mix Note: Asset balances reflect the average daily balance for the quarter (% of $ originations) 14% 14% 11% 29% 26% 26% 6% 6% 6% 27% 28% 30% 24% 25% 27% 2Q 12 3Q 12 4Q 12 1Q 13 2Q 13 3Q 13 New Subvented New Standard New Diversified Lease Used

16 3Q 2013 Preliminary Results Key Financials ($ millions) 3Q 13 2Q 13 3Q 12 Insurance premiums, service revenue earned and other 254$ (9)$ (14)$ Insurance losses and loss adjustment expenses 85 (61) (5) Acquisition and underwriting expenses 141 (8) (3) Total underwriting income 28 60 (6) Investment income and other 55 (22) 76 Pre-tax income from continuing ops 83$ 38$ 70$ Total assets 7,323$ (13)$ (1,138)$ Key Statistics 3Q 13 2Q 13 3Q 12 Insurance ratios Loss ratio 34% 56% 34% Underwriting expense ratio 56% 57% 55% Combined ratio 90% 113% 89% Increase/(Decrease) vs. Dealer Products & Services Written Premiums ($ millions) $262 $222 $235 $260 $267 $236 $233 $276 $267 3Q 11 4Q 11 1Q 12 2Q 12 3Q 12 4Q 12 1Q 13 2Q 13 3Q 13 Insurance • Pre - tax income of $83 million, up from $45 million in 2Q and $13 million a year ago – Lower weather - related losses QoQ driven by seasonality and reinsurance coverage – Investment income down QoQ driven by lower realized gains ▪ Increase YoY driven by a larger other than temporary impairment in the investment portfolio in 3Q12 • Segment continues to post strong written premiums – Written premiums declined QoQ and flat to a year ago ▪ QoQ decline driven by seasonally lower wholesale inventory levels and increased reinsurance usage Note: Excludes Canadian Personal Lines business, which is in runoff
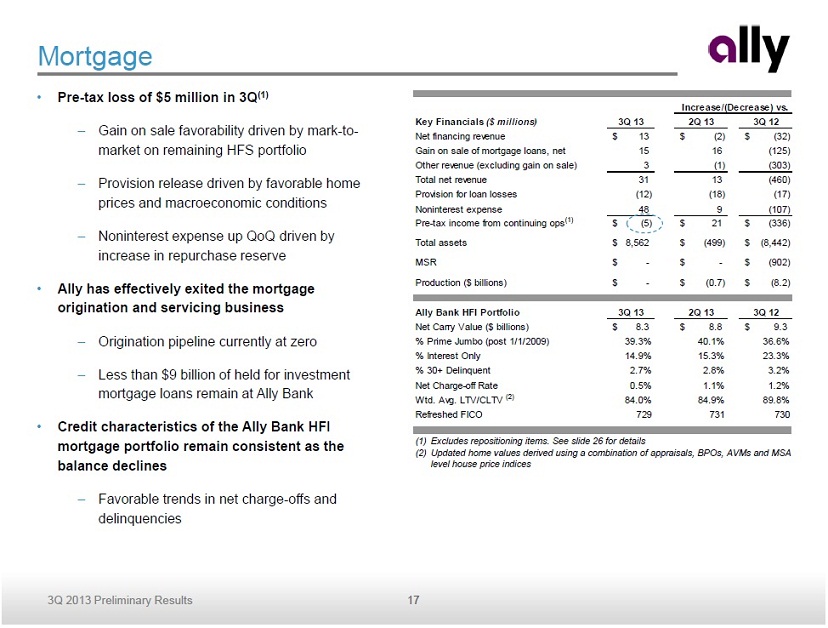
17 3Q 2013 Preliminary Results Key Financials ($ millions) 3Q 13 2Q 13 3Q 12 Net financing revenue 13$ (2)$ (32)$ Gain on sale of mortgage loans, net 15 16 (125) Other revenue (excluding gain on sale) 3 (1) (303) Total net revenue 31 13 (460) Provision for loan losses (12) (18) (17) Noninterest expense 48 9 (107) Pre-tax income from continuing ops (1) (5)$ 21$ (336)$ Total assets 8,562$ (499)$ (8,442)$ MSR -$ -$ (902)$ Production ($ billions) -$ (0.7)$ (8.2)$ Ally Bank HFI Portfolio 3Q 13 2Q 13 3Q 12 Net Carry Value ($ billions) 8.3$ 8.8$ 9.3$ % Prime Jumbo (post 1/1/2009) 39.3% 40.1% 36.6% % Interest Only 14.9% 15.3% 23.3% % 30+ Delinquent 2.7% 2.8% 3.2% Net Charge-off Rate 0.5% 1.1% 1.2% Wtd. Avg. LTV/CLTV (2) 84.0% 84.9% 89.8% Refreshed FICO 729 731 730 Increase/(Decrease) vs. Mortgage • Pre - tax loss of $5 million in 3Q (1) – Gain on sale favorability driven by mark - to - market on remaining HFS portfolio – Provision release driven by favorable home prices and macroeconomic conditions – Noninterest expense up QoQ driven by increase in repurchase reserve • Ally has effectively exited the mortgage origination and servicing business – Origination pipeline currently at zero – Less than $9 billion of held for investment mortgage loans remain at Ally Bank • Credit characteristics of the Ally Bank HFI mortgage portfolio remain consistent as the balance declines – Favorable trends in net charge - offs and delinquencies (1) Excludes repositioning items. See slide 26 for details (2) Updated home values derived using a combination of appraisals, BPOs, AVMs and MSA level house price indices

18 3Q 2013 Preliminary Results Key Financials ($ millions) 3Q 13 2Q 13 3Q 12 Net financing (loss) revenue (ex. OID) (28)$ 90$ 211$ Total other revenue (9) (32) (30) Provision for loan losses 3 8 4 Noninterest expense 105 7 22 Core pre-tax loss (1) (146)$ 43$ 155$ OID amortization expense (2) 64 3 (12) Pre-tax loss from continuing ops (1) (210)$ 39$ 167$ Total assets 26,062$ (683)$ (7,703)$ Increase/(Decrease) vs. Corporate and Other • Net financing loss (ex. OID) declined 88% YoY driven by lower cost of funds – Expect to decline further due to debt calls • Other revenue decline driven by a $42 million charge related to debt extinguishment associated with liability management transactions • OID amortization expense of $64 million in 3Q (1) Excludes repositioning items. See slide 26 for details (2) Primarily bond exchange OID amortization expense used for calculating core pre - tax income As of 9/30/13. Primarily represents bond exchange OID amortization expense used for calculating core pre - tax income Net Financing Loss (ex. OID) ($ millions) ($239) ($169) ($122) ($118) ($28) 3Q 12 4Q 12 1Q 13 2Q 13 3Q 13 Corp & Other Net Financing Loss (ex. OID) OID Amortization Schedule ($ millions) $67 $176 Avg = $52/yr $962 $336 $182 2011 2012 2013 2014 2015 and thereafter Remaining Previous/Current Period $249

19 3Q 2013 Preliminary Results Ally Bank Deposit Levels and Retail Portfolio Interest Expense ($ billions) $32.1 $35.0 $38.8 $39.9 $41.7 $42.0 $45.0 $48.6 $49.4 $51.4 1.36% 1.34% 1.29% 1.24% 1.22% 3Q 12 4Q 12 1Q 13 2Q 13 3Q 13 Ally Bank Retail Ally Bank Brokered Average Retail Portfolio Interest Expense Ally Bank Quarterly Retail Deposit Growth ($ billions) $1.7 $1.4 $1.6 $1.1 $1.7 $2.9 $3.7 $1.1 $1.8 3Q 11 4Q 11 1Q 12 2Q 12 3Q 12 4Q 12 1Q 13 2Q 13 3Q 13 Ally Bank Deposit Franchise • Continued franchise momentum with almost $42 billion of retail deposits across 1.5 million accounts – $1.8 billion of retail deposit growth in 3Q, with balances up 5% QoQ and 30% YoY – 754k primary customers, up 4 % QoQ and 30% YoY • Average retail portfolio interest expense dropped 14 bps YoY • Strong loyalty with existing relationships – CD balance retention over 90% for nine consecutive quarters – Customer satisfaction over 90% for five consecutive quarters • Ally Bank’s value proposition and customer friendly approach continues to resonate in the marketplace – Ally Bank named 'Best Online Bank' for 3 rd straight year – MONEY ® Magazine 2011, 2012, 2013 – Recognized by the Ponemon Institute as one of the “Most Trusted Banks” for the second straight year Stable, consistent growth of retail deposits Deposit Growth Momentum
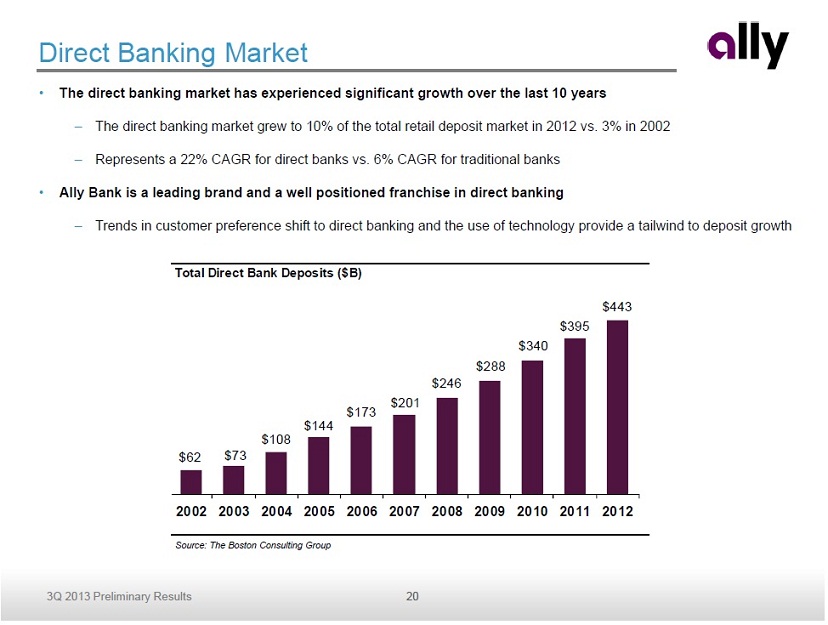
20 3Q 2013 Preliminary Results Direct Banking Market • T he direct banking market has experienced significant growth over the last 10 years – The direct banking market grew to 10% of the total retail deposit market in 2012 vs. 3% in 2002 – Represents a 22% CAGR for direct banks vs. 6% CAGR for traditional banks • Ally Bank is a leading brand and a well positioned franchise in direct banking – Trends in customer preference shift to direct banking and the use of technology provide a tailwind to deposit growth Source: The Boston Consulting Group Total Direct Bank Deposits ($B) $62 $73 $108 $144 $173 $201 $246 $288 $340 $395 $443 2002 2003 2004 2005 2006 2007 2008 2009 2010 2011 2012

21 3Q 2013 Preliminary Results Conclusion • Positive core business trends continue – Solid auto finance performance and steady deposit growth • Strategic transformation nearly complete – Streamlined company with significantly improved credit profile – Addressed legacy mortgage issues • Normalizing capital structure – $1 billion common equity raise and MCP repurchase pending CCAR non - objection • Focus on improving profitability – Impact of liability management transactions already visible • Key priority of exiting U.S. Treasury ownership in a timely manner Improving profitability as strategic transformation draws to completion

Supplemental Charts

23 3Q 2013 Preliminary Results International Entities Summary (1) ($ billions) Business Closing Date Assets Tangible Book Value (2) Proceeds (3) Premium to TBV Canada (4) 1Q 2013 12.0$ 3.1$ 4.1$ 0.6$ Europe, Mexico, Colombia and Chile 2Q 2013 12.2 2.5 2.8 0.1 ABA Seguros 2Q 2013 1.0 0.3 0.9 0.4 Brazil (5) Oct. 1, 2013 5.4 0.6 0.7 0.1 China (6) TBD 0.5 0.5 0.9 0.4 Total 31.1$ 7.0$ 9.3$ 1.6$ International Sale Update Supplemental (1) Brazil and China assets and tangible book values are as of 9/30/13 . All other numbers are as of the respective sale dates . (2) Book value on a GAAP basis was approximately $ 7.5 billion, which included approximately $0.5 billion of associated goodwill . TBV as shown as of closing after reduction from dividend payments received. (3) Total proceeds include holdbacks and dividends to Ally and certain of its subsidiaries prior to the date of sale, including: $40 1 million in dividends paid from Ally Credit Canada Limited to Ally Financial, $194 million paid from Ally Credit Mexico to Ally Financial, a fixed $175 million paid from ABA Seguros to Ally Insurance Holdings and a $65 million purchase price holdback from GM Financial for the sale of Europe (ex. France), Mexico, Colombia and Chile. (4) Canada includes Ally Credit Canada Limited and ResMor Trust (includes assets from Auto Finance and Corp/Other segments). (5) Brazil proceeds reflect $611 million received at October 1, 2013 closing and an estimated incremental amount of $ 54 million based on differences between closing balance sheet using 8/31 balances and 9/30 balance sheet. (6) Assets for China JV reflect investment in unconsolidated subsidiary of $ 484 million.

24 3Q 2013 Preliminary Results Impact of Discontinued Operations ($ millions) 3Q 13 2Q 13 3Q 12 Auto Finance (1) 60$ 305$ (65)$ Insurance 5 (289) (8) Mortgage - - 0 Corporate and Other (2) (161) 1,532 (193) Consolidated pre-tax income (96)$ 1,548$ (266)$ Tax expense (10) 606 (48) Consolidated net income (86)$ 941$ (219)$ Increase/(Decrease) vs. Discontinued Operations Supplemental (1) 2Q13 includes losses associated with Goodwill write - downs, OCI and hedge unwinds (2) 3Q13 includes FHFA and FDIC settlement charge. 2Q13 includes ResCap settlement charge

25 3Q 2013 Preliminary Results Liquidity Supplemental (1) Parent company liquidity is defined as our consolidated operations less Ally Bank and the regulated subsidiaries of Ally Insu ran ce’s holding company (2) Includes UST, Agency debt and Agency MBS (3) Includes equal allocation of shared unused capacity totaling $4.1 billion in 2Q13 and $4.0 billion in 3Q12, which was available for us e b y Ally Bank or the Parent. As of 3Q13, the facility was renewed for the exclusive use of the Parent (4) To optimize use of cash and secured facility capacity between entities, Ally Financial lends cash to Ally Bank from time to t ime under an intercompany loan agreement. Amounts outstanding on this loan are repayable to Ally Financial at any time, subject to 5 days notice (5) Represents capacity from certain domestic and foreign forward purchase commitments and committed secured facilities that are gen erally reliant upon the origination of future automotive receivables over the next 3 months Available Liquidity 9/30/2013 6/30/2013 9/30/2012 ($ billions) Parent (1) Ally Bank Parent (1) Ally Bank Parent (1) Ally Bank Cash and Cash Equivalents 3.7$ 2.7$ 4.5$ 3.1$ 9.8$ 7.1$ Highly Liquid Securities (2) 3.2 6.8 2.5 6.7 0.1 5.4 Current Committed Unused Capacity (3) 13.4 1.8 12.3 3.9 10.7 6.7 Subtotal 20.3$ 11.3$ 19.3$ 13.7$ 20.6$ 19.2$ Ally Bank Intercompany Loan (4) 0.9 (0.9) 3.4 (3.4) 3.4 (3.4) SubtotalTotal Current Available Liquidity 21.2$ 10.4$ 22.7$ 10.3$ 24.0$ 15.8$ Forward Committed Unused Capacity (5) 0.8 - 1.3 - 3.1 - Total Available Liquidity 22.0$ 10.4$ 24.0$ 10.3$ 27.1$ 15.8$
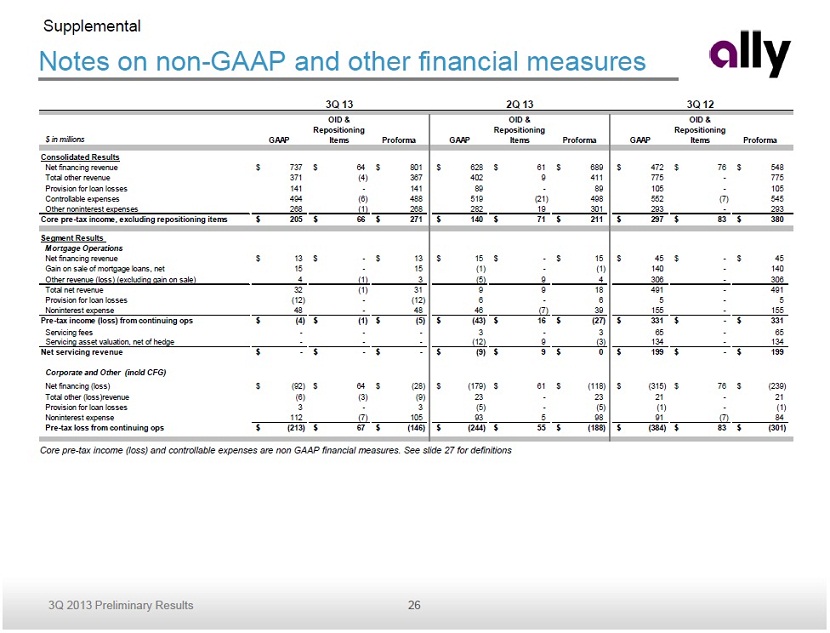
26 3Q 2013 Preliminary Results Notes on non - GAAP and other financial measures Supplemental Core pre - tax income (loss) and controllable expenses are non GAAP financial measures. See slide 27 for definitions $ in millions GAAP OID & Repositioning Items Proforma GAAP OID & Repositioning Items Proforma GAAP OID & Repositioning Items Proforma Consolidated Results Net financing revenue 737$ 64$ 801$ 628$ 61$ 689$ 472$ 76$ 548$ Total other revenue 371 (4) 367 402 9 411 775 - 775 Provision for loan losses 141 - 141 89 - 89 105 - 105 Controllable expenses 494 (6) 488 519 (21) 498 552 (7) 545 Other noninterest expenses 268 (1) 268 282 19 301 293 - 293 Core pre-tax income, excluding repositioning items 205$ 66$ 271$ 140$ 71$ 211$ 297$ 83$ 380$ Segment Results Mortgage Operations Net financing revenue 13$ -$ 13$ 15$ -$ 15$ 45$ -$ 45$ Gain on sale of mortgage loans, net 15 - 15 (1) - (1) 140 - 140 Other revenue (loss) (excluding gain on sale) 4 (1) 3 (5) 9 4 306 - 306 Total net revenue 32 (1) 31 9 9 18 491 - 491 Provision for loan losses (12) - (12) 6 - 6 5 - 5 Noninterest expense 48 - 48 46 (7) 39 155 - 155 Pre-tax income (loss) from continuing ops (4)$ (1)$ (5)$ (43)$ 16$ (27)$ 331$ -$ 331$ Servicing fees - - - 3 - 3 65 - 65 Servicing asset valuation, net of hedge - - - (12) 9 (3) 134 - 134 Net servicing revenue -$ -$ -$ (9)$ 9$ 0$ 199$ -$ 199$ Corporate and Other (incld CFG) Net financing (loss) (92)$ 64$ (28)$ (179)$ 61$ (118)$ (315)$ 76$ (239)$ Total other (loss)revenue (6) (3) (9) 23 - 23 21 - 21 Provision for loan losses 3 - 3 (5) - (5) (1) - (1) Noninterest expense 112 (7) 105 93 5 98 91 (7) 84 Pre-tax loss from continuing ops (213)$ 67$ (146)$ (244)$ 55$ (188)$ (384)$ 83$ (301)$ 3Q 13 2Q 13 3Q 12

27 3Q 2013 Preliminary Results Notes on non - GAAP and other financial measures Supplemental 1) Core pre - tax income (loss) is a non - GAAP financial measure. It is defined as income (loss) from continuing operations before taxes and primarily bond exchange original issue discount ("OID") amortization expense . 2) Repositioning items for 3Q13 are primarily related to exiting non - strategic mortgage activities. 3) Repositioning items for 2Q13 are primarily related to final closing costs for Ally Bank’s MSR sales, which were partially off - set by the reversal of a mortga ge related liability accrual. 4) Time to Required Funding (“TRF”) is a liquidity risk measure expressed as the number of months that Ally Financial can meet its ongoing liquidity needs as they arise without issuing unsecured debt. The TRF metric assumes that auto asset growth projections remain unchanged and tha t t he auto ABS markets remain open. 5) Corporate and Other primarily consists of Ally’s centralized treasury activities, the residual impacts of the company’s corporate funds transfer pri cing and asset liability management activities, and the amortization of the discount associated with new debt issuances and bond excha nge s. Corporate and Other also includes the Commercial Finance business, certain equity investments and reclassifications, eliminations between the reportab le operating segments, and overhead previously allocated to operations that have since been sold or discontinued. 6) Controllable expenses include employee related costs, consulting and legal fees, marketing, information technology, facility, portfolio servicing a nd restructuring expenses. 7) Net interest margin (“NIM”) and cost of funds (“COF”) exclude OID amortization expense. 8) U.S. consumer auto originations ▪ New Subvented – subvented rate new vehicle loans from GM and Chrysler dealers ▪ New Standard – standard rate new vehicle loans from GM and Chrysler dealers ▪ New Diversified – new vehicle loans from non - GM/Chrysler dealers ▪ Lease – new vehicle lease originations from all dealers ▪ Used – used vehicle loans from all dealers ▪ Super Prime – FICO score of 740 or greater ▪ Prime – FICO score of 660 - 739 ▪ Near Prime – FICO score of 620 - 659 ▪ Non Prime – FICO score of less than 620 ▪ No FICO – Primarily Commercial Services Group originations where Dun & Bradstreet scores used 9) Net charge - off ratios are calculated as annualized net charge - offs divided by average outstanding finance receivables and loans excluding loans measur ed at fair value and loans held - for - sale. 10) Allowance coverage ratios are based on the allowance for loan losses related to loans held - for - investment excluding those loans held at fair value as a percentage of the unpaid principal balance, net of premiums and discounts .