Exhibit 99.2
Ally Financial Inc. 4 Q Earnings Review Contact Ally Investor Relations at (866) 710 - 4623 or investor.relations@ally.com February 6, 2014
2 4Q 2013 Preliminary Results Forward - Looking Statements and Additional Information The following should be read in conjunction with the financial statements, notes and other information contained in the Compa ny’ s Annual Reports on Form 10 - K, Quarterly Reports on Form 10 - Q, and Current Reports on Form 8 - K . This information is preliminary and based on company data available at the time of the presentation In the presentation that follows and related comments by Ally Financial Inc. (“Ally”) management, the use of the words “expec t,” “anticipate,” “estimate,” “forecast,” “initiative,” “objective,” “plan,” “goal,” “project,” “outlook,” “priorities,” “target,” “explore,” “ pos itions,” “intend,” “evaluate,” “pursue,” “seek,” “may,” “would, ” “could, ” “should, ” “believe, ” “potential, ” “continue,” or the negative of these words, or similar expressions is intended to identify forward - looking statements. All statements herein and in related management comments, other than statements of historical fact, including without limitation, statements about future events and financial performance, are forward - looking statements tha t involve certain risks and uncertainties. While these statements represent our current judgment on what the future may hold, and we believe th ese judgments are reasonable, these statements are not guarantees of any events or financial results, and Ally’s actual results may differ mate ria lly due to numerous important factors that are described in the most recent reports on SEC Forms 10 - K and 10 - Q for Ally, each of which may be revise d or supplemented in subsequent reports filed with the SEC. Such factors include, among others, the following: maintaining the mut ual ly beneficial relationship between Ally and General Motors (“GM”), and Ally and Chrysler Group LLC (“Chrysler”); the profitability and fina nci al condition of GM and Chrysler; our ability to realize the anticipated benefits associated with being a financial holding company, and the sign ifi cant regulation and restrictions that we are now subject to; the potential for deterioration in the residual value of off - lease vehicles; disruption s in the market in which we fund our operations, with resulting negative impact on our liquidity; changes in our accounting assumptions that may requi re or that result from changes in the accounting rules or their application, which could result in an impact on earnings; changes in the credit rati ngs of Ally, Chrysler, or GM; changes in economic conditions, currency exchange rates or political stability in the markets in which we operate; and ch ang es in the existing or the adoption of new laws, regulations, policies or other activities of governments, agencies and similar organizations (in clu ding as a result of the Dodd - Frank Act and Basel III). Investors are cautioned not to place undue reliance on forward - looking statements. Ally undertakes no obligation to update publi cly or otherwise revise any forward - looking statements, whether as a result of new information, future events or other such factors that affect t he subject of these statements, except where expressly required by law. Reconciliation of non - GAAP financial measures included within this presentat ion are provided in this presentation. Use of the term “loans” describes products associated with direct and indirect lending activities of Ally’s operations. The s pec ific products include retail installment sales contracts, lines of credit, leases or other financing products. The term “originate” refers to Ally’ s p urchase, acquisition or direct origination of various “loan” products.
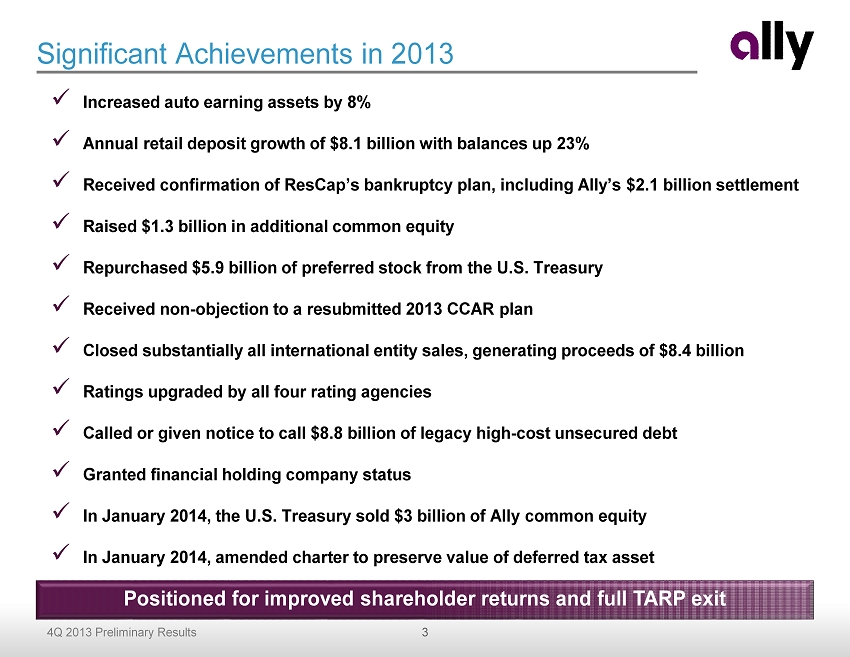
3 4Q 2013 Preliminary Results Significant Achievements in 2013 x Increased auto earning assets by 8% x Annual retail deposit growth of $8.1 billion with balances up 23% x Received confirmation of ResCap’s bankruptcy plan, including Ally’s $2.1 billion settlement x Raised $1.3 billion in additional common equity x Repurchased $5.9 billion of preferred stock from the U.S. Treasury x Received non - objection to a resubmitted 2013 CCAR plan x Closed substantially all international entity sales, generating proceeds of $8.4 billion x Ratings upgraded by all four rating agencies x Called or given notice to call $8.8 billion of legacy high - cost unsecured debt x Granted f inancial holding company status x In January 2014, the U.S. Treasury sold $3 billion of Ally common equity x In January 2014, amended charter to preserve value of deferred tax asset Positioned for improved shareholder returns and full TARP exit
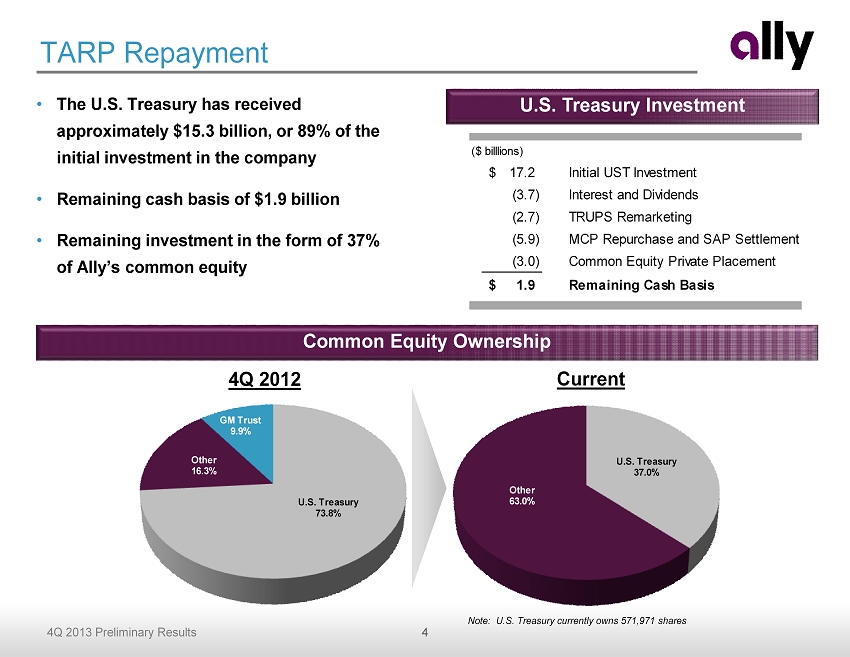
4 4Q 2013 Preliminary Results TARP Repayment • The U.S. Treasury has received approximately $ 15.3 billion, or 89% of the initial investment in the company • Remaining cash basis of $1.9 billion • Remaining investment in the form of 37% of Ally’s common equity Common Equity Ownership U.S. Treasury Investment 4Q 2012 Current Note: U.S. Treasury currently owns 571,971 shares U.S. Treasury 73.8% Other 16.3% GM Trust 9.9% U.S. Treasury 37.0% Other 63.0% ($ billlions) 17.2$ Initial UST Investment (3.7) Interest and Dividends (2.7) TRUPS Remarketing (5.9) MCP Repurchase and SAP Settlement (3.0) Common Equity Private Placement 1.9$ Remaining Cash Basis
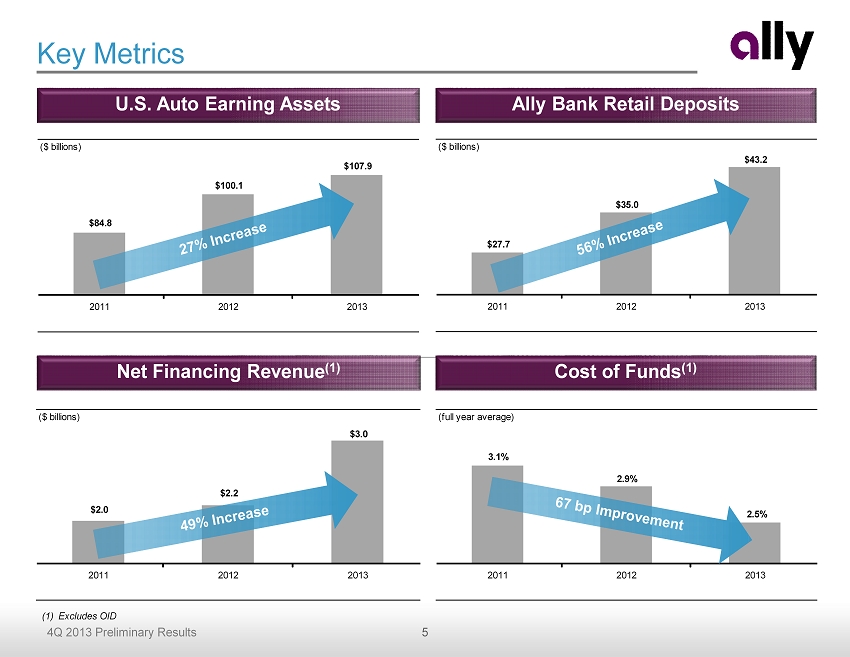
5 4Q 2013 Preliminary Results (full year average) 3.1% 2.9% 2.5% 2011 2012 2013 ($ billions) $2.0 $2.2 $3.0 2011 2012 2013 Key Metrics Net Financing Revenue (1) Cost of Funds (1) U.S. Auto Earning Assets Ally Bank Retail Deposits ($ billions) $27.7 $35.0 $43.2 2011 2012 2013 ($ billions) $84.8 $100.1 $107.9 2011 2012 2013 (1) Excludes OID
6 4Q 2013 Preliminary Results x Pre - eminent domestic a uto f inance f ranchise x Leading direct b ank f ranchise x Legacy mortgage issues have been addressed x Balance sheet consists primarily of low loss auto assets x More stable earnings with significant ROE expansion o pportunities x Strong capital and liquidity x Improved standing with banking regulators x P roven track record of executing plan and strategic objectives Ally Financial Today Winning Combination of Premier Auto Finance Franchise and Leading Direct Bank
7 4Q 2013 Preliminary Results Outlook and Priorities • Auto finance competitive environment continues to be challenging – Leveraging the competitive strengths of our premier auto finance platform – Focused on strong dealer relationships, profitability and asset quality over growth or market share • Continue to grow high - quality and stable deposit base – Ally is a well - positioned, award winning brand – Supported by shift in consumer preference, technology advancement and demographic trends – Opportunities to leverage franchise for future growth opportunities • Targeting double - digit ROE over time – Cost of funds savings already driving NIM expansion – Focus on right - sizing the noninterest expense base in 2014 and 2015 – Longer - term regulatory normalization
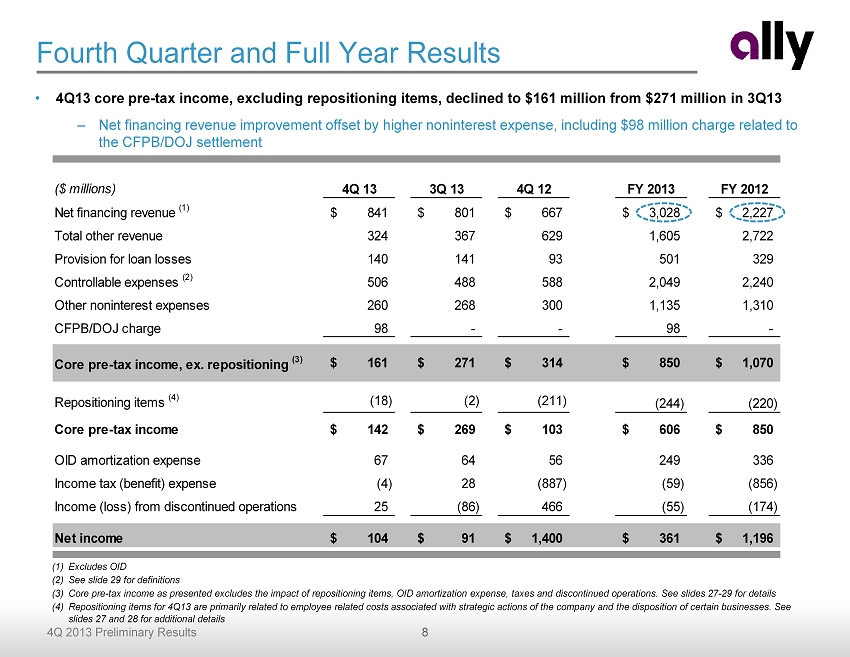
8 4Q 2013 Preliminary Results ($ millions) 4Q 13 3Q 13 4Q 12 FY 2013 FY 2012 Net financing revenue (1) 841$ 801$ 667$ 3,028$ 2,227$ Total other revenue 324 367 629 1,605 2,722 Provision for loan losses 140 141 93 501 329 Controllable expenses (2) 506 488 588 2,049 2,240 Other noninterest expenses 260 268 300 1,135 1,310 CFPB/DOJ charge 98 - - 98 - Core pre-tax income, ex. repositioning (3) 161$ 271$ 314$ 850$ 1,070$ Repositioning items (4) (18) (2) (211) (244) (220) Core pre-tax income 142$ 269$ 103$ 606$ 850$ OID amortization expense 67 64 56 249 336 Income tax (benefit) expense (4) 28 (887) (59) (856) Income (loss) from discontinued operations 25 (86) 466 (55) (174) Net income 104$ 91$ 1,400$ 361$ 1,196$ Fourth Quarter and Full Year Results (1) Excludes OID (2) See slide 29 for definitions (3) Core pre - tax income as presented excludes the impact of repositioning items, OID amortization expense, taxes and discontinued op erations. See slides 27 - 29 for details (4) Repositioning items for 4Q13 are primarily related to employee related costs associated with strategic actions of the company and the disposition of certain businesses. See slides 27 and 28 for additional details • 4Q13 core pre - tax income, excluding repositioning items, declined to $161 million from $271 million in 3Q13 – Net financing revenue improvement offset by higher noninterest expense, including $98 million charge related to the CFPB/DOJ settlement
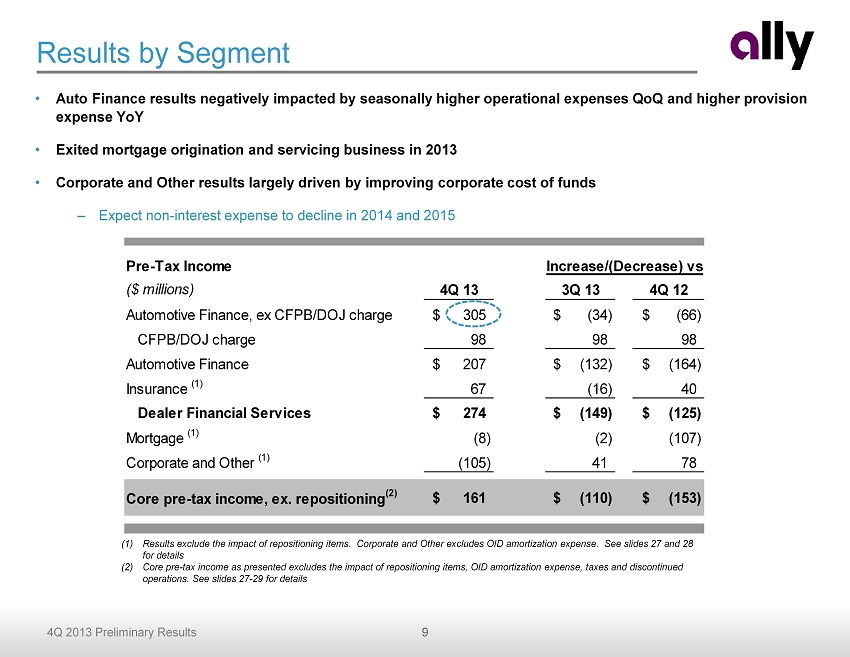
9 4Q 2013 Preliminary Results Pre-Tax Income ($ millions) 4Q 13 3Q 13 4Q 12 Automotive Finance, ex CFPB/DOJ charge 305$ (34)$ (66)$ CFPB/DOJ charge 98 98 98 Automotive Finance 207$ (132)$ (164)$ Insurance (1) 67 (16) 40 Dealer Financial Services 274$ (149)$ (125)$ Mortgage (1) (8) (2) (107) Corporate and Other (1) (105) 41 78 Core pre-tax income, ex. repositioning (2) 161$ (110)$ (153)$ Increase/(Decrease) vs. Results by Segment (1) Results exclude the impact of repositioning items. Corporate and Other excludes OID amortization expense. See slides 27 and 28 for details (2) Core pre - tax income as presented excludes the impact of repositioning items, OID amortization expense, taxes and discontinued operations. See slides 27 - 29 for details • Auto Finance results negatively impacted by seasonally higher operational expenses QoQ and higher provision expense YoY • Exited mortgage origination and servicing business in 2013 • Corporate and Other results largely driven by improving corporate cost of funds – Expect non - interest expense to decline in 2014 and 2015

10 4Q 2013 Preliminary Results Net Interest Margin • Net Interest Margin (“NIM”) improved 5 bps QoQ and 48 bps YoY – Cost of funds declined 17 bps QoQ and 50 bps YoY driven primarily by the redemption of legacy high - cost callable debt and growth in deposits – Earning asset increase driven by higher commercial auto loan balances, which resulted in slightly lower asset yield on average Note: Continuing operations only. See slide 29 for definitions Ally Financial - Net Interest Margin $136 $135 $138 4.52% 4.47% 4.41% 1.91% 2.34% 2.39% 2.71% 2.38% 2.21% 4Q 12 1Q 13 2Q 13 3Q 13 4Q 13 Average Earning Assets ($B) Earning Asset Yield NIM (ex. OID) Cost of Funds (ex. OID)
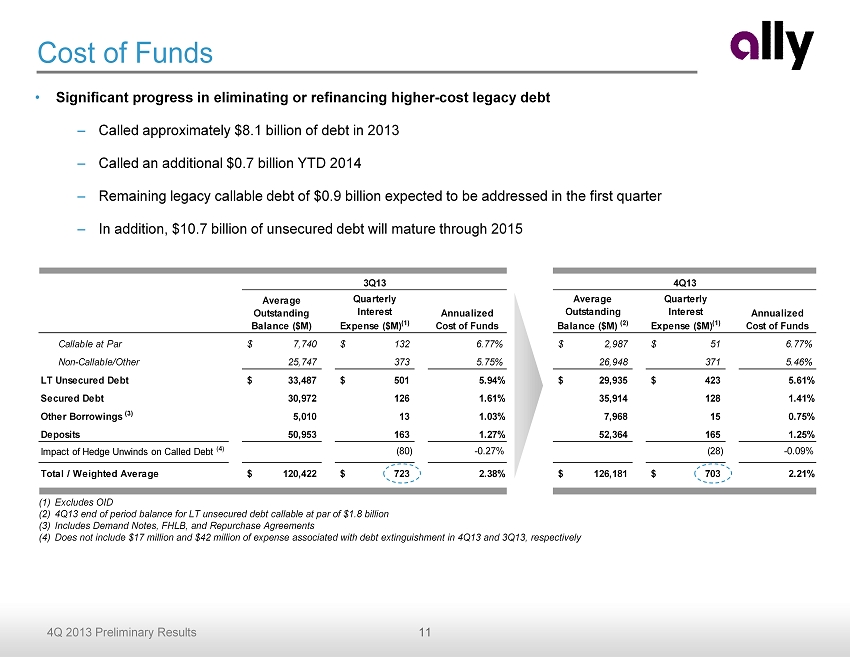
11 4Q 2013 Preliminary Results Average Outstanding Balance ($M) Quarterly Interest Expense ($M) (1) Annualized Cost of Funds Average Outstanding Balance ($M) (2) Quarterly Interest Expense ($M) (1) Annualized Cost of Funds Callable at Par 7,740$ 132$ 6.77% 2,987$ 51$ 6.77% Non-Callable/Other 25,747 373 5.75% 26,948 371 5.46% LT Unsecured Debt 33,487$ 501$ 5.94% 29,935$ 423$ 5.61% Secured Debt 30,972 126 1.61% 35,914 128 1.41% Other Borrowings (3) 5,010 13 1.03% 7,968 15 0.75% Deposits 50,953 163 1.27% 52,364 165 1.25% Impact of Hedge Unwinds on Called Debt (4) (80) -0.27% (28) -0.09% Total / Weighted Average 120,422$ 723$ 2.38% 126,181$ 703$ 2.21% 3Q13 4Q13 Cost of Funds • Significant progress in eliminating or refinancing higher - cost legacy debt – Called approximately $8.1 billion of debt in 2013 – Called an additional $0.7 b illion YTD 2014 – Remaining legacy callable debt of $0.9 billion expected to be addressed in the first quarter – I n addition, $10.7 billion of unsecured debt will mature through 2015 (1) Excludes OID (2) 4 Q13 end of period balance for LT unsecured debt callable at par of $1.8 billion (3) Includes Demand Notes, FHLB, and Repurchase Agreements (4) Does not include $17 million and $42 million of expense associated with debt extinguishment in 4Q13 and 3Q13, respectively
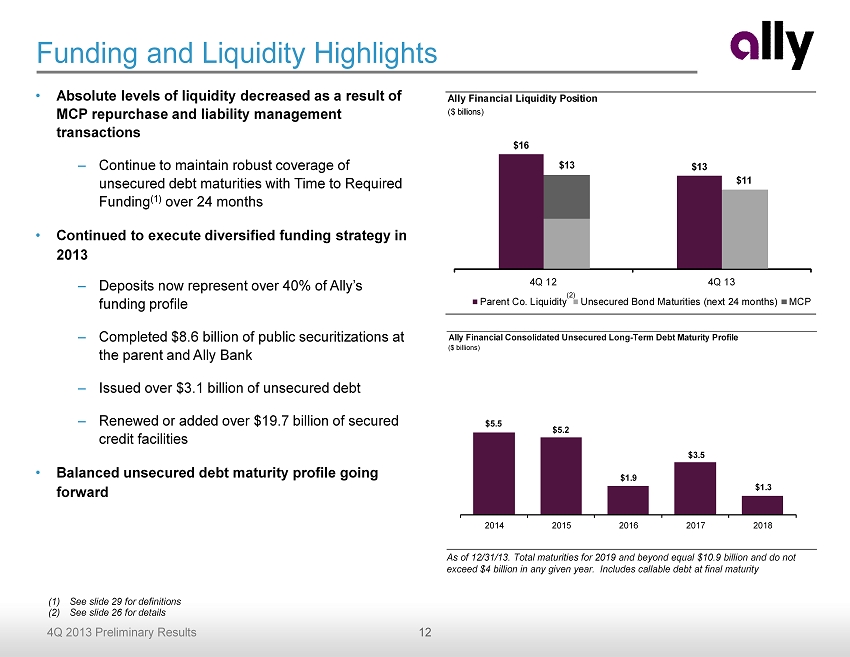
12 4Q 2013 Preliminary Results Ally Financial Liquidity Position ($ billions) $16 $13 4Q 12 4Q 13 $13 $11 Parent Co. Liquidity Unsecured Bond Maturities (next 24 months) MCP • Absolute levels of liquidity decreased as a result of MCP repurchase and liability management transactions – C ontinue to maintain robust coverage of unsecured debt maturities with Time to Required Funding (1) over 24 months • Continued to execute diversified funding strategy in 2013 – Deposits now represent over 40% of Ally’s funding profile – Completed $8.6 billion of public securitizations at the parent and Ally Bank – Issued over $3.1 billion of unsecured debt – Renewed or added over $19.7 billion of secured credit facilities • Balanced unsecured debt maturity profile going forward Funding and Liquidity Highlights (1) See slide 29 for definitions (2) See slide 26 for details (2) As of 12/31/13. Total maturities for 2019 and beyond equal $10.9 billion and do not exceed $4 billion in any given year. Includes callable debt at final maturity Ally Financial Consolidated Unsecured Long-Term Debt Maturity Profile ($ billions) $5.5 $5.2 $1.9 $3.5 $1.3 2014 2015 2016 2017 2018
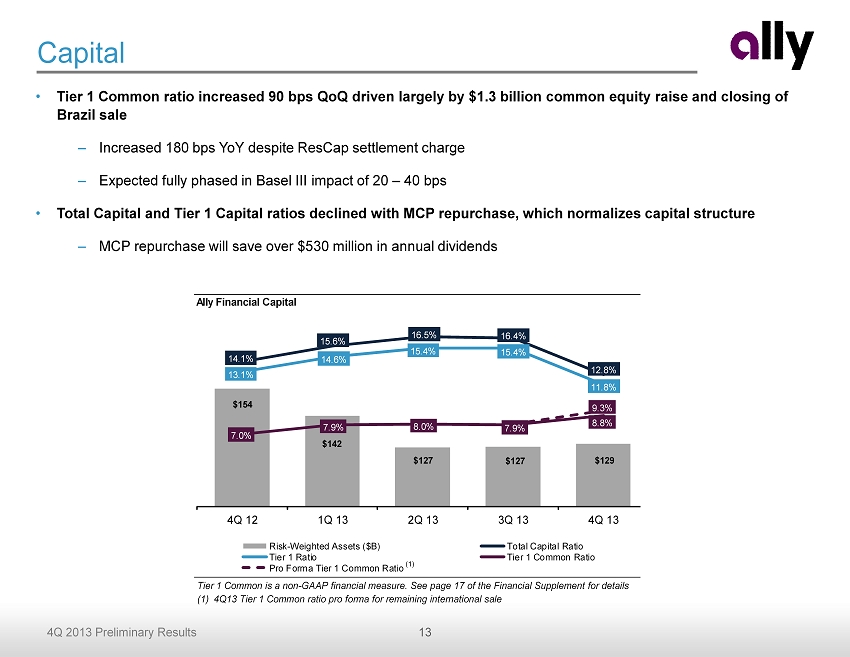
13 4Q 2013 Preliminary Results Ally Financial Capital $154 $142 $127 $127 $129 14.1% 15.6% 16.5% 16.4% 12.8% 13.1% 14.6% 15.4% 15.4% 11.8% 7.0% 7.9% 8.0% 7.9% 8.8% 9.3% 4Q 12 1Q 13 2Q 13 3Q 13 4Q 13 Risk-Weighted Assets ($B) Total Capital Ratio Tier 1 Ratio Tier 1 Common Ratio Pro Forma Tier 1 Common Ratio Capital • Tier 1 Common ratio increased 90 bps QoQ driven largely by $1.3 billion common equity raise and closing of Brazil sale – Increased 180 bps YoY despite ResCap settlement charge – Expected fully phased in Basel III impact of 20 – 40 bps • Total Capital and Tier 1 Capital ratios declined with MCP repurchase, which normalizes capital structure – MCP repurchase will save over $ 530 million in annual dividends Tier 1 Common is a non - GAAP financial measure. See page 17 of the Financial Supplement for details (1) 4 Q13 Tier 1 Common ratio pro forma for remaining international sale (1)
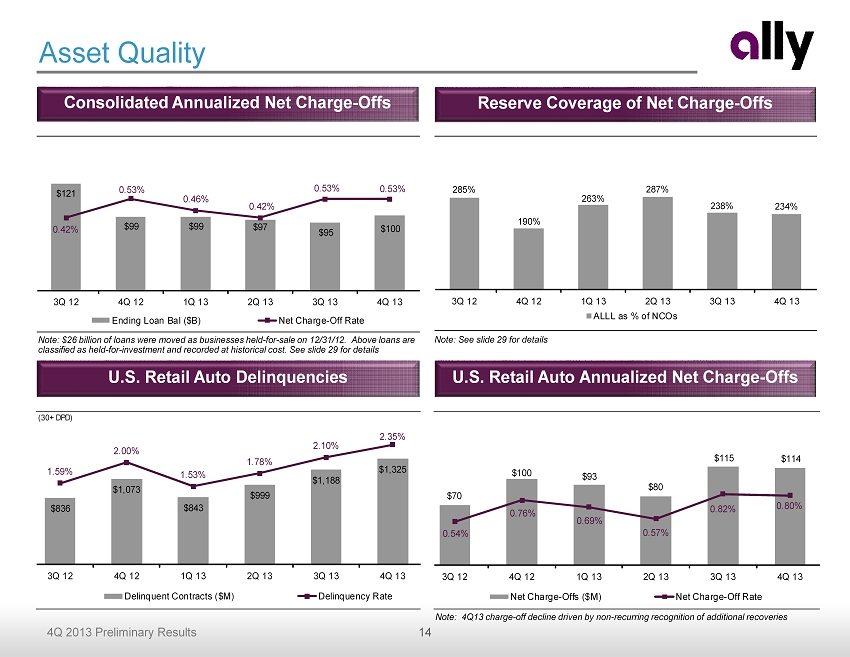
14 4Q 2013 Preliminary Results Consolidated Annualized Net Charge - Offs Reserve C overage of Net Charge - Offs Asset Quality U.S. Retail Auto Annualized Net Charge - Offs U.S. Retail Auto Delinquencies Note: $26 billion of loans were moved as businesses held - for - sale on 12/31/12. Above loans are classified as held - for - investment and recorded at historical cost. See slide 29 for details Note: See slide 29 for details (30+ DPD) $836 $1,073 $843 $999 $1,188 $1,325 1.59% 2.00% 1.53% 1.78% 2.10% 2.35% 3Q 12 4Q 12 1Q 13 2Q 13 3Q 13 4Q 13 Delinquent Contracts ($M) Delinquency Rate $70 $100 $93 $80 $115 $114 0.54% 0.76% 0.69% 0.57% 0.82% 0.80% 3Q 12 4Q 12 1Q 13 2Q 13 3Q 13 4Q 13 Net Charge-Offs ($M) Net Charge-Off Rate $121 $99 $99 $97 $95 $100 0.42% 0.53% 0.46% 0.42% 0.53% 0.53% 3Q 12 4Q 12 1Q 13 2Q 13 3Q 13 4Q 13 Ending Loan Bal ($B) Net Charge-Off Rate 285% 190% 263% 287% 238% 234% 3Q 12 4Q 12 1Q 13 2Q 13 3Q 13 4Q 13 ALLL as % of NCOs Note: 4Q13 charge - off decline driven by non - recurring recognition of additional recoveries
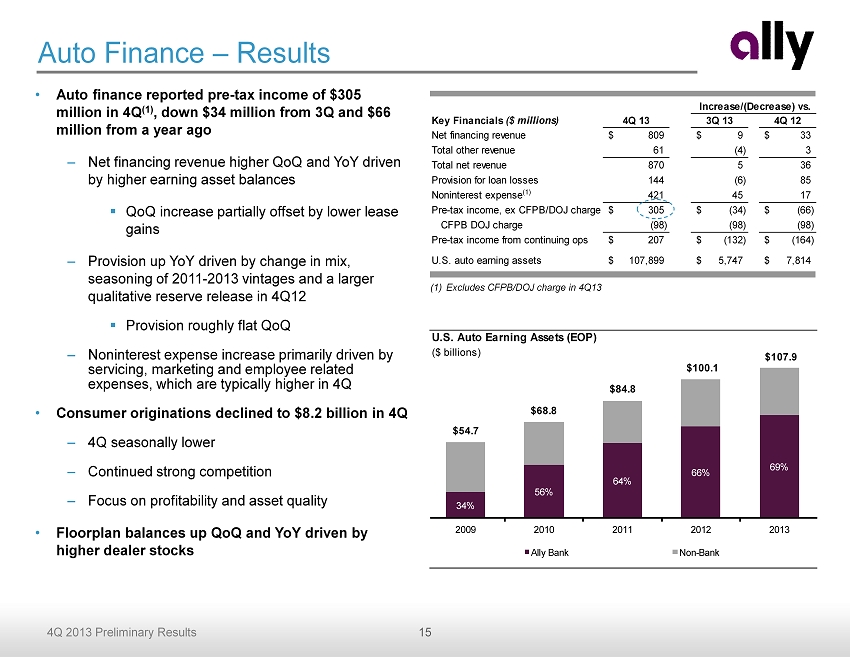
15 4Q 2013 Preliminary Results Key Financials ($ millions) 4Q 13 3Q 13 4Q 12 Net financing revenue 809$ 9$ 33$ Total other revenue 61 (4) 3 Total net revenue 870 5 36 Provision for loan losses 144 (6) 85 Noninterest expense (1) 421 45 17 Pre-tax income, ex CFPB/DOJ charge 305$ (34)$ (66)$ CFPB DOJ charge (98) (98) (98) Pre-tax income from continuing ops 207$ (132)$ (164)$ U.S. auto earning assets 107,899$ 5,747$ 7,814$ Increase/(Decrease) vs. • Auto finance reported pre - tax income of $305 million in 4Q (1) , down $34 million from 3Q and $66 million from a year ago – Net financing revenue higher QoQ and YoY driven by higher earning asset balances ▪ QoQ increase partially offset by lower lease gains – Provision up YoY driven by change in mix, seasoning of 2011 - 2013 vintages and a larger qualitative reserve release in 4Q12 ▪ Provision roughly flat QoQ – Noninterest expense increase primarily driven by servicing, marketing and employee related expenses, which are typically higher in 4Q • Consumer originations declined to $8.2 billion in 4Q – 4Q seasonally lower – Continued strong competition – Focus on profitability and asset quality • Floorplan balances up QoQ and YoY driven by higher dealer stocks Auto Finance – Results U.S. Auto Earning Assets (EOP) ($ billions) 34% 56% 64% 66% 69% 2009 2010 2011 2012 2013 Ally Bank Non-Bank $107.9 $100.1 $84.8 $68.8 $54.7 (1) Excludes CFPB/DOJ charge in 4Q13
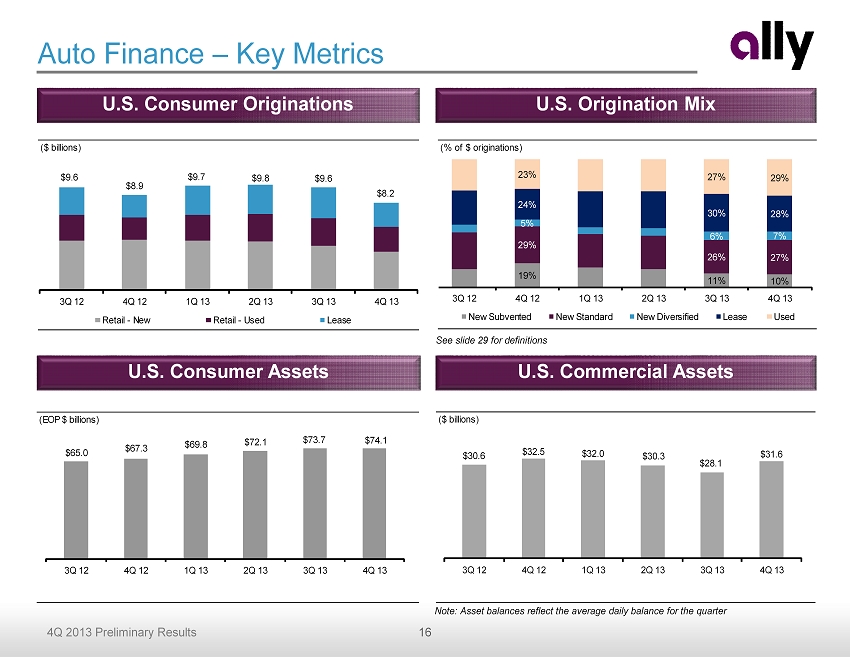
16 4Q 2013 Preliminary Results Auto Finance – Key Metrics See slide 29 for definitions U.S. Consumer Assets U.S. Commercial Assets U.S. Consumer Originations U.S. Origination Mix Note: Asset balances reflect the average daily balance for the quarter (% of $ originations) 19% 11% 10% 29% 26% 27% 5% 6% 7% 24% 30% 28% 23% 27% 29% 3Q 12 4Q 12 1Q 13 2Q 13 3Q 13 4Q 13 New Subvented New Standard New Diversified Lease Used ($ billions) $9.6 $8.9 $9.7 $9.8 $9.6 $8.2 3Q 12 4Q 12 1Q 13 2Q 13 3Q 13 4Q 13 Retail - New Retail - Used Lease (EOP $ billions) $65.0 $67.3 $69.8 $72.1 $73.7 $74.1 3Q 12 4Q 12 1Q 13 2Q 13 3Q 13 4Q 13 ($ billions) $30.6 $32.5 $32.0 $30.3 $28.1 $31.6 3Q 12 4Q 12 1Q 13 2Q 13 3Q 13 4Q 13

17 4Q 2013 Preliminary Results Key Financials ($ millions) 4Q 13 3Q 13 4Q 12 Insurance premiums, service revenue earned and other 247$ (7)$ (20)$ Insurance losses and loss adjustment expenses 59 (26) (58) Acquisition and underwriting expenses (1) 158 17 1 Total underwriting income 30 2 37 Investment income and other 37 (18) 3 Pre-tax income from continuing ops (1) 67$ (16)$ 40$ Total assets 7,124$ (199)$ (1,315)$ Key Statistics 4Q 13 3Q 13 4Q 12 Insurance ratios Loss ratio 24% 34% 45% Underwriting expense ratio (1) 64% 56% 59% Combined ratio 88% 90% 104% Increase/(Decrease) vs. Dealer Products & Services Written Premiums ($ millions) $222 $235 $260 $267 $236 $233 $276 $267 $225 4Q 11 1Q 12 2Q 12 3Q 12 4Q 12 1Q 13 2Q 13 3Q 13 4Q 13 Insurance • Pre - tax income of $67 million (1) , down $16 million from 3Q and up $40 million from a year ago – Weather - related losses down both QoQ and YoY ▪ 4Q12 losses impacted by Superstorm Sandy – Investment income lower QoQ driven by lower realized gains • Segment continues to post strong written premiums, but down both QoQ and YoY – 4Q seasonally lower – Lower premiums written on vehicle s ervice c ontracts driven by lower loan origination volumes and increased reinsurance usage Note: Excludes Canadian Personal Lines business, which is in runoff (1) Excludes repositioning items in 4Q13. See slides 27 and 28 for details
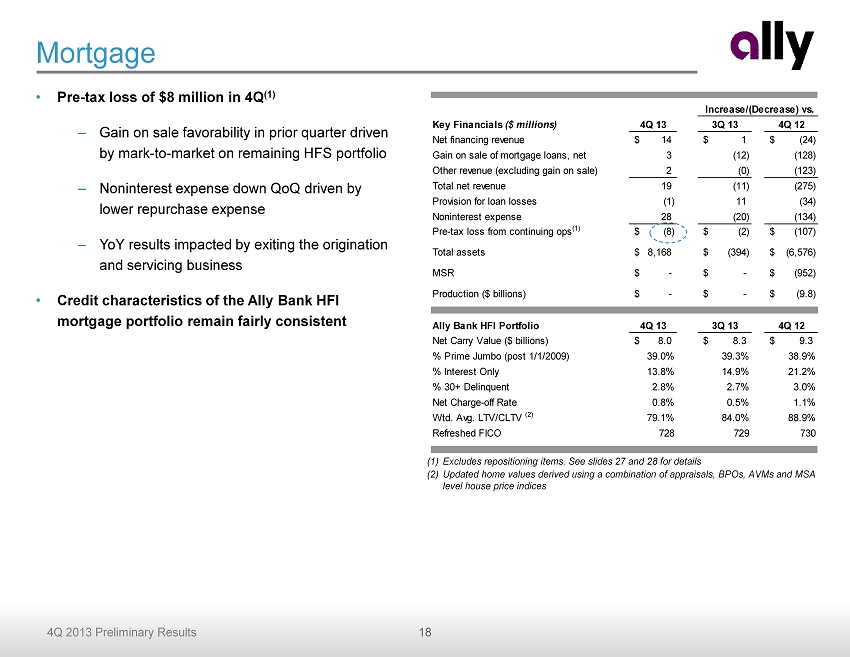
18 4Q 2013 Preliminary Results Key Financials ($ millions) 4Q 13 3Q 13 4Q 12 Net financing revenue 14$ 1$ (24)$ Gain on sale of mortgage loans, net 3 (12) (128) Other revenue (excluding gain on sale) 2 (0) (123) Total net revenue 19 (11) (275) Provision for loan losses (1) 11 (34) Noninterest expense 28 (20) (134) Pre-tax loss from continuing ops (1) (8)$ (2)$ (107)$ Total assets 8,168$ (394)$ (6,576)$ MSR -$ -$ (952)$ Production ($ billions) -$ -$ (9.8)$ Ally Bank HFI Portfolio 4Q 13 3Q 13 4Q 12 Net Carry Value ($ billions) 8.0$ 8.3$ 9.3$ % Prime Jumbo (post 1/1/2009) 39.0% 39.3% 38.9% % Interest Only 13.8% 14.9% 21.2% % 30+ Delinquent 2.8% 2.7% 3.0% Net Charge-off Rate 0.8% 0.5% 1.1% Wtd. Avg. LTV/CLTV (2) 79.1% 84.0% 88.9% Refreshed FICO 728 729 730 Increase/(Decrease) vs. Mortgage • Pre - tax loss of $8 million in 4Q (1) – Gain on sale favorability in prior quarter driven by mark - to - market on remaining HFS portfolio – Noninterest expense down QoQ driven by lower repurchase expense – YoY results impacted by exiting the origination and servicing business • Credit characteristics of the Ally Bank HFI mortgage portfolio remain fairly consistent (1) Excludes repositioning items. See slides 27 and 28 for details (2) Updated home values derived using a combination of appraisals, BPOs, AVMs and MSA level house price indices
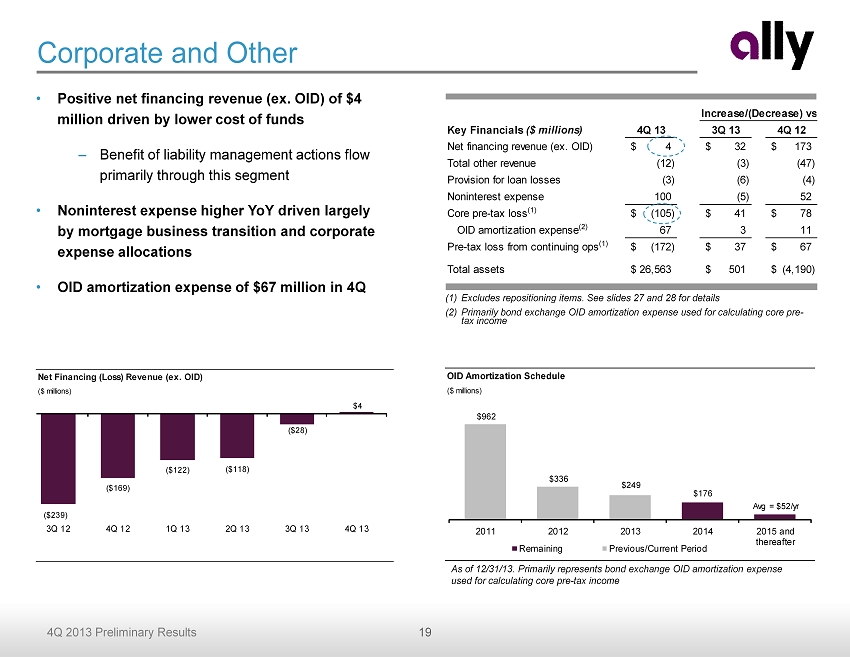
19 4Q 2013 Preliminary Results Key Financials ($ millions) 4Q 13 3Q 13 4Q 12 Net financing revenue (ex. OID) 4$ 32$ 173$ Total other revenue (12) (3) (47) Provision for loan losses (3) (6) (4) Noninterest expense 100 (5) 52 Core pre-tax loss (1) (105)$ 41$ 78$ OID amortization expense (2) 67 3 11 Pre-tax loss from continuing ops (1) (172)$ 37$ 67$ Total assets 26,563$ 501$ (4,190)$ Increase/(Decrease) vs. Corporate and Other • Positive net financing revenue (ex. OID) of $4 million driven by lower cost of funds – Benefit of liability management actions flow primarily through this segment • Noninterest expense higher YoY driven largely by mortgage business transition and corporate expense allocations • OID amortization expense of $67 million in 4 Q (1) Excludes repositioning items. See slides 27 and 28 for details (2) Primarily bond exchange OID amortization expense used for calculating core pre - tax income As of 12/31/13. Primarily represents bond exchange OID amortization expense used for calculating core pre - tax income OID Amortization Schedule ($ millions) $176 Avg = $52/yr $962 $336 $249 2011 2012 2013 2014 2015 and thereafter Remaining Previous/Current Period Net Financing (Loss) Revenue (ex. OID) ($ millions) ($239) ($169) ($122) ($118) ($28) $4 3Q 12 4Q 12 1Q 13 2Q 13 3Q 13 4Q 13
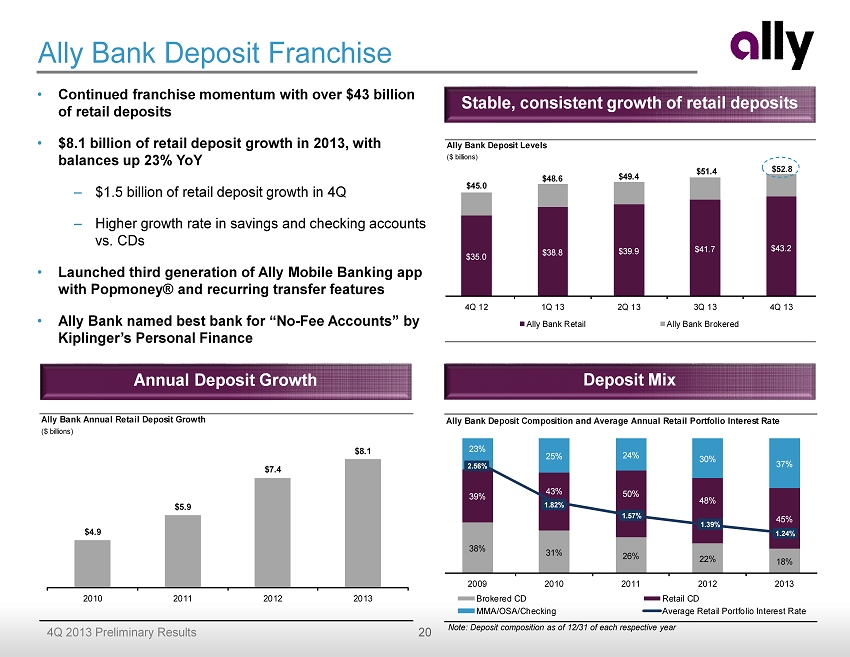
20 4Q 2013 Preliminary Results Ally Bank Deposit Levels ($ billions) $35.0 $38.8 $39.9 $41.7 $43.2 $45.0 $48.6 $49.4 $51.4 $52.8 4Q 12 1Q 13 2Q 13 3Q 13 4Q 13 Ally Bank Retail Ally Bank Brokered Ally Bank Deposit Franchise • Continued franchise momentum with over $43 billion of retail deposits • $8.1 billion of retail deposit growth in 2013, with balances up 23% YoY – $1.5 billion of retail deposit growth in 4Q – Higher growth rate in savings and checking accounts vs. CDs • Launched third g eneration of Ally Mobile Banking app with Popmoney ® and recurring t ransfer f eatures • Ally Bank named b est b ank for “No - Fee Accounts” by Kiplinger’s Personal Finance Stable, consistent growth of retail deposits Deposit Mix Annual Deposit Growth Note: Deposit composition as of 12/31 of each respective year Ally Bank Annual Retail Deposit Growth ($ billions) $4.9 $5.9 $7.4 $8.1 2010 2011 2012 2013 Ally Bank Deposit Composition and Average Annual Retail Portfolio Interest Rate 38% 31% 26% 22% 18% 39% 43% 50% 48% 45% 23% 25% 24% 30% 37% 2.56% 1.82% 1.57% 1.39% 1.24% 2009 2010 2011 2012 2013 Brokered CD Retail CD MMA/OSA/Checking Average Retail Portfolio Interest Rate
21 4Q 2013 Preliminary Results Summary • Ally’s multi - year strategic transformation is complete and the company is now focused on the following priorities : – Exit TARP – Achieve double digit ROE ▪ Drive margin expansion through lower cost of funds ▪ Reduce noninterest expense by streamlining cost structure ▪ Normalize regulatory impacts over time – Maximize the opportunities offered by our leading auto finance and direct banking franchises – Move from defense to offense
Supplemental Charts
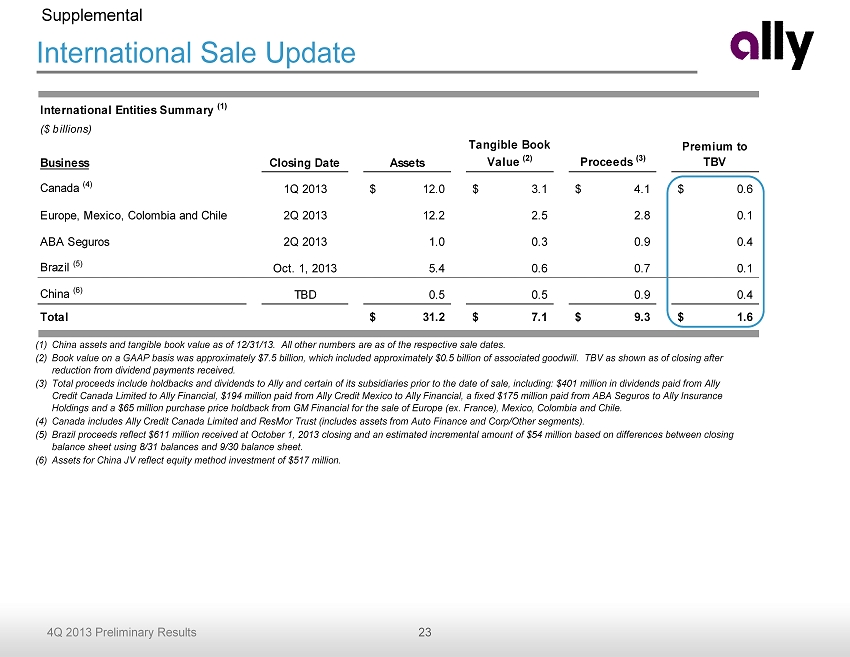
23 4Q 2013 Preliminary Results International Sale Update Supplemental (1) China assets and tangible book value as of 12/31/13 . All other numbers are as of the respective sale dates . (2) Book value on a GAAP basis was approximately $ 7.5 billion, which included approximately $0.5 billion of associated goodwill . TBV as shown as of closing after reduction from dividend payments received. (3) Total proceeds include holdbacks and dividends to Ally and certain of its subsidiaries prior to the date of sale, including: $40 1 million in dividends paid from Ally Credit Canada Limited to Ally Financial, $194 million paid from Ally Credit Mexico to Ally Financial, a fixed $175 million paid from ABA Seguros to Ally Insurance Holdings and a $65 million purchase price holdback from GM Financial for the sale of Europe (ex. France), Mexico, Colombia and Chile. (4) Canada includes Ally Credit Canada Limited and ResMor Trust (includes assets from Auto Finance and Corp/Other segments). (5) Brazil proceeds reflect $611 million received at October 1, 2013 closing and an estimated incremental amount of $ 54 million based on differences between closing balance sheet using 8/31 balances and 9/30 balance sheet. (6) Assets for China JV reflect equity method investment of $517 million . International Entities Summary (1) ($ billions) Business Closing Date Assets Tangible Book Value (2) Proceeds (3) Premium to TBV Canada (4) 1Q 2013 12.0$ 3.1$ 4.1$ 0.6$ Europe, Mexico, Colombia and Chile 2Q 2013 12.2 2.5 2.8 0.1 ABA Seguros 2Q 2013 1.0 0.3 0.9 0.4 Brazil (5) Oct. 1, 2013 5.4 0.6 0.7 0.1 China (6) TBD 0.5 0.5 0.9 0.4 Total 31.2$ 7.1$ 9.3$ 1.6$
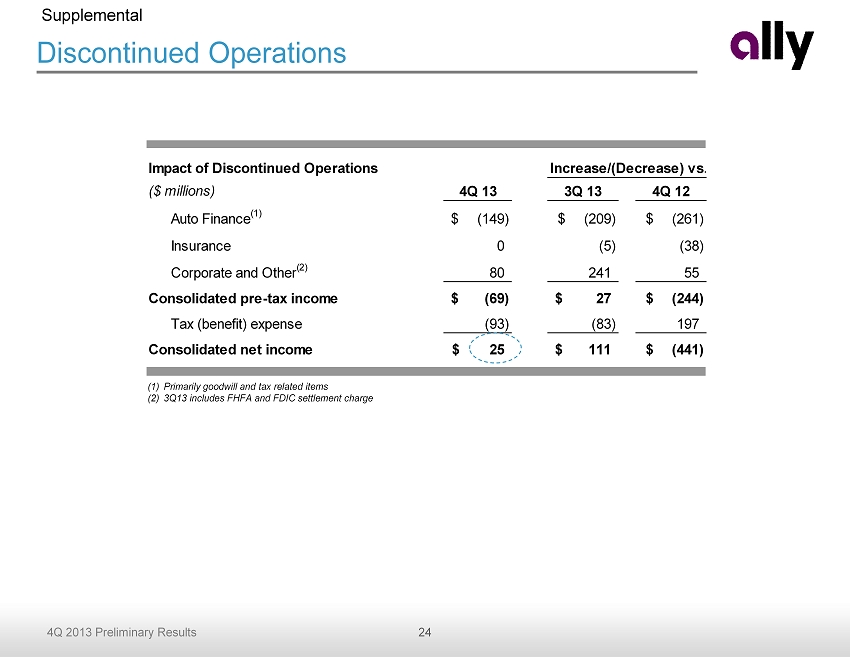
24 4Q 2013 Preliminary Results Impact of Discontinued Operations ($ millions) 4Q 13 3Q 13 4Q 12 Auto Finance (1) (149)$ (209)$ (261)$ Insurance 0 (5) (38) Corporate and Other (2) 80 241 55 Consolidated pre-tax income (69)$ 27$ (244)$ Tax (benefit) expense (93) (83) 197 Consolidated net income 25$ 111$ (441)$ Increase/(Decrease) vs. Discontinued Operations Supplemental (1) Primarily goodwill and tax related items (2) 3Q13 includes FHFA and FDIC settlement charge
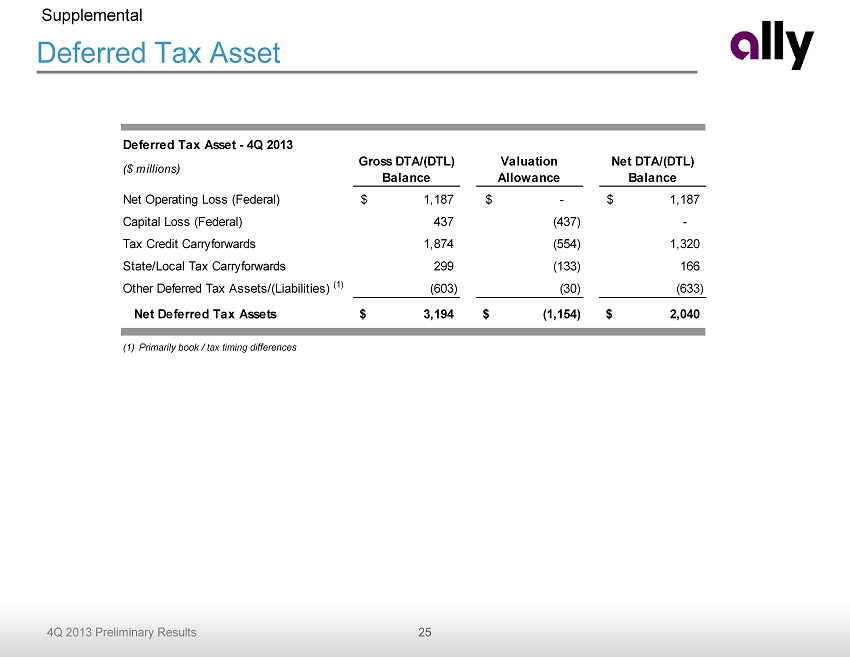
25 4Q 2013 Preliminary Results Deferred Tax Asset Supplemental (1) Primarily book / tax timing differences Deferred Tax Asset - 4Q 2013 ($ millions) Gross DTA/(DTL) Balance Valuation Allowance Net DTA/(DTL) Balance Net Operating Loss (Federal) 1,187$ -$ 1,187$ Capital Loss (Federal) 437 (437) - Tax Credit Carryforwards 1,874 (554) 1,320 State/Local Tax Carryforwards 299 (133) 166 Other Deferred Tax Assets/(Liabilities) (1) (603) (30) (633) Net Deferred Tax Assets 3,194$ (1,154)$ 2,040$
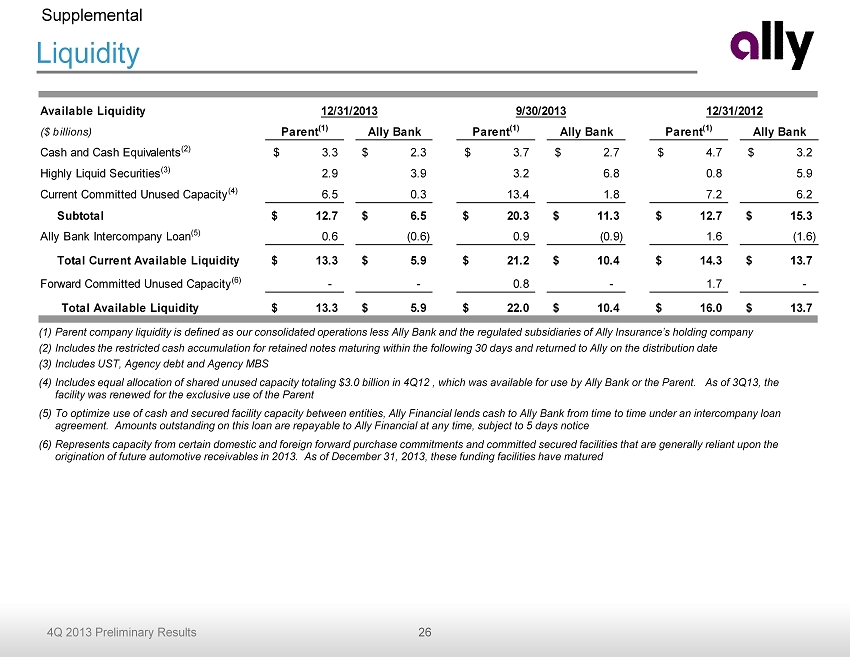
26 4Q 2013 Preliminary Results Liquidity Supplemental (1) Parent company liquidity is defined as our consolidated operations less Ally Bank and the regulated subsidiaries of Ally Insu ran ce’s holding company (2) Includes the restricted cash accumulation for retained notes maturing within the following 30 days and returned to Ally on th e d istribution date (3) Includes UST, Agency debt and Agency MBS (4) Includes equal allocation of shared unused capacity totaling $3.0 billion in 4Q12 , which was available for use by Ally Bank or the Parent. As of 3Q13 , the facility was renewed for the exclusive use of the Parent (5) To optimize use of cash and secured facility capacity between entities, Ally Financial lends cash to Ally Bank from time to t ime under an intercompany loan agreement. Amounts outstanding on this loan are repayable to Ally Financial at any time, subject to 5 days notice (6) Represents capacity from certain domestic and foreign forward purchase commitments and committed secured facilities that are gen erally reliant upon the origination of future automotive receivables in 2013. As of December 31, 2013, these funding facilities have matured Available Liquidity 12/31/2013 9/30/2013 12/31/2012 ($ billions) Parent (1) Ally Bank Parent (1) Ally Bank Parent (1) Ally Bank Cash and Cash Equivalents (2) 3.3$ 2.3$ 3.7$ 2.7$ 4.7$ 3.2$ Highly Liquid Securities (3) 2.9 3.9 3.2 6.8 0.8 5.9 Current Committed Unused Capacity (4) 6.5 0.3 13.4 1.8 7.2 6.2 Subtotal 12.7$ 6.5$ 20.3$ 11.3$ 12.7$ 15.3$ Ally Bank Intercompany Loan (5) 0.6 (0.6) 0.9 (0.9) 1.6 (1.6) SubtotalTotal Current Available Liquidity 13.3$ 5.9$ 21.2$ 10.4$ 14.3$ 13.7$ Forward Committed Unused Capacity (6) - - 0.8 - 1.7 - Total Available Liquidity 13.3$ 5.9$ 22.0$ 10.4$ 16.0$ 13.7$
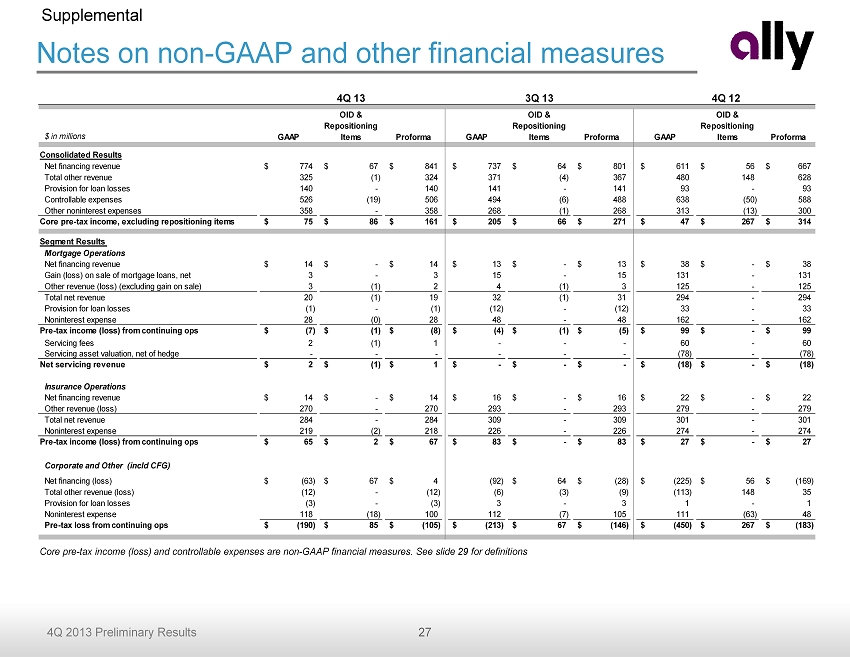
27 4Q 2013 Preliminary Results Notes on non - GAAP and other financial measures Supplemental Core pre - tax income (loss) and controllable expenses are non - GAAP financial measures. See slide 29 for definitions $ in millions GAAP OID & Repositioning Items Proforma GAAP OID & Repositioning Items Proforma GAAP OID & Repositioning Items Proforma Consolidated Results Net financing revenue 774$ 67$ 841$ 737$ 64$ 801$ 611$ 56$ 667$ Total other revenue 325 (1) 324 371 (4) 367 480 148 628 Provision for loan losses 140 - 140 141 - 141 93 - 93 Controllable expenses 526 (19) 506 494 (6) 488 638 (50) 588 Other noninterest expenses 358 - 358 268 (1) 268 313 (13) 300 Core pre-tax income, excluding repositioning items 75$ 86$ 161$ 205$ 66$ 271$ 47$ 267$ 314$ Segment Results Mortgage Operations Net financing revenue 14$ -$ 14$ 13$ -$ 13$ 38$ -$ 38$ Gain (loss) on sale of mortgage loans, net 3 - 3 15 - 15 131 - 131 Other revenue (loss) (excluding gain on sale) 3 (1) 2 4 (1) 3 125 - 125 Total net revenue 20 (1) 19 32 (1) 31 294 - 294 Provision for loan losses (1) - (1) (12) - (12) 33 - 33 Noninterest expense 28 (0) 28 48 - 48 162 - 162 Pre-tax income (loss) from continuing ops (7)$ (1)$ (8)$ (4)$ (1)$ (5)$ 99$ -$ 99$ Servicing fees 2 (1) 1 - - - 60 - 60 Servicing asset valuation, net of hedge - - - - - - (78) - (78) Net servicing revenue 2$ (1)$ 1$ -$ -$ -$ (18)$ -$ (18)$ Insurance Operations Net financing revenue 14$ -$ 14$ 16$ -$ 16$ 22$ -$ 22$ Other revenue (loss) 270 - 270 293 - 293 279 - 279 Total net revenue 284 - 284 309 - 309 301 - 301 Noninterest expense 219 (2) 218 226 - 226 274 - 274 Pre-tax income (loss) from continuing ops 65$ 2$ 67$ 83$ -$ 83$ 27$ -$ 27$ Corporate and Other (incld CFG) Net financing (loss) (63)$ 67$ 4$ (92) 64$ (28)$ (225)$ 56$ (169)$ Total other revenue (loss) (12) - (12) (6) (3) (9) (113) 148 35 Provision for loan losses (3) - (3) 3 - 3 1 - 1 Noninterest expense 118 (18) 100 112 (7) 105 111 (63) 48 Pre-tax loss from continuing ops (190)$ 85$ (105)$ (213)$ 67$ (146)$ (450)$ 267$ (183)$ 4Q 13 3Q 13 4Q 12
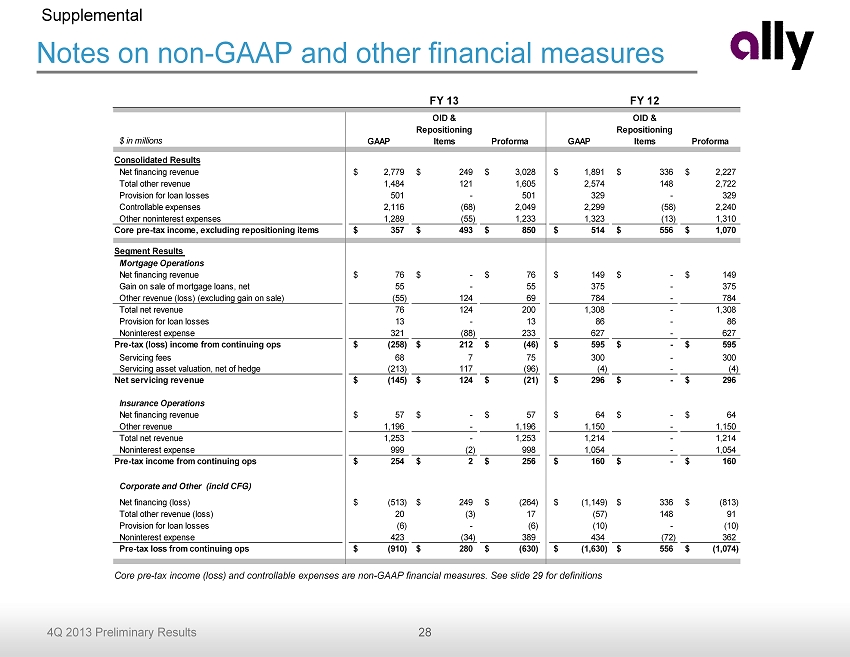
28 4Q 2013 Preliminary Results Notes on non - GAAP and other financial measures Supplemental Core pre - tax income (loss) and controllable expenses are non - GAAP financial measures. See slide 29 for definitions $ in millions GAAP OID & Repositioning Items Proforma GAAP OID & Repositioning Items Proforma Consolidated Results Net financing revenue 2,779$ 249$ 3,028$ 1,891$ 336$ 2,227$ Total other revenue 1,484 121 1,605 2,574 148 2,722 Provision for loan losses 501 - 501 329 - 329 Controllable expenses 2,116 (68) 2,049 2,299 (58) 2,240 Other noninterest expenses 1,289 (55) 1,233 1,323 (13) 1,310 Core pre-tax income, excluding repositioning items 357$ 493$ 850$ 514$ 556$ 1,070$ Segment Results Mortgage Operations Net financing revenue 76$ -$ 76$ 149$ -$ 149$ Gain on sale of mortgage loans, net 55 - 55 375 - 375 Other revenue (loss) (excluding gain on sale) (55) 124 69 784 - 784 Total net revenue 76 124 200 1,308 - 1,308 Provision for loan losses 13 - 13 86 - 86 Noninterest expense 321 (88) 233 627 - 627 Pre-tax (loss) income from continuing ops (258)$ 212$ (46)$ 595$ -$ 595$ Servicing fees 68 7 75 300 - 300 Servicing asset valuation, net of hedge (213) 117 (96) (4) - (4) Net servicing revenue (145)$ 124$ (21)$ 296$ -$ 296$ Insurance Operations Net financing revenue 57$ -$ 57$ 64$ -$ 64$ Other revenue 1,196 - 1,196 1,150 - 1,150 Total net revenue 1,253 - 1,253 1,214 - 1,214 Noninterest expense 999 (2) 998 1,054 - 1,054 Pre-tax income from continuing ops 254$ 2$ 256$ 160$ -$ 160$ Corporate and Other (incld CFG) Net financing (loss) (513)$ 249$ (264)$ (1,149)$ 336$ (813)$ Total other revenue (loss) 20 (3) 17 (57) 148 91 Provision for loan losses (6) - (6) (10) - (10) Noninterest expense 423 (34) 389 434 (72) 362 Pre-tax loss from continuing ops (910)$ 280$ (630)$ (1,630)$ 556$ (1,074)$ FY 13 FY 12
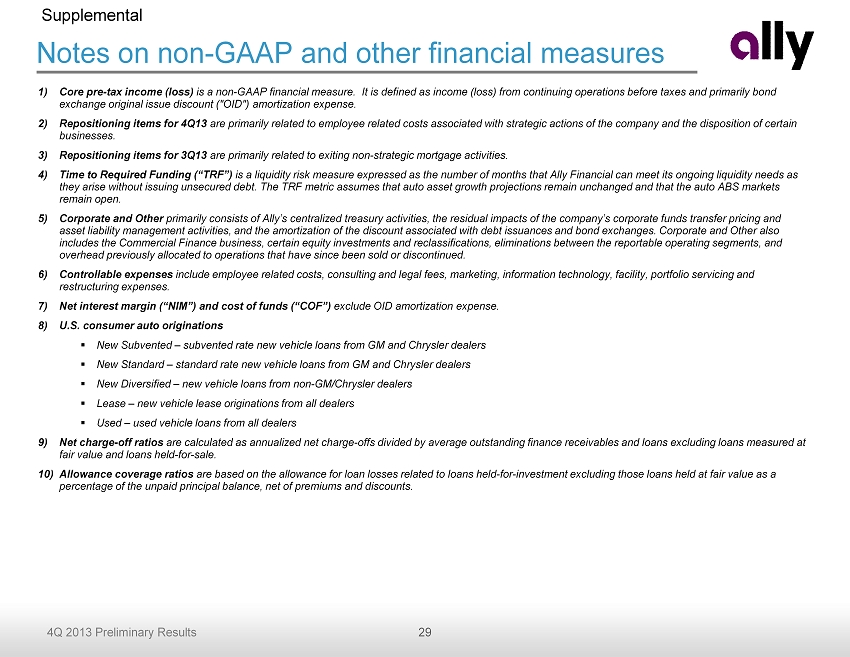
29 4Q 2013 Preliminary Results Notes on non - GAAP and other financial measures Supplemental 1) Core pre - tax income (loss) is a non - GAAP financial measure. It is defined as income (loss) from continuing operations before taxes and primarily bond exchange original issue discount ("OID") amortization expense . 2) Repositioning items for 4Q13 are primarily related to employee related costs associated with strategic actions of the company and the disposition of certa in businesses. 3) Repositioning items for 3Q13 are primarily related to exiting non - strategic mortgage activities. 4) Time to Required Funding (“TRF”) is a liquidity risk measure expressed as the number of months that Ally Financial can meet its ongoing liquidity needs as they arise without issuing unsecured debt. The TRF metric assumes that auto asset growth projections remain unchanged and tha t t he auto ABS markets remain open. 5) Corporate and Other primarily consists of Ally’s centralized treasury activities, the residual impacts of the company’s corporate funds transfer pri cing and asset liability management activities, and the amortization of the discount associated with debt issuances and bond exchanges . C orporate and Other also includes the Commercial Finance business, certain equity investments and reclassifications, eliminations between the reportab le operating segments, and overhead previously allocated to operations that have since been sold or discontinued. 6) Controllable expenses include employee related costs, consulting and legal fees, marketing, information technology, facility, portfolio servicing a nd restructuring expenses. 7) Net interest margin (“NIM”) and cost of funds (“COF”) exclude OID amortization expense. 8) U.S. consumer auto originations ▪ New Subvented – subvented rate new vehicle loans from GM and Chrysler dealers ▪ New Standard – standard rate new vehicle loans from GM and Chrysler dealers ▪ New Diversified – new vehicle loans from non - GM/Chrysler dealers ▪ Lease – new vehicle lease originations from all dealers ▪ Used – used vehicle loans from all dealers 9) Net charge - off ratios are calculated as annualized net charge - offs divided by average outstanding finance receivables and loans excluding loans measur ed at fair value and loans held - for - sale. 10) Allowance coverage ratios are based on the allowance for loan losses related to loans held - for - investment excluding those loans held at fair value as a percentage of the unpaid principal balance, net of premiums and discounts .