
Ally Financial Inc. 1 Q Earnings Review Contact Ally Investor Relations at (866) 710 - 4623 or investor.relations@ally.com May 1, 2014
2 1Q 2014 Preliminary Results Forward - Looking Statements and Additional Information The following should be read in conjunction with the financial statements, notes and other information contained in the Compa ny’ s Annual Reports on Form 10 - K, Quarterly Reports on Form 10 - Q, and Current Reports on Form 8 - K . This information is preliminary and based on company data available at the time of the presentation In the presentation that follows and related comments by Ally Financial Inc. (“Ally”) management, the use of the words “expec t,” “anticipate,” “estimate,” “forecast,” “initiative,” “objective,” “plan,” “goal,” “project,” “outlook,” “priorities,” “target,” “explore,” “ pos itions,” “intend,” “evaluate,” “pursue,” “seek,” “may,” “would, ” “could, ” “should, ” “believe, ” “potential, ” “continue,” or the negative of these words, or similar expressions is intended to identify forward - looking statements. All statements herein and in related management comments, other than statements of historical fact, including without limitation, statements about future events and financial performance, are forward - looking statements tha t involve certain risks and uncertainties. While these statements represent our current judgment on what the future may hold, and we believe th ese judgments are reasonable, these statements are not guarantees of any events or financial results, and Ally’s actual results may differ mate ria lly due to numerous important factors that are described in the most recent reports on SEC Forms 10 - K and 10 - Q for Ally, each of which may be revise d or supplemented in subsequent reports filed with the SEC. Such factors include, among others, the following: maintaining the mut ual ly beneficial relationship between Ally and General Motors (“GM”), and Ally and Chrysler Group LLC (“Chrysler”); our ability to maintain relationships with automotive dealers; our ability to realize the anticipated benefits associated with being a financial holding company, and the significant regula tio n and restrictions that we are now subject to; the potential for deterioration in the residual value of off - lease vehicles; disrup tions in the market in which we fund our operations, with resulting negative impact on our liquidity; changes in our accounting assumptions that may re quire or that result from changes in the accounting rules or their application, which could result in an impact on earnings; changes in the cr edit ratings of Ally, Chrysler, or GM; changes in economic conditions, currency exchange rates or political stability in the markets in which we op era te; and changes in the existing or the adoption of new laws, regulations, policies or other activities of governments, agencies and similar orga niz ations (including as a result of the Dodd - Frank Act and Basel III). Investors are cautioned not to place undue reliance on forward - looking statements. Ally undertakes no obligation to update publi cly or otherwise revise any forward - looking statements, whether as a result of new information, future events or other such factors that affect t he subject of these statements, except where expressly required by law. Reconciliation of non - GAAP financial measures included within this presentat ion are provided in this presentation. Use of the term “loans” describes products associated with direct and indirect lending activities of Ally’s operations. The s pec ific products include retail installment sales contracts, lines of credit, leases or other financing products. The term “originate” refers to Ally’ s p urchase, acquisition or direct origination of various “loan” products.
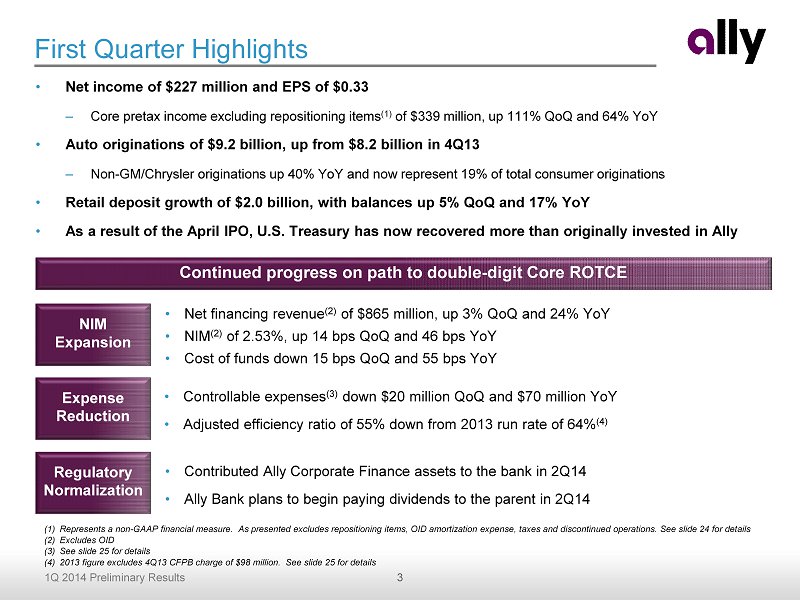
3 1Q 2014 Preliminary Results First Quarter Highlights • Net income of $227 million and EPS of $0.33 – Core pretax income excluding repositioning items (1) of $ 339 million, up 111% QoQ and 64% YoY • Auto originations of $9.2 billion, up from $ 8.2 billion in 4Q13 – Non - GM/Chrysler originations up 40% YoY and now represent 19% of total consumer originations • Retail deposit growth of $2.0 billion, with balances up 5% QoQ and 17% YoY • As a result of the April IPO, U.S . Treasury has now recovered more than originally invested in Ally (1) Represents a non - GAAP financial measure. As presented excludes repositioning items, OID amortization expense, taxes and discontinued operations. See slide 24 for details (2) Excludes OID (3) See slide 25 for details (4) 2013 figure excludes 4Q13 CFPB charge of $98 million. See slide 25 for details NIM Expansion Expense Reduction Regulatory Normalization • Net financing revenue (2) of $865 million, up 3% QoQ and 24% YoY • NIM (2) of 2.53%, up 14 bps QoQ and 46 bps YoY • Cost of funds down 15 bps QoQ and 55 bps YoY • Controllable expenses (3) down $20 million QoQ and $70 million YoY • Adjusted efficiency ratio of 55% down from 2013 run rate of 64% (4) • Contributed Ally Corporate Finance assets to the bank in 2Q14 • Ally Bank plans to begin paying dividends to the parent in 2Q14 Continued progress on path to double - digit Core ROTCE
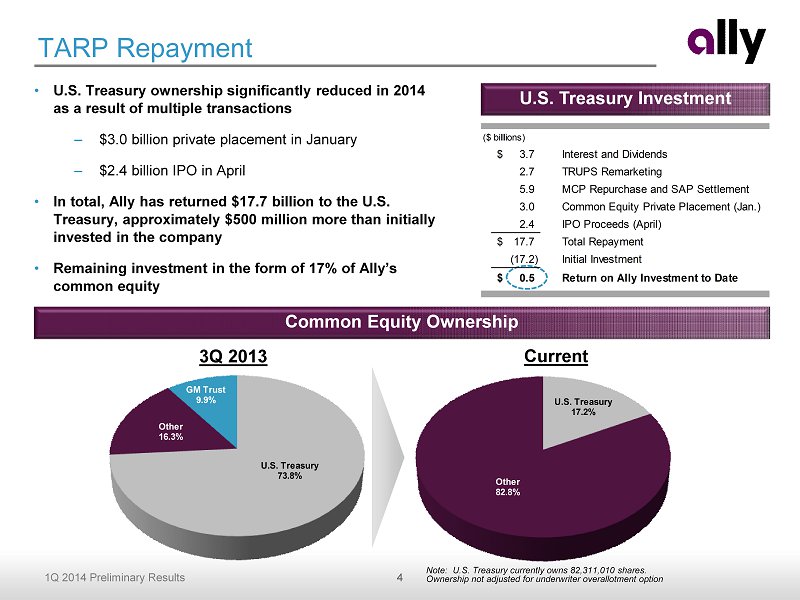
4 1Q 2014 Preliminary Results TARP Repayment • U.S. Treasury ownership significantly reduced in 2014 as a result of multiple transactions – $3.0 billion private p lacement in January – $2.4 billion IPO in April • In total, Ally has returned $17.7 billion to the U.S. Treasury, approximately $500 million more than initially invested in the company • Remaining investment in the form of 17% of Ally’s common equity Common Equity Ownership 3 Q 2013 Current Note: U.S. Treasury currently owns 82,311,010 shares. Ownership not adjusted for underwriter overallotment option U.S. Treasury Investment U.S. Treasury 73.8% Other 16.3% GM Trust 9.9% U.S. Treasury 17.2% Other 82.8% ($ billlions) 3.7$ Interest and Dividends 2.7 TRUPS Remarketing 5.9 MCP Repurchase and SAP Settlement 3.0 Common Equity Private Placement (Jan.) 2.4 IPO Proceeds (April) 17.7$ Total Repayment (17.2) Initial Investment 0.5$ Return on Ally Investment to Date
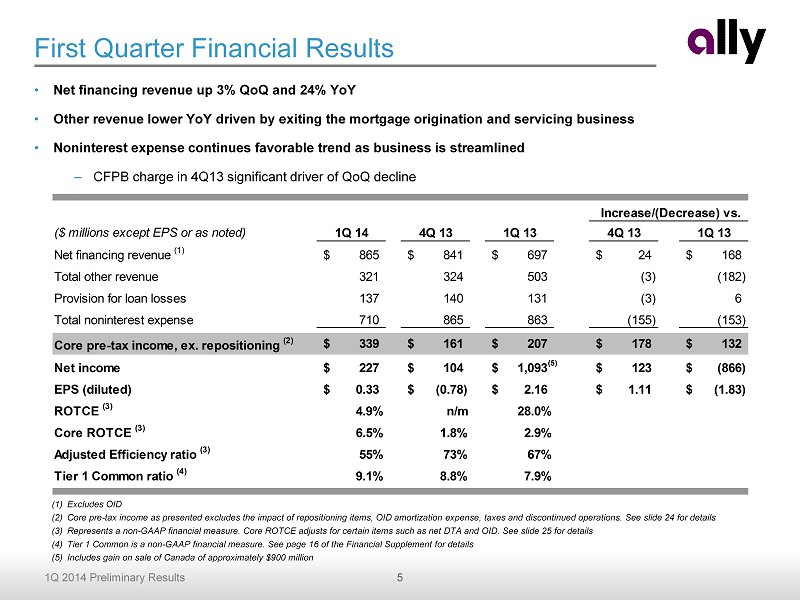
5 1Q 2014 Preliminary Results First Quarter Financial Results (1) Excludes OID (2) Core pre - tax income as presented excludes the impact of repositioning items, OID amortization expense, taxes and discontinued op erations. See slide 24 for details (3) Represents a non - GAAP financial measure . Core ROTCE adjusts for certain items such as net DTA and OID . See slide 25 for details (4) Tier 1 Common is a non - GAAP financial measure. See page 16 of the Financial Supplement for details (5) Includes gain on sale of Canada of approximately $900 million • Net financing revenue up 3% QoQ and 24% YoY • Other revenue lower YoY driven by exiting the mortgage origination and servicing business • Noninterest expense continues favorable trend as business is streamlined – CFPB charge in 4Q13 significant driver of QoQ decline ($ millions except EPS or as noted) 1Q 14 4Q 13 1Q 13 4Q 13 1Q 13 Net financing revenue (1) 865$ 841$ 697$ 24$ 168$ Total other revenue 321 324 503 (3) (182) Provision for loan losses 137 140 131 (3) 6 Total noninterest expense 710 865 863 (155) (153) Core pre-tax income, ex. repositioning (2) 339$ 161$ 207$ 178$ 132$ Net income 227$ 104$ 1,093$ 123$ (866)$ EPS (diluted) 0.33$ (0.78)$ 2.16$ 1.11$ (1.83)$ ROTCE (3) 4.9% n/m 28.0% Core ROTCE (3) 6.5% 1.8% 2.9% Adjusted Efficiency ratio (3) 55% 73% 67% Tier 1 Common ratio (4) 9.1% 8.8% 7.9% Increase/(Decrease) vs. (5)
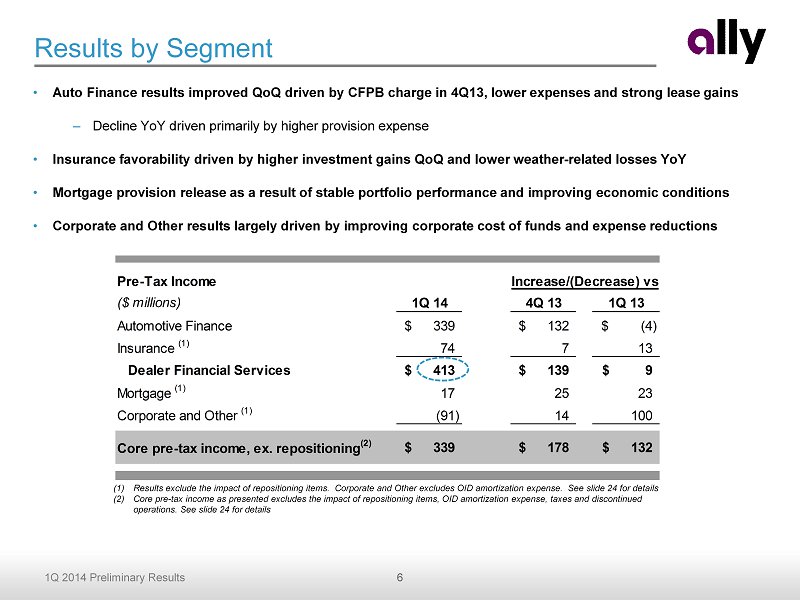
6 1Q 2014 Preliminary Results Pre-Tax Income ($ millions) 1Q 14 4Q 13 1Q 13 Automotive Finance 339$ 132$ (4)$ Insurance (1) 74 7 13 Dealer Financial Services 413$ 139$ 9$ Mortgage (1) 17 25 23 Corporate and Other (1) (91) 14 100 Core pre-tax income, ex. repositioning (2) 339$ 178$ 132$ Increase/(Decrease) vs. Results by Segment (1) Results exclude the impact of repositioning items. Corporate and Other excludes OID amortization expense. See slide 24 for det ails (2) Core pre - tax income as presented excludes the impact of repositioning items, OID amortization expense, taxes and discontinued operations. See slide 24 for details • Auto Finance results improved QoQ driven by CFPB charge in 4Q13, lower expenses and strong lease gains – Decline YoY driven primarily by higher provision expense • Insurance favorability driven by higher investment gains QoQ and lower weather - related losses YoY • Mortgage provision release as a result of stable portfolio performance and improving economic conditions • Corporate and Other results largely driven by improving corporate cost of funds and expense reductions
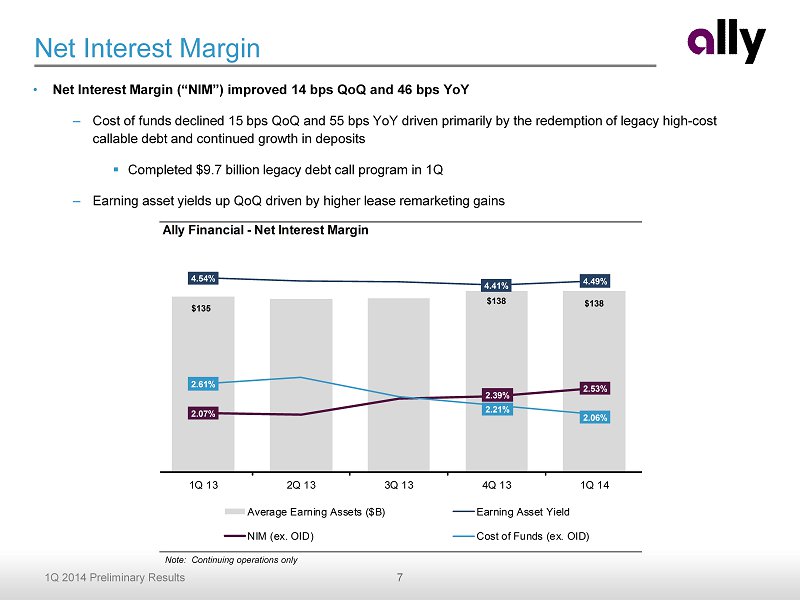
7 1Q 2014 Preliminary Results Net Interest Margin • Net Interest Margin (“NIM”) improved 14 bps QoQ and 46 bps YoY – Cost of funds declined 15 bps QoQ and 55 bps YoY driven primarily by the redemption of legacy high - cost callable debt and continued growth in deposits ▪ Completed $9.7 billion legacy debt call program in 1Q – Earning asset yields up QoQ driven by higher lease remarketing gains Note: Continuing operations only Ally Financial - Net Interest Margin $135 $138 $138 4.54% 4.41% 4.49% 2.07% 2.39% 2.53% 2.61% 2.21% 2.06% 1Q 13 2Q 13 3Q 13 4Q 13 1Q 14 Average Earning Assets ($B) Earning Asset Yield NIM (ex. OID) Cost of Funds (ex. OID)
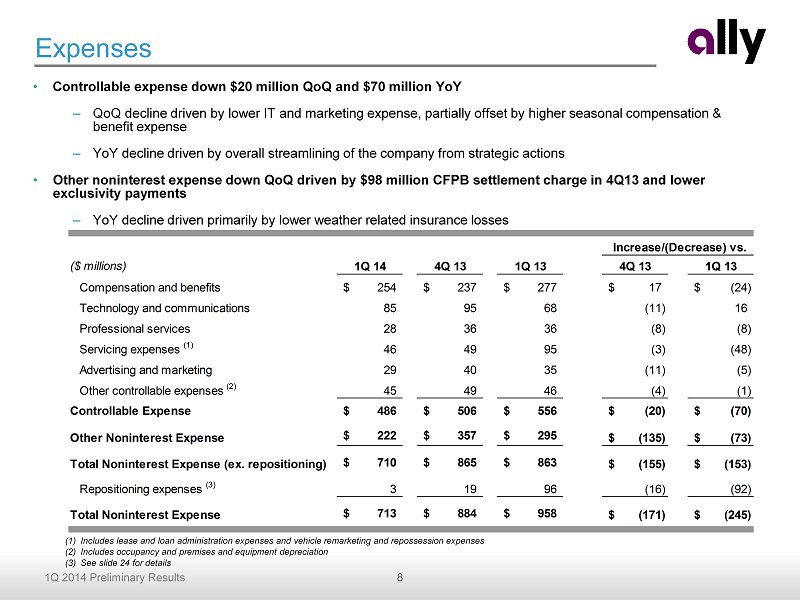
8 1Q 2014 Preliminary Results ($ millions) 1Q 14 4Q 13 1Q 13 4Q 13 1Q 13 Compensation and benefits 254$ 237$ 277$ 17$ (24)$ Technology and communications 85 95 68 (11) 16 Professional services 28 36 36 (8) (8) Servicing expenses (1) 46 49 95 (3) (48) Advertising and marketing 29 40 35 (11) (5) Other controllable expenses (2) 45 49 46 (4) (1) Controllable Expense 486$ 506$ 556$ (20)$ (70)$ Other Noninterest Expense 222$ 357$ 295$ (135)$ (73)$ Total Noninterest Expense (ex. repositioning) 710$ 865$ 863$ (155)$ (153)$ Repositioning expenses (3) 3 19 96 (16) (92) Total Noninterest Expense 713$ 884$ 958$ (171)$ (245)$ Increase/(Decrease) vs. Expenses • Controllable expense down $20 million QoQ and $70 million YoY – QoQ decline driven by lower IT and marketing expense, partially offset by higher seasonal c ompensation & benefit expense – YoY decline driven by overall streamlining of the company from strategic actions • Other noninterest expense down QoQ driven by $98 million CFPB settlement charge in 4Q13 and lower exclusivity payments – YoY decline driven primarily by lower weather related insurance losses (1) Includes lease and loan administration expenses and vehicle remarketing and repossession expenses (2) Includes occupancy and premises and equipment depreciation (3) See slide 24 for details
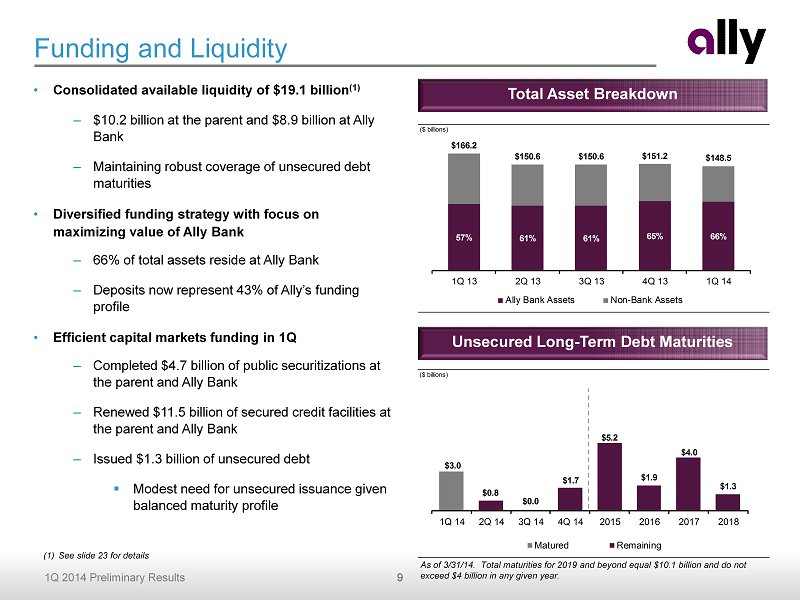
9 1Q 2014 Preliminary Results • Consolidated available liquidity of $19.1 billion (1) – $10.2 billion at the parent and $8.9 billion at Ally Bank – Maintaining robust coverage of unsecured debt maturities • Diversified funding strategy with focus on maximizing value of Ally Bank – 66% of total assets reside at Ally Bank – Deposits now represent 43% of Ally’s funding profile • Efficient capital markets funding in 1Q – Completed $4.7 billion of public securitizations at the parent and Ally Bank – Renewed $11.5 billion of secured credit facilities at the parent and Ally Bank – Issued $1.3 b illion of unsecured debt ▪ Modest need for unsecured issuance given balanced maturity profile Funding and Liquidity (1) See slide 23 for details As of 3/31/14. Total maturities for 2019 and beyond equal $10.1 billion and do not exceed $4 billion in any given year. Total Asset Breakdown Unsecured Long - Term Debt Maturities ($ billions) 57% 61% 61% 65% 66% $166.2 $150.6 $150.6 $151.2 $148.5 1Q 13 2Q 13 3Q 13 4Q 13 1Q 14 Ally Bank Assets Non-Bank Assets ($ billions) $3.0 $0.8 $0.0 $1.7 $5.2 $1.9 $4.0 $1.3 1Q 14 2Q 14 3Q 14 4Q 14 2015 2016 2017 2018 Matured Remaining
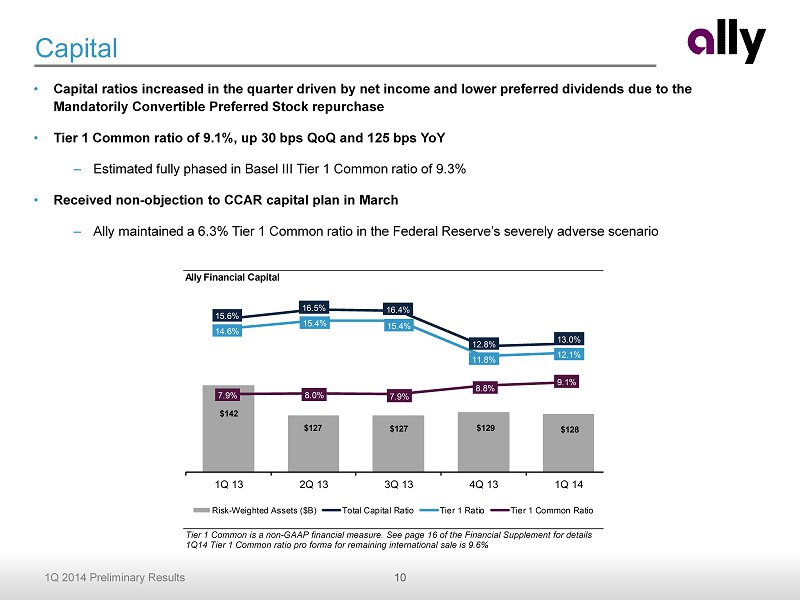
10 1Q 2014 Preliminary Results Ally Financial Capital $142 $127 $127 $129 $128 15.6% 16.5% 16.4% 12.8% 13.0% 14.6% 15.4% 15.4% 11.8% 12.1% 7.9% 8.0% 7.9% 8.8% 9.1% 1Q 13 2Q 13 3Q 13 4Q 13 1Q 14 Risk-Weighted Assets ($B) Total Capital Ratio Tier 1 Ratio Tier 1 Common Ratio Capital • Capital ratios increased in the quarter driven by net income and lower preferred dividends due to the Mandatorily C onvertible P referred Stock repurchase • Tier 1 Common ratio of 9.1%, up 30 bps QoQ and 125 bps YoY – Estimated fully phased in Basel III Tier 1 Common ratio of 9.3% • Received non - objection to CCAR capital plan in March – Ally maintained a 6.3% Tier 1 Common ratio in the Federal Reserve’s severely adverse scenario Tier 1 Common is a non - GAAP financial measure. See page 16 of the Financial Supplement for details 1Q14 Tier 1 Common ratio pro forma for remaining international sale is 9.6%
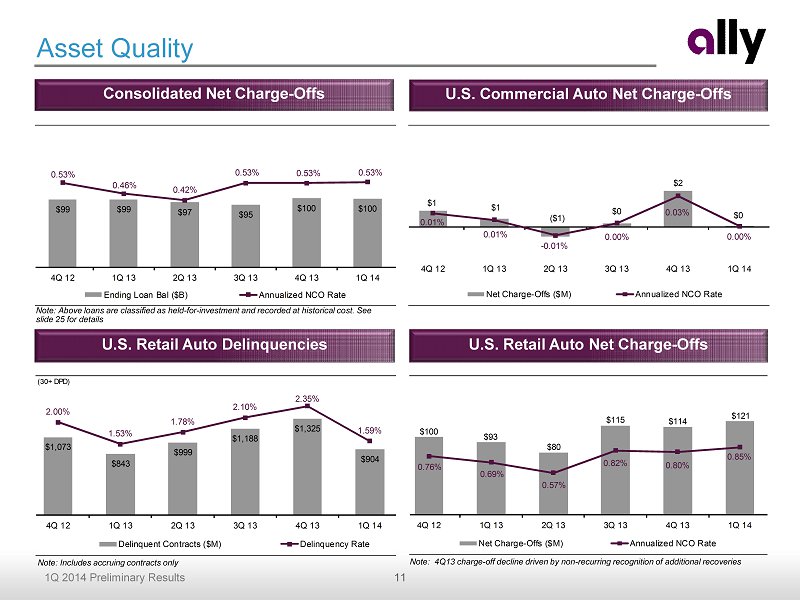
11 1Q 2014 Preliminary Results Consolidated Net Charge - Offs U.S. Commercial Auto Net Charge - Offs Asset Quality U.S. Retail Auto Net Charge - Offs U.S. Retail Auto Delinquencies Note: Above loans are classified as held - for - investment and recorded at historical cost. See slide 25 for details Note: 4Q13 charge - off decline driven by non - recurring recognition of additional recoveries $1 $1 ($1) $0 $2 $0 0.01% 0.01% - 0.01% 0.00% 0.03% 0.00% 4Q 12 1Q 13 2Q 13 3Q 13 4Q 13 1Q 14 Net Charge-Offs ($M) Annualized NCO Rate $99 $99 $97 $95 $100 $100 0.53% 0.46% 0.42% 0.53% 0.53% 0.53% 4Q 12 1Q 13 2Q 13 3Q 13 4Q 13 1Q 14 Ending Loan Bal ($B) Annualized NCO Rate (30+ DPD) $1,073 $843 $999 $1,188 $1,325 $904 2.00% 1.53% 1.78% 2.10% 2.35% 1.59% 4Q 12 1Q 13 2Q 13 3Q 13 4Q 13 1Q 14 Delinquent Contracts ($M) Delinquency Rate $100 $93 $80 $115 $114 $121 0.76% 0.69% 0.57% 0.82% 0.80% 0.85% 4Q 12 1Q 13 2Q 13 3Q 13 4Q 13 1Q 14 Net Charge-Offs ($M) Annualized NCO Rate Note: Includes accruing contracts only

12 1Q 2014 Preliminary Results U.S. Consumer Auto Originations by Dealer Channel (% of $ originations) 65% 60% 65% 66% 26% 27% 20% 15% 9% 13% 15% 19% 0% 50% 100% FY11 FY12 FY13 1Q14 GM Chrysler Other Key Financials ($ millions) 1Q 14 4Q 13 1Q 13 Net financing revenue 820$ 11$ 47$ Total other revenue 64 3 (18) Total net revenue 884 14 29 Provision for loan losses 159 15 47 Noninterest expense 386 (133) (14) Pre-tax income from continuing ops 339$ 132$ (4)$ U.S. auto earning assets 107,933$ 34$ 6,217$ Increase/(Decrease) vs. • Auto finance reported pre - tax income of $339 million in 1Q, up $132 million from 4Q and down $4 million from a year ago – Net financing revenue higher QoQ driven primarily by strong lease gains and YoY due to higher earning asset balances – Provision increases continue to be driven by portfolio normalization and seasoning of recent vintages – Noninterest expense decline driven by CFPB settlement charge in 4Q13 and lower exclusivity payments • Earning assets flat QoQ and up 6% YoY • Consumer originations of $9.2 billion in 1Q – Strong used, lease and diversified new originations offsetting reduction in subvented business – Growth in non - GM/Chrysler channel – Continued focus on profitability and asset quality • Average floorplan balances up both QoQ and YoY Auto Finance – Results Includes new, used and lease originations
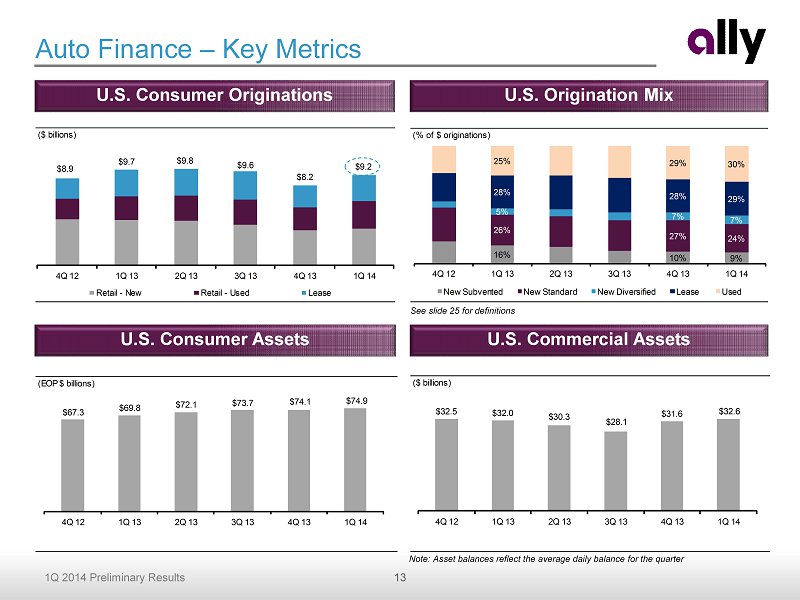
13 1Q 2014 Preliminary Results ($ billions) $8.9 $9.7 $9.8 $9.6 $8.2 $9.2 4Q 12 1Q 13 2Q 13 3Q 13 4Q 13 1Q 14 Retail - New Retail - Used Lease Auto Finance – Key Metrics See slide 25 for definitions U.S. Consumer Assets U.S. Commercial Assets U.S. Consumer Originations U.S. Origination Mix Note: Asset balances reflect the average daily balance for the quarter (EOP $ billions) $67.3 $69.8 $72.1 $73.7 $74.1 $74.9 4Q 12 1Q 13 2Q 13 3Q 13 4Q 13 1Q 14 (% of $ originations) 16% 10% 9% 26% 27% 24% 5% 7% 7% 28% 28% 29% 25% 29% 30% 0% 25% 50% 75% 100% 4Q 12 1Q 13 2Q 13 3Q 13 4Q 13 1Q 14 New Subvented New Standard New Diversified Lease Used ($ billions) $32.5 $32.0 $30.3 $28.1 $31.6 $32.6 4Q 12 1Q 13 2Q 13 3Q 13 4Q 13 1Q 14
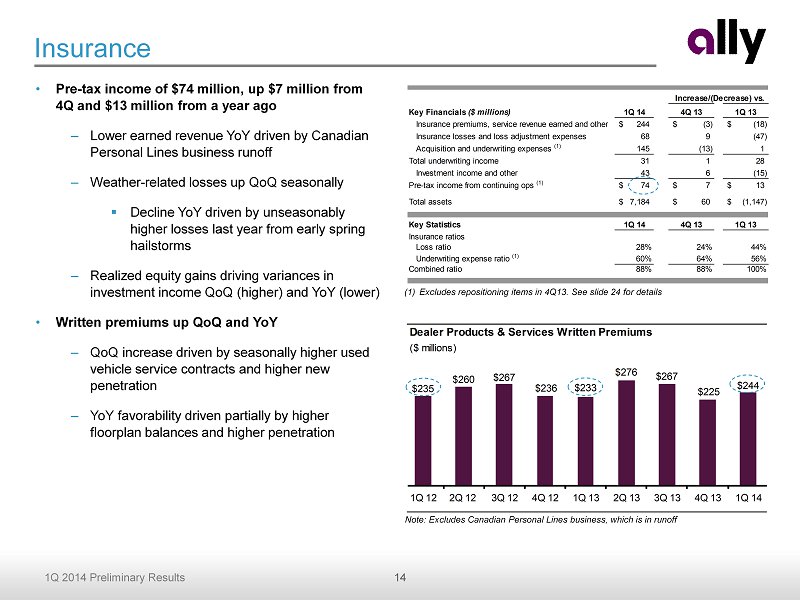
14 1Q 2014 Preliminary Results Dealer Products & Services Written Premiums ($ millions) $235 $260 $267 $236 $233 $276 $267 $225 $244 1Q 12 2Q 12 3Q 12 4Q 12 1Q 13 2Q 13 3Q 13 4Q 13 1Q 14 Key Financials ($ millions) 1Q 14 4Q 13 1Q 13 Insurance premiums, service revenue earned and other 244$ (3)$ (18)$ Insurance losses and loss adjustment expenses 68 9 (47) Acquisition and underwriting expenses (1) 145 (13) 1 Total underwriting income 31 1 28 Investment income and other 43 6 (15) Pre-tax income from continuing ops (1) 74$ 7$ 13$ Total assets 7,184$ 60$ (1,147)$ Key Statistics 1Q 14 4Q 13 1Q 13 Insurance ratios Loss ratio 28% 24% 44% Underwriting expense ratio (1) 60% 64% 56% Combined ratio 88% 88% 100% Increase/(Decrease) vs. Insurance • Pre - tax income of $74 million, up $ 7 million from 4Q and $13 million from a year ago – Lower earned revenue YoY driven by Canadian Personal Lines business runoff – Weather - related losses up QoQ seasonally ▪ Decline YoY driven by unseasonably higher losses last year from early spring hailstorms – Realized equity gains driving variances in investment income QoQ (higher) and YoY (lower) • W ritten premiums up QoQ and YoY – QoQ increase driven by seasonally higher used vehicle service contracts and higher new penetration – YoY favorability driven partially by higher floorplan balances and higher penetration Note: Excludes Canadian Personal Lines business, which is in runoff (1) Excludes repositioning items in 4Q13. See slide 24 for details
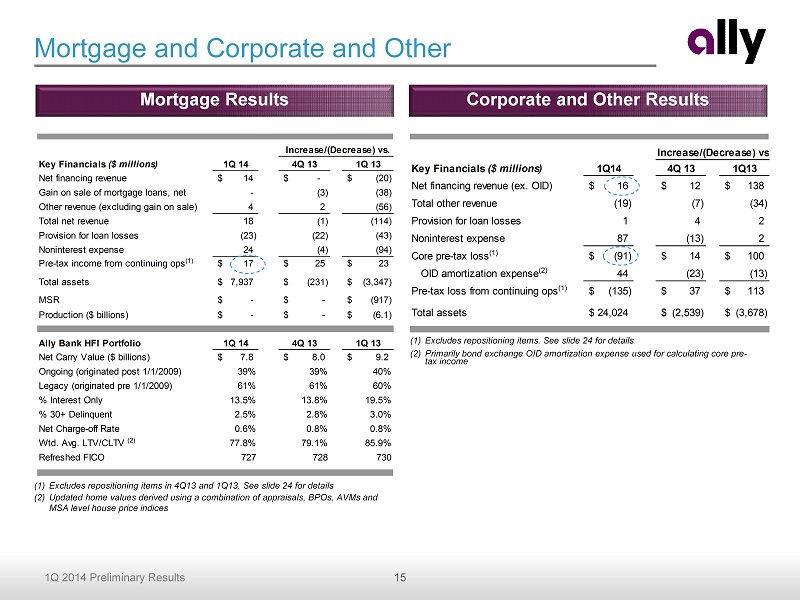
15 1Q 2014 Preliminary Results Key Financials ($ millions) 1Q 14 4Q 13 1Q 13 Net financing revenue 14$ -$ (20)$ Gain on sale of mortgage loans, net - (3) (38) Other revenue (excluding gain on sale) 4 2 (56) Total net revenue 18 (1) (114) Provision for loan losses (23) (22) (43) Noninterest expense 24 (4) (94) Pre-tax income from continuing ops (1) 17$ 25$ 23$ Total assets 7,937$ (231)$ (3,347)$ MSR -$ -$ (917)$ Production ($ billions) -$ -$ (6.1)$ Ally Bank HFI Portfolio 1Q 14 4Q 13 1Q 13 Net Carry Value ($ billions) 7.8$ 8.0$ 9.2$ Ongoing (originated post 1/1/2009) 39% 39% 40% Legacy (originated pre 1/1/2009) 61% 61% 60% % Interest Only 13.5% 13.8% 19.5% % 30+ Delinquent 2.5% 2.8% 3.0% Net Charge-off Rate 0.6% 0.8% 0.8% Wtd. Avg. LTV/CLTV (2) 77.8% 79.1% 85.9% Refreshed FICO 727 728 730 Increase/(Decrease) vs. Key Financials ($ millions) 1Q14 4Q 13 1Q13 Net financing revenue (ex. OID) 16$ 12$ 138$ Total other revenue (19) (7) (34) Provision for loan losses 1 4 2 Noninterest expense 87 (13) 2 Core pre-tax loss (1) (91)$ 14$ 100$ OID amortization expense (2) 44 (23) (13) Pre-tax loss from continuing ops (1) (135)$ 37$ 113$ Total assets 24,024$ (2,539)$ (3,678)$ Increase/(Decrease) vs. Mortgage and Corporate and Other (1) Excludes repositioning items in 4Q13 and 1Q13. See slide 24 for details (2) Updated home values derived using a combination of appraisals, BPOs, AVMs and MSA level house price indices Mortgage Results (1) Excludes repositioning items. See slide 24 for details (2) Primarily bond exchange OID amortization expense used for calculating core pre - tax income Corporate and Other Results

16 1Q 2014 Preliminary Results Ally Bank Deposit Levels ($ billions) $38.8 $39.9 $41.7 $43.2 $45.2 $48.6 $49.4 $51.4 $52.8 $54.9 1Q 13 2Q 13 3Q 13 4Q 13 1Q 14 Ally Bank Retail Ally Bank Brokered Ally Bank Deposit Franchise • Continued franchise momentum with over $45 billion of retail deposits • $2.0 billion of retail deposit growth in 1Q, with balances up 5% QoQ and 17% YoY – Growth continues to be driven largely by savings products vs. CDs • Expansion of loyal customer base with 825K primary customers, up 5% QoQ and 19% YoY • Continued recognition of Ally Bank’s customer centric approach and brand value – For second consecutive year, earned the top rating in The Pew Charitable Trusts’ study "Checks and Balances: Measuring Checking Accounts’ Safety and Transparency" (April 2014) ▪ Ally Bank was the only financial institution studied to meet all of Pew’s best and good practice criteria – Won three S ilver Stevie® Awards for Sales and Customer Service (Feb. 2014) Stable, consistent growth of retail deposits Deposit Mix Ally Bank Deposit Composition and Average Retail Portfolio Interest Rate 20% 19% 19% 18% 18% 46% 46% 45% 45% 43% 34% 35% 36% 37% 39% 1.29% 1.24% 1.22% 1.21% 1.19% 1Q13 2Q13 3Q13 4Q13 1Q14 Brokered CD Retail CD MMA/OSA/Checking Average Retail Portfolio Interest Rate
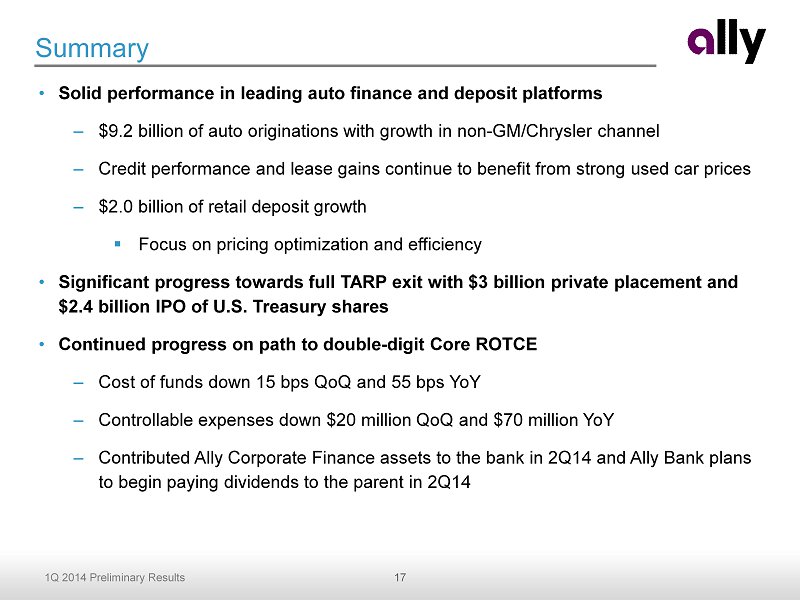
17 1Q 2014 Preliminary Results Summary • Solid performance in leading auto finance and deposit platforms – $9.2 billion of auto originations with growth in non - GM/Chrysler channel – Credit performance and lease gains continue to benefit from strong used car prices – $2.0 billion of retail deposit growth ▪ Focus on pricing optimization and efficiency • Significant progress towards full TARP exit with $3 billion private p lacement and $2.4 billion IPO of U.S. Treasury shares • Continued progress on path to double - digit Core ROTCE – Cost of funds down 15 bps QoQ and 55 bps YoY – Controllable expenses down $20 million QoQ and $70 million YoY – Contributed Ally Corporate Finance assets to the bank in 2Q14 and Ally Bank plans to begin paying dividends to the parent in 2Q14
Supplemental Charts
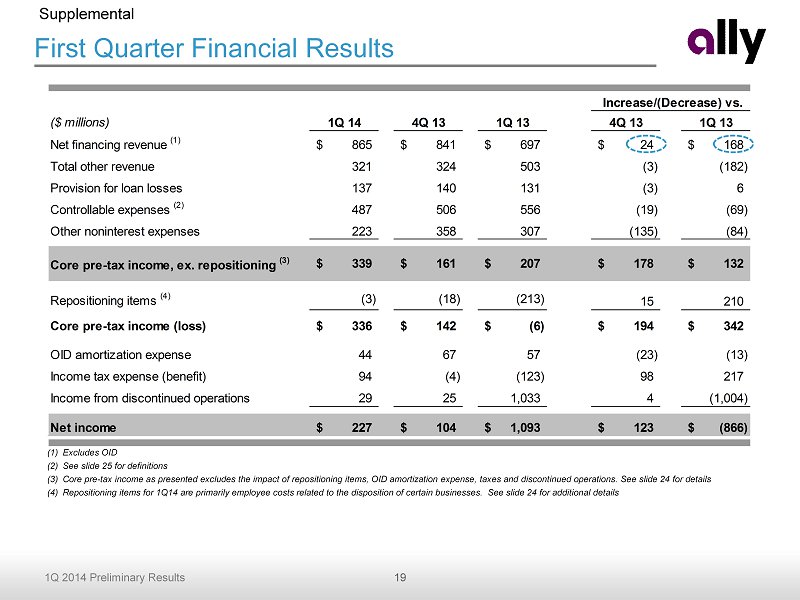
19 1Q 2014 Preliminary Results First Quarter Financial Results (1) Excludes OID (2) See slide 25 for definitions (3) Core pre - tax income as presented excludes the impact of repositioning items, OID amortization expense, taxes and discontinued op erations. See slide 24 for details (4) Repositioning items for 1Q14 are primarily employee costs related to the disposition of certain businesses. See slide 24 for additional details Supplemental ($ millions) 1Q 14 4Q 13 1Q 13 4Q 13 1Q 13 Net financing revenue (1) 865$ 841$ 697$ 24$ 168$ Total other revenue 321 324 503 (3) (182) Provision for loan losses 137 140 131 (3) 6 Controllable expenses (2) 487 506 556 (19) (69) Other noninterest expenses 223 358 307 (135) (84) Core pre-tax income, ex. repositioning (3) 339$ 161$ 207$ 178$ 132$ Repositioning items (4) (3) (18) (213) 15 210 Core pre-tax income (loss) 336$ 142$ (6)$ 194$ 342$ OID amortization expense 44 67 57 (23) (13) Income tax expense (benefit) 94 (4) (123) 98 217 Income from discontinued operations 29 25 1,033 4 (1,004) Net income 227$ 104$ 1,093$ 123$ (866)$ Increase/(Decrease) vs.
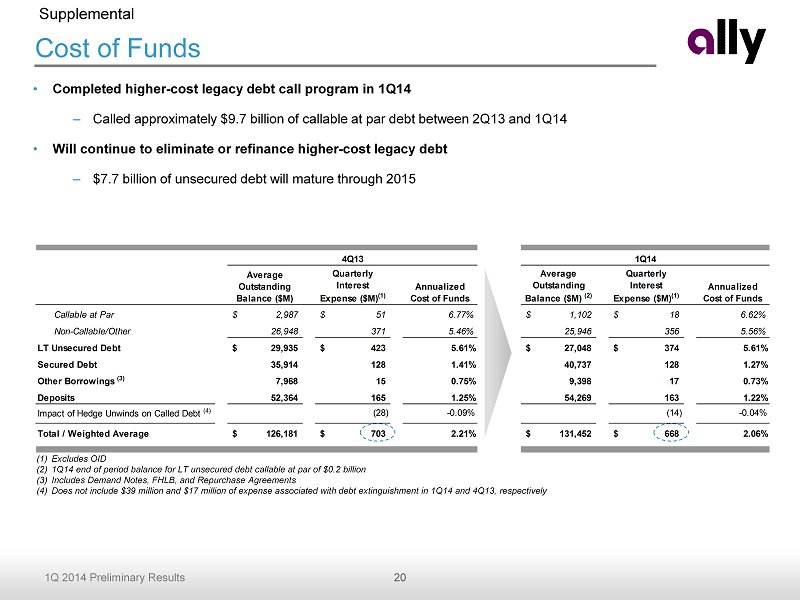
20 1Q 2014 Preliminary Results Cost of Funds • Completed higher - cost legacy debt call program in 1Q14 – Called approximately $9.7 billion of callable at par debt between 2Q13 and 1Q14 • Will continue to eliminate or refinance higher - cost legacy debt – $7.7 billion of unsecured debt will mature through 2015 (1) Excludes OID (2) 1Q14 end of period balance for LT unsecured debt callable at par of $0.2 billion (3) Includes Demand Notes, FHLB, and Repurchase Agreements (4) Does not include $39 million and $17 million of expense associated with debt extinguishment in 1 Q14 and 4Q13, respectively Average Outstanding Balance ($M) Quarterly Interest Expense ($M) (1) Annualized Cost of Funds Average Outstanding Balance ($M) (2) Quarterly Interest Expense ($M) (1) Annualized Cost of Funds Callable at Par 2,987$ 51$ 6.77% 1,102$ 18$ 6.62% Non-Callable/Other 26,948 371 5.46% 25,946 356 5.56% LT Unsecured Debt 29,935$ 423$ 5.61% 27,048$ 374$ 5.61% Secured Debt 35,914 128 1.41% 40,737 128 1.27% Other Borrowings (3) 7,968 15 0.75% 9,398 17 0.73% Deposits 52,364 165 1.25% 54,269 163 1.22% Impact of Hedge Unwinds on Called Debt (4) (28) -0.09% (14) -0.04% Total / Weighted Average 126,181$ 703$ 2.21% 131,452$ 668$ 2.06% 4Q13 1Q14 Supplemental
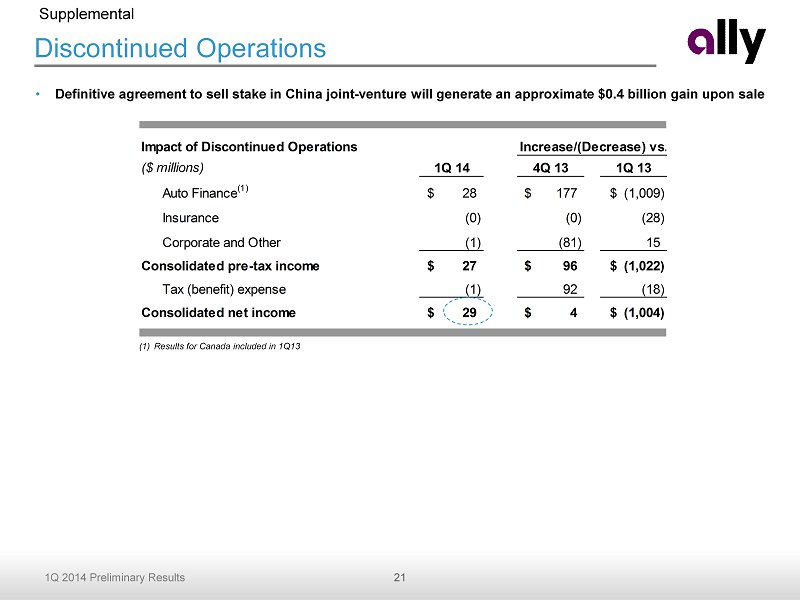
21 1Q 2014 Preliminary Results Impact of Discontinued Operations ($ millions) 1Q 14 4Q 13 1Q 13 Auto Finance (1) 28$ 177$ (1,009)$ Insurance (0) (0) (28) Corporate and Other (1) (81) 15 Consolidated pre-tax income 27$ 96$ (1,022)$ Tax (benefit) expense (1) 92 (18) Consolidated net income 29$ 4$ (1,004)$ Increase/(Decrease) vs. Discontinued Operations Supplemental (1) Results for Canada included in 1Q13 • Definitive agreement to sell stake in China joint - venture will generate an approximate $0.4 billion gain upon sale
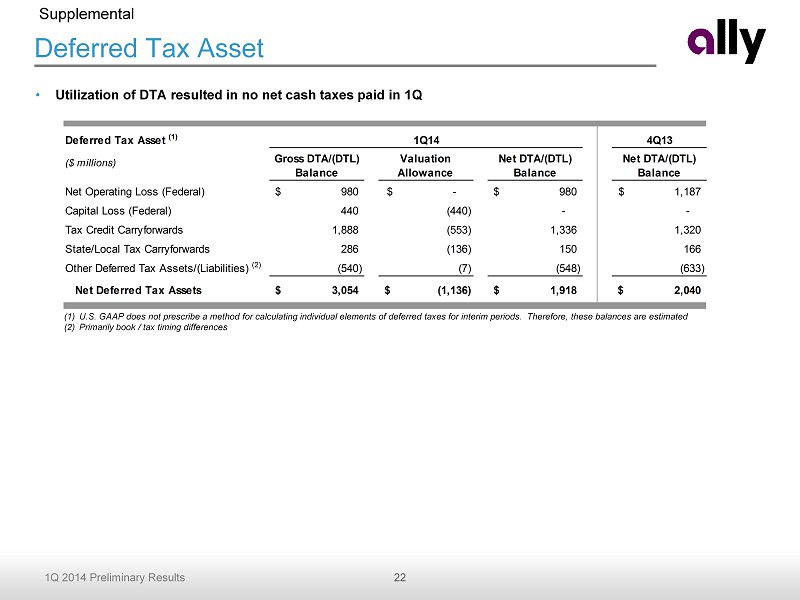
22 1Q 2014 Preliminary Results Deferred Tax Asset Supplemental (1) U.S. GAAP does not prescribe a method for calculating individual elements of deferred taxes for interim periods. Therefore, these ba lances are estimated (2) Primarily book / tax timing differences • Utilization of DTA resulted in no net cash taxes paid in 1Q Deferred Tax Asset (1) 4Q13 ($ millions) Gross DTA/(DTL) Balance Valuation Allowance Net DTA/(DTL) Balance Net DTA/(DTL) Balance Net Operating Loss (Federal) 980$ -$ 980$ 1,187$ Capital Loss (Federal) 440 (440) - - Tax Credit Carryforwards 1,888 (553) 1,336 1,320 State/Local Tax Carryforwards 286 (136) 150 166 Other Deferred Tax Assets/(Liabilities) (2) (540) (7) (548) (633) Net Deferred Tax Assets 3,054$ (1,136)$ 1,918$ 2,040$ 1Q14
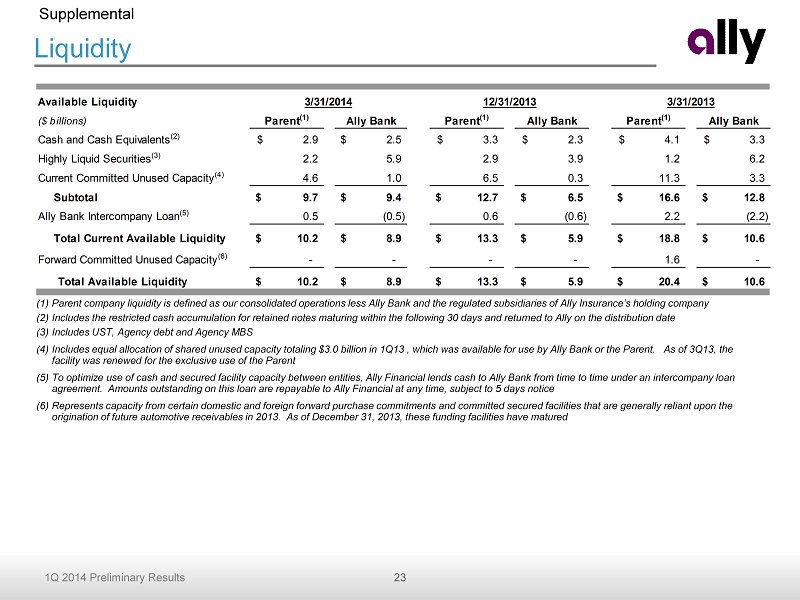
23 1Q 2014 Preliminary Results Liquidity Supplemental (1) Parent company liquidity is defined as our consolidated operations less Ally Bank and the regulated subsidiaries of Ally Insu ran ce’s holding company (2) Includes the restricted cash accumulation for retained notes maturing within the following 30 days and returned to Ally on th e d istribution date (3) Includes UST, Agency debt and Agency MBS (4) Includes equal allocation of shared unused capacity totaling $3.0 billion in 1 Q13 , which was available for use by Ally Bank or the Parent. As of 3Q13 , the facility was renewed for the exclusive use of the Parent (5) To optimize use of cash and secured facility capacity between entities, Ally Financial lends cash to Ally Bank from time to t ime under an intercompany loan agreement. Amounts outstanding on this loan are repayable to Ally Financial at any time, subject to 5 days notice (6) Represents capacity from certain domestic and foreign forward purchase commitments and committed secured facilities that are gen erally reliant upon the origination of future automotive receivables in 2013. As of December 31, 2013, these funding facilities have matured Available Liquidity 3/31/2014 12/31/2013 3/31/2013 ($ billions) Parent (1) Ally Bank Parent (1) Ally Bank Parent (1) Ally Bank Cash and Cash Equivalents (2) 2.9$ 2.5$ 3.3$ 2.3$ 4.1$ 3.3$ Highly Liquid Securities (3) 2.2 5.9 2.9 3.9 1.2 6.2 Current Committed Unused Capacity (4) 4.6 1.0 6.5 0.3 11.3 3.3 Subtotal 9.7$ 9.4$ 12.7$ 6.5$ 16.6$ 12.8$ Ally Bank Intercompany Loan (5) 0.5 (0.5) 0.6 (0.6) 2.2 (2.2) SubtotalTotal Current Available Liquidity 10.2$ 8.9$ 13.3$ 5.9$ 18.8$ 10.6$ Forward Committed Unused Capacity (6) - - - - 1.6 - Total Available Liquidity 10.2$ 8.9$ 13.3$ 5.9$ 20.4$ 10.6$
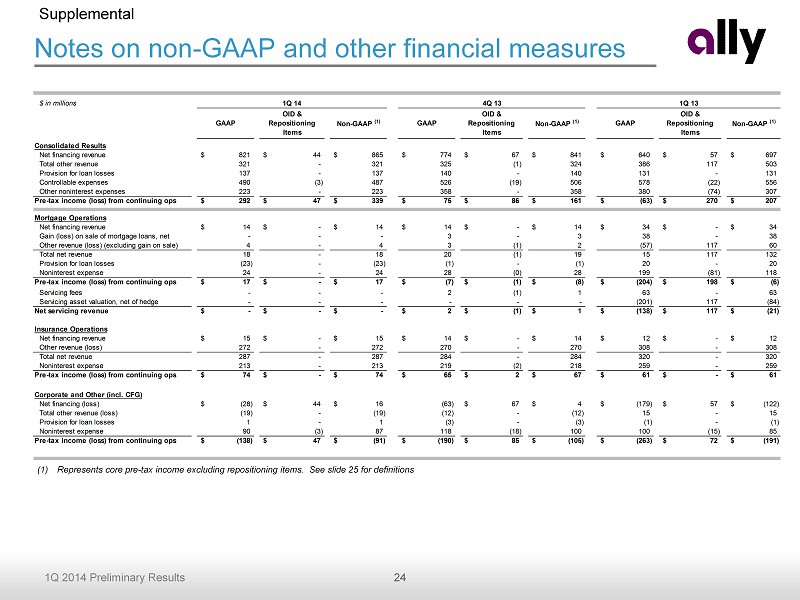
24 1Q 2014 Preliminary Results Notes on non - GAAP and other financial measures Supplemental (1) Represents core pre - tax income excluding repositioning items. See slide 25 for definitions $ in millions GAAP OID & Repositioning Items Non-GAAP (1) GAAP OID & Repositioning Items Non-GAAP (1) GAAP OID & Repositioning Items Non-GAAP (1) Consolidated Results Net financing revenue 821$ 44$ 865$ 774$ 67$ 841$ 640$ 57$ 697$ Total other revenue 321 - 321 325 (1) 324 386 117 503 Provision for loan losses 137 - 137 140 - 140 131 - 131 Controllable expenses 490 (3) 487 526 (19) 506 578 (22) 556 Other noninterest expenses 223 - 223 358 - 358 380 (74) 307 Pre-tax income (loss) from continuing ops 292$ 47$ 339$ 75$ 86$ 161$ (63)$ 270$ 207$ Mortgage Operations Net financing revenue 14$ -$ 14$ 14$ -$ 14$ 34$ -$ 34$ Gain (loss) on sale of mortgage loans, net - - - 3 - 3 38 - 38 Other revenue (loss) (excluding gain on sale) 4 - 4 3 (1) 2 (57) 117 60 Total net revenue 18 - 18 20 (1) 19 15 117 132 Provision for loan losses (23) - (23) (1) - (1) 20 - 20 Noninterest expense 24 - 24 28 (0) 28 199 (81) 118 Pre-tax income (loss) from continuing ops 17$ -$ 17$ (7)$ (1)$ (8)$ (204)$ 198$ (6)$ Servicing fees - - - 2 (1) 1 63 - 63 Servicing asset valuation, net of hedge - - - - - - (201) 117 (84) Net servicing revenue -$ -$ -$ 2$ (1)$ 1$ (138)$ 117$ (21)$ Insurance Operations Net financing revenue 15$ -$ 15$ 14$ -$ 14$ 12$ -$ 12$ Other revenue (loss) 272 - 272 270 - 270 308 - 308 Total net revenue 287 - 287 284 - 284 320 - 320 Noninterest expense 213 - 213 219 (2) 218 259 - 259 Pre-tax income (loss) from continuing ops 74$ -$ 74$ 65$ 2$ 67$ 61$ -$ 61$ Corporate and Other (incl. CFG) Net financing (loss) (28)$ 44$ 16$ (63) 67$ 4$ (179)$ 57$ (122)$ Total other revenue (loss) (19) - (19) (12) - (12) 15 - 15 Provision for loan losses 1 - 1 (3) - (3) (1) - (1) Noninterest expense 90 (3) 87 118 (18) 100 100 (15) 85 Pre-tax income (loss) from continuing ops (138)$ 47$ (91)$ (190)$ 85$ (105)$ (263)$ 72$ (191)$ 1Q 14 4Q 13 1Q 13
25 1Q 2014 Preliminary Results Notes on non - GAAP and other financial measures Supplemental 1) Core pre - tax income (loss) is a non - GAAP financial measure. It is defined as income (loss) from continuing operations before taxes and primarily bond exchange original issue discount ("OID") amortization expense . 2) Repositioning items for 1Q14 are primarily employee costs related to the disposition of certain businesses. 3) Repositioning items for 4Q13 are primarily related to employee related costs associated with strategic actions of the company and the disposition of certa in businesses. 4) Repositioning items for 1Q13 are primarily related to a valuation write - down resulting from the MSR sale agreements and for other expenses related to the ResCap bankruptcy and disposition of our International Operations. 5) ROTCE is equal to GAAP Net I ncome A vailable to Common S hareholders divided by a two period average of Tangible C ommon Equity. See pages 4 and 16 in the Financial Supplement for more detail. 6) Core ROTCE is equal to Operating Net Income Available to Common divided by Normalized Common Equity. See page 22 in the Financial Supplement for full calculation . A. Operating Net Income Available to Common is calculated as (a) Pre - Tax Income from Continuing Operations minus (b) Income Tax Expense using a normalized 34% rate plus (c) expense associated with original issue bond discount amortization minus (d) preferred dividends associated with our Series A and Series G preferred stock plus (e) impact of any disclosed repositioning items . B. Normalized Common Equity is calculated as the two period average of (a) shareholder equity minus (b) the book value of preferred stock outstanding minus (c) goodwill and other intangibles minus (d) remaining original issue bond discount minus (e) remaining net deferred tax asset. 7) Adjusted Efficiency ratio is equal to (A) total noninterest expense less ( i ) Insurance operating segment related expenses, (ii) mortgage repurchase expense and (iii) expense related to repositioning items divided by ( B) total net revenue less ( i ) Insurance operating segment related revenue, (ii) OID amortization expense and (iii) any revenue related to repositioning items . See page 22 in the Financial Supplement for full calculation. 8) Corporate and Other primarily consists of Ally’s centralized treasury activities, the residual impacts of the company’s corporate funds transfer pri cing and asset liability management activities, and the amortization of the discount associated with debt issuances and bond exchanges . C orporate and Other also includes the Ally Corporate Finance business, certain equity investments and reclassifications, eliminations between the repo rta ble operating segments, and overhead previously allocated to operations that have since been sold or discontinued. 9) Controllable expenses include employee related costs, consulting and legal fees, marketing, information technology, facility, portfolio servicing a nd restructuring expenses. 10) U.S. consumer auto originations ▪ New Subvented – subvented rate new vehicle loans from GM and Chrysler dealers ▪ New Standard – standard rate new vehicle loans from GM and Chrysler dealers ▪ New Diversified – new vehicle loans from non - GM/Chrysler dealers ▪ Lease – new vehicle lease originations from all dealers ▪ Used – used vehicle loans from all dealers 11) Net charge - off ratios are calculated as annualized net charge - offs divided by average outstanding finance receivables and loans excluding loans measur ed at fair value and loans held - for - sale .