Exhibit 99.2

Ally Financial Inc. 3 Q Earnings Review Contact Ally Investor Relations at (866) 710 - 4623 or investor.relations@ally.com October 29, 2014
2 3Q 2014 Preliminary Results Forward - Looking Statements and Additional Information The following should be read in conjunction with the financial statements, notes and other information contained in the Compa ny’ s Annual Reports on Form 10 - K, Quarterly Reports on Form 10 - Q, and Current Reports on Form 8 - K . This information is preliminary and based on company data available at the time of the presentation In the presentation that follows and related comments by Ally Financial Inc. (“Ally”) management, the use of the words “expec t,” “anticipate,” “estimate,” “forecast,” “initiative,” “objective,” “plan,” “goal,” “project,” “outlook,” “priorities,” “target,” “explore,” “ pos itions,” “intend,” “evaluate,” “pursue,” “seek,” “may,” “would, ” “could, ” “should, ” “believe, ” “potential, ” “continue,” or the negative of these words, or similar expressions is intended to identify forward - looking statements. All statements herein and in related management comments, other than statements of historical fact, including without limitation, statements about future events and financial performance, are forward - looking statements tha t involve certain risks and uncertainties. While these statements represent our current judgment on what the future may hold, and we believe th ese judgments are reasonable, these statements are not guarantees of any events or financial results, and Ally’s actual results may differ mate ria lly due to numerous important factors that are described in the most recent reports on SEC Forms 10 - K and 10 - Q for Ally, each of which may be revise d or supplemented in subsequent reports filed with the SEC. Such factors include, among others, the following: maintaining the mut ual ly beneficial relationship between Ally and General Motors (“GM”), and Ally and Chrysler Group LLC (“Chrysler”); our ability to maintain relationships with automotive dealers; our ability to realize the anticipated benefits associated with being a financial holding company, and the significant regula tio n and restrictions that we are now subject to; the potential for deterioration in the residual value of off - lease vehicles; disrup tions in the market in which we fund our operations, with resulting negative impact on our liquidity; changes in our accounting assumptions that may re quire or that result from changes in the accounting rules or their application, which could result in an impact on earnings; changes in the cr edit ratings of Ally, Chrysler, or GM; changes in economic conditions, currency exchange rates or political stability in the markets in which we op era te; and changes in the existing or the adoption of new laws, regulations, policies or other activities of governments, agencies and similar orga niz ations (including as a result of the Dodd - Frank Act and Basel III). Investors are cautioned not to place undue reliance on forward - looking statements. Ally undertakes no obligation to update publi cly or otherwise revise any forward - looking statements, whether as a result of new information, future events or other such factors that affect t he subject of these statements, except where expressly required by law. Reconciliation of non - GAAP financial measures included within this presentat ion are provided in this presentation. Use of the term “loans” describes products associated with direct and indirect lending activities of Ally’s operations. The s pec ific products include retail installment sales contracts, lines of credit, leases or other financing products. The term “originate” refers to Ally’ s p urchase, acquisition or direct origination of various “loan” products.
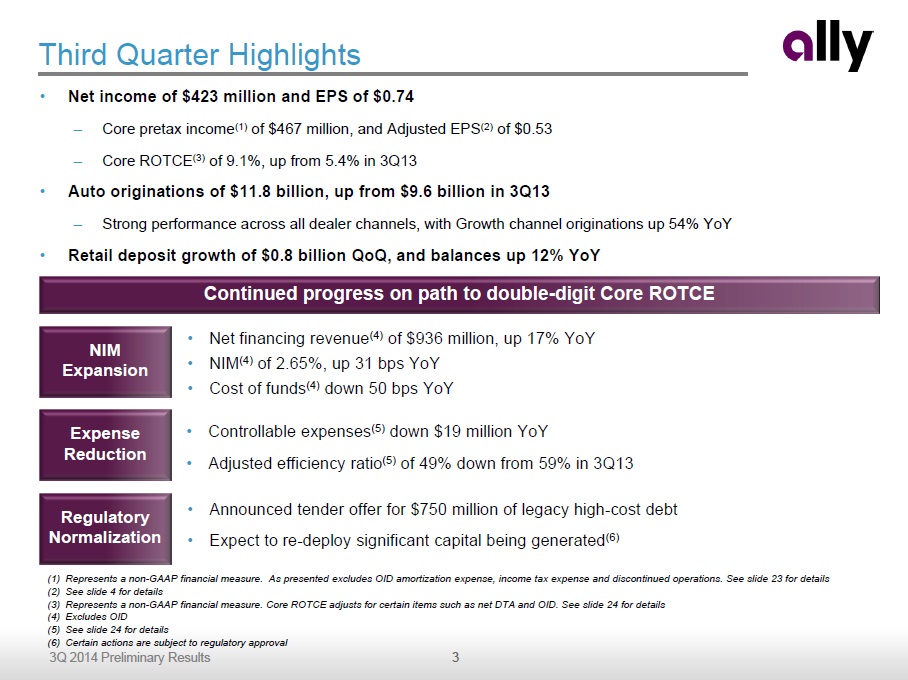
3 3Q 2014 Preliminary Results Third Quarter Highlights • Net income of $423 million and EPS of $0.74 – Core pretax income (1) of $467 million, and Adjusted EPS (2) of $0.53 – Core ROTCE (3 ) of 9.1%, up from 5.4% in 3Q13 • Auto originations of $11.8 billion, up from $9.6 billion in 3Q13 – Strong performance across all dealer channels, with Growth channel originations up 54% YoY • Retail deposit growth of $0.8 billion QoQ , and balances up 12% YoY (1) Represents a non - GAAP financial measure. As presented excludes OID amortization expense, income tax expense and discontinued operations. See slide 23 for details (2) See slide 4 for details (3) Represents a non - GAAP financial measure. Core ROTCE adjusts for certain items such as net DTA and OID. See slide 24 for details (4) Excludes OID (5) See slide 24 for details (6) Certain actions are subject to regulatory approval NIM Expansion Expense Reduction Regulatory Normalization • Net financing revenue (4) of $936 million, up 17% YoY • NIM (4) of 2.65%, up 31 bps YoY • Cost of funds (4) down 50 bps YoY • Controllable expenses (5) down $19 million YoY • Adjusted efficiency ratio (5) of 49% down from 59% in 3Q13 • Announced tender offer for $750 million of legacy high - cost debt • Expect to re - deploy significant capital being generated (6) Continued progress on path to double - digit Core ROTCE
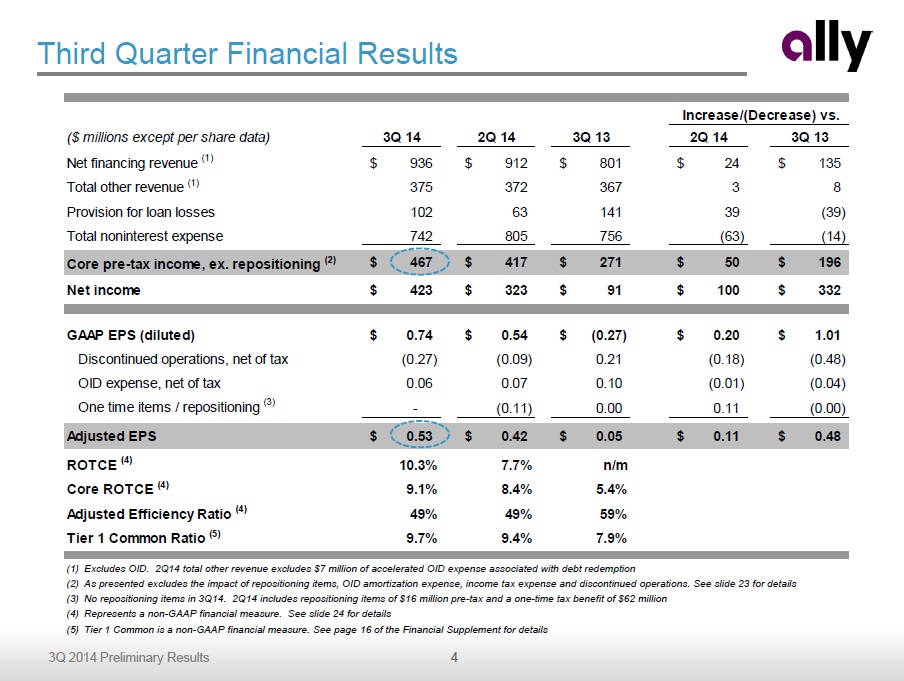
4 3Q 2014 Preliminary Results ($ millions except per share data) 3Q 14 2Q 14 3Q 13 2Q 14 3Q 13 Net financing revenue (1) 936$ 912$ 801$ 24$ 135$ Total other revenue (1) 375 372 367 3 8 Provision for loan losses 102 63 141 39 (39) Total noninterest expense 742 805 756 (63) (14) Core pre-tax income, ex. repositioning (2) 467$ 417$ 271$ 50$ 196$ Net income 423$ 323$ 91$ 100$ 332$ GAAP EPS (diluted) 0.74$ 0.54$ (0.27)$ 0.20$ 1.01$ Discontinued operations, net of tax (0.27) (0.09) 0.21 (0.18) (0.48) OID expense, net of tax 0.06 0.07 0.10 (0.01) (0.04) One time items / repositioning (3) - (0.11) 0.00 0.11 (0.00) Adjusted EPS 0.53$ 0.42$ 0.05$ 0.11$ 0.48$ ROTCE (4) 10.3% 7.7% n/m Core ROTCE (4) 9.1% 8.4% 5.4% Adjusted Efficiency Ratio (4) 49% 49% 59% Tier 1 Common Ratio (5) 9.7% 9.4% 7.9% Increase/(Decrease) vs. Third Quarter Financial Results (1) Excludes OID. 2Q14 total other revenue excludes $7 million of accelerated OID expense associated with debt redemption (2) A s presented excludes the impact of repositioning items, OID amortization expense, income tax expense and discontinued operati ons . See slide 23 for details (3) No repositioning items in 3Q14. 2Q14 includes repositioning items of $16 million pre - tax and a one - time tax benefit of $62 million (4) Represents a non - GAAP financial measure . See slide 24 for details (5) Tier 1 Common is a non - GAAP financial measure. See page 16 of the Financial Supplement for details
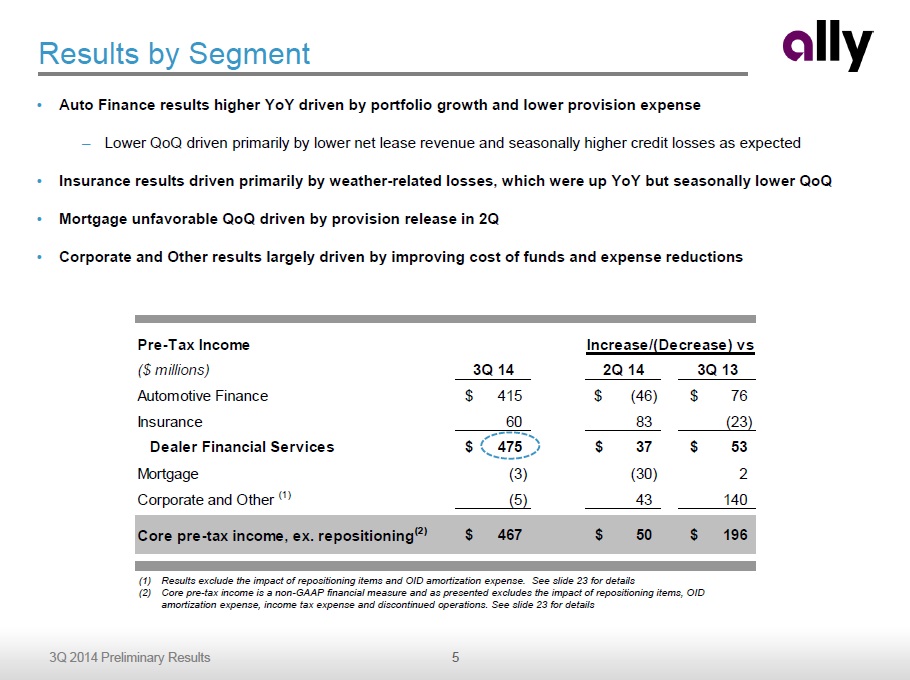
5 3Q 2014 Preliminary Results Pre-Tax Income ($ millions) 3Q 14 2Q 14 3Q 13 Automotive Finance 415$ (46)$ 76$ Insurance 60 83 (23) Dealer Financial Services 475$ 37$ 53$ Mortgage (3) (30) 2 Corporate and Other (1) (5) 43 140 Core pre-tax income, ex. repositioning (2) 467$ 50$ 196$ Increase/(Decrease) vs. Results by Segment (1) Results exclude the impact of repositioning items and OID amortization expense. See slide 23 for details (2) Core pre - tax income is a non - GAAP financial measure and as presented excludes the impact of repositioning items, OID amortization expense, income tax expense and discontinued operations. See slide 23 for details • Auto Finance results higher YoY driven by portfolio growth and lower provision expense – Lower QoQ driven primarily by lower net lease revenue and seasonally higher credit losses as expected • Insurance results driven primarily by weather - related losses, which were up YoY but seasonally lower QoQ • Mortgage unfavorable QoQ driven by provision release in 2Q • Corporate and Other results largely driven by improving cost of funds and expense reductions
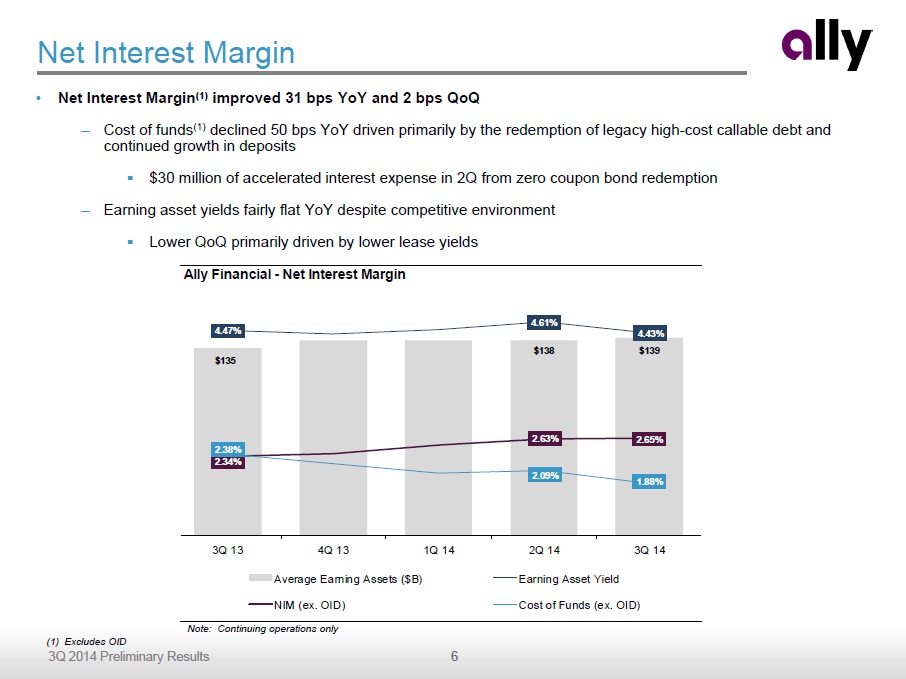
6 3Q 2014 Preliminary Results Net Interest Margin • Net Interest Margin (1) improved 31 bps YoY and 2 bps QoQ – Cost of funds (1) declined 50 bps YoY driven primarily by the redemption of legacy high - cost callable debt and continued growth in deposits ▪ $30 million of accelerated interest expense in 2Q from zero coupon bond redemption – Earning asset yields fairly flat YoY despite competitive environment ▪ Lower QoQ primarily driven by lower lease yields Note: Continuing operations only (1) Excludes OID Ally Financial - Net Interest Margin $135 $138 $139 4.47% 4.61% 4.43% 2.34% 2.63% 2.65% 2.38% 2.09% 1.88% 3Q 13 4Q 13 1Q 14 2Q 14 3Q 14 Average Earning Assets ($B) Earning Asset Yield NIM (ex. OID) Cost of Funds (ex. OID)
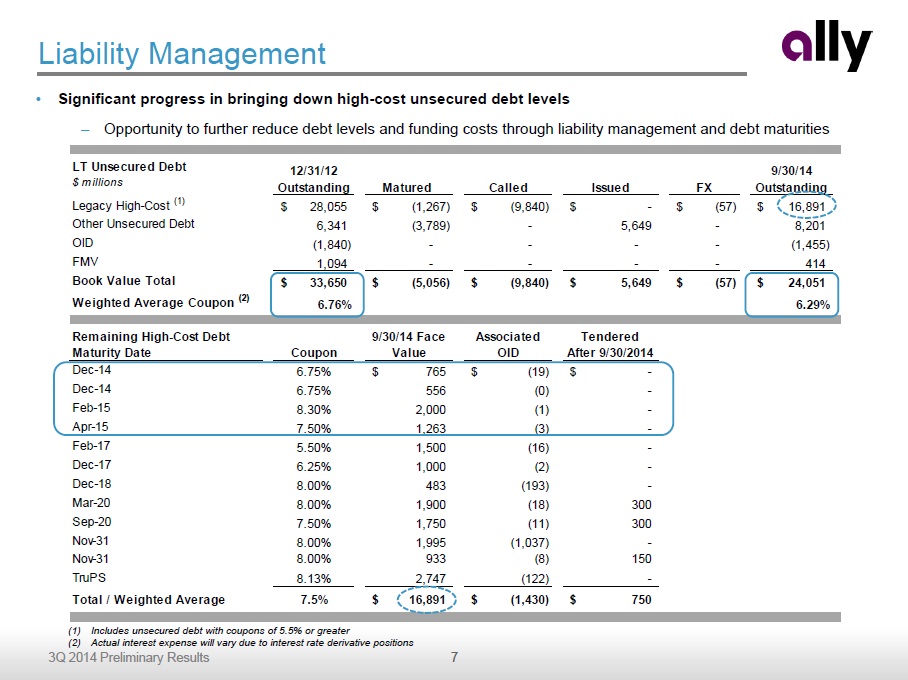
7 3Q 2014 Preliminary Results LT Unsecured Debt $ millions 12/31/12 Outstanding Matured Called Issued FX 9/30/14 Outstanding Legacy High-Cost (1) 28,055$ (1,267)$ (9,840)$ -$ (57)$ 16,891$ Other Unsecured Debt 6,341 (3,789) - 5,649 - 8,201 OID (1,840) - - - - (1,455) FMV 1,094 - - - - 414 Book Value Total 33,650$ (5,056)$ (9,840)$ 5,649$ (57)$ 24,051$ Weighted Average Coupon (2) 6.76% 6.29% Remaining High-Cost Debt Maturity Date Coupon 9/30/14 Face Value Associated OID Tendered After 9/30/2014 Dec-14 6.75% 765$ (19)$ -$ Dec-14 6.75% 556 (0) - Feb-15 8.30% 2,000 (1) - Apr-15 7.50% 1,263 (3) - Feb-17 5.50% 1,500 (16) - Dec-17 6.25% 1,000 (2) - Dec-18 8.00% 483 (193) - Mar-20 8.00% 1,900 (18) 300 Sep-20 7.50% 1,750 (11) 300 Nov-31 8.00% 1,995 (1,037) - Nov-31 8.00% 933 (8) 150 TruPS 8.13% 2,747 (122) - Total / Weighted Average 7.5% 16,891$ (1,430)$ 750$ Liability Management • Significant progress in bringing down high - cost unsecured debt levels – Opportunity to further reduce debt levels and funding costs through liability management and debt maturities (1) Includes unsecured debt with coupons of 5.5% or greater (2) Actual interest expense will vary due to interest rate derivative positions

8 3Q 2014 Preliminary Results Ally Bank Deposit Levels ($ billions) $41.7 $43.2 $45.2 $45.9 $46.7 $51.4 $52.8 $54.9 $55.6 $56.4 3Q 13 4Q 13 1Q 14 2Q 14 3Q 14 Ally Bank Retail Ally Bank Brokered Ally Bank Deposit Franchise • Continued franchise momentum with nearly $47 billion of retail deposits • $0.8 billion of retail deposit growth QoQ , with balances up 12% YoY – Growth continues to be driven largely by savings products • Deposit noninterest expenses have declined despite growing deposit base • Focus on continuing to build on strong franchise and brand while improving efficiencies – Ally Bank named 'Best Online Bank' for 4th straight year - MONEY® Magazine 2011 - 2014 – Recognized as ‘Best Online Bank’ by Kiplinger’s Personal Finance – Deployed iOS, Android and Kindle tablet apps • Expansion of loyal customer base with 885 thousand primary customers, up 17% YoY Stable, consistent growth of retail deposits Deposit Mix Ally Bank Deposit Composition and Average Retail Portfolio Interest Rate 19% 18% 18% 17% 17% 45% 45% 43% 42% 41% 36% 37% 39% 40% 41% 1.22% 1.21% 1.19% 1.17% 1.16% 3Q13 4Q13 1Q14 2Q14 3Q14 Brokered Retail CD MMA/OSA/Checking Average Retail Portfolio Interest Rate
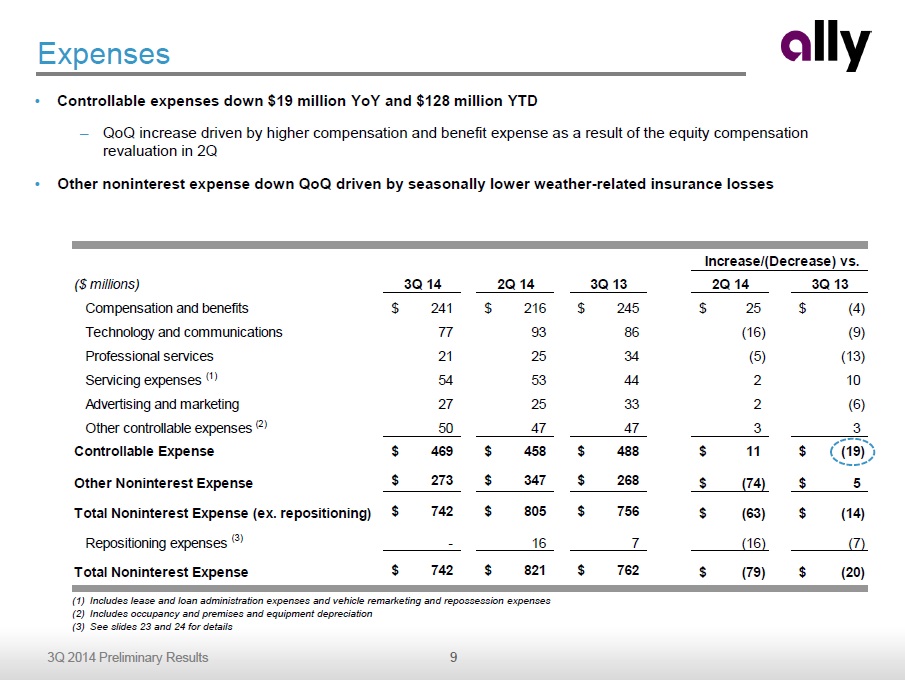
9 3Q 2014 Preliminary Results Expenses • Controllable expenses down $19 million YoY and $128 million YTD – QoQ increase driven by higher compensation and benefit expense as a result of the equity compensation revaluation in 2Q • Other noninterest expense down QoQ driven by seasonally lower weather - related insurance losses (1) Includes lease and loan administration expenses and vehicle remarketing and repossession expenses (2) Includes occupancy and premises and equipment depreciation (3) See slides 23 and 24 for details ($ millions) 3Q 14 2Q 14 3Q 13 2Q 14 3Q 13 Compensation and benefits 241$ 216$ 245$ 25$ (4)$ Technology and communications 77 93 86 (16) (9) Professional services 21 25 34 (5) (13) Servicing expenses (1) 54 53 44 2 10 Advertising and marketing 27 25 33 2 (6) Other controllable expenses (2) 50 47 47 3 3 Controllable Expense 469$ 458$ 488$ 11$ (19)$ Other Noninterest Expense 273$ 347$ 268$ (74)$ 5$ Total Noninterest Expense (ex. repositioning) 742$ 805$ 756$ (63)$ (14)$ Repositioning expenses (3) - 16 7 (16) (7) Total Noninterest Expense 742$ 821$ 762$ (79)$ (20)$ Increase/(Decrease) vs.
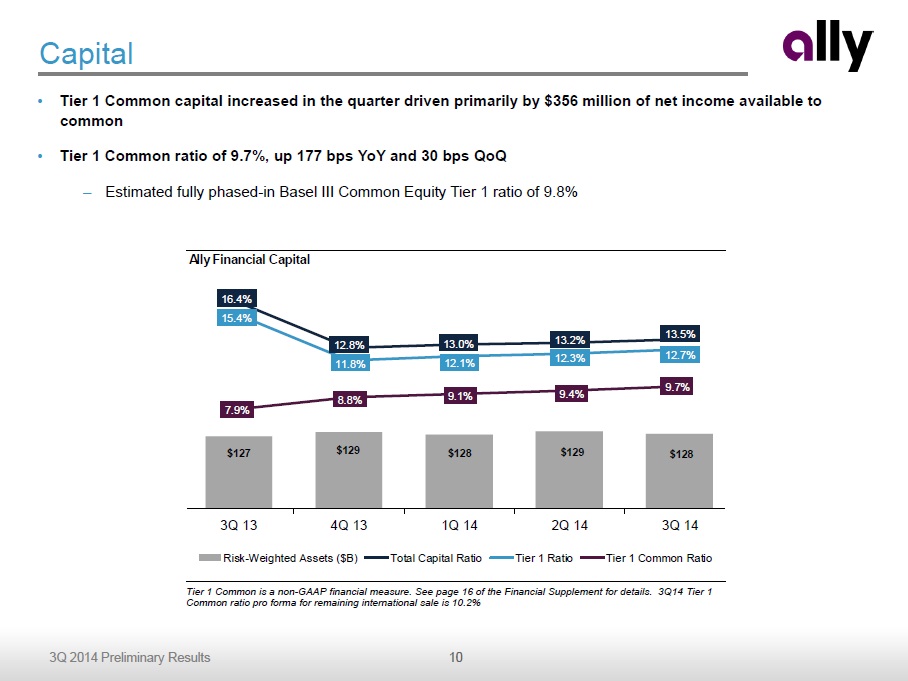
10 3Q 2014 Preliminary Results Capital • Tier 1 Common capital increased in the quarter driven primarily by $356 million of net income available to common • Tier 1 Common ratio of 9.7%, up 177 bps YoY and 30 bps QoQ – Estimated fully phased - in Basel III Common Equity Tier 1 ratio of 9.8% Tier 1 Common is a non - GAAP financial measure. See page 16 of the Financial Supplement for details. 3Q14 Tier 1 Common ratio pro forma for remaining international sale is 10.2% Ally Financial Capital $127 $129 $128 $129 $128 16.4% 12.8% 13.0% 13.2% 13.5% 15.4% 11.8% 12.1% 12.3% 12.7% 7.9% 8.8% 9.1% 9.4% 9.7% 3Q 13 4Q 13 1Q 14 2Q 14 3Q 14 Risk-Weighted Assets ($B) Total Capital Ratio Tier 1 Ratio Tier 1 Common Ratio
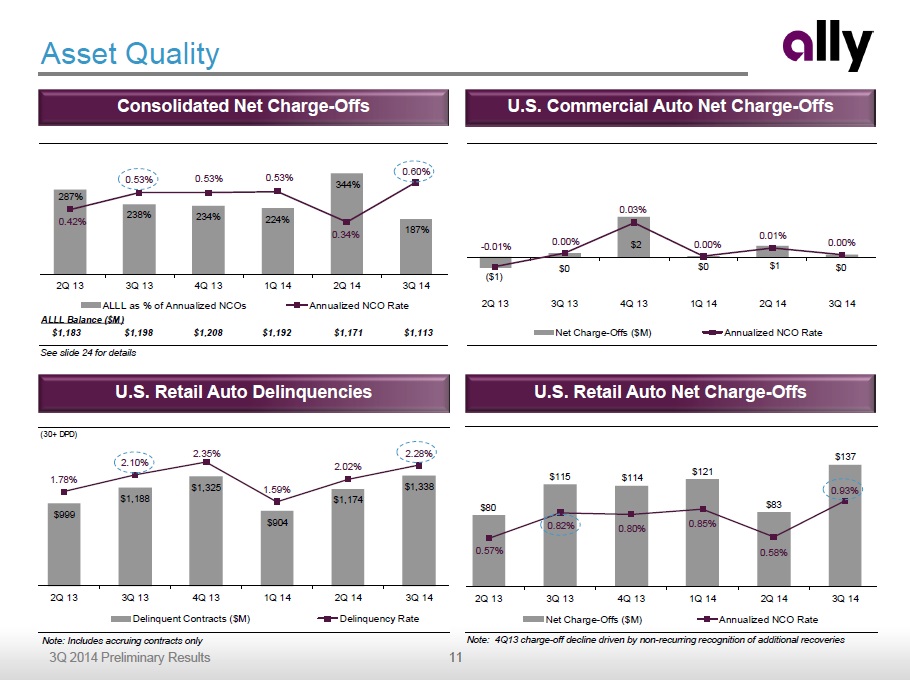
11 3Q 2014 Preliminary Results 287% 238% 234% 224% 344% 187% 0.42% 0.53% 0.53% 0.53% 0.34% 0.60% 2Q 13 3Q 13 4Q 13 1Q 14 2Q 14 3Q 14 ALLL as % of Annualized NCOs Annualized NCO Rate $1,171 $1,192 $1,208 $1,198 $1,183 $1,113 ALLL Balance ($M) (30+ DPD) $999 $1,188 $1,325 $904 $1,174 $1,338 1.78% 2.10% 2.35% 1.59% 2.02% 2.28% 2Q 13 3Q 13 4Q 13 1Q 14 2Q 14 3Q 14 Delinquent Contracts ($M) Delinquency Rate $80 $115 $114 $121 $83 $137 0.57% 0.82% 0.80% 0.85% 0.58% 0.93% 2Q 13 3Q 13 4Q 13 1Q 14 2Q 14 3Q 14 Net Charge-Offs ($M) Annualized NCO Rate Consolidated Net Charge - Offs U.S. Commercial Auto Net Charge - Offs Asset Quality U.S. Retail Auto Net Charge - Offs U.S. Retail Auto Delinquencies See slide 24 for details Note: Includes accruing contracts only ($1) $0 $2 $0 $1 $0 - 0.01% 0.00% 0.03% 0.00% 0.01% 0.00% 2Q 13 3Q 13 4Q 13 1Q 14 2Q 14 3Q 14 Net Charge-Offs ($M) Annualized NCO Rate Note: 4Q13 charge - off decline driven by non - recurring recognition of additional recoveries
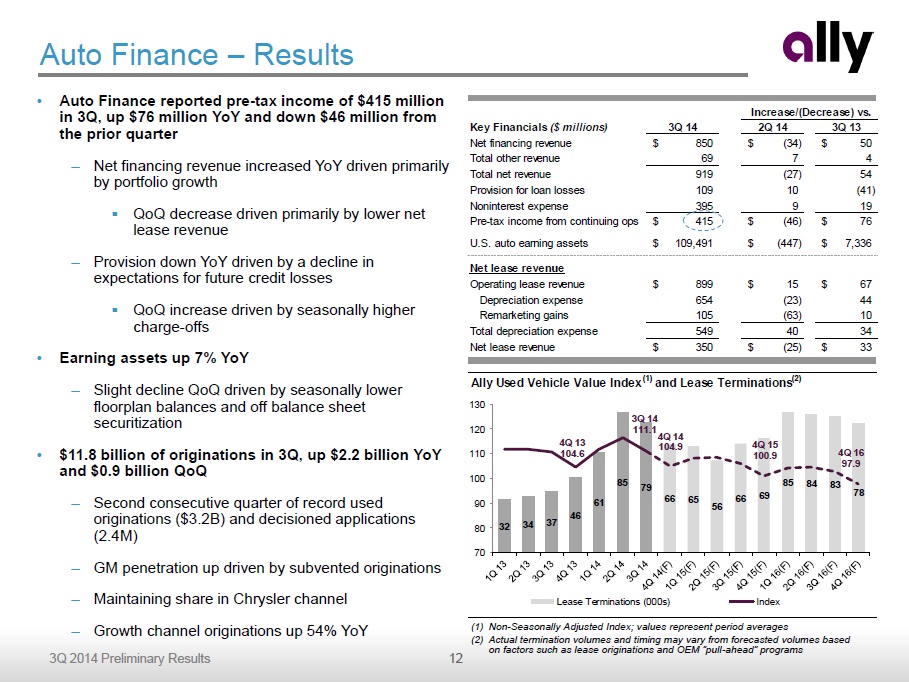
12 3Q 2014 Preliminary Results Key Financials ($ millions) 3Q 14 2Q 14 3Q 13 Net financing revenue 850$ (34)$ 50$ Total other revenue 69 7 4 Total net revenue 919 (27) 54 Provision for loan losses 109 10 (41) Noninterest expense 395 9 19 Pre-tax income from continuing ops 415$ (46)$ 76$ U.S. auto earning assets 109,491$ (447)$ 7,336$ Net lease revenue Operating lease revenue 899$ 15$ 67$ Depreciation expense 654 (23) 44 Remarketing gains 105 (63) 10 Total depreciation expense 549 40 34 Net lease revenue 350$ (25)$ 33$ Increase/(Decrease) vs. • Auto Finance reported pre - tax income of $415 million in 3Q, up $76 million YoY and down $46 million from the prior quarter – Net financing revenue increased YoY driven primarily by portfolio growth ▪ QoQ decrease driven primarily by lower net lease revenue – Provision down YoY driven by a decline in expectations for future credit losses ▪ QoQ increase driven by seasonally higher charge - offs • Earning assets up 7 % YoY – Slight decline QoQ driven by seasonally lower floorplan balances and off balance sheet securitization • $11.8 billion of originations in 3 Q , up $2.2 billion YoY and $0.9 billion QoQ – Second consecutive quarter of record used originations ($3.2B) and decisioned applications (2.4M) – GM penetration up driven by subvented originations – Maintaining share in Chrysler channel – Growth channel originations up 54% YoY Auto Finance – Results (1) Non - Seasonally Adjusted Index; values represent period averages (2) Actual termination volumes and timing may vary from forecasted volumes based on factors such as lease originations and OEM “pull - ahead” programs Ally Used Vehicle Value Index (1) and Lease Terminations (2) 32 34 37 46 61 85 79 66 65 56 66 69 85 84 83 78 4Q 13 104.6 3Q 14 111.1 4Q 14 104.9 4Q 15 100.9 4Q 16 97.9 0 10 20 30 40 50 60 70 80 90 70 80 90 100 110 120 130 Lease Terminations (000s) Index
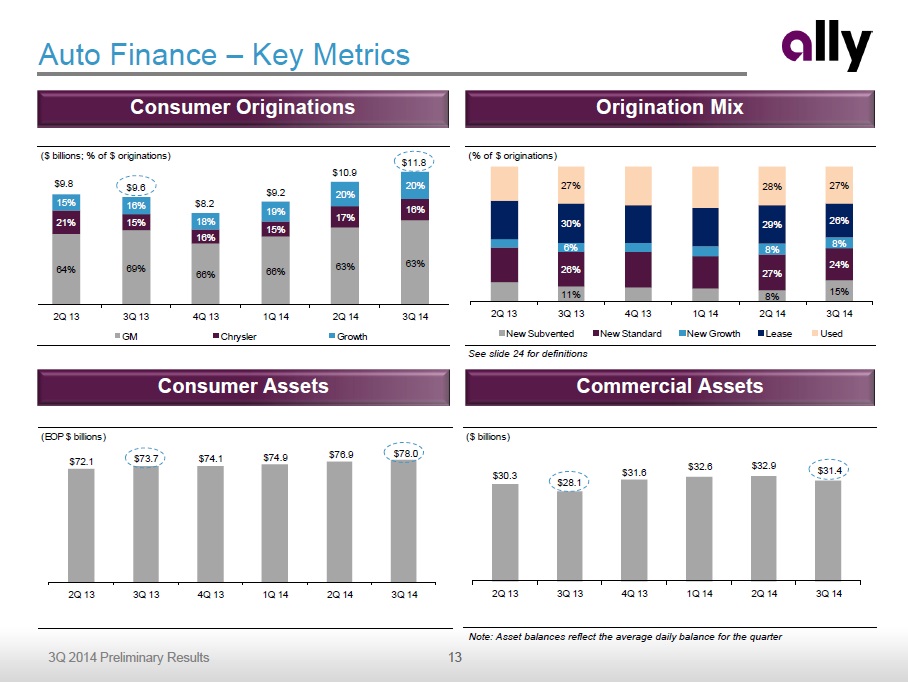
13 3Q 2014 Preliminary Results ($ billions; % of $ originations) 64% 69% 66% 66% 63% 63% 21% 15% 16% 15% 17% 16% 15% 16% 18% 19% 20% 20% $9.8 $9.6 $8.2 $9.2 $10.9 $11.8 2Q 13 3Q 13 4Q 13 1Q 14 2Q 14 3Q 14 GM Chrysler Growth (EOP $ billions) $72.1 $73.7 $74.1 $74.9 $76.9 $78.0 2Q 13 3Q 13 4Q 13 1Q 14 2Q 14 3Q 14 Auto Finance – Key Metrics See slide 24 for definitions Consumer Assets Commercial Assets Consumer Originations Origination Mix Note: Asset balances reflect the average daily balance for the quarter ($ billions) $30.3 $28.1 $31.6 $32.6 $32.9 $31.4 2Q 13 3Q 13 4Q 13 1Q 14 2Q 14 3Q 14 (% of $ originations) 11% 8% 15% 26% 27% 24% 6% 8% 8% 30% 29% 26% 27% 28% 27% 0% 25% 50% 75% 100% 2Q 13 3Q 13 4Q 13 1Q 14 2Q 14 3Q 14 New Subvented New Standard New Growth Lease Used
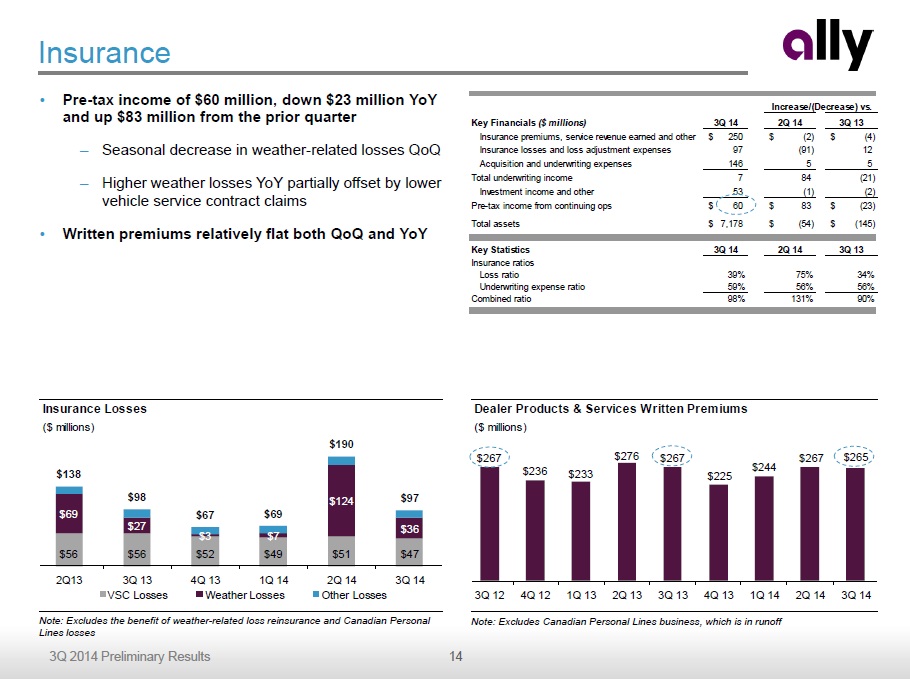
14 3Q 2014 Preliminary Results Key Financials ($ millions) 3Q 14 2Q 14 3Q 13 Insurance premiums, service revenue earned and other 250$ (2)$ (4)$ Insurance losses and loss adjustment expenses 97 (91) 12 Acquisition and underwriting expenses 146 5 5 Total underwriting income 7 84 (21) Investment income and other 53 (1) (2) Pre-tax income from continuing ops 60$ 83$ (23)$ Total assets 7,178$ (54)$ (145)$ Key Statistics 3Q 14 2Q 14 3Q 13 Insurance ratios Loss ratio 39% 75% 34% Underwriting expense ratio 59% 56% 56% Combined ratio 98% 131% 90% Increase/(Decrease) vs. Dealer Products & Services Written Premiums ($ millions) $267 $236 $233 $276 $267 $225 $244 $267 $265 3Q 12 4Q 12 1Q 13 2Q 13 3Q 13 4Q 13 1Q 14 2Q 14 3Q 14 Insurance • Pre - tax income of $60 million, down $23 million YoY and up $83 million from the prior quarter – Seasonal decrease in weather - related losses QoQ – Higher weather losses YoY partially offset by lower vehicle service contract claims • Written premiums relatively flat both QoQ and YoY Note: Excludes Canadian Personal Lines business, which is in runoff Note: Excludes the benefit of weather - related loss reinsurance and Canadian Personal Lines losses Insurance Losses ($ millions) $56 $56 $52 $49 $51 $47 $69 $27 $3 $7 $124 $36 $138 $98 $67 $69 $190 $97 2Q13 3Q 13 4Q 13 1Q 14 2Q 14 3Q 14 VSC Losses Weather Losses Other Losses
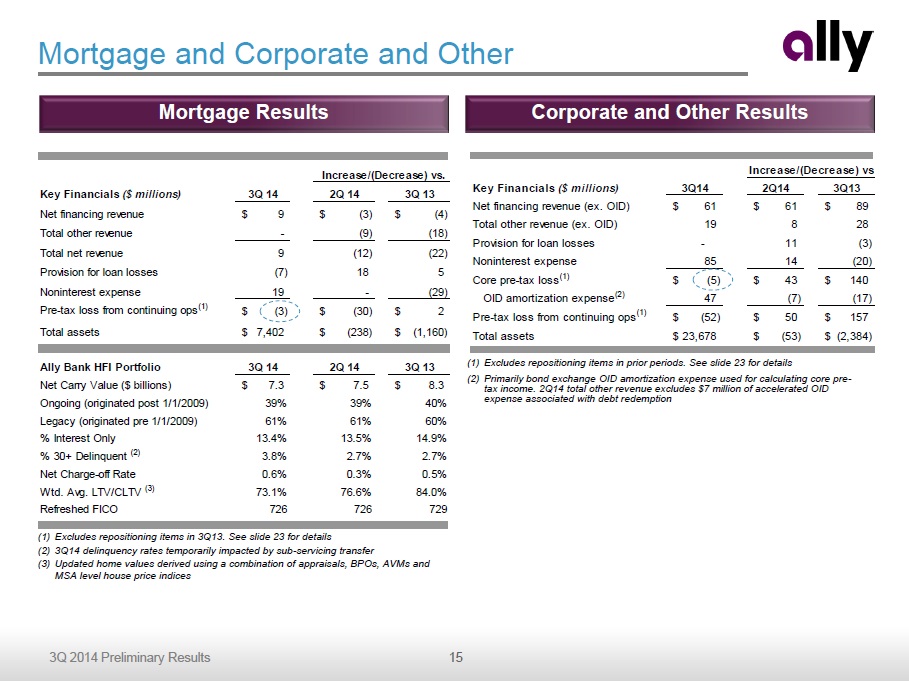
15 3Q 2014 Preliminary Results Key Financials ($ millions) 3Q14 2Q14 3Q13 Net financing revenue (ex. OID) 61$ 61$ 89$ Total other revenue (ex. OID) 19 8 28 Provision for loan losses - 11 (3) Noninterest expense 85 14 (20) Core pre-tax loss (1) (5)$ 43$ 140$ OID amortization expense (2) 47 (7) (17) Pre-tax loss from continuing ops (1) (52)$ 50$ 157$ Total assets 23,678$ (53)$ (2,384)$ Increase/(Decrease) vs. Key Financials ($ millions) 3Q 14 2Q 14 3Q 13 Net financing revenue 9$ (3)$ (4)$ Total other revenue - (9) (18) Total net revenue 9 (12) (22) Provision for loan losses (7) 18 5 Noninterest expense 19 - (29) Pre-tax loss from continuing ops (1) (3)$ (30)$ 2$ Total assets 7,402$ (238)$ (1,160)$ Ally Bank HFI Portfolio 3Q 14 2Q 14 3Q 13 Net Carry Value ($ billions) 7.3$ 7.5$ 8.3$ Ongoing (originated post 1/1/2009) 39% 39% 40% Legacy (originated pre 1/1/2009) 61% 61% 60% % Interest Only 13.4% 13.5% 14.9% % 30+ Delinquent (2) 3.8% 2.7% 2.7% Net Charge-off Rate 0.6% 0.3% 0.5% Wtd. Avg. LTV/CLTV (3) 73.1% 76.6% 84.0% Refreshed FICO 726 726 729 Increase/(Decrease) vs. Mortgage and Corporate and Other (1) Excludes repositioning items in 3Q13. See slide 23 for details (2) 3Q14 delinquency rates temporarily impacted by sub - servicing transfer (3) Updated home values derived using a combination of appraisals, BPOs, AVMs and MSA level house price indices Mortgage Results (1) Excludes repositioning items in prior periods. See slide 23 for details (2) Primarily bond exchange OID amortization expense used for calculating core pre - tax income . 2Q14 total other revenue excludes $7 million of accelerated OID expense associated with debt redemption Corporate and Other Results
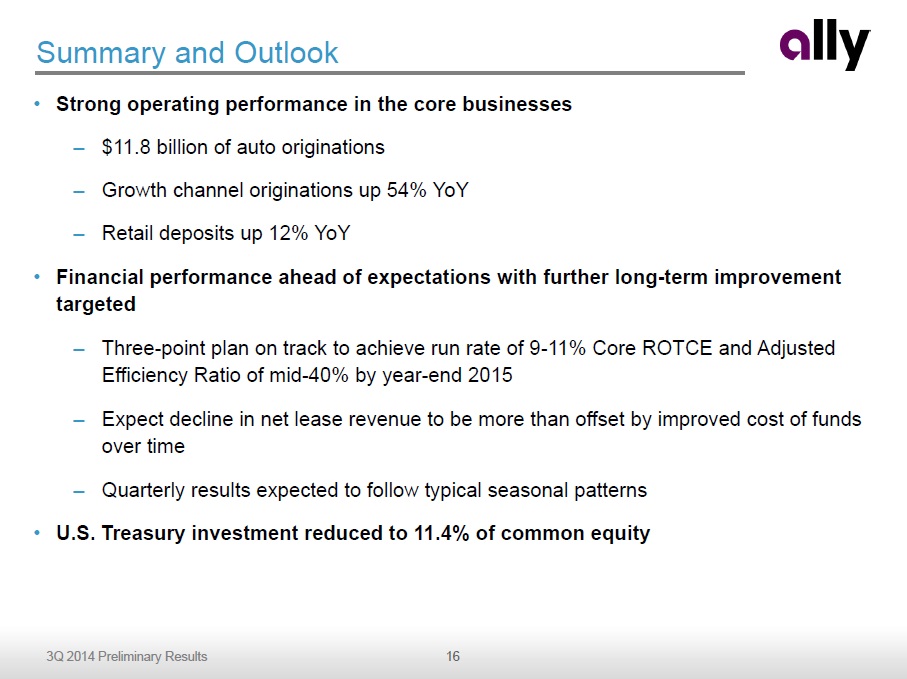
16 3Q 2014 Preliminary Results Summary and Outlook • Strong operating performance in the core businesses – $ 11.8 billion of auto originations – Growth channel originations up 54% YoY – Retail deposits up 12% YoY • Financial performance ahead of expectations with further long - term improvement targeted – Three - point plan on track to achieve run rate of 9 - 11% Core ROTCE and Adjusted Efficiency Ratio of mid - 40 % by year - end 2015 – Expect decline in net lease revenue to be more than offset by improved cost of funds over time – Quarterly results expected to follow typical seasonal patterns • U.S . Treasury investment reduced to 11.4 % of common equity
Supplemental Charts
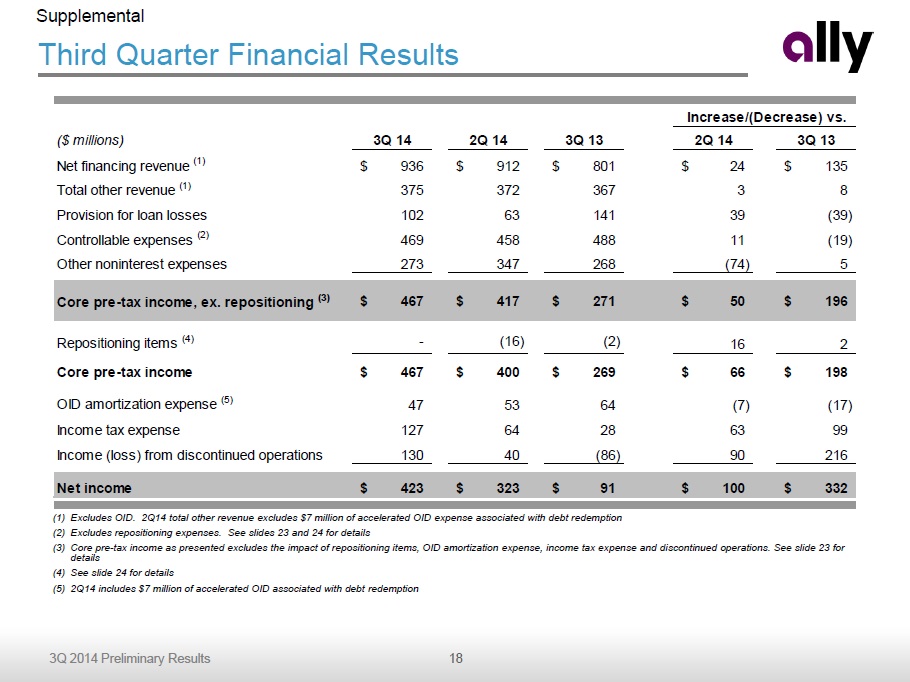
18 3Q 2014 Preliminary Results ($ millions) 3Q 14 2Q 14 3Q 13 2Q 14 3Q 13 Net financing revenue (1) 936$ 912$ 801$ 24$ 135$ Total other revenue (1) 375 372 367 3 8 Provision for loan losses 102 63 141 39 (39) Controllable expenses (2) 469 458 488 11 (19) Other noninterest expenses 273 347 268 (74) 5 Core pre-tax income, ex. repositioning (3) 467$ 417$ 271$ 50$ 196$ Repositioning items (4) - (16) (2) 16 2 Core pre-tax income 467$ 400$ 269$ 66$ 198$ OID amortization expense (5) 47 53 64 (7) (17) Income tax expense 127 64 28 63 99 Income (loss) from discontinued operations 130 40 (86) 90 216 Net income 423$ 323$ 91$ 100$ 332$ Increase/(Decrease) vs. Third Quarter Financial Results (1) Excludes OID. 2Q14 total other revenue excludes $7 million of accelerated OID expense associated with debt redemption (2) Excludes repositioning expenses. See slides 23 and 24 for details (3) Core pre - tax income as presented excludes the impact of repositioning items, OID amortization expense, income tax expense and di scontinued operations. See slide 23 for details (4) See slide 24 for details (5) 2Q14 includes $ 7 million of accelerated OID associated with debt redemption Supplemental

19 3Q 2014 Preliminary Results ($ in millions) Average Outstanding Balance (1) Quarterly Interest Expense Annualized Cost of Funds LT Unsecured Debt 24,586$ 319$ 5.15% Secured Debt 41,528 123 1.18% Other Borrowings (2) 9,171 16 0.69% Deposits 56,376 166 1.17% Total / Weighted Average 131,661$ 624$ 1.88% ($ billions) $3.0 $0.8 $0.0 $1.7 $4.9 $1.9 $4.4 $1.3 1Q 14 2Q 14 3Q 14 4Q 14 2015 2016 2017 2018 Matured Remaining • Diversified funding strategy with opportunities to lower cost of funds – 68% of total assets reside at Ally Bank – Deposits now represent 44% of Ally’s funding • Efficient capital markets funding in 3Q – Completed $3.2 billion of term securitizations at the parent and Ally Bank ▪ Includes $1.6 billion full securitization – $1.0 billion of unsecured issuance Funding As of 9/30/14. Total maturities for 2019 and beyond equal $10.8 billion and do not exceed $4 billion in any given year. Prior periods do not include early debt redemptions Total Asset Breakdown Unsecured Long - Term Debt Maturities Supplemental Liability and Cost of Funds Detail (1) Excludes OID (2) Includes Demand Notes, FHLB, and Repurchase Agreements ($ billions) 61% 65% 66% 68% 68% $150.6 $151.2 $148.5 $149.9 $149.2 3Q 13 4Q 13 1Q 14 2Q 14 3Q 14 Ally Bank Assets Non-Bank Assets

20 3Q 2014 Preliminary Results Liquidity Supplemental (1) Parent company liquidity is defined as our consolidated operations less Ally Bank and the regulated subsidiaries of Ally Insu ran ce’s holding company (2) Includes UST, Agency debt and Agency MBS (3) To optimize the use of cash, Ally Financial lends cash to Ally Bank from time to time under an intercompany loan agreement. Amo unts outstanding on this loan are repayable to Ally Financial at any time, subject to 5 days notice (4) Represents capacity from certain domestic and foreign forward purchase commitments and committed secured facilities that are gen erally reliant upon the origination of future automotive receivables in 2013. As of December 31, 2013, these funding facilities have matured • Consolidated available liquidity of $18.9 billion – $11.4 billion at the parent and $7.5 billion at Ally Bank Available Liquidity 9/30/2014 6/30/2014 9/30/2013 ($ billions) Parent (1) Ally Bank Parent (1) Ally Bank Parent (1) Ally Bank Cash and Cash Equivalents 2.9$ 2.2$ 2.9$ 2.2$ 3.7$ 2.7$ Highly Liquid Securities (2) 2.7 6.1 2.5 6.6 3.2 6.8 Current Committed Unused Capacity 4.5 0.5 3.6 1.0 13.4 1.8 Subtotal 10.1$ 8.8$ 9.0$ 9.8$ 20.3$ 11.3$ Ally Bank Intercompany Loan (3) 1.3 (1.3) 1.7 (1.7) 0.9 (0.9) SubtotalTotal Current Available Liquidity 11.4$ 7.5$ 10.7$ 8.1$ 21.2$ 10.4$ Forward Committed Unused Capacity (4) - - - - 0.8 - Total Available Liquidity 11.4$ 7.5$ 10.7$ 8.1$ 22.0$ 10.4$
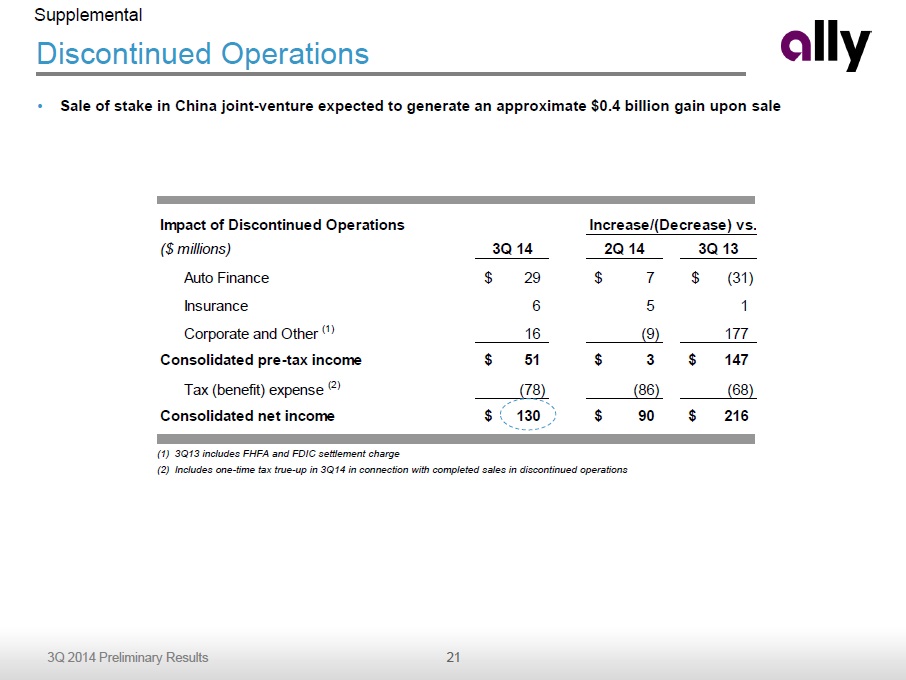
21 3Q 2014 Preliminary Results Impact of Discontinued Operations ($ millions) 3Q 14 2Q 14 3Q 13 Auto Finance 29$ 7$ (31)$ Insurance 6 5 1 Corporate and Other (1) 16 (9) 177 Consolidated pre-tax income 51$ 3$ 147$ Tax (benefit) expense (2) (78) (86) (68) Consolidated net income 130$ 90$ 216$ Increase/(Decrease) vs. Discontinued Operations Supplemental • Sale of stake in China joint - venture expected to generate an approximate $0.4 billion gain upon sale (1) 3Q13 includes FHFA and FDIC settlement charge (2) Includes one - time tax true - up in 3Q14 in connection with completed sales in discontinued operations

22 3Q 2014 Preliminary Results Deferred Tax Asset (1) 2Q14 ($ millions) Gross DTA/(DTL) Balance Valuation Allowance Net DTA/(DTL) Balance Net DTA/(DTL) Balance Net Operating Loss (Federal) 798$ -$ 798$ 885$ Capital Loss (Federal) 354 354 - - Tax Credit Carryforwards 1,915 496 1,419 1,346 State/Local Tax Carryforwards 278 136 141 153 Other Deferred Tax Assets/(Liabilities) (2) (568) 3 (571) (559) Net Deferred Tax Assets 2,777$ 989$ 1,788$ 1,825$ 3Q14 Deferred Tax Asset Supplemental (1) U.S. GAAP does not prescribe a method for calculating individual elements of deferred taxes for interim periods. Therefore, these ba lances are estimated (2) Primarily book / tax timing differences • DTA utilization resulted in approximately $12 million of cash taxes paid YTD

23 3Q 2014 Preliminary Results Notes on non - GAAP and other financial measures Supplemental (1) Represents core pre - tax income excluding repositioning items. See slide 24 for definitions $ in millions GAAP OID & Repositioning Items Non-GAAP (1) GAAP OID & Repositioning Items Non-GAAP (1) GAAP OID & Repositioning Items Non-GAAP (1) Consolidated Results Net financing revenue 889$ 47$ 936$ 866$ 46$ 912$ 737$ 64$ 801$ Total other revenue 375 - 375 365 7 372 371 (4) 367 Provision for loan losses 102 - 102 63 - 63 141 - 141 Controllable expenses 469 - 469 455 3 458 494 (6) 488 Other noninterest expenses 273 - 273 366 (19) 347 268 (1) 268 Pre-tax income (loss) from continuing ops 420$ 47$ 467$ 347$ 70$ 417$ 205$ 66$ 271$ Mortgage Operations Net financing revenue 9$ -$ 9$ 12$ -$ 12$ 13$ -$ 13$ Gain (loss) on sale of mortgage loans, net - - - 6 - 6 15 - 15 Other revenue (loss) (excluding gain on sale) - - - 3 - 3 4 (1) 3 Total net revenue 9 - 9 21 - 21 32 (1) 31 Provision for loan losses (7) - (7) (25) - (25) (12) - (12) Noninterest expense 19 - 19 19 - 19 48 - 48 Pre-tax income (loss) from continuing ops (3)$ -$ (3)$ 27$ -$ 27$ (4)$ (1)$ (5)$ Corporate and Other (incl. CF) Net financing (loss) 14$ 47$ 61$ (46)$ 46$ 0$ (92)$ 64$ (28)$ Total other revenue (loss) 19 - 19 4 7 11 (6) (3) (9) Provision for loan losses - - - (11) - (11) 3 - 3 Noninterest expense 85 - 85 87 (16) 71 112 (7) 105 Pre-tax income (loss) from continuing ops (52)$ 47$ (5)$ (118)$ 70$ (48)$ (213)$ 67$ (146)$ 3Q 14 2Q 14 3Q 13

24 3Q 2014 Preliminary Results Notes on non - GAAP and other financial measures Supplemental 1) Core pre - tax income (loss) is a non - GAAP financial measure. It is defined as income (loss) from continuing operations before income tax expense and primarily bond exchange original issue discount ("OID") amortization expense . 2) Repositioning items for 2Q14 are primarily related to Ally’s Initial Public Offering. 3) Repositioning items for 3Q13 are primarily related to exiting non - strategic mortgage activities. 4) ROTCE is equal to GAAP Net I ncome A vailable to Common S hareholders divided by a two period average of Tangible C ommon Equity. See pages 4 and 16 in the Financial Supplement for more detail. 5) Core ROTCE is equal to Operating Net Income Available to Common divided by Normalized Common Equity. See page 22 in the Financial Supplement for full calculation . A. Operating Net Income Available to Common is calculated as (a) Pre - Tax Income from Continuing Operations minus (b) Income Tax Expense using a normalized 34% rate plus (c) expense associated with original issue bond discount amortization minus (d) preferred dividends associated with our Series A and Series G preferred stock plus (e) impact of any disclosed repositioning items . B. Normalized Common Equity is calculated as the two period average of (a) shareholder equity minus (b) the book value of preferred stock outstanding minus (c) goodwill and other intangibles minus (d) remaining original issue bond discount minus (e) remaining net deferred tax asset. 6) Adjusted Efficiency Ratio is equal to (A) total noninterest expense less ( i ) Insurance operating segment related expenses, (ii) mortgage repurchase expense and (iii) expense related to repositioning items divided by ( B) total net revenue less ( i ) Insurance operating segment related revenue, (ii) OID amortization expense and (iii) any revenue related to repositioning items . See page 22 in the Financial Supplement for full calculation. 7) Corporate and Other primarily consists of Ally’s centralized treasury activities, the residual impacts of the company’s corporate funds transfer pri cing and asset liability management activities, and the amortization of the discount associated with debt issuances and bond exchanges . C orporate and Other also includes the Ally Corporate Finance business, certain equity investments and reclassifications, eliminations between the repo rta ble operating segments, and overhead previously allocated to operations that have since been sold or discontinued. 8) Controllable expenses include employee related costs, consulting and legal fees, marketing, information technology, facility, portfolio servicing a nd restructuring expenses. 9) U.S. consumer auto originations ▪ New Subvented – subvented rate new vehicle loans from GM and Chrysler dealers ▪ New Standard – standard rate new vehicle loans from GM and Chrysler dealers ▪ Lease – new vehicle lease originations from all dealers ▪ Used – used vehicle loans from all dealers ▪ Growth – total originations from non - GM/Chrysler dealers (New Growth refers to new vehicle loan originations only) 10) Net charge - off ratios are calculated as annualized net charge - offs divided by average outstanding finance receivables and loans excluding loans measur ed at fair value and loans held - for - sale .