Exhibit 99.2

Ally Financial Inc. 4Q 2015 Earnings Review Contact Ally Investor Relations at (866) 710 - 4623 or investor.relations@ally.com February 2, 2016
2 4Q 2015 Preliminary Results Forward - Looking Statements and Additional Information The following should be read in conjunction with the financial statements, notes and other information contained in the Compa ny’ s Annual Reports on Form 10 - K, Quarterly Reports on Form 10 - Q, and Current Reports on Form 8 - K . This information is preliminary and based on company data available at the time of the presentation In the presentation that follows and related comments by Ally Financial Inc. (“Ally”) management, the use of the words “expec t,” “anticipate,” “estimate,” “forecast,” “initiative,” “objective,” “plan,” “goal,” “project,” “outlook,” “priorities,” “target,” “explore,” “ pos itions,” “intend,” “evaluate,” “pursue,” “seek,” “may,” “would, ” “could, ” “should, ” “believe, ” “potential, ” “continue,” or the negative of these words, or similar expressions is intended to identify forward - looking statements. All statements herein and in related management comments, other than statements of historical fact, including without limitation, statements about future events and financial performance, are forward - looking statements tha t involve certain risks and uncertainties. While these statements represent our current judgment on what the future may hold, and we believe th ese judgments are reasonable, these statements are not guarantees of any events or financial results, and Ally’s actual results may differ mate ria lly due to numerous important factors that are described in the most recent reports on SEC Forms 10 - K and 10 - Q for Ally, each of which may be revise d or supplemented in subsequent reports filed with the SEC. Such factors include, among others, the following: maintaining the mut ual ly beneficial relationship between Ally and General Motors, and Ally and Chrysler and our ability to further diversify our business; our ability to maintain relationships with automotive dealers; the significant regulation and restrictions that we are subject to as a bank holding company and financial holding company; the potential for deterioration in the residual value of off - lease vehicles; disruptions in the market in which we fund our operations, with resulting negative impact on our liquidity; changes in our accounting assumptions that may require or that r esu lt from changes in the accounting rules or their application, which could result in an impact on earnings; changes in our credit ratings; changes in economic conditions, currency exchange rates or political stability in the markets in which we operate; and changes in the existing or th e adoption of new laws, regulations, policies or other activities of governments, agencies and similar organizations (including as a result of the Dodd - Frank Act and Basel III). Investors are cautioned not to place undue reliance on forward - looking statements. Ally undertakes no obligation to update publi cly or otherwise revise any forward - looking statements, whether as a result of new information, future events or other such factors that affect t he subject of these statements, except where expressly required by law. Reconciliation of non - GAAP financial measures included within this presentat ion are provided in this presentation. Use of the term “loans” describes products associated with direct and indirect lending activities of Ally’s operations. The s pec ific products include retail installment sales contracts, lines of credit, leases or other financing products. The term “originate” refers to Ally’ s p urchase, acquisition or direct origination of various “loan” products.
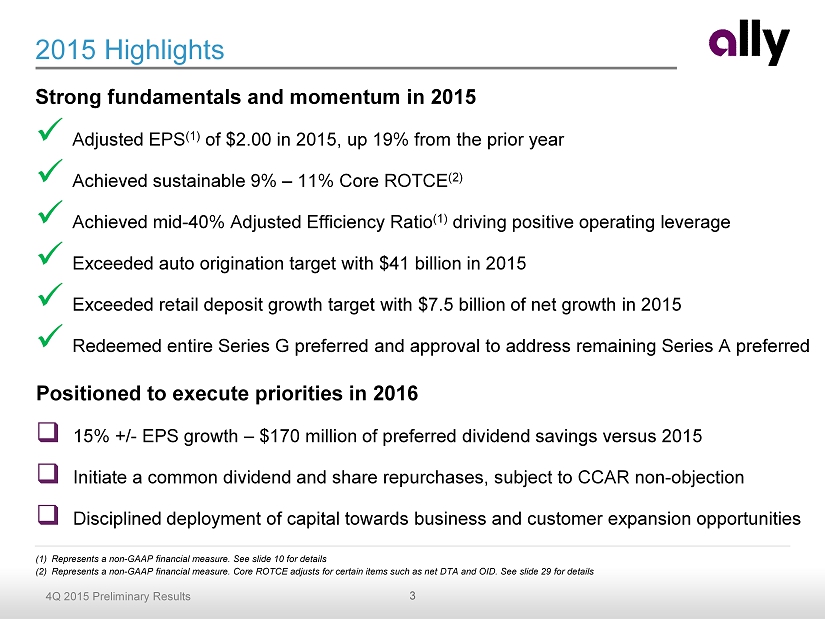
3 4Q 2015 Preliminary Results 2015 Highlights Strong fundamentals and momentum in 2015 x Adjusted EPS (1) of $2.00 in 2015, up 19% from the prior year x Achieved sustainable 9% – 11% Core ROTCE (2) x Achieved mid - 40% Adjusted Efficiency Ratio (1) driving positive operating leverage x Exceeded auto origination target with $41 billion in 2015 x Exceeded retail deposit growth target with $7.5 billion of net growth in 2015 x Redeemed entire Series G preferred and approval to address remaining Series A preferred (1) Represents a non - GAAP financial measure. See slide 10 for details (2) Represents a non - GAAP financial measure. Core ROTCE adjusts for certain items such as net DTA and OID. See slide 29 for details Positioned to execute priorities in 2016 □ 15% +/ - EPS growth – $170 million of preferred dividend savings versus 2015 □ Initiate a common dividend and share repurchases, subject to CCAR non - objection □ Disciplined deployment of capital towards business and customer expansion opportunities
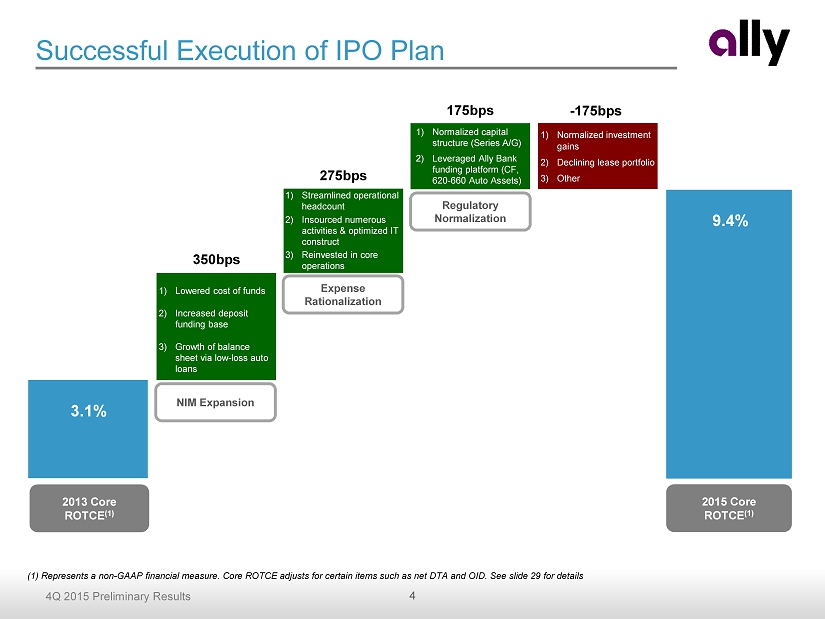
4 4Q 2015 Preliminary Results 1) Normalized investment gains 2) Declining lease portfolio 3) Other 1) Normalized capital structure (Series A/G ) 2) Leveraged Ally Bank funding platform (CF, 620 - 660 Auto Assets) 1) Streamlined operational headcount 2) Insourced numerous activities & optimized IT construct 3) Reinvested in core operations 1) Lowered cost of funds 2) Increased d eposit funding base 3) Growth of balance sheet via low - loss auto loans Successful Execution of IPO Plan 2013 Core ROTCE (1) 2015 Core ROTCE (1) NIM Expansion 175bps - 175bps 9.4% 350bps Regulatory Normalization 275bps Expense Rationalization (1) Represents a non - GAAP financial measure. Core ROTCE adjusts for certain items such as net DTA and OID. See slide 29 for details 3.1%
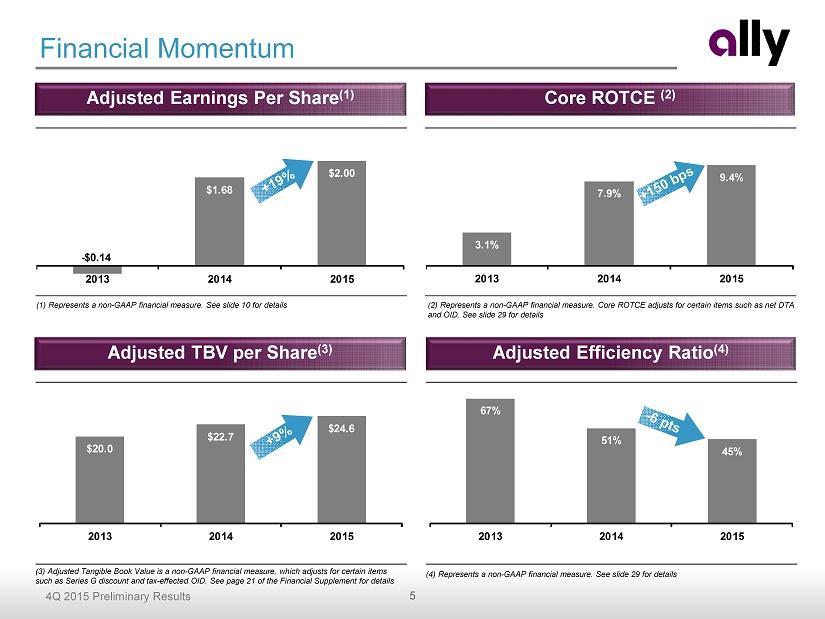
5 4Q 2015 Preliminary Results - $0.14 $1.68 $2.00 2013 2014 2015 $20.0 $22.7 $24.6 2013 2014 2015 3.1% 7.9% 9.4% 2013 2014 2015 67% 51% 45% 2013 2014 2015 Financial Momentum Adjusted TBV per Share (3) Adjusted Efficiency Ratio (4) Adjusted Earnings Per Share (1) Core ROTCE (2) (1) Represents a non - GAAP financial measure. See slide 10 for details (2) Represents a non - GAAP financial measure. Core ROTCE adjusts for certain items such as net DTA and OID. See slide 29 for details (4) Represents a non - GAAP financial measure. See slide 29 for details (3) Adjusted Tangible Book Value is a non - GAAP financial measure, which adjusts for certain items such as Series G discount and tax - effected OID . See page 21 of the Financial Supplement for details
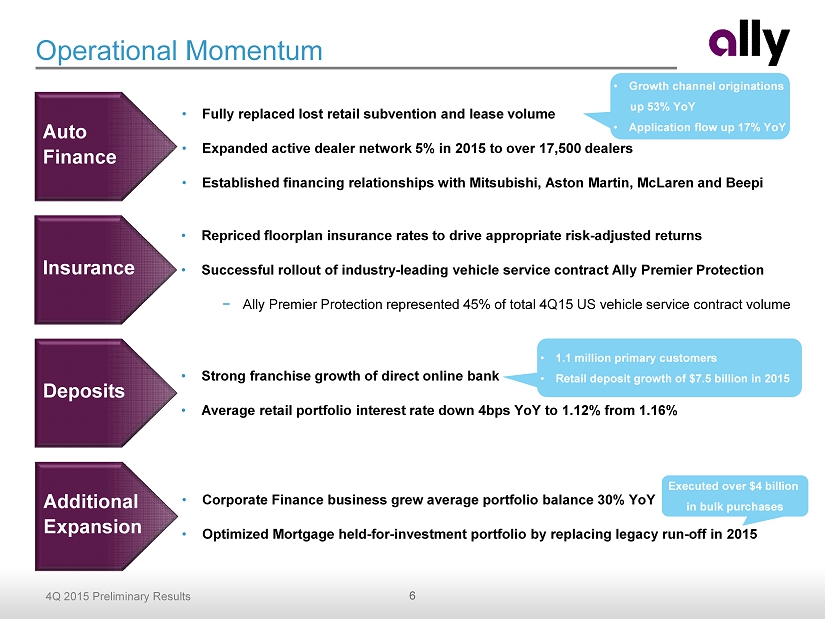
6 4Q 2015 Preliminary Results Operational Momentum Auto Finance Deposits • Fully replaced lost retail subvention and lease volume • Expanded active dealer network 5% in 2015 to over 17,500 dealers • Established financing relationships with Mitsubishi, Aston Martin, McLaren and Beepi • Strong franchise growth of direct online bank • Average retail portfolio interest rate down 4bps YoY to 1.12% from 1.16% • Growth channel originations up 53% YoY • Application flow up 17% YoY Additional Expansion • 1.1 million primary customers • Retail deposit growth of $7.5 billion in 2015 Insurance • Repriced floorplan insurance rates to drive appropriate risk - adjusted returns • Successful rollout of industry - leading vehicle service contract Ally Premier Protection − Ally Premier Protection represented 45% of total 4Q15 US vehicle service contract volume • Corporate Finance business grew average portfolio balance 3 0 % YoY • Optimized Mortgage held - for - investment portfolio by replacing legacy run - off in 2015 Executed over $4 billion in bulk purchases
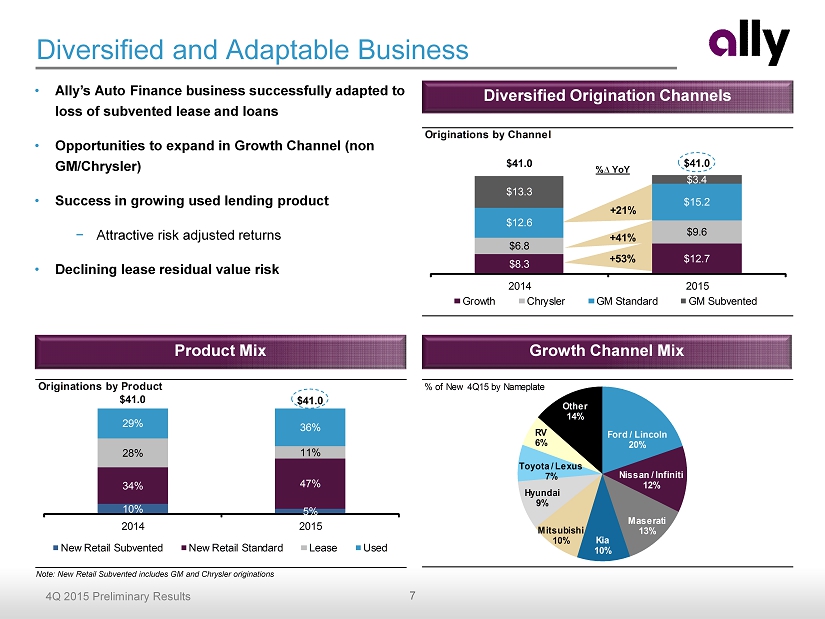
7 4Q 2015 Preliminary Results Originations by Product 10% 5% 34% 47% 28% 11% 29% 36% $41.0 $41.0 2014 2015 New Retail Subvented New Retail Standard Lease Used Originations by Channel $8.3 $12.7 $6.8 $9.6 $12.6 $15.2 $13.3 $3.4 $41.0 $41.0 2014 2015 Growth Chrysler GM Standard GM Subvented +53% +41% +21% Diversified and Adaptable Business • Ally’s Auto Finance business successfully adapted to loss of subvented lease and loans • Opportunities to expand in Growth Channel (non GM/Chrysler ) • Success in growing used lending product − Attractive risk adjusted returns • Declining lease residual value risk Diversified Origination Channels %∆ YoY Growth Channel Mix Product Mix Note: New Retail Subvented includes GM and Chrysler originations % of New 4Q15 by Nameplate Ford / Lincoln 20% Nissan / Infiniti 12% Maserati 13% Kia 10% Mitsubishi 10% Hyundai 9% Toyota / Lexus 7% RV 6% Other 14%
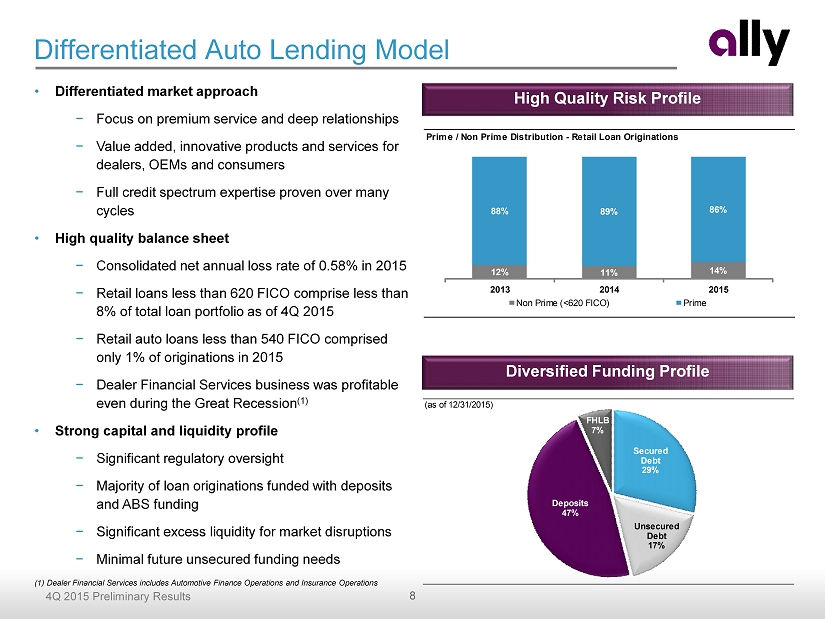
8 4Q 2015 Preliminary Results Prime / Non Prime Distribution - Retail Loan Originations 12% 11% 14% 88% 89% 86% 2013 2014 2015 Non Prime (<620 FICO) Prime Differentiated Auto Lending Model • Differentiated market approach − Focus on premium service and deep relationships − Value added, innovative products and services for dealers, OEMs and consumers − Full credit spectrum expertise proven over many cycles • High quality balance sheet − Consolidated net annual loss rate of 0.58% in 2015 − Retail loans less than 620 FICO comprise less than 8% of total loan portfolio as of 4Q 2015 − Retail auto loans less than 540 FICO comprised only 1% of originations in 2015 − Dealer Financial Services business was profitable even during the Great Recession (1 ) • Strong capital and liquidity profile − Significant regulatory oversight − Majority of loan originations funded with deposits and ABS funding − Significant excess liquidity for market disruptions − Minimal future unsecured funding needs High Quality Risk Profile Diversified Funding Profile (1) Dealer Financial Services includes Automotive Finance Operations and Insurance Operations (as of 12/31/2015) Secured Debt 29% Unsecured Debt 17% Deposits 47% FHLB 7%
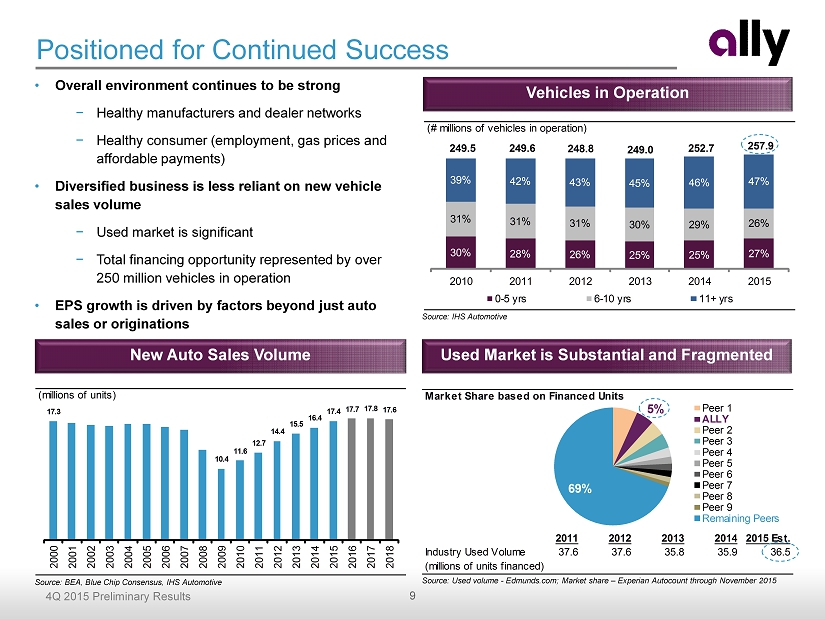
9 4Q 2015 Preliminary Results Market Share based on Financed Units 2011 2012 2013 2014 2015 Est. Industry Used Volume 37.6 37.6 35.8 35.9 36.5 (millions of units financed) 5% 69% Peer 1 ALLY Peer 2 Peer 3 Peer 4 Peer 5 Peer 6 Peer 7 Peer 8 Peer 9 Remaining Peers Positioned for Continued Success • Overall environment continues to be strong − Healthy manufacturers and dealer networks − Healthy consumer (employment, gas prices and affordable payments ) • Diversified business is less reliant on new vehicle sales volume − Used market is significant − Total financing opportunity represented by over 250 million vehicles in operation • EPS growth is driven by factors beyond just auto sales or originations Used Market is Substantial and Fragmented New Auto Sales Volume Source: BEA, Blue Chip Consensus, IHS Automotive Source: Used volume - Edmunds.com; Market share – Experian Autocount through November 2015 (millions of units) 17.3 10.4 11.6 12.7 14.4 15.5 16.4 17.4 17.7 17.8 17.6 2000 2001 2002 2003 2004 2005 2006 2007 2008 2009 2010 2011 2012 2013 2014 2015 2016 2017 2018 Vehicles in Operation Source: IHS Automotive (# millions of vehicles in operation) 249.5 249.6 248.8 249.0 252.7 257.9 39% 42% 43% 45% 46% 47% 31% 31% 31% 30% 29% 26% 30% 28% 26% 25% 25% 27% 2010 2011 2012 2013 2014 2015 0-5 yrs 6-10 yrs 11+ yrs
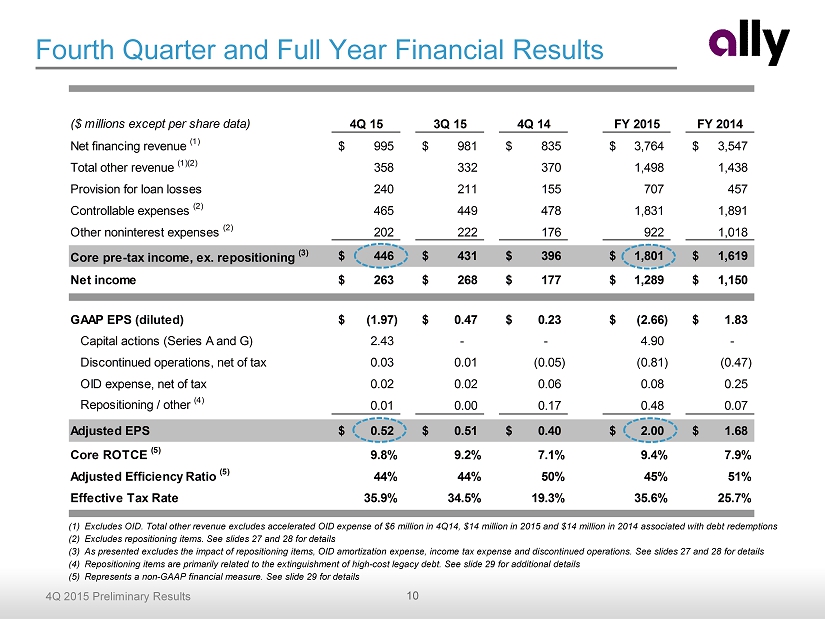
10 4Q 2015 Preliminary Results ($ millions except per share data) 4Q 15 3Q 15 4Q 14 FY 2015 FY 2014 Net financing revenue (1) 995$ 981$ 835$ 3,764$ 3,547$ Total other revenue (1)(2) 358 332 370 1,498 1,438 Provision for loan losses 240 211 155 707 457 Controllable expenses (2) 465 449 478 1,831 1,891 Other noninterest expenses (2) 202 222 176 922 1,018 Core pre-tax income, ex. repositioning (3) 446$ 431$ 396$ 1,801$ 1,619$ Net income 263$ 268$ 177$ 1,289$ 1,150$ GAAP EPS (diluted) (1.97)$ 0.47$ 0.23$ (2.66)$ 1.83$ Capital actions (Series A and G) 2.43 - - 4.90 - Discontinued operations, net of tax 0.03 0.01 (0.05) (0.81) (0.47) OID expense, net of tax 0.02 0.02 0.06 0.08 0.25 Repositioning / other (4) 0.01 0.00 0.17 0.48 0.07 Adjusted EPS 0.52$ 0.51$ 0.40$ 2.00$ 1.68$ Core ROTCE (5) 9.8% 9.2% 7.1% 9.4% 7.9% Adjusted Efficiency Ratio (5) 44% 44% 50% 45% 51% Effective Tax Rate 35.9% 34.5% 19.3% 35.6% 25.7% Fourth Quarter and Full Year Financial Results (1) Excludes OID. Total other revenue excludes accelerated OID expense of $6 million in 4Q14 , $14 million in 2015 and $14 million in 2014 associated with debt redemptions (2) Excludes repositioning items. See slides 27 and 28 for details (3) As presented excludes the impact of repositioning items, OID amortization expense, income tax expense and discontinued operation s. See slides 27 and 28 for details (4) Repositioning items are primarily related to the extinguishment of high - cost legacy debt. See slide 29 for additional details (5) Represents a non - GAAP financial measure. See slide 29 for details
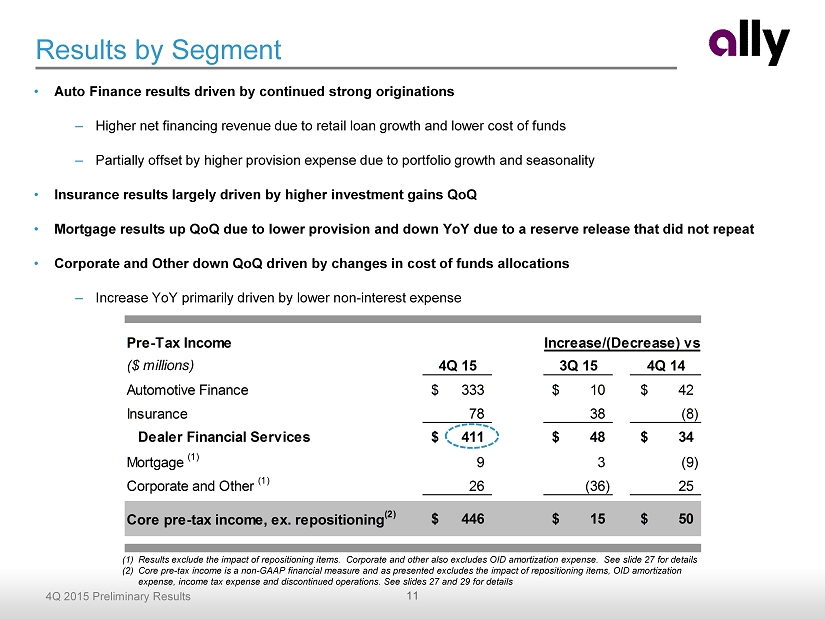
11 4Q 2015 Preliminary Results Pre-Tax Income ($ millions) 4Q 15 3Q 15 4Q 14 Automotive Finance 333$ 10$ 42$ Insurance 78 38 (8) Dealer Financial Services 411$ 48$ 34$ Mortgage (1) 9 3 (9) Corporate and Other (1) 26 (36) 25 Core pre-tax income, ex. repositioning (2) 446$ 15$ 50$ Increase/(Decrease) vs. Results by Segment (1) Results exclude the impact of repositioning items. Corporate and other also excludes OID amortization expense. See slide 27 fo r details (2) Core pre - tax income is a non - GAAP financial measure and as presented excludes the impact of repositioning items, OID amortizatio n expense, income tax expense and discontinued operations. See slides 27 and 29 for details • Auto Finance results driven by continued strong originations – Higher net financing revenue due to retail loan growth and lower cost of funds – Partially offset by higher provision expense due to portfolio growth and seasonality • Insurance results largely driven by higher investment gains QoQ • Mortgage results up QoQ due to lower provision and down YoY due to a reserve release that did not repeat • Corporate and Other down QoQ driven by changes in cost of funds allocations – Increase YoY primarily driven by lower non - interest expense
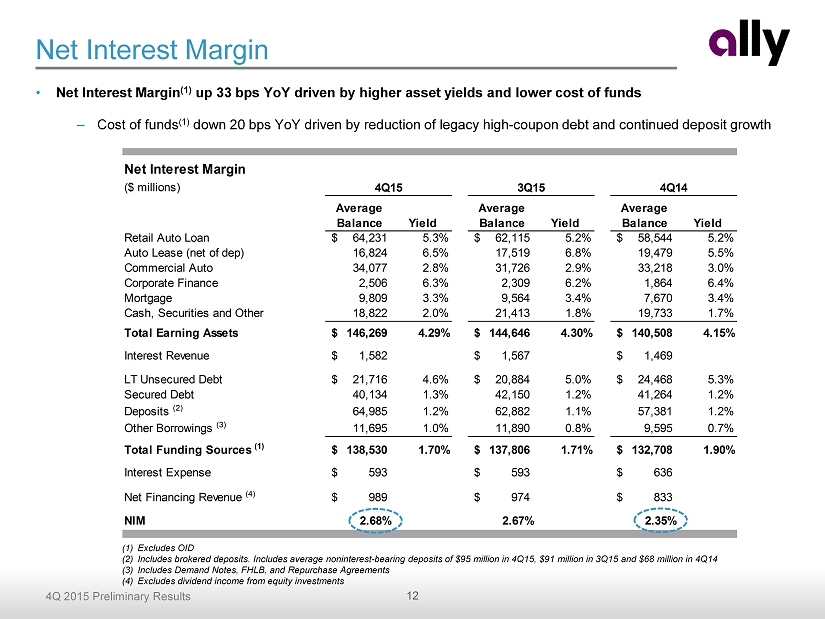
12 4Q 2015 Preliminary Results Net Interest Margin Variance ($ millions) Average Balance Yield Average Balance Yield Average Balance Yield Retail Auto Loan 64,231$ 5.3% 62,115$ 5.2% 58,544$ 5.2% Auto Lease (net of dep) 16,824 6.5% 17,519 6.8% 19,479 5.5% Commercial Auto 34,077 2.8% 31,726 2.9% 33,218 3.0% Corporate Finance 2,506 6.3% 2,309 6.2% 1,864 6.4% Mortgage 9,809 3.3% 9,564 3.4% 7,670 3.4% Cash, Securities and Other 18,822 2.0% 21,413 1.8% 19,733 1.7% Total Earning Assets 146,269$ 4.29% 144,646$ 4.30% 140,508$ 4.15% Interest Revenue 1,582$ 1,567$ 1,469$ LT Unsecured Debt 21,716$ 4.6% 20,884$ 5.0% 24,468$ 5.3% Secured Debt 40,134 1.3% 42,150 1.2% 41,264 1.2% Deposits (2) 64,985 1.2% 62,882 1.1% 57,381 1.2% Other Borrowings (3) 11,695 1.0% 11,890 0.8% 9,595 0.7% Total Funding Sources (1) 138,530$ 1.70% 137,806$ 1.71% 132,708$ 1.90% Interest Expense 593$ 593$ 636$ Net Financing Revenue (4) 989$ 974$ 833$ NIM 2.68% 2.67% 2.35% 4Q15 3Q15 4Q14 Net Interest Margin • Net Interest Margin (1) up 33 bps YoY driven by higher asset yields and lower cost of funds – Cost of funds (1) down 20 bps YoY driven by reduction of legacy high - coupon debt and continued deposit growth (1) Excludes OID (2) Includes brokered deposits. Includes average noninterest - bearing deposits of $95 million in 4Q15 , $ 91 million in 3Q15 and $68 million in 4Q14 (3) Includes Demand Notes, FHLB, and Repurchase Agreements (4) Excludes dividend income from equity investments
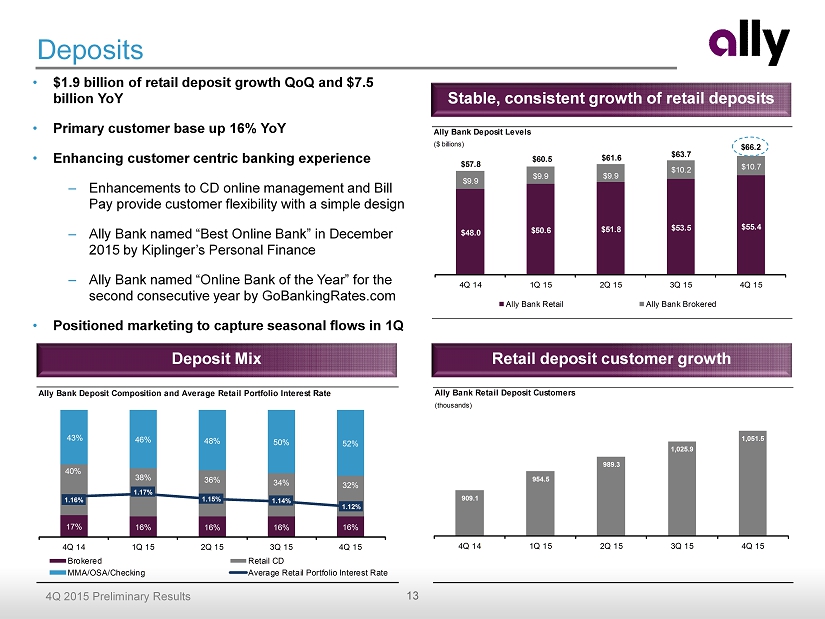
13 4Q 2015 Preliminary Results Ally Bank Deposit Levels ($ billions) $48.0 $50.6 $51.8 $53.5 $55.4 $9.9 $9.9 $9.9 $10.2 $10.7 $57.8 $60.5 $61.6 $63.7 $66.2 4Q 14 1Q 15 2Q 15 3Q 15 4Q 15 Ally Bank Retail Ally Bank Brokered Deposits • $1.9 billion of retail deposit growth QoQ and $7.5 billion YoY • Primary customer base up 16% YoY • Enhancing customer centric banking experience – Enhancements to CD online management and Bill Pay provide customer flexibility with a simple design – Ally Bank named “Best Online Bank” in December 2015 by Kiplinger’s Personal Finance – Ally Bank named “Online Bank of the Year” for the second consecutive year by GoBankingRates.com • Positioned marketing to capture seasonal flows in 1Q Stable, consistent growth of retail deposits Deposit Mix Retail deposit customer growth Ally Bank Deposit Composition and Average Retail Portfolio Interest Rate 17% 16% 16% 16% 16% 40% 38% 36% 34% 32% 43% 46% 48% 50% 52% 1.16% 1.17% 1.15% 1.14% 1.12% 4Q 14 1Q 15 2Q 15 3Q 15 4Q 15 Brokered Retail CD MMA/OSA/Checking Average Retail Portfolio Interest Rate Ally Bank Retail Deposit Customers (thousands) 909.1 954.5 989.3 1,025.9 1,051.5 4Q 14 1Q 15 2Q 15 3Q 15 4Q 15
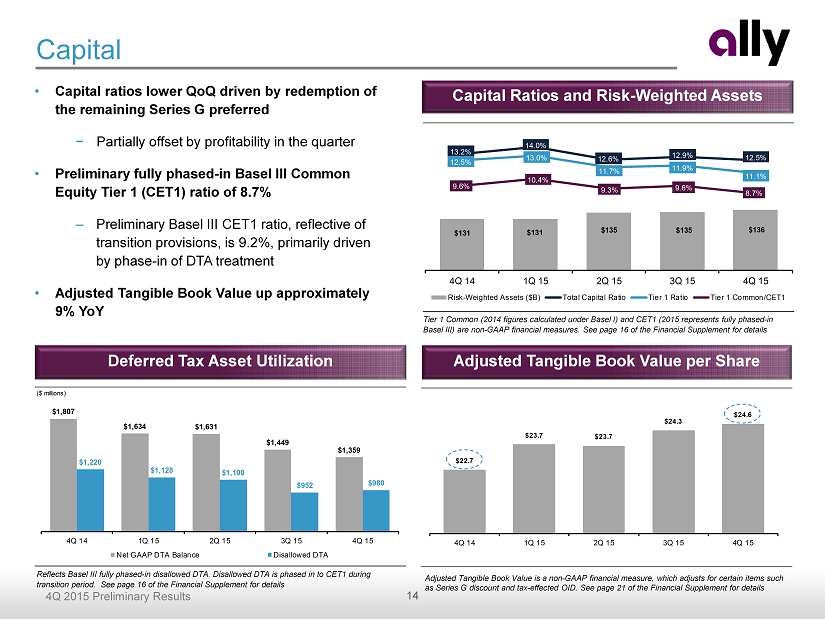
14 4Q 2015 Preliminary Results $22.7 $23.7 $23.7 $24.3 $24.6 4Q 14 1Q 15 2Q 15 3Q 15 4Q 15 Capital • Capital ratios lower QoQ driven by redemption of the remaining Series G preferred − Partially offset by profitability in the quarter • Preliminary fully phased - in Basel III Common Equity Tier 1 (CET1) ratio of 8.7% – Preliminary Basel III CET1 ratio, reflective of transition provisions, is 9.2%, primarily driven by phase - in of DTA treatment • Adjusted Tangible Book Value up approximately 9% YoY Tier 1 Common (2014 figures calculated under Basel I) and CET1 (2015 represents fully phased - in Basel III) are non - GAAP financial measures. See page 16 of the Financial Supplement for details Capital Ratios and Risk - Weighted Assets Adjusted Tangible Book Value per Share Adjusted Tangible Book Value is a non - GAAP financial measure, which adjusts for certain items such as Series G discount and tax - effected OID . See page 21 of the Financial Supplement for details Deferred Tax Asset Utilization Reflects Basel III fully phased - in disallowed DTA. Disallowed DTA is phased in to CET1 during transition period. See page 16 of the Financial Supplement for details $131 $131 $135 $135 $136 13.2% 14.0% 12.6% 12.9% 12.5% 12.5% 13.0% 11.7% 11.9% 11.1% 9.6% 10.4% 9.3% 9.6% 8.7% 4Q 14 1Q 15 2Q 15 3Q 15 4Q 15 Risk-Weighted Assets ($B) Total Capital Ratio Tier 1 Ratio Tier 1 Common/CET1 ($ millions) $1,807 $1,634 $1,631 $1,449 $1,359 $1,220 $1,128 $1,100 $952 $980 4Q 14 1Q 15 2Q 15 3Q 15 4Q 15 Net GAAP DTA Balance Disallowed DTA
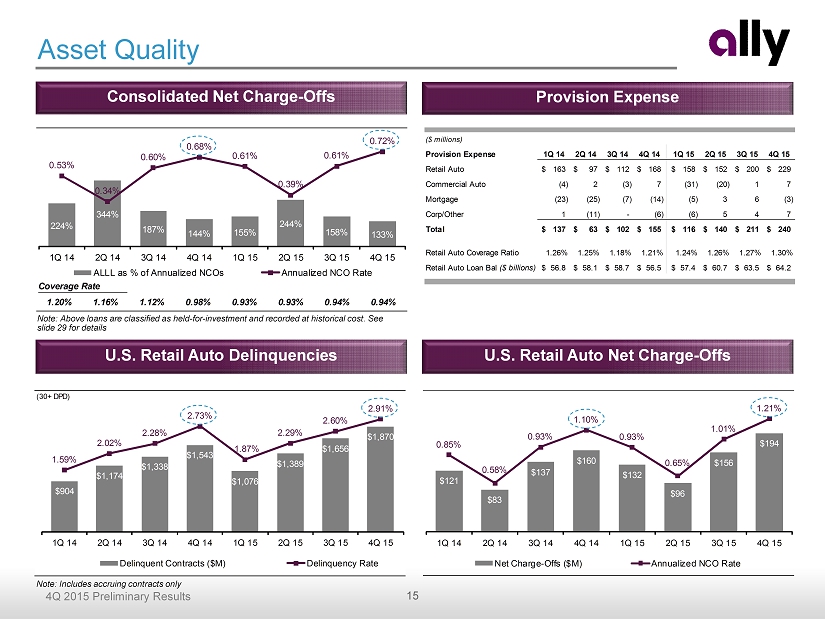
15 4Q 2015 Preliminary Results 0.94%1.12% 0.98% 0.93% 0.93% 0.94%1.20% Coverage Rate 1.16% 224% 344% 187% 144% 155% 244% 158% 133% 0.53% 0.34% 0.60% 0.68% 0.61% 0.39% 0.61% 0.72% 50% 1Q 14 2Q 14 3Q 14 4Q 14 1Q 15 2Q 15 3Q 15 4Q 15 ALLL as % of Annualized NCOs Annualized NCO Rate (30+ DPD) $904 $1,174 $1,338 $1,543 $1,076 $1,389 $1,656 $1,870 1.59% 2.02% 2.28% 2.73% 1.87% 2.29% 2.60% 2.91% 1Q 14 2Q 14 3Q 14 4Q 14 1Q 15 2Q 15 3Q 15 4Q 15 Delinquent Contracts ($M) Delinquency Rate $121 $83 $137 $160 $132 $96 $156 $194 0.85% 0.58% 0.93% 1.10% 0.93% 0.65% 1.01% 1.21% 1Q 14 2Q 14 3Q 14 4Q 14 1Q 15 2Q 15 3Q 15 4Q 15 Net Charge-Offs ($M) Annualized NCO Rate Consolidated Net Charge - Offs Provision Expense Asset Quality U.S. Retail Auto Net Charge - Offs U.S. Retail Auto Delinquencies Note: Above loans are classified as held - for - investment and recorded at historical cost. See slide 29 for details Note: Includes accruing contracts only ($ millions) Provision Expense 1Q 14 2Q 14 3Q 14 4Q 14 1Q 15 2Q 15 3Q 15 4Q 15 Retail Auto 163$ 97$ 112$ 168$ 158$ 152$ 200$ 229$ Commercial Auto (4) 2 (3) 7 (31) (20) 1 7 Mortgage (23) (25) (7) (14) (5) 3 6 (3) Corp/Other 1 (11) - (6) (6) 5 4 7 Total 137$ 63$ 102$ 155$ 116$ 140$ 211$ 240$ Retail Auto Coverage Ratio 1.26% 1.25% 1.18% 1.21% 1.24% 1.26% 1.27% 1.30% Retail Auto Loan Bal ($ billions) 56.8$ 58.1$ 58.7$ 56.5$ 57.4$ 60.7$ 63.5$ 64.2$
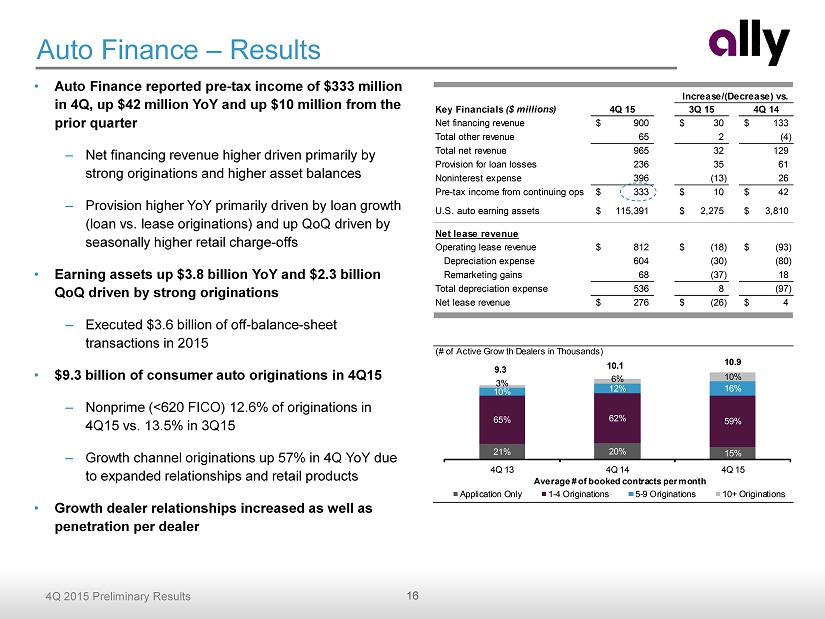
16 4Q 2015 Preliminary Results Key Financials ($ millions) 4Q 15 3Q 15 4Q 14 Net financing revenue 900$ 30$ 133$ Total other revenue 65 2 (4) Total net revenue 965 32 129 Provision for loan losses 236 35 61 Noninterest expense 396 (13) 26 Pre-tax income from continuing ops 333$ 10$ 42$ U.S. auto earning assets 115,391$ 2,275$ 3,810$ Net lease revenue Operating lease revenue 812$ (18)$ (93)$ Depreciation expense 604 (30) (80) Remarketing gains 68 (37) 18 Total depreciation expense 536 8 (97) Net lease revenue 276$ (26)$ 4$ Increase/(Decrease) vs. • Auto Finance reported pre - tax income of $333 million in 4Q, up $42 million YoY and up $10 million from the prior quarter – Net financing revenue higher driven primarily by strong originations and higher asset balances – Provision higher YoY primarily driven by loan growth (loan vs. lease originations) and up QoQ driven by seasonally higher retail charge - offs • Earning assets up $3.8 billion YoY and $2.3 billion QoQ driven by strong originations – Executed $3.6 billion of off - balance - sheet transactions in 2015 • $9.3 billion of consumer auto originations in 4Q15 – Nonprime (<620 FICO) 12.6% of originations in 4Q15 vs. 13.5 % in 3Q15 – Growth channel originations up 57% in 4Q YoY due to expanded relationships and retail products • Growth dealer relationships increased as well as penetration per dealer Auto Finance – Results (# of Active Growth Dealers in Thousands) 21% 20% 15% 65% 62% 59% 10% 12% 16% 3% 6% 10% 9.3 10.1 10.9 4Q 13 4Q 14 4Q 15 Application Only 1-4 Originations 5-9 Originations 10+ Originations Average # of booked contracts per month 21% 20% 15% 65% 62% 59% 10% 12% 16% 3% 6% 10% 9.3 10.1 10.9 4Q 13 4Q 14 4Q 15 Application Only 1-4 Originations 5-9 Originations 10+ Originations Average # of booked contracts per month
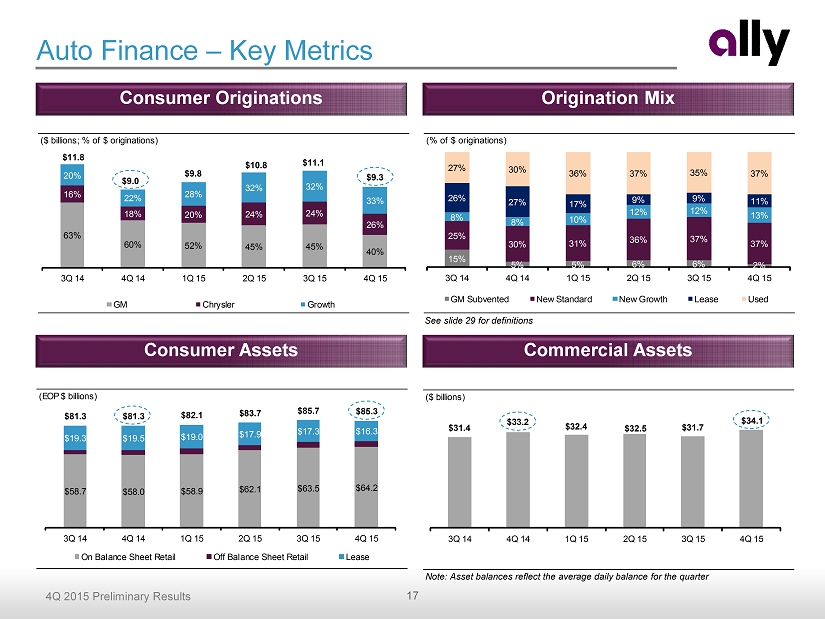
17 4Q 2015 Preliminary Results (EOP $ billions) $58.7 $58.0 $58.9 $62.1 $63.5 $64.2 $19.3 $19.5 $19.0 $17.9 $17.3 $16.3 $81.3 $81.3 $82.1 $83.7 $85.7 $85.3 3Q 14 4Q 14 1Q 15 2Q 15 3Q 15 4Q 15 On Balance Sheet Retail Off Balance Sheet Retail Lease ($ billions) $31.4 $33.2 $32.4 $32.5 $31.7 $34.1 3Q 14 4Q 14 1Q 15 2Q 15 3Q 15 4Q 15 ($ billions; % of $ originations) 63% 60% 52% 45% 45% 40% 16% 18% 20% 24% 24% 26% 20% 22% 28% 32% 32% 33% $11.8 $9.0 $9.8 $10.8 $11.1 $9.3 3Q 14 4Q 14 1Q 15 2Q 15 3Q 15 4Q 15 GM Chrysler Growth Auto Finance – Key Metrics See slide 29 for definitions Consumer Assets Commercial Assets Consumer Originations Origination Mix Note: Asset balances reflect the average daily balance for the quarter (% of $ originations) 15% 5% 5% 6% 6% 2% 25% 30% 31% 36% 37% 37% 8% 8% 10% 12% 12% 13% 26% 27% 17% 9% 9% 11% 27% 30% 36% 37% 35% 37% 3Q 14 4Q 14 1Q 15 2Q 15 3Q 15 4Q 15 GM Subvented New Standard New Growth Lease Used
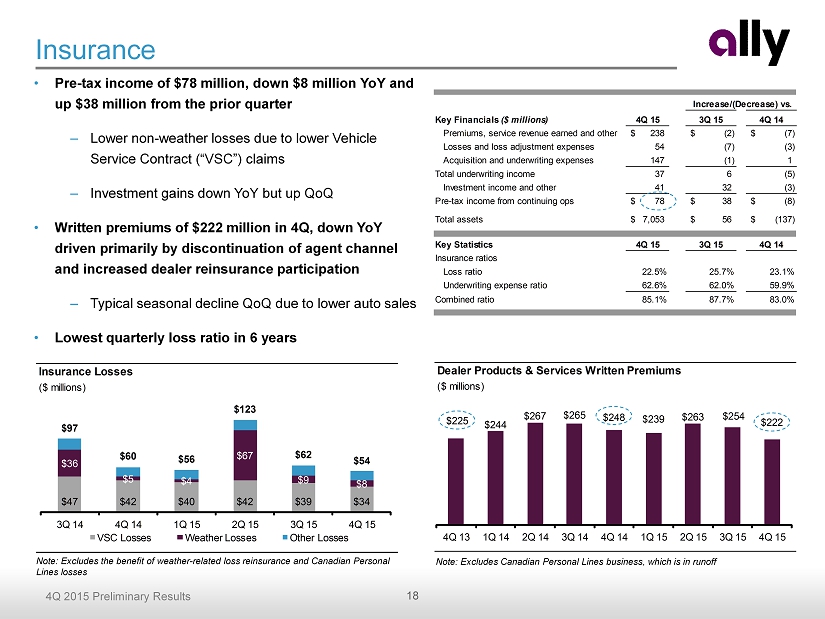
18 4Q 2015 Preliminary Results Key Financials ($ millions) 4Q 15 3Q 15 4Q 14 Premiums, service revenue earned and other 238$ (2)$ (7)$ Losses and loss adjustment expenses 54 (7) (3) Acquisition and underwriting expenses 147 (1) 1 Total underwriting income 37 6 (5) Investment income and other 41 32 (3) Pre-tax income from continuing ops 78$ 38$ (8)$ Total assets 7,053$ 56$ (137)$ Key Statistics 4Q 15 3Q 15 4Q 14 Insurance ratios Loss ratio 22.5% 25.7% 23.1% Underwriting expense ratio 62.6% 62.0% 59.9% Combined ratio 85.1% 87.7% 83.0% Increase/(Decrease) vs. Dealer Products & Services Written Premiums ($ millions) $225 $244 $267 $265 $248 $239 $263 $254 $222 4Q 13 1Q 14 2Q 14 3Q 14 4Q 14 1Q 15 2Q 15 3Q 15 4Q 15 Insurance • Pre - tax income of $78 million, down $8 million YoY and up $38 million from the prior quarter – Lower non - weather losses due to lower Vehicle Service Contract (“VSC”) claims – Investment gains down YoY but up QoQ • Written premiums of $222 million in 4Q, down YoY driven primarily by discontinuation of agent channel and increased dealer reinsurance participation – Typical seasonal decline QoQ due to lower auto sales • Lowest quarterly loss ratio in 6 years Note: Excludes Canadian Personal Lines business, which is in runoff Note: Excludes the benefit of weather - related loss reinsurance and Canadian Personal Lines losses Insurance Losses ($ millions) $47 $42 $40 $42 $39 $34 $36 $5 $4 $67 $9 $8 $97 $60 $56 $123 $62 $54 3Q 14 4Q 14 1Q 15 2Q 15 3Q 15 4Q 15 VSC Losses Weather Losses Other Losses
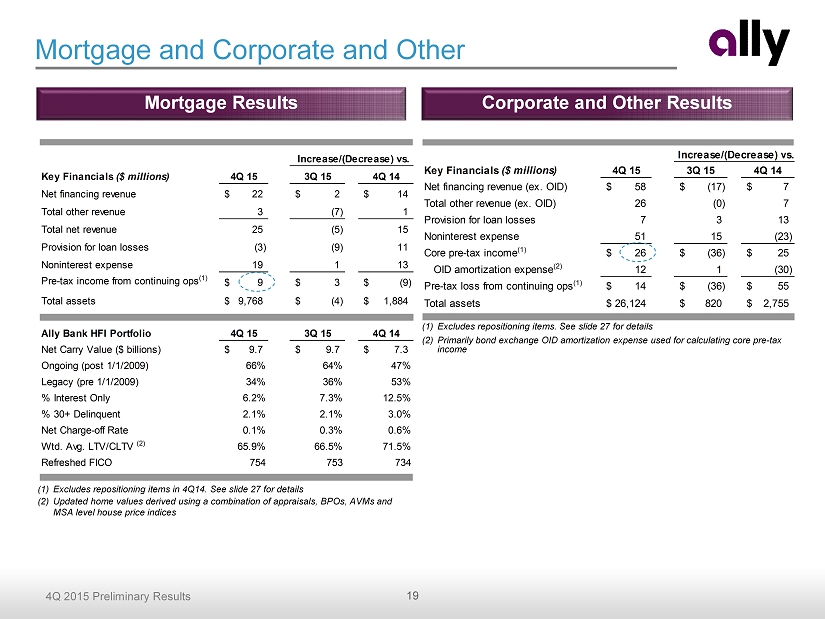
19 4Q 2015 Preliminary Results Key Financials ($ millions) 4Q 15 3Q 15 4Q 14 Net financing revenue (ex. OID) 58$ (17)$ 7$ Total other revenue (ex. OID) 26 (0) 7 Provision for loan losses 7 3 13 Noninterest expense 51 15 (23) Core pre-tax income (1) 26$ (36)$ 25$ OID amortization expense (2) 12 1 (30) Pre-tax loss from continuing ops (1) 14$ (36)$ 55$ Total assets 26,124$ 820$ 2,755$ Increase/(Decrease) vs. Key Financials ($ millions) 4Q 15 3Q 15 4Q 14 Net financing revenue 22$ 2$ 14$ Total other revenue 3 (7) 1 Total net revenue 25 (5) 15 Provision for loan losses (3) (9) 11 Noninterest expense 19 1 13 Pre-tax income from continuing ops (1) 9$ 3$ (9)$ Total assets 9,768$ (4)$ 1,884$ Ally Bank HFI Portfolio 4Q 15 3Q 15 4Q 14 Net Carry Value ($ billions) 9.7$ 9.7$ 7.3$ Ongoing (post 1/1/2009) 66% 64% 47% Legacy (pre 1/1/2009) 34% 36% 53% % Interest Only 6.2% 7.3% 12.5% % 30+ Delinquent 2.1% 2.1% 3.0% Net Charge-off Rate 0.1% 0.3% 0.6% Wtd. Avg. LTV/CLTV (2) 65.9% 66.5% 71.5% Refreshed FICO 754 753 734 Increase/(Decrease) vs. Mortgage and Corporate and Other (1) Excludes repositioning items in 4Q14. See slide 27 for details (2) Updated home values derived using a combination of appraisals, BPOs, AVMs and MSA level house price indices Mortgage Results (1) Excludes repositioning items. See slide 27 for details (2) Primarily bond exchange OID amortization expense used for calculating core pre - tax income Corporate and Other Results

20 4Q 2015 Preliminary Results Conclusion and Outlook • Successfully executed two year plan to restore profitability and returns • Positioned Ally to provide reliable results with a long runway for steady growth – Near - term EPS growth driven by significantly lower preferred dividends and modest business expansion – Proven ability to quickly and profitably adapt our originations model to industry, market and competitive changes – Creating additional attractive capital deployment opportunities • Focused on balance sheet strength and profitability over asset growth – Credit remains healthy and in line with expectations – ROE optimization, protecting book value and driving shareholder value remain highest priorities Building a better financial services company
Supplemental Charts
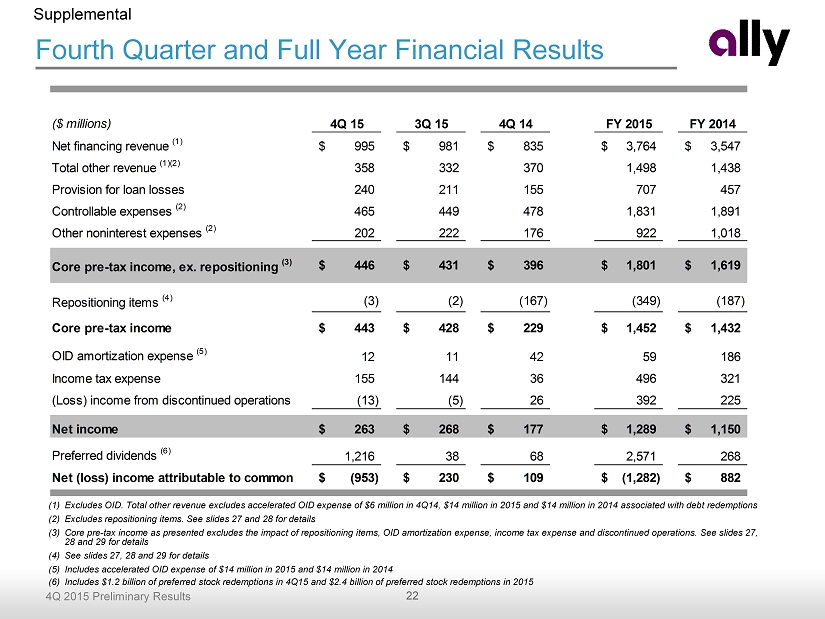
22 4Q 2015 Preliminary Results Fourth Quarter and Full Year Financial Results (1) Excludes OID. Total other revenue excludes accelerated OID expense of $6 million in 4Q14, $14 million in 2015 and $14 million in 2014 associated with debt redemptions (2) Excludes repositioning items. See slides 27 and 28 for details (3) Core pre - tax income as presented excludes the impact of repositioning items, OID amortization expense, income tax expense and di scontinued operations. See slides 27, 28 and 29 for details (4) See slides 27, 28 and 29 for details (5) Includes accelerated OID expense of $14 million in 2015 and $14 million in 2014 (6) Includes $1.2 billion of preferred stock redemptions in 4Q15 and $2.4 billion of preferred stock redemptions in 2015 Supplemental ($ millions) 4Q 15 3Q 15 4Q 14 FY 2015 FY 2014 Net financing revenue (1) 995$ 981$ 835$ 3,764$ 3,547$ Total other revenue (1)(2) 358 332 370 1,498 1,438 Provision for loan losses 240 211 155 707 457 Controllable expenses (2) 465 449 478 1,831 1,891 Other noninterest expenses (2) 202 222 176 922 1,018 Core pre-tax income, ex. repositioning (3) 446$ 431$ 396$ 1,801$ 1,619$ Repositioning items (4) (3) (2) (167) (349) (187) Core pre-tax income 443$ 428$ 229$ 1,452$ 1,432$ OID amortization expense (5) 12 11 42 59 186 Income tax expense 155 144 36 496 321 (Loss) income from discontinued operations (13) (5) 26 392 225 Net income 263$ 268$ 177$ 1,289$ 1,150$ Preferred dividends (6) 1,216 38 68 2,571 268 Net (loss) income attributable to common (953)$ 230$ 109$ (1,282)$ 882$
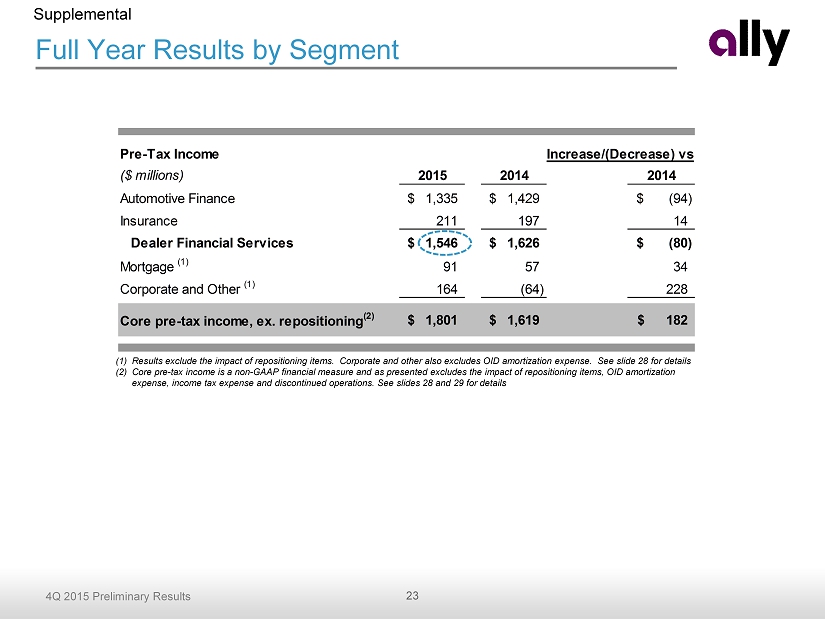
23 4Q 2015 Preliminary Results Pre-Tax Income ($ millions) 2015 2014 2014 Automotive Finance 1,335$ 1,429$ (94)$ Insurance 211 197 14 Dealer Financial Services 1,546$ 1,626$ (80)$ Mortgage (1) 91 57 34 Corporate and Other (1) 164 (64) 228 Core pre-tax income, ex. repositioning (2) 1,801$ 1,619$ 182$ Increase/(Decrease) vs. Full Year Results by Segment (1) Results exclude the impact of repositioning items. Corporate and other also excludes OID amortization expense. See slide 28 fo r details (2) Core pre - tax income is a non - GAAP financial measure and as presented excludes the impact of repositioning items, OID amortizatio n expense, income tax expense and discontinued operations. See slides 28 and 29 for details Supplemental
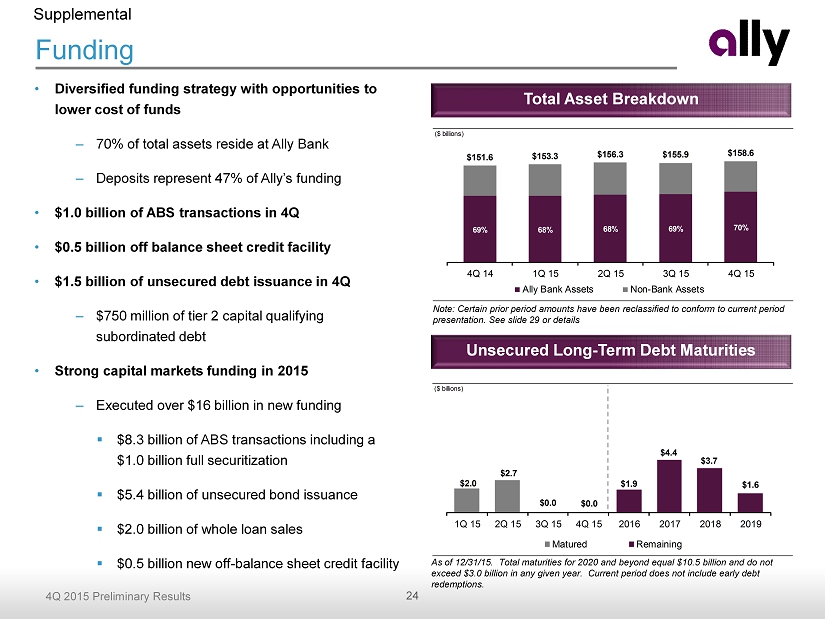
24 4Q 2015 Preliminary Results ($ billions) 69% 68% 68% 69% 70% $151.6 $153.3 $156.3 $155.9 $158.6 4Q 14 1Q 15 2Q 15 3Q 15 4Q 15 Ally Bank Assets Non-Bank Assets ($ billions) $2.0 $2.7 $0.0 $0.0 $1.9 $4.4 $3.7 $1.6 1Q 15 2Q 15 3Q 15 4Q 15 2016 2017 2018 2019 Matured Remaining • Diversified funding strategy with opportunities to lower cost of funds – 70% of total assets reside at Ally Bank – Deposits represent 47% of Ally’s funding • $1.0 billion of ABS transactions in 4Q • $0.5 billion off balance sheet credit facility • $1.5 billion of unsecured debt issuance in 4Q – $750 million of tier 2 capital qualifying subordinated debt • Strong capital markets funding in 2015 – Executed over $16 billion in new funding ▪ $8.3 billion of ABS transactions including a $1.0 billion full securitization ▪ $5.4 billion of unsecured bond issuance ▪ $2.0 billion of whole loan sales ▪ $0.5 billion new off - balance sheet credit facility Funding As of 12/31/15. Total maturities for 2020 and beyond equal $10.5 billion and do not exceed $3.0 billion in any given year. Current period does not include early debt redemptions. Total Asset Breakdown Unsecured Long - Term Debt Maturities Supplemental Note: Certain prior period amounts have been reclassified to conform to current period presentation. See slide 29 or details

25 4Q 2015 Preliminary Results Interest Rate Sensitivity (1) Net financing revenue impacts reflect a rolling 12 - month view (2) Results in ~80% pass - through rate over time. See slide 29 for additional details Supplemental Net Financing Revenue Impact (1) vs. Forward Curve $ million Ally Modeled Scenario (2) 50% Deposit Pass-Through Ally Modeled Scenario (2) 50% Deposit Pass-Through +100 bp Instantaneous (109)$ 13$ (50)$ 48$ +100 bp Gradual (over 12 months) (37)$ 4$ (7)$ 29$ Stable rate environment 30$ 18$ 12$ (5)$ 4Q15 3Q15
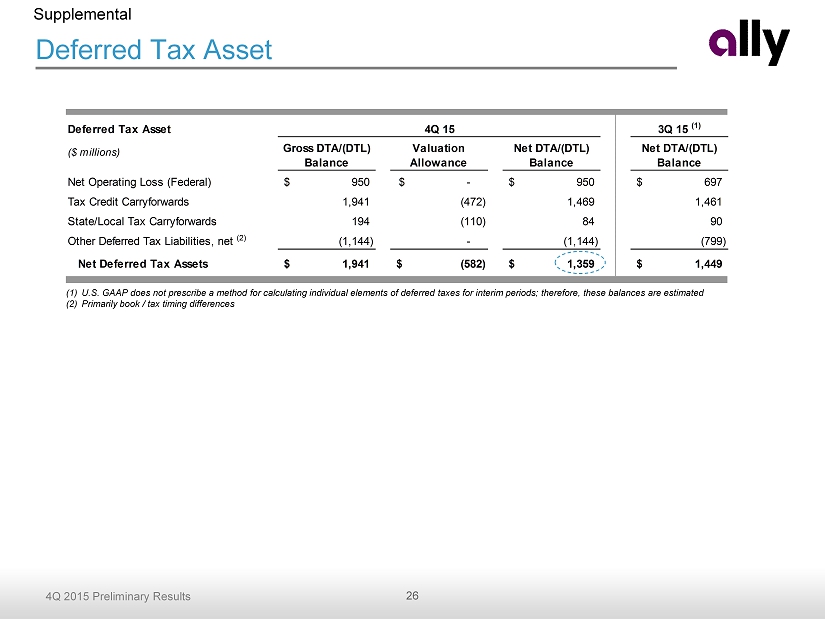
26 4Q 2015 Preliminary Results Deferred Tax Asset 3Q 15 (1) ($ millions) Gross DTA/(DTL) Balance Valuation Allowance Net DTA/(DTL) Balance Net DTA/(DTL) Balance Net Operating Loss (Federal) 950$ -$ 950$ 697$ Tax Credit Carryforwards 1,941 (472) 1,469 1,461 State/Local Tax Carryforwards 194 (110) 84 90 Other Deferred Tax Liabilities, net (2) (1,144) - (1,144) (799) Net Deferred Tax Assets 1,941$ (582)$ 1,359$ 1,449$ 4Q 15 Deferred Tax Asset Supplemental (1) U.S. GAAP does not prescribe a method for calculating individual elements of deferred taxes for interim periods; therefore , these balances are estimated (2) Primarily book / tax timing differences
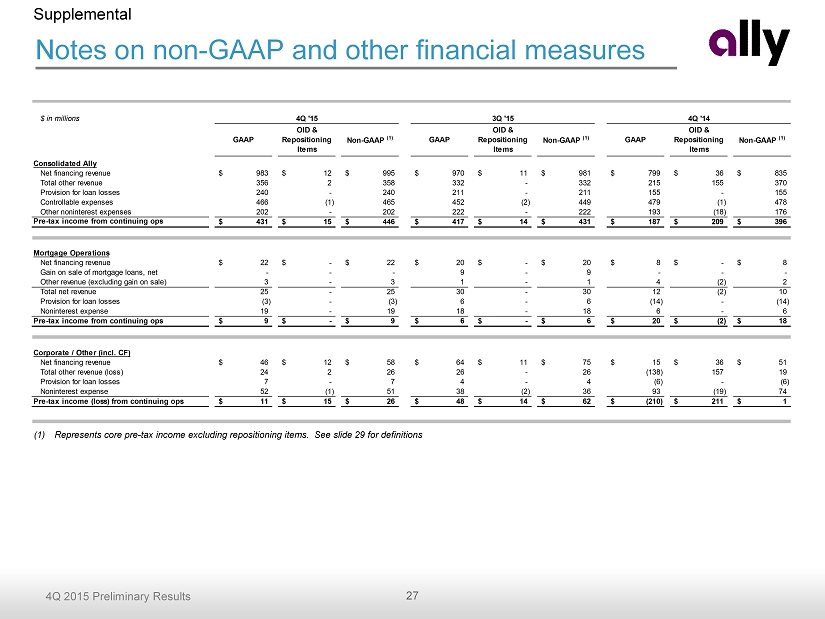
27 4Q 2015 Preliminary Results Notes on non - GAAP and other financial measures Supplemental (1) Represents core pre - tax income excluding repositioning items. See slide 29 for definitions $ in millions GAAP OID & Repositioning Items Non-GAAP (1) GAAP OID & Repositioning Items Non-GAAP (1) GAAP OID & Repositioning Items Non-GAAP (1) Consolidated Ally Net financing revenue 983$ 12$ 995$ 970$ 11$ 981$ 799$ 36$ 835$ Total other revenue 356 2 358 332 - 332 215 155 370 Provision for loan losses 240 - 240 211 - 211 155 - 155 Controllable expenses 466 (1) 465 452 (2) 449 479 (1) 478 Other noninterest expenses 202 - 202 222 - 222 193 (18) 176 Pre-tax income from continuing ops 431$ 15$ 446$ 417$ 14$ 431$ 187$ 209$ 396$ Mortgage Operations Net financing revenue 22$ -$ 22$ 20$ -$ 20$ 8$ -$ 8$ Gain on sale of mortgage loans, net - - - 9 - 9 - - - Other revenue (excluding gain on sale) 3 - 3 1 - 1 4 (2) 2 Total net revenue 25 - 25 30 - 30 12 (2) 10 Provision for loan losses (3) - (3) 6 - 6 (14) - (14) Noninterest expense 19 - 19 18 - 18 6 - 6 Pre-tax income from continuing ops 9$ -$ 9$ 6$ -$ 6$ 20$ (2)$ 18$ Corporate / Other (incl. CF) Net financing revenue 46$ 12$ 58$ 64$ 11$ 75$ 15$ 36$ 51$ Total other revenue (loss) 24 2 26 26 - 26 (138) 157 19 Provision for loan losses 7 - 7 4 - 4 (6) - (6) Noninterest expense 52 (1) 51 38 (2) 36 93 (19) 74 Pre-tax income (loss) from continuing ops 11$ 15$ 26$ 48$ 14$ 62$ (210)$ 211$ 1$ 4Q '15 3Q '15 4Q '14

28 4Q 2015 Preliminary Results Notes on non - GAAP and other financial measures Supplemental (1) Represents core pre - tax income excluding repositioning items. See slide 29 for definitions $ in millions GAAP OID & Repositioning Items Non-GAAP (1) GAAP OID & Repositioning Items Non-GAAP (1) Consolidated Ally Net financing revenue 3,719$ 45$ 3,764$ 3,375$ 172$ 3,547$ Total other revenue 1,142 356 1,498 1,276 162 1,438 Provision for loan losses 707 - 707 457 - 457 Controllable expenses 1,839 (7) 1,831 1,893 (2) 1,891 Other noninterest expenses 922 - 922 1,055 (37) 1,018 Pre-tax income from continuing ops 1,393$ 408$ 1,801$ 1,246$ 373$ 1,619$ Mortgage Operations Net financing revenue 72$ -$ 72$ 43$ -$ 43$ Gain on sale of mortgage loans, net 79 - 79 6 - 6 Other revenue (excluding gain on sale) 8 1 9 11 (2) 9 Total net revenue 159 1 160 60 (2) 58 Provision for loan losses 1 - 1 (69) - (69) Noninterest expense 68 - 68 70 0 70 Pre-tax income from continuing ops 90$ 1$ 91$ 59$ (2)$ 57$ Corporate / Other (incl. CF) Net financing revenue (loss) 161$ 45$ 206$ (45)$ 172$ 127$ Total other revenue (loss) (213) 355 142 (134) 164 30 Provision for loan losses 10 - 10 (16) - (16) Noninterest expense 181 (7) 174 276 (39) 237 Pre-tax (loss) income from continuing ops (243)$ 407$ 164$ (439)$ 375$ (64)$ FY '15 FY '14
29 4Q 2015 Preliminary Results Notes on non - GAAP and other financial measures Supplemental 1) Core pre - tax income (loss) is a non - GAAP financial measure. It is defined as income (loss) from continuing operations before income tax expense and primarily bond exchange original issue discount ("OID") amortization expense . 2) Repositioning items are primarily related to the extinguishment of high - cost legacy debt in 2015 and 2014. Additionally, expenses associated with Ally’s IPO were repositioned in 2014. 3) Core ROTCE is equal to Operating Net Income Available to Common divided by Normalized Common Equity. See page 22 in the Financial Supple men t for full calculation. A. Operating Net Income Available to Common is calculated as (a) Pre - Tax Income from Continuing Operations minus (b) Income Tax Expense using a normalized 34% rate plus (c) expense associated with original issue bond discount amortization minus (d) preferred dividends associated with our Series A and Series G preferred stock plus (e) impact of any disclosed repositioning items . B. Normalized Common Equity is calculated as the two period average of (a) shareholder equity minus (b) the book value of preferred stock outstanding minus (c) goodwill and other intangibles minus (d) remaining original issue bond discount minus (e) remaining net deferred tax asset. 4) Adjusted Efficiency ratio is equal to (A) total noninterest expense less (i) Insurance operating segment related expenses, (ii) mortgage repurchase expense and (iii) expense related to repositioning items divided by ( B) total net revenue less (i) Insurance operating segment related revenue, (ii) OID amortization expense and (iii) any revenue related to repositioning items . See page 22 in the Financial Supplement for full calculation. 5) Corporate and Other primarily consists of Ally’s centralized treasury activities, the residual impacts of the company’s corporate funds transfer pri cing and asset liability management activities, and the amortization of the discount associated with debt issuances and bond exchanges. Corporate and Oth er also includes the Corporate Finance business, certain investment portfolio activity and reclassifications, eliminations between the reportable operating seg ments. During 4Q15, incremental overhead expenses related to centralized support functions were allocated to Automotive Finance, Insurance, and Mortgage Operations. The se expenses were previously included in Corporate and Other Activities. Amounts in prior periods have been reclassified to conform to this ne w p resentation. 6) Controllable expenses include employee related costs, consulting and legal fees, marketing, information technology, facility, portfolio servicing a nd restructuring expenses. 7) U.S. consumer auto originations ▪ GM Subvented – subvented rate new vehicle loans from GM dealers ▪ New Standard – standard rate new vehicle loans from GM and Chrysler dealers ▪ Lease – new vehicle lease originations from all dealers ▪ Used – used vehicle loans from all dealers ▪ Growth – total originations from non - GM/Chrysler dealers (New Growth refers to new vehicle loan originations only) 8) Net charge - off ratios are calculated as annualized net charge - offs divided by average outstanding finance receivables and loans excluding loans measur ed at fair value and loans held - for - sale . 9) Interest rate risk modeling – Ally’s interest rate risk models use dynamic assumptions driven by a number of factors, including the overall level of interest rates and the spread between short - term and long - term interest rates to project changes in Ally’s retail deposit offered rates. Ally’s interest rate risk metrics currently assume a long - term retail deposit beta of greater than 80%. We believe our deposits may ultimately be less sensitive to interest rate changes, which will reduce our overall exposure to rising rates. Assuming a long - term retail deposit beta of 50% ( vs. current assumption of greater than 80%) would result in a consolidated interest rate risk position that is asset sensitive. 10) ASU 2014 - 03 and ASU 2015 - 15 adoption - As of December 31, 2015, we adopted ASU 2014 - 03 and ASU 2015 - 15. The impact of adopting the standard was a reduction to assets and liabilities and were applied retrospectively to all periods presented .