Exhibit 99.2

Ally Financial Inc. 1Q 2016 Earnings Review Contact Ally Investor Relations at (866) 710 - 4623 or investor.relations@ally.com April 26, 2016

2 1Q 2016 Preliminary Results Forward - Looking Statements and Additional Information The following should be read in conjunction with the financial statements, notes and other information contained in the Compa ny’ s Annual Reports on Form 10 - K, Quarterly Reports on Form 10 - Q, and Current Reports on Form 8 - K . This information is preliminary and based on company and third party data available at the time of the presentation In the presentation that follows and related comments by Ally Financial Inc. (“Ally”) management, the use of the words “expec t,” “anticipate,” “estimate,” “forecast,” “initiative,” “objective,” “plan,” “goal,” “project,” “outlook,” “priorities,” “target,” “explore,” “ pos itions,” “intend,” “evaluate,” “pursue,” “seek,” “may,” “would, ” “could, ” “should, ” “believe, ” “potential, ” “continue,” or the negative of these words, or similar expressions is intended to identify forward - looking statements. All statements herein and in related management comments, other than statements of historical fact, including without limitation, statements about future events and financial performance, are forward - looking statements tha t involve certain risks and uncertainties. While these statements represent our current judgment on what the future may hold, and we believe th ese judgments are reasonable, these statements are not guarantees of any events or financial results, and Ally’s actual results may differ mate ria lly due to numerous important factors that are described in the most recent reports on SEC Forms 10 - K and 10 - Q for Ally, each of which may be revise d or supplemented in subsequent reports filed with the SEC. Such factors include, among others, the following: maintaining the mut ual ly beneficial relationship between Ally and General Motors, and Ally and Chrysler and our ability to further diversify our business; our ability to maintain relationships with automotive dealers; the significant regulation and restrictions that we are subject to as a bank holding company and financial holding company; the potential for deterioration in the residual value of off - lease vehicles; disruptions in the market in which we fund our operations, with resulting negative impact on our liquidity; changes in our accounting assumptions that may require or that r esu lt from changes in the accounting rules or their application, which could result in an impact on earnings; changes in our credit ratings; changes in economic conditions, currency exchange rates or political stability in the markets in which we operate; and changes in the existing or th e adoption of new laws, regulations, policies or other activities of governments, agencies and similar organizations (including as a result of the Dodd - Frank Act and Basel III). Investors are cautioned not to place undue reliance on forward - looking statements. Ally undertakes no obligation to update publi cly or otherwise revise any forward - looking statements, whether as a result of new information, future events or other such factors that affect t he subject of these statements, except where expressly required by law. Certain non - GAAP measures are provided in this presentation which are important to the reader of the Consolidated Financial Statements but should be supplemental to primary U.S. GAAP measures. Reconciliation of non - GAAP financial measures included within this presentation are provided in this presentation. Use of the term “loans” describes products associated with direct and indirect lending activities of Ally’s operations. The s pec ific products include retail installment sales contracts, lines of credit, leases or other financing products. The term “originate” refers to Ally’ s p urchase, acquisition or direct origination of various “loan” products.
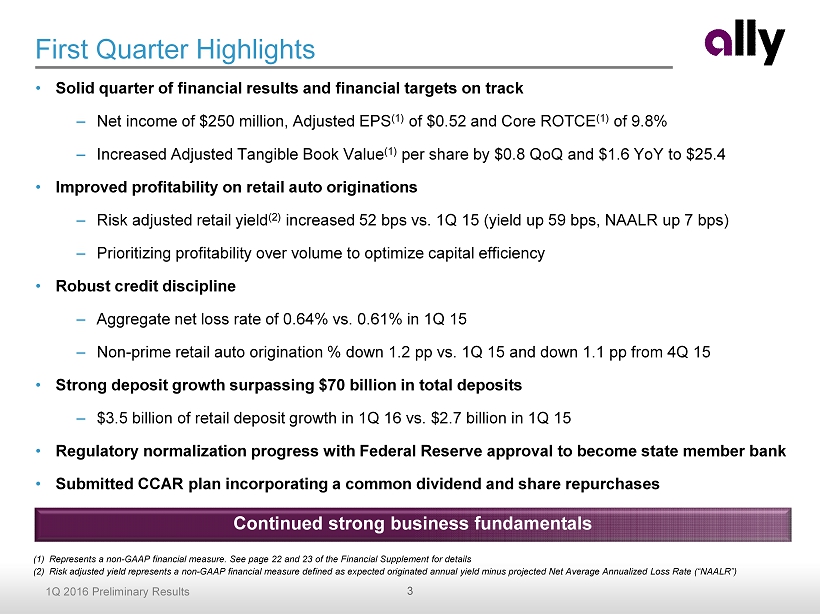
3 1Q 2016 Preliminary Results • Solid quarter of financial results and financial targets on track – Net income of $250 million, Adjusted EPS (1) of $0.52 and Core ROTCE (1) of 9.8% – Increased Adjusted Tangible Book Value (1) per share by $0.8 QoQ and $1.6 YoY to $25.4 • Improved profitability on retail auto originations – Risk adjusted retail yield (2) increased 52 bps vs. 1Q 15 (yield up 59 bps, NAALR up 7 bps) – Prioritizing profitability over volume to optimize capital efficiency • Robust credit discipline – Aggregate net loss rate of 0.64% vs. 0.61% in 1Q 15 – Non - prime retail auto origination % down 1.2 pp vs . 1Q 15 and down 1.1 pp from 4Q 15 • Strong deposit growth surpassing $70 billion in total deposits – $3.5 billion of retail deposit growth in 1Q 16 vs. $2.7 billion in 1Q 15 • Regulatory normalization progress with Federal Reserve approval to become state member bank • Submitted CCAR plan incorporating a common dividend and share repurchases First Quarter Highlights (1) Represents a non - GAAP financial measure. See page 22 and 23 of the Financial Supplement for details (2) Risk adjusted yield represents a non - GAAP financial measure defined as expected originated annual yield minus projected Net Average Annualized Loss Rate (“ NAALR ”) Continued strong business fundamentals
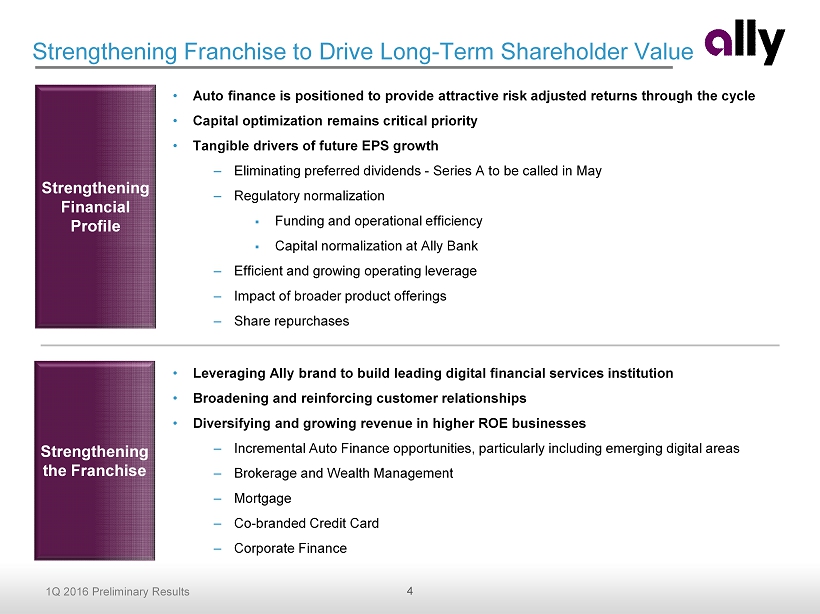
4 1Q 2016 Preliminary Results Strengthening Franchise to Drive Long - Term Shareholder Value • Auto finance is positioned to provide attractive risk adjusted returns through the cycle • Capital optimization remains critical priority • Tangible drivers of future EPS growth – Eliminating preferred dividends - Series A to be called in May – Regulatory normalization ▪ Funding and operational efficiency ▪ Capital normalization at Ally Bank – Efficient and growing operating leverage – Impact of broader product offerings – Share repurchases Strengthening Financial Profile Strengthening the Franchise • Leveraging Ally brand to build leading digital financial services institution • Broadening and reinforcing customer relationships • Diversifying and growing revenue in higher ROE businesses – Incremental Auto Finance opportunities, particularly including emerging digital areas – Brokerage and Wealth M anagement – Mortgage – Co - branded Credit Card – Corporate Finance
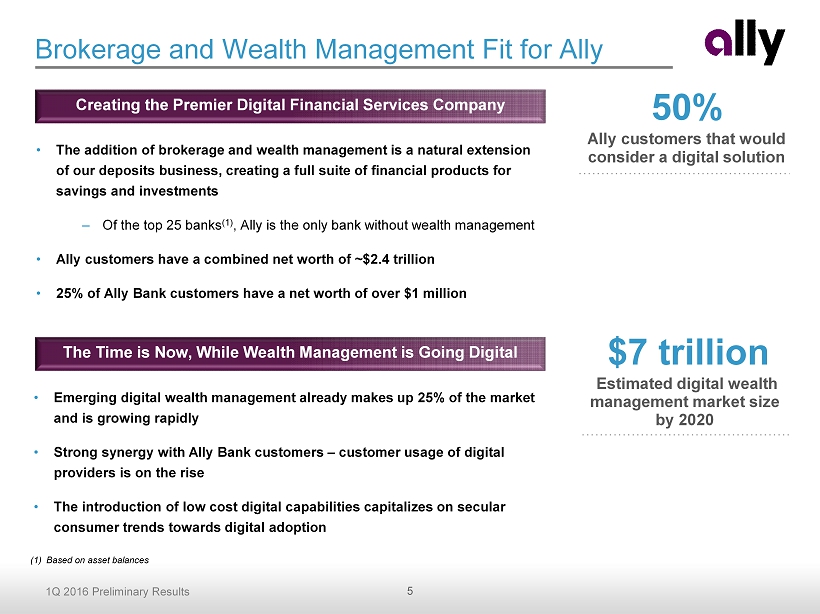
5 1Q 2016 Preliminary Results Ally customers that would consider a digital solution Brokerage and Wealth Management Fit for Ally • The addition of brokerage and wealth management is a natural extension of our deposits business, creating a full suite of financial products for savings and investments – Of the top 25 banks (1) , Ally is the only bank without wealth management • Ally customers have a combined net worth of ~$2.4 trillion • 25% of Ally Bank customers have a net worth of over $1 million Creating the Premier Digital Financial Services Company The Time is Now, While Wealth Management is Going Digital • Emerging digital wealth management already makes up 25% of the market and is growing rapidly • Strong synergy with Ally Bank customers – customer usage of digital providers is on the rise • The introduction of low cost digital capabilities capitalizes on secular consumer trends towards digital adoption 50% $7 trillion Estimated digital wealth management market size by 2020 (1) Based on asset balances

6 1Q 2016 Preliminary Results Brokerage and Wealth Management Acquisition Driving Shareholder Value • Estimated annual pre - tax income run - rate of over $80 million by YE 2018 • Lowers capital markets funding and improves ROE • Expect 20+% IRR on investment • Signed agreement to acquire TradeKing Group, Inc. for approximately $275 million • Expandable technology platform • Transaction expected to close 2Q 16 or 3Q 16 • Founded in 2005, currently has approximately $4.5 billion AUM • Online broker/dealer for self - directed investors – Broad range of offerings including equity, options, futures and FX trades • Emerging Digital Wealth Management – Professionally - managed portfolios through an automated and fully transparent online process • 4 star rating in Barron’s 2016 Online Broker Ranking NIM Benefits • Currently over $ 1.1 billion of cash and sweep deposits Brokerage Commissions • Already generating over $25 million of annual trade commissions Digital Wealth Management • Expect significant growth under Ally umbrella – digital wealth management poised for growth Transaction Overview About TradeKing

7 1Q 2016 Preliminary Results TradeKing Financial Details • Expect gradual and significant growth of business: – Leverage power of the Ally brand and marketing capabilities – Secular trends in consumer adoption of digital financial services – Cross sell to Ally’s growing customer base Brokerage AUM: ~ $4.5 billion $12 - 16 billion Brokerage Funded Accounts : 260 k 400 - 450k Cash and Deposits: $1.1 billion $2 - 3 billion Average Account Balance: $17 k $30 - 40k DARTs (1) : 20k 30 - 35k Digital Advisory AUM: <$0.1 billion $3 - 4 billion Current YE 2018 Expectations (1) Daily Average Revenue Trades

8 1Q 2016 Preliminary Results ($ millions except per share data) 1Q 16 4Q 15 1Q 15 4Q 15 1Q 15 Net financing revenue (1) 964$ 995$ 860$ (31)$ 103$ Total other revenue (1)(2) 380 358 440 22 (60) Provision for loan losses 220 240 116 (20) 104 Controllable expenses (2) 473 465 469 8 3 Other noninterest expenses (2) 233 202 226 31 7 Core pre-tax income, ex. repositioning (3) 419$ 446$ 490$ (28)$ (71)$ Net income 250$ 263$ 576$ (13)$ (326)$ GAAP EPS (diluted) 0.49$ (1.97)$ 1.06$ 2.46$ (0.57)$ Capital actions (Series A and G) - 2.43 - (2.43) - Discontinued operations, net of tax (0.01) 0.03 (0.82) (0.03) 0.82 OID expense, net of tax 0.02 0.02 0.02 0.00 (0.00) Repositioning, net of tax / other (4) 0.02 0.01 0.26 0.01 (0.24) Adjusted EPS (5) 0.52$ 0.52$ 0.52$ 0.00$ 0.00$ Core ROTCE (5) 9.8% 9.8% 9.1% Adjusted Efficiency Ratio (5) 45% 44% 48% Effective Tax Rate 37.7% 35.9% 36.3% Increase/(Decrease) vs. First Quarter Financial Results (1) Excludes OID. Total other revenue excludes accelerated OID expense of $2 million in 1Q 2016 and $7 million in 1Q 2015 associated with debt redemptions (2) Excludes repositioning items. See slides 27 and 28 for details (3) As presented excludes the impact of repositioning items, OID amortization expense, income tax expense and discontinued operation s. See slides 27 and 28 for details (4) Repositioning items are primarily related to the extinguishment of high - cost legacy debt and non - recurring strategic activities. See slides 27 and 28 for additional details (5) Represents a non - GAAP financial measure. See slide 28 for details. See pages 22 and 23 of the Financial Supplement for calculation methodology
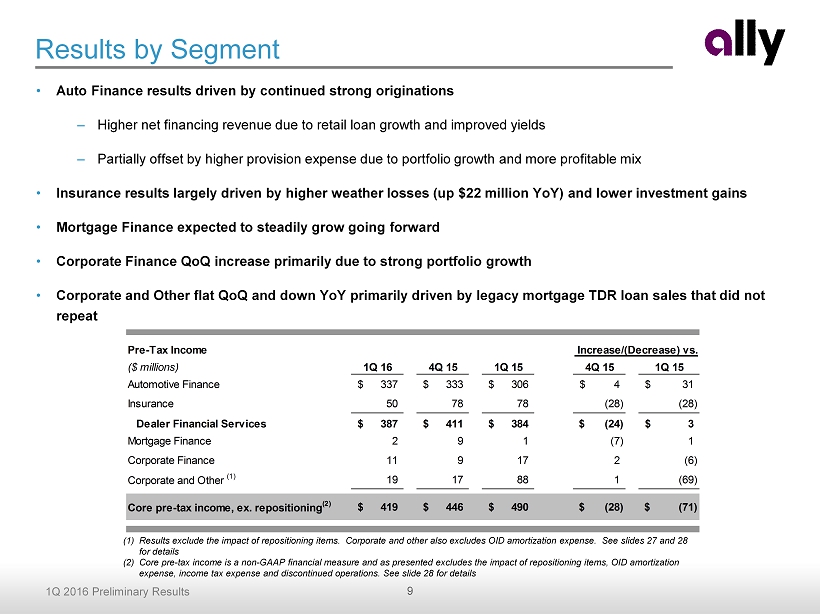
9 1Q 2016 Preliminary Results Pre-Tax Income ($ millions) 1Q 16 4Q 15 1Q 15 4Q 15 1Q 15 Automotive Finance 337$ 333$ 306$ 4$ 31$ Insurance 50 78 78 (28) (28) Dealer Financial Services 387$ 411$ 384$ (24)$ 3$ Mortgage Finance 2 9 1 (7) 1 Corporate Finance 11 9 17 2 (6) Corporate and Other (1) 19 17 88 1 (69) Core pre-tax income, ex. repositioning (2) 419$ 446$ 490$ (28)$ (71)$ Increase/(Decrease) vs. Results by Segment (1) Results exclude the impact of repositioning items. Corporate and other also excludes OID amortization expense. See slides 2 7 a nd 28 for details (2) Core pre - tax income is a non - GAAP financial measure and as presented excludes the impact of repositioning items, OID amortizatio n expense, income tax expense and discontinued operations. See slide 28 for details • Auto Finance results driven by continued strong originations – Higher net financing revenue due to retail loan growth and improved yields – Partially offset by higher provision expense due to portfolio growth and more profitable mix • Insurance results largely driven by higher weather losses (up $22 million YoY) and lower investment gains • Mortgage Finance expected to steadily grow going forward • Corporate Finance QoQ increase primarily due to strong portfolio growth • Corporate and Other flat QoQ and down YoY primarily driven by legacy mortgage TDR loan sales that did not repeat
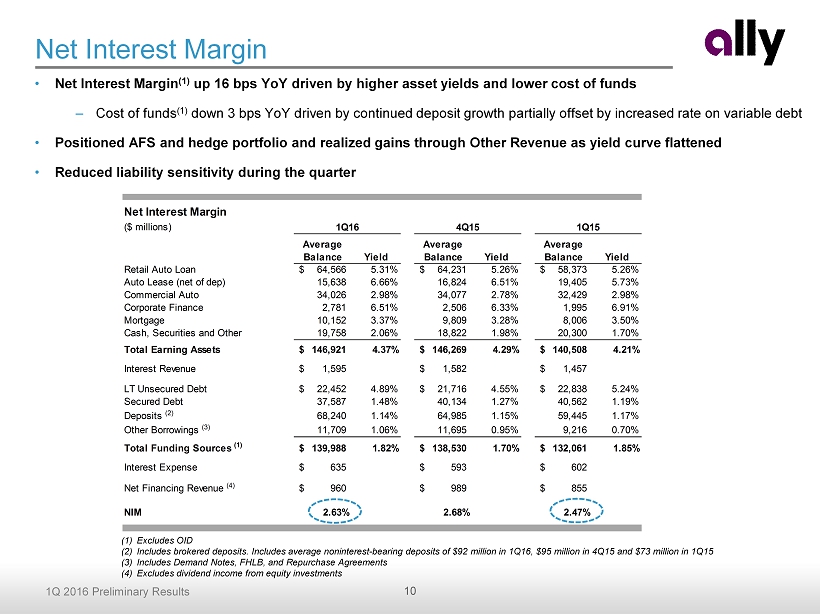
10 1Q 2016 Preliminary Results Net Interest Margin Variance ($ millions) Average Balance Yield Average Balance Yield Average Balance Yield Retail Auto Loan 64,566$ 5.31% 64,231$ 5.26% 58,373$ 5.26% Auto Lease (net of dep) 15,638 6.66% 16,824 6.51% 19,405 5.73% Commercial Auto 34,026 2.98% 34,077 2.78% 32,429 2.98% Corporate Finance 2,781 6.51% 2,506 6.33% 1,995 6.91% Mortgage 10,152 3.37% 9,809 3.28% 8,006 3.50% Cash, Securities and Other 19,758 2.06% 18,822 1.98% 20,300 1.70% Total Earning Assets 146,921$ 4.37% 146,269$ 4.29% 140,508$ 4.21% Interest Revenue 1,595$ 1,582$ 1,457$ LT Unsecured Debt 22,452$ 4.89% 21,716$ 4.55% 22,838$ 5.24% Secured Debt 37,587 1.48% 40,134 1.27% 40,562 1.19% Deposits (2) 68,240 1.14% 64,985 1.15% 59,445 1.17% Other Borrowings (3) 11,709 1.06% 11,695 0.95% 9,216 0.70% Total Funding Sources (1) 139,988$ 1.82% 138,530$ 1.70% 132,061$ 1.85% Interest Expense 635$ 593$ 602$ Net Financing Revenue (4) 960$ 989$ 855$ NIM 2.63% 2.68% 2.47% 1Q16 4Q15 1Q15 Net Interest Margin • Net Interest Margin (1) up 16 bps YoY driven by higher asset yields and lower cost of funds – Cost of funds (1) down 3 bps YoY driven by continued deposit growth partially offset by increased rate on variable debt • Positioned AFS and hedge portfolio and realized gains through Other Revenue as yield curve flattened • Reduced liability sensitivity during the quarter (1) Excludes OID (2) Includes brokered deposits. Includes average noninterest - bearing deposits of $92 million in 1Q16, $95 million in 4Q15 and $73 million in 1Q15 (3) Includes Demand Notes, FHLB, and Repurchase Agreements (4) Excludes dividend income from equity investments
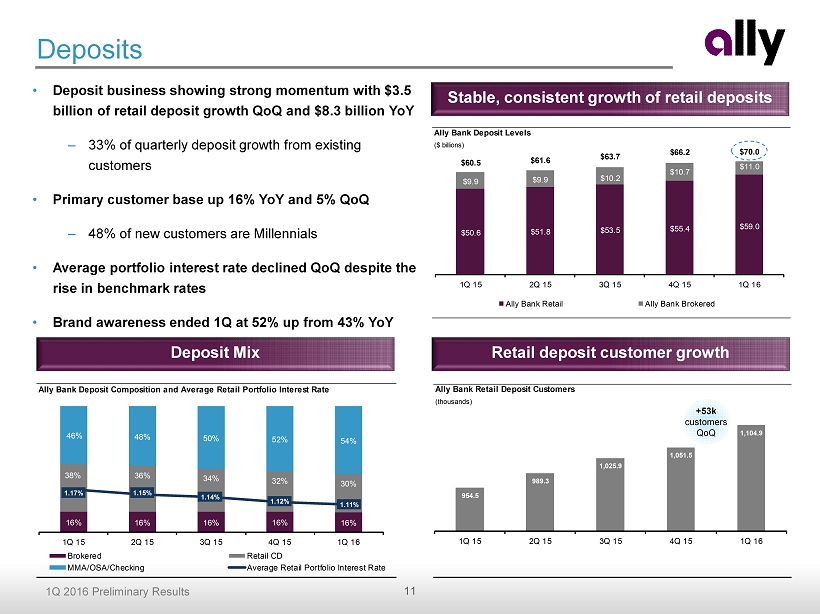
11 1Q 2016 Preliminary Results Ally Bank Retail Deposit Customers (thousands) 954.5 989.3 1,025.9 1,051.5 1,104.9 1Q 15 2Q 15 3Q 15 4Q 15 1Q 16 +53k customers QoQ Ally Bank Deposit Levels ($ billions) $50.6 $51.8 $53.5 $55.4 $59.0 $9.9 $9.9 $10.2 $10.7 $11.0 $60.5 $61.6 $63.7 $66.2 $70.0 1Q 15 2Q 15 3Q 15 4Q 15 1Q 16 Ally Bank Retail Ally Bank Brokered Deposits • Deposit business showing strong momentum with $3.5 billion of retail deposit growth QoQ and $8.3 billion YoY – 33% of quarterly deposit growth from existing customers • Primary customer base up 16% YoY and 5% QoQ – 48% of new customers are Millennials • Average portfolio interest rate declined QoQ despite the rise in benchmark rates • Brand awareness ended 1Q at 52% up from 43% YoY Stable, consistent growth of retail deposits Deposit Mix Retail deposit customer growth Ally Bank Deposit Composition and Average Retail Portfolio Interest Rate 16% 16% 16% 16% 16% 38% 36% 34% 32% 30% 46% 48% 50% 52% 54% 1.17% 1.15% 1.14% 1.12% 1.11% 1Q 15 2Q 15 3Q 15 4Q 15 1Q 16 Brokered Retail CD MMA/OSA/Checking Average Retail Portfolio Interest Rate
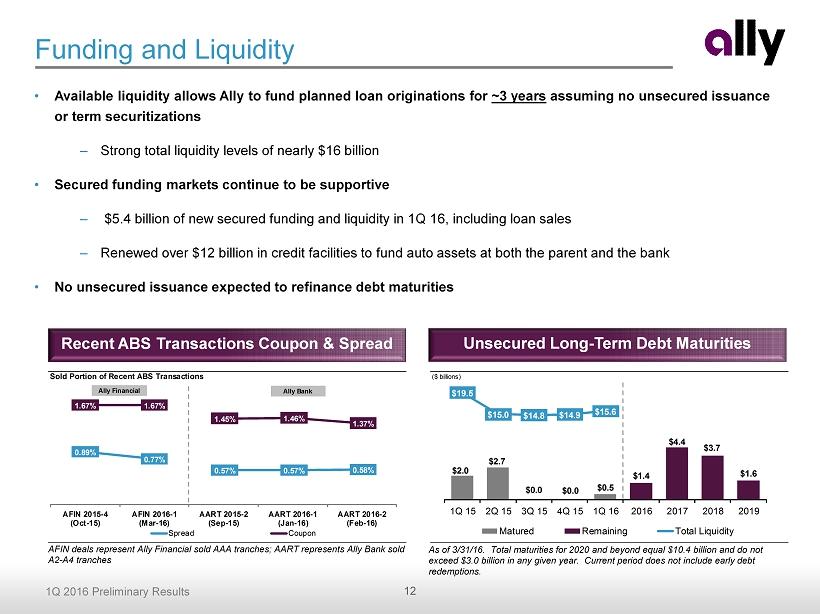
12 1Q 2016 Preliminary Results ($ billions) $2.0 $2.7 $0.0 $0.0 $0.5 $1.4 $4.4 $3.7 $1.6 $19.5 $15.0 $14.8 $14.9 $15.6 1Q 15 2Q 15 3Q 15 4Q 15 1Q 16 2016 2017 2018 2019 Matured Remaining Total Liquidity • Available liquidity allows Ally to fund planned loan originations for ~3 years assuming no unsecured issuance or term securitizations – Strong total liquidity levels of nearly $16 billion • Secured funding markets continue to be supportive – $5.4 billion of new secured funding and liquidity in 1Q 16, including loan sales – Renewed over $12 billion in credit facilities to fund auto assets at both the parent and the bank • No unsecured issuance expected to refinance debt maturities Funding and Liquidity As of 3/31/16. Total maturities for 2020 and beyond equal $10.4 billion and do not exceed $3.0 billion in any given year. Current period does not include early debt redemptions. Unsecured Long - Term Debt Maturities Recent ABS Transactions Coupon & Spread AFIN deals represent Ally Financial sold AAA tranches; AART represents Ally Bank sold A2 - A4 tranches Sold Portion of Recent ABS Transactions 0.89% 0.77% 1.67% 1.67% AFIN 2015-4 (Oct-15) AFIN 2016-1 (Mar-16) AART 2015-2 (Sep-15) AART 2016-1 (Jan-16) AART 2016-2 (Feb-16) 0.57% 0.57% 0.58% 1.45% 1.46% 1.37% Spread Coupon Ally Financial Ally Bank
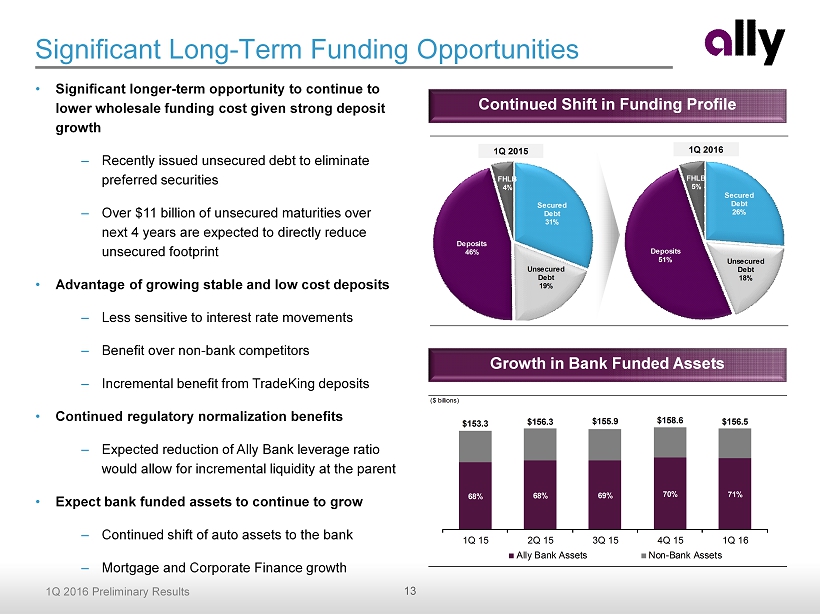
13 1Q 2016 Preliminary Results Significant Long - Term Funding Opportunities • Significant longer - term opportunity to continue to lower wholesale funding cost given strong deposit growth – Recently issued unsecured debt to eliminate preferred securities – Over $ 11 billion of unsecured maturities over next 4 years are expected to directly reduce unsecured footprint • Advantage of growing stable and low cost deposits – Less sensitive to interest rate movements – Benefit over non - bank competitors – Incremental benefit from TradeKing deposits • Continued regulatory normalization benefits – Expected reduction of Ally Bank leverage ratio would allow for incremental liquidity at the parent • Expect bank funded assets to continue to grow – Continued shift of auto assets to the bank – Mortgage and Corporate Finance growth Continued Shift in Funding Profile Secured Debt 31% Unsecured Debt 19% Deposits 46% FHLB 4% Secured Debt 26% Unsecured Debt 18% Deposits 51% FHLB 5% 1Q 2015 1Q 2016 Growth in Bank Funded Assets ($ billions) 68% 68% 69% 70% 71% $153.3 $156.3 $155.9 $158.6 $156.5 1Q 15 2Q 15 3Q 15 4Q 15 1Q 16 Ally Bank Assets Non-Bank Assets
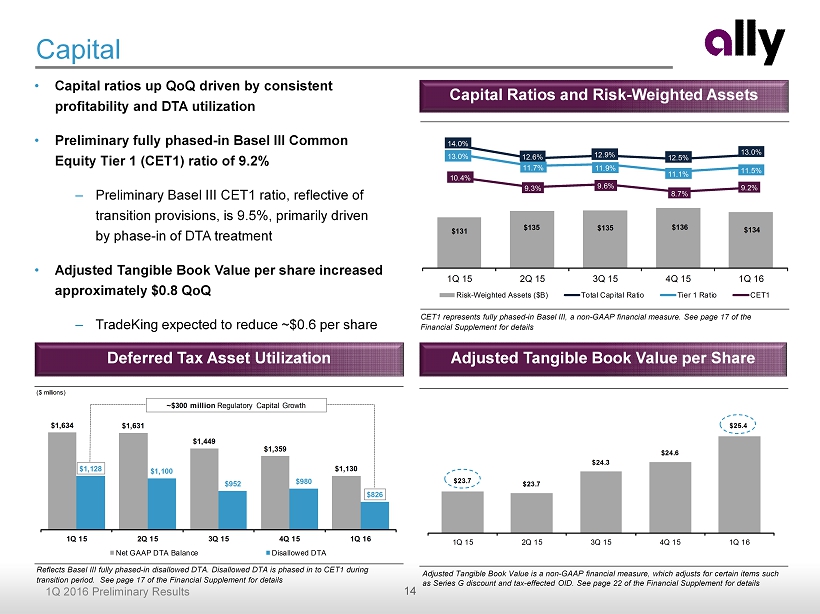
14 1Q 2016 Preliminary Results $23.7 $23.7 $24.3 $24.6 $25.4 1Q 15 2Q 15 3Q 15 4Q 15 1Q 16 Capital • Capital ratios up QoQ driven by consistent profitability and DTA utilization • Preliminary fully phased - in Basel III Common Equity Tier 1 (CET1) ratio of 9.2% – Preliminary Basel III CET1 ratio, reflective of transition provisions, is 9.5%, primarily driven by phase - in of DTA treatment • Adjusted Tangible Book Value per share increased approximately $0.8 QoQ – TradeKing expected to reduce ~$0.6 per share CET1 represents fully phased - in Basel III, a non - GAAP financial measure. See page 17 of the Financial Supplement for details Capital Ratios and Risk - Weighted Assets Adjusted Tangible Book Value per Share Adjusted Tangible Book Value is a non - GAAP financial measure, which adjusts for certain items such as Series G discount and tax - effected OID . See page 22 of the Financial Supplement for details Deferred Tax Asset Utilization Reflects Basel III fully phased - in disallowed DTA. Disallowed DTA is phased in to CET1 during transition period. See page 17 of the Financial Supplement for details ($ millions) $1,634 $1,631 $1,449 $1,359 $1,130 $1,128 $1,100 $952 $980 $826 1Q 15 2Q 15 3Q 15 4Q 15 1Q 16 Net GAAP DTA Balance Disallowed DTA ~$300 million Regulatory Capital Growth $131 $135 $135 $136 $134 14.0% 12.6% 12.9% 12.5% 13.0% 13.0% 11.7% 11.9% 11.1% 11.5% 10.4% 9.3% 9.6% 8.7% 9.2% 1Q 15 2Q 15 3Q 15 4Q 15 1Q 16 Risk-Weighted Assets ($B) Total Capital Ratio Tier 1 Ratio CET1
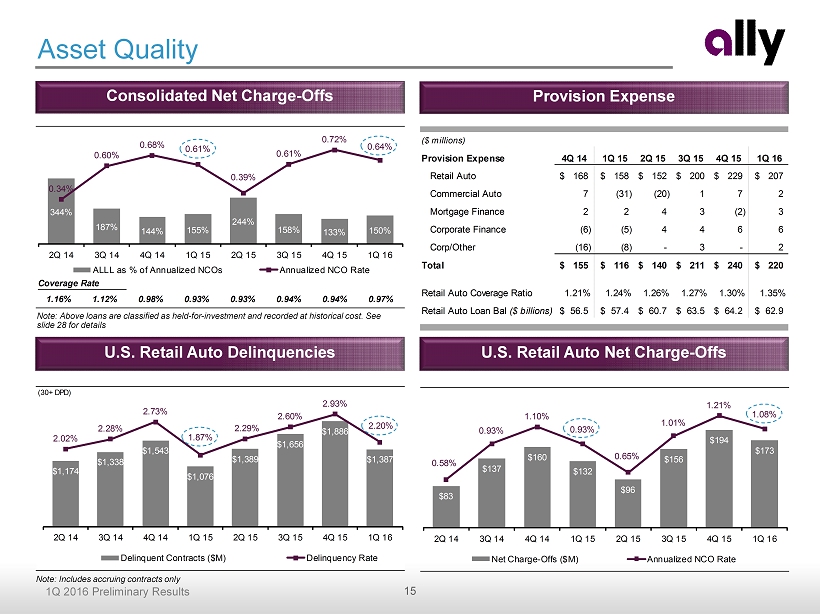
15 1Q 2016 Preliminary Results (30+ DPD) $1,174 $1,338 $1,543 $1,076 $1,389 $1,656 $1,886 $1,387 2.02% 2.28% 2.73% 1.87% 2.29% 2.60% 2.93% 2.20% 2Q 14 3Q 14 4Q 14 1Q 15 2Q 15 3Q 15 4Q 15 1Q 16 Delinquent Contracts ($M) Delinquency Rate 0.97%0.98% 0.93% 0.93% 0.94% 0.94%1.16% Coverage Rate 1.12% 344% 187% 144% 155% 244% 158% 133% 150% 0.34% 0.60% 0.68% 0.61% 0.39% 0.61% 0.72% 0.64% 50% 2Q 14 3Q 14 4Q 14 1Q 15 2Q 15 3Q 15 4Q 15 1Q 16 ALLL as % of Annualized NCOs Annualized NCO Rate $83 $137 $160 $132 $96 $156 $194 $173 0.58% 0.93% 1.10% 0.93% 0.65% 1.01% 1.21% 1.08% 2Q 14 3Q 14 4Q 14 1Q 15 2Q 15 3Q 15 4Q 15 1Q 16 Net Charge-Offs ($M) Annualized NCO Rate Consolidated Net Charge - Offs Provision Expense Asset Quality U.S. Retail Auto Net Charge - Offs U.S. Retail Auto Delinquencies Note: Above loans are classified as held - for - investment and recorded at historical cost. See slide 28 for details Note: Includes accruing contracts only ($ millions) Provision Expense 4Q 14 1Q 15 2Q 15 3Q 15 4Q 15 1Q 16 Retail Auto 168$ 158$ 152$ 200$ 229$ 207$ Commercial Auto 7 (31) (20) 1 7 2 Mortgage Finance 2 2 4 3 (2) 3 Corporate Finance (6) (5) 4 4 6 6 Corp/Other (16) (8) - 3 - 2 Total 155$ 116$ 140$ 211$ 240$ 220$ Retail Auto Coverage Ratio 1.21% 1.24% 1.26% 1.27% 1.30% 1.35% Retail Auto Loan Bal ($ billions) 56.5$ 57.4$ 60.7$ 63.5$ 64.2$ 62.9$

16 1Q 2016 Preliminary Results Retail Originations Total Average Originated Yield and NAALR % Nonprime (<620 FICO) Retail Quarterly Originations 13.9% 14.7% 14.4% 13.7% 12.6% 5.26% 5.28% 5.27% 5.53% 5.85% 1.10% 1.12% 1.09% 1.17% 1.17% 1Q 2015 2Q 2015 3Q 2015 4Q 2015 1Q 2016 Total Originated Yield NAALR +59 bps +7 bps Key Financials ($ millions) 1Q 16 4Q 15 1Q 15 Net financing revenue 896$ (4)$ 87$ Total other revenue 77 12 25 Total net revenue 973 8 112 Provision for loan losses 209 (27) 82 Noninterest expense 427 31 (1) Pre-tax income from continuing ops 337$ 4$ 31$ U.S. auto earning assets 112,209$ (3,182)$ 1,555$ Net lease revenue Operating lease revenue 769$ (43)$ (127)$ Depreciation expense 565 (39) (126) Remarketing gains 55 (13) (14) Total depreciation expense 510 (26) (112) Net lease revenue 259$ (17)$ (15)$ Increase/(Decrease) vs. • Auto Finance reported pre - tax income of $337 million in 1Q, up $31 million YoY and up $4 million QoQ – Net financing revenue higher YoY due to successful retail growth focused on risk - adjusted returns – Provision higher YoY primarily driven by loan growth and mix shift and a commercial release in the prior year; down QoQ driven by seasonally lower retail charge - offs ▪ Incremental provision of $6 million due to loan sales in 1Q 2016 • Earning assets up $1.6 billion YoY and down $3.2 billion QoQ – Executed $2.6 billion of loan sales in 1Q 2016 – Commercial balances up $1.6 billion YoY • $9.0 billion of originations in 1Q – Highest quarterly used volume in Ally history – Record application volume of 2.8 million up 12% YoY – Ex. GM subvented and lease, originations up 10% YoY – Growth channel up 23% YoY Auto Finance – Results NAALR = Projected Net Average Annualized Loss Rate
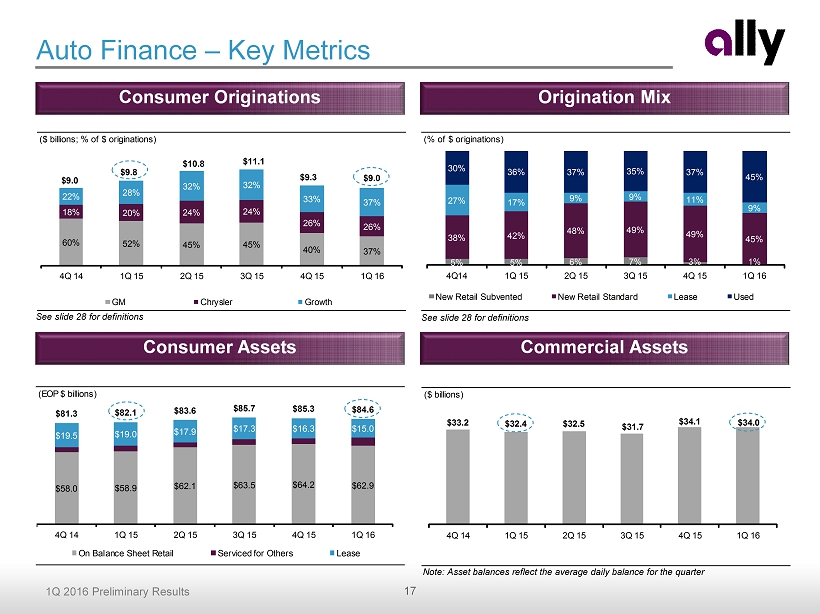
17 1Q 2016 Preliminary Results ($ billions) $33.2 $32.4 $32.5 $31.7 $34.1 $34.0 4Q 14 1Q 15 2Q 15 3Q 15 4Q 15 1Q 16 (EOP $ billions) $58.0 $58.9 $62.1 $63.5 $64.2 $62.9 $19.5 $19.0 $17.9 $17.3 $16.3 $15.0 $81.3 $82.1 $83.6 $85.7 $85.3 $84.6 4Q 14 1Q 15 2Q 15 3Q 15 4Q 15 1Q 16 On Balance Sheet Retail Serviced for Others Lease ($ billions; % of $ originations) 60% 52% 45% 45% 40% 37% 18% 20% 24% 24% 26% 26% 22% 28% 32% 32% 33% 37% $9.0 $9.8 $10.8 $11.1 $9.3 $9.0 4Q 14 1Q 15 2Q 15 3Q 15 4Q 15 1Q 16 GM Chrysler Growth Auto Finance – Key Metrics See slide 28 for definitions Consumer Assets Commercial Assets Consumer Originations Origination Mix Note: Asset balances reflect the average daily balance for the quarter See slide 28 for definitions (% of $ originations) 5% 5% 6% 7% 3% 1% 38% 42% 48% 49% 49% 45% 27% 17% 9% 9% 11% 9% 30% 36% 37% 35% 37% 45% 4Q14 1Q 15 2Q 15 3Q 15 4Q 15 1Q 16 New Retail Subvented New Retail Standard Lease Used
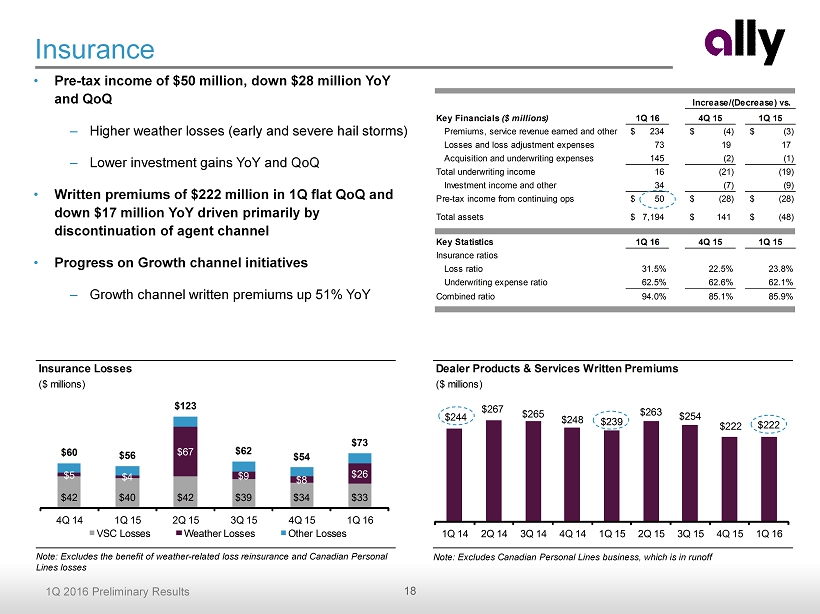
18 1Q 2016 Preliminary Results Key Financials ($ millions) 1Q 16 4Q 15 1Q 15 Premiums, service revenue earned and other 234$ (4)$ (3)$ Losses and loss adjustment expenses 73 19 17 Acquisition and underwriting expenses 145 (2) (1) Total underwriting income 16 (21) (19) Investment income and other 34 (7) (9) Pre-tax income from continuing ops 50$ (28)$ (28)$ Total assets 7,194$ 141$ (48)$ Key Statistics 1Q 16 4Q 15 1Q 15 Insurance ratios Loss ratio 31.5% 22.5% 23.8% Underwriting expense ratio 62.5% 62.6% 62.1% Combined ratio 94.0% 85.1% 85.9% Increase/(Decrease) vs. Insurance Losses ($ millions) $42 $40 $42 $39 $34 $33 $5 $4 $67 $9 $8 $26 $60 $56 $123 $62 $54 $73 4Q 14 1Q 15 2Q 15 3Q 15 4Q 15 1Q 16 VSC Losses Weather Losses Other Losses Dealer Products & Services Written Premiums ($ millions) $244 $267 $265 $248 $239 $263 $254 $222 $222 1Q 14 2Q 14 3Q 14 4Q 14 1Q 15 2Q 15 3Q 15 4Q 15 1Q 16 Insurance • Pre - tax income of $50 million, down $28 million YoY and QoQ – Higher weather losses (early and severe hail storms) – Lower investment gains YoY and QoQ • Written premiums of $222 million in 1Q flat QoQ and down $17 million YoY driven primarily by discontinuation of agent channel • Progress on Growth channel initiatives – Growth channel written premiums up 51 % YoY Note: Excludes Canadian Personal Lines business, which is in runoff Note: Excludes the benefit of weather - related loss reinsurance and Canadian Personal Lines losses

19 1Q 2016 Preliminary Results Mortgage Finance HFI Assets ($ billions) $0.7 $2.0 $1.0 $0.5 $1.4 Bulk Purchase Activity $3.9 $5.6 $6.3 $6.4 $7.4 1Q 15 2Q 15 3Q 15 4Q 15 1Q 16 Key Financials ($ millions) 1Q 16 4Q 15 1Q 15 Total net revenue 20$ 2$ 9$ Provision for loan losses 3 5 1 Noninterest expense (1) 15 4 7 Pre-tax income from continuing ops 2$ (7)$ 1$ Total assets 7,493$ 1,032$ 3,552$ Mortgage Finance HFI Portfolio 1Q 16 4Q 15 1Q 15 Net Carry Value ($ billions) 7.4$ 6.4$ 3.9$ Wtd. Avg. LTV/CLTV (2) 60.8% 60.4% 59.6% Refreshed FICO 770 769 768 Increase/(Decrease) vs. Mortgage Finance (1) Noninterest expense includes corporate allocations of $10 million in 1Q 2016, $6 million in 4Q 2015, $6 million in 1Q 2015 (2) 1st lien only. Updated home values derived using a combination of appraisals, BPOs, AVMs and MSA level house price indices • As assets grow, the mortgage segment is expected to drive operating leverage and meaningful income contribution • Pre - tax income of $2 million, up $1 million YoY and down $7 million from the prior quarter – Net financing revenue higher driven by asset balance growth from bulk purchase activity – Provision up QoQ and YoY driven by bulk purchase volume and reserve releases that did not repeat – Noninterest expense increase driven by asset growth and expansion of Mortgage operating model • Total assets up $1.0 billion QoQ and $3.6 billion YoY – Bulk purchase activity of $4.8 billion post 1Q 15, partially offset by portfolio runoff
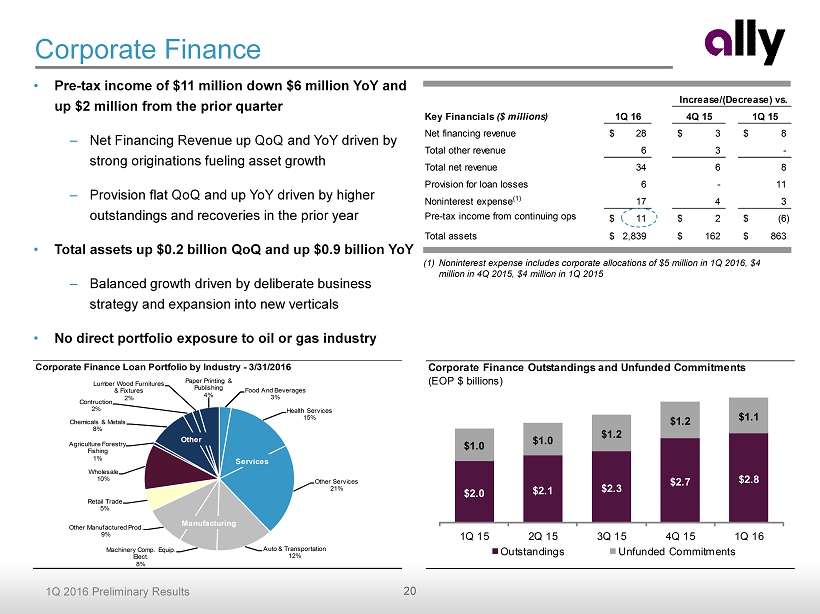
20 1Q 2016 Preliminary Results Key Financials ($ millions) 1Q 16 4Q 15 1Q 15 Net financing revenue 28$ 3$ 8$ Total other revenue 6 3 - Total net revenue 34 6 8 Provision for loan losses 6 - 11 Noninterest expense (1) 17 4 3 Pre-tax income from continuing ops 11$ 2$ (6)$ Total assets 2,839$ 162$ 863$ Increase/(Decrease) vs. • Pre - tax income of $11 million down $6 million YoY and up $2 million from the prior quarter – Net Financing Revenue up QoQ and YoY driven by strong originations fueling asset growth – Provision flat QoQ and up YoY driven by higher outstandings and recoveries in the prior year • Total assets up $0.2 billion QoQ and up $0.9 billion YoY – Balanced growth driven by deliberate business strategy and expansion into new verticals • No direct portfolio exposure to oil or gas industry Corporate Finance (1) Noninterest expense includes corporate allocations of $5 million in 1Q 2016, $4 million in 4Q 2015, $4 million in 1Q 2015 Corporate Finance Outstandings and Unfunded Commitments (EOP $ billions) $2.0 $2.1 $2.3 $2.7 $2.8 $1.0 $1.0 $1.2 $1.2 $1.1 1Q 15 2Q 15 3Q 15 4Q 15 1Q 16 Outstandings Unfunded Commitments Corporate Finance Loan Portfolio by Industry - 3/31/2016 Food And Beverages 3% Health Services 15% Other Services 21% Auto & Transportation 12% Machinery Comp. Equip. Elect. 8% Other Manufactured Prod. 9% Retail Trade 5% Wholesale 10% Agriculture Forestry Fishing 1% Chemicals & Metals 8% Contruction 2% Lumber Wood Furnitures & Fixtures 2% Paper Printing & Publishing 4% Services Manufacturing Other
21 1Q 2016 Preliminary Results Conclusion • Improved profitability on new auto originations • Maintaining credit discipline • Strong deposit balance and customer growth • Recently announced redemption of remaining Series A Preferred Stock • Capital return priority: Submitted CCAR plan to initiate a dividend and share repurchases • Earnings growth: Improving profitability and driving long term EPS growth • Continued migration of assets to Ally Bank • Positioned for long term success − Growing customer base and product offerings − Incremental franchise expansion in higher ROE businesses − Diversifying revenue and lowering capital markets funding Well positioned for continued solid financial results Driving long term shareholder value
Supplemental Charts
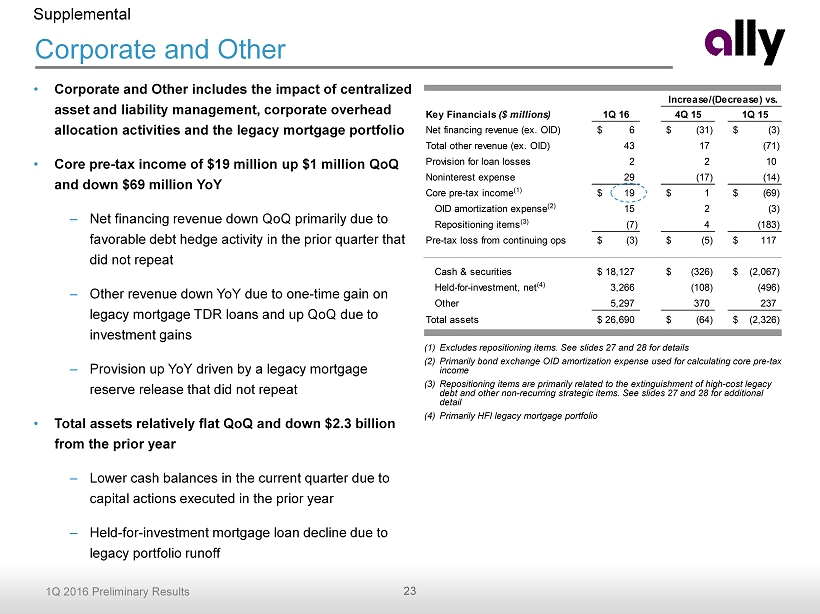
23 1Q 2016 Preliminary Results Key Financials ($ millions) 1Q 16 4Q 15 1Q 15 Net financing revenue (ex. OID) 6$ (31)$ (3)$ Total other revenue (ex. OID) 43 17 (71) Provision for loan losses 2 2 10 Noninterest expense 29 (17) (14) Core pre-tax income (1) 19$ 1$ (69)$ OID amortization expense (2) 15 2 (3) Repositioning items (3) (7) 4 (183) Pre-tax loss from continuing ops (3)$ (5)$ 117$ Cash & securities 18,127$ (326)$ (2,067)$ Held-for-investment, net (4) 3,266 (108) (496) Other 5,297 370 237 Total assets 26,690$ (64)$ (2,326)$ Increase/(Decrease) vs. (1) Excludes repositioning items. See slides 27 and 28 for details (2) Primarily bond exchange OID amortization expense used for calculating core pre - tax income (3) Repositioning items are primarily related to the extinguishment of high - cost legacy debt and other non - recurring strategic items. See slides 27 and 28 for additional detail (4) Primarily HFI legacy mortgage portfolio Corporate and Other Supplemental • Corporate and Other includes the impact of centralized asset and liability management, corporate overhead allocation activities and the legacy mortgage portfolio • Core pre - tax income of $19 million up $1 million QoQ and down $69 million YoY – Net financing revenue down QoQ primarily due to favorable debt hedge activity in the prior quarter that did not repeat – Other revenue down YoY due to one - time gain on legacy mortgage TDR loans and up QoQ due to investment gains – Provision up YoY driven by a legacy mortgage reserve release that did not repeat • Total assets relatively flat QoQ and down $2.3 billion from the prior year – Lower cash balances in the current quarter due to capital actions executed in the prior year – Held - for - investment mortgage loan decline due to legacy portfolio runoff

24 1Q 2016 Preliminary Results ($ millions) 1Q 16 4Q 15 1Q 15 4Q 15 1Q 15 Net financing revenue (1) 964$ 995$ 860$ (31)$ 103$ Total other revenue (1)(2) 380 358 440 22 (60) Provision for loan losses 220 240 116 (20) 104 Controllable expenses (2) 473 465 469 8 3 Other noninterest expenses 233 202 226 31 7 Core pre-tax income, ex. repositioning (3) 419$ 446$ 490$ (28)$ (71)$ Repositioning items (4) (7) (3) (190) 4 (183) Core pre-tax income 412$ 443$ 299$ (32)$ 112$ OID amortization expense (5) 15 12 17 2 (3) Income tax expense 150 155 103 (5) 47 Income (loss) from discontinued operations 3 (13) 397 16 (394) Net income 250$ 263$ 576$ (13)$ (326)$ Preferred dividends (6) 15 1,216 67 (1,201) (52) Net income (loss) attributable to common 235$ (953)$ 509$ 1,188$ (274)$ Increase/(Decrease) vs. First Quarter Financial Results (1) Excludes OID. Total other revenue excludes accelerated OID expense of $2 million in 1Q 2016 and $7 million in 1Q 2015 associated with debt redemptions (2) Excludes repositioning items. See slides 27 and 28 for details (3) Core pre - tax income as presented excludes the impact of repositioning items, OID amortization expense, income tax expense and di scontinued operations. See slides 27 and 28 for details (4) See slides 27 and 28 for details (5) Includes accelerated OID expense of $2 million in 1Q 2016 and $7 million in 1Q 2015 (6) Includes $1.2 billion of preferred stock redemptions in 4Q 2015 Supplemental

25 1Q 2016 Preliminary Results Interest Rate Sensitivity (1) Net financing revenue impacts reflect a rolling 12 - month view (2) Results in ~75% pass - through rate based on 1Q16 modeling and ~80 % pass - through rate based on 4Q15 modeling. See slide 28 for additional details Supplemental Net Financing Revenue Impact (1) vs. Forward Curve $ million Ally Modeled Scenario (2) 50% Deposit Pass-Through Ally Modeled Scenario (2) 50% Deposit Pass-Through +100 bp Instantaneous (29)$ 73$ (109)$ 13$ +100 bp Gradual (over 12 months) (16)$ 21$ (37)$ 4$ Stable rate environment (26)$ (27)$ 30$ 18$ 1Q16 4Q15
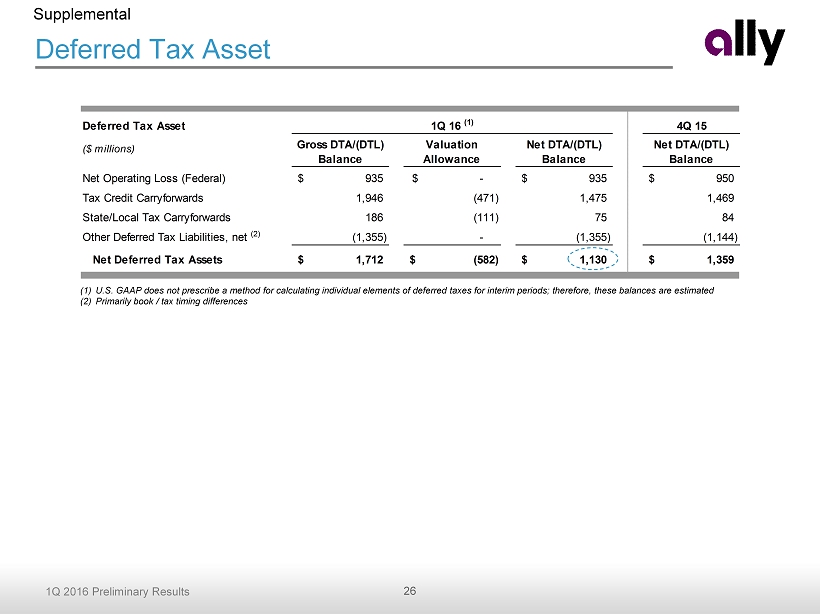
26 1Q 2016 Preliminary Results Deferred Tax Asset 4Q 15 ($ millions) Gross DTA/(DTL) Balance Valuation Allowance Net DTA/(DTL) Balance Net DTA/(DTL) Balance Net Operating Loss (Federal) 935$ -$ 935$ 950$ Tax Credit Carryforwards 1,946 (471) 1,475 1,469 State/Local Tax Carryforwards 186 (111) 75 84 Other Deferred Tax Liabilities, net (2) (1,355) - (1,355) (1,144) Net Deferred Tax Assets 1,712$ (582)$ 1,130$ 1,359$ 1Q 16 (1) Deferred Tax Asset Supplemental (1) U.S. GAAP does not prescribe a method for calculating individual elements of deferred taxes for interim periods; therefore , these balances are estimated (2) Primarily book / tax timing differences

27 1Q 2016 Preliminary Results Notes on non - GAAP and other financial measures Supplemental (1) Represents core pre - tax income excluding repositioning items. See slide 28 for definitions $ in millions GAAP OID & Repositioning Items Non-GAAP (1) GAAP OID & Repositioning Items Non-GAAP (1) GAAP OID & Repositioning Items Non-GAAP (1) Consolidated Ally Net financing revenue 951$ 13$ 964$ 983$ 12$ 995$ 850$ 10$ 860$ Total other revenue 376 4 380 356 2 358 243 197 440 Provision for loan losses 220 - 220 240 - 240 116 - 116 Controllable expenses 477 (4) 473 466 (1) 465 469 - 469 Other noninterest expenses 233 - 233 202 - 202 226 - 226 Pre-tax income from continuing ops 397$ 22$ 419$ 431$ 15$ 446$ 282$ 208$ 490$ Corporate / Other (incl. Legacy Mortgage) Net financing revenue (7)$ 13$ 6$ 25$ 12$ 37$ (2)$ 10$ 8$ Total other revenue (loss) 39 4 43 24 2 26 (83) 197 114 Provision for loan losses 2 - 2 - - - (8) - (8) Noninterest expense 33 (4) 29 47 (1) 46 43 - 43 Pre-tax income (loss) from continuing ops (3)$ 22$ 19$ 2$ 15$ 17$ (120)$ 208$ 88$ 1Q 16 4Q 15 1Q 15
28 1Q 2016 Preliminary Results Notes on non - GAAP and other financial measures Supplemental 1) Core pre - tax income (loss) is a non - GAAP financial measure. It is defined as income (loss) from continuing operations before income tax expense and primarily bond exchange original issue discount ("OID") amortization expense . 2) Repositioning items are primarily related to the extinguishment of high - cost legacy debt and non - recurring strategic activities. Certain discrete tax items were adjusted in the current quarter and included within repositioning items. 3) Core ROTCE is equal to Operating Net Income Available to Common divided by Normalized Common Equity. See page 23 in the Financial Supple men t for full calculation. A. Operating Net Income Available to Common is calculated as (a) Net Income from Continuing Operations plus (b) repositioning items net of tax expense using a normalized 35% rate plus (c) OID amortization expense net of tax expense using a normalized 35% rate plus (d) discrete tax items. Prior to 2016, Operating Net Income Available to Common was calculated as (a) Pre - Tax Income from Continuing Operations minus (b) Income Tax Expense usin g a normalized 34% rate plus (c) OID amortization expense minus (d) contractual preferred dividends associated with our Series A and Series G preferred stock plus (e) impact of any disclosed repositioning items. B. Normalized Common Equity is calculated as the two period average of (a) shareholder equity minus (b) the book value of preferred stock outstanding minus (c) goodwill and other intangibles minus (d) remaining original issue bond discount minus (e) remaining net deferred tax asset. 4) Adjusted Efficiency ratio is equal to (A) total noninterest expense less (i) Insurance operating segment related expenses, (ii) mortgage repurchase expense and (iii) expense related to repositioning items divided by ( B) total net revenue less (i) Insurance operating segment related revenue, (ii) OID amortization expense and (iii) any revenue related to repositioning items . See page 23 in the Financial Supplement for full calculation. 5) Corporate and Other primarily consists of activity related to centralized corporate treasury activities such as management of the cash and corporate investment securities and loan portfolios, short - and long - term debt, retail and brokered deposit liabilities, derivative instruments, the amortization of the discount associated with new debt issuances and bond exchanges, and the residual impacts of our corporate FTP and treasury ALM activities. Corporate a nd Other also includes certain equity investments, the management of our legacy mortgage portfolio, and reclassifications and eliminations between the reportable o per ating segments. 6) Controllable expenses include employee related costs, consulting and legal fees, marketing, information technology, facility, portfolio servicing a nd restructuring expenses. 7) U.S. consumer auto originations ▪ New Retail Subvented – subvented rate new vehicle loans ▪ New Retail Standard – standard rate new vehicle loans ▪ Lease – new vehicle lease originations ▪ Used – used vehicle loans ▪ Growth – total originations from non - GM/Chrysler dealers 8) Net charge - off ratios are calculated as annualized net charge - offs divided by average outstanding finance receivables and loans excluding loans measur ed at fair value and loans held - for - sale . 9) Interest rate risk modeling – Ally’s interest rate risk models use dynamic assumptions driven by a number of factors, including the overall level of interest rates and the spread between short - term and long - term interest rates to project changes in Ally’s retail deposit offered rates. Ally’s interest rate risk metrics currently assume a long - term retail deposit beta greater than 75%. We believe our deposits may ultimately be less sensitive to interest rate changes, which will reduce our overall exposure to rising rates. Assuming a long - term retail deposit beta of 50% ( vs. current assumption of greater than 75%) would result in a consolidated interest rate risk position that is asset sensitive. The following are non - GAAP measures which are important to the reader of the Consolidated Financial Statements but should be supplemental to primary U.S. GAAP measures.