
Exhibit 99.2 Ally Financial Inc. 3Q 2020 Earnings Review October 16, 2020 Contact Ally Investor Relations at (866) 710-4623 or investor.relations@ally.com 3Q 2020 Preliminary Results 1Exhibit 99.2 Ally Financial Inc. 3Q 2020 Earnings Review October 16, 2020 Contact Ally Investor Relations at (866) 710-4623 or investor.relations@ally.com 3Q 2020 Preliminary Results 1

Forward-Looking Statements and Additional Information This presentation and related communications should be read in conjunction with the financial statements, notes, and other information contained in our Annual Reports on Form 10-K, Quarterly Reports on Form 10-Q, and Current Reports on Form 8-K. This information is preliminary and based on company and third-party data available at the time of the presentation or related communication. This presentation and related communications contain forward-looking statements within the meaning of the Private Securities Litigation Reform Act of 1995. These statements can be identified by the fact that they do not relate strictly to historical or current facts—such as statements about future effects of COVID-19 and our ability to navigate them, the outlook for financial and operating metrics and performance, and future capital allocation and actions. Forward-looking statements often use words such as “believe,” “expect,” “anticipate,” “intend,” “pursue,” “seek,” “continue,” “estimate,” “project,” “outlook,” “forecast,” “potential,” “target,” “objective,” “trend,” “plan,” “goal,” “initiative,” “priorities,” or other words of comparable meaning or future-tense or conditional verbs such as “may,” “will,” “should,” “would,” or “could.” Forward-looking statements convey our expectations, intentions, or forecasts about future events, circumstances, or results. All forward-looking statements, by their nature, are subject to assumptions, risks, and uncertainties, which may change over time and many of which are beyond our control. You should not rely on any forward-looking statement as a prediction or guarantee about the future. Actual future objectives, strategies, plans, prospects, performance, conditions, or results may differ materially from those set forth in any forward-looking statement. Some of the factors that may cause actual results or other future events or circumstances to differ from those in forward-looking statements are described in our Annual Report on Form 10-K for the year ended December 31, 2019, our subsequent Quarterly Reports on Form 10-Q or Current Reports on Form 8-K, or other applicable documents that are filed or furnished with the U.S. Securities and Exchange Commission (collectively, our “SEC filings”). Any forward-looking statement made by us or on our behalf speaks only as of the date that it was made. We do not undertake to update any forward-looking statement to reflect the impact of events, circumstances, or results that arise after the date that the statement was made, except as required by applicable securities laws. You, however, should consult further disclosures (including disclosures of a forward-looking nature) that we may make in any subsequent SEC filings. This presentation and related communications contain specifically identified non-GAAP financial measures, which supplement the results that are reported according to U.S. generally accepted accounting principles (“GAAP”). These non-GAAP financial measures may be useful to investors but should not be viewed in isolation from, or as a substitute for, GAAP results. Differences between non- GAAP financial measures and comparable GAAP financial measures are reconciled in the presentation. Unless the context otherwise requires, the following definitions apply. The term “loans” means the following consumer and commercial products associated with our direct and indirect financing activities: loans, retail installment sales contracts, lines of credit, and other financing products excluding operating leases. The term “operating leases” means consumer- and commercial- vehicle lease agreements where Ally is the lessor and the lessee is generally not obligated to acquire ownership of the vehicle at lease-end or compensate Ally for the vehicle’s residual value. The terms “lend,” “finance,” and “originate” mean our direct extension or origination of loans, our purchase or acquisition of loans, or our purchase of operating leases, as applicable. The term “consumer” means all consumer products associated with our loan and operating-lease activities and all commercial retail installment sales contracts. The term “commercial” means all commercial products associated with our loan activities, other than commercial retail installment sales contracts. 3Q 2020 Preliminary Results 2Forward-Looking Statements and Additional Information This presentation and related communications should be read in conjunction with the financial statements, notes, and other information contained in our Annual Reports on Form 10-K, Quarterly Reports on Form 10-Q, and Current Reports on Form 8-K. This information is preliminary and based on company and third-party data available at the time of the presentation or related communication. This presentation and related communications contain forward-looking statements within the meaning of the Private Securities Litigation Reform Act of 1995. These statements can be identified by the fact that they do not relate strictly to historical or current facts—such as statements about future effects of COVID-19 and our ability to navigate them, the outlook for financial and operating metrics and performance, and future capital allocation and actions. Forward-looking statements often use words such as “believe,” “expect,” “anticipate,” “intend,” “pursue,” “seek,” “continue,” “estimate,” “project,” “outlook,” “forecast,” “potential,” “target,” “objective,” “trend,” “plan,” “goal,” “initiative,” “priorities,” or other words of comparable meaning or future-tense or conditional verbs such as “may,” “will,” “should,” “would,” or “could.” Forward-looking statements convey our expectations, intentions, or forecasts about future events, circumstances, or results. All forward-looking statements, by their nature, are subject to assumptions, risks, and uncertainties, which may change over time and many of which are beyond our control. You should not rely on any forward-looking statement as a prediction or guarantee about the future. Actual future objectives, strategies, plans, prospects, performance, conditions, or results may differ materially from those set forth in any forward-looking statement. Some of the factors that may cause actual results or other future events or circumstances to differ from those in forward-looking statements are described in our Annual Report on Form 10-K for the year ended December 31, 2019, our subsequent Quarterly Reports on Form 10-Q or Current Reports on Form 8-K, or other applicable documents that are filed or furnished with the U.S. Securities and Exchange Commission (collectively, our “SEC filings”). Any forward-looking statement made by us or on our behalf speaks only as of the date that it was made. We do not undertake to update any forward-looking statement to reflect the impact of events, circumstances, or results that arise after the date that the statement was made, except as required by applicable securities laws. You, however, should consult further disclosures (including disclosures of a forward-looking nature) that we may make in any subsequent SEC filings. This presentation and related communications contain specifically identified non-GAAP financial measures, which supplement the results that are reported according to U.S. generally accepted accounting principles (“GAAP”). These non-GAAP financial measures may be useful to investors but should not be viewed in isolation from, or as a substitute for, GAAP results. Differences between non- GAAP financial measures and comparable GAAP financial measures are reconciled in the presentation. Unless the context otherwise requires, the following definitions apply. The term “loans” means the following consumer and commercial products associated with our direct and indirect financing activities: loans, retail installment sales contracts, lines of credit, and other financing products excluding operating leases. The term “operating leases” means consumer- and commercial- vehicle lease agreements where Ally is the lessor and the lessee is generally not obligated to acquire ownership of the vehicle at lease-end or compensate Ally for the vehicle’s residual value. The terms “lend,” “finance,” and “originate” mean our direct extension or origination of loans, our purchase or acquisition of loans, or our purchase of operating leases, as applicable. The term “consumer” means all consumer products associated with our loan and operating-lease activities and all commercial retail installment sales contracts. The term “commercial” means all commercial products associated with our loan activities, other than commercial retail installment sales contracts. 3Q 2020 Preliminary Results 2

GAAP and Core Results: Quarterly ($ millions except per share data) 3Q 20 2Q 20 1Q 20 4Q 19 3Q 19 GAAP net income (loss) attributable to common shareholders (NIAC) $ 476 $ 241 $ (319) $ 378 $ 381 (1)(2) Core net income (loss) attributable to common shareholders $ 473 $ 228 $ (166) $ 364 $ 396 GAAP earnings per common share (EPS) (basic or diluted as applicable, NIAC) $ 1.26 $ 0.64 $ (0.85) $ 0.99 $ 0.97 (1)(3) Adjusted EPS $ 1.25 $ 0.61 $ (0.44) $ 0.95 $ 1.01 Return (NIAC) on GAAP shareholder's equity 13.6% 7.1% -9.1% 10.5% 10.6% (1)(4) Core ROTCE 15.2% 7.6% -5.4% 11.2% 12.3% GAAP common shareholder's equity per share $ 37.8 $ 37.0 $ 36.2 $ 38.5 $ 37.7 (1)(5) Adjusted tangible book value per share (Adjusted TBVPS) $ 34.6 $ 33.7 $ 32.8 $ 35.1 $ 34.7 Efficiency Ratio 53.7% 61.2% 65.2% 53.6% 52.3% (1)(6) Adjusted Efficiency Ratio 47.3% 52.5% 52.3% 49.4% 45.3% GAAP total net revenue $ 1,684 $ 1,609 $ 1,412 $ 1,643 $ 1,601 (1)(7) Adjusted total net revenue $ 1,680 $ 1,528 $ 1,606 $ 1,622 $ 1,620 (1) The following are non-GAAP financial measures which Ally believes are important to the reader of the Consolidated Financial Statements, but which are supplemental to and not a substitute for GAAP measures: Adjusted earnings per share (Adjusted EPS), Core pre-tax income (loss), Core net income (loss) attributable to common shareholders, Core return on tangible common equity (Core ROTCE), Adjusted efficiency ratio, Adjusted total net revenue, Net financing revenue (excluding Core OID), Adjusted other revenue, Core original issue discount (Core OID) amortization expense, Core outstanding original issue discount balance (Core OID balance), and Adjusted tangible book value per share (Adjusted TBVPS). These measures are used by management and we believe are useful to investors in assessing the company’s operating performance and capital. Refer to the Definitions of Non-GAAP Financial Measures and Other Key Terms, and Reconciliation to GAAP later in this document. (2) Core net income (loss) attributable to common shareholders is a non-GAAP financial measure that serves as the numerator in the calculations of Adjusted EPS and Core ROTCE and that, like those measures, is believed by management to help the reader better understand the operating performance of the core businesses and their ability to generate earnings. See pages 30 and 32 for calculation methodology and details. (3) Adjusted earnings per share (Adjusted EPS) is a non-GAAP financial measure that adjusts GAAP EPS for revenue and expense items that are typically strategic in nature or that management otherwise does not view as reflecting the operating performance of the company. Management believes Adjusted EPS can help the reader better understand the operating performance of the core businesses and their ability to generate earnings. See page 32 for calculation methodology and details. (4) Core return on tangible common equity (Core ROTCE) is a non-GAAP financial measure that management believes is helpful for readers to better understand the ongoing ability of the company to generate returns on its equity base that supports core operations. For purposes of this calculation, tangible common equity is adjusted for Core OID balance and the net deferred tax asset. See page 34 for calculation methodology and details. (5) Adjusted tangible book value per share (Adjusted TBVPS) is a non-GAAP financial measure that reflects the book value of equity attributable to shareholders even if tax-effected Core OID balance were accelerated immediately through the financial statements. As a result, management believes Adjusted TBVPS provides the reader with an assessment of value that is more conservative than GAAP common shareholder’s equity per share. See page 33 for calculation methodology and details. (6) Adjusted efficiency ratio is a non-GAAP financial measure that management believes is helpful to readers in comparing the efficiency of its core banking and lending businesses with those of its peers. Adjusted efficiency ratio generally adjusts for Insurance segment revenue and expense, rep and warrant expense, Core OID, and repositioning and other. See page 35 for calculation methodology and details. (7) Adjusted total net revenue is a non-GAAP financial measure that adjusts GAAP total net revenue for Core OID and for change in the fair value of equity securities due to the implementation of ASU 2016-01 which requires change in the fair value of equity securities to be recognized in current period net income as compared to periods prior to 1/1/18 in which such adjustments were recognized through other comprehensive income, a component of equity. See page 37 for calculation methodology and details. 3Q 2020 Preliminary Results 3GAAP and Core Results: Quarterly ($ millions except per share data) 3Q 20 2Q 20 1Q 20 4Q 19 3Q 19 GAAP net income (loss) attributable to common shareholders (NIAC) $ 476 $ 241 $ (319) $ 378 $ 381 (1)(2) Core net income (loss) attributable to common shareholders $ 473 $ 228 $ (166) $ 364 $ 396 GAAP earnings per common share (EPS) (basic or diluted as applicable, NIAC) $ 1.26 $ 0.64 $ (0.85) $ 0.99 $ 0.97 (1)(3) Adjusted EPS $ 1.25 $ 0.61 $ (0.44) $ 0.95 $ 1.01 Return (NIAC) on GAAP shareholder's equity 13.6% 7.1% -9.1% 10.5% 10.6% (1)(4) Core ROTCE 15.2% 7.6% -5.4% 11.2% 12.3% GAAP common shareholder's equity per share $ 37.8 $ 37.0 $ 36.2 $ 38.5 $ 37.7 (1)(5) Adjusted tangible book value per share (Adjusted TBVPS) $ 34.6 $ 33.7 $ 32.8 $ 35.1 $ 34.7 Efficiency Ratio 53.7% 61.2% 65.2% 53.6% 52.3% (1)(6) Adjusted Efficiency Ratio 47.3% 52.5% 52.3% 49.4% 45.3% GAAP total net revenue $ 1,684 $ 1,609 $ 1,412 $ 1,643 $ 1,601 (1)(7) Adjusted total net revenue $ 1,680 $ 1,528 $ 1,606 $ 1,622 $ 1,620 (1) The following are non-GAAP financial measures which Ally believes are important to the reader of the Consolidated Financial Statements, but which are supplemental to and not a substitute for GAAP measures: Adjusted earnings per share (Adjusted EPS), Core pre-tax income (loss), Core net income (loss) attributable to common shareholders, Core return on tangible common equity (Core ROTCE), Adjusted efficiency ratio, Adjusted total net revenue, Net financing revenue (excluding Core OID), Adjusted other revenue, Core original issue discount (Core OID) amortization expense, Core outstanding original issue discount balance (Core OID balance), and Adjusted tangible book value per share (Adjusted TBVPS). These measures are used by management and we believe are useful to investors in assessing the company’s operating performance and capital. Refer to the Definitions of Non-GAAP Financial Measures and Other Key Terms, and Reconciliation to GAAP later in this document. (2) Core net income (loss) attributable to common shareholders is a non-GAAP financial measure that serves as the numerator in the calculations of Adjusted EPS and Core ROTCE and that, like those measures, is believed by management to help the reader better understand the operating performance of the core businesses and their ability to generate earnings. See pages 30 and 32 for calculation methodology and details. (3) Adjusted earnings per share (Adjusted EPS) is a non-GAAP financial measure that adjusts GAAP EPS for revenue and expense items that are typically strategic in nature or that management otherwise does not view as reflecting the operating performance of the company. Management believes Adjusted EPS can help the reader better understand the operating performance of the core businesses and their ability to generate earnings. See page 32 for calculation methodology and details. (4) Core return on tangible common equity (Core ROTCE) is a non-GAAP financial measure that management believes is helpful for readers to better understand the ongoing ability of the company to generate returns on its equity base that supports core operations. For purposes of this calculation, tangible common equity is adjusted for Core OID balance and the net deferred tax asset. See page 34 for calculation methodology and details. (5) Adjusted tangible book value per share (Adjusted TBVPS) is a non-GAAP financial measure that reflects the book value of equity attributable to shareholders even if tax-effected Core OID balance were accelerated immediately through the financial statements. As a result, management believes Adjusted TBVPS provides the reader with an assessment of value that is more conservative than GAAP common shareholder’s equity per share. See page 33 for calculation methodology and details. (6) Adjusted efficiency ratio is a non-GAAP financial measure that management believes is helpful to readers in comparing the efficiency of its core banking and lending businesses with those of its peers. Adjusted efficiency ratio generally adjusts for Insurance segment revenue and expense, rep and warrant expense, Core OID, and repositioning and other. See page 35 for calculation methodology and details. (7) Adjusted total net revenue is a non-GAAP financial measure that adjusts GAAP total net revenue for Core OID and for change in the fair value of equity securities due to the implementation of ASU 2016-01 which requires change in the fair value of equity securities to be recognized in current period net income as compared to periods prior to 1/1/18 in which such adjustments were recognized through other comprehensive income, a component of equity. See page 37 for calculation methodology and details. 3Q 2020 Preliminary Results 3
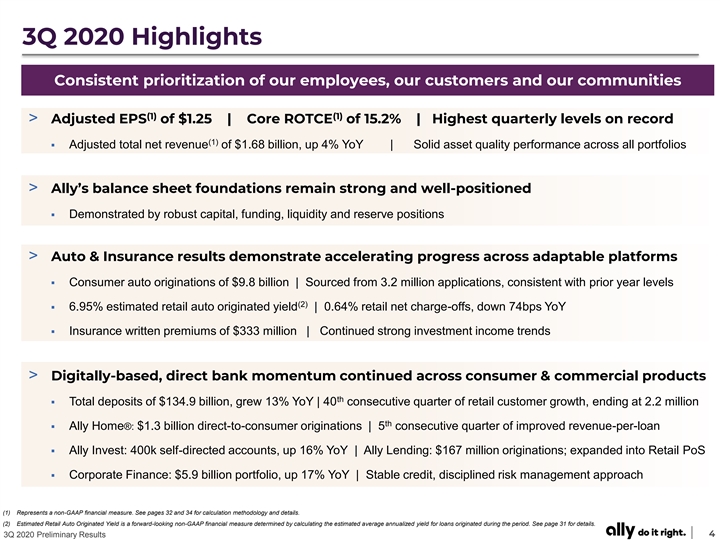
3Q 2020 Highlights Consistent prioritization of our employees, our customers and our communities (1) (1) > Adjusted EPS of $1.25 | Core ROTCE of 15.2% | Highest quarterly levels on record (1) ▪ Adjusted total net revenue of $1.68 billion, up 4% YoY | Solid asset quality performance across all portfolios > Ally’s balance sheet foundations remain strong and well-positioned ▪ Demonstrated by robust capital, funding, liquidity and reserve positions > Auto & Insurance results demonstrate accelerating progress across adaptable platforms ▪ Consumer auto originations of $9.8 billion | Sourced from 3.2 million applications, consistent with prior year levels (2) ▪ 6.95% estimated retail auto originated yield | 0.64% retail net charge-offs, down 74bps YoY ▪ Insurance written premiums of $333 million | Continued strong investment income trends > Digitally-based, direct bank momentum continued across consumer & commercial products th ▪ Total deposits of $134.9 billion, grew 13% YoY | 40 consecutive quarter of retail customer growth, ending at 2.2 million th ▪ Ally Home®: $1.3 billion direct-to-consumer originations | 5 consecutive quarter of improved revenue-per-loan ▪ Ally Invest: 400k self-directed accounts, up 16% YoY | Ally Lending: $167 million originations; expanded into Retail PoS ▪ Corporate Finance: $5.9 billion portfolio, up 17% YoY | Stable credit, disciplined risk management approach (1) Represents a non-GAAP financial measure. See pages 32 and 34 for calculation methodology and details. (2) Estimated Retail Auto Originated Yield is a forward-looking non-GAAP financial measure determined by calculating the estimated average annualized yield for loans originated during the period. See page 31 for details. 3Q 2020 Preliminary Results 43Q 2020 Highlights Consistent prioritization of our employees, our customers and our communities (1) (1) > Adjusted EPS of $1.25 | Core ROTCE of 15.2% | Highest quarterly levels on record (1) ▪ Adjusted total net revenue of $1.68 billion, up 4% YoY | Solid asset quality performance across all portfolios > Ally’s balance sheet foundations remain strong and well-positioned ▪ Demonstrated by robust capital, funding, liquidity and reserve positions > Auto & Insurance results demonstrate accelerating progress across adaptable platforms ▪ Consumer auto originations of $9.8 billion | Sourced from 3.2 million applications, consistent with prior year levels (2) ▪ 6.95% estimated retail auto originated yield | 0.64% retail net charge-offs, down 74bps YoY ▪ Insurance written premiums of $333 million | Continued strong investment income trends > Digitally-based, direct bank momentum continued across consumer & commercial products th ▪ Total deposits of $134.9 billion, grew 13% YoY | 40 consecutive quarter of retail customer growth, ending at 2.2 million th ▪ Ally Home®: $1.3 billion direct-to-consumer originations | 5 consecutive quarter of improved revenue-per-loan ▪ Ally Invest: 400k self-directed accounts, up 16% YoY | Ally Lending: $167 million originations; expanded into Retail PoS ▪ Corporate Finance: $5.9 billion portfolio, up 17% YoY | Stable credit, disciplined risk management approach (1) Represents a non-GAAP financial measure. See pages 32 and 34 for calculation methodology and details. (2) Estimated Retail Auto Originated Yield is a forward-looking non-GAAP financial measure determined by calculating the estimated average annualized yield for loans originated during the period. See page 31 for details. 3Q 2020 Preliminary Results 4

Ally’s Sustainable Competitive Advantage Auto & Insurance: Established, Market-leading Capabilities Tech, Digital Tools & Data Analytics Full-Market Reach Across Growing Dealer Base Established & Emerging Players | Franchised & Independent Modern Servicing System | Digital, Self-service Portals Full Product Suite + Real-time Market Insights Dynamic Underwriting + Disciplined Servicer Retail, Lease, Floorplan | Insurance | SmartAuction Full-Spectrum Credit Expertise | Customer-Focused Actions Strong Dealer-Partner + Differentiated Service Levels Proven Capabilities + Adaptable Model 100-years in Auto | Anticipating & Evolving with Market Enhanced Dealer Engagement | Experienced Field Reps & Teams Ally Bank: Early-Disruptor With Expanding Digital Consumer Platform Digitally-based, Frictionless Platforms Tech + Data-Driven Approach Leveraging Digital Model for Insights & Trends 0 Branches | Differentiated by Digital | Award-winning High Customer Growth + Low Cost to Acquire Diversified Consumer + Commercial Product Offerings 10-years of Growth | Millennial-driven Account Openings Save, Pay, Borrow & Invest | Ongoing Relationship Deepening Scalable Infrastructure + Strategically Partnered Award-winning Offerings + Leading Customer Service Positioned for Organic Growth | Enhancing-Partnerships Built for the Customer | Low Fees | Strong Loyalty & Satisfaction 3Q 2020 Preliminary Results 5Ally’s Sustainable Competitive Advantage Auto & Insurance: Established, Market-leading Capabilities Tech, Digital Tools & Data Analytics Full-Market Reach Across Growing Dealer Base Established & Emerging Players | Franchised & Independent Modern Servicing System | Digital, Self-service Portals Full Product Suite + Real-time Market Insights Dynamic Underwriting + Disciplined Servicer Retail, Lease, Floorplan | Insurance | SmartAuction Full-Spectrum Credit Expertise | Customer-Focused Actions Strong Dealer-Partner + Differentiated Service Levels Proven Capabilities + Adaptable Model 100-years in Auto | Anticipating & Evolving with Market Enhanced Dealer Engagement | Experienced Field Reps & Teams Ally Bank: Early-Disruptor With Expanding Digital Consumer Platform Digitally-based, Frictionless Platforms Tech + Data-Driven Approach Leveraging Digital Model for Insights & Trends 0 Branches | Differentiated by Digital | Award-winning High Customer Growth + Low Cost to Acquire Diversified Consumer + Commercial Product Offerings 10-years of Growth | Millennial-driven Account Openings Save, Pay, Borrow & Invest | Ongoing Relationship Deepening Scalable Infrastructure + Strategically Partnered Award-winning Offerings + Leading Customer Service Positioned for Organic Growth | Enhancing-Partnerships Built for the Customer | Low Fees | Strong Loyalty & Satisfaction 3Q 2020 Preliminary Results 5

Ally’s Customer Evolution 10-Years of Customer Growth Ally’s Growing Customer Base Ally Bank Customer Trends Retail Deposit Customers % Multi-Product Customers 8.5M+ 2.2M 2.0M customers 7% # of Customers 6% 1.2M 4.5M 0.8M Auto 0.4M <1% 2010 2013 2016 2019 3Q 2020 Note: Multi-product Customers represent Deposit Customers with an Ally Invest or Ally Home relationship. Insurance Ally Auto Dealer Relationship & Application Trends Active U.S. Dealer Relationships U.S. Consumer Applications 2.0M Retail Deposits 18.7K 18.3K 17.1K 14.9K 1.0M 12.6M 11.2M 12.4K 9.3M YTD 500k 7.8M Invest 3.7M 50K Home 2010 2013 2016 2019 3Q 2020 Note: Active U.S. Dealer Relationships include Ally active dealers, excluding RV Commercial and Consumer lines of business exited in 2Q 18. 3Q 2020 Preliminary Results 6Ally’s Customer Evolution 10-Years of Customer Growth Ally’s Growing Customer Base Ally Bank Customer Trends Retail Deposit Customers % Multi-Product Customers 8.5M+ 2.2M 2.0M customers 7% # of Customers 6% 1.2M 4.5M 0.8M Auto 0.4M <1% 2010 2013 2016 2019 3Q 2020 Note: Multi-product Customers represent Deposit Customers with an Ally Invest or Ally Home relationship. Insurance Ally Auto Dealer Relationship & Application Trends Active U.S. Dealer Relationships U.S. Consumer Applications 2.0M Retail Deposits 18.7K 18.3K 17.1K 14.9K 1.0M 12.6M 11.2M 12.4K 9.3M YTD 500k 7.8M Invest 3.7M 50K Home 2010 2013 2016 2019 3Q 2020 Note: Active U.S. Dealer Relationships include Ally active dealers, excluding RV Commercial and Consumer lines of business exited in 2Q 18. 3Q 2020 Preliminary Results 6
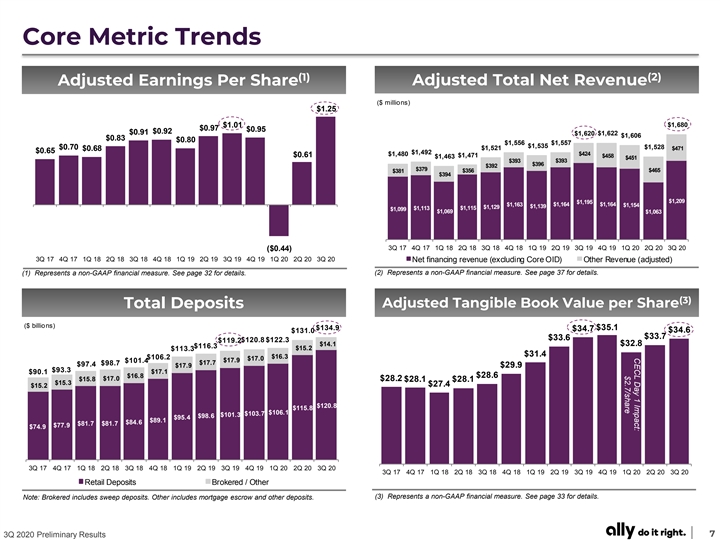
CECL Day 1 Impact: $2.7/share Core Metric Trends (1) (2) Adjusted Total Net Revenue Adjusted Earnings Per Share ($ millions) $1.25 $1,680 $1.01 $0.97 $0.95 $0.92 $0.91 $1,622 $1,620 $1,606 $0.83 $0.80 $1,556 $1,557 $1,535 $1,528 $0.70 $1,521 $471 $0.68 $0.65 $1,492 $1,480 $424 $0.61 $1,471 $458 $1,463 $451 $393 $393 $396 $392 $379 $465 $381 $356 $394 $1,209 $1,195 $1,163 $1,164 $1,164 $1,154 $1,139 $1,129 $1,113 $1,115 $1,099 $1,069 $1,063 3Q 17 4Q 17 1Q 18 2Q 18 3Q 18 4Q 18 1Q 19 2Q 19 3Q 19 4Q 19 1Q 20 2Q 20 3Q 20 ($0.44) 3Q 17 4Q 17 1Q 18 2Q 18 3Q 18 4Q 18 1Q 19 2Q 19 3Q 19 4Q 19 1Q 20 2Q 20 3Q 20 Net financing revenue (excluding Core OID) Other Revenue (adjusted) (1) Represents a non-GAAP financial measure. See page 32 for details. (2) Represents a non-GAAP financial measure. See page 37 for details. (3) Total Deposits Adjusted Tangible Book Value per Share ($ billions) $134.9 $35.1 $34.7 $131.0 $34.6 $33.7 $33.6 $120.8 $122.3 $119.2 $14.1 $32.8 $116.3 $15.2 $113.3 $31.4 $16.3 $106.2 $17.0 $17.9 $101.4 $98.7 $17.7 $97.4 $17.9 $29.9 $93.3 $90.1 $17.1 $16.8 $28.6 $15.8 $17.0 $28.2 $28.1 $28.1 $15.3 $27.4 $15.2 $120.8 $115.8 $106.1 $103.7 $101.3 $98.6 $95.4 $89.1 $84.6 $81.7 $81.7 $77.9 $74.9 3Q 17 4Q 17 1Q 18 2Q 18 3Q 18 4Q 18 1Q 19 2Q 19 3Q 19 4Q 19 1Q 20 2Q 20 3Q 20 3Q 17 4Q 17 1Q 18 2Q 18 3Q 18 4Q 18 1Q 19 2Q 19 3Q 19 4Q 19 1Q 20 2Q 20 3Q 20 Retail Deposits Brokered / Other (3) Represents a non-GAAP financial measure. See page 33 for details. Note: Brokered includes sweep deposits. Other includes mortgage escrow and other deposits. 3Q 2020 Preliminary Results 7CECL Day 1 Impact: $2.7/share Core Metric Trends (1) (2) Adjusted Total Net Revenue Adjusted Earnings Per Share ($ millions) $1.25 $1,680 $1.01 $0.97 $0.95 $0.92 $0.91 $1,622 $1,620 $1,606 $0.83 $0.80 $1,556 $1,557 $1,535 $1,528 $0.70 $1,521 $471 $0.68 $0.65 $1,492 $1,480 $424 $0.61 $1,471 $458 $1,463 $451 $393 $393 $396 $392 $379 $465 $381 $356 $394 $1,209 $1,195 $1,163 $1,164 $1,164 $1,154 $1,139 $1,129 $1,113 $1,115 $1,099 $1,069 $1,063 3Q 17 4Q 17 1Q 18 2Q 18 3Q 18 4Q 18 1Q 19 2Q 19 3Q 19 4Q 19 1Q 20 2Q 20 3Q 20 ($0.44) 3Q 17 4Q 17 1Q 18 2Q 18 3Q 18 4Q 18 1Q 19 2Q 19 3Q 19 4Q 19 1Q 20 2Q 20 3Q 20 Net financing revenue (excluding Core OID) Other Revenue (adjusted) (1) Represents a non-GAAP financial measure. See page 32 for details. (2) Represents a non-GAAP financial measure. See page 37 for details. (3) Total Deposits Adjusted Tangible Book Value per Share ($ billions) $134.9 $35.1 $34.7 $131.0 $34.6 $33.7 $33.6 $120.8 $122.3 $119.2 $14.1 $32.8 $116.3 $15.2 $113.3 $31.4 $16.3 $106.2 $17.0 $17.9 $101.4 $98.7 $17.7 $97.4 $17.9 $29.9 $93.3 $90.1 $17.1 $16.8 $28.6 $15.8 $17.0 $28.2 $28.1 $28.1 $15.3 $27.4 $15.2 $120.8 $115.8 $106.1 $103.7 $101.3 $98.6 $95.4 $89.1 $84.6 $81.7 $81.7 $77.9 $74.9 3Q 17 4Q 17 1Q 18 2Q 18 3Q 18 4Q 18 1Q 19 2Q 19 3Q 19 4Q 19 1Q 20 2Q 20 3Q 20 3Q 17 4Q 17 1Q 18 2Q 18 3Q 18 4Q 18 1Q 19 2Q 19 3Q 19 4Q 19 1Q 20 2Q 20 3Q 20 Retail Deposits Brokered / Other (3) Represents a non-GAAP financial measure. See page 33 for details. Note: Brokered includes sweep deposits. Other includes mortgage escrow and other deposits. 3Q 2020 Preliminary Results 7
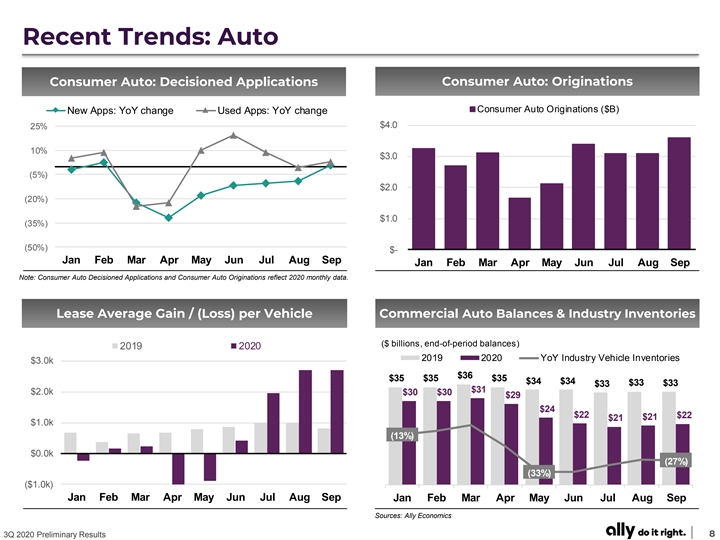
Recent Trends: Auto Consumer Auto: Decisioned Applications Consumer Auto: Originations Consumer Auto Originations ($B) New Apps: YoY change Used Apps: YoY change $4.0 25% 10% $3.0 (5%) $2.0 (20%) $1.0 (35%) (50%) $- Jan Feb Mar Apr May Jun Jul Aug Sep Jan Feb Mar Apr May Jun Jul Aug Sep Note: Consumer Auto Decisioned Applications and Consumer Auto Originations reflect 2020 monthly data. Lease Average Gain / (Loss) per Vehicle Commercial Auto Balances & Industry Inventories ($ billions, end-of-period balances) 2019 2020 2019 2020 YoY Industry Vehicle Inventories $3.0k $36 $35 $35 $35 $34 $34 $33 $33 $33 $31 $2.0k $30 $30 $29 $24 $22 $22 $21 $21 $1.0k (13%) $0.0k (27%) (33%) ($1.0k) Jan Feb Mar Apr May Jun Jul Aug Sep Jan Feb Mar Apr May Jun Jul Aug Sep Sources: Ally Economics 3Q 2020 Preliminary Results 8 ThousandsRecent Trends: Auto Consumer Auto: Decisioned Applications Consumer Auto: Originations Consumer Auto Originations ($B) New Apps: YoY change Used Apps: YoY change $4.0 25% 10% $3.0 (5%) $2.0 (20%) $1.0 (35%) (50%) $- Jan Feb Mar Apr May Jun Jul Aug Sep Jan Feb Mar Apr May Jun Jul Aug Sep Note: Consumer Auto Decisioned Applications and Consumer Auto Originations reflect 2020 monthly data. Lease Average Gain / (Loss) per Vehicle Commercial Auto Balances & Industry Inventories ($ billions, end-of-period balances) 2019 2020 2019 2020 YoY Industry Vehicle Inventories $3.0k $36 $35 $35 $35 $34 $34 $33 $33 $33 $31 $2.0k $30 $30 $29 $24 $22 $22 $21 $21 $1.0k (13%) $0.0k (27%) (33%) ($1.0k) Jan Feb Mar Apr May Jun Jul Aug Sep Jan Feb Mar Apr May Jun Jul Aug Sep Sources: Ally Economics 3Q 2020 Preliminary Results 8 Thousands
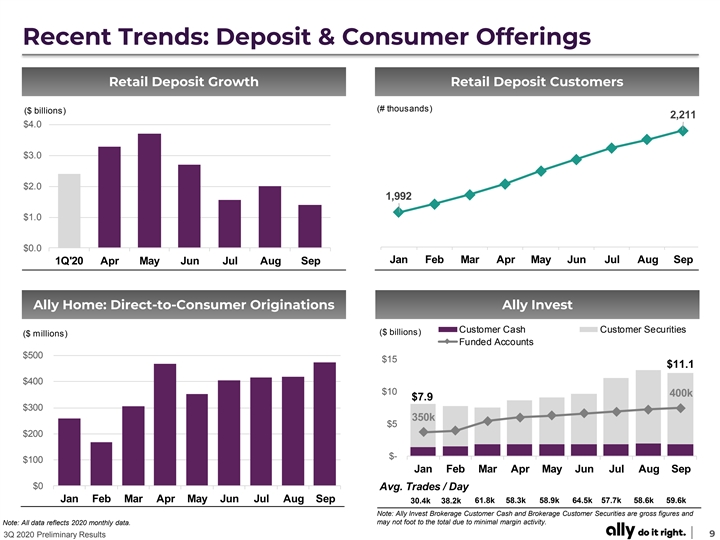
Recent Trends: Deposit & Consumer Offerings Retail Deposit Growth Retail Deposit Customers (# thousands) ($ billions) 2,211 $4.0 $3.0 $2.0 1,992 $1.0 $0.0 Jan Feb Mar Apr May Jun Jul Aug Sep 1Q'20 Apr May Jun Jul Aug Sep Ally Home: Direct-to-Consumer Originations Ally Invest Customer Cash Customer Securities ($ billions) ($ millions) Funded Accounts $500 $15 $11.1 $400 $10 400k $7.9 $300 350k $5 $200 $- $100 Jan Feb Mar Apr May Jun Jul Aug Sep $0 Avg. Trades / Day Jan Feb Mar Apr May Jun Jul Aug Sep 30.4k 38.2k 61.8k 58.3k 58.9k 64.5k 57.7k 58.6k 59.6k Note: Ally Invest Brokerage Customer Cash and Brokerage Customer Securities are gross figures and may not foot to the total due to minimal margin activity. Note: All data reflects 2020 monthly data. 3Q 2020 Preliminary Results 9Recent Trends: Deposit & Consumer Offerings Retail Deposit Growth Retail Deposit Customers (# thousands) ($ billions) 2,211 $4.0 $3.0 $2.0 1,992 $1.0 $0.0 Jan Feb Mar Apr May Jun Jul Aug Sep 1Q'20 Apr May Jun Jul Aug Sep Ally Home: Direct-to-Consumer Originations Ally Invest Customer Cash Customer Securities ($ billions) ($ millions) Funded Accounts $500 $15 $11.1 $400 $10 400k $7.9 $300 350k $5 $200 $- $100 Jan Feb Mar Apr May Jun Jul Aug Sep $0 Avg. Trades / Day Jan Feb Mar Apr May Jun Jul Aug Sep 30.4k 38.2k 61.8k 58.3k 58.9k 64.5k 57.7k 58.6k 59.6k Note: Ally Invest Brokerage Customer Cash and Brokerage Customer Securities are gross figures and may not foot to the total due to minimal margin activity. Note: All data reflects 2020 monthly data. 3Q 2020 Preliminary Results 9
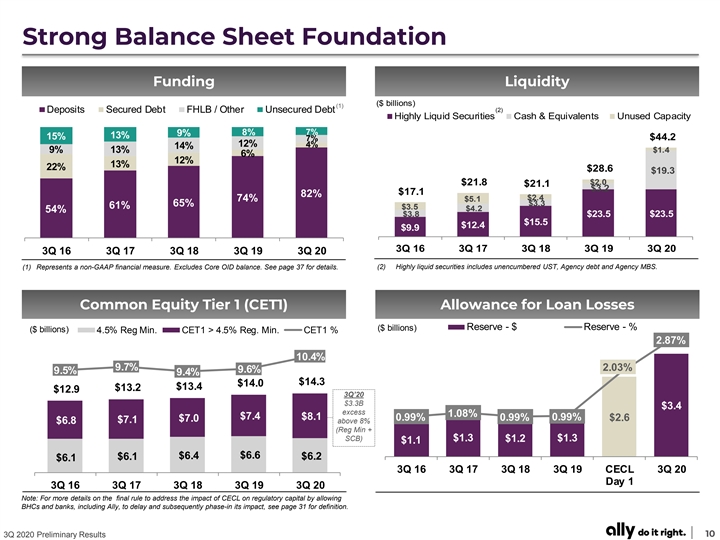
Strong Balance Sheet Foundation Funding Liquidity ($ billions) (1) (2) Deposits Secured Debt FHLB / Other Unsecured Debt Highly Liquid Securities Cash & Equivalents Unused Capacity 8% 7% 9% 13% 15% $44.2 7% 12% 4% 14% 9% 13% $1.4 6% 12% 13% 22% $28.6 $19.3 $21.8 $2.0 $21.1 $3.2 $17.1 82% $2.4 74% $5.1 $3.3 65% 61% $3.5 $4.2 54% $3.8 $23.5 $23.5 $15.5 $12.4 $9.9 3Q 16 3Q 17 3Q 18 3Q 19 3Q 20 3Q 16 3Q 17 3Q 18 3Q 19 3Q 20 (2) Highly liquid securities includes unencumbered UST, Agency debt and Agency MBS. (1) Represents a non-GAAP financial measure. Excludes Core OID balance. See page 37 for details. Common Equity Tier 1 (CET1) Allowance for Loan Losses Reserve - $ Reserve - % ($ billions) ($ billions) 4.5% Reg Min. CET1 > 4.5% Reg. Min. CET1 % 2.87% 10.4% 9.7% 2.03% 9.6% 9.5% 9.4% $14.3 $14.0 $13.4 $13.2 $12.9 3Q’20 $3.3B $3.4 excess 1.08% $7.4 $8.1 0.99% 0.99% 0.99% $2.6 $7.0 $7.1 above 8% $6.8 (Reg Min + SCB) $1.3 $1.2 $1.3 $1.1 $6.4 $6.6 $6.1 $6.2 $6.1 3Q 16 3Q 17 3Q 18 3Q 19 CECL 3Q 20 Day 1 3Q 16 3Q 17 3Q 18 3Q 19 3Q 20 Note: For more details on the final rule to address the impact of CECL on regulatory capital by allowing BHCs and banks, including Ally, to delay and subsequently phase-in its impact, see page 31 for definition. 3Q 2020 Preliminary Results 10Strong Balance Sheet Foundation Funding Liquidity ($ billions) (1) (2) Deposits Secured Debt FHLB / Other Unsecured Debt Highly Liquid Securities Cash & Equivalents Unused Capacity 8% 7% 9% 13% 15% $44.2 7% 12% 4% 14% 9% 13% $1.4 6% 12% 13% 22% $28.6 $19.3 $21.8 $2.0 $21.1 $3.2 $17.1 82% $2.4 74% $5.1 $3.3 65% 61% $3.5 $4.2 54% $3.8 $23.5 $23.5 $15.5 $12.4 $9.9 3Q 16 3Q 17 3Q 18 3Q 19 3Q 20 3Q 16 3Q 17 3Q 18 3Q 19 3Q 20 (2) Highly liquid securities includes unencumbered UST, Agency debt and Agency MBS. (1) Represents a non-GAAP financial measure. Excludes Core OID balance. See page 37 for details. Common Equity Tier 1 (CET1) Allowance for Loan Losses Reserve - $ Reserve - % ($ billions) ($ billions) 4.5% Reg Min. CET1 > 4.5% Reg. Min. CET1 % 2.87% 10.4% 9.7% 2.03% 9.6% 9.5% 9.4% $14.3 $14.0 $13.4 $13.2 $12.9 3Q’20 $3.3B $3.4 excess 1.08% $7.4 $8.1 0.99% 0.99% 0.99% $2.6 $7.0 $7.1 above 8% $6.8 (Reg Min + SCB) $1.3 $1.2 $1.3 $1.1 $6.4 $6.6 $6.1 $6.2 $6.1 3Q 16 3Q 17 3Q 18 3Q 19 CECL 3Q 20 Day 1 3Q 16 3Q 17 3Q 18 3Q 19 3Q 20 Note: For more details on the final rule to address the impact of CECL on regulatory capital by allowing BHCs and banks, including Ally, to delay and subsequently phase-in its impact, see page 31 for definition. 3Q 2020 Preliminary Results 10

3Q 2020 Financial Results ($ millions; except per share data) Increase / (Decrease) vs. 3Q 20 2Q 20 3Q 19 2Q 20 3Q 19 (1) $ 1,209 $ 1,063 $ 1,195 $ 146 $ 14 Net financing revenue (excluding Core OID) Core OID (9 ) (9) (7 ) (0) (2) Net financing revenue (as reported) $ 1,200 $ 1,054 $ 1,188 $ 146 $ 12 (2) 471 465 424 5 46 Other revenue (excluding change in fair value of equity securities) (2) 13 90 (1 1) (76) 25 Change in fair value of equity securities Other revenue (as reported) 484 555 413 (71) 71 Provision for credit losses 147 287 263 (140) (116) Noninterest expense 905 985 838 (80) 67 Pre-tax income from continuing operations $ 632 $ 337 $ 500 $ 295 $ 132 Income tax expense 156 95 119 61 37 (Loss) income from discontinued operations, net of tax - (1) - 1 - Net income $ 476 $ 241 $ 381 $ 235 $ 95 3Q 20 2Q 20 3Q 19 2Q 20 3Q 19 GAAP EPS (diluted) $ 1.26 $ 0 .64 $ 0 .97 $ 0.62 $ 0.29 Core OID, net of tax 0.02 0.02 0 .02 0 .00 0.00 Change in fair value of equity securities, net of tax (0.03) (0.19) 0.02 0 .16 (0.05) (3) - 0 .14 - (0 .14) - Repositioning, discontinued ops., and other, net of tax (4) $ 1 .25 $ 0.61 $ 1.01 $ 0.65 $ 0.25 Adjusted EPS (4) Core ROTCE 15.2% 7.6% 12.3% (4) 47.3% 52.5% 45.3% Adjusted Efficiency Ratio Effective Tax Rate 24.8% 28.2% 23.9% (1) Represents a non-GAAP financial measure. Adjusted for Core OID. See page 37 for calculation methodology and details. (2) Represents a non-GAAP financial measure. Adjusted for change in the fair value of equity securities due to the implementation of ASU 2016-01, which requires change in the fair value of equity securities to be recognized in current period net income as compared to periods prior to 1/1/18 in which such adjustments were recognized through other comprehensive income, a component of equity. For Non-GAAP calculation methodology and details see pages 36 and 37. (3) Repositioning and other, net of tax (as applicable) in 2Q 20 includes a $50 million Goodwill impairment at Ally Invest. See page 36 for calculation methodology and details. (4) Represents a non-GAAP financial measure. For Non-GAAP calculation methodology and details see pages 32 , 34 and 35. 3Q 2020 Preliminary Results 113Q 2020 Financial Results ($ millions; except per share data) Increase / (Decrease) vs. 3Q 20 2Q 20 3Q 19 2Q 20 3Q 19 (1) $ 1,209 $ 1,063 $ 1,195 $ 146 $ 14 Net financing revenue (excluding Core OID) Core OID (9 ) (9) (7 ) (0) (2) Net financing revenue (as reported) $ 1,200 $ 1,054 $ 1,188 $ 146 $ 12 (2) 471 465 424 5 46 Other revenue (excluding change in fair value of equity securities) (2) 13 90 (1 1) (76) 25 Change in fair value of equity securities Other revenue (as reported) 484 555 413 (71) 71 Provision for credit losses 147 287 263 (140) (116) Noninterest expense 905 985 838 (80) 67 Pre-tax income from continuing operations $ 632 $ 337 $ 500 $ 295 $ 132 Income tax expense 156 95 119 61 37 (Loss) income from discontinued operations, net of tax - (1) - 1 - Net income $ 476 $ 241 $ 381 $ 235 $ 95 3Q 20 2Q 20 3Q 19 2Q 20 3Q 19 GAAP EPS (diluted) $ 1.26 $ 0 .64 $ 0 .97 $ 0.62 $ 0.29 Core OID, net of tax 0.02 0.02 0 .02 0 .00 0.00 Change in fair value of equity securities, net of tax (0.03) (0.19) 0.02 0 .16 (0.05) (3) - 0 .14 - (0 .14) - Repositioning, discontinued ops., and other, net of tax (4) $ 1 .25 $ 0.61 $ 1.01 $ 0.65 $ 0.25 Adjusted EPS (4) Core ROTCE 15.2% 7.6% 12.3% (4) 47.3% 52.5% 45.3% Adjusted Efficiency Ratio Effective Tax Rate 24.8% 28.2% 23.9% (1) Represents a non-GAAP financial measure. Adjusted for Core OID. See page 37 for calculation methodology and details. (2) Represents a non-GAAP financial measure. Adjusted for change in the fair value of equity securities due to the implementation of ASU 2016-01, which requires change in the fair value of equity securities to be recognized in current period net income as compared to periods prior to 1/1/18 in which such adjustments were recognized through other comprehensive income, a component of equity. For Non-GAAP calculation methodology and details see pages 36 and 37. (3) Repositioning and other, net of tax (as applicable) in 2Q 20 includes a $50 million Goodwill impairment at Ally Invest. See page 36 for calculation methodology and details. (4) Represents a non-GAAP financial measure. For Non-GAAP calculation methodology and details see pages 32 , 34 and 35. 3Q 2020 Preliminary Results 11
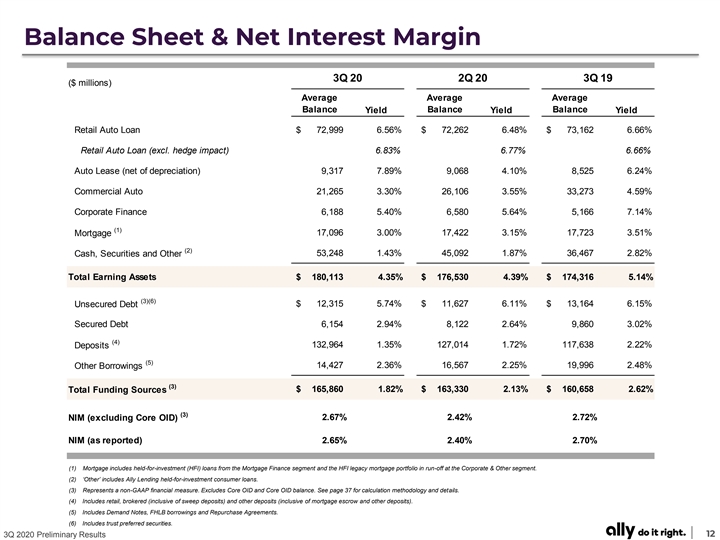
Balance Sheet & Net Interest Margin 3Q 20 2Q 20 3Q 19 ($ millions) Average Average Average Balance Yield Balance Yield Balance Yield Retail Auto Loan $ 72,999 6.56% $ 72,262 6.48% $ 73,162 6.66% Retail Auto Loan (excl. hedge impact) 6.83% 6.77% 6.66% Auto Lease (net of depreciation) 9,317 7.89% 9,068 4.10% 8,525 6.24% Commercial Auto 21,265 3.30% 26,106 3.55% 33,273 4.59% Corporate Finance 6,188 5.40% 6,580 5.64% 5,166 7.14% (1) Mortgage 17,096 3.00% 17,422 3.15% 17,723 3.51% (2) 53,248 1.43% 45,092 1.87% 36,467 2.82% Cash, Securities and Other Total Earning Assets $ 1 80,113 4.35% $ 176,530 4.39% $ 1 74,316 5.14% (3)(6) Unsecured Debt $ 12,315 5.74% $ 11,627 6.11% $ 13,164 6.15% Secured Debt 6,154 2.94% 8,122 2.64% 9,860 3.02% (4) Deposits 132,964 1.35% 127,014 1.72% 117,638 2.22% (5) 14,427 2.36% 16,567 2.25% 19,996 2.48% Other Borrowings (3) $ 1 65,860 1.82% $ 163,330 2.13% $ 160,658 2.62% Total Funding Sources (3) 2.67% 2.42% 2.72% NIM (excluding Core OID) NIM (as reported) 2.65% 2.40% 2.70% (1) Mortgage includes held-for-investment (HFI) loans from the Mortgage Finance segment and the HFI legacy mortgage portfolio in run-off at the Corporate & Other segment. (2) ‘Other’ includes Ally Lending held-for-investment consumer loans. (3) Represents a non-GAAP financial measure. Excludes Core OID and Core OID balance. See page 37 for calculation methodology and details. (4) Includes retail, brokered (inclusive of sweep deposits) and other deposits (inclusive of mortgage escrow and other deposits). (5) Includes Demand Notes, FHLB borrowings and Repurchase Agreements. (6) Includes trust preferred securities. 3Q 2020 Preliminary Results 12Balance Sheet & Net Interest Margin 3Q 20 2Q 20 3Q 19 ($ millions) Average Average Average Balance Yield Balance Yield Balance Yield Retail Auto Loan $ 72,999 6.56% $ 72,262 6.48% $ 73,162 6.66% Retail Auto Loan (excl. hedge impact) 6.83% 6.77% 6.66% Auto Lease (net of depreciation) 9,317 7.89% 9,068 4.10% 8,525 6.24% Commercial Auto 21,265 3.30% 26,106 3.55% 33,273 4.59% Corporate Finance 6,188 5.40% 6,580 5.64% 5,166 7.14% (1) Mortgage 17,096 3.00% 17,422 3.15% 17,723 3.51% (2) 53,248 1.43% 45,092 1.87% 36,467 2.82% Cash, Securities and Other Total Earning Assets $ 1 80,113 4.35% $ 176,530 4.39% $ 1 74,316 5.14% (3)(6) Unsecured Debt $ 12,315 5.74% $ 11,627 6.11% $ 13,164 6.15% Secured Debt 6,154 2.94% 8,122 2.64% 9,860 3.02% (4) Deposits 132,964 1.35% 127,014 1.72% 117,638 2.22% (5) 14,427 2.36% 16,567 2.25% 19,996 2.48% Other Borrowings (3) $ 1 65,860 1.82% $ 163,330 2.13% $ 160,658 2.62% Total Funding Sources (3) 2.67% 2.42% 2.72% NIM (excluding Core OID) NIM (as reported) 2.65% 2.40% 2.70% (1) Mortgage includes held-for-investment (HFI) loans from the Mortgage Finance segment and the HFI legacy mortgage portfolio in run-off at the Corporate & Other segment. (2) ‘Other’ includes Ally Lending held-for-investment consumer loans. (3) Represents a non-GAAP financial measure. Excludes Core OID and Core OID balance. See page 37 for calculation methodology and details. (4) Includes retail, brokered (inclusive of sweep deposits) and other deposits (inclusive of mortgage escrow and other deposits). (5) Includes Demand Notes, FHLB borrowings and Repurchase Agreements. (6) Includes trust preferred securities. 3Q 2020 Preliminary Results 12
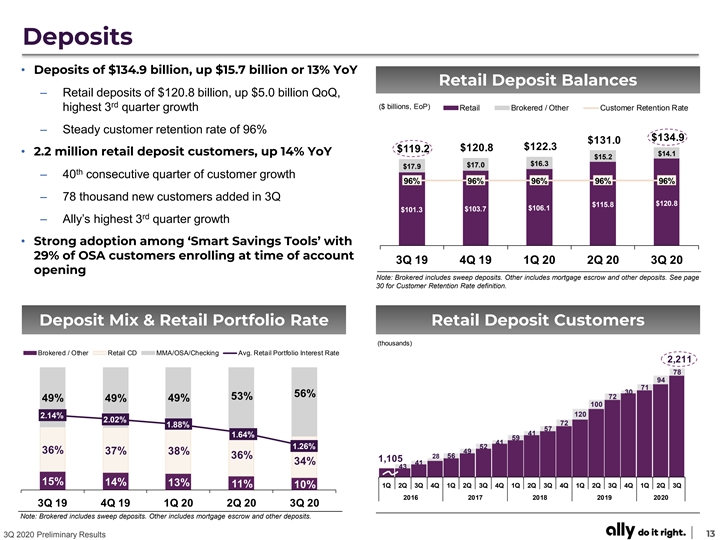
Deposits • Deposits of $134.9 billion, up $15.7 billion or 13% YoY Retail Deposit Balances – Retail deposits of $120.8 billion, up $5.0 billion QoQ, rd ($ billions, EoP) highest 3 quarter growth Retail Brokered / Other Customer Retention Rate – Steady customer retention rate of 96% $134.9 $131.0 $122.3 $120.8 $119.2 • 2.2 million retail deposit customers, up 14% YoY $14.1 $15.2 $16.3 $17.0 $17.9 th – 40 consecutive quarter of customer growth 96% 96% 96% 96% 96% – 78 thousand new customers added in 3Q $120.8 $115.8 $103.7 $106.1 $101.3 rd – Ally’s highest 3 quarter growth • Strong adoption among ‘Smart Savings Tools’ with 29% of OSA customers enrolling at time of account 3Q 19 4Q 19 1Q 20 2Q 20 3Q 20 opening Note: Brokered includes sweep deposits. Other includes mortgage escrow and other deposits. See page 30 for Customer Retention Rate definition. Deposit Mix & Retail Portfolio Rate Retail Deposit Customers (thousands) Brokered / Other Retail CD MMA/OSA/Checking Avg. Retail Portfolio Interest Rate 2,211 78 94 71 30 56% 72 53% 49% 49% 49% 100 120 2.14% 2.02% 72 1.88% 57 41 1.64% 59 41 1.26% 52 36% 37% 49 38% 56 36% 28 1,105 34% 41 43 15% 14% 13% 11% 10% 1Q 2Q 3Q 4Q 1Q 2Q 3Q 4Q 1Q 2Q 3Q 4Q 1Q 2Q 3Q 4Q 1Q 2Q 3Q 2016 2017 2018 2019 2020 3Q 19 4Q 19 1Q 20 2Q 20 3Q 20 Note: Brokered includes sweep deposits. Other includes mortgage escrow and other deposits. 3Q 2020 Preliminary Results 13Deposits • Deposits of $134.9 billion, up $15.7 billion or 13% YoY Retail Deposit Balances – Retail deposits of $120.8 billion, up $5.0 billion QoQ, rd ($ billions, EoP) highest 3 quarter growth Retail Brokered / Other Customer Retention Rate – Steady customer retention rate of 96% $134.9 $131.0 $122.3 $120.8 $119.2 • 2.2 million retail deposit customers, up 14% YoY $14.1 $15.2 $16.3 $17.0 $17.9 th – 40 consecutive quarter of customer growth 96% 96% 96% 96% 96% – 78 thousand new customers added in 3Q $120.8 $115.8 $103.7 $106.1 $101.3 rd – Ally’s highest 3 quarter growth • Strong adoption among ‘Smart Savings Tools’ with 29% of OSA customers enrolling at time of account 3Q 19 4Q 19 1Q 20 2Q 20 3Q 20 opening Note: Brokered includes sweep deposits. Other includes mortgage escrow and other deposits. See page 30 for Customer Retention Rate definition. Deposit Mix & Retail Portfolio Rate Retail Deposit Customers (thousands) Brokered / Other Retail CD MMA/OSA/Checking Avg. Retail Portfolio Interest Rate 2,211 78 94 71 30 56% 72 53% 49% 49% 49% 100 120 2.14% 2.02% 72 1.88% 57 41 1.64% 59 41 1.26% 52 36% 37% 49 38% 56 36% 28 1,105 34% 41 43 15% 14% 13% 11% 10% 1Q 2Q 3Q 4Q 1Q 2Q 3Q 4Q 1Q 2Q 3Q 4Q 1Q 2Q 3Q 4Q 1Q 2Q 3Q 2016 2017 2018 2019 2020 3Q 19 4Q 19 1Q 20 2Q 20 3Q 20 Note: Brokered includes sweep deposits. Other includes mortgage escrow and other deposits. 3Q 2020 Preliminary Results 13
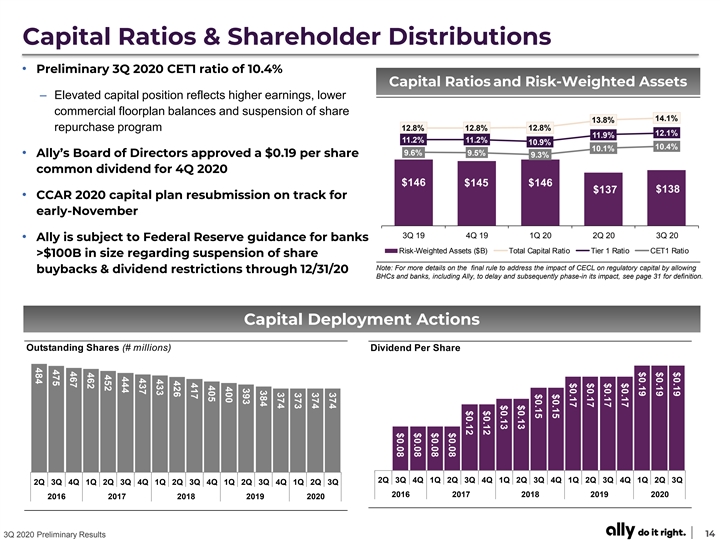
$0.19 $0.19 $0.19 $0.17 $0.17 $0.17 $0.17 $0.15 $0.15 $0.13 $0.13 $0.12 $0.12 $0.08 $0.08 $0.08 $0.08 $- 374 374 373 374 384 393 400 405 417 426 433 437 444 452 462 467 475 484 Capital Ratios & Shareholder Distributions • Preliminary 3Q 2020 CET1 ratio of 10.4% Capital Ratios and Risk-Weighted Assets – Elevated capital position reflects higher earnings, lower commercial floorplan balances and suspension of share 14.1% 13.8% repurchase program 12.8% 12.8% 12.8% 12.1% 11.9% 11.2% 11.2% 10.9% 10.4% 10.1% 9.6% 9.5% • Ally’s Board of Directors approved a $0.19 per share 9.3% common dividend for 4Q 2020 $146 $145 $146 $137 $138 • CCAR 2020 capital plan resubmission on track for early-November 3Q 19 4Q 19 1Q 20 2Q 20 3Q 20 • Ally is subject to Federal Reserve guidance for banks Risk-Weighted Assets ($B) Total Capital Ratio Tier 1 Ratio CET1 Ratio >$100B in size regarding suspension of share Note: For more details on the final rule to address the impact of CECL on regulatory capital by allowing buybacks & dividend restrictions through 12/31/20 BHCs and banks, including Ally, to delay and subsequently phase-in its impact, see page 31 for definition. Capital Deployment Actions Outstanding Shares (# millions) Dividend Per Share 2Q 3Q 4Q 1Q 2Q 3Q 4Q 1Q 2Q 3Q 4Q 1Q 2Q 3Q 4Q 1Q 2Q 3Q 2Q 3Q 4Q 1Q 2Q 3Q 4Q 1Q 2Q 3Q 4Q 1Q 2Q 3Q 4Q 1Q 2Q 3Q 2016 2017 2018 2019 2020 2016 2017 2018 2019 2020 3Q 2020 Preliminary Results 14$0.19 $0.19 $0.19 $0.17 $0.17 $0.17 $0.17 $0.15 $0.15 $0.13 $0.13 $0.12 $0.12 $0.08 $0.08 $0.08 $0.08 $- 374 374 373 374 384 393 400 405 417 426 433 437 444 452 462 467 475 484 Capital Ratios & Shareholder Distributions • Preliminary 3Q 2020 CET1 ratio of 10.4% Capital Ratios and Risk-Weighted Assets – Elevated capital position reflects higher earnings, lower commercial floorplan balances and suspension of share 14.1% 13.8% repurchase program 12.8% 12.8% 12.8% 12.1% 11.9% 11.2% 11.2% 10.9% 10.4% 10.1% 9.6% 9.5% • Ally’s Board of Directors approved a $0.19 per share 9.3% common dividend for 4Q 2020 $146 $145 $146 $137 $138 • CCAR 2020 capital plan resubmission on track for early-November 3Q 19 4Q 19 1Q 20 2Q 20 3Q 20 • Ally is subject to Federal Reserve guidance for banks Risk-Weighted Assets ($B) Total Capital Ratio Tier 1 Ratio CET1 Ratio >$100B in size regarding suspension of share Note: For more details on the final rule to address the impact of CECL on regulatory capital by allowing buybacks & dividend restrictions through 12/31/20 BHCs and banks, including Ally, to delay and subsequently phase-in its impact, see page 31 for definition. Capital Deployment Actions Outstanding Shares (# millions) Dividend Per Share 2Q 3Q 4Q 1Q 2Q 3Q 4Q 1Q 2Q 3Q 4Q 1Q 2Q 3Q 4Q 1Q 2Q 3Q 2Q 3Q 4Q 1Q 2Q 3Q 4Q 1Q 2Q 3Q 4Q 1Q 2Q 3Q 4Q 1Q 2Q 3Q 2016 2017 2018 2019 2020 2016 2017 2018 2019 2020 3Q 2020 Preliminary Results 14
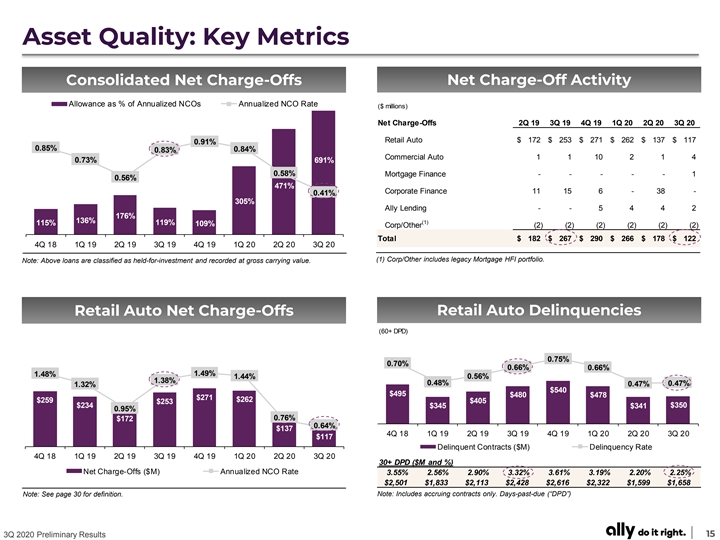
Asset Quality: Key Metrics Consolidated Net Charge-Offs Net Charge-Off Activity Allowance as % of Annualized NCOs Annualized NCO Rate ($ millions) Variance 550% 500% Net Charge-Offs 2Q 19 3Q 19 4Q 19 1Q 20 2Q 20 3Q 20 450% Retail Auto $ 172 $ 253 $ 271 $ 262 $ 137 $ 117 0.91% 400% 0.85% 0.84% 0.83% 350% Commercial Auto 1 1 10 2 1 4 0.73% 691% 300% 0.58% Mortgage Finance - - - - - 1 250% 0.56% 471% 200% Corporate Finance 11 15 6 - 38 - 0.41% 150% 305% Ally Lending - - 5 4 4 2 100% 176% 136% (1) 119% 115% 109% 50% Corp/Other (2) (2) (2) (2) (2) (2) 0% Total $ 182 $ 267 $ 290 $ 266 $ 178 $ 122 4Q 18 1Q 19 2Q 19 3Q 19 4Q 19 1Q 20 2Q 20 3Q 20 (1) Corp/Other includes legacy Mortgage HFI portfolio. Note: Above loans are classified as held-for-investment and recorded at gross carrying value. Retail Auto Delinquencies Retail Auto Net Charge-Offs (60+ DPD) 1.00% $500 $480 $460 $440 $420 0.75% $400 0.70% $380 0.66% 0.66% $360 1.49% $340 1.48% 1.44% 0.56% $320 1.38% 0.50% $300 0.48% 0.47% 1.32% 0.47% $280 $540 $260 $495 $240 $480 $478 $271 $220 $262 $259 $405 $253 $200 $234 $345 $350 $341 $180 0.95% $160 $140 0.76% $172 $120 0.00% $100 0.64% $137 $80 4Q 18 1Q 19 2Q 19 3Q 19 4Q 19 1Q 20 2Q 20 3Q 20 $60 $117 $40 $20 $0 Delinquent Contracts ($M) Delinquency Rate 4Q 18 1Q 19 2Q 19 3Q 19 4Q 19 1Q 20 2Q 20 3Q 20 30+ DPD ($M and %) Net Charge-Offs ($M) Annualized NCO Rate 3.55% 2.56% 2.90% 3.32% 3.61% 3.19% 2.20% 2.25% $2,501 $1,833 $2,113 $2,428 $2,616 $2,322 $1,599 $1,658 Note: Includes accruing contracts only. Days-past-due (“DPD”) Note: See page 30 for definition. 3Q 2020 Preliminary Results 15Asset Quality: Key Metrics Consolidated Net Charge-Offs Net Charge-Off Activity Allowance as % of Annualized NCOs Annualized NCO Rate ($ millions) Variance 550% 500% Net Charge-Offs 2Q 19 3Q 19 4Q 19 1Q 20 2Q 20 3Q 20 450% Retail Auto $ 172 $ 253 $ 271 $ 262 $ 137 $ 117 0.91% 400% 0.85% 0.84% 0.83% 350% Commercial Auto 1 1 10 2 1 4 0.73% 691% 300% 0.58% Mortgage Finance - - - - - 1 250% 0.56% 471% 200% Corporate Finance 11 15 6 - 38 - 0.41% 150% 305% Ally Lending - - 5 4 4 2 100% 176% 136% (1) 119% 115% 109% 50% Corp/Other (2) (2) (2) (2) (2) (2) 0% Total $ 182 $ 267 $ 290 $ 266 $ 178 $ 122 4Q 18 1Q 19 2Q 19 3Q 19 4Q 19 1Q 20 2Q 20 3Q 20 (1) Corp/Other includes legacy Mortgage HFI portfolio. Note: Above loans are classified as held-for-investment and recorded at gross carrying value. Retail Auto Delinquencies Retail Auto Net Charge-Offs (60+ DPD) 1.00% $500 $480 $460 $440 $420 0.75% $400 0.70% $380 0.66% 0.66% $360 1.49% $340 1.48% 1.44% 0.56% $320 1.38% 0.50% $300 0.48% 0.47% 1.32% 0.47% $280 $540 $260 $495 $240 $480 $478 $271 $220 $262 $259 $405 $253 $200 $234 $345 $350 $341 $180 0.95% $160 $140 0.76% $172 $120 0.00% $100 0.64% $137 $80 4Q 18 1Q 19 2Q 19 3Q 19 4Q 19 1Q 20 2Q 20 3Q 20 $60 $117 $40 $20 $0 Delinquent Contracts ($M) Delinquency Rate 4Q 18 1Q 19 2Q 19 3Q 19 4Q 19 1Q 20 2Q 20 3Q 20 30+ DPD ($M and %) Net Charge-Offs ($M) Annualized NCO Rate 3.55% 2.56% 2.90% 3.32% 3.61% 3.19% 2.20% 2.25% $2,501 $1,833 $2,113 $2,428 $2,616 $2,322 $1,599 $1,658 Note: Includes accruing contracts only. Days-past-due (“DPD”) Note: See page 30 for definition. 3Q 2020 Preliminary Results 15
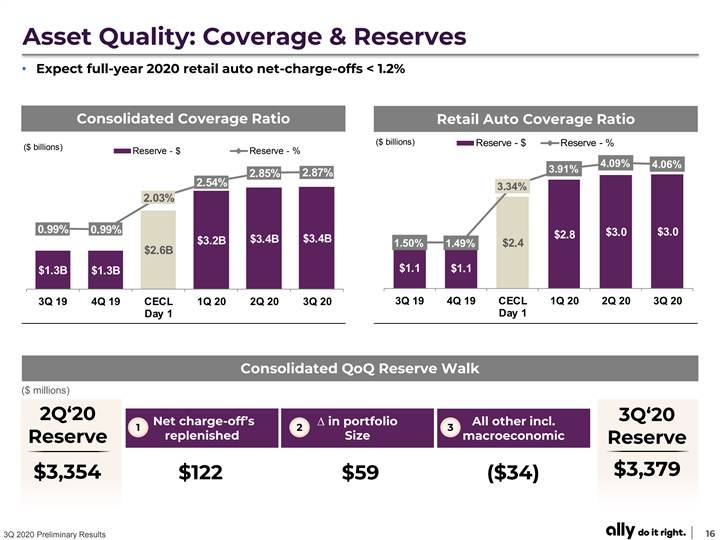
Asset Quality: Coverage & Reserves • Expect full-year 2020 retail auto net-charge-offs < 1.2% Consolidated Coverage Ratio Retail Auto Coverage Ratio ($ billions) Reserve - $ Reserve - % ($ billions) Reserve - $ Reserve - % 4.09% 4.06% 3.91% 2.87% 2.85% 2.54% 3.34% 2.03% 0.99% 0.99% $3.0 $3.0 $2.8 $3.4B $3.4B $3.2B 1.50% 1.49% $2.4 $2.6B $1.1 $1.1 $1.3B $1.3B 3Q 19 4Q 19 CECL 1Q 20 2Q 20 3Q 20 3Q 19 4Q 19 CECL 1Q 20 2Q 20 3Q 20 Day 1 Day 1 Consolidated QoQ Reserve Walk ($ millions) 2Q‘20 3Q‘20 Net charge-off’s ∆ in portfolio All other incl. 1 2 3 replenished Size macroeconomic Reserve Reserve $3,379 $3,354 $122 $59 ($34) 3Q 2020 Preliminary Results 16Asset Quality: Coverage & Reserves • Expect full-year 2020 retail auto net-charge-offs < 1.2% Consolidated Coverage Ratio Retail Auto Coverage Ratio ($ billions) Reserve - $ Reserve - % ($ billions) Reserve - $ Reserve - % 4.09% 4.06% 3.91% 2.87% 2.85% 2.54% 3.34% 2.03% 0.99% 0.99% $3.0 $3.0 $2.8 $3.4B $3.4B $3.2B 1.50% 1.49% $2.4 $2.6B $1.1 $1.1 $1.3B $1.3B 3Q 19 4Q 19 CECL 1Q 20 2Q 20 3Q 20 3Q 19 4Q 19 CECL 1Q 20 2Q 20 3Q 20 Day 1 Day 1 Consolidated QoQ Reserve Walk ($ millions) 2Q‘20 3Q‘20 Net charge-off’s ∆ in portfolio All other incl. 1 2 3 replenished Size macroeconomic Reserve Reserve $3,379 $3,354 $122 $59 ($34) 3Q 2020 Preliminary Results 16

Auto: COVID-19 Deferral Program Update • Ally provided COVID-19 assistance to ~30% or ~1.3M consumer auto accounts | ~99% expired as of 9/30/20 • Customer Engagement: Rolled out enhanced digital portal & new communication technology during 3Q • Preparedness: Ongoing utilization of scalable staffing model & resource capabilities Ally Deferral Population Trends Deferral Population % of Consumer Auto Accounts by Status @ 9/30/2020 30% 1.0% Expired: Re-extended 3% 2.4% Expired: 30+ Delinquent 8% or Charged-off 25% 20% 15% (1) Expired: Current or 89% 26.6% Paid-in-full 10% 5% 0% Mar'20 Apr'20 May'20 Jun'20 Jul'20 Aug'20 Sep'20 Note: Consumer Auto deferral program data as of 9/30/2020. (1) Current accounts are < 30 days past due. 3Q 2020 Preliminary Results 17Auto: COVID-19 Deferral Program Update • Ally provided COVID-19 assistance to ~30% or ~1.3M consumer auto accounts | ~99% expired as of 9/30/20 • Customer Engagement: Rolled out enhanced digital portal & new communication technology during 3Q • Preparedness: Ongoing utilization of scalable staffing model & resource capabilities Ally Deferral Population Trends Deferral Population % of Consumer Auto Accounts by Status @ 9/30/2020 30% 1.0% Expired: Re-extended 3% 2.4% Expired: 30+ Delinquent 8% or Charged-off 25% 20% 15% (1) Expired: Current or 89% 26.6% Paid-in-full 10% 5% 0% Mar'20 Apr'20 May'20 Jun'20 Jul'20 Aug'20 Sep'20 Note: Consumer Auto deferral program data as of 9/30/2020. (1) Current accounts are < 30 days past due. 3Q 2020 Preliminary Results 17

Auto Finance • Pre-tax income of $566 million, up $137 million YoY Increase/(Decrease) vs. and up $237 million QoQ Key Financials ($ millions) 3Q 20 2Q 20 3Q 19 Net financing revenue $ 1,102 $ 113 $ 24 – Net financing revenue up YoY and QoQ due to higher gains Total other revenue 61 21 2 on off-lease vehicles and increased retail revenue Total net revenue 1,163 134 26 Provision for credit losses 128 (128) ( 137) (1) Noninterest expense 469 25 26 – Provision expense reflects lower net charge-off activity Pre-tax income $ 566 $ 237 $ 137 U.S. auto earning assets (EOP) $ 1 04,792 $ 1,618 $ (10,085) – Noninterest expense reflects staffing and investments in servicing and collections activities Key Statistics Remarketing gains ($ millions) $ 81 $ 42 $ 70 • Earning assets of $104.8 billion, down $10.1 billion YoY Average gain per vehicle $ 2,437 $ 2,858 $ 1,494 and up $1.6 billion QoQ Off-lease vehicles terminated 28,917 2 ,132 (1,068) (On-balance sheet - # in units) Application Volume (# thousands) 3,240 142 6 – Commercial balances bottomed in July, with modest growth in August and September (1) Noninterest expense includes corporate allocations of $190 million in 3Q 2020, $197 million in 2Q 2020, and $184 million in 3Q 2019. – Consumer balances up modestly YoY and QoQ Retail Auto Trends (2) • Market-leading, adaptable franchise continuing to Portfolio Yield (ex. hedge) Est. Retail Auto Originated Yield Retail Auto NCO % deliver innovative solutions for dealers and customers 7.59% 7.55% 7.53% 7.50% – Application volume and origination flow remained robust, 7.33% 7.25% 7.07% 7.10% 6.95% including strong consumer demand for Used 6.83% 6.77% 6.74% 6.66% 6.66% 6.57% 6.46% 6.34% – All participating dealers who deferred wholesale charges as 6.17% part of the COVID-19 Dealer Assistance Plan are current 1.48% 1.49% 1.44% 1.38% 1.32% 1.32% 0.95% ▪ Remittance payments remain ahead of schedule 0.76% 0.64% 3Q 18 4Q 18 1Q 19 2Q 19 3Q 19 4Q 19 1Q 20 2Q 20 3Q 20 (2) Estimated Retail Auto Originated Yield is a forward-looking non-GAAP financial measure determined by calculating the estimated average annualized yield for loans originated during the period. See page 31 for details. 3Q 2020 Preliminary Results 18Auto Finance • Pre-tax income of $566 million, up $137 million YoY Increase/(Decrease) vs. and up $237 million QoQ Key Financials ($ millions) 3Q 20 2Q 20 3Q 19 Net financing revenue $ 1,102 $ 113 $ 24 – Net financing revenue up YoY and QoQ due to higher gains Total other revenue 61 21 2 on off-lease vehicles and increased retail revenue Total net revenue 1,163 134 26 Provision for credit losses 128 (128) ( 137) (1) Noninterest expense 469 25 26 – Provision expense reflects lower net charge-off activity Pre-tax income $ 566 $ 237 $ 137 U.S. auto earning assets (EOP) $ 1 04,792 $ 1,618 $ (10,085) – Noninterest expense reflects staffing and investments in servicing and collections activities Key Statistics Remarketing gains ($ millions) $ 81 $ 42 $ 70 • Earning assets of $104.8 billion, down $10.1 billion YoY Average gain per vehicle $ 2,437 $ 2,858 $ 1,494 and up $1.6 billion QoQ Off-lease vehicles terminated 28,917 2 ,132 (1,068) (On-balance sheet - # in units) Application Volume (# thousands) 3,240 142 6 – Commercial balances bottomed in July, with modest growth in August and September (1) Noninterest expense includes corporate allocations of $190 million in 3Q 2020, $197 million in 2Q 2020, and $184 million in 3Q 2019. – Consumer balances up modestly YoY and QoQ Retail Auto Trends (2) • Market-leading, adaptable franchise continuing to Portfolio Yield (ex. hedge) Est. Retail Auto Originated Yield Retail Auto NCO % deliver innovative solutions for dealers and customers 7.59% 7.55% 7.53% 7.50% – Application volume and origination flow remained robust, 7.33% 7.25% 7.07% 7.10% 6.95% including strong consumer demand for Used 6.83% 6.77% 6.74% 6.66% 6.66% 6.57% 6.46% 6.34% – All participating dealers who deferred wholesale charges as 6.17% part of the COVID-19 Dealer Assistance Plan are current 1.48% 1.49% 1.44% 1.38% 1.32% 1.32% 0.95% ▪ Remittance payments remain ahead of schedule 0.76% 0.64% 3Q 18 4Q 18 1Q 19 2Q 19 3Q 19 4Q 19 1Q 20 2Q 20 3Q 20 (2) Estimated Retail Auto Originated Yield is a forward-looking non-GAAP financial measure determined by calculating the estimated average annualized yield for loans originated during the period. See page 31 for details. 3Q 2020 Preliminary Results 18
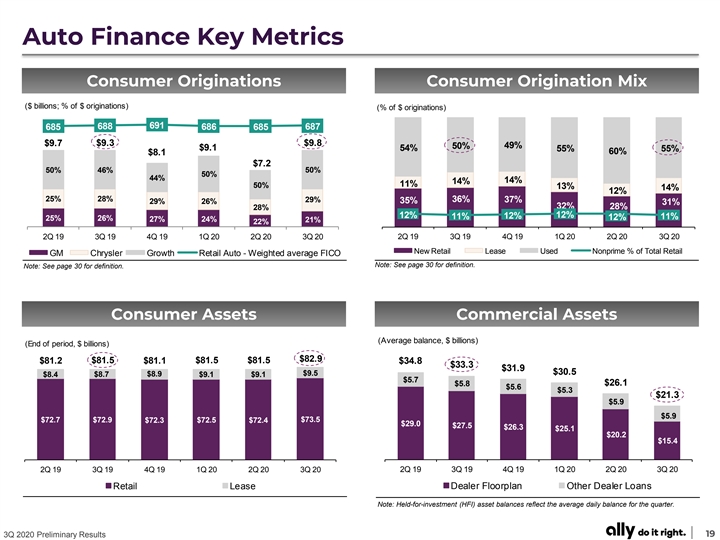
Auto Finance Key Metrics Consumer Originations Consumer Origination Mix ($ billions; % of $ originations) (% of $ originations) 688 691 685 686 685 687 $9.7 $9.3 $9.8 49% 50% $9.1 54% 55% 55% 60% $8.1 $7.2 50% 46% 50% 50% 44% 14% 14% 11% 50% 13% 14% 12% 25% 28% 29% 36% 37% 29% 26% 35% 31% 32% 28% 28% 12% 12% 11% 12% 11% 12% 25% 26% 27% 24% 21% 22% 2Q 19 3Q 19 4Q 19 1Q 20 2Q 20 3Q 20 2Q 19 3Q 19 4Q 19 1Q 20 2Q 20 3Q 20 New Retail Lease Used Nonprime % of Total Retail GM Chrysler Growth Retail Auto - Weighted average FICO Note: See page 30 for definition. Note: See page 30 for definition. Consumer Assets Commercial Assets (Average balance, $ billions) (End of period, $ billions) $82.9 $81.5 $81.5 $81.5 $81.2 $81.1 $34.8 $33.3 $31.9 $30.5 $9.5 $8.4 $8.7 $8.9 $9.1 $9.1 $5.7 $5.8 $26.1 $5.6 $5.3 $21.3 $5.9 $5.9 $73.5 $72.7 $72.9 $72.3 $72.5 $72.4 $29.0 $27.5 $26.3 $25.1 $20.2 $15.4 2Q 19 3Q 19 4Q 19 1Q 20 2Q 20 3Q 20 2Q 19 3Q 19 4Q 19 1Q 20 2Q 20 3Q 20 Retail Lease Dealer Floorplan Other Dealer Loans Note: Held-for-investment (HFI) asset balances reflect the average daily balance for the quarter. 3Q 2020 Preliminary Results 19Auto Finance Key Metrics Consumer Originations Consumer Origination Mix ($ billions; % of $ originations) (% of $ originations) 688 691 685 686 685 687 $9.7 $9.3 $9.8 49% 50% $9.1 54% 55% 55% 60% $8.1 $7.2 50% 46% 50% 50% 44% 14% 14% 11% 50% 13% 14% 12% 25% 28% 29% 36% 37% 29% 26% 35% 31% 32% 28% 28% 12% 12% 11% 12% 11% 12% 25% 26% 27% 24% 21% 22% 2Q 19 3Q 19 4Q 19 1Q 20 2Q 20 3Q 20 2Q 19 3Q 19 4Q 19 1Q 20 2Q 20 3Q 20 New Retail Lease Used Nonprime % of Total Retail GM Chrysler Growth Retail Auto - Weighted average FICO Note: See page 30 for definition. Note: See page 30 for definition. Consumer Assets Commercial Assets (Average balance, $ billions) (End of period, $ billions) $82.9 $81.5 $81.5 $81.5 $81.2 $81.1 $34.8 $33.3 $31.9 $30.5 $9.5 $8.4 $8.7 $8.9 $9.1 $9.1 $5.7 $5.8 $26.1 $5.6 $5.3 $21.3 $5.9 $5.9 $73.5 $72.7 $72.9 $72.3 $72.5 $72.4 $29.0 $27.5 $26.3 $25.1 $20.2 $15.4 2Q 19 3Q 19 4Q 19 1Q 20 2Q 20 3Q 20 2Q 19 3Q 19 4Q 19 1Q 20 2Q 20 3Q 20 Retail Lease Dealer Floorplan Other Dealer Loans Note: Held-for-investment (HFI) asset balances reflect the average daily balance for the quarter. 3Q 2020 Preliminary Results 19
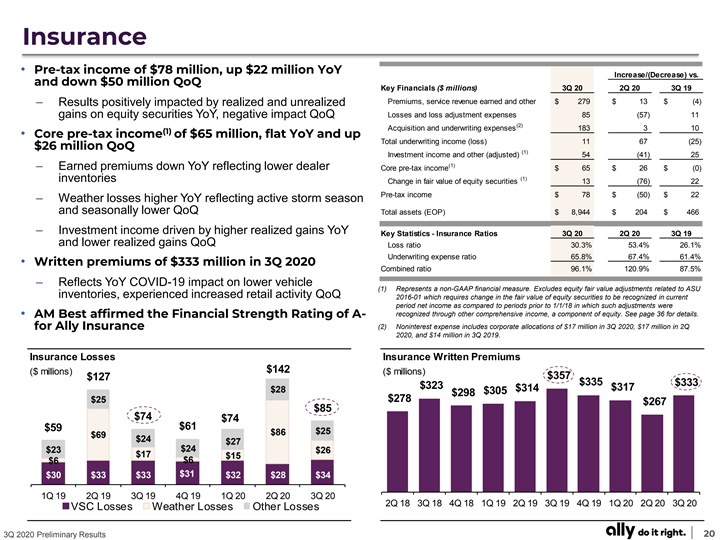
Insurance • Pre-tax income of $78 million, up $22 million YoY Increase/(Decrease) vs. and down $50 million QoQ Key Financials ($ millions) 3Q 20 2Q 20 3Q 19 Premiums, service revenue earned and other $ 279 $ 13 $ (4) – Results positively impacted by realized and unrealized Losses and loss adjustment expenses 85 (57) 11 gains on equity securities YoY, negative impact QoQ (2) Acquisition and underwriting expenses 183 3 10 (1) • Core pre-tax income of $65 million, flat YoY and up Total underwriting income (loss) 11 67 (25) $26 million QoQ (1) Investment income and other (adjusted) 54 (41) 25 (1) – Earned premiums down YoY reflecting lower dealer Core pre-tax income $ 65 $ 26 $ (0) (1) inventories Change in fair value of equity securities 13 (76) 22 Pre-tax income $ 78 $ ( 50) $ 22 – Weather losses higher YoY reflecting active storm season and seasonally lower QoQ Total assets (EOP) $ 8,944 $ 204 $ 466 – Investment income driven by higher realized gains YoY Key Statistics - Insurance Ratios 3Q 20 2Q 20 3Q 19 and lower realized gains QoQ Loss ratio 30.3% 53.4% 26.1% Underwriting expense ratio 65.8% 67.4% 61.4% • Written premiums of $333 million in 3Q 2020 Combined ratio 96.1% 120.9% 87.5% – Reflects YoY COVID-19 impact on lower vehicle (1) Represents a non-GAAP financial measure. Excludes equity fair value adjustments related to ASU inventories, experienced increased retail activity QoQ 2016-01 which requires change in the fair value of equity securities to be recognized in current period net income as compared to periods prior to 1/1/18 in which such adjustments were recognized through other comprehensive income, a component of equity. See page 36 for details. • AM Best affirmed the Financial Strength Rating of A- (2) Noninterest expense includes corporate allocations of $17 million in 3Q 2020, $17 million in 2Q for Ally Insurance 2020, and $14 million in 3Q 2019. Insurance Losses Insurance Written Premiums $142 ($ millions) ($ millions) $357 $127 $335 $333 $323 $317 $314 $28 $305 $298 $278 $25 $267 $85 $74 $74 $61 $59 $25 $86 $69 $24 $27 $24 $23 $26 $17 $15 $6 $6 $31 $30 $33 $33 $32 $28 $34 1Q 19 2Q 19 3Q 19 4Q 19 1Q 20 2Q 20 3Q 20 2Q 18 3Q 18 4Q 18 1Q 19 2Q 19 3Q 19 4Q 19 1Q 20 2Q 20 3Q 20 VSC Losses Weather Losses Other Losses 3Q 2020 Preliminary Results 20Insurance • Pre-tax income of $78 million, up $22 million YoY Increase/(Decrease) vs. and down $50 million QoQ Key Financials ($ millions) 3Q 20 2Q 20 3Q 19 Premiums, service revenue earned and other $ 279 $ 13 $ (4) – Results positively impacted by realized and unrealized Losses and loss adjustment expenses 85 (57) 11 gains on equity securities YoY, negative impact QoQ (2) Acquisition and underwriting expenses 183 3 10 (1) • Core pre-tax income of $65 million, flat YoY and up Total underwriting income (loss) 11 67 (25) $26 million QoQ (1) Investment income and other (adjusted) 54 (41) 25 (1) – Earned premiums down YoY reflecting lower dealer Core pre-tax income $ 65 $ 26 $ (0) (1) inventories Change in fair value of equity securities 13 (76) 22 Pre-tax income $ 78 $ ( 50) $ 22 – Weather losses higher YoY reflecting active storm season and seasonally lower QoQ Total assets (EOP) $ 8,944 $ 204 $ 466 – Investment income driven by higher realized gains YoY Key Statistics - Insurance Ratios 3Q 20 2Q 20 3Q 19 and lower realized gains QoQ Loss ratio 30.3% 53.4% 26.1% Underwriting expense ratio 65.8% 67.4% 61.4% • Written premiums of $333 million in 3Q 2020 Combined ratio 96.1% 120.9% 87.5% – Reflects YoY COVID-19 impact on lower vehicle (1) Represents a non-GAAP financial measure. Excludes equity fair value adjustments related to ASU inventories, experienced increased retail activity QoQ 2016-01 which requires change in the fair value of equity securities to be recognized in current period net income as compared to periods prior to 1/1/18 in which such adjustments were recognized through other comprehensive income, a component of equity. See page 36 for details. • AM Best affirmed the Financial Strength Rating of A- (2) Noninterest expense includes corporate allocations of $17 million in 3Q 2020, $17 million in 2Q for Ally Insurance 2020, and $14 million in 3Q 2019. Insurance Losses Insurance Written Premiums $142 ($ millions) ($ millions) $357 $127 $335 $333 $323 $317 $314 $28 $305 $298 $278 $25 $267 $85 $74 $74 $61 $59 $25 $86 $69 $24 $27 $24 $23 $26 $17 $15 $6 $6 $31 $30 $33 $33 $32 $28 $34 1Q 19 2Q 19 3Q 19 4Q 19 1Q 20 2Q 20 3Q 20 2Q 18 3Q 18 4Q 18 1Q 19 2Q 19 3Q 19 4Q 19 1Q 20 2Q 20 3Q 20 VSC Losses Weather Losses Other Losses 3Q 2020 Preliminary Results 20

Corporate Finance • Pre-tax income of $60 million, up $16 million YoY and Increase/(Decrease) vs. up $28 million QoQ Key Financials ($ millions) 3Q 20 2Q 20 3Q 19 Net financing revenue $ 75 $ (2) $ 15 (1) – Net financing revenue increase YoY reflects higher loan Adjusted total other revenue 8 3 (2) (1) Adjusted total net revenue 83 1 13 balances Provision for credit losses 1 (24) (2) (2) Noninterest expense 23 (3) 1 • $5.9 billion held-for-investment portfolio, up 17% YoY (1) Core pre-tax income $ 59 $ 28 $ 14 (1) Change in fair value of equity securities 1 0 2 – Credit continues to perform well despite current economic Pre-tax income $ 60 $ 28 $ 16 backdrop – risk management activities remain disciplined Total assets (EOP) $ 5,995 $ (211) $ 720 (1) Represents a non-GAAP financial measure. Excludes equity fair value adjustments related to ASU 2016-01 which requires change in the fair value of equity securities to be recognized in current – Growth in commitments reflects focused, steady origination period net income as compared to periods prior to 1/1/18 in which such adjustments were activities – utilization levels remain low recognized through other comprehensive income, a component of equity. See page 36 for details. (2) Noninterest expense includes corporate allocations of $8 million in 3Q 2020, $8 million in 2Q 2020, and $7 million in 3Q 2019. Key Corporate Finance HFI Loans and Unfunded Commitments % % % ~65 47 0 (end of period balances, $ billions) Portfolio Asset Based Portfolio w/ Direct Gas & Oil (3) Lending LIBOR Floor Exposure Metrics Corporate Finance Outstandings Loan Portfolio by Industry - 9/30/2020 Chemicals & Construction Wholesale $3.8 $2.5 $3.5 Paper Printing & Services Metals 1% 3% Other Publishing $2.6 4% 4% 1% $2.3 Other Manufactured Prod. Food And 3% Beverages 3% Machinery. Equip. Manufacturing Elect. $6.5 $6.0 $5.9 $5.7 7% Financial Services $5.0 19% Auto & Transportation 11% Other Retail Trade 3Q 19 4Q 19 1Q 20 2Q 20 3Q 20 1% Health Services 22% Held-for-investment loans Unfunded Commitments Other Services 21% (3) As of 9/30/2020 3Q 2020 Preliminary Results 21Corporate Finance • Pre-tax income of $60 million, up $16 million YoY and Increase/(Decrease) vs. up $28 million QoQ Key Financials ($ millions) 3Q 20 2Q 20 3Q 19 Net financing revenue $ 75 $ (2) $ 15 (1) – Net financing revenue increase YoY reflects higher loan Adjusted total other revenue 8 3 (2) (1) Adjusted total net revenue 83 1 13 balances Provision for credit losses 1 (24) (2) (2) Noninterest expense 23 (3) 1 • $5.9 billion held-for-investment portfolio, up 17% YoY (1) Core pre-tax income $ 59 $ 28 $ 14 (1) Change in fair value of equity securities 1 0 2 – Credit continues to perform well despite current economic Pre-tax income $ 60 $ 28 $ 16 backdrop – risk management activities remain disciplined Total assets (EOP) $ 5,995 $ (211) $ 720 (1) Represents a non-GAAP financial measure. Excludes equity fair value adjustments related to ASU 2016-01 which requires change in the fair value of equity securities to be recognized in current – Growth in commitments reflects focused, steady origination period net income as compared to periods prior to 1/1/18 in which such adjustments were activities – utilization levels remain low recognized through other comprehensive income, a component of equity. See page 36 for details. (2) Noninterest expense includes corporate allocations of $8 million in 3Q 2020, $8 million in 2Q 2020, and $7 million in 3Q 2019. Key Corporate Finance HFI Loans and Unfunded Commitments % % % ~65 47 0 (end of period balances, $ billions) Portfolio Asset Based Portfolio w/ Direct Gas & Oil (3) Lending LIBOR Floor Exposure Metrics Corporate Finance Outstandings Loan Portfolio by Industry - 9/30/2020 Chemicals & Construction Wholesale $3.8 $2.5 $3.5 Paper Printing & Services Metals 1% 3% Other Publishing $2.6 4% 4% 1% $2.3 Other Manufactured Prod. Food And 3% Beverages 3% Machinery. Equip. Manufacturing Elect. $6.5 $6.0 $5.9 $5.7 7% Financial Services $5.0 19% Auto & Transportation 11% Other Retail Trade 3Q 19 4Q 19 1Q 20 2Q 20 3Q 20 1% Health Services 22% Held-for-investment loans Unfunded Commitments Other Services 21% (3) As of 9/30/2020 3Q 2020 Preliminary Results 21
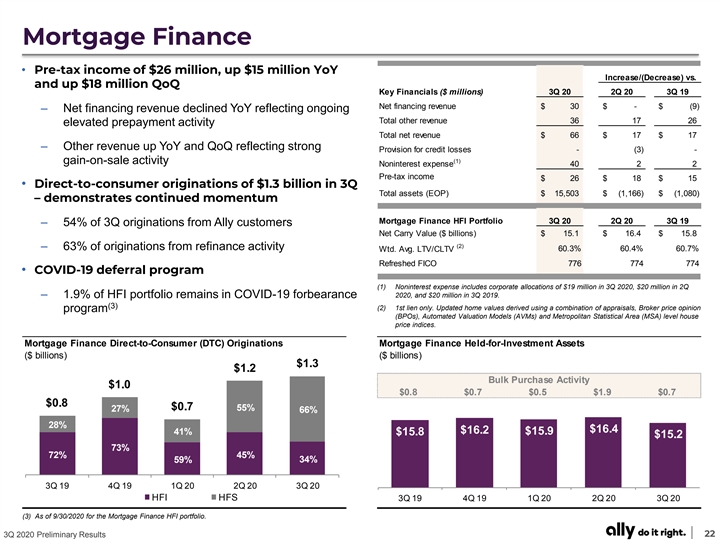
Mortgage Finance • Pre-tax income of $26 million, up $15 million YoY Increase/(Decrease) vs. and up $18 million QoQ Key Financials ($ millions) 3Q 20 2Q 20 3Q 19 Net financing revenue $ 30 $ - $ (9) – Net financing revenue declined YoY reflecting ongoing Total other revenue 36 17 26 elevated prepayment activity Total net revenue $ 66 $ 17 $ 17 – Other revenue up YoY and QoQ reflecting strong Provision for credit losses - (3) - (1) gain-on-sale activity Noninterest expense 40 2 2 Pre-tax income $ 26 $ 18 $ 15 • Direct-to-consumer originations of $1.3 billion in 3Q Total assets (EOP) $ 15,503 $ (1,166) $ (1,080) – demonstrates continued momentum Mortgage Finance HFI Portfolio 3Q 20 2Q 20 3Q 19 – 54% of 3Q originations from Ally customers Net Carry Value ($ billions) $ 15.1 $ 16.4 $ 15.8 (2) – 63% of originations from refinance activity 60.3% 60.4% 60.7% Wtd. Avg. LTV/CLTV Refreshed FICO 776 774 774 • COVID-19 deferral program (1) Noninterest expense includes corporate allocations of $19 million in 3Q 2020, $20 million in 2Q – 1.9% of HFI portfolio remains in COVID-19 forbearance 2020, and $20 million in 3Q 2019. (3) (2) 1st lien only. Updated home values derived using a combination of appraisals, Broker price opinion program (BPOs), Automated Valuation Models (AVMs) and Metropolitan Statistical Area (MSA) level house price indices. Mortgage Finance Direct-to-Consumer (DTC) Originations Mortgage Finance Held-for-Investment Assets ($ billions) ($ billions) $1.3 $1.2 Bulk Purchase Activity $1.0 $0.8 $0.7 $0.5 $1.9 $0.7 $0.8 $0.7 55% 27% 66% 28% $16.4 $16.2 41% $15.8 $15.9 $15.2 73% 72% 45% 59% 34% 3Q 19 4Q 19 1Q 20 2Q 20 3Q 20 HFI HFS 3Q 19 4Q 19 1Q 20 2Q 20 3Q 20 (3) As of 9/30/2020 for the Mortgage Finance HFI portfolio. 3Q 2020 Preliminary Results 22Mortgage Finance • Pre-tax income of $26 million, up $15 million YoY Increase/(Decrease) vs. and up $18 million QoQ Key Financials ($ millions) 3Q 20 2Q 20 3Q 19 Net financing revenue $ 30 $ - $ (9) – Net financing revenue declined YoY reflecting ongoing Total other revenue 36 17 26 elevated prepayment activity Total net revenue $ 66 $ 17 $ 17 – Other revenue up YoY and QoQ reflecting strong Provision for credit losses - (3) - (1) gain-on-sale activity Noninterest expense 40 2 2 Pre-tax income $ 26 $ 18 $ 15 • Direct-to-consumer originations of $1.3 billion in 3Q Total assets (EOP) $ 15,503 $ (1,166) $ (1,080) – demonstrates continued momentum Mortgage Finance HFI Portfolio 3Q 20 2Q 20 3Q 19 – 54% of 3Q originations from Ally customers Net Carry Value ($ billions) $ 15.1 $ 16.4 $ 15.8 (2) – 63% of originations from refinance activity 60.3% 60.4% 60.7% Wtd. Avg. LTV/CLTV Refreshed FICO 776 774 774 • COVID-19 deferral program (1) Noninterest expense includes corporate allocations of $19 million in 3Q 2020, $20 million in 2Q – 1.9% of HFI portfolio remains in COVID-19 forbearance 2020, and $20 million in 3Q 2019. (3) (2) 1st lien only. Updated home values derived using a combination of appraisals, Broker price opinion program (BPOs), Automated Valuation Models (AVMs) and Metropolitan Statistical Area (MSA) level house price indices. Mortgage Finance Direct-to-Consumer (DTC) Originations Mortgage Finance Held-for-Investment Assets ($ billions) ($ billions) $1.3 $1.2 Bulk Purchase Activity $1.0 $0.8 $0.7 $0.5 $1.9 $0.7 $0.8 $0.7 55% 27% 66% 28% $16.4 $16.2 41% $15.8 $15.9 $15.2 73% 72% 45% 59% 34% 3Q 19 4Q 19 1Q 20 2Q 20 3Q 20 HFI HFS 3Q 19 4Q 19 1Q 20 2Q 20 3Q 20 (3) As of 9/30/2020 for the Mortgage Finance HFI portfolio. 3Q 2020 Preliminary Results 22

Strategic Priorities Relentless Customer Focus and ‘Do It Right’ Culture Leading, adaptable Auto & Insurance businesses Lending and digitally-based Ally Bank platform Consumer & Commercial Ongoing customer growth & relationship Savings & deepening across scalable platforms Insurance Checking Accelerated growth in expanded product offerings Servicing Efficient & disciplined risk management and & Customer Investing capital deployment Solutions Focus on long-term execution & sustainable Payments returns across all products Steady execution in current environment | Delivering on long-term strategic objectives 3Q 2020 Preliminary Results 23Strategic Priorities Relentless Customer Focus and ‘Do It Right’ Culture Leading, adaptable Auto & Insurance businesses Lending and digitally-based Ally Bank platform Consumer & Commercial Ongoing customer growth & relationship Savings & deepening across scalable platforms Insurance Checking Accelerated growth in expanded product offerings Servicing Efficient & disciplined risk management and & Customer Investing capital deployment Solutions Focus on long-term execution & sustainable Payments returns across all products Steady execution in current environment | Delivering on long-term strategic objectives 3Q 2020 Preliminary Results 23

Supplemental 3Q 2020 Preliminary Results 24Supplemental 3Q 2020 Preliminary Results 24

Supplemental Results by Segment Pre-Tax Income ($ millions) 3Q 20 2Q 20 3Q 19 Automotive Finance $ 566 $ 329 $ 429 Insurance 78 128 56 Dealer Financial Services $ 644 $ 457 $ 485 Corporate Finance 60 32 44 Mortgage Finance 26 8 11 Corporate and Other (9 8) (160) (4 0) Pre-tax income from continuing operations $ 632 $ 337 $ 500 (1) 9 9 7 Core OID (2) (1 3) (90) 11 Change in fair value of equity securities (3) - 50 - Repositioning and other (4) $ 628 $ 306 $ 519 Core pre-tax income (1) Core OID for all periods shown is applied to the pre-tax income of the Corporate and Other segment. (2) Change in fair value of equity securities impacts the Insurance and Corporate Finance segments. Reflects equity fair value adjustments related to ASU 2016-01 which requires change in the fair value of equity securities to be recognized in current period net income as compared to periods prior to 1/1/18 in which such adjustments were recognized through other comprehensive income, a component of equity. See pages 36 for details. (3) Repositioning and other include a $50 million Goodwill impairment at Ally Invest in 2Q 20. (4) Core pre-tax income is a non-GAAP financial measure that adjusts pre-tax income from continuing operations for Core OID, equity fair value adjustments related to ASU 2016-01, and, repositioning and other which are primarily related to the extinguishment of high cost legacy debt, strategic activities and significant other one- time items. Management believes core pre-tax income can help the reader better understand the operating performance of the core businesses and their ability to generate earnings. See page 36 for calculation methodology and details. 3Q 2020 Preliminary Results 25Supplemental Results by Segment Pre-Tax Income ($ millions) 3Q 20 2Q 20 3Q 19 Automotive Finance $ 566 $ 329 $ 429 Insurance 78 128 56 Dealer Financial Services $ 644 $ 457 $ 485 Corporate Finance 60 32 44 Mortgage Finance 26 8 11 Corporate and Other (9 8) (160) (4 0) Pre-tax income from continuing operations $ 632 $ 337 $ 500 (1) 9 9 7 Core OID (2) (1 3) (90) 11 Change in fair value of equity securities (3) - 50 - Repositioning and other (4) $ 628 $ 306 $ 519 Core pre-tax income (1) Core OID for all periods shown is applied to the pre-tax income of the Corporate and Other segment. (2) Change in fair value of equity securities impacts the Insurance and Corporate Finance segments. Reflects equity fair value adjustments related to ASU 2016-01 which requires change in the fair value of equity securities to be recognized in current period net income as compared to periods prior to 1/1/18 in which such adjustments were recognized through other comprehensive income, a component of equity. See pages 36 for details. (3) Repositioning and other include a $50 million Goodwill impairment at Ally Invest in 2Q 20. (4) Core pre-tax income is a non-GAAP financial measure that adjusts pre-tax income from continuing operations for Core OID, equity fair value adjustments related to ASU 2016-01, and, repositioning and other which are primarily related to the extinguishment of high cost legacy debt, strategic activities and significant other one- time items. Management believes core pre-tax income can help the reader better understand the operating performance of the core businesses and their ability to generate earnings. See page 36 for calculation methodology and details. 3Q 2020 Preliminary Results 25
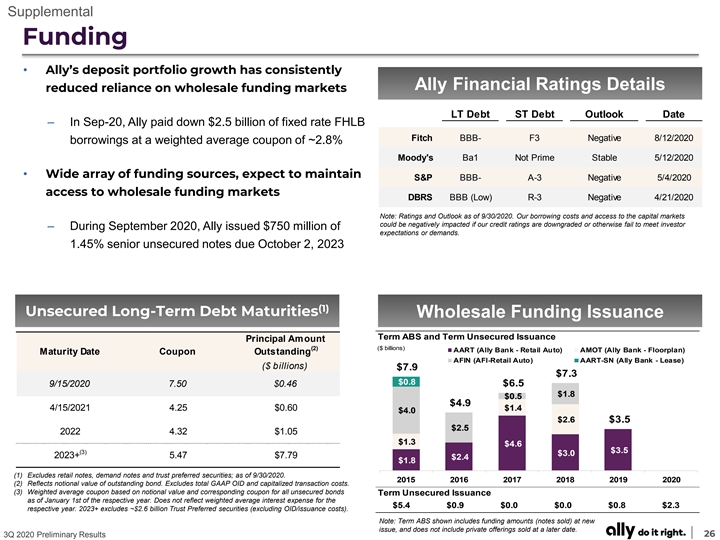
Supplemental Funding • Ally’s deposit portfolio growth has consistently Ally Financial Ratings Details reduced reliance on wholesale funding markets LT Debt ST Debt Outlook Date – In Sep-20, Ally paid down $2.5 billion of fixed rate FHLB Fitch BBB- F3 Negative 8/12/2020 borrowings at a weighted average coupon of ~2.8% Moody's Ba1 Not Prime Stable 5/12/2020 • Wide array of funding sources, expect to maintain S&P BBB- A-3 Negative 5/4/2020 access to wholesale funding markets DBRS BBB (Low) R-3 Negative 4/21/2020 Note: Ratings and Outlook as of 9/30/2020. Our borrowing costs and access to the capital markets could be negatively impacted if our credit ratings are downgraded or otherwise fail to meet investor – During September 2020, Ally issued $750 million of expectations or demands. 1.45% senior unsecured notes due October 2, 2023 (1) Unsecured Long-Term Debt Maturities Wholesale Funding Issuance Term ABS and Term Unsecured Issuance Principal Amount (2) ($ billions) AART (Ally Bank - Retail Auto) AMOT (Ally Bank - Floorplan) Maturity Date Coupon Outstanding AFIN (AFI-Retail Auto) AART-SN (Ally Bank - Lease) ($ billions) $7.9 $7.3 $0.8 9/15/2020 7.50 $0.46 $6.5 $1.8 $0.5 $4.9 4/15/2021 4.25 $0.60 $1.4 $4.0 $2.6 $3.5 $2.5 2022 4.32 $1.05 $1.3 $4.6 $3.5 (3) $3.0 2023+ 5.47 $7.79 $2.4 $1.8 (1) Excludes retail notes, demand notes and trust preferred securities; as of 9/30/2020. 2015 2016 2017 2018 2019 2020 (2) Reflects notional value of outstanding bond. Excludes total GAAP OID and capitalized transaction costs. (3) Weighted average coupon based on notional value and corresponding coupon for all unsecured bonds Term Unsecured Issuance as of January 1st of the respective year. Does not reflect weighted average interest expense for the $5.4 $0.9 $0.0 $0.0 $0.8 $2.3 respective year. 2023+ excludes ~$2.6 billion Trust Preferred securities (excluding OID/issuance costs). Note: Term ABS shown includes funding amounts (notes sold) at new issue, and does not include private offerings sold at a later date. 3Q 2020 Preliminary Results 26Supplemental Funding • Ally’s deposit portfolio growth has consistently Ally Financial Ratings Details reduced reliance on wholesale funding markets LT Debt ST Debt Outlook Date – In Sep-20, Ally paid down $2.5 billion of fixed rate FHLB Fitch BBB- F3 Negative 8/12/2020 borrowings at a weighted average coupon of ~2.8% Moody's Ba1 Not Prime Stable 5/12/2020 • Wide array of funding sources, expect to maintain S&P BBB- A-3 Negative 5/4/2020 access to wholesale funding markets DBRS BBB (Low) R-3 Negative 4/21/2020 Note: Ratings and Outlook as of 9/30/2020. Our borrowing costs and access to the capital markets could be negatively impacted if our credit ratings are downgraded or otherwise fail to meet investor – During September 2020, Ally issued $750 million of expectations or demands. 1.45% senior unsecured notes due October 2, 2023 (1) Unsecured Long-Term Debt Maturities Wholesale Funding Issuance Term ABS and Term Unsecured Issuance Principal Amount (2) ($ billions) AART (Ally Bank - Retail Auto) AMOT (Ally Bank - Floorplan) Maturity Date Coupon Outstanding AFIN (AFI-Retail Auto) AART-SN (Ally Bank - Lease) ($ billions) $7.9 $7.3 $0.8 9/15/2020 7.50 $0.46 $6.5 $1.8 $0.5 $4.9 4/15/2021 4.25 $0.60 $1.4 $4.0 $2.6 $3.5 $2.5 2022 4.32 $1.05 $1.3 $4.6 $3.5 (3) $3.0 2023+ 5.47 $7.79 $2.4 $1.8 (1) Excludes retail notes, demand notes and trust preferred securities; as of 9/30/2020. 2015 2016 2017 2018 2019 2020 (2) Reflects notional value of outstanding bond. Excludes total GAAP OID and capitalized transaction costs. (3) Weighted average coupon based on notional value and corresponding coupon for all unsecured bonds Term Unsecured Issuance as of January 1st of the respective year. Does not reflect weighted average interest expense for the $5.4 $0.9 $0.0 $0.0 $0.8 $2.3 respective year. 2023+ excludes ~$2.6 billion Trust Preferred securities (excluding OID/issuance costs). Note: Term ABS shown includes funding amounts (notes sold) at new issue, and does not include private offerings sold at a later date. 3Q 2020 Preliminary Results 26
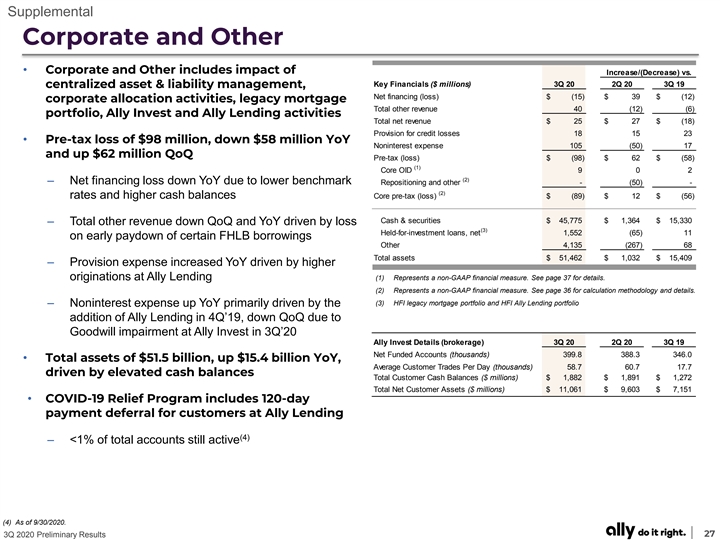
Supplemental Corporate and Other • Corporate and Other includes impact of Increase/(Decrease) vs. Key Financials ($ millions) 3Q 20 2Q 20 3Q 19 centralized asset & liability management, Net financing (loss) $ (15) $ 39 $ (12) corporate allocation activities, legacy mortgage Total other revenue 40 (12) (6) portfolio, Ally Invest and Ally Lending activities Total net revenue $ 25 $ 27 $ ( 18) Provision for credit losses 18 15 23 • Pre-tax loss of $98 million, down $58 million YoY Noninterest expense 105 (50) 17 and up $62 million QoQ Pre-tax (loss) $ ( 98) $ 62 $ (58) (1) Core OID 9 0 2 (2) – Net financing loss down YoY due to lower benchmark Repositioning and other - (50) - - - (2) rates and higher cash balances Core pre-tax (loss) $ (89) $ 12 $ (56) Cash & securities $ 45,775 $ 1,364 $ 15,330 – Total other revenue down QoQ and YoY driven by loss (3) Held-for-investment loans, net 1,552 (65) 11 on early paydown of certain FHLB borrowings Other 4,135 ( 267) 68 Total assets $ 51,462 $ 1,032 $ 15,409 – Provision expense increased YoY driven by higher originations at Ally Lending (1) Represents a non-GAAP financial measure. See page 37 for details. (2) Represents a non-GAAP financial measure. See page 36 for calculation methodology and details. (3) HFI legacy mortgage portfolio and HFI Ally Lending portfolio – Noninterest expense up YoY primarily driven by the addition of Ally Lending in 4Q’19, down QoQ due to Goodwill impairment at Ally Invest in 3Q’20 Ally Invest Details (brokerage) 3Q 20 2Q 20 3Q 19 Net Funded Accounts (thousands) 399.8 388.3 346.0 • Total assets of $51.5 billion, up $15.4 billion YoY, Average Customer Trades Per Day (thousands) 58.7 60.7 17.7 driven by elevated cash balances Total Customer Cash Balances ($ millions) $ 1,882 $ 1,891 $ 1,272 Total Net Customer Assets ($ millions) $ 11,061 $ 9,603 $ 7,151 • COVID-19 Relief Program includes 120-day payment deferral for customers at Ally Lending (4) – <1% of total accounts still active (4) As of 9/30/2020. 3Q 2020 Preliminary Results 27Supplemental Corporate and Other • Corporate and Other includes impact of Increase/(Decrease) vs. Key Financials ($ millions) 3Q 20 2Q 20 3Q 19 centralized asset & liability management, Net financing (loss) $ (15) $ 39 $ (12) corporate allocation activities, legacy mortgage Total other revenue 40 (12) (6) portfolio, Ally Invest and Ally Lending activities Total net revenue $ 25 $ 27 $ ( 18) Provision for credit losses 18 15 23 • Pre-tax loss of $98 million, down $58 million YoY Noninterest expense 105 (50) 17 and up $62 million QoQ Pre-tax (loss) $ ( 98) $ 62 $ (58) (1) Core OID 9 0 2 (2) – Net financing loss down YoY due to lower benchmark Repositioning and other - (50) - - - (2) rates and higher cash balances Core pre-tax (loss) $ (89) $ 12 $ (56) Cash & securities $ 45,775 $ 1,364 $ 15,330 – Total other revenue down QoQ and YoY driven by loss (3) Held-for-investment loans, net 1,552 (65) 11 on early paydown of certain FHLB borrowings Other 4,135 ( 267) 68 Total assets $ 51,462 $ 1,032 $ 15,409 – Provision expense increased YoY driven by higher originations at Ally Lending (1) Represents a non-GAAP financial measure. See page 37 for details. (2) Represents a non-GAAP financial measure. See page 36 for calculation methodology and details. (3) HFI legacy mortgage portfolio and HFI Ally Lending portfolio – Noninterest expense up YoY primarily driven by the addition of Ally Lending in 4Q’19, down QoQ due to Goodwill impairment at Ally Invest in 3Q’20 Ally Invest Details (brokerage) 3Q 20 2Q 20 3Q 19 Net Funded Accounts (thousands) 399.8 388.3 346.0 • Total assets of $51.5 billion, up $15.4 billion YoY, Average Customer Trades Per Day (thousands) 58.7 60.7 17.7 driven by elevated cash balances Total Customer Cash Balances ($ millions) $ 1,882 $ 1,891 $ 1,272 Total Net Customer Assets ($ millions) $ 11,061 $ 9,603 $ 7,151 • COVID-19 Relief Program includes 120-day payment deferral for customers at Ally Lending (4) – <1% of total accounts still active (4) As of 9/30/2020. 3Q 2020 Preliminary Results 27
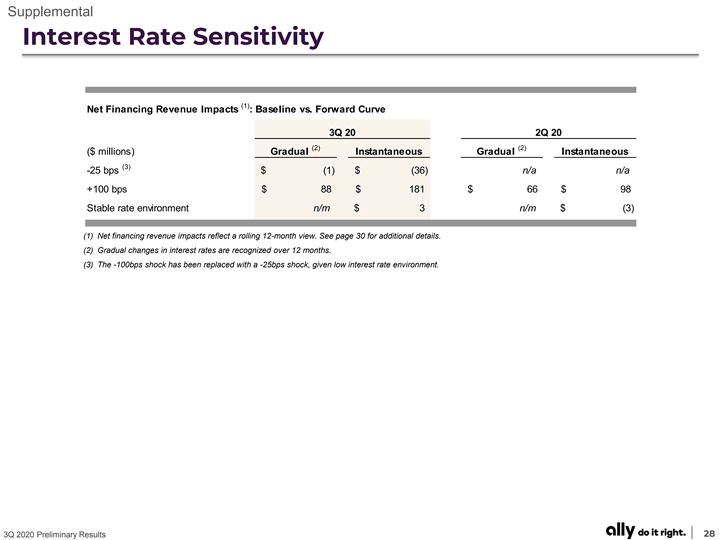
Supplemental Interest Rate Sensitivity (1) Net Financing Revenue Impacts : Baseline vs. Forward Curve 3Q 20 2Q 20 (2) (2) ($ millions) Gradual Instantaneous Gradual Instantaneous (3) -25 bps $ (1) $ ( 36) n/a n/a +100 bps $ 88 $ 181 $ 66 $ 98 Stable rate environment n/m $ 3 n/m $ (3) (1) Net financing revenue impacts reflect a rolling 12-month view. See page 30 for additional details. (2) Gradual changes in interest rates are recognized over 12 months. (3) The -100bps shock has been replaced with a -25bps shock, given low interest rate environment. 3Q 2020 Preliminary Results 28Supplemental Interest Rate Sensitivity (1) Net Financing Revenue Impacts : Baseline vs. Forward Curve 3Q 20 2Q 20 (2) (2) ($ millions) Gradual Instantaneous Gradual Instantaneous (3) -25 bps $ (1) $ ( 36) n/a n/a +100 bps $ 88 $ 181 $ 66 $ 98 Stable rate environment n/m $ 3 n/m $ (3) (1) Net financing revenue impacts reflect a rolling 12-month view. See page 30 for additional details. (2) Gradual changes in interest rates are recognized over 12 months. (3) The -100bps shock has been replaced with a -25bps shock, given low interest rate environment. 3Q 2020 Preliminary Results 28

Supplemental Deferred Tax Asset (1) (1) Deferred Tax Asset / (Liability) 3Q 20 2Q 20 Gross DTA/(DTL) Valuation Net DTA/(DTL) Net DTA/(DTL) ($ millions) Balance Allowance Balance Balance Net Operating Loss (Federal) $ 7 $ - $ 7 $ 7 Tax Credit Carryforwards 1,835 (750) 1,085 956 State/Local Tax Carryforwards 149 ( 107) 42 36 (2) Other Deferred Tax Liabilities, net ( 1,057) - (1,057) (862) Net Deferred Tax Asset / (Liability) $ 934 $ (857) $ 77 $ 137 (1) GAAP does not prescribe a method for calculating individual elements of deferred taxes for interim periods; therefore, these balances are estimates. (2) Primarily book / tax timing differences, including loan loss reserves impact of ~$0.3 billion related to CECL implementation. Deferred Tax Asset / (Liability) Utilization ($ millions) Net GAAP DTA / (DTL) Balance Disallowed DTA $215 $137 $77 $48 $39 $25 $20 $18 $17 -$9 3Q 19 4Q 19 1Q 20 2Q 20 3Q 20 3Q 2020 Preliminary Results 29Supplemental Deferred Tax Asset (1) (1) Deferred Tax Asset / (Liability) 3Q 20 2Q 20 Gross DTA/(DTL) Valuation Net DTA/(DTL) Net DTA/(DTL) ($ millions) Balance Allowance Balance Balance Net Operating Loss (Federal) $ 7 $ - $ 7 $ 7 Tax Credit Carryforwards 1,835 (750) 1,085 956 State/Local Tax Carryforwards 149 ( 107) 42 36 (2) Other Deferred Tax Liabilities, net ( 1,057) - (1,057) (862) Net Deferred Tax Asset / (Liability) $ 934 $ (857) $ 77 $ 137 (1) GAAP does not prescribe a method for calculating individual elements of deferred taxes for interim periods; therefore, these balances are estimates. (2) Primarily book / tax timing differences, including loan loss reserves impact of ~$0.3 billion related to CECL implementation. Deferred Tax Asset / (Liability) Utilization ($ millions) Net GAAP DTA / (DTL) Balance Disallowed DTA $215 $137 $77 $48 $39 $25 $20 $18 $17 -$9 3Q 19 4Q 19 1Q 20 2Q 20 3Q 20 3Q 2020 Preliminary Results 29

Supplemental Notes on Non-GAAP and Other Financial Measures The following are non-GAAP financial measures which Ally believes are important to the reader of the Consolidated Financial Statements, but which are supplemental to, and not a substitute for, GAAP measures: Adjusted Earnings per Share (Adjusted EPS), Core pre-tax income, Core net income attributable to common shareholders, Core return on tangible common equity (Core ROTCE), Adjusted efficiency ratio, Adjusted total net revenue, Adjusted other revenue, Core original issue discount (Core OID) amortization expense and Core outstanding original issue discount balance (Core OID balance), Net financing revenue (excluding Core OID), and Adjusted tangible book value per share (Adjusted TBVPS). These measures are used by management and we believe are useful to investors in assessing the company’s operating performance and capital. Refer to the Definitions of Non-GAAP Financial Measures and Other Key Terms, and Reconciliation to GAAP later in this document. 1) Core pre-tax income is a non-GAAP financial measure that adjusts pre-tax income from continuing operations by excluding (1) Core OID, and (2) equity fair value adjustments related to ASU 2016-01 which requires change in the fair value of equity securities to be recognized in current period net income as compared to periods prior to 1/1/18 in which such adjustments were recognized through other comprehensive income, a component of equity, and (3) Repositioning and other which are primarily related to the extinguishment of high cost legacy debt, strategic activities and significant other one-time items, as applicable for respective periods. Management believes core pre-tax income can help the reader better understand the operating performance of the core businesses and their ability to generate earnings. See page 36 for calculation methodology and details. 2) Core net income attributable to common shareholders is a non-GAAP financial measure that serves as the numerator in the calculations of Adjusted EPS and Core ROTCE and that, like those measures, is believed by management to help the reader better understand the operating performance of the core businesses and their ability to generate earnings. Core net income attributable to common shareholders adjusts GAAP net income attributable to common shareholders for discontinued operations net of tax, tax-effected Core OID expense, tax-effected repositioning and other primarily related to the extinguishment of high-cost legacy debt and strategic activities and significant other, preferred stock capital actions, significant discrete tax items and tax-effected changes in equity investments measured at fair value, as applicable for respective periods. See page 32 for calculation methodology and details. 3) Core original issue discount (Core OID) amortization expense is a non-GAAP financial measure for OID and is believed by management to help the reader better understand the activity removed from: Core pre-tax income (loss), Core net income (loss) attributable to common shareholders, Adjusted EPS, Core ROTCE, Adjusted efficiency ratio, Adjusted total net revenue, and Net financing revenue (excluding Core OID). Core OID is primarily related to bond exchange OID which excludes international operations and future issuances. See page 37 for calculation methodology and details. 4) Core outstanding original issue discount balance (Core OID balance) is a non-GAAP financial measure for outstanding OID and is believed by management to help the reader better understand the balance removed from Core ROTCE and Adjusted TBVPS. Core OID balance is primarily related to bond exchange OID which excludes international operations and future issuances. See page 37 for calculation methodology and details 5) Accelerated issuance expense (Accelerated OID) is the recognition of issuance expenses related to calls of redeemable debt. 6) Interest rate risk modeling – We prepare our forward-looking baseline forecasts of net financing revenue taking into consideration anticipated future business growth, asset/liability positioning, and interest rates based on the implied forward curve. The analysis is highly dependent upon a variety of assumptions including the repricing characteristics of retail deposits with both contractual and non-contractual maturities. We continually monitor industry and competitive repricing activity along with other market factors when contemplating deposit pricing actions. Please see the 10-Q for more details. 7) Net charge-off ratios are calculated as annualized net charge-offs divided by average outstanding finance receivables and loans excluding loans measured at fair value and loans held-for-sale. 8) Tangible Common Equity is a non-GAAP financial measure that is defined as common stockholders’ equity less goodwill and identifiable intangible assets, net of deferred tax liabilities. Ally considers various measures when evaluating capital adequacy, including tangible common equity. Ally believes that tangible common equity is important because we believe readers may assess our capital adequacy using this measure. Additionally, presentation of this measure allows readers to compare certain aspects of our capital adequacy on the same basis to other companies in the industry. For purposes of calculating Core return on tangible common equity (Core ROTCE), tangible common equity is further adjusted for Core OID balance and net deferred tax asset. See page 33 for more details. 9) U.S. consumer auto originations ▪ New Retail – standard and subvented rate new vehicle loans ▪ Lease – new vehicle lease originations ▪ Used – used vehicle loans ▪ Growth – total originations from non-GM/Chrysler dealers and direct-to-consumer loans ▪ Nonprime – originations with a FICO® score of less than 620 10) Customer retention rate is the annualized 3-month rolling average of 1 minus the monthly attrition rate; excludes non-recurring escheatment. 3Q 2020 Preliminary Results 30Supplemental Notes on Non-GAAP and Other Financial Measures The following are non-GAAP financial measures which Ally believes are important to the reader of the Consolidated Financial Statements, but which are supplemental to, and not a substitute for, GAAP measures: Adjusted Earnings per Share (Adjusted EPS), Core pre-tax income, Core net income attributable to common shareholders, Core return on tangible common equity (Core ROTCE), Adjusted efficiency ratio, Adjusted total net revenue, Adjusted other revenue, Core original issue discount (Core OID) amortization expense and Core outstanding original issue discount balance (Core OID balance), Net financing revenue (excluding Core OID), and Adjusted tangible book value per share (Adjusted TBVPS). These measures are used by management and we believe are useful to investors in assessing the company’s operating performance and capital. Refer to the Definitions of Non-GAAP Financial Measures and Other Key Terms, and Reconciliation to GAAP later in this document. 1) Core pre-tax income is a non-GAAP financial measure that adjusts pre-tax income from continuing operations by excluding (1) Core OID, and (2) equity fair value adjustments related to ASU 2016-01 which requires change in the fair value of equity securities to be recognized in current period net income as compared to periods prior to 1/1/18 in which such adjustments were recognized through other comprehensive income, a component of equity, and (3) Repositioning and other which are primarily related to the extinguishment of high cost legacy debt, strategic activities and significant other one-time items, as applicable for respective periods. Management believes core pre-tax income can help the reader better understand the operating performance of the core businesses and their ability to generate earnings. See page 36 for calculation methodology and details. 2) Core net income attributable to common shareholders is a non-GAAP financial measure that serves as the numerator in the calculations of Adjusted EPS and Core ROTCE and that, like those measures, is believed by management to help the reader better understand the operating performance of the core businesses and their ability to generate earnings. Core net income attributable to common shareholders adjusts GAAP net income attributable to common shareholders for discontinued operations net of tax, tax-effected Core OID expense, tax-effected repositioning and other primarily related to the extinguishment of high-cost legacy debt and strategic activities and significant other, preferred stock capital actions, significant discrete tax items and tax-effected changes in equity investments measured at fair value, as applicable for respective periods. See page 32 for calculation methodology and details. 3) Core original issue discount (Core OID) amortization expense is a non-GAAP financial measure for OID and is believed by management to help the reader better understand the activity removed from: Core pre-tax income (loss), Core net income (loss) attributable to common shareholders, Adjusted EPS, Core ROTCE, Adjusted efficiency ratio, Adjusted total net revenue, and Net financing revenue (excluding Core OID). Core OID is primarily related to bond exchange OID which excludes international operations and future issuances. See page 37 for calculation methodology and details. 4) Core outstanding original issue discount balance (Core OID balance) is a non-GAAP financial measure for outstanding OID and is believed by management to help the reader better understand the balance removed from Core ROTCE and Adjusted TBVPS. Core OID balance is primarily related to bond exchange OID which excludes international operations and future issuances. See page 37 for calculation methodology and details 5) Accelerated issuance expense (Accelerated OID) is the recognition of issuance expenses related to calls of redeemable debt. 6) Interest rate risk modeling – We prepare our forward-looking baseline forecasts of net financing revenue taking into consideration anticipated future business growth, asset/liability positioning, and interest rates based on the implied forward curve. The analysis is highly dependent upon a variety of assumptions including the repricing characteristics of retail deposits with both contractual and non-contractual maturities. We continually monitor industry and competitive repricing activity along with other market factors when contemplating deposit pricing actions. Please see the 10-Q for more details. 7) Net charge-off ratios are calculated as annualized net charge-offs divided by average outstanding finance receivables and loans excluding loans measured at fair value and loans held-for-sale. 8) Tangible Common Equity is a non-GAAP financial measure that is defined as common stockholders’ equity less goodwill and identifiable intangible assets, net of deferred tax liabilities. Ally considers various measures when evaluating capital adequacy, including tangible common equity. Ally believes that tangible common equity is important because we believe readers may assess our capital adequacy using this measure. Additionally, presentation of this measure allows readers to compare certain aspects of our capital adequacy on the same basis to other companies in the industry. For purposes of calculating Core return on tangible common equity (Core ROTCE), tangible common equity is further adjusted for Core OID balance and net deferred tax asset. See page 33 for more details. 9) U.S. consumer auto originations ▪ New Retail – standard and subvented rate new vehicle loans ▪ Lease – new vehicle lease originations ▪ Used – used vehicle loans ▪ Growth – total originations from non-GM/Chrysler dealers and direct-to-consumer loans ▪ Nonprime – originations with a FICO® score of less than 620 10) Customer retention rate is the annualized 3-month rolling average of 1 minus the monthly attrition rate; excludes non-recurring escheatment. 3Q 2020 Preliminary Results 30
Supplemental Notes on Non-GAAP and Other Financial Measures 11) Estimated Retail Auto Originated Yield is a forward-looking non-GAAP financial measure determined by calculating the estimated average annualized yield for loans originated during the period. At this time there currently is no comparable GAAP financial measure for Estimated Retail Auto Originated Yield and therefore this forecasted estimate of yield at the time of origination cannot be quantitatively reconciled to comparable GAAP information. 12) Estimated impact of CECL on regulatory capital per final rule issued by U.S. banking agencies - In December 2018, the FRB and other U.S. banking agencies approved a final rule to address the impact of CECL on regulatory capital by allowing BHCs and banks, including Ally, the option to phase in the day-one impact of CECL over a three-year period. In March 2020, the FRB and other U.S. banking agencies issued an interim final rule that became effective on March 31, 2020 and provided an alternative option for banks to temporarily delay the impacts of CECL, relative to the incurred loss methodology for estimating the allowance for loan losses, on regulatory capital. A final rule that was largely unchanged from the March 2020 interim final rule was issued by the FRB and other U.S. banking agencies in August 2020, and became effective in September 2020. For regulatory capital purposes, these rules permitted us to delay recognizing the estimated impact of CECL on regulatory capital until after a two-year deferral period, which for us extends through December 31, 2021. Beginning on January 1, 2022, we will be required to phase in 25% of the previously deferred estimated capital impact of CECL, with an additional 25% to be phased in at the beginning of each subsequent year until fully phased in by the first quarter of 2025. Under these rules, firms that adopt CECL and elect the five-year transition will calculate the estimated impact of CECL on regulatory capital as the day-one impact of adoption plus 25% of the subsequent change in allowance during the two-year deferral period, which according to the final rule approximates the impact of CECL relative to an incurred loss model. We adopted this transition option during the first quarter of 2020, and plan to phase in the regulatory capital impacts of CECL based on this five-year transition period. 3Q 2020 Preliminary Results 31Supplemental Notes on Non-GAAP and Other Financial Measures 11) Estimated Retail Auto Originated Yield is a forward-looking non-GAAP financial measure determined by calculating the estimated average annualized yield for loans originated during the period. At this time there currently is no comparable GAAP financial measure for Estimated Retail Auto Originated Yield and therefore this forecasted estimate of yield at the time of origination cannot be quantitatively reconciled to comparable GAAP information. 12) Estimated impact of CECL on regulatory capital per final rule issued by U.S. banking agencies - In December 2018, the FRB and other U.S. banking agencies approved a final rule to address the impact of CECL on regulatory capital by allowing BHCs and banks, including Ally, the option to phase in the day-one impact of CECL over a three-year period. In March 2020, the FRB and other U.S. banking agencies issued an interim final rule that became effective on March 31, 2020 and provided an alternative option for banks to temporarily delay the impacts of CECL, relative to the incurred loss methodology for estimating the allowance for loan losses, on regulatory capital. A final rule that was largely unchanged from the March 2020 interim final rule was issued by the FRB and other U.S. banking agencies in August 2020, and became effective in September 2020. For regulatory capital purposes, these rules permitted us to delay recognizing the estimated impact of CECL on regulatory capital until after a two-year deferral period, which for us extends through December 31, 2021. Beginning on January 1, 2022, we will be required to phase in 25% of the previously deferred estimated capital impact of CECL, with an additional 25% to be phased in at the beginning of each subsequent year until fully phased in by the first quarter of 2025. Under these rules, firms that adopt CECL and elect the five-year transition will calculate the estimated impact of CECL on regulatory capital as the day-one impact of adoption plus 25% of the subsequent change in allowance during the two-year deferral period, which according to the final rule approximates the impact of CECL relative to an incurred loss model. We adopted this transition option during the first quarter of 2020, and plan to phase in the regulatory capital impacts of CECL based on this five-year transition period. 3Q 2020 Preliminary Results 31

Supplemental GAAP to Core Results: Adjusted EPS - Quarterly Adjusted Earnings per Share ( Adjusted EPS ) QUARTERLY TREND 3Q 20 2Q 20 1Q 20 4Q 19 3Q 19 2Q 19 1Q 19 4Q 18 3Q 18 2Q 18 1Q 18 4Q 17 3Q 17 Numerator ($ millions) GAAP net income (loss) attributable to common shareholders $ 476 $ 241 $ (319) $ 378 $ 381 $ 582 $ 374 $ 290 $ 374 $ 349 $ 250 $ 181 $ 282 Discontinued operations, net of tax - 1 - 3 - 2 1 (1) - (1) 2 (2) (2) Core OID 9 9 8 8 7 7 7 23 22 21 20 19 18 Repositioning items - 50 - - - - - - - - - - - Change in the fair value of equity securities (13) (90) 185 (29) 11 (2) (70) 95 (6) (8) 40 - - Tax on Core OID, repositioning items, & change in the fair value of equity securities 1 17 (41) 4 (4) (1) 13 (25) (3) (3) (13) (7) (6) (assumes 21% tax rate starting in 1Q18, 35% prior) Significant discrete tax items - - - - - (201) - - - - - 119 - Core net income (loss) attributable to common shareholders [a] $ 473 $ 228 $ (166) $ 364 $ 396 $ 387 $ 325 $ 382 $ 386 $ 358 $ 300 $ 310 $ 292 Denominator Weighted-average common shares outstanding - (Diluted, thousands) [b] 377,011 375,762 375,723 383,391 392,604 399,916 405,959 414,750 424,784 432,554 438,931 444,985 451,078 0 Metric GAAP EPS $ 1.26 $ 0.64 $ (0.85) $ 0.99 $ 0.97 $ 1.46 $ 0.92 $ 0.70 $ 0.88 $ 0.81 $ 0.57 $ 0.41 $ 0.63 Discontinued operations, net of tax - 0 .00 - 0.01 - 0 .01 0.00 ( 0.00) - ( 0.00) 0 .00 (0.00) (0.00) Core OID 0 .02 0.02 0.02 0 .02 0.02 0.02 0 .02 0.06 0.05 0.05 0.05 0.04 0.04 Repositioning items - 0 .13 - - - - - - - - - - - Change in the fair value of equity securities ( 0.04) (0.24) 0.49 (0.08) 0 .03 ( 0.01) (0.17) 0.23 ( 0.01) (0.02) 0 .09 - - Tax on Core OID, repositioning items, & change in the fair value of equity securities 0.00 0.05 ( 0.11) 0.01 (0.01) (0.00) 0 .03 ( 0.06) (0.01) (0.01) ( 0.03) (0.02) ( 0.01) (assumes 21% tax rate starting in 1Q18, 35% prior) Significant discrete tax items - - - - - (0.50) - - - - - 0 .27 - Adjusted EPS [a] / [b] $ 1.25 $ 0.61 $ (0.44) $ 0.95 $ 1.01 $ 0.97 $ 0.80 $ 0.92 $ 0.91 $ 0.83 $ 0.68 $ 0.70 $ 0.65 Adjusted earnings per share (Adjusted EPS) is a non-GAAP financial measure that adjusts GAAP EPS for revenue and expense items that are typically strategic in nature or that management otherwise does not view as reflecting the operating performance of the company. Management believes Adjusted EPS can help the reader better understand the operating performance of the core businesses and their ability to generate earnings. In the numerator of Adjusted EPS, GAAP net income attributable to common shareholders is adjusted for the following items: (1) excludes discontinued operations, net of tax, as Ally is primarily a domestic company and sales of international businesses and other discontinued operations in the past have significantly impacted GAAP EPS, (2) adds back the tax-effected non-cash Core OID, (3) adjusts for tax-effected repositioning and other which are primarily related to the extinguishment of high cost legacy debt, strategic activities and significant other one-time items, (4) excludes equity fair value adjustments (net of tax) related to ASU 2016-01 which requires change in the fair value of equity securities to be recognized in current period net income as compared to periods prior to 1/1/18 in which such adjustments were recognized through other comprehensive income, a component of equity, (5) excludes significant discrete tax items that do not relate to the operating performance of the core businesses, and adjusts for preferred stock capital actions (e.g., Series A and Series G) that have been taken by the company to normalize its capital structure, as applicable for respective periods. 3Q 2020 Preliminary Results 32Supplemental GAAP to Core Results: Adjusted EPS - Quarterly Adjusted Earnings per Share ( Adjusted EPS ) QUARTERLY TREND 3Q 20 2Q 20 1Q 20 4Q 19 3Q 19 2Q 19 1Q 19 4Q 18 3Q 18 2Q 18 1Q 18 4Q 17 3Q 17 Numerator ($ millions) GAAP net income (loss) attributable to common shareholders $ 476 $ 241 $ (319) $ 378 $ 381 $ 582 $ 374 $ 290 $ 374 $ 349 $ 250 $ 181 $ 282 Discontinued operations, net of tax - 1 - 3 - 2 1 (1) - (1) 2 (2) (2) Core OID 9 9 8 8 7 7 7 23 22 21 20 19 18 Repositioning items - 50 - - - - - - - - - - - Change in the fair value of equity securities (13) (90) 185 (29) 11 (2) (70) 95 (6) (8) 40 - - Tax on Core OID, repositioning items, & change in the fair value of equity securities 1 17 (41) 4 (4) (1) 13 (25) (3) (3) (13) (7) (6) (assumes 21% tax rate starting in 1Q18, 35% prior) Significant discrete tax items - - - - - (201) - - - - - 119 - Core net income (loss) attributable to common shareholders [a] $ 473 $ 228 $ (166) $ 364 $ 396 $ 387 $ 325 $ 382 $ 386 $ 358 $ 300 $ 310 $ 292 Denominator Weighted-average common shares outstanding - (Diluted, thousands) [b] 377,011 375,762 375,723 383,391 392,604 399,916 405,959 414,750 424,784 432,554 438,931 444,985 451,078 0 Metric GAAP EPS $ 1.26 $ 0.64 $ (0.85) $ 0.99 $ 0.97 $ 1.46 $ 0.92 $ 0.70 $ 0.88 $ 0.81 $ 0.57 $ 0.41 $ 0.63 Discontinued operations, net of tax - 0 .00 - 0.01 - 0 .01 0.00 ( 0.00) - ( 0.00) 0 .00 (0.00) (0.00) Core OID 0 .02 0.02 0.02 0 .02 0.02 0.02 0 .02 0.06 0.05 0.05 0.05 0.04 0.04 Repositioning items - 0 .13 - - - - - - - - - - - Change in the fair value of equity securities ( 0.04) (0.24) 0.49 (0.08) 0 .03 ( 0.01) (0.17) 0.23 ( 0.01) (0.02) 0 .09 - - Tax on Core OID, repositioning items, & change in the fair value of equity securities 0.00 0.05 ( 0.11) 0.01 (0.01) (0.00) 0 .03 ( 0.06) (0.01) (0.01) ( 0.03) (0.02) ( 0.01) (assumes 21% tax rate starting in 1Q18, 35% prior) Significant discrete tax items - - - - - (0.50) - - - - - 0 .27 - Adjusted EPS [a] / [b] $ 1.25 $ 0.61 $ (0.44) $ 0.95 $ 1.01 $ 0.97 $ 0.80 $ 0.92 $ 0.91 $ 0.83 $ 0.68 $ 0.70 $ 0.65 Adjusted earnings per share (Adjusted EPS) is a non-GAAP financial measure that adjusts GAAP EPS for revenue and expense items that are typically strategic in nature or that management otherwise does not view as reflecting the operating performance of the company. Management believes Adjusted EPS can help the reader better understand the operating performance of the core businesses and their ability to generate earnings. In the numerator of Adjusted EPS, GAAP net income attributable to common shareholders is adjusted for the following items: (1) excludes discontinued operations, net of tax, as Ally is primarily a domestic company and sales of international businesses and other discontinued operations in the past have significantly impacted GAAP EPS, (2) adds back the tax-effected non-cash Core OID, (3) adjusts for tax-effected repositioning and other which are primarily related to the extinguishment of high cost legacy debt, strategic activities and significant other one-time items, (4) excludes equity fair value adjustments (net of tax) related to ASU 2016-01 which requires change in the fair value of equity securities to be recognized in current period net income as compared to periods prior to 1/1/18 in which such adjustments were recognized through other comprehensive income, a component of equity, (5) excludes significant discrete tax items that do not relate to the operating performance of the core businesses, and adjusts for preferred stock capital actions (e.g., Series A and Series G) that have been taken by the company to normalize its capital structure, as applicable for respective periods. 3Q 2020 Preliminary Results 32

Supplemental GAAP to Core Results: Adjusted TBVPS - Quarterly Adjusted Tangible Book Value per Share ( Adjusted TBVPS ) QUARTERLY TREND 3Q 20 2Q 20 1Q 20 4Q 19 3Q 19 2Q 19 1Q 19 4Q 18 3Q 18 2Q 18 1Q 18 4Q 17 3Q 17 Numerator ($ billions) GAAP common shareholder's equity $ 14.1 $ 13.8 $ 13.5 $ 14.4 $ 14.5 $ 14.3 $ 13.7 $ 13.3 $ 13.1 $ 13.1 $ 13.1 $ 13.5 $ 13.6 Goodwill and identifiable intangibles, net of DTLs (0.4) (0.4) (0.4) (0.5) (0.3) (0.3) (0.3) (0.3) (0.3) (0.3) (0.3) (0.3) (0.3) Tangible common equity 13.7 1 3.4 1 3.1 1 4.0 14.2 1 4.0 13.4 13.0 12.8 1 2.8 1 2.8 13.2 1 3.3 Tax-effected Core OID balance (assumes 21% tax rate starting in 4Q17, 35% prior) (0.8) (0.8) (0.8) (0.8) (0.8) (0.9) (0.9) (0.9) (0.9) (0.9) (0.9) (0.9) (0.8) Adjusted tangible book value [a] $ 12.9 $ 12.6 $ 12.2 $ 13.1 $ 13.3 $ 13.2 $ 12.6 $ 12.1 $ 11.9 $ 12.0 $ 11.9 $ 12.3 $ 12.5 Denominator Issued shares outstanding (period-end, thousands) [b] 373,857 373,837 373,155 374,332 383,523 392,775 399,761 404,900 416,591 425,752 432,691 437,054 443,796 Metric GAAP common shareholder's equity per share $ 37.8 $ 37.0 $ 36.2 $ 38.5 $ 37.7 $ 36.4 $ 34.3 $ 32.8 $ 31.4 $ 30.9 $ 30.2 $ 30.9 $ 30.6 Goodwill and identifiable intangibles, net of DTLs per share (1.0) (1.0) (1.2) (1.2) (0.7) (0.7) (0.7) (0.7) (0.7) (0.7) (0.7) (0.7) (0.6) Tangible common equity per share 3 6.7 3 5.9 3 5.0 3 7.3 3 7.0 3 5.7 3 3.6 3 2.1 30.7 30.2 2 9.6 3 0.2 29.9 Tax-effected Core OID balance (assumes 21% tax rate starting in 4Q17, 35% prior) per share (2.2) (2.2) (2.2) (2.2) (2.2) (2.2) (2.1) (2.1) (2.1) (2.1) (2.1) (2.1) (1.8) Adjusted tangible book value per share [a] / [b] $ 34.6 $ 33.7 $ 32.8 $ 35.1 $ 34.7 $ 33.6 $ 31.4 $ 29.9 $ 28.6 $ 28.1 $ 27.4 $ 28.1 $ 28.2 Adjusted tangible book value per share (Adjusted TBVPS) is a non-GAAP financial measure that reflects the book value of equity attributable to shareholders even if Core OID balance were accelerated immediately through the financial statements. As a result, management believes Adjusted TBVPS provides the reader with an assessment of value that is more conservative than GAAP common shareholder’s equity per share. Adjusted TBVPS generally adjusts common equity for: (1) goodwill and identifiable intangibles, net of DTLs, (2) tax-effected Core OID balance to reduce tangible common equity in the event the corresponding discounted bonds are redeemed/tendered, and (3) Series G discount which reduces tangible common equity as the company has normalized its capital structure, as applicable for respective periods. Note: In December 2017, tax-effected Core OID balance was adjusted from a statutory U.S. Federal tax rate of 35% to 21% (“rate”) as a result of changes to U.S. tax law. The adjustment conservatively increased the tax-effected Core OID balance and consequently reduced Adjusted TBVPS as any acceleration of the non-cash charge in future periods would flow through the financial statements at a 21% rate versus a previously modeled 35% rate. Calculated Impact to Adjusted TBVPS from CECL Day-1 1Q 20 Numerator ($ billions) Adjusted tangible book value $ 12.2 CECL Day-1 impact to retained earnings, net of tax 1.0 Adjusted tangible book value less CECL Day-1 impact [a] $ 13.3 Denominator Issued shares outstanding (period-end, thousands) [b] 373,155 Metric Adjusted TBVPS $ 32.8 CECL Day-1 impact to retained earnings, net of tax per share 2.7 Adjusted tangible book value, less CECL Day-1 impact per share [a] / [b] $ 35.5 Ally adopted CECL on January 1, 2020. Upon implementation of CECL Ally recognized a reduction to our opening retained earnings balance of approximately $1.0 billion, net of income tax, which reflects a pre-tax increase to the allowance for loan losses of approximately $1.3 billion. This increase is almost exclusively driven by our consumer automotive loan portfolio. 3Q 2020 Preliminary Results 33Supplemental GAAP to Core Results: Adjusted TBVPS - Quarterly Adjusted Tangible Book Value per Share ( Adjusted TBVPS ) QUARTERLY TREND 3Q 20 2Q 20 1Q 20 4Q 19 3Q 19 2Q 19 1Q 19 4Q 18 3Q 18 2Q 18 1Q 18 4Q 17 3Q 17 Numerator ($ billions) GAAP common shareholder's equity $ 14.1 $ 13.8 $ 13.5 $ 14.4 $ 14.5 $ 14.3 $ 13.7 $ 13.3 $ 13.1 $ 13.1 $ 13.1 $ 13.5 $ 13.6 Goodwill and identifiable intangibles, net of DTLs (0.4) (0.4) (0.4) (0.5) (0.3) (0.3) (0.3) (0.3) (0.3) (0.3) (0.3) (0.3) (0.3) Tangible common equity 13.7 1 3.4 1 3.1 1 4.0 14.2 1 4.0 13.4 13.0 12.8 1 2.8 1 2.8 13.2 1 3.3 Tax-effected Core OID balance (assumes 21% tax rate starting in 4Q17, 35% prior) (0.8) (0.8) (0.8) (0.8) (0.8) (0.9) (0.9) (0.9) (0.9) (0.9) (0.9) (0.9) (0.8) Adjusted tangible book value [a] $ 12.9 $ 12.6 $ 12.2 $ 13.1 $ 13.3 $ 13.2 $ 12.6 $ 12.1 $ 11.9 $ 12.0 $ 11.9 $ 12.3 $ 12.5 Denominator Issued shares outstanding (period-end, thousands) [b] 373,857 373,837 373,155 374,332 383,523 392,775 399,761 404,900 416,591 425,752 432,691 437,054 443,796 Metric GAAP common shareholder's equity per share $ 37.8 $ 37.0 $ 36.2 $ 38.5 $ 37.7 $ 36.4 $ 34.3 $ 32.8 $ 31.4 $ 30.9 $ 30.2 $ 30.9 $ 30.6 Goodwill and identifiable intangibles, net of DTLs per share (1.0) (1.0) (1.2) (1.2) (0.7) (0.7) (0.7) (0.7) (0.7) (0.7) (0.7) (0.7) (0.6) Tangible common equity per share 3 6.7 3 5.9 3 5.0 3 7.3 3 7.0 3 5.7 3 3.6 3 2.1 30.7 30.2 2 9.6 3 0.2 29.9 Tax-effected Core OID balance (assumes 21% tax rate starting in 4Q17, 35% prior) per share (2.2) (2.2) (2.2) (2.2) (2.2) (2.2) (2.1) (2.1) (2.1) (2.1) (2.1) (2.1) (1.8) Adjusted tangible book value per share [a] / [b] $ 34.6 $ 33.7 $ 32.8 $ 35.1 $ 34.7 $ 33.6 $ 31.4 $ 29.9 $ 28.6 $ 28.1 $ 27.4 $ 28.1 $ 28.2 Adjusted tangible book value per share (Adjusted TBVPS) is a non-GAAP financial measure that reflects the book value of equity attributable to shareholders even if Core OID balance were accelerated immediately through the financial statements. As a result, management believes Adjusted TBVPS provides the reader with an assessment of value that is more conservative than GAAP common shareholder’s equity per share. Adjusted TBVPS generally adjusts common equity for: (1) goodwill and identifiable intangibles, net of DTLs, (2) tax-effected Core OID balance to reduce tangible common equity in the event the corresponding discounted bonds are redeemed/tendered, and (3) Series G discount which reduces tangible common equity as the company has normalized its capital structure, as applicable for respective periods. Note: In December 2017, tax-effected Core OID balance was adjusted from a statutory U.S. Federal tax rate of 35% to 21% (“rate”) as a result of changes to U.S. tax law. The adjustment conservatively increased the tax-effected Core OID balance and consequently reduced Adjusted TBVPS as any acceleration of the non-cash charge in future periods would flow through the financial statements at a 21% rate versus a previously modeled 35% rate. Calculated Impact to Adjusted TBVPS from CECL Day-1 1Q 20 Numerator ($ billions) Adjusted tangible book value $ 12.2 CECL Day-1 impact to retained earnings, net of tax 1.0 Adjusted tangible book value less CECL Day-1 impact [a] $ 13.3 Denominator Issued shares outstanding (period-end, thousands) [b] 373,155 Metric Adjusted TBVPS $ 32.8 CECL Day-1 impact to retained earnings, net of tax per share 2.7 Adjusted tangible book value, less CECL Day-1 impact per share [a] / [b] $ 35.5 Ally adopted CECL on January 1, 2020. Upon implementation of CECL Ally recognized a reduction to our opening retained earnings balance of approximately $1.0 billion, net of income tax, which reflects a pre-tax increase to the allowance for loan losses of approximately $1.3 billion. This increase is almost exclusively driven by our consumer automotive loan portfolio. 3Q 2020 Preliminary Results 33

Supplemental GAAP to Core Results: Core ROTCE - Quarterly Core Return on Tangible Common Equity ( Core ROTCE ) QUARTERLY TREND 3Q 20 2Q 20 1Q 20 4Q 19 3Q 19 Numerator ($ millions) GAAP net income (loss) attributable to common shareholders $ 476 $ 241 $ (319) $ 378 $ 381 Discontinued operations, net of tax - 1 - 3 - Core OID 9 9 8 8 7 Repositioning Items - 50 - - - Change in the fair value of equity securities (13) (90) 185 (29) 11 Tax on Core OID & change in the fair value of equity securities (assumes 21% tax rate) 1 17 (41) 4 (4) Significant discrete tax items & other - - - - - Core net income (loss) attributable to common shareholders [a] $ 473 $ 228 $ (166) $ 364 $ 396 Denominator (2-period average, $ billions) GAAP shareholder's equity $ 14.0 $ 13.7 $ 14.0 $ 14.4 $ 14.4 Goodwill & identifiable intangibles, net of deferred tax liabilities ( DTLs ) (0.4) (0.4) (0.4) (0.4) (0.3) Tangible common equity $ 13.6 $ 13.3 $ 13.5 $ 14.1 $ 14.1 Core OID balance (1.0) (1.1) (1.1) (1.1) (1.1) Net deferred tax asset ( DTA ) (0.1) (0.2) (0.1) (0.0) (0.1) Normalized common equity [b] $ 12.4 $ 12.0 $ 12.3 $ 13.0 $ 12.9 Core Return on Tangible Common Equity [a] / [b] 15.2% 7.6% -5.4% 11.2% 12.3% Core return on tangible common equity (Core ROTCE) is a non-GAAP financial measure that management believes is helpful for readers to better understand the ongoing ability of the company to generate returns on its equity base that supports core operations. For purposes of this calculation, tangible common equity is adjusted for Core OID balance and net DTA. Ally’s Core net income attributable to common shareholders for purposes of calculating Core ROTCE is based on the actual effective tax rate for the period adjusted for significant discrete tax items including tax reserve releases, which aligns with the methodology used in calculating adjusted earnings per share. (1) In the numerator of Core ROTCE, GAAP net income attributable to common shareholders is adjusted for discontinued operations net of tax, tax-effected Core OID, tax- effected repositioning and other which are primarily related to the extinguishment of high cost legacy debt, strategic activities and significant other one-time items, fair value adjustments (net of tax) related to ASU 2016-01 which requires change in the fair value of equity securities to be recognized in current period net income as compared to periods prior to 1/1/18 in which such adjustments were recognized through other comprehensive income, a component of equity, significant discrete tax items, and preferred stock capital actions, as applicable for respective periods. (2) In the denominator, GAAP shareholder’s equity is adjusted for goodwill and identifiable intangibles net of DTL, Core OID balance, and net DTA. 3Q 2020 Preliminary Results 34Supplemental GAAP to Core Results: Core ROTCE - Quarterly Core Return on Tangible Common Equity ( Core ROTCE ) QUARTERLY TREND 3Q 20 2Q 20 1Q 20 4Q 19 3Q 19 Numerator ($ millions) GAAP net income (loss) attributable to common shareholders $ 476 $ 241 $ (319) $ 378 $ 381 Discontinued operations, net of tax - 1 - 3 - Core OID 9 9 8 8 7 Repositioning Items - 50 - - - Change in the fair value of equity securities (13) (90) 185 (29) 11 Tax on Core OID & change in the fair value of equity securities (assumes 21% tax rate) 1 17 (41) 4 (4) Significant discrete tax items & other - - - - - Core net income (loss) attributable to common shareholders [a] $ 473 $ 228 $ (166) $ 364 $ 396 Denominator (2-period average, $ billions) GAAP shareholder's equity $ 14.0 $ 13.7 $ 14.0 $ 14.4 $ 14.4 Goodwill & identifiable intangibles, net of deferred tax liabilities ( DTLs ) (0.4) (0.4) (0.4) (0.4) (0.3) Tangible common equity $ 13.6 $ 13.3 $ 13.5 $ 14.1 $ 14.1 Core OID balance (1.0) (1.1) (1.1) (1.1) (1.1) Net deferred tax asset ( DTA ) (0.1) (0.2) (0.1) (0.0) (0.1) Normalized common equity [b] $ 12.4 $ 12.0 $ 12.3 $ 13.0 $ 12.9 Core Return on Tangible Common Equity [a] / [b] 15.2% 7.6% -5.4% 11.2% 12.3% Core return on tangible common equity (Core ROTCE) is a non-GAAP financial measure that management believes is helpful for readers to better understand the ongoing ability of the company to generate returns on its equity base that supports core operations. For purposes of this calculation, tangible common equity is adjusted for Core OID balance and net DTA. Ally’s Core net income attributable to common shareholders for purposes of calculating Core ROTCE is based on the actual effective tax rate for the period adjusted for significant discrete tax items including tax reserve releases, which aligns with the methodology used in calculating adjusted earnings per share. (1) In the numerator of Core ROTCE, GAAP net income attributable to common shareholders is adjusted for discontinued operations net of tax, tax-effected Core OID, tax- effected repositioning and other which are primarily related to the extinguishment of high cost legacy debt, strategic activities and significant other one-time items, fair value adjustments (net of tax) related to ASU 2016-01 which requires change in the fair value of equity securities to be recognized in current period net income as compared to periods prior to 1/1/18 in which such adjustments were recognized through other comprehensive income, a component of equity, significant discrete tax items, and preferred stock capital actions, as applicable for respective periods. (2) In the denominator, GAAP shareholder’s equity is adjusted for goodwill and identifiable intangibles net of DTL, Core OID balance, and net DTA. 3Q 2020 Preliminary Results 34
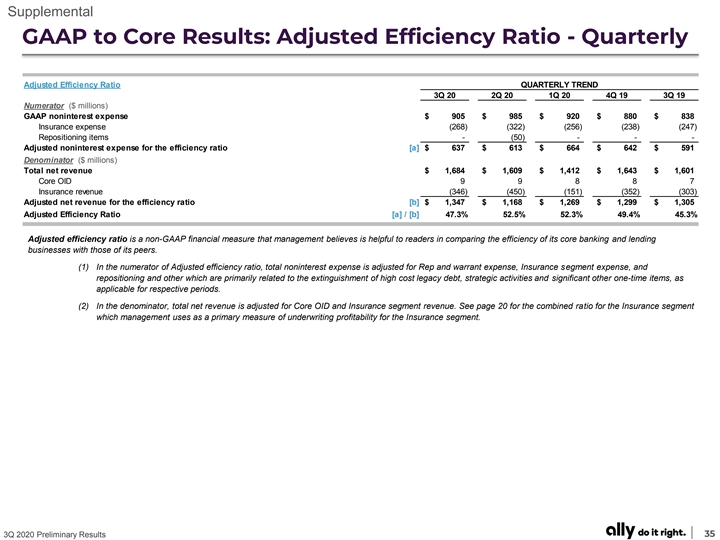
Supplemental GAAP to Core Results: Adjusted Efficiency Ratio - Quarterly Adjusted Efficiency Ratio QUARTERLY TREND 3Q 20 2Q 20 1Q 20 4Q 19 3Q 19 Numerator ($ millions) GAAP noninterest expense $ 905 $ 985 $ 920 $ 880 $ 838 Insurance expense ( 268) (322) ( 256) ( 238) (247) Repositioning items - (50) - - - Adjusted noninterest expense for the efficiency ratio [a] $ 637 $ 613 $ 664 $ 642 $ 591 Denominator ($ millions) Total net revenue $ 1,684 $ 1,609 $ 1,412 $ 1,643 $ 1,601 Core OID 9 9 8 8 7 Insurance revenue ( 346) ( 450) ( 151) (352) (303) Adjusted net revenue for the efficiency ratio [b] $ 1,347 $ 1,168 $ 1,269 $ 1,299 $ 1,305 Adjusted Efficiency Ratio [a] / [b] 47.3% 52.5% 52.3% 49.4% 45.3% Adjusted efficiency ratio is a non-GAAP financial measure that management believes is helpful to readers in comparing the efficiency of its core banking and lending businesses with those of its peers. (1) In the numerator of Adjusted efficiency ratio, total noninterest expense is adjusted for Rep and warrant expense, Insurance segment expense, and repositioning and other which are primarily related to the extinguishment of high cost legacy debt, strategic activities and significant other one-time items, as applicable for respective periods. (2) In the denominator, total net revenue is adjusted for Core OID and Insurance segment revenue. See page 20 for the combined ratio for the Insurance segment which management uses as a primary measure of underwriting profitability for the Insurance segment. 3Q 2020 Preliminary Results 35Supplemental GAAP to Core Results: Adjusted Efficiency Ratio - Quarterly Adjusted Efficiency Ratio QUARTERLY TREND 3Q 20 2Q 20 1Q 20 4Q 19 3Q 19 Numerator ($ millions) GAAP noninterest expense $ 905 $ 985 $ 920 $ 880 $ 838 Insurance expense ( 268) (322) ( 256) ( 238) (247) Repositioning items - (50) - - - Adjusted noninterest expense for the efficiency ratio [a] $ 637 $ 613 $ 664 $ 642 $ 591 Denominator ($ millions) Total net revenue $ 1,684 $ 1,609 $ 1,412 $ 1,643 $ 1,601 Core OID 9 9 8 8 7 Insurance revenue ( 346) ( 450) ( 151) (352) (303) Adjusted net revenue for the efficiency ratio [b] $ 1,347 $ 1,168 $ 1,269 $ 1,299 $ 1,305 Adjusted Efficiency Ratio [a] / [b] 47.3% 52.5% 52.3% 49.4% 45.3% Adjusted efficiency ratio is a non-GAAP financial measure that management believes is helpful to readers in comparing the efficiency of its core banking and lending businesses with those of its peers. (1) In the numerator of Adjusted efficiency ratio, total noninterest expense is adjusted for Rep and warrant expense, Insurance segment expense, and repositioning and other which are primarily related to the extinguishment of high cost legacy debt, strategic activities and significant other one-time items, as applicable for respective periods. (2) In the denominator, total net revenue is adjusted for Core OID and Insurance segment revenue. See page 20 for the combined ratio for the Insurance segment which management uses as a primary measure of underwriting profitability for the Insurance segment. 3Q 2020 Preliminary Results 35
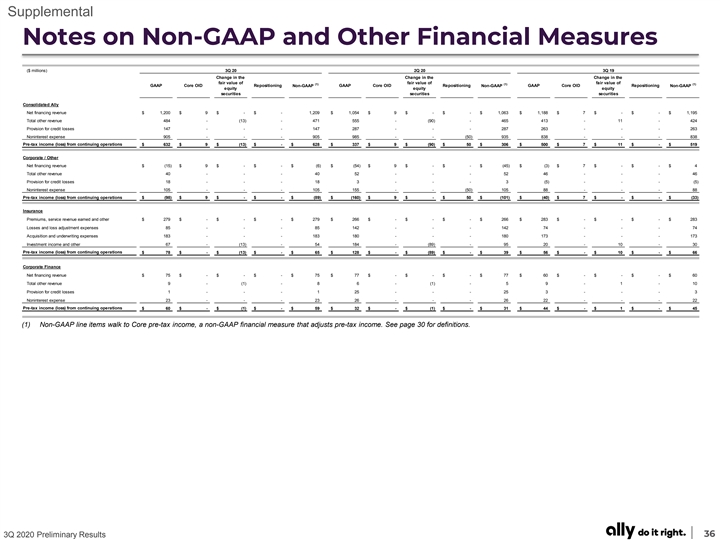
Supplemental Notes on Non-GAAP and Other Financial Measures ($ millions) 3Q 20 2Q 20 3Q 19 Change in the Change in the Change in the fair value of fair value of fair value of (1) (1) (1) GAAP Core OID Repositioning Non-GAAP GAAP Core OID Repositioning Non-GAAP GAAP Core OID Repositioning Non-GAAP equity equity equity securities securities securities Consolidated Ally Net financing revenue $ 1,200 $ 9 $ - $ - 1,209 $ 1,054 $ 9 $ - $ - $ 1,063 $ 1,188 $ 7 $ - $ - $ 1,195 Total other revenue 484 - ( 13) - 471 555 - (90) - 465 413 - 11 - 424 Provision for credit losses 147 - - - 147 287 - - - 287 263 - - - 263 Noninterest expense 905 - - - 905 985 - - (50) 935 838 - - - 838 Pre-tax income (loss) from continuing operations $ 632 $ 9 $ (13) $ - $ 628 $ 337 $ 9 $ (90) $ 50 $ 306 $ 500 $ 7 $ 11 $ - $ 519 Corporate / Other Net financing revenue $ (15) $ 9 $ - $ - $ (6) $ (54) $ 9 $ - $ - $ (45) $ (3) $ 7 $ - $ - $ 4 Total other revenue 40 - - - 40 52 - - - 52 46 - - - 46 Provision for credit losses 18 - - - 18 3 - - - 3 (5) - - - (5) Noninterest expense 105 - - - 105 155 - - (50) 105 88 - - - 88 Pre-tax income (loss) from continuing operations $ (98) $ 9 $ - $ - $ (89) $ ( 160) $ 9 $ - $ 50 $ ( 101) $ (40) $ 7 $ - $ - $ (33) Insurance Premiums, service revenue earned and other $ 279 $ - $ - $ - $ 279 $ 266 $ - $ - $ - $ 266 $ 283 $ - $ - $ - $ 283 Losses and loss adjustment expenses 85 - - - 85 142 - - - 142 74 - - - 74 Acquisition and underwriting expenses 183 - - - 183 180 - - - 180 173 - - - 173 Investment income and other 67 - (13) - 54 184 - (89) - 95 20 - 10 - 30 Pre-tax income (loss) from continuing operations $ 78 $ - $ (13) $ - $ 65 $ 128 $ - $ (89) $ - $ 39 $ 56 $ - $ 10 $ - $ 66 Corporate Finance Net financing revenue $ 75 $ - $ - $ - $ 75 $ 77 $ - $ - $ - $ 77 $ 60 $ - $ - $ - $ 60 Total other revenue 9 - (1) - 8 6 - ( 1) - 5 9 - 1 - 10 Provision for credit losses 1 - - - 1 25 - - - 25 3 - - - 3 Noninterest expense 23 - - - 23 26 - - - 26 22 - - - 22 Pre-tax income (loss) from continuing operations $ 60 $ - $ (1) $ - $ 59 $ 32 $ - $ (1) $ - $ 31 $ 44 $ - $ 1 $ - $ 45 (1) Non-GAAP line items walk to Core pre-tax income, a non-GAAP financial measure that adjusts pre-tax income. See page 30 for definitions. 3Q 2020 Preliminary Results 36Supplemental Notes on Non-GAAP and Other Financial Measures ($ millions) 3Q 20 2Q 20 3Q 19 Change in the Change in the Change in the fair value of fair value of fair value of (1) (1) (1) GAAP Core OID Repositioning Non-GAAP GAAP Core OID Repositioning Non-GAAP GAAP Core OID Repositioning Non-GAAP equity equity equity securities securities securities Consolidated Ally Net financing revenue $ 1,200 $ 9 $ - $ - 1,209 $ 1,054 $ 9 $ - $ - $ 1,063 $ 1,188 $ 7 $ - $ - $ 1,195 Total other revenue 484 - ( 13) - 471 555 - (90) - 465 413 - 11 - 424 Provision for credit losses 147 - - - 147 287 - - - 287 263 - - - 263 Noninterest expense 905 - - - 905 985 - - (50) 935 838 - - - 838 Pre-tax income (loss) from continuing operations $ 632 $ 9 $ (13) $ - $ 628 $ 337 $ 9 $ (90) $ 50 $ 306 $ 500 $ 7 $ 11 $ - $ 519 Corporate / Other Net financing revenue $ (15) $ 9 $ - $ - $ (6) $ (54) $ 9 $ - $ - $ (45) $ (3) $ 7 $ - $ - $ 4 Total other revenue 40 - - - 40 52 - - - 52 46 - - - 46 Provision for credit losses 18 - - - 18 3 - - - 3 (5) - - - (5) Noninterest expense 105 - - - 105 155 - - (50) 105 88 - - - 88 Pre-tax income (loss) from continuing operations $ (98) $ 9 $ - $ - $ (89) $ ( 160) $ 9 $ - $ 50 $ ( 101) $ (40) $ 7 $ - $ - $ (33) Insurance Premiums, service revenue earned and other $ 279 $ - $ - $ - $ 279 $ 266 $ - $ - $ - $ 266 $ 283 $ - $ - $ - $ 283 Losses and loss adjustment expenses 85 - - - 85 142 - - - 142 74 - - - 74 Acquisition and underwriting expenses 183 - - - 183 180 - - - 180 173 - - - 173 Investment income and other 67 - (13) - 54 184 - (89) - 95 20 - 10 - 30 Pre-tax income (loss) from continuing operations $ 78 $ - $ (13) $ - $ 65 $ 128 $ - $ (89) $ - $ 39 $ 56 $ - $ 10 $ - $ 66 Corporate Finance Net financing revenue $ 75 $ - $ - $ - $ 75 $ 77 $ - $ - $ - $ 77 $ 60 $ - $ - $ - $ 60 Total other revenue 9 - (1) - 8 6 - ( 1) - 5 9 - 1 - 10 Provision for credit losses 1 - - - 1 25 - - - 25 3 - - - 3 Noninterest expense 23 - - - 23 26 - - - 26 22 - - - 22 Pre-tax income (loss) from continuing operations $ 60 $ - $ (1) $ - $ 59 $ 32 $ - $ (1) $ - $ 31 $ 44 $ - $ 1 $ - $ 45 (1) Non-GAAP line items walk to Core pre-tax income, a non-GAAP financial measure that adjusts pre-tax income. See page 30 for definitions. 3Q 2020 Preliminary Results 36

Supplemental Notes on Non-GAAP and Other Financial Measures Net Financing Revenue (ex. Core OID) QUARTERLY TREND ($ millions) 3Q 20 2Q 20 1Q 20 4Q 19 3Q 19 2Q 19 1Q 19 4Q 18 3Q 18 2Q 18 1Q 18 4Q 17 3Q 17 GAAP Net Financing Revenue $ 1 ,200 $ 1 ,054 $ 1,146 $ 1,156 $ 1 ,188 $ 1 ,157 $ 1,132 $ 1 ,140 $ 1,107 $ 1 ,094 $ 1 ,049 $ 1,094 $ 1,081 Core OID 9 9 8 8 7 7 7 23 22 21 20 19 18 Net Financing Revenue (ex. Core OID) [a] $ 1 ,209 $ 1 ,063 $ 1,154 $ 1,164 $ 1 ,195 $ 1 ,164 $ 1,139 $ 1,163 $ 1 ,129 $ 1 ,115 $ 1 ,069 $ 1,113 $ 1 ,099 Adjusted Other Revenue QUARTERLY TREND ($ millions) 3Q 20 2Q 20 1Q 20 4Q 19 3Q 19 2Q 19 1Q 19 4Q 18 3Q 18 2Q 18 1Q 18 4Q 17 3Q 17 GAAP Other Revenue $ 484 $ 555 $ 266 $ 487 $ 413 $ 395 $ 466 $ 298 $ 398 $ 364 $ 354 $ 379 $ 381 Accelerated OID & repositioning items - - - - - - - - - - - - - Change in the fair value of equity securities (13) (90) 185 (29) 11 (2) (70) 95 (6) (8) 40 - - Adjusted Other Revenue [b] $ 471 $ 465 $ 451 $ 458 $ 424 $ 393 $ 396 $ 393 $ 392 $ 356 $ 394 $ 379 $ 381 Adjusted Total Net Revenue ($ millions) Adjusted Total Net Revenue [a]+[b] $ 1,680 $ 1,528 $ 1,606 $ 1,622 $ 1,620 $ 1 ,557 $ 1,535 $ 1,556 $ 1 ,521 $ 1,471 $ 1,463 $ 1 ,492 $ 1,480 Adjusted NIE (ex. Impairment) QUARTERLY TREND ($ millions) 3Q 20 2Q 20 1Q 20 4Q 19 3Q 19 2Q 19 1Q 19 4Q 18 3Q 18 2Q 18 1Q 18 4Q 17 3Q 17 GAAP Noninterest Expense $ 905 $ 985 $ 920 $ 880 $ 838 $ 881 $ 830 $ 804 $ 807 $ 839 $ 814 $ 769 $ 753 Impairment - (50) - - - - - - - - - - - Adjusted NIE (ex. Impairment) [c] $ 905 $ 935 $ 920 $ 880 $ 838 $ 881 $ 830 $ 804 $ 807 $ 839 $ 814 $ 769 $ 753 Original issue discount amortization expense QUARTERLY TREND ($ millions) 3Q 20 2Q 20 1Q 20 4Q 19 3Q 19 2Q 19 1Q 19 4Q 18 3Q 18 2Q 18 1Q 18 4Q 17 3Q 17 (1) Core original issue discount (Core OID) amortization expense $ 9 $ 9 $ 8 $ 8 $ 7 $ 7 $ 7 $ 23 $ 22 $ 21 $ 20 $ 19 $ 18 Other OID 3 4 3 3 3 3 3 2 4 4 4 5 5 GAAP original issue discount amortization expense $ 12 $ 12 $ 11 $ 11 $ 11 $ 10 $ 10 $ 26 $ 25 $ 25 $ 24 $ 24 $ 23 Outstanding original issue discount balance QUARTERLY TREND ($ millions) 3Q 20 2Q 20 1Q 20 4Q 19 3Q 19 2Q 19 4Q 18 3Q 18 2Q 18 1Q 18 4Q 17 3Q 17 2Q 17 Core outstanding original issue discount balance (Core OID balance) $ (1,037) $ ( 1,046) $ ( 1,055) $ ( 1,063) $ ( 1,071) $ ( 1,078) $ (1,085) $ (1,092) $ (1,115) $ (1,137) $ (1,158) $ (1,178) $ (1,197) Other outstanding OID balance (48) (46) (34) (37) (40) (44) (39) (43) (46) (49) (53) (57) (62) GAAP outstanding original issue discount balance $ (1,084) $ (1,092) $ ( 1,089) $ (1,100) $ ( 1,111) $ (1,122) $ ( 1,125) $ ( 1,135) $ (1,161) $ ( 1,187) $ (1,211) $ (1,235) $ ( 1,259) (1) Excludes accelerated OID. See page 30 for definitions. Note: Equity fair value adjustments related to ASU 2016-01 requires change in the fair value of equity securities to be recognized in current period net income as compared to periods prior to 1/1/18 in which such adjustments were recognized through other comprehensive income, a component of equity. Repositioning and other which are primarily related to the extinguishment of high cost legacy debt, strategic activities and significant other one-time items. See page 30 for definitions. 3Q 2020 Preliminary Results 37Supplemental Notes on Non-GAAP and Other Financial Measures Net Financing Revenue (ex. Core OID) QUARTERLY TREND ($ millions) 3Q 20 2Q 20 1Q 20 4Q 19 3Q 19 2Q 19 1Q 19 4Q 18 3Q 18 2Q 18 1Q 18 4Q 17 3Q 17 GAAP Net Financing Revenue $ 1 ,200 $ 1 ,054 $ 1,146 $ 1,156 $ 1 ,188 $ 1 ,157 $ 1,132 $ 1 ,140 $ 1,107 $ 1 ,094 $ 1 ,049 $ 1,094 $ 1,081 Core OID 9 9 8 8 7 7 7 23 22 21 20 19 18 Net Financing Revenue (ex. Core OID) [a] $ 1 ,209 $ 1 ,063 $ 1,154 $ 1,164 $ 1 ,195 $ 1 ,164 $ 1,139 $ 1,163 $ 1 ,129 $ 1 ,115 $ 1 ,069 $ 1,113 $ 1 ,099 Adjusted Other Revenue QUARTERLY TREND ($ millions) 3Q 20 2Q 20 1Q 20 4Q 19 3Q 19 2Q 19 1Q 19 4Q 18 3Q 18 2Q 18 1Q 18 4Q 17 3Q 17 GAAP Other Revenue $ 484 $ 555 $ 266 $ 487 $ 413 $ 395 $ 466 $ 298 $ 398 $ 364 $ 354 $ 379 $ 381 Accelerated OID & repositioning items - - - - - - - - - - - - - Change in the fair value of equity securities (13) (90) 185 (29) 11 (2) (70) 95 (6) (8) 40 - - Adjusted Other Revenue [b] $ 471 $ 465 $ 451 $ 458 $ 424 $ 393 $ 396 $ 393 $ 392 $ 356 $ 394 $ 379 $ 381 Adjusted Total Net Revenue ($ millions) Adjusted Total Net Revenue [a]+[b] $ 1,680 $ 1,528 $ 1,606 $ 1,622 $ 1,620 $ 1 ,557 $ 1,535 $ 1,556 $ 1 ,521 $ 1,471 $ 1,463 $ 1 ,492 $ 1,480 Adjusted NIE (ex. Impairment) QUARTERLY TREND ($ millions) 3Q 20 2Q 20 1Q 20 4Q 19 3Q 19 2Q 19 1Q 19 4Q 18 3Q 18 2Q 18 1Q 18 4Q 17 3Q 17 GAAP Noninterest Expense $ 905 $ 985 $ 920 $ 880 $ 838 $ 881 $ 830 $ 804 $ 807 $ 839 $ 814 $ 769 $ 753 Impairment - (50) - - - - - - - - - - - Adjusted NIE (ex. Impairment) [c] $ 905 $ 935 $ 920 $ 880 $ 838 $ 881 $ 830 $ 804 $ 807 $ 839 $ 814 $ 769 $ 753 Original issue discount amortization expense QUARTERLY TREND ($ millions) 3Q 20 2Q 20 1Q 20 4Q 19 3Q 19 2Q 19 1Q 19 4Q 18 3Q 18 2Q 18 1Q 18 4Q 17 3Q 17 (1) Core original issue discount (Core OID) amortization expense $ 9 $ 9 $ 8 $ 8 $ 7 $ 7 $ 7 $ 23 $ 22 $ 21 $ 20 $ 19 $ 18 Other OID 3 4 3 3 3 3 3 2 4 4 4 5 5 GAAP original issue discount amortization expense $ 12 $ 12 $ 11 $ 11 $ 11 $ 10 $ 10 $ 26 $ 25 $ 25 $ 24 $ 24 $ 23 Outstanding original issue discount balance QUARTERLY TREND ($ millions) 3Q 20 2Q 20 1Q 20 4Q 19 3Q 19 2Q 19 4Q 18 3Q 18 2Q 18 1Q 18 4Q 17 3Q 17 2Q 17 Core outstanding original issue discount balance (Core OID balance) $ (1,037) $ ( 1,046) $ ( 1,055) $ ( 1,063) $ ( 1,071) $ ( 1,078) $ (1,085) $ (1,092) $ (1,115) $ (1,137) $ (1,158) $ (1,178) $ (1,197) Other outstanding OID balance (48) (46) (34) (37) (40) (44) (39) (43) (46) (49) (53) (57) (62) GAAP outstanding original issue discount balance $ (1,084) $ (1,092) $ ( 1,089) $ (1,100) $ ( 1,111) $ (1,122) $ ( 1,125) $ ( 1,135) $ (1,161) $ ( 1,187) $ (1,211) $ (1,235) $ ( 1,259) (1) Excludes accelerated OID. See page 30 for definitions. Note: Equity fair value adjustments related to ASU 2016-01 requires change in the fair value of equity securities to be recognized in current period net income as compared to periods prior to 1/1/18 in which such adjustments were recognized through other comprehensive income, a component of equity. Repositioning and other which are primarily related to the extinguishment of high cost legacy debt, strategic activities and significant other one-time items. See page 30 for definitions. 3Q 2020 Preliminary Results 37