
4Q 2021 Exhibit Preliminary 99.2 Results Ally Financial Inc. 4Q 2021 Earnings Review January 21, 2022 Contact Ally Investor Relations at (866) 710-4623 or investor.relations@ally.com 1

4Q 2021 Preliminary Results Forward-Looking Statements and Additional Information This presentation and related communications should be read in conjunction with the financial statements, notes, and other information contained in our Annual Reports on Form 10-K, Quarterly Reports on Form 10-Q, and Current Reports on Form 8-K. This information is preliminary and based on company and third-party data available at the time of the presentation or related communication. This presentation and related communications contain forward-looking statements within the meaning of the Private Securities Litigation Reform Act of 1995. These statements can be identified by the fact that they do not relate strictly to historical or current facts—such as statements about future effects of COVID-19 and our ability to navigate them, the outlook for financial and operating metrics and performance, and future capital allocation and actions. Forward-looking statements often use words such as “believe,” “expect,” “anticipate,” “intend,” “pursue,” “seek,” “continue,” “estimate,” “project,” “outlook,” “forecast,” “potential,” “target,” “objective,” “trend,” “plan,” “goal,” “initiative,” “priorities,” or other words of comparable meaning or future-tense or conditional verbs such as “may,” “will,” “should,” “would,” or “could.” Forward-looking statements convey our expectations, intentions, or forecasts about future events, circumstances, or results. All forward-looking statements, by their nature, are subject to assumptions, risks, and uncertainties, which may change over time and many of which are beyond our control. You should not rely on any forward-looking statement as a prediction or guarantee about the future. Actual future objectives, strategies, plans, prospects, performance, conditions, or results may differ materially from those set forth in any forward-looking statement. Some of the factors that may cause actual results or other future events or circumstances to differ from those in forward-looking statements are described in our Annual Report on Form 10-K for the year ended December 31, 2020, our subsequent Quarterly Reports on Form 10-Q or Current Reports on Form 8-K, or other applicable documents that are filed or furnished with the U.S. Securities and Exchange Commission (collectively, our “SEC filings”). Any forward-looking statement made by us or on our behalf speaks only as of the date that it was made. We do not undertake to update any forward-looking statement to reflect the impact of events, circumstances, or results that arise after the date that the statement was made, except as required by applicable securities laws. You, however, should consult further disclosures (including disclosures of a forward-looking nature) that we may make in any subsequent SEC filings. This presentation and related communications contain specifically identified non-GAAP financial measures, which supplement the results that are reported according to U.S. generally accepted accounting principles (“GAAP”). These non-GAAP financial measures may be useful to investors but should not be viewed in isolation from, or as a substitute for, GAAP results. Differences between non-GAAP financial measures and comparable GAAP financial measures are reconciled in the presentation. Unless the context otherwise requires, the following definitions apply. The term “loans” means the following consumer and commercial products associated with our direct and indirect financing activities: loans, retail installment sales contracts, lines of credit, and other financing products excluding operating leases. The term “operating leases” means consumer- and commercial-vehicle lease agreements where Ally is the lessor and the lessee is generally not obligated to acquire ownership of the vehicle at lease-end or compensate Ally for the vehicle’s residual value. The terms “lend,” “finance,” and “originate” mean our direct extension or origination of loans, our purchase or acquisition of loans, or our purchase of operating leases, as applicable. The term “consumer” means all consumer products associated with our loan and operating-lease activities and all commercial retail installment sales contracts. The term “commercial” means all commercial products associated with our loan activities, other than commercial retail installment sales contracts. The term “partnerships” means business arrangements rather than partnerships as defined by law. 2
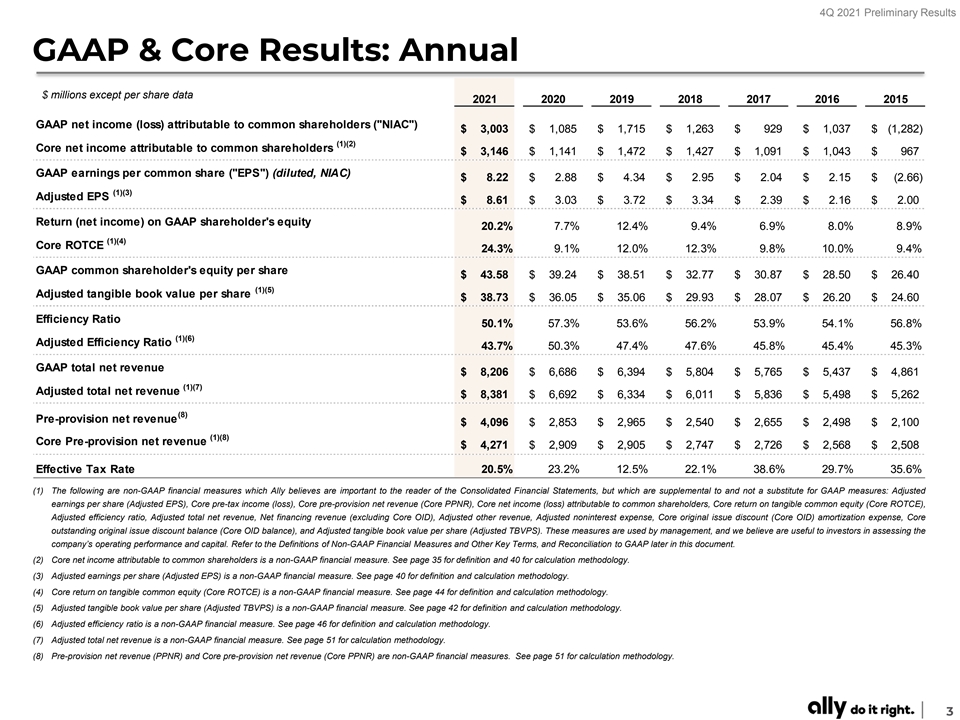
4Q 2021 Preliminary Results GAAP & Core Results: Annual $ millions except per share data 2021 2020 2019 2018 2017 2016 2015 GAAP net income (loss) attributable to common shareholders ( NIAC ) $ 3,003 $ 1,085 $ 1,715 $ 1,263 $ 929 $ 1 ,037 $ (1,282) (1)(2) Core net income attributable to common shareholders $ 3,146 $ 1 ,141 $ 1 ,472 $ 1 ,427 $ 1 ,091 $ 1,043 $ 967 GAAP earnings per common share ( EPS ) (diluted, NIAC) $ 8.22 $ 2.88 $ 4.34 $ 2.95 $ 2.04 $ 2.15 $ (2.66) (1)(3) Adjusted EPS $ 8.61 $ 3.03 $ 3.72 $ 3.34 $ 2.39 $ 2.16 $ 2.00 Return (net income) on GAAP shareholder's equity 20.2% 7.7% 12.4% 9.4% 6.9% 8.0% 8.9% (1)(4) Core ROTCE 24.3% 9.1% 12.0% 12.3% 9.8% 10.0% 9.4% GAAP common shareholder's equity per share $ 43.58 $ 39.24 $ 38.51 $ 32.77 $ 3 0.87 $ 2 8.50 $ 2 6.40 (1)(5) Adjusted tangible book value per share $ 3 8.73 $ 36.05 $ 3 5.06 $ 2 9.93 $ 2 8.07 $ 26.20 $ 2 4.60 Efficiency Ratio 50.1% 57.3% 53.6% 56.2% 53.9% 54.1% 56.8% (1)(6) Adjusted Efficiency Ratio 43.7% 50.3% 47.4% 47.6% 45.8% 45.4% 45.3% GAAP total net revenue $ 8 ,206 $ 6 ,686 $ 6,394 $ 5 ,804 $ 5,765 $ 5 ,437 $ 4 ,861 (1)(7) Adjusted total net revenue $ 8,381 $ 6,692 $ 6 ,334 $ 6 ,011 $ 5 ,836 $ 5 ,498 $ 5 ,262 (8) Pre-provision net revenue $ 4 ,096 $ 2,853 $ 2 ,965 $ 2 ,540 $ 2 ,655 $ 2 ,498 $ 2 ,100 (1)(8) Core Pre-provision net revenue $ 4 ,271 $ 2 ,909 $ 2,905 $ 2,747 $ 2 ,726 $ 2 ,568 $ 2,508 Effective Tax Rate 20.5% 23.2% 12.5% 22.1% 38.6% 29.7% 35.6% (1) The following are non-GAAP financial measures which Ally believes are important to the reader of the Consolidated Financial Statements, but which are supplemental to and not a substitute for GAAP measures: Adjusted earnings per share (Adjusted EPS), Core pre-tax income (loss), Core pre-provision net revenue (Core PPNR), Core net income (loss) attributable to common shareholders, Core return on tangible common equity (Core ROTCE), Adjusted efficiency ratio, Adjusted total net revenue, Net financing revenue (excluding Core OID), Adjusted other revenue, Adjusted noninterest expense, Core original issue discount (Core OID) amortization expense, Core outstanding original issue discount balance (Core OID balance), and Adjusted tangible book value per share (Adjusted TBVPS). These measures are used by management, and we believe are useful to investors in assessing the company’s operating performance and capital. Refer to the Definitions of Non-GAAP Financial Measures and Other Key Terms, and Reconciliation to GAAP later in this document. (2) Core net income attributable to common shareholders is a non-GAAP financial measure. See page 35 for definition and 40 for calculation methodology. (3) Adjusted earnings per share (Adjusted EPS) is a non-GAAP financial measure. See page 40 for definition and calculation methodology. (4) Core return on tangible common equity (Core ROTCE) is a non-GAAP financial measure. See page 44 for definition and calculation methodology. (5) Adjusted tangible book value per share (Adjusted TBVPS) is a non-GAAP financial measure. See page 42 for definition and calculation methodology. (6) Adjusted efficiency ratio is a non-GAAP financial measure. See page 46 for definition and calculation methodology. (7) Adjusted total net revenue is a non-GAAP financial measure. See page 51 for calculation methodology. (8) Pre-provision net revenue (PPNR) and Core pre-provision net revenue (Core PPNR) are non-GAAP financial measures. See page 51 for calculation methodology. 3
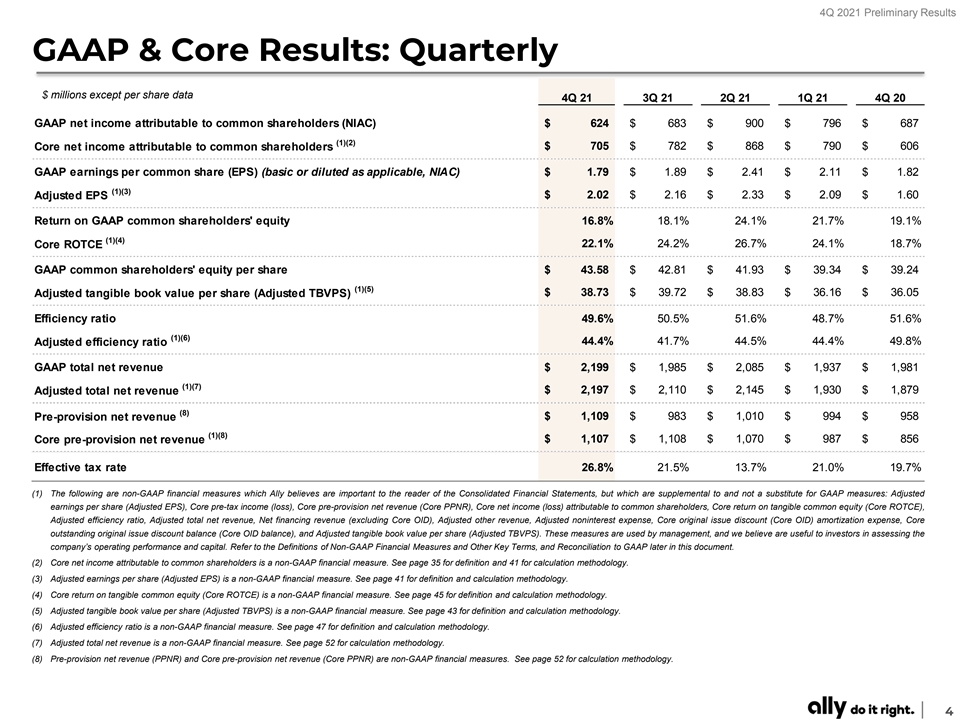
4Q 2021 Preliminary Results GAAP & Core Results: Quarterly $ millions except per share data 4Q 21 3Q 21 2Q 21 1Q 21 4Q 20 GAAP net income attributable to common shareholders (NIAC) $ 624 $ 683 $ 900 $ 796 $ 687 (1)(2) Core net income attributable to common shareholders $ 705 $ 782 $ 868 $ 790 $ 606 GAAP earnings per common share (EPS) (basic or diluted as applicable, NIAC) $ 1.79 $ 1.89 $ 2.41 $ 2.11 $ 1.82 (1)(3) $ 2.02 $ 2.16 $ 2.33 $ 2.09 $ 1.60 Adjusted EPS Return on GAAP common shareholders' equity 16.8% 18.1% 24.1% 21.7% 19.1% (1)(4) Core ROTCE 22.1% 24.2% 26.7% 24.1% 18.7% GAAP common shareholders' equity per share $ 43.58 $ 42.81 $ 41.93 $ 39.34 $ 39.24 (1)(5) $ 38.73 $ 39.72 $ 38.83 $ 36.16 $ 36.05 Adjusted tangible book value per share (Adjusted TBVPS) Efficiency ratio 49.6% 50.5% 51.6% 48.7% 51.6% (1)(6) 44.4% 41.7% 44.5% 44.4% 49.8% Adjusted efficiency ratio GAAP total net revenue $ 2,199 $ 1,985 $ 2,085 $ 1,937 $ 1,981 (1)(7) $ 2,197 $ 2,110 $ 2,145 $ 1,930 $ 1,879 Adjusted total net revenue (8) $ 1,109 $ 983 $ 1,010 $ 994 $ 958 Pre-provision net revenue (1)(8) $ 1,107 $ 1,108 $ 1,070 $ 987 $ 856 Core pre-provision net revenue Effective tax rate 26.8% 21.5% 13.7% 21.0% 19.7% (1) The following are non-GAAP financial measures which Ally believes are important to the reader of the Consolidated Financial Statements, but which are supplemental to and not a substitute for GAAP measures: Adjusted earnings per share (Adjusted EPS), Core pre-tax income (loss), Core pre-provision net revenue (Core PPNR), Core net income (loss) attributable to common shareholders, Core return on tangible common equity (Core ROTCE), Adjusted efficiency ratio, Adjusted total net revenue, Net financing revenue (excluding Core OID), Adjusted other revenue, Adjusted noninterest expense, Core original issue discount (Core OID) amortization expense, Core outstanding original issue discount balance (Core OID balance), and Adjusted tangible book value per share (Adjusted TBVPS). These measures are used by management, and we believe are useful to investors in assessing the company’s operating performance and capital. Refer to the Definitions of Non-GAAP Financial Measures and Other Key Terms, and Reconciliation to GAAP later in this document. (2) Core net income attributable to common shareholders is a non-GAAP financial measure. See page 35 for definition and 41 for calculation methodology. (3) Adjusted earnings per share (Adjusted EPS) is a non-GAAP financial measure. See page 41 for definition and calculation methodology. (4) Core return on tangible common equity (Core ROTCE) is a non-GAAP financial measure. See page 45 for definition and calculation methodology. (5) Adjusted tangible book value per share (Adjusted TBVPS) is a non-GAAP financial measure. See page 43 for definition and calculation methodology. (6) Adjusted efficiency ratio is a non-GAAP financial measure. See page 47 for definition and calculation methodology. (7) Adjusted total net revenue is a non-GAAP financial measure. See page 52 for calculation methodology. (8) Pre-provision net revenue (PPNR) and Core pre-provision net revenue (Core PPNR) are non-GAAP financial measures. See page 52 for calculation methodology. 4

4Q 2021 Preliminary Results 2021 Full-Year Highlights Focused Execution Leading, Growing Businesses $ % $ % 8.61 24.3 8.4B 10.3 Adjusted Core Adjusted Total CET1 (1) (1) (1) ROTCE EPS Net Revenue Capital Ratio • Record-setting results demonstrate growth and momentum across Ally’s leading Auto, Insurance, and Digital Bank platforms • Closed acquisition of Fair Square Financial in December 2021, integration efforts fully underway and ahead of schedule Auto & Insurance th • 12 year of dealer network expansion to 21.1k; Consumer originations of $46.3B, sourced from record 13 million apps (2) • Retail auto originated yield of 7.1%, 31bps full-year net charge-offs, reflecting exceptional credit performance th • Insurance written premiums of $1.2B sourced from 4.5k dealer network, 4 consecutive year above $1.0B Ally Bank th • 13 consecutive year of expansion 2.5 million retail depositors, ↑10% YoY $135B retail deposits, ↑8% YoY • Ally Home®: $10.4B originations, ↑123% YoY; convenient, digitally-based mortgage solution • Ally Invest: $17.4B net customer assets, ↑24% YoY, 506k active self-directed and robo accounts • Ally Lending: $1.2B point-of-sale originations, ↑147% YoY, 3.0k merchants, ↑37% YoY • Credit Card (Fair Square): $953 million credit card loan balances, ↑66% YoY, 756k customers, ↑67% YoY • Corporate Finance: $7.8B loan portfolio expanded 29% YoY as credit trends remain solid Announced up to $2B share repurchase program for 2022, increased common dividend 20% to 30¢ (1) Represents a non-GAAP financial measure. See pages 40, 44, and 51 for calculation methodology and details. (2) Estimated Retail Auto Originated Yield is a forward-looking non-GAAP financial measure. See page 37 for details. Note: Ally Bank, Member FDIC and Equal Housing Lender, offers mortgage lending, point-of-sale personal lending, and a variety of deposit and other banking products, including savings, money market, and checking accounts, CDs, and IRAs. Additionally, we offer securities-brokerage and investment-advisory services through Ally Invest. 5

4Q 2021 Preliminary Results Ally’s Culture & Priorities do it right customers culture & values Relentless focus on our dealers, consumers & commercial clients employees Ongoing prioritization of our teammates and their well-being Driving long-term, enhanced value for ALL stakeholders communities Driving meaningful and lasting change through our actions and the Ally Charitable Foundation 6

4Q 2021 Preliminary Results Ally’s Proven Ability to Deliver Auto & Insurance: Agile, Diversified Market Leader P #1 Prime Auto Lender | Comprehensive product suite | Skilled, experienced teams | Differentiating via data, tech & digital Ally Bank: Leading, Growing, All-Digital Disruptor #1 Direct, Digital Bank | Award-winning products | Industry-leading retention & loyalty | Expanded suite of digital offerings P Financial: Diversified Earnings, Optimized Balance Sheet & Quality Assets P Doubled PPNR since ‘14 | $31B of balance sheet growth since ’14 | Disciplined risk management ~1% Consolidated NCO’s Capital Deployment: Disciplined, Accretive Approach Ongoing customer, tech & brand investments | Prudent acquisition & partnering | $6.5B shareholder distributions since ‘16 P Outlook: Positioned for Ongoing, Organic Growth + Enhanced Returns P Well-positioned for steady growth | Met or exceeded ALL financial objectives | Strong, sustainable hi-teens ROTCE profile Consistently executing against our long-term strategic priorities Note: Ally Bank, Member FDIC and Equal Housing Lender, offers mortgage lending, point-of-sale personal lending, and a variety of deposit and other banking products, including savings, money market, and checking accounts, CDs, and IRAs. Additionally, we offer securities-brokerage and investment-advisory services through Ally Invest. 7

4Q 2021 Preliminary Results Ally’s Comprehensive Product Suite Customer-Centric Expanded & Sophisticated Launched / Enhanced Since 2014 P Consumer Commercial Consumer Checking, Auto Loans Savings & Borrow Borrow & Leases CD’s Retail Auto Floorplan Inventory Consumer Lease Commercial Dealer: Real Estate ClearLane (DTC Auto) P Investing Auto Ally Home (Mortgage) Dealer: Expansion & Acquisition P & Wealth Lending Pay Commercial Services Group Mgmt P Fair Square (Card) P Corporate Finance P Ally Lending: Healthcare P Ally Lending: Home Improvement P Protect Insurance Ally Lending: Retail MortgageP Property & Casualty Save, Pay & Invest Checking ClearGuard (Smart Auction) P Savings Servicing & CDs Serve & Source Customer Invest: Trading & Wealth Mgmt Credit P Portfolio Servicing (Auto) Solutions Invest: IRA & Robo Card P Customer Care Point Protect Corporate Smart Auction Vehicle Service Contracts of Sale P Finance GAP Auto Protection ClearPass Lending P 8
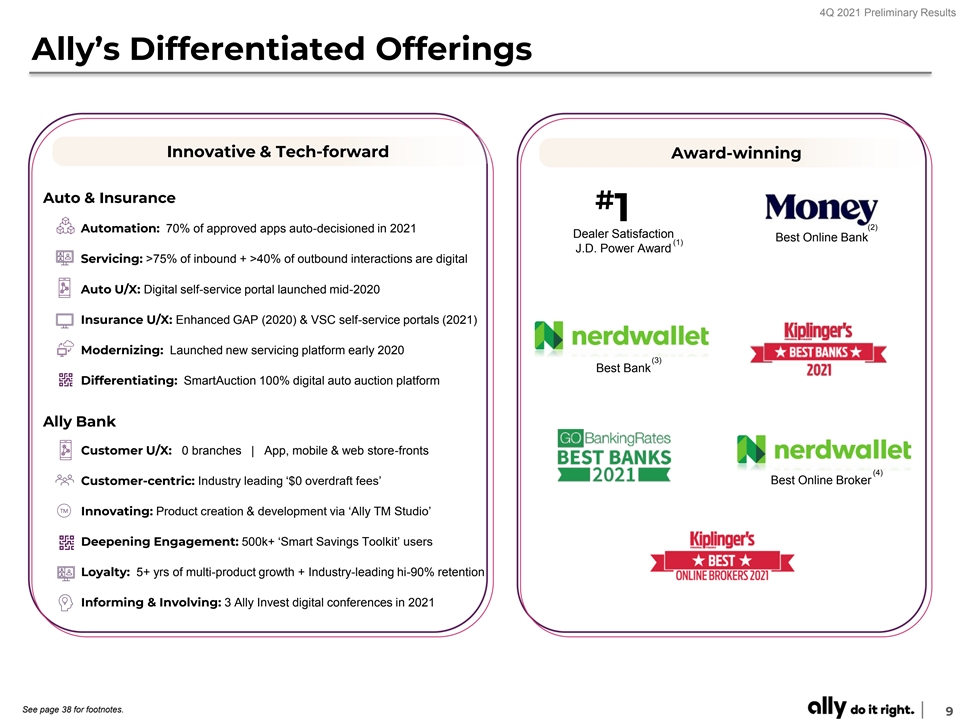
4Q 2021 Preliminary Results Ally’s Differentiated Offerings Innovative & Tech-forward Award-winning Auto & Insurance # 1 (2) Automation: 70% of approved apps auto-decisioned in 2021 Dealer Satisfaction Best Online Bank (1) J.D. Power Award Servicing: >75% of inbound + >40% of outbound interactions are digital Auto U/X: Digital self-service portal launched mid-2020 Insurance U/X: Enhanced GAP (2020) & VSC self-service portals (2021) Modernizing: Launched new servicing platform early 2020 (3) Best Bank Differentiating: SmartAuction 100% digital auto auction platform Ally Bank Customer U/X: 0 branches | App, mobile & web store-fronts (4) Best Online Broker Customer-centric: Industry leading ‘$0 overdraft fees’ Innovating: Product creation & development via ‘Ally TM Studio’ Deepening Engagement: 500k+ ‘Smart Savings Toolkit’ users Loyalty: 5+ yrs of multi-product growth + Industry-leading hi-90% retention Informing & Involving: 3 Ally Invest digital conferences in 2021 See page 38 for footnotes. 9
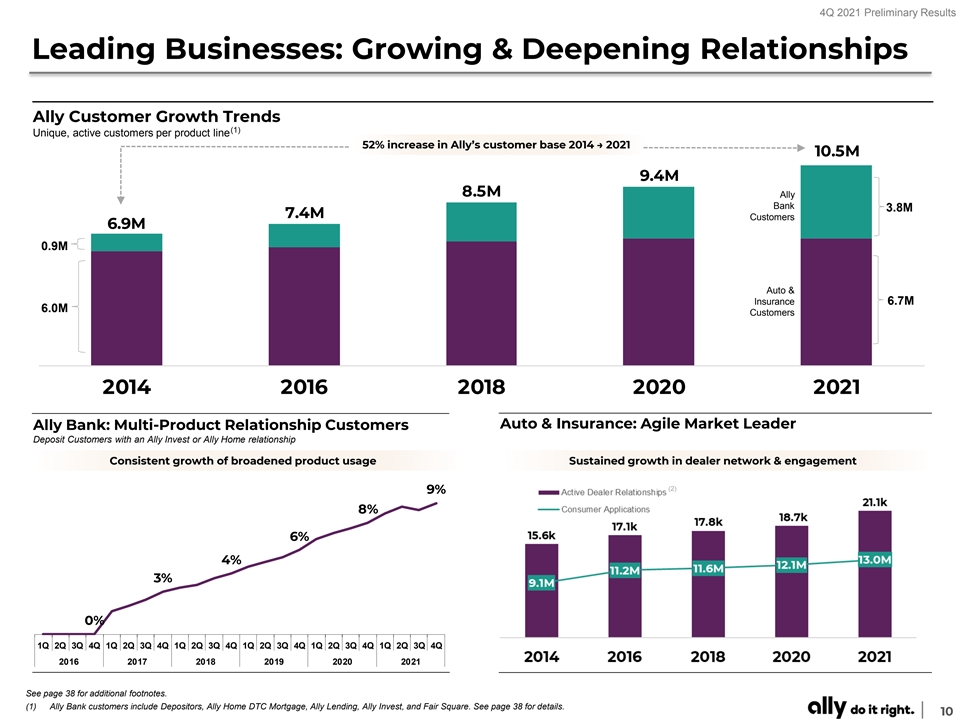
4Q 2021 Preliminary Results Leading Businesses: Growing & Deepening Relationships Ally Customer Growth Trends (1) Unique, active customers per product line 52% increase in Ally’s customer base 2014 → 2021 10.5M 9.4M 8.5M Ally Bank 3.8M 7.4M Customers 6.9M 0.9M Auto & Insurance 6.7M 6.0M Customers 2014 2016 2018 2020 2021 Auto & Insurance: Agile Market Leader Ally Bank: Multi-Product Relationship Customers Deposit Customers with an Ally Invest or Ally Home relationship Consistent growth of broadened product usage Sustained growth in dealer network & engagement (2) 9% 8% 6% 4% 3% 0% 1Q 2Q 3Q 4Q 1Q 2Q 3Q 4Q 1Q 2Q 3Q 4Q 1Q 2Q 3Q 4Q 1Q 2Q 3Q 4Q 1Q 2Q 3Q 4Q 2016 2017 2018 2019 2020 2021 See page 38 for additional footnotes. (1) Ally Bank customers include Depositors, Ally Home DTC Mortgage, Ally Lending, Ally Invest, and Fair Square. See page 38 for details. 10
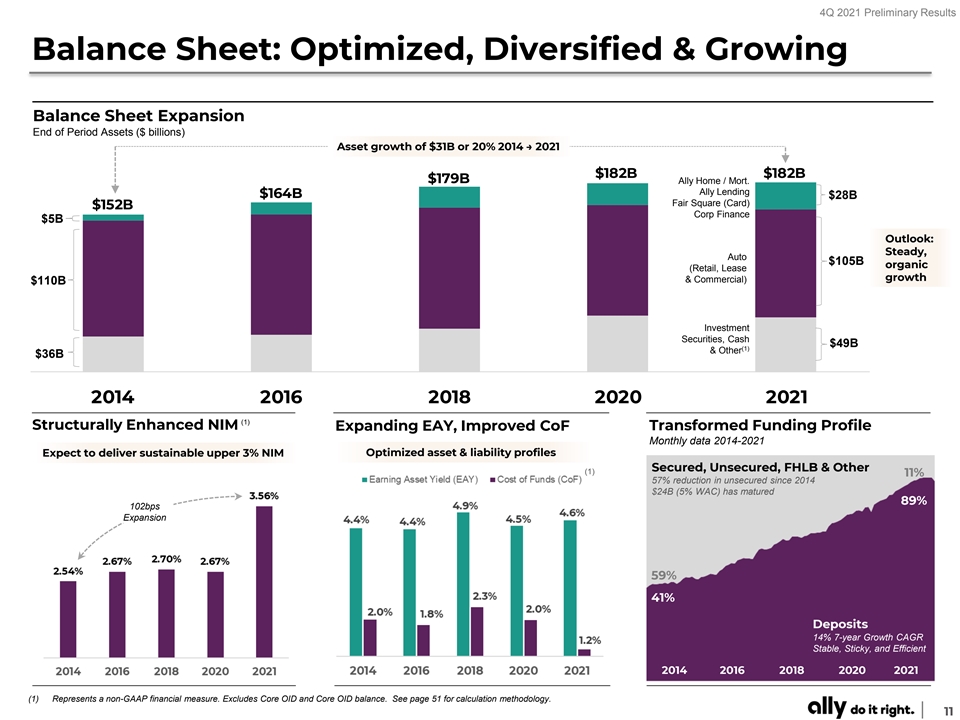
4Q 2021 Preliminary Results Balance Sheet: Optimized, Diversified & Growing Balance Sheet Expansion End of Period Assets ($ billions) Asset growth of $31B or 20% 2014 → 2021 $182B $182B $179B Ally Home / Mort. Ally Lending $164B $28B Fair Square (Card) $152B Corp Finance $5B Outlook: Steady, Auto $105B organic (Retail, Lease growth & Commercial) $110B Investment Securities, Cash $49B (1) & Other $36B 2014 2016 2018 2020 2021 (1) Structurally Enhanced NIM Expanding EAY, Improved CoF Transformed Funding Profile Monthly data 2014-2021 Optimized asset & liability profiles Expect to deliver sustainable upper 3% NIM Secured, Unsecured, FHLB & Other (1) 11% 57% reduction in unsecured since 2014 $24B (5% WAC) has matured 89% 102bps Expansion 59% 41% Deposits 14% 7-year Growth CAGR Stable, Sticky, and Efficient 2014 2016 2018 2020 2021 (1) Represents a non-GAAP financial measure. Excludes Core OID and Core OID balance. See page 51 for calculation methodology. 11

4Q 2021 Preliminary Results Earnings: Enhanced, Diversified & Expanded (1) Core Pre-provision Net Revenue (PPNR) Core PPNR more than doubled 2014 → 2021 Outlook: Steady annual expansion (1) Diversified, Durable Revenues Adjusted Efficiency Ratio $ billions Strong and improving efficiency trends Outlook for ongoing top-line growth $8.4 (1) (1) Net Financing Rev (ex OID) Adj. Other Rev $2.2 $6.7 $6.0 $5.5 $2.0 $6.2 $5.0 $1.5 $1.5 $1.4 $4.7 $4.5 $4.0 $3.5 2014 2016 2018 2020 2021 (1) Represents a non-GAAP financial measure. See pages 46 and 51 for details. 12

4Q 2021 Preliminary Results Credit: High-Quality Assets, Disciplined Approach Consolidated Annual Net Charge-offs (NCOs) and Coverage Levels 2.03% Outlook: CECL Day 1 Consolidated NCOs ~1% Retail Auto: Asset Quality Commercial Auto: Asset Quality Secured, high utility asset. Adequately reserved for 1.4-1.6% NCOs Low-loss, high-performing secured asset across variety of economic cycles 3.3% CECL Day 1 See page 37 for definitions. Note: coverage rate calculations exclude fair value adjustment for loans in hedge accounting relationships. 13

4Q 2021 Preliminary Results Capital Deployment: Accretive, Disciplined Approach (1) Adjusted Tangible Book Value per Share 71% increase since 2014 Building Long-term Intrinsic Value (2) Common Equity Tier 1 (CET1) Cumulative Shareholder Deployment Trends $ billions $ billions (1) Represents a non-GAAP financial measure. See page 42 for details. (2) 2014 reflects our capital position under U.S. Basel I using Tier 1 common capital, which represents a non-GAAP financial measure. See page 36 for calculation methodology. 14

4Q 2021 Preliminary Results 4Q and Full-Year 2021 Financial Results $ millions except per share data 4Q 21 3Q21 4Q20 2021 2020 (1) $ 1,663 $ 1,603 $ 1,312 $ 6,205 $ 4,739 Net financing revenue (ex. Core OID) (1) (9) (9) (9) (38) (36) Core OID Net financing revenue $ 1,654 $ 1,594 $ 1,303 $ 6,167 $ 4,703 (1) 533 507 567 2,177 1,954 Adjusted other revenue (2) 12 (116) 111 (138) 29 Repositioning & change in fair value of equity securities Other revenue 545 391 678 2,039 1,983 Incl. $97M Fair Square Provision for credit losses 210 76 102 241 1,439 Day 1 reserve build Noninterest expense 1,090 1,002 1,023 4,110 3,833 Pre-tax income $ 899 $ 907 $ 856 $ 3,855 $ 1,414 Income tax expense 241 195 169 790 328 Net income / (loss) from discontinued operations (6) - - (5) (1) Net income $ 652 $ 712 $ 687 $ 3,060 $ 1,085 Preferred stock dividends 28 29 - 57 - Net income attributable to common stockholders $ 624 $ 683 $ 687 $ 3,003 $ 1 ,085 GAAP EPS (diluted) $ 1.79 $ 1.89 $ 1 .82 $ 8 .22 $ 2 .88 Core OID, net of tax 0.02 0 .02 0 .02 0 .08 0 .07 Change in fair value of equity securities, net of tax (0 .05) 0 .14 (0.23) 0 .02 (0 .06) Fair Square Day 1 reserve build & $9M (3) 0 .26 0 .11 - 0 .51 0 .14 Repositioning, discontinued ops., and other, net of tax charge on TRUP’s (4) debt extinguishment - - - (0.21) - Significant discrete tax items (5) $ 2.02 $ 2.16 $ 1.60 $ 8 .61 $ 3 .03 Adjusted EPS (1) Represents a non-GAAP financial measure. For calculation methodology see pages 51 and 52. (2) See pages 48 and 50 for details and calculation methodology. (3) Represents a non-GAAP financial measure. For calculation methodology see pages 40 and 41. (4) 2Q’21 effective tax rate included a $78 million release of valuation allowance on foreign tax credit carryforwards. (5) Represents a non-GAAP financial measure. For calculation methodology see page 40 and 41. 15
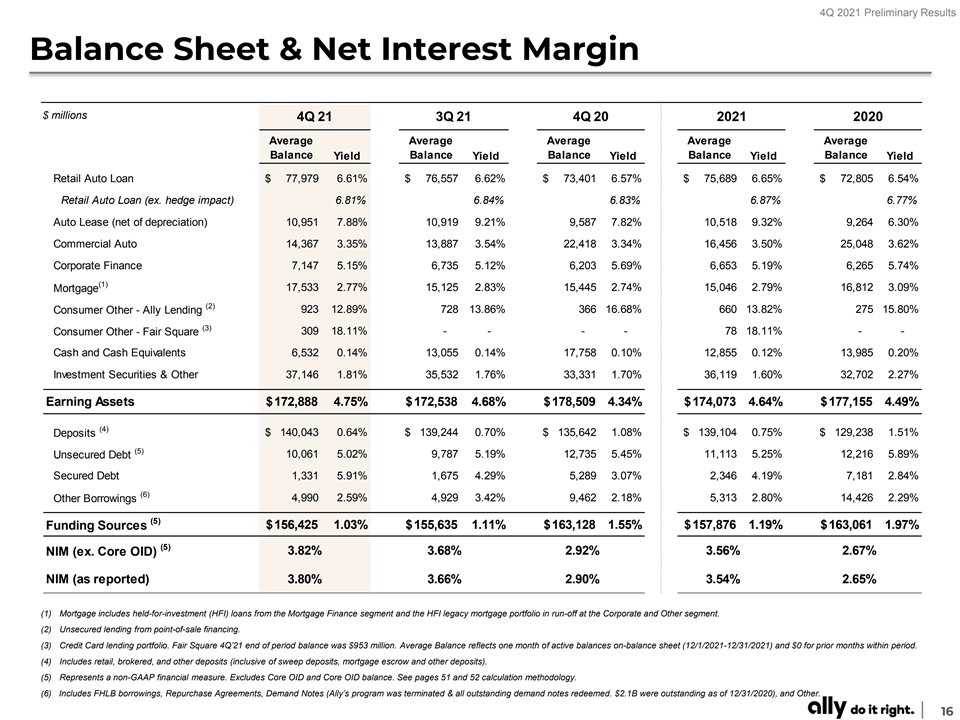
4Q 2021 Preliminary Results Balance Sheet & Net Interest Margin $ millions 4Q 21 3Q 21 4Q 20 2021 2020 Average Average Average Average Average Balance Balance Balance Balance Balance Yield Yield Yield Yield Yield Retail Auto Loan $ 77,979 6.61% $ 76,557 6.62% $ 73,401 6.57% $ 75,689 6.65% $ 72,805 6.54% Retail Auto Loan (ex. hedge impact) 6.81% 6.84% 6.83% 6.87% 6.77% Auto Lease (net of depreciation) 10,951 7.88% 10,919 9.21% 9 ,587 7.82% 10,518 9.32% 9 ,264 6.30% Commercial Auto 14,367 3.35% 13,887 3.54% 22,418 3.34% 16,456 3.50% 25,048 3.62% Corporate Finance 7,147 5.15% 6,735 5.12% 6 ,203 5.69% 6,653 5.19% 6,265 5.74% (1) 17,533 2.77% 15,125 2.83% 15,445 2.74% 15,046 2.79% 16,812 3.09% Mortgage (2) Consumer Other - Ally Lending 923 12.89% 728 13.86% 366 16.68% 660 13.82% 275 15.80% (3) 309 18.11% - - - - 78 18.11% - - Consumer Other - Fair Square Cash and Cash Equivalents 6,532 0.14% 13,055 0.14% 17,758 0.10% 12,855 0.12% 13,985 0.20% Investment Securities & Other 37,146 1.81% 35,532 1.76% 33,331 1.70% 36,119 1.60% 32,702 2.27% Earning Assets $ 172,888 4.75% $ 172,538 4.68% $ 178,509 4.34% $ 174,073 4.64% $ 177,155 4.49% (4) $ 140,043 0.64% $ 139,244 0.70% $ 135,642 1.08% $ 139,104 0.75% $ 129,238 1.51% Deposits (5) 10,061 5.02% 9 ,787 5.19% 12,735 5.45% 11,113 5.25% 12,216 5.89% Unsecured Debt Secured Debt 1,331 5.91% 1 ,675 4.29% 5,289 3.07% 2 ,346 4.19% 7 ,181 2.84% (6) 4,990 2.59% 4,929 3.42% 9 ,462 2.18% 5 ,313 2.80% 14,426 2.29% Other Borrowings (5) Funding Sources $ 156,425 1.03% $ 155,635 1.11% $ 163,128 1.55% $ 157,876 1.19% $ 163,061 1.97% (5) 3.82% 3.68% 2.92% 3.56% 2.67% NIM (ex. Core OID) NIM (as reported) 3.80% 3.66% 2.90% 3.54% 2.65% (1) Mortgage includes held-for-investment (HFI) loans from the Mortgage Finance segment and the HFI legacy mortgage portfolio in run-off at the Corporate and Other segment. (2) Unsecured lending from point-of-sale financing. (3) Credit Card lending portfolio. Fair Square 4Q’21 end of period balance was $953 million. Average Balance reflects one month of active balances on-balance sheet (12/1/2021-12/31/2021) and $0 for prior months within period. (4) Includes retail, brokered, and other deposits (inclusive of sweep deposits, mortgage escrow and other deposits). (5) Represents a non-GAAP financial measure. Excludes Core OID and Core OID balance. See pages 51 and 52 calculation methodology. (6) Includes FHLB borrowings, Repurchase Agreements, Demand Notes (Ally’s program was terminated & all outstanding demand notes redeemed. $2.1B were outstanding as of 12/31/2020), and Other. 16
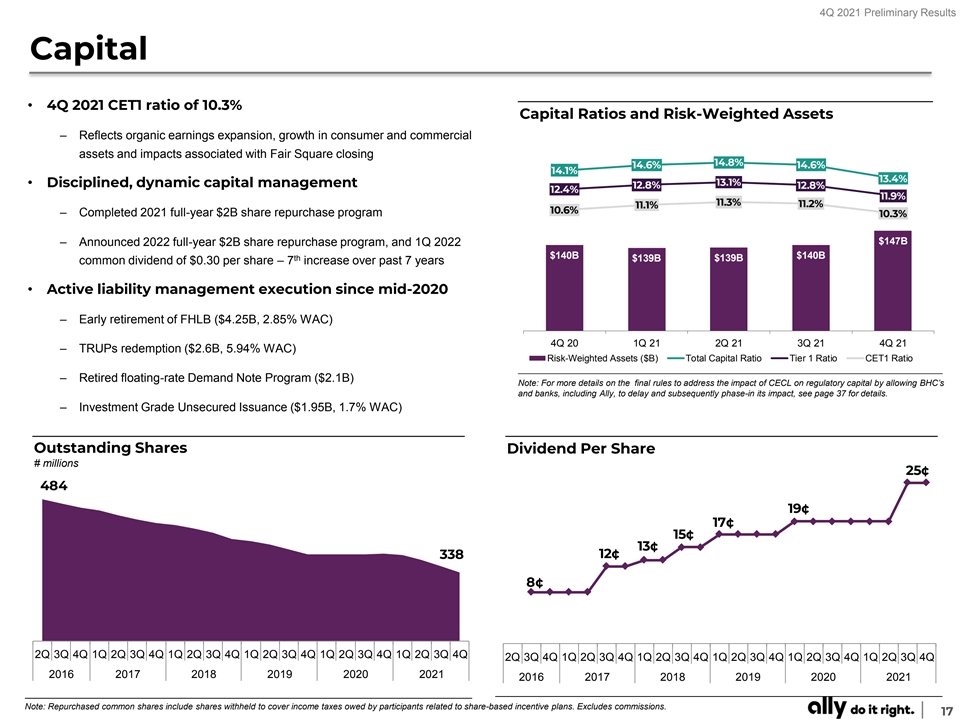
4Q 2021 Preliminary Results Capital • 4Q 2021 CET1 ratio of 10.3% Capital Ratios and Risk-Weighted Assets – Reflects organic earnings expansion, growth in consumer and commercial assets and impacts associated with Fair Square closing 14.8% 14.6% 14.6% 14.1% 13.4% 13.1% • Disciplined, dynamic capital management 12.8% 12.8% 12.4% 11.9% 11.3% 11.2% 11.1% 10.6% – Completed 2021 full-year $2B share repurchase program 10.3% $147B – Announced 2022 full-year $2B share repurchase program, and 1Q 2022 $140B $140B th $139B $139B common dividend of $0.30 per share – 7 increase over past 7 years • Active liability management execution since mid-2020 – Early retirement of FHLB ($4.25B, 2.85% WAC) 4Q 20 1Q 21 2Q 21 3Q 21 4Q 21 – TRUPs redemption ($2.6B, 5.94% WAC) Risk-Weighted Assets ($B) Total Capital Ratio Tier 1 Ratio CET1 Ratio – Retired floating-rate Demand Note Program ($2.1B) Note: For more details on the final rules to address the impact of CECL on regulatory capital by allowing BHC’s and banks, including Ally, to delay and subsequently phase-in its impact, see page 37 for details. – Investment Grade Unsecured Issuance ($1.95B, 1.7% WAC) Outstanding Shares Dividend Per Share # millions 25¢ 484 19¢ 17¢ 15¢ 13¢ 338 12¢ 8¢ 2Q 3Q 4Q 1Q 2Q 3Q 4Q 1Q 2Q 3Q 4Q 1Q 2Q 3Q 4Q 1Q 2Q 3Q 4Q 1Q 2Q 3Q 4Q 2Q 3Q 4Q 1Q 2Q 3Q 4Q 1Q 2Q 3Q 4Q 1Q 2Q 3Q 4Q 1Q 2Q 3Q 4Q 1Q 2Q 3Q 4Q 2016 2017 2018 2019 2020 2021 2016 2017 2018 2019 2020 2021 Note: Repurchased common shares include shares withheld to cover income taxes owed by participants related to share-based incentive plans. Excludes commissions. 17

4Q 2021 Preliminary Results Asset Quality: Key Metrics Consolidated Net Charge-Offs (NCOs) Net Charge-Off Activity $ millions 4Q 20 1Q 21 2Q 21 3Q 21 4Q 21 Allowance as % of Annualized NCOs Annualized NCO Rate Retail Auto $ 186 $ 97 $ (5) $ 51 $ 94 1550% 1.60% 1500% 1450% 1400% 1.40% Commercial Auto 7 - - - - 1350% 1448% 1300% 1250% 1200% 1.20% 1150% 1100% Mortgage Finance 2 1 1 - - 1050% 1.00% 1000% 950% 0.91% 900% 0.84% 0.80% 850% 800% Corporate Finance (1) 14 (4) - 1 0.67% 750% 700% 792% 0.60% 0.58% 650% 600% 550% 0.41% 0.41% 0.40% Ally Lending 4 8 4 5 9 500% 0.35% 450% 400% 667% 691% 350% 0.20% 414% 0.19% 300% (1) 250% 471% Fair Square - - - - 2 200% -0.02% 0.00% 150% 305% 100% 0% 50% 109% 0% -0.20% (2) Corp/Other - (2) (2) (2) (3) 4Q 19 1Q 20 2Q 20 3Q 20 4Q 20 1Q 21 2Q 21 3Q 21 4Q 21 Total $ 198 $ 118 $ (6) $ 54 $ 103 (1) Fair Square (Card) NCOs represent December 2021 only (2) Corp/Other includes legacy Mortgage HFI portfolio. Ratios exclude loans measured at fair value and loans held-for-sale. See page 37 for definition. Retail Auto Delinquencies Retail Auto Net Charge-Offs 60+ Days Past Due (DPD) Delinquent Contracts ($M) Delinquency Rate Net Charge-Offs ($M) Annualized NCO Rate 1.49% 1.44% 0.75% 0.66% 0.58% 1.01% 0.48% 0.47% 0.47% $540 $271 0.38% $262 0.76% $478 $428 0.32% 0.32% 0.64% $378 $341 $350 $186 0.53% 0.48% $298 $51 $137 $241 $233 $117 0.27% $97 ($5) $94 4Q 19 1Q 20 2Q 20 3Q 20 4Q 20 1Q 21 2Q 21 3Q 21 4Q 21 -0.03% 30+ DPD ($M and %) 3.61% 3.19% 2.20% 2.25% 2.49% 1.43% 1.60% 1.83% 2.14% 4Q 19 1Q 20 2Q 20 3Q 20 4Q 20 1Q 21 2Q 21 3Q 21 4Q 21 $2,616 $2,322 $1,599 $1,658 $1,834 $1,059 $1,218 $1,427 $1,677 Note: Includes accruing contracts only. Days-past-due (“DPD”). See page 37 for definition. 18

4Q 2021 Preliminary Results Asset Quality: Coverage & Reserves Consolidated Coverage Retail Auto Coverage $ billions $ billions Reserve - $ Reserve - % Reserve - $ Reserve - % $3.3 Fair Square Day 1 Build $3.0 $3.0 $2.9 $3.4 $3.4 $2.8 $2.8 $3.3 $2.8 $2.8 $3.2 $2.8 $3.2 $3.1 $3.1 $2.6 $2.4 4.09% 4.06% 2.87% 3.95% 2.85% 3.91% 2.78% 2.79% 2.79% 2.75% 3.80% 3.70% 2.67% 3.62% 3.54% 2.54% 3.34% 2.03% $1.3 $1.1 1.49% 0.99% 4Q 19 CECL 1Q 20 2Q 20 3Q 20 4Q 20 1Q 21 2Q 21 3Q 21 4Q 21 4Q 19 CECL 1Q 20 2Q 20 3Q 20 4Q 20 1Q 21 2Q 21 3Q 21 4Q 21 Day 1 Day 1 Coverage rate calculations exclude fair value adjustment for loans in hedge accounting relationships. Coverage rate calculations exclude fair value adjustment for loans in hedge accounting relationships. Consolidated QoQ Reserve Walk $ millions Net Charge- ∆ In Portfolio All 4Q’21 3Q’21 1 2 3 (2) off Activity Size Other Reserve Reserve (1) ($103) 4Q’21 NCO’s Fair Square ($55) $106 Primarily Favorable $3,148 $3,267 Loan Growth $103 Replenished Macroeconomic Trends $68 (1) Includes $97 million Fair Square Day 1 reserve build and CECL impact related to portfolio growth from 12/1/2021 – 12/31/2021. (2) Includes $12 million of reserves established for Purchase Credit Deteriorated (PCD) assets related to Fair Square acquisition. 19
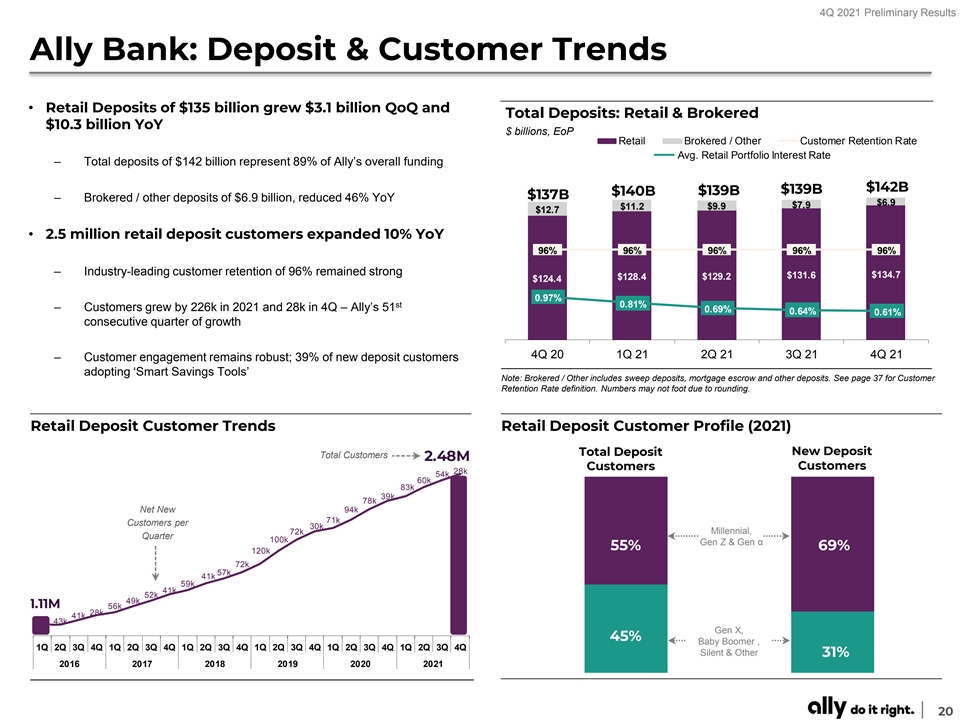
4Q 2021 Preliminary Results Ally Bank: Deposit & Customer Trends • Retail Deposits of $135 billion grew $3.1 billion QoQ and Total Deposits: Retail & Brokered $10.3 billion YoY $ billions, EoP Retail Brokered / Other Customer Retention Rate Avg. Retail Portfolio Interest Rate – Total deposits of $142 billion represent 89% of Ally’s overall funding $142B $139B $140B $139B $137B – Brokered / other deposits of $6.9 billion, reduced 46% YoY $6.9 $7.9 $11.2 $9.9 $12.7 • 2.5 million retail deposit customers expanded 10% YoY 96% 96% 96% 96% 96% – Industry-leading customer retention of 96% remained strong $131.6 $134.7 $128.4 $129.2 $124.4 0.97% st 0.81% – Customers grew by 226k in 2021 and 28k in 4Q – Ally’s 51 0.69% 0.64% 0.61% consecutive quarter of growth 4Q 20 1Q 21 2Q 21 3Q 21 4Q 21 – Customer engagement remains robust; 39% of new deposit customers adopting ‘Smart Savings Tools’ Note: Brokered / Other includes sweep deposits, mortgage escrow and other deposits. See page 37 for Customer Retention Rate definition. Numbers may not foot due to rounding. Retail Deposit Customer Trends Retail Deposit Customer Profile (2021) Total Deposit New Deposit Total Customers 2.48M Customers Customers 28k 54k 60k 83k 39k 78k Net New 94k 71k Customers per 30k 72k Millennial, Quarter 100k Gen Z & Gen α 55% 69% 120k 72k 57k 41k 59k 41k 52k 49k 1.11M 56k 28k 41k 43k Gen X, 45% Baby Boomer , 1Q 2Q 3Q 4Q 1Q 2Q 3Q 4Q 1Q 2Q 3Q 4Q 1Q 2Q 3Q 4Q 1Q 2Q 3Q 4Q 1Q 2Q 3Q 4Q Silent & Other 31% 2016 2017 2018 2019 2020 2021 20
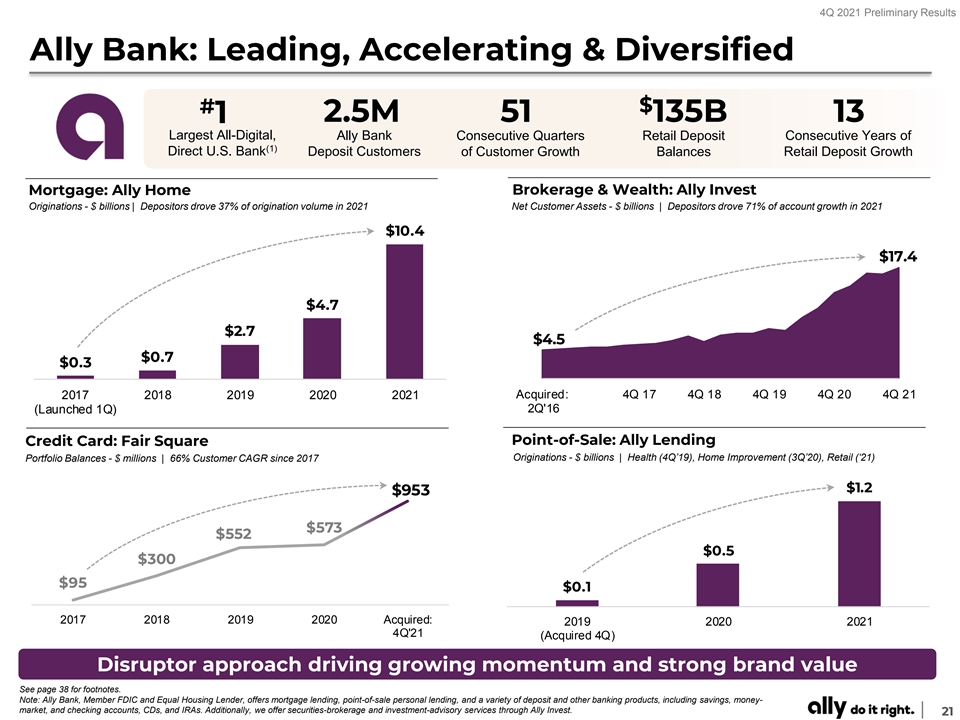
4Q 2021 Preliminary Results Ally Bank: Leading, Accelerating & Diversified $ # 2.5M 51 135B 13 1 Largest All-Digital, Ally Bank Consecutive Quarters Retail Deposit Consecutive Years of (1) Direct U.S. Bank Deposit Customers of Customer Growth Balances Retail Deposit Growth Brokerage & Wealth: Ally Invest Mortgage: Ally Home Originations - $ billions | Depositors drove 37% of origination volume in 2021 Net Customer Assets - $ billions | Depositors drove 71% of account growth in 2021 $10.4 $17.4 $4.7 $2.7 $4.5 $0.7 $0.3 Acquired: 4Q 17 4Q 18 4Q 19 4Q 20 4Q 21 2017 2018 2019 2020 2021 (Launched 1Q) 2Q'16 Point-of-Sale: Ally Lending Credit Card: Fair Square Originations - $ billions | Health (4Q’19), Home Improvement (3Q’20), Retail (‘21) Portfolio Balances - $ millions | 66% Customer CAGR since 2017 $1.2 $953 $573 $552 $0.5 $300 $95 $0.1 2017 2018 2019 2020 Acquired: 2019 2020 2021 4Q'21 (Acquired 4Q) Disruptor approach driving growing momentum and strong brand value See page 38 for footnotes. Note: Ally Bank, Member FDIC and Equal Housing Lender, offers mortgage lending, point-of-sale personal lending, and a variety of deposit and other banking products, including savings, money- market, and checking accounts, CDs, and IRAs. Additionally, we offer securities-brokerage and investment-advisory services through Ally Invest. 21

4Q 2021 Preliminary Results Auto Finance Inc / (Dec) v. • Auto pre-tax income of $839 million in 4Q 2021, reflecting Key Financials ($ millions) 4Q 21 3Q 21 4Q 20 industry leading capabilities and well-positioned platform Net financing revenue $ 1,341 $ 12 $ 188 – Net financing revenue driven by strong retail auto trends and solid off- Total other revenue 67 6 11 lease vehicle gains, offsetting lower floorplan balances Total net revenue 1,408 18 199 Provision for credit losses 45 ( 8) ( 41) – Continued strong credit performance resulted in historically low net losses (1) Noninterest expense 524 12 (36) Pre-tax income $ 839 $ 14 $ 276 – Ending earning assets of $105.2 billion, increased $4.0 billion QoQ, driven by consumer expansion and growth in dealer floorplan levels U.S. auto earning assets (EOP) $ 105,225 $ 3,986 $ (998) Key Statistics • Used vehicle values remain supported by strong Remarketing gains ($ millions) $ 65 $ ( 21) $ (0) consumer demand and low vehicle supply Average gain per vehicle $ 2,339 $ (156) $ 189 Off-lease vehicles terminated (# units) 27,977 (6,498) (2,503) • Pricing and credit trends reflect disciplined underwriting and investments in technology Application Volume (# thousands) 2,933 (326) 128 Retail Auto Trends Lease Portfolio Trends (3) Portfolio Yield (ex. hedge) NCO % Est. Retail Auto Origt'd Yield 7.44% 7.10% 7.07% 7.01% 6.87% 6.77% 6.61% 6.14% 5.82% 5.28% 5.52% 5.26% Lease Portfolio (EoP) $19.5B $11.5B $8.4B $9.6B $10.9B 2014 2016 2018 2019 2020 2021 Avg. Gain / Vehicle $1,461 $691 $661 $1,193 $2,693 See page 38 for additional footnotes. (3) Estimated Retail Auto Originated Yield is a forward-looking non-GAAP financial measure. See page 37 for details. 22

4Q 2021 Preliminary Results Auto Finance: Agile Market Leader # # # # Leading 1 1 1 1 Prime Auto Bank Floorplan Bank Retail Auto Dealer Satisfaction Insurance Provider (1) (2) (3) (4) Lender Lender Loan Outstandings J.D. Power Award (F&I, P&C Products) Consumer Originations & Applications Auto Balance Sheet Trends $ billions $ billions; EoP Consumer Originations U.S. Consumer Applications Retail Lease Commercial Auto $46.3 $89.2 $41.0 $88.7 $86.5 $83.1 $83.8 $36.0 $35.1 $10.9 $11.0 $10.7 $31.6 $9.9 $9.6 $78.3 $77.7 $75.8 $73.4 $73.8 13.0M 12.1M 11.2M $23.1 9.1M $19.2 $16.1 3.7M $15.2 $12.6 2010 2014 2016 2020 2021 4Q 20 1Q 21 2Q 21 3Q 21 4Q 21 Note: Held-for-investment (HFI) asset balances reflect the average daily balance for the quarter. Consumer Originations Consumer Origination Mix $ billions; % of $ originations % of $ originations 690 685 682 683 684 9% 10% 13% 13% 14% $12.9 27% 26% $12.3 31% 30% $10.9 36% $10.2 $9.1 53% 55% 54% 51% 48% 64% 64% 56% 56% 51% 26% 25% 25% 29% 27% 10% 9% 9% 21% 10% 10% 20% 21% 23% 22% 4Q 20 1Q 21 2Q 21 3Q 21 4Q 21 4Q 20 1Q 21 2Q 21 3Q 21 4Q 21 Used New Retail Lease Nonprime % of Total Retail GM Stellantis Growth Retail Auto - Wtd Avg. FICO See page 38 for footnotes. 23

4Q 2021 Preliminary Results Insurance Inc / (Dec) v. • Insurance pre-tax income of $91 million and core pre-tax Key Financials ($ millions) 4Q 21 3Q 21 4Q 20 income, excluding the change in fair value of equities, of $67 million in 4Q 2021 Premiums, service revenue earned and other $ 283 1 $ (7) VSC Losses 32 (1) - – Loss claims declined QoQ driven by lower F&I claims and weather losses Weather Losses 3 (8) 1 Other Losses 20 (5) (8) Losses and loss adjustment expenses 55 (14) (7) – Investment income higher YoY reflecting elevated realized gain activity (2) from $6.5 billion investment portfolio Acquisition and underwriting expenses 208 4 24 Total underwriting income 20 11 (24) (1) Investment income and other (adjusted) 47 (33) 19 • Written premiums of $268 million in 4Q 2021, despite (1) headwinds from near-term industry dynamics Core pre-tax income $ 67 $ ( 22) $ (5) (3) Change in fair value of equity securities 24 89 (87) – $215 million in consumer F&I written premiums, impacted by lower Pre-tax income $ 91 $ 67 $ ( 92) industry vehicle sales Total assets (EOP) $ 9,381 $ 27 $ 244 – P&C premiums of $53 million reflect historically low dealer inventory levels Key Statistics - Insurance Ratios 4Q 21 3Q 21 4Q 20 Loss ratio 19.5% 24.4% 21.6% Underwriting expense ratio 73.4% 72.0% 63.5% Combined ratio 92.9% 96.4% 85.1% Insurance Written Premiums Insurance Investment Portfolio $ billions; EoP $ millions F&I Premium P&C Premium Fixed Income Equity Cash, Equivalents & Other $6.3 $6.5 $333 $5.7 $312 $301 $295 $1.6 $64 $1.6 $268 $27 $1.3 $70 $53 $53 $1.1 $0.6 $1.1 $274 $269 $242 $242 $215 $3.8 $3.6 $3.7 4Q 19 1Q 20 2Q 20 3Q 20 4Q 20 1Q 21 2Q 21 3Q 21 4Q 21 4Q 20 1Q 21 2Q 21 3Q 21 4Q 21 (1) Represents a non-GAAP financial measure. See page 50 for calculation methodology and details. F&I: Finance and insurance products. P&C: Property and casualty insurance. For additional footnotes see page 39. 24

4Q 2021 Preliminary Results Corporate Finance Inc / (Dec) v. • Corporate Finance pre-tax income of $73 million and core Key Financials ($ millions) 4Q 21 3Q 21 4Q 20 pre-tax income, excluding the change in fair value of Net financing revenue $ 83 $ 6 $ 4 equities, of $75 million in 4Q 2021 (1) Adjusted total other revenue 55 40 38 – Higher total revenue reflects strong asset growth along with diversified (1) Adjusted total net revenue 138 46 42 revenue from co-investments, fee income and syndication activities Provision for credit losses 33 28 24 (2) Noninterest expense 30 3 7 – Provision reflects specific reserve increase and asset expansion (1) Core pre-tax income $ 75 $ 15 $ 11 (3) Change in fair value of equity securities (2) (3) (2) • Held-for-investment loans of $7.8B, up 29% YoY Pre-tax income $ 73 $ 12 $ 9 – Full year origination record of $7.3B, up $2.1B or 41% YoY Total assets (EOP) $ 7,950 $ 1,221 $ 1,842 – Quality lending portfolio comprised of 56% asset-based loans and 99.9% first lien position HFI Loans and Unfunded Commitments Diversified Loan Portfolio (12/31/2021) EoP balances, $ billions $12.7 All Other $11.2 $11.0 $10.1 $10.5 Chemicals & Metals 9% $4.9 2% Wholesale 2% Construction Services $4.6 $4.7 15% $4.3 $4.1 1% Paper & Publishing 38% Financial Services 16% Health Services 69% 14% Other Services Manufacturing $7.8 1% Food & Beverage 9% $6.6 Auto & Transportation $6.3 $6.2 16% $6.0 5% Machinery Equipment 1% Retail Trade 1% Other Manufacturing 4Q 20 1Q 21 2Q 21 3Q 21 4Q 21 Held-for-investment loans Unfunded Commitments (1) Represents a non-GAAP financial measure. See page 50 for calculation methodology and details. Note: Unfunded amounts include Held-for-investment and Held-for-sale commitments of up to $0.3B per quarter. For additional footnotes see page 39. 25

4Q 2021 Preliminary Results Mortgage Finance Inc / (Dec) v. • Mortgage pre-tax income of $3 million in 4Q 2021 Key Financials ($ millions) 4Q 21 3Q 21 4Q 20 Net financing revenue $ 42 $ 6 $ 22 – Expanded net financing revenue reflects growth in asset balances Total other revenue 13 (6) (24) reflecting DTC origination volume and reduced prepayment activity Total net revenue $ 55 $ - $ (2) – Other revenue declined QoQ and YoY, driven by shift from HFS to HFI Provision for credit losses 1 (1) (2) and lower gain on sale margins (1) Noninterest expense 51 4 4 Pre-tax income $ 3 $ (3) $ (4) • Direct-to-Consumer (DTC) originations of $2.9 billion in Total assets (EOP) $ 17,847 $ 1,519 $ 2,958 4Q 2021, up 99% YoY Mortgage Finance HFI Portfolio 4Q 21 3Q 21 4Q 20 – 37% of 4Q originations from Ally Bank deposit customers Net Carry Value ($ billions) $ 17.6 $ 16.0 $ 14.6 (2) 56.9% 57.6% 60.1% Wtd. Avg. LTV/CLTV – Refinance activity made up 75% of 4Q funded volume, up 106% YoY Refreshed FICO 776 776 776 Mortgage: Held-for-Investment Assets Mortgage: Direct-to-Consumer Originations $ billions $ billions D DTC TC - - H HFI FI D DT TC C - - H HF FS S Bulk DTC $ $3 3..6 6 $17.6 $16.0 $ $2 2..9 9 22% 36% $14.6 $13.6 $ $2 2..2 2 $12.4 22% 26% $8.7 $ $1 1..8 8 $3.9 $7.0 $ $1 1..4 4 58% 36% $4.8 $3.9 64% 78% 62% 58% 78% 74% 62% 66% 42% 64% 38% 42% $10.7 34% 38% $9.0 $8.8 $8.9 $8.5 4 4Q Q 2 20 0 1 1Q Q 2 21 1 2 2Q Q 2 21 1 3 3Q Q 2 21 1 4 4Q Q 2 21 1 Bulk 4Q 20 1Q 21 2Q 21 3Q 21 4Q 21 $1.2 $0.2 $1.7 $1.2 $0.7 See page 39 for footnotes. 26

4Q 2021 Preliminary Results Financial Outlook Structurally more profitable company (1) Core ROTCE Progression 24.3% Enhanced, Sustainable, FY’21 Reserve Return Drivers Reduction Fair Square +100-125bps Loan Growth 16-18%+ ✓ Steady, Organic Expansion Operating Discipline ✓ Annual PPNR Expansion 12.3% 12.0% Revenues ✓ Upper 3% Net Interest Margin 10.0% 9.8% Modeling 1.5% - 2.0% Fed Funds 9.4% 9.1% ✓ Expanding Other Revenue Mid-$400 / qtr. Including modest inv. gains 7.9% Credit ✓ Steady normalization over 12-18 mos. ✓ Retail Auto NCOs ‘22:<1.0% ‘23-’24: 1.4-1.6% ✓ Used Car Values Modeling 15%+ decline by YE’23 Taxes (2) ✓ 23-24% Tax Rate 2014 2015 2016 2017 2018 2019 2020 2021 2022 & Medium Term Executing against our long-term strategic objectives (1) Represents a non-GAAP financial measure. See page 44 for details. (2) Assumes statutory U.S. Federal tax rate is unchanged at 21%. 27

4Q 2021 Preliminary Results Strategic Priorities ‘Do It Right’ Purpose-Driven Culture Leading Auto, Insurance & Ally Bank products & platforms Lend Consumer & Consumer Checking, Commercial Auto Loans Savings & Savings & & Leases CD’s Checking Expanding customers & relationships across scalable platforms Commercial Protect: Investing Auto Insurance & Wealth Lending Mgmt Delivering growth through deep expertise & Insurance Mortgage digitally-enhanced capabilities Loans Servicing Servicing & & Customer Customer Credit Solutions Invest Solutions Card Disciplined risk management & accretive capital deployment Pay: Point Corporate of Sale Point-of- Finance Lending Sale & Card Driving sustainably enhanced results and value for ALL stakeholders 28

4Q 2021 Preliminary Results Supplemental 29
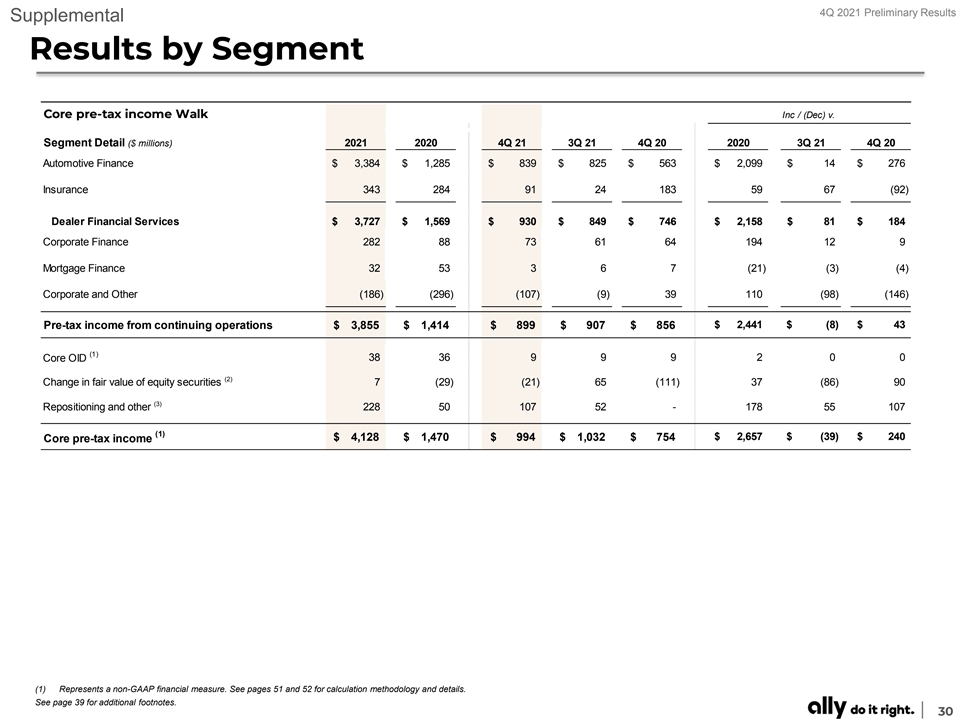
4Q 2021 Preliminary Results Supplemental Results by Segment Core pre-tax income Walk Inc / (Dec) v. Segment Detail ($ millions) 2021 2020 4Q 21 3Q 21 4Q 20 2020 3Q 21 4Q 20 Automotive Finance $ 3,384 $ 1 ,285 $ 839 $ 825 $ 563 $ 2 ,099 $ 14 $ 276 Insurance 343 284 91 24 183 59 67 (92) Dealer Financial Services $ 3 ,727 $ 1,569 $ 930 $ 849 $ 746 $ 2,158 $ 81 $ 184 Corporate Finance 282 88 73 61 64 194 12 9 Mortgage Finance 32 53 3 6 7 (21) (3 ) (4 ) Corporate and Other (186) (296) (1 07) (9) 39 110 (98) (146) $ 2,441 $ (8 ) $ 43 Pre-tax income from continuing operations $ 3,855 $ 1,414 $ 899 $ 907 $ 856 (1) Core OID 38 36 9 9 9 2 0 0 (2) Change in fair value of equity securities 7 (29) (21) 65 (1 11) 37 (8 6) 90 (3) Repositioning and other 228 50 107 52 - 178 55 107 (1) $ 2,657 $ (3 9) $ 240 $ 4,128 $ 1 ,470 $ 994 $ 1 ,032 $ 754 Core pre-tax income (1) Represents a non-GAAP financial measure. See pages 51 and 52 for calculation methodology and details. See page 39 for additional footnotes. 30

4Q 2021 Preliminary Results Supplemental Funding Profile Details Funding Mix Deposit Mix Brokered / Other Retail CD MMA/OSA/Checking Deposits Secured Debt FHLB / Other Unsecured Debt 3.00% 7% 6% 8% 8% 4% 5% 2.50% 1% 11% 15% 3% 58% 6% 62% 65% 67% 70% 11% 2.00% 1.50% 89% 85% 75% 1.00% 66% 33% 30% 28% 27% 26% 0.50% 9% 8% 7% 6% 5% 0.00% 4Q 18 4Q 19 4Q 20 4Q 21 4Q 20 1Q 21 2Q 21 3Q21 4Q21 Note: Other includes sweep deposits, mortgage escrow and other deposits. (1) Unsecured Long-Term Debt Maturities Wholesale Funding Issuance $ billions $ billions Term ABS Term Unsecured Principal Amount Maturity Date Coupon (2) $13.3 Outstanding 2022 4.32 $1.05 $5.4 $7.3 2023 2.09 $2.00 $6.5 $5.8 $0.9 2024 4.48 $1.45 $4.2 $7.9 $0.8 $2.8 $7.3 $6.5 (3) $4.9 2025+ 6.19 $5.54 $3.5 $0.8 $2.8 $0.8 (1) Excludes retail notes, trust preferred securities, and perpetual preferred equity; as of 12/31/2021. (2) Reflects notional value of outstanding bond. Excludes total GAAP OID and capitalized transaction costs. 2015 2016 2017 2018 2019 2020 2021 (3) Weighted average coupon based on notional value and corresponding coupon for all unsecured bonds as of January 1st of the respective year. Does not reflect weighted average interest expense for the respective year. 2025+ excludes Trust Preferred securities (excluding OID/issuance costs). Note: Term ABS shown includes funding amounts (notes sold) at new issue and does not include private offerings sold later. Excludes $2.35 billion of preferred equity issued in 2021. 31

4Q 2021 Preliminary Results Supplemental Corporate and Other $ millions • Pre-tax loss of $107 million includes $97 million Inc / (Dec) v. Key Financials 4Q 21 3Q 21 4Q 20 provision impact from Fair Square Day 1 reserve build, Net financing revenue $ 173 $ 35 $ 130 Core pre-tax income of $10 million includes: Total other revenue 73 61 (74) Total net revenue $ 246 $ 96 $ 56 Provision for credit losses 131 115 127 – Higher net financing revenue from favorable funding profile Noninterest expense 222 79 75 and investment income Pre-tax loss $ (107) $ (98) $ (146) (1) Core OID 9 0 0 (2) – Total other revenue up QoQ driven by corporate investment Repositioning and other 107 55 107 (3) gain activity and income from expanded product offerings, YoY Change in fair value of equity securities 1 0 1 - - (1) decline reflects a gain that did not repeat from prior year period Core pre-tax income $ 10 $ (42) $ (38) Cash & securities $ 35,357 $ (5,335) $ (6,967) • Total assets of $43.5 billion, down $3.7 billion YoY, (4) Held-for-investment loans, net 2,260 824 1,035 (5) driven by lower cash balances Intercompany loan ( 923) (25) (93) (5) Other 6,825 899 2,307 Total assets $ 43,519 $ (3,637) $ (3,718) Ally Financial Rating Details Ally Invest 4Q 21 3Q 21 4Q 20 Net Funded Accounts (k) 505.6 502.9 456.7 Average Customer Trades Per Day (k) 42.8 40.8 60.1 LT Debt ST Debt Outlook Date Total Customer Cash Balances $ 2,195 $ 2,175 $ 2,178 Total Net Customer Assets $ 17,391 $ 16,290 $ 14,017 Fitch BBB- F3 Stable 3/30/2021 Moody's Baa3 P-3 Stable 8/27/2021 S&P BBB- A-3 Stable 3/25/2021 DBRS BBB (Low) R-3 Review for Upgrade 11/23/2021 Ally Lending 4Q 21 3Q 21 4Q 20 Note: Ratings & Outlook as of 12/31/2021. Our borrowing costs & access to the capital markets could be Gross Originations $ 369 $ 362 $ 177 negatively impacted if our credit ratings are downgraded or otherwise fail to meet investor expectations or Held-for-investment Loans (EOP) $ 1,009 $ 836 $ 407 demands. Portfolio yield 12.9% 13.9% 16.7% NCO % 4.1% 2.8% 4.7% Fair Square Credit Card 4Q 21 3Q 21 4Q 20 Gross Receivable Growth (EOP) $ 189 $ 131 $ 63 Outstanding Balance (EOP) $ 953 $ 763 $ 573 NCO % 3.1% 2.7% 4.0% Active Cardholders (k) 755.8 657.9 451.4 (1) Represents a non-GAAP financial measure. See pages 50 and 52 for calculation methodology and details. Note: Fair Square acquisition closed 12/1/2021 – Fair Square metrics are not reflected in Ally’s 3Q’21 and 4Q’20 consolidated results See page 39 for additional footnotes. 32
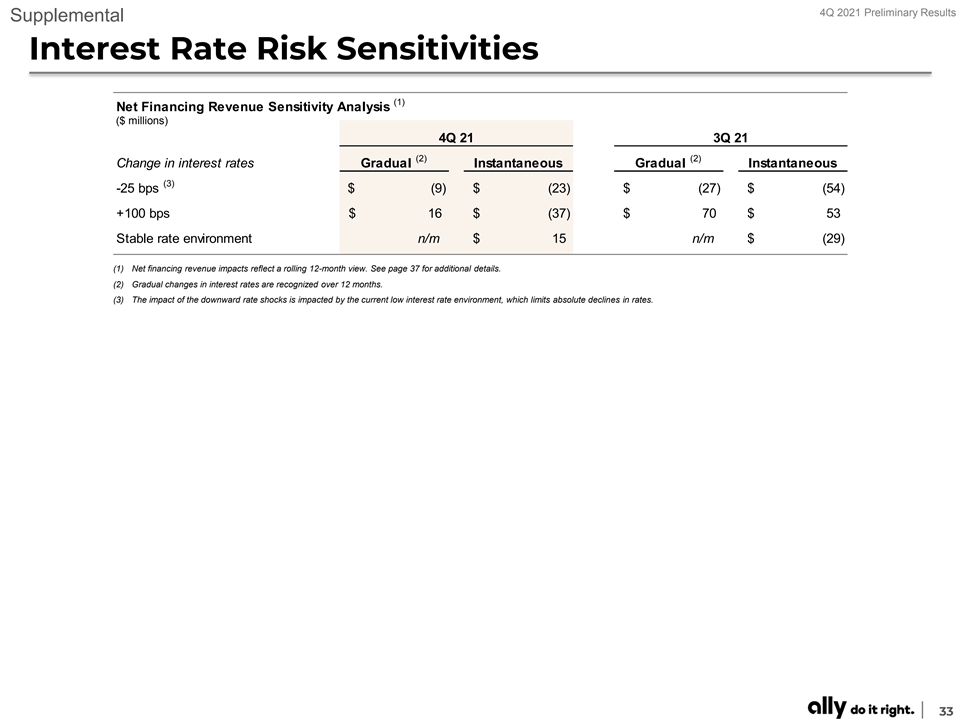
4Q 2021 Preliminary Results Supplemental Interest Rate Risk Sensitivities (1) Net Financing Revenue Sensitivity Analysis ($ millions) 4Q 21 3Q 21 (2) (2) Change in interest rates Gradual Instantaneous Gradual Instantaneous (3) -25 bps $ (9) $ (23) $ (27) $ ( 54) +100 bps $ 16 $ (37) $ 70 $ 53 Stable rate environment n/m $ 15 n/m $ (29) (1) Net financing revenue impacts reflect a rolling 12-month view. See page 37 for additional details. (2) Gradual changes in interest rates are recognized over 12 months. (3) The impact of the downward rate shocks is impacted by the current low interest rate environment, which limits absolute declines in rates. 33

4Q 2021 Preliminary Results Supplemental Deferred Tax Asset (1) Deferred Tax Asset 4Q 21 3Q 21 Gross DTA Valuation Net DTA Net DTA ($ millions) Balance Allowance Balance Balance Net Operating Loss (Federal) $ 256 $ - $ 256 $ 7 Tax Credit Carryforwards 1 ,014 ( 710) 304 216 State/Local Tax Carryforwards 198 ( 130) 68 117 Other Deferred Tax Assets / (Liabilities) (384) - (384) 499 Net Deferred Tax Asset $ 1,084 $ ( 840) $ 244 $ 839 (1) GAAP does not prescribe a method for calculating individual elements of deferred taxes for interim periods; therefore, these balances are estimates. Deferred Tax Asset / (Liability) Utilization $ millions Net GAAP DTA Balance Disallowed DTA $871 $839 $249 $244 $75 $48 $36 $2 $20 $2 4Q 20 1Q 21 2Q 21 3Q 21 4Q 21 Note: Changes to DTA in 2021 driven primarily by changes in tax depreciation election. 34

4Q 2021 Preliminary Results Supplemental Notes on Non-GAAP Financial Measures The following are non-GAAP financial measures which Ally believes are important to the reader of the Consolidated Financial Statements, but which are supplemental to, and not a substitute for, GAAP measures: Adjusted Earnings per Share (Adjusted EPS), Core pre-tax income, Pre-provision net revenue (PPNR) and Core pre-provision net revenue (Core PPNR), Core net income attributable to common shareholders, Core return on tangible common equity (Core ROTCE), Adjusted efficiency ratio, Adjusted total net revenue, Adjusted other revenue, Adjusted noninterest expense, Core original issue discount (Core OID) amortization expense and Core outstanding original issue discount balance (Core OID balance), Net financing revenue (excluding Core OID), and Adjusted tangible book value per share (Adjusted TBVPS). These measures are used by management, and we believe are useful to investors in assessing the company’s operating performance and capital. For calculation methodology, refer to the Reconciliation to GAAP later in this document. 1) Core pre-tax income is a non-GAAP financial measure that adjusts pre-tax income from continuing operations by excluding (1) Core OID, and (2) equity fair value adjustments related to ASU 2016-01 which requires change in the fair value of equity securities to be recognized in current period net income as compared to periods prior to 1/1/18 in which such adjustments were recognized through other comprehensive income, a component of equity (change in fair value of equity securities impacts the Insurance and Corporate Finance segments), and (3) Repositioning and other which are primarily related to the extinguishment of high cost legacy debt, strategic activities and significant other one-time items, as applicable for respective periods or businesses. Management believes core pre-tax income can help the reader better understand the operating performance of the core businesses and their ability to generate earnings. See pages 48-50 for calculation methodology and details. 2) Core pre-provision net revenue (Core PPNR) is a non-GAAP financial measure calculated by adjusting Core pre-tax income to add back provision for credit losses. Management believes that Core PPNR is a helpful financial metric because it enables the reader to assess the core business' ability to generate earnings to cover credit losses and as it is utilized by Federal Reserve's approach to modeling within the Supervisory Stress Test Framework that generally follows U.S. generally accepted accounting principles (GAAP) and includes a calculation of PPNR as a component of projected pre-tax net income. 3) Core net income attributable to common shareholders is a non-GAAP financial measure that serves as the numerator in the calculations of Adjusted EPS and Core ROTCE and that, like those measures, is believed by management to help the reader better understand the operating performance of the core businesses and their ability to generate earnings. Core net income attributable to common shareholders adjusts GAAP net income attributable to common shareholders for discontinued operations net of tax, tax-effected Core OID expense, tax-effected repositioning and other primarily related to the extinguishment of high-cost legacy debt and strategic activities and significant other, preferred stock capital actions, significant discrete tax items and tax-effected changes in equity investments measured at fair value, as applicable for respective periods. See pages 40 and 41 calculation methodology and details. 4) Tangible Common Equity is a non-GAAP financial measure that is defined as common stockholders’ equity less goodwill and identifiable intangible assets, net of deferred tax liabilities. Ally considers various measures when evaluating capital adequacy, including tangible common equity. Ally believes that tangible common equity is important because we believe readers may assess our capital adequacy using this measure. Additionally, presentation of this measure allows readers to compare certain aspects of our capital adequacy on the same basis to other companies in the industry. For purposes of calculating Core return on tangible common equity (Core ROTCE), tangible common equity is further adjusted for Core OID balance and net deferred tax asset. See pages 44 and 45 for more details. 5) Core original issue discount (Core OID) amortization expense is a non-GAAP financial measure for OID and is believed by management to help the reader better understand the activity removed from: Core pre-tax income (loss), Core net income (loss) attributable to common shareholders, Adjusted EPS, Core ROTCE, Adjusted efficiency ratio, Adjusted total net revenue, and Net financing revenue (excluding Core OID). Core OID is primarily related to bond exchange OID which excludes international operations and future issuances. Core OID for all periods shown is applied to the pre-tax income of the Corporate and Other segment. See pages 51 and 52 calculation methodology and details. 35
4Q 2021 Preliminary Results Notes on Non-GAAP Financial Measures 6) Core outstanding original issue discount balance (Core OID balance) is a non-GAAP financial measure for outstanding OID and is believed by management to help the reader better understand the balance removed from Core ROTCE and Adjusted TBVPS. Core OID balance is primarily related to bond exchange OID which excludes international operations and future issuances. See pages 51 and 52 for calculation methodology and details. 7) Accelerated issuance expense (Accelerated OID) is the recognition of issuance expenses related to calls of redeemable debt. 8) Tier 1 common capital is a non-GAAP financial measure defined as Tier 1 capital under the rules of U.S. Basel I less noncommon elements, including qualifying perpetual preferred stock, minority interest in subsidiaries, trust preferred securities, and mandatorily convertible preferred securities. Prior to the implementation of U.S. Basel III on January 1, 2015, Ally considered various measures when evaluating capital utilization and adequacy, including the Tier 1 common equity ratio, in addition to capital ratios defined by banking regulators. This calculation is intended to complement the capital ratios defined by banking regulators for both absolute and comparative purposes. For periods prior to the implementation of U.S. Basel III, we believe the Tier 1 common equity ratio is important because we believe analysts and banking regulators may assess our capital adequacy using this ratio. Additionally, presentation of this measure allows readers to compare certain aspects of our capital adequacy on the same basis to other companies in the industry. 36

4Q 2021 Preliminary Results Supplemental Notes on Other Financial Measures 1) Estimated Retail Auto Originated Yield is a forward-looking non-GAAP financial measure determined by calculating the estimated average annualized yield for loans originated during the period. At this time there currently is no comparable GAAP financial measure for Estimated Retail Auto Originated Yield and therefore this forecasted estimate of yield at the time of origination cannot be quantitatively reconciled to comparable GAAP information. 2) Interest rate risk modeling – We prepare our forward-looking baseline forecasts of net financing revenue taking into consideration anticipated future business growth, asset/liability positioning, and interest rates based on the implied forward curve. The analysis is highly dependent upon a variety of assumptions including the repricing characteristics of retail deposits with both contractual and non-contractual maturities. We continually monitor industry and competitive repricing activity along with other market factors when contemplating deposit pricing actions. Please see our SEC filings for more details. 3) Net charge-off ratios are calculated as annualized net charge-offs divided by average outstanding finance receivables and loans excluding loans measured at fair value and loans held-for-sale. 4) U.S. consumer auto originations ▪ New Retail – standard and subvented rate new vehicle loans ▪ Lease – new vehicle lease originations ▪ Used – used vehicle loans ▪ Growth – total originations from non-GM/Stellantis dealers and direct-to-consumer loans. Note: Stellantis N.V. (“Stellantis”) announced January 17, 2021, following completion of the merger of Peugeot S.A. (“Groupe PSA”) and Fiat Chrysler Automobiles N.V. (“FCA”) on January 16, 2021, the combined company was renamed Stellantis. ▪ Nonprime – originations with a FICO® score of less than 620 5) Customer retention rate is the annualized 3-month rolling average of 1 minus the monthly attrition rate; excludes escheatment. 6) Estimated impact of CECL on regulatory capital per final rule issued by U.S. banking agencies - In December 2018, the FRB and other U.S. banking agencies approved a final rule to address the impact of CECL on regulatory capital by allowing BHCs and banks, including Ally, the option to phase in the day-one impact of CECL over a three-year period. In March 2020, the FRB and other U.S. banking agencies issued an interim final rule that became effective on March 31, 2020 and provided an alternative option for banks to temporarily delay the impacts of CECL, relative to the incurred loss methodology for estimating the allowance for loan losses, on regulatory capital. A final rule that was largely unchanged from the March 2020 interim final rule was issued by the FRB and other U.S. banking agencies in August 2020, and became effective in September 2020. For regulatory capital purposes, these rules permitted us to delay recognizing the estimated impact of CECL on regulatory capital until after a two-year deferral period, which for us extended through December 31, 2021. Beginning on January 1, 2022, we are required to phase in 25% of the previously deferred estimated capital impact of CECL, with an additional 25% to be phased in at the beginning of each subsequent year until fully phased in by the first quarter of 2025. Under these rules, firms that adopt CECL and elect the five-year transition will calculate the estimated impact of CECL on regulatory capital as the day-one impact of adoption plus 25% of the subsequent change in allowance during the two-year deferral period, which according to the final rule approximates the impact of CECL relative to an incurred loss model. We adopted this transition option during the first quarter of 2020, and beginning January 1, 2022 are phasing in the regulatory capital impacts of CECL based on this five-year transition period. 7) Change in fair value of equity securities impacts the Insurance, Corporate Finance and Corporate Other segments. Reflects equity fair value adjustments related to ASU 2016-01 which requires change in the fair value of equity securities to be recognized in current period net income as compared to periods prior to 1/1/18 in which such adjustments were recognized through other comprehensive income, a component of equity. 37

4Q 2021 Preliminary Results Supplemental Additional Notes Page – 9 | Ally’s Differentiated Offerings (1) ‘#1 Dealer Satisfaction among Non-Captive Lenders with Sub-Prime Credit’ - Source: J.D. Power. (2) ‘Best Online Banks of 2021’ for Low Fees – Source: Money Magazine. (3) ‘Best Bank’ for Checking Account (2022) – Source: NerdWallet. (4) ‘Best Online Brokers for Stock Trading’ (January 2022) – Source: NerdWallet. Page – 10 | Leading Businesses: Growing & Deepening Relationships (1) Customers include on-balance sheet Auto, U.S. and Canadian Insurance, active Depositors, on-balance sheet Ally Home DTC Mortgage, Ally Lending, Ally Invest, and Fair Square (credit card). (2) ‘Active U.S. Dealers’ defined as all dealers who utilize one or more of Ally’s products including consumer & commercial lending, SmartAuction or Commercial Services Group and excludes RV Commercial & Consumer lines of business exited in 2Q 2018. Page – 21 | Ally Bank: Leading, Accelerating & Diversified (1) Source: FDIC, FFIEC Call Reports and Company filings of branchless banks including Marcus, Discover, American Express, Synchrony. Page – 22 | Auto Finance (1) Noninterest expense includes corporate allocations of $236 million in 4Q 2021, $234 million in 3Q 2021, and $208 million in 4Q 2020. Page – 23 | Auto Finance: Agile Market Leader (1) ‘Prime Auto Lender’ - Source: PIN Navigator Data & Analytics, a business division of J.D. Power. The credit scores provided within these reports have been provided by FICO® Risk Score, Auto 08 FICO® is a registered trademark of Fair Isaac Corporation in the United States and other countries. Ally management defines retail auto market segmentation (unit based) for consumer automotive loans primarily as those loans with a FICO® Score (or an equivalent score) at origination by the following: • Super-prime 720+ • Prime 620 - 719 • Nonprime less than 620 (2) ‘Bank Floorplan Lender’ - Source: Company filings, including WFC and HBAN. (3) ‘Retail Auto Loan Outstandings’ - Source: Big Wheels Auto Finance Data 2021. (4) ‘#1 Dealer Satisfaction among Non-Captive Lenders with Sub-Prime Credit’ - Source: J.D. Power. 38
4Q 2021 Preliminary Results Supplemental Additional Notes Page – 24 | Insurance (2) Acquisition and underwriting expenses includes corporate allocations of $21 million in 4Q 2021, $22 million in 3Q 2021, and $15 million in 4Q 2020. (3) Change in fair value of equity securities impacts the Insurance segment. Reflects equity fair value adjustments related to ASU 2016-01 which requires change in the fair value of equity securities to be recognized in current period net income as compared to periods prior to 1/1/18 in which such adjustments were recognized through other comprehensive income, a component of equity. Page – 25 | Corporate Finance (2) Noninterest expense includes corporate allocations of $10 million in 4Q 2021, $10 million in 3Q 2021, and $8 million in 4Q 2020. (3) Change in fair value of equity securities impacts the Corporate Finance segment. Reflects equity fair value adjustments related to ASU 2016-01 which requires change in the fair value of equity securities to be recognized in current period net income as compared to periods prior to 1/1/18 in which such adjustments were recognized through other comprehensive income, a component of equity. Page – 26 | Mortgage Finance (1) Noninterest expense includes corporate allocations of $26 million in 4Q 2021, $24 million in 3Q 2021, and $22 million in 4Q 2020. (2) 1st lien only. Updated home values derived using a combination of appraisals, Broker price opinion (BPOs), Automated Valuation Models (AVMs) and Metropolitan Statistical Area (MSA) level house price indices. Page – 30 | Results by Segment (2) Change in fair value of equity securities impacts the Insurance, Corporate Finance and Corp/Other segments. Reflects equity fair value adjustments related to ASU 2016-01 which requires change in the fair value of equity securities to be recognized in current period net income as compared to periods prior to 1/1/18 in which such adjustments were recognized through other comprehensive income, a component of equity. (3) Repositioning and other which are primarily related to the extinguishment of high-cost legacy debt, strategic activities and significant other one-time items, as applicable for respective periods or businesses. Page – 32 | Corporate and Other (2) Repositioning and other which are primarily related to the extinguishment of high-cost legacy debt, strategic activities and significant other one-time items, as applicable for respective periods or businesses. (3) Change in fair value of equity securities impacts the Corporate and Other segment. Reflects equity fair value adjustments related to ASU 2016-01 which requires change in the fair value of equity securities to be recognized in current period net income as compared to periods prior to 1/1/18 in which such adjustments were recognized through other comprehensive income, a component of equity. (4) HFI legacy mortgage portfolio and HFI Ally Lending portfolio. (5) Intercompany loan related to activity between Insurance and Corporate for liquidity purposes from the wind down of the Demand Notes program. Includes loans held- for-sale. 39

4Q 2021 Preliminary Results Supplemental GAAP to Core Results: Adjusted EPS - Annual Adjusted Earnings per Share ( Adjusted EPS ) FY 2021 FY 2020 FY 2019 FY 2018 FY 2017 FY 2016 FY 2015 Numerator ($ millions) GAAP net income / (loss) attributable to common shareholders $ 3,003 $ 1,085 $ 1,715 $ 1,263 $ 929 $ 1,037 $ (1,282) Discontinued operations, net of tax 5 1 6 - (3) 44 ( 392) Core OID 38 36 29 86 71 59 59 Repositioning items 228 50 - - - 11 349 Change in fair value of equity securities 7 (29) (89) 121 - - - Tax on Core OID, repositioning items, & change in fair value of equity securities (tax rate 21% starting 1Q18, 35% starting 1Q16; 34% prior) (57) (1) 13 (43) (25) (24) (139) Significant discrete tax items (78) - (201) - 119 (84) - Series G actions - - - - - - 2,350 Series A actions - - - - - 1 22 Core net income attributable to common shareholders [a] $ 3,146 $ 1,141 $ 1,472 $ 1,427 $ 1,091 $ 1,043 $ 967 Denominator Weighted-average common shares outstanding - (Diluted, thousands) [b] 365,180 377,101 395,395 427,680 455,350 482,182 483,934 Metric Adjusted EPS [a] / [b] $ 8.61 $ 3.03 $ 3.72 $ 3.34 $ 2.39 $ 2.16 $ 2.00 Adjusted earnings per share (Adjusted EPS) is a non-GAAP financial measure that adjusts GAAP EPS for revenue and expense items that are typically strategic in nature or that management otherwise does not view as reflecting the operating performance of the company. Management believes Adjusted EPS can help the reader better understand the operating performance of the core businesses and their ability to generate earnings. In the numerator of Adjusted EPS, GAAP net income attributable to common shareholders is adjusted for the following items: (1) excludes discontinued operations, net of tax, as Ally is primarily a domestic company and sales of international businesses and other discontinued operations in the past have significantly impacted GAAP EPS, (2) adds back the tax-effected non-cash Core OID, (3) adjusts for tax-effected repositioning and other which are primarily related to the extinguishment of high cost legacy debt, strategic activities and significant other one-time items, (4) excludes equity fair value adjustments (net of tax) related to ASU 2016-01 which requires change in the fair value of equity securities to be recognized in current period net income as compared to periods prior to 1/1/18 in which such adjustments were recognized through other comprehensive income, a component of equity, (5) excludes significant discrete tax items that do not relate to the operating performance of the core businesses, and adjusts for preferred stock capital actions (e.g., Series A and Series G) that have been taken by the company to normalize its capital structure, as applicable for respective periods. 40
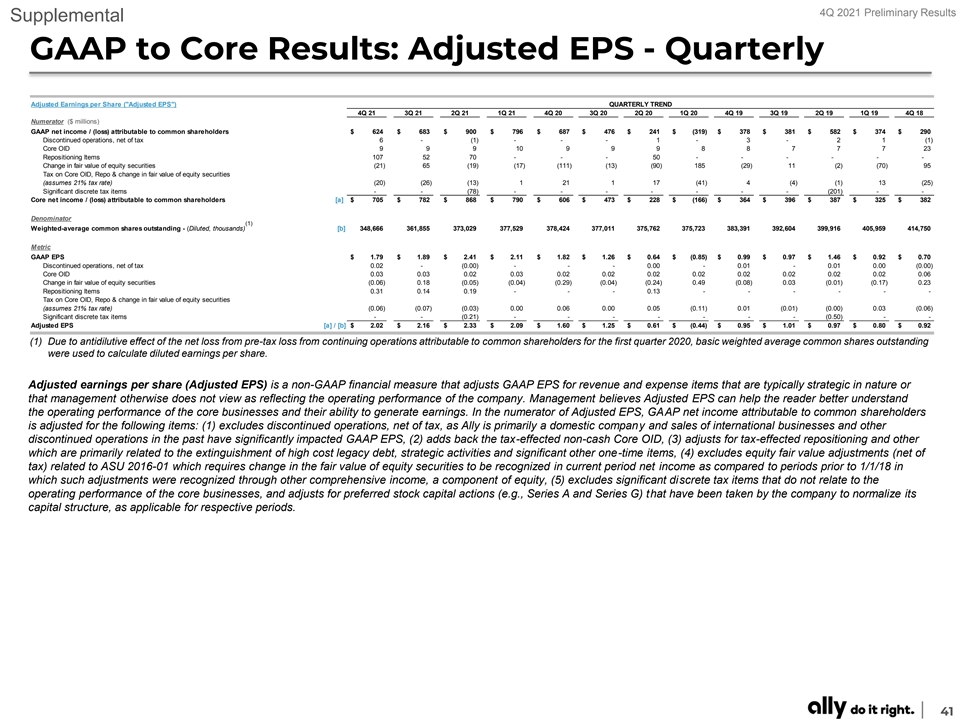
4Q 2021 Preliminary Results Supplemental GAAP to Core Results: Adjusted EPS - Quarterly Adjusted Earnings per Share ( Adjusted EPS ) QUARTERLY TREND 4Q 21 3Q 21 2Q 21 1Q 21 4Q 20 3Q 20 2Q 20 1Q 20 4Q 19 3Q 19 2Q 19 1Q 19 4Q 18 Numerator ($ millions) GAAP net income / (loss) attributable to common shareholders $ 624 $ 683 $ 900 $ 796 $ 687 $ 476 $ 241 $ (319) $ 378 $ 381 $ 582 $ 374 $ 290 Discontinued operations, net of tax 6 - (1) - - - 1 - 3 - 2 1 (1) Core OID 9 9 9 10 9 9 9 8 8 7 7 7 23 Repositioning Items 107 52 70 - - - 50 - - - - - - Change in fair value of equity securities (21) 65 (19) (17) (111) (13) (90) 185 (29) 11 (2) (70) 95 Tax on Core OID, Repo & change in fair value of equity securities (assumes 21% tax rate) (20) (26) (13) 1 21 1 17 (41) 4 (4) (1) 13 (25) Significant discrete tax items - - (78) - - - - - - - (201) - - Core net income / (loss) attributable to common shareholders [a] $ 705 $ 782 $ 868 $ 790 $ 606 $ 473 $ 228 $ (166) $ 364 $ 396 $ 387 $ 325 $ 382 Denominator (1) Weighted-average common shares outstanding - (Diluted, thousands) [b] 348,666 361,855 373,029 377,529 378,424 377,011 375,762 375,723 383,391 392,604 399,916 405,959 414,750 Metric GAAP EPS $ 1.79 $ 1.89 $ 2.41 $ 2.11 $ 1.82 $ 1.26 $ 0.64 $ (0.85) $ 0.99 $ 0.97 $ 1.46 $ 0.92 $ 0.70 Discontinued operations, net of tax 0 .02 - (0.00) - - - 0.00 - 0 .01 - 0.01 0.00 (0.00) Core OID 0 .03 0 .03 0 .02 0 .03 0.02 0.02 0.02 0.02 0.02 0.02 0.02 0 .02 0 .06 Change in fair value of equity securities ( 0.06) 0.18 ( 0.05) ( 0.04) (0.29) (0.04) (0.24) 0 ..49 ( 0.08) 0 .03 (0.01) ( 0.17) 0 .23 Repositioning Items 0 .31 0 .14 0.19 - - - 0 .13 - - - - - - Tax on Core OID, Repo & change in fair value of equity securities (assumes 21% tax rate) ( 0.06) (0.07) (0.03) 0.00 0 .06 0 .00 0 .05 ( 0.11) 0 ..01 (0.01) ( 0.00) 0 .03 ( 0.06) Significant discrete tax items - - (0.21) - - - - - - - (0.50) - - Adjusted EPS [a] / [b] $ 2.02 $ 2.16 $ 2.33 $ 2.09 $ 1.60 $ 1.25 $ 0.61 $ (0.44) $ 0.95 $ 1.01 $ 0.97 $ 0.80 $ 0.92 (1) Due to antidilutive effect of the net loss from pre-tax loss from continuing operations attributable to common shareholders for the first quarter 2020, basic weighted average common shares outstanding were used to calculate diluted earnings per share. Adjusted earnings per share (Adjusted EPS) is a non-GAAP financial measure that adjusts GAAP EPS for revenue and expense items that are typically strategic in nature or that management otherwise does not view as reflecting the operating performance of the company. Management believes Adjusted EPS can help the reader better understand the operating performance of the core businesses and their ability to generate earnings. In the numerator of Adjusted EPS, GAAP net income attributable to common shareholders is adjusted for the following items: (1) excludes discontinued operations, net of tax, as Ally is primarily a domestic company and sales of international businesses and other discontinued operations in the past have significantly impacted GAAP EPS, (2) adds back the tax-effected non-cash Core OID, (3) adjusts for tax-effected repositioning and other which are primarily related to the extinguishment of high cost legacy debt, strategic activities and significant other one-time items, (4) excludes equity fair value adjustments (net of tax) related to ASU 2016-01 which requires change in the fair value of equity securities to be recognized in current period net income as compared to periods prior to 1/1/18 in which such adjustments were recognized through other comprehensive income, a component of equity, (5) excludes significant discrete tax items that do not relate to the operating performance of the core businesses, and adjusts for preferred stock capital actions (e.g., Series A and Series G) that have been taken by the company to normalize its capital structure, as applicable for respective periods. 41

4Q 2021 Preliminary Results Supplemental GAAP to Core Results: Adjusted TBVPS - Annual Adjusted Tangible Book Value per Share ( Adjusted TBVPS ) FY 2021 FY 2020 FY 2019 FY 2018 FY 2017 FY 2016 FY 2015 Numerator ($ billions) GAAP shareholder's equity $ 17.1 $ 14.7 $ 14.4 $ 13.3 $ 13.5 $ 13.3 $ 13.4 Preferred equity (2.3) - - - - - (0.7) GAAP common shareholder's equity $ 14.7 $ 14.7 $ 14.4 $ 13.3 $ 13.5 $ 13.3 $ 12.7 Goodwill and identifiable intangibles, net of DTLs (0.9) (0.4) (0.5) (0.3) (0.3) (0.3) (0.0) Tangible common equity 13.8 14.3 14.0 13.0 1 3.2 13.0 12.7 Tax-effected Core OID balance (21% tax rate starting 4Q17, 35% starting 1Q16; 34% prior) (0.7) (0.8) (0.8) (0.9) (0.9) (0.8) (0.9) Adjusted tangible book value [a] $ 13.1 $ 13.5 $ 13.1 $ 12.1 $ 12.3 $ 12.2 $ 11.9 Denominator Issued shares outstanding (period-end, thousands) [b] 337,941 374,674 374,332 404,900 437,054 467,000 481,980 Metric GAAP shareholder's equity per share $ 50.5 $ 39.2 $ 38.5 $ 32.8 $ 30.9 $ 28.5 $ 27.9 Preferred equity per share (6.9) - - - - - (1.4) GAAP common shareholder's equity per share $ 43.6 $ 39.2 $ 38.5 $ 32.8 $ 30.9 $ 28.5 $ 26.4 Goodwill and identifiable intangibles, net of DTLs per share (2.8) (1.0) (1.2) (0.7) (0.7) (0.6) (0.1) Tangible common equity per share 40.8 3 8.2 3 7.3 32.1 3 0.2 2 7.9 26.4 Tax-effected Core OID balance (21% tax rate starting 4Q17, 35% starting 1Q16; 34% prior) per share (2.1) (2.2) (2.2) (2.1) (2.1) (1.7) (1.8) Series G discount per share - - - - - - - Adjusted tangible book value per share [a] / [b] $ 38.7 $ 36.1 $ 35.1 $ 29.9 $ 28.1 $ 26.2 $ 24.6 Adjusted tangible book value per share (Adjusted TBVPS) is a non-GAAP financial measure that reflects the book value of equity attributable to shareholders even if Core OID balance were accelerated immediately through the financial statements. As a result, management believes Adjusted TBVPS provides the reader with an assessment of value that is more conservative than GAAP common shareholder’s equity per share. Adjusted TBVPS generally adjusts common equity for: (1) goodwill and identifiable intangibles, net of DTLs, (2) tax-effected Core OID balance to reduce tangible common equity in the event the corresponding discounted bonds are redeemed/tendered, and (3) Series G discount which reduces tangible common equity as the company has normalized its capital structure, as applicable for respective periods. Note: In December 2017, tax-effected Core OID balance was adjusted from a statutory U.S. Federal tax rate of 35% to 21% (“rate”) as a result of changes to U.S. tax law. The adjustment conservatively increased the tax-effected Core OID balance and consequently reduced Adjusted TBVPS as any acceleration of the non-cash charge in future periods would flow through the financial statements at a 21% rate versus a previously modeled 35% rate. Calculated Impact to Adjusted TBVPS from CECL Day-1 1Q 20 Numerator ($ billions) Adjusted tangible book value $ 12.2 CECL Day-1 impact to retained earnings, net of tax 1.0 Adjusted tangible book value less CECL Day-1 impact [a] $ 13.3 Denominator Issued shares outstanding (period-end, thousands) [b] 373,155 Metric Adjusted TBVPS $ 32.8 CECL Day-1 impact to retained earnings, net of tax per share 2.7 Adjusted tangible book value, less CECL Day-1 impact per share [a] / [b] $ 35.5 Ally adopted CECL on January 1, 2020. Upon implementation of CECL Ally recognized a reduction to our opening retained earnings balance of approximately $1.0 billion, net of income tax, which reflects a pre-tax increase to the allowance for loan losses of approximately $1.3 billion. This increase is almost exclusively driven by our consumer automotive loan portfolio. 42

4Q 2021 Preliminary Results Supplemental GAAP to Core Results: Adjusted TBVPS - Quarterly Adjusted Tangible Book Value per Share ( Adjusted TBVPS ) QUARTERLY TREND 4Q 21 3Q 21 2Q 21 1Q 21 4Q 20 3Q 20 2Q 20 1Q 20 4Q 19 3Q 19 2Q 19 1Q 19 4Q 18 Numerator ($ billions) GAAP shareholder's equity $ 17.1 $ 17.3 $ 17.5 $ 14.6 $ 14.7 $ 14.1 $ 13.8 $ 13.5 $ 14.4 $ 14.5 $ 14.3 $ 13.7 $ 13.3 less: Preferred equity (0.0) (0.0) (0.0) - - - - - - - - - - GAAP common shareholder's equity $ 14.7 $ 15.0 $ 15.2 $ 14.6 $ 14.7 $ 14.1 $ 13.8 $ 13.5 $ 14.4 $ 14.5 $ 14.3 $ 13.7 $ 13.3 Goodwill and identifiable intangibles, net of DTLs (0.9) (0.4) (0.4) (0.4) (0.4) (0.4) (0.4) (0.4) (0.5) (0.3) (0.3) (0.3) (0.3) Tangible common equity 1 3.8 1 4.6 1 4.8 14.2 14.3 13.7 13.4 13.1 14.0 14.2 14.0 1 3.4 13.0 Tax-effected Core OID balance (assumes 21% tax rate) (0.7) (0.7) (0.8) (0.8) (0.8) (0.8) (0.8) (0.8) (0.8) (0.8) (0.9) (0.9) (0.9) Significant discrete tax items Adjusted tangible book value [a] $ 13.1 $ 13.9 $ 14.1 $ 13.4 $ 13.5 $ 12.9 $ 12.6 $ 12.2 $ 13.1 $ 13.3 $ 13.2 $ 12.6 $ 12.1 Denominator Issued shares outstanding (period-end, thousands) [b] 337,941 349,599 362,639 371,805 374,674 373,857 373,837 373,155 374,332 383,523 392,775 399,761 404,900 Metric GAAP common shareholder's equity per share $ 43.6 $ 42.8 $ 41.9 $ 39.3 $ 39.2 $ 37.8 $ 37.0 $ 36.2 $ 38.5 $ 37.7 $ 36.4 $ 34.3 $ 32.8 Goodwill and identifiable intangibles, net of DTLs per share (2.8) (1.1) (1.0) (1.0) (1.0) (1.0) (1.0) (1.2) (1.2) (0.7) (0.7) (0.7) (0.7) Tangible common equity per share 4 0.8 4 1.8 40.9 3 8.3 3 8.2 3 6.7 3 5.9 3 5.0 3 7.3 37.0 35.7 3 3.6 32.1 Tax-effected Core OID balance (assumes 21% tax rate) per share (2.1) (2.0) (2.1) (2.2) (2.2) (2.2) (2.2) (2.2) (2.2) (2.2) (2.2) (2.1) (2.1) Adjusted tangible book value per share [a] / [b] $ 38.7 $ 39.7 $ 38.8 $ 36.2 $ 36.1 $ 34.6 $ 33.7 $ 32.8 $ 35.1 $ 34.7 $ 33.6 $ 31.4 $ 29.9 Adjusted tangible book value per share (Adjusted TBVPS) is a non-GAAP financial measure that reflects the book value of equity attributable to shareholders even if Core OID balance were accelerated immediately through the financial statements. As a result, management believes Adjusted TBVPS provides the reader with an assessment of value that is more conservative than GAAP common shareholder’s equity per share. Adjusted TBVPS generally adjusts common equity for: (1) goodwill and identifiable intangibles, net of DTLs, (2) tax-effected Core OID balance to reduce tangible common equity in the event the corresponding discounted bonds are redeemed/tendered, and (3) Series G discount which reduces tangible common equity as the company has normalized its capital structure, as applicable for respective periods. Note: In December 2017, tax-effected Core OID balance was adjusted from a statutory U.S. Federal tax rate of 35% to 21% (“rate”) as a result of changes to U.S. tax law. The adjustment conservatively increased the tax-effected Core OID balance and consequently reduced Adjusted TBVPS as any acceleration of the non-cash charge in future periods would flow through the financial statements at a 21% rate versus a previously modeled 35% rate. Calculated Impact to Adjusted TBVPS from CECL Day-1 1Q 20 Numerator ($ billions) Adjusted tangible book value $ 12.2 CECL Day-1 impact to retained earnings, net of tax 1.0 Adjusted tangible book value less CECL Day-1 impact [a] $ 13.3 Denominator Issued shares outstanding (period-end, thousands) [b] 373,155 Metric Adjusted TBVPS $ 32.8 CECL Day-1 impact to retained earnings, net of tax per share 2.7 Adjusted tangible book value, less CECL Day-1 impact per share [a] / [b] $ 35.5 Ally adopted CECL on January 1, 2020. Upon implementation of CECL Ally recognized a reduction to our opening retained earnings balance of approximately $1.0 billion, net of income tax, which reflects a pre-tax increase to the allowance for loan losses of approximately $1.3 billion. This increase is almost exclusively driven by our consumer automotive loan portfolio. 43

4Q 2021 Preliminary Results Supplemental GAAP to Core Results: Core ROTCE - Annual Core Return on Tangible Common Equity ( Core ROTCE ) FY 2021 FY 2020 FY 2019 FY 2018 FY 2017 FY 2016 FY 2015 Numerator ($ millions) GAAP net income / (loss) attributable to common shareholders $ 3,003 $ 1,085 $ 1,715 $ 1,263 $ 929 $ 1,037 $ (1,282) Discontinued operations, net of tax 5 1 6 - (3) 44 (392) Core OID 38 36 29 86 71 59 59 Repositioning items 228 50 - - - 11 349 Change in fair value of equity securities 7 (29) (89) 121 - - - Tax on Core OID & change in fair value of equity securities (tax rate 21% starting in 1Q18, 35% prior) (57) (1) 13 (43) (25) (24) (139) Significant Discrete tax items & other (78) - ( 201) - 119 (84) 22 Series G actions - - - - - - 2,350 Series A actions - - - - - 1 22 Core net income attributable to common shareholders [a] $ 3,146 $ 1,141 $ 1,472 $ 1,427 $ 1,091 $ 1,043 $ 990 Denominator (Average, $ billions) GAAP shareholder's equity $ 16.2 $ 14.1 $ 13.8 $ 13.4 $ 13.4 $ 13.4 $ 14.4 Preferred equity 1.4 - - - - (0.3) (1.0) Goodwill & identifiable intangibles, net of deferred tax liabilities ( DTLs ) (0.5) (0.4) (0.4) (0.3) (0.3) (0.2) (0.0) Tangible common equity $ 14.4 $ 13.7 $ 13.5 $ 13.1 $ 13.1 $ 12.9 $ 13.4 Core OID balance (1.0) (1.0) (1.1) (1.1) (1.2) (1.3) (1.3) Net deferred tax asset ( DTA ) (0.5) (0.1) (0.2) (0.4) (0.7) (1.2) (1.6) Normalized common equity [b] $ 12.9 $ 12.6 $ 12.2 $ 11.6 $ 11.2 $ 10.4 $ 10.5 Core Return on Tangible Common Equity [a] / [b] 24.3% 9.1% 12.0% 12.3% 9.8% 10.0% 9.4% Core return on tangible common equity (Core ROTCE) is a non-GAAP financial measure that management believes is helpful for readers to better understand the ongoing ability of the company to generate returns on its equity base that supports core operations. For purposes of this calculation, tangible common equity is adjusted for Core OID balance and net DTA. Ally’s Core net income attributable to common shareholders for purposes of calculating Core ROTCE is based on the actual effective tax rate for the period adjusted for significant discrete tax items including tax reserve releases, which aligns with the methodology used in calculating adjusted earnings per share. (1) In the numerator of Core ROTCE, GAAP net income attributable to common shareholders is adjusted for discontinued operations net of tax, tax-effected Core OID, tax- effected repositioning and other which are primarily related to the extinguishment of high cost legacy debt, strategic activities and significant other one-time items, fair value adjustments (net of tax) related to ASU 2016-01 which requires change in the fair value of equity securities to be recognized in current period net income as compared to periods prior to 1/1/18 in which such adjustments were recognized through other comprehensive income, a component of equity, significant discrete tax items, and preferred stock capital actions, as applicable for respective periods. (2) In the denominator, GAAP shareholder’s equity is adjusted for goodwill and identifiable intangibles net of DTL, Core OID balance, and net DTA. 44
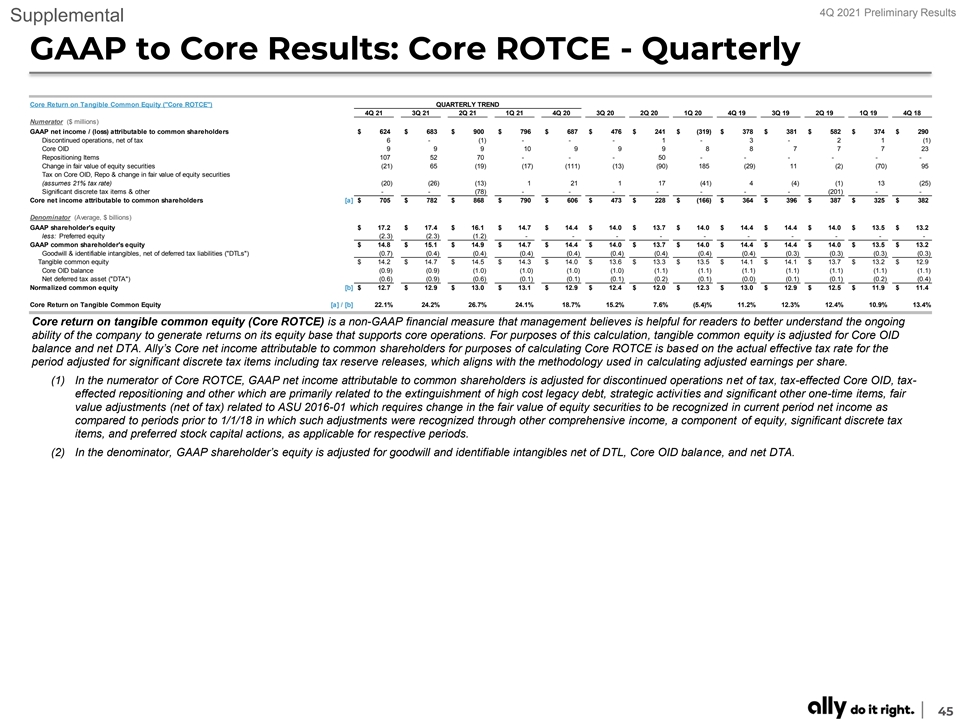
4Q 2021 Preliminary Results Supplemental GAAP to Core Results: Core ROTCE - Quarterly Core Return on Tangible Common Equity ( Core ROTCE ) QUARTERLY TREND 4Q 21 3Q 21 2Q 21 1Q 21 4Q 20 3Q 20 2Q 20 1Q 20 4Q 19 3Q 19 2Q 19 1Q 19 4Q 18 Numerator ($ millions) GAAP net income / (loss) attributable to common shareholders $ 624 $ 683 $ 900 $ 796 $ 687 $ 476 $ 241 $ (319) $ 378 $ 381 $ 582 $ 374 $ 290 Discontinued operations, net of tax 6 - (1) - - - 1 - 3 - 2 1 (1) Core OID 9 9 9 10 9 9 9 8 8 7 7 7 23 Repositioning Items 107 52 70 - - - 50 - - - - - - Change in fair value of equity securities (21) 65 (19) (17) ( 111) (13) (90) 185 (29) 11 (2) (70) 95 Tax on Core OID, Repo & change in fair value of equity securities (assumes 21% tax rate) (20) (26) (13) 1 21 1 17 (41) 4 (4) (1) 13 (25) Significant discrete tax items & other - - (78) - - - - - - - ( 201) - - Core net income attributable to common shareholders [a] $ 705 $ 782 $ 868 $ 790 $ 606 $ 473 $ 228 $ (166) $ 364 $ 396 $ 387 $ 325 $ 382 Denominator (Average, $ billions) GAAP shareholder's equity $ 17.2 $ 17.4 $ 16.1 $ 14.7 $ 14.4 $ 14.0 $ 13.7 $ 14.0 $ 14.4 $ 14.4 $ 14.0 $ 13.5 $ 13.2 less: Preferred equity (2.3) (2.3) (1.2) - - - - - - - - - - GAAP common shareholder's equity $ 14.8 $ 15.1 $ 14.9 $ 14.7 $ 14.4 $ 14.0 $ 13.7 $ 14.0 $ 14.4 $ 14.4 $ 14.0 $ 13.5 $ 13.2 Goodwill & identifiable intangibles, net of deferred tax liabilities ( DTLs ) (0.7) (0.4) (0.4) (0.4) (0.4) (0.4) (0.4) (0.4) (0.4) (0.3) (0.3) (0.3) (0.3) Tangible common equity $ 14.2 $ 14.7 $ 14.5 $ 14.3 $ 14.0 $ 13.6 $ 13.3 $ 13.5 $ 14.1 $ 14.1 $ 13.7 $ 13.2 $ 12.9 Core OID balance (0.9) (0.9) (1.0) (1.0) (1.0) (1.0) (1.1) (1.1) (1.1) (1.1) (1.1) (1.1) (1.1) Net deferred tax asset ( DTA ) (0.6) (0.9) (0.6) (0.1) (0.1) (0.1) (0.2) (0.1) (0.0) (0.1) (0.1) (0.2) (0.4) Normalized common equity [b] $ 12.7 $ 12.9 $ 13.0 $ 13.1 $ 12.9 $ 12.4 $ 12.0 $ 12.3 $ 13.0 $ 12.9 $ 12.5 $ 11.9 $ 11.4 Core Return on Tangible Common Equity [a] / [b] 22.1% 24.2% 26.7% 24.1% 18.7% 15.2% 7.6% (5.4)% 11.2% 12.3% 12.4% 10.9% 13.4% Core return on tangible common equity (Core ROTCE) is a non-GAAP financial measure that management believes is helpful for readers to better understand the ongoing ability of the company to generate returns on its equity base that supports core operations. For purposes of this calculation, tangible common equity is adjusted for Core OID balance and net DTA. Ally’s Core net income attributable to common shareholders for purposes of calculating Core ROTCE is based on the actual effective tax rate for the period adjusted for significant discrete tax items including tax reserve releases, which aligns with the methodology used in calculating adjusted earnings per share. (1) In the numerator of Core ROTCE, GAAP net income attributable to common shareholders is adjusted for discontinued operations net of tax, tax-effected Core OID, tax- effected repositioning and other which are primarily related to the extinguishment of high cost legacy debt, strategic activities and significant other one-time items, fair value adjustments (net of tax) related to ASU 2016-01 which requires change in the fair value of equity securities to be recognized in current period net income as compared to periods prior to 1/1/18 in which such adjustments were recognized through other comprehensive income, a component of equity, significant discrete tax items, and preferred stock capital actions, as applicable for respective periods. (2) In the denominator, GAAP shareholder’s equity is adjusted for goodwill and identifiable intangibles net of DTL, Core OID balance, and net DTA. 45

4Q 2021 Preliminary Results Supplemental GAAP to Core Results: Adjusted Efficiency Ratio - Annual Adjusted Efficiency Ratio FY 2021 FY 2020 FY 2019 FY 2018 FY 2017 FY 2016 FY 2015 Numerator ($ millions) GAAP noninterest expense $ 4,110 $ 3,833 $ 3,429 $ 3,264 $ 3,110 $ 2,939 $ 2,761 Rep and warrant expense - - - 3 - 6 13 Insurance expense (1,061) (1,092) (1,013) ( 955) (950) (940) (879) Repositioning items - (50) - - - (9) (7) Adjusted noninterest expense for efficiency ratio [a] $ 3,049 $ 2,691 $ 2,416 $ 2,312 $ 2,160 $ 1,997 $ 1,888 Denominator ($ millions) Total net revenue $ 8,206 $ 6,686 $ 6,394 $ 5,804 $ 5,765 $ 5,437 $ 4,861 Core OID 38 36 29 86 71 59 59 Insurance revenue (1,404) (1,376) (1,328) (1,035) (1,118) (1,097) (1,090) Repositioning items 131 - - - - 3 342 Adjusted net revenue for efficiency ratio [b] $ 6,970 $ 5,346 $ 5,095 $ 4,855 $ 4,718 $ 4,401 $ 4,172 Adjusted Efficiency Ratio [a] / [b] 43.7% 50.3% 47.4% 47.6% 45.8% 45.4% 45.3% Adjusted efficiency ratio is a non-GAAP financial measure that management believes is helpful to readers in comparing the efficiency of its core banking and lending businesses with those of its peers. (1) In the numerator of Adjusted efficiency ratio, total noninterest expense is adjusted for Rep and warrant expense, Insurance segment expense, and repositioning and other which are primarily related to the extinguishment of high-cost legacy debt, strategic activities and significant other one-time items, as applicable for respective periods. (2) In the denominator, total net revenue is adjusted for Core OID and Insurance segment revenue. See page 24 for the combined ratio for the Insurance segment which management uses as a primary measure of underwriting profitability for the Insurance segment. 46

4Q 2021 Preliminary Results Supplemental GAAP to Core Results: Adjusted Efficiency Ratio - Quarterly Adjusted Efficiency Ratio QUARTERLY TREND 4Q 21 3Q 21 2Q 21 1Q 21 4Q 20 Numerator ($ millions) GAAP noninterest expense $ 1,090 $ 1,002 $ 1,075 $ 943 $ 1,023 Insurance expense ( 263) (273) ( 272) (253) ( 246) Repositioning items - - - - - Adjusted noninterest expense for efficiency ratio [a] $ 827 $ 729 $ 803 $ 690 $ 777 Denominator ($ millions) Total net revenue $ 2,199 $ 1,985 $ 2,085 $ 1,937 $ 1,981 Core OID 9 9 9 10 9 Repositioning items 9 52 70 - - Insurance revenue (354) (297) (359) (394) (429) Adjusted net revenue for the efficiency ratio [b] $ 1,864 $ 1,749 $ 1,805 $ 1,553 $ 1,561 Adjusted Efficiency Ratio [a] / [b] 44.4% 41.7% 44.5% 44.4% 49.8% Adjusted efficiency ratio is a non-GAAP financial measure that management believes is helpful to readers in comparing the efficiency of its core banking and lending businesses with those of its peers. (1) In the numerator of Adjusted efficiency ratio, total noninterest expense is adjusted for Rep and warrant expense, Insurance segment expense, and repositioning and other which are primarily related to the extinguishment of high-cost legacy debt, strategic activities and significant other one-time items, as applicable for respective periods. (2) In the denominator, total net revenue is adjusted for Core OID and Insurance segment revenue. See page 24 for the combined ratio for the Insurance segment which management uses as a primary measure of underwriting profitability for the Insurance segment. 47

4Q 2021 Preliminary Results Supplemental Non-GAAP Reconciliation: Core Income - Annual ($ millions) FY 2021 FY 2020 FY 2019 Core OID & Change in fair Core OID & Change in fair Core OID & Change in fair (1) (1) (1) GAAP Repositioning value of equity Non-GAAP GAAP Repositioning value of equity Non-GAAP GAAP Repositioning value of equity Non-GAAP Items securities Items securities Items securities Consolidated Ally Net financing revenue $ 6,167 $ 38 $ - 6,205 $ 4,703 $ 36 $ - 4,739 $ 4,633 $ 29 $ - $ 4,662 Total other revenue 2,039 131 7 2,177 1,983 - (29) 1 ,954 1 ,761 - (89) 1 ,672 Provision for loan losses 241 97 - 144 1,439 - - 1 ,439 998 - - 998 Noninterest expense 4 ,110 - - 4,110 3,833 (50) - 3,783 3,429 - - 3,429 Pre-tax income / (loss) from continuing operations $ 3,855 $ 265 $ 7 $ 4,128 $ 1,414 $ 86 $ (29) $ 1,470 $ 1,967 $ 29 $ (89) $ 1,907 Corporate / Other Net financing revenue $ 467 $ 38 $ - $ 505 $ (40) $ 36 $ - $ (4) $ 28 $ 29 $ - $ 57 Total other revenue 221 131 1 353 298 - - 298 171 - - 171 Provision for loan losses 151 97 - 54 47 - - 47 (5) - - (5) Noninterest expense 723 - - 723 507 (50) - 457 363 - - 363 Pre-tax income / (loss) from continuing operations $ (186) $ 265 $ 1 $ 81 $ ( 296) $ 86 $ - $ (210) $ ( 159) $ 29 $ - $ ( 130) Insurance Premiums, service revenue earned and other $ 1,129 $ - $ - $ 1,129 $ 1,114 $ - $ - $ 1,114 $ 1,099 $ - $ - $ 1,099 Losses and loss adjustment expenses 261 - - 261 363 - - 363 321 - - 321 Acquisition and underwriting expenses 800 - - 800 729 - - 729 692 - - 692 Investment income and other 275 - 10 285 262 - (31) 231 229 - (88) 141 Pre-tax income / (loss) from continuing operations $ 343 $ - $ 10 $ 353 $ 284 $ - $ (31) $ 253 $ 315 $ - $ (88) $ 227 Corporate Finance Net financing revenue $ 308 $ - $ - $ 308 $ 299 $ - $ - $ 299 $ 239 $ - $ - $ 239 Total other revenue 128 - (4) 124 45 - 1 46 45 - ( 2) 43 Provision for loan losses 38 - - 38 149 - - 149 36 - - 36 Noninterest expense 116 - - 116 107 - - 107 95 - - 95 Pre-tax income / (loss) from continuing operations $ 282 $ - $ (4) $ 278 $ 88 $ - $ 1 $ 89 $ 153 $ - $ (2) $ 151 (1) Non-GAAP line items walk to Core pre-tax income, a non-GAAP financial measure that adjusts pre-tax income. See pages 35 and 36 for definitions. Note: Equity fair value adjustments related to ASU 2016-01 requires change in the fair value of equity securities to be recognized in current period net income as compared to periods prior to 1/1/18 in which such adjustments were recognized through other comprehensive income, a component of equity. 48

4Q 2021 Preliminary Results Non-GAAP Reconciliation: Core Income - Annual ($ millions) FY 2018 FY 2017 FY 2016 FY 2015 Core OID & Change in fair Core OID & Change in fair Core OID & Change in fair Core OID & Change in fair (1) (1) (1) (1) GAAP Repositioning value of equity Non-GAAP GAAP Repositioning value of equity Non-GAAP GAAP Repositioning value of equity Non-GAAP GAAP Repositioning value of equity Non-GAAP Items securities Items securities Items securities Items securities Consolidated Ally Net financing revenue $ 4,390 $ 86 $ - $ 4,476 $ 4,221 $ 71 $ - $ 4,292 $ 3,907 $ 57 $ - $ 3,964 $ 3,719 $ 45 $ - $ 3,764 Total other revenue 1,414 - 121 1,535 1,544 - - 1 ,544 1 ,530 4 - 1 ,534 1,142 356 - 1,498 Provision for loan losses 918 - - 918 1 ,148 - - 1,148 917 - - 917 707 - - 707 Noninterest expense 3,264 - - 3 ,264 3 ,110 - - 3,110 2 ,939 (9) - 2 ,931 2,761 (7) - 2,754 Pre-tax income / (loss) from continuing operations $ 1,622 $ 86 $ 121 $ 1,829 $ 1,507 $ 71 $ - $ 1,578 $ 1,581 $ 70 $ - $ 1,651 $ 1,393 $ 408 $ - $ 1,801 Corporate / Other Net financing revenue $ 184 $ 86 $ - $ 270 $ 150 $ 71 $ - $ 221 $ (37) $ 57 $ - $ 20 $ 87 $ 45 $ - $ 132 Total other revenue 119 - - 119 81 - - 81 162 4 - 166 (151) 356 - 205 Provision for loan losses (15) - - (15) (16) - - (16) (13) - - (13) (5) - - (5) Noninterest expense 333 - - 333 262 - - 262 199 (9) - 190 155 (7) - 148 Pre-tax income / (loss) from continuing operations $ (15) $ 86 $ - $ 71 $ (15) $ 71 $ - $ 56 $ (61) $ 70 $ - $ 9 $ ( 214) $ 408 $ - $ 194 Insurance Premiums, service revenue earned and other $ 1,032 $ - $ - $ 1,032 $ 981 $ - $ - $ 981 $ 952 $ - $ - $ 952 $ 948 $ - $ - $ 948 Losses and loss adjustment expenses 295 - - 295 332 - - 332 342 - - 342 293 - - 293 Acquisition and underwriting expenses 660 - - 660 618 - - 618 598 - - 598 586 - - 586 Investment income and other 3 - 112 115 137 - - 137 145 - - 145 142 - - 142 Pre-tax income / (loss) from continuing operations $ 80 $ - $ 112 $ 192 $ 168 $ - $ - $ 168 $ 157 $ - $ - $ 157 $ 211 $ - $ - $ 211 Corporate Finance Net financing revenue $ 204 $ - $ - $ 204 $ 167 $ - $ - $ 167 $ 121 $ - $ - $ 121 $ 89 $ - $ - $ 89 Total other revenue 38 - 9 47 45 - - 45 26 - - 26 25 - - 25 Provision for loan losses 12 - - 12 22 - - 22 10 - - 10 9 - - 9 Noninterest expense 86 - - 86 76 - - 76 66 - - 66 55 - - 55 Pre-tax income / (loss) from continuing operations $ 144 $ - $ 9 $ 153 $ 114 $ - $ - $ 114 $ 71 $ - $ - $ 71 $ 50 $ - $ - $ 50 (1) Non-GAAP line items walk to Core pre-tax income, a non-GAAP financial measure that adjusts pre-tax income. See pages 35 and 36 for definitions. Note: Equity fair value adjustments related to ASU 2016-01 requires change in the fair value of equity securities to be recognized in current period net income as compared to periods prior to 1/1/18 in which such adjustments were recognized through other comprehensive income, a component of equity. 49

4Q 2021 Preliminary Results Supplemental Non-GAAP Reconciliation: Core Income - Quarterly ($ millions) 4Q 21 3Q 21 4Q 20 Change in fair Change in fair Change in fair (1) (1) (1) GAAP Core OID value of equity Repositioning Non-GAAP GAAP Core OID value of equity Repositioning Non-GAAP GAAP Core OID value of equity Repositioning Non-GAAP securities securities securities Consolidated Ally Net financing revenue $ 1,654 $ 9 $ - $ - 1,663 $ 1,594 $ 9 $ - $ - $ 1,603 $ 1,303 $ 9 $ - $ - $ 1,312 Total other revenue 545 - ( 21) 9 533 391 - 65 52 507 678 - (111) - 567 Provision for credit losses 210 - - 97 113 76 - - - 76 102 - - - 102 Noninterest expense 1,090 - - - 1,090 1 ,002 - - - 1,002 1,023 - - - 1,023 Pre-tax income / (loss) $ 899 $ 9 $ (21) $ 107 $ 994 $ 907 $ 9 $ 65 $ 52 $ 1,032 $ 856 $ 9 $ ( 111) $ - $ 754 Corporate / Other Net financing revenue $ 173 $ 9 $ - $ - $ 182 $ 138 $ 9 $ - $ - $ 147 $ 43 $ 9 $ - $ - $ 52 Total other revenue 73 - 1 9 83 12 - 1 52 64 147 - - - 147 Provision for credit losses 131 - - 97 34 16 - - - 16 4 - - - 4 Noninterest expense 222 - - - 222 143 - - - 143 147 - - - 147 Pre-tax income / (loss) $ (107) $ 9 $ 1 $ 107 $ 10 $ (9) $ 9 $ 1 $ 52 $ 52 $ 39 $ 9 $ - $ - $ 48 Insurance Premiums, service revenue earned and other $ 283 $ - $ - $ - $ 283 $ 282 $ - $ - $ - $ 282 $ 290 $ - $ - $ - $ 290 Losses and loss adjustment expenses 55 - - - 55 69 - - - 69 62 - - - 62 Acquisition and underwriting expenses 208 - - - 208 204 - - - 204 184 - - - 184 Investment income and other 71 - (24) - 47 15 - 65 - 80 139 - (111) - 28 Pre-tax income / (loss) $ 91 $ - $ (24) $ - $ 67 $ 24 $ - $ 65 $ - $ 89 $ 183 $ - $ ( 111) $ - $ 72 Corporate Finance Net financing revenue $ 83 $ - $ - $ - $ 83 $ 77 $ - $ - $ - $ 77 $ 79 $ - $ - $ - $ 79 Total other revenue 53 - 2 - 55 16 - (1) - 15 17 - ( 1) - 16 Provision for credit losses 33 - - - 33 5 - - - 5 9 - - - 9 Noninterest expense 30 - - - 30 27 - - - 27 23 - - - 23 Pre-tax income / (loss) $ 73 $ - $ 2 $ - $ 75 $ 61 $ - $ (1) $ - $ 60 $ 64 $ - $ (1) $ - $ 63 (1) Non-GAAP line items walk to Core pre-tax income, a non-GAAP financial measure that adjusts pre-tax income. See pages 35 and 36 for definitions. Note: Equity fair value adjustments related to ASU 2016-01 requires change in the fair value of equity securities to be recognized in current period net income as compared to periods prior to 1/1/18 in which such adjustments were recognized through other comprehensive income, a component of equity. 50
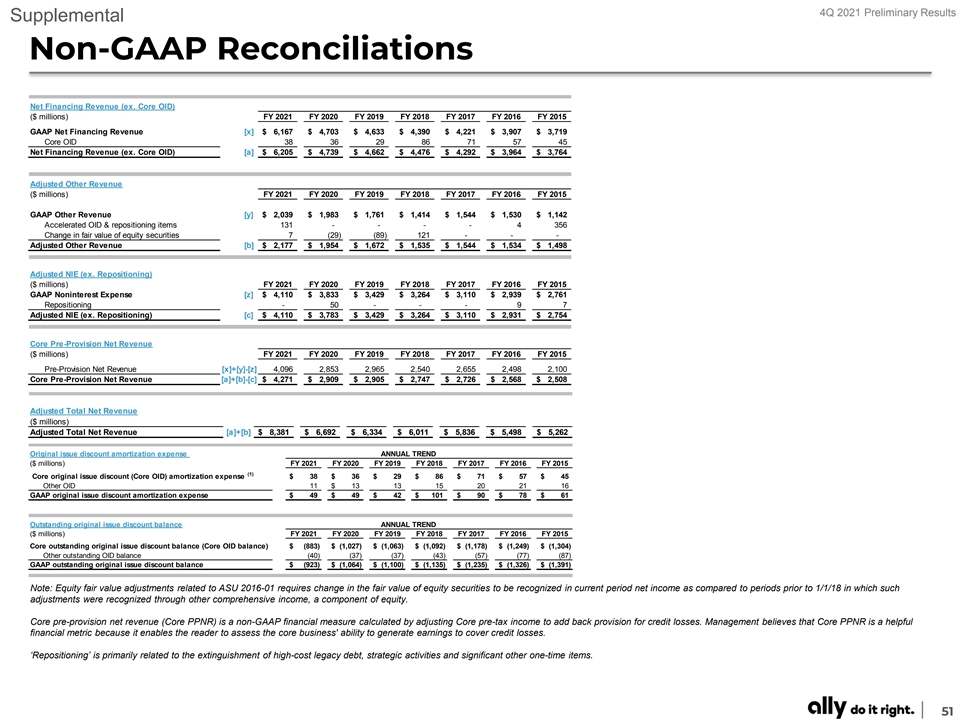
4Q 2021 Preliminary Results Supplemental Non-GAAP Reconciliations Net Financing Revenue (ex. Core OID) ($ millions) FY 2021 FY 2020 FY 2019 FY 2018 FY 2017 FY 2016 FY 2015 GAAP Net Financing Revenue [x] $ 6,167 $ 4,703 $ 4,633 $ 4 ,390 $ 4,221 $ 3 ,907 $ 3,719 Core OID 38 36 29 86 71 57 45 Net Financing Revenue (ex. Core OID) [a] $ 6,205 $ 4 ,739 $ 4,662 $ 4 ,476 $ 4 ,292 $ 3 ,964 $ 3,764 Adjusted Other Revenue ($ millions) FY 2021 FY 2020 FY 2019 FY 2018 FY 2017 FY 2016 FY 2015 GAAP Other Revenue [y] $ 2,039 $ 1 ,983 $ 1 ,761 $ 1,414 $ 1,544 $ 1,530 $ 1 ,142 Accelerated OID & repositioning items 131 - - - - 4 356 Change in fair value of equity securities 7 (29) (89) 121 - - - Adjusted Other Revenue [b] $ 2 ,177 $ 1 ,954 $ 1,672 $ 1 ,535 $ 1,544 $ 1 ,534 $ 1 ,498 Adjusted NIE (ex. Repositioning) ($ millions) FY 2021 FY 2020 FY 2019 FY 2018 FY 2017 FY 2016 FY 2015 GAAP Noninterest Expense [z] $ 4 ,110 $ 3 ,833 $ 3,429 $ 3,264 $ 3,110 $ 2,939 $ 2 ,761 Repositioning - 50 - - - 9 7 Adjusted NIE (ex. Repositioning) [c] $ 4 ,110 $ 3 ,783 $ 3,429 $ 3,264 $ 3 ,110 $ 2,931 $ 2 ,754 Core Pre-Provision Net Revenue ($ millions) FY 2021 FY 2020 FY 2019 FY 2018 FY 2017 FY 2016 FY 2015 Pre-Provision Net Revenue [x]+[y]-[z] 4,096 2,853 2,965 2,540 2,655 2,498 2,100 Core Pre-Provision Net Revenue [a]+[b]-[c] $ 4 ,271 $ 2,909 $ 2,905 $ 2,747 $ 2 ,726 $ 2 ,568 $ 2 ,508 Adjusted Total Net Revenue ($ millions) Adjusted Total Net Revenue [a]+[b] $ 8,381 $ 6,692 $ 6 ,334 $ 6,011 $ 5,836 $ 5,498 $ 5 ,262 Original issue discount amortization expense ANNUAL TREND ($ millions) FY 2021 FY 2020 FY 2019 FY 2018 FY 2017 FY 2016 FY 2015 (1) Core original issue discount (Core OID) amortization expense $ 38 $ 36 $ 29 $ 86 $ 71 $ 57 $ 45 Other OID 11 $ 13 13 15 20 21 16 GAAP original issue discount amortization expense $ 49 $ 49 $ 42 $ 101 $ 90 $ 78 $ 61 Outstanding original issue discount balance ANNUAL TREND ($ millions) FY 2021 FY 2020 FY 2019 FY 2018 FY 2017 FY 2016 FY 2015 Core outstanding original issue discount balance (Core OID balance) $ (883) $ (1,027) $ ( 1,063) $ ( 1,092) $ ( 1,178) $ (1,249) $ ( 1,304) Other outstanding OID balance (40) (37) (37) (43) (57) (77) (87) GAAP outstanding original issue discount balance $ (923) $ (1,064) $ ( 1,100) $ ( 1,135) $ ( 1,235) $ ( 1,326) $ ( 1,391) Note: Equity fair value adjustments related to ASU 2016-01 requires change in the fair value of equity securities to be recognized in current period net income as compared to periods prior to 1/1/18 in which such adjustments were recognized through other comprehensive income, a component of equity. Core pre-provision net revenue (Core PPNR) is a non-GAAP financial measure calculated by adjusting Core pre-tax income to add back provision for credit losses. Management believes that Core PPNR is a helpful financial metric because it enables the reader to assess the core business' ability to generate earnings to cover credit losses. ‘Repositioning’ is primarily related to the extinguishment of high-cost legacy debt, strategic activities and significant other one-time items. 51
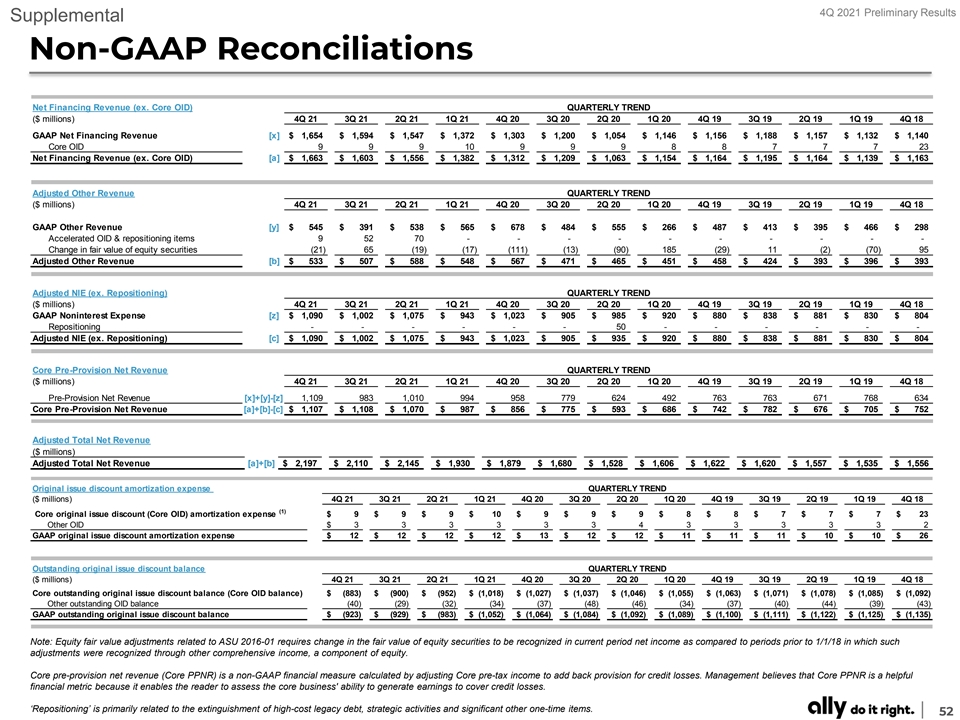
4Q 2021 Preliminary Results Supplemental Non-GAAP Reconciliations Net Financing Revenue (ex. Core OID) QUARTERLY TREND ($ millions) 4Q 21 3Q 21 2Q 21 1Q 21 4Q 20 3Q 20 2Q 20 1Q 20 4Q 19 3Q 19 2Q 19 1Q 19 4Q 18 GAAP Net Financing Revenue [x] $ 1 ,654 $ 1 ,594 $ 1 ,547 $ 1,372 $ 1,303 $ 1 ,200 $ 1 ,054 $ 1,146 $ 1 ,156 $ 1 ,188 $ 1 ,157 $ 1,132 $ 1 ,140 Core OID 9 9 9 10 9 9 9 8 8 7 7 7 23 Net Financing Revenue (ex. Core OID) [a] $ 1 ,663 $ 1,603 $ 1 ,556 $ 1 ,382 $ 1 ,312 $ 1,209 $ 1,063 $ 1 ,154 $ 1 ,164 $ 1,195 $ 1 ,164 $ 1 ,139 $ 1,163 Adjusted Other Revenue QUARTERLY TREND ($ millions) 4Q 21 3Q 21 2Q 21 1Q 21 4Q 20 3Q 20 2Q 20 1Q 20 4Q 19 3Q 19 2Q 19 1Q 19 4Q 18 GAAP Other Revenue [y] $ 545 $ 391 $ 538 $ 565 $ 678 $ 484 $ 555 $ 266 $ 487 $ 413 $ 395 $ 466 $ 298 Accelerated OID & repositioning items 9 52 70 - - - - - - - - - - Change in fair value of equity securities (21) 65 (19) (17) (111) (13) (90) 185 (29) 11 (2) (70) 95 Adjusted Other Revenue [b] $ 533 $ 507 $ 588 $ 548 $ 567 $ 471 $ 465 $ 451 $ 458 $ 424 $ 393 $ 396 $ 393 Adjusted NIE (ex. Repositioning) QUARTERLY TREND ($ millions) 4Q 21 3Q 21 2Q 21 1Q 21 4Q 20 3Q 20 2Q 20 1Q 20 4Q 19 3Q 19 2Q 19 1Q 19 4Q 18 GAAP Noninterest Expense [z] $ 1,090 $ 1,002 $ 1 ,075 $ 943 $ 1,023 $ 905 $ 985 $ 920 $ 880 $ 838 $ 881 $ 830 $ 804 Repositioning - - - - - - 50 - - - - - - Adjusted NIE (ex. Repositioning) [c] $ 1 ,090 $ 1 ,002 $ 1 ,075 $ 943 $ 1,023 $ 905 $ 935 $ 920 $ 880 $ 838 $ 881 $ 830 $ 804 Core Pre-Provision Net Revenue QUARTERLY TREND ($ millions) 4Q 21 3Q 21 2Q 21 1Q 21 4Q 20 3Q 20 2Q 20 1Q 20 4Q 19 3Q 19 2Q 19 1Q 19 4Q 18 Pre-Provision Net Revenue [x]+[y]-[z] 1,109 983 1,010 994 958 779 624 492 763 763 671 768 634 Core Pre-Provision Net Revenue [a]+[b]-[c] $ 1 ,107 $ 1 ,108 $ 1 ,070 $ 987 $ 856 $ 775 $ 593 $ 686 $ 742 $ 782 $ 676 $ 705 $ 752 Adjusted Total Net Revenue ($ millions) Adjusted Total Net Revenue [a]+[b] $ 2,197 $ 2,110 $ 2,145 $ 1 ,930 $ 1,879 $ 1,680 $ 1,528 $ 1,606 $ 1 ,622 $ 1 ,620 $ 1,557 $ 1 ,535 $ 1 ,556 Original issue discount amortization expense QUARTERLY TREND ($ millions) 4Q 21 3Q 21 2Q 21 1Q 21 4Q 20 3Q 20 2Q 20 1Q 20 4Q 19 3Q 19 2Q 19 1Q 19 4Q 18 (1) Core original issue discount (Core OID) amortization expense $ 9 $ 9 $ 9 $ 10 $ 9 $ 9 $ 9 $ 8 $ 8 $ 7 $ 7 $ 7 $ 23 Other OID $ 3 3 3 3 3 3 4 3 3 3 3 3 2 GAAP original issue discount amortization expense $ 12 $ 12 $ 12 $ 12 $ 13 $ 12 $ 12 $ 11 $ 11 $ 11 $ 10 $ 10 $ 26 Outstanding original issue discount balance QUARTERLY TREND ($ millions) 4Q 21 3Q 21 2Q 21 1Q 21 4Q 20 3Q 20 2Q 20 1Q 20 4Q 19 3Q 19 2Q 19 1Q 19 4Q 18 Core outstanding original issue discount balance (Core OID balance) $ (883) $ (900) $ (952) $ ( 1,018) $ ( 1,027) $ (1,037) $ ( 1,046) $ ( 1,055) $ (1,063) $ (1,071) $ (1,078) $ (1,085) $ (1,092) Other outstanding OID balance (40) (29) (32) (34) (37) (48) (46) (34) (37) (40) (44) (39) (43) GAAP outstanding original issue discount balance $ (923) $ (929) $ (983) $ (1,052) $ ( 1,064) $ ( 1,084) $ ( 1,092) $ (1,089) $ ( 1,100) $ ( 1,111) $ ( 1,122) $ (1,125) $ (1,135) Note: Equity fair value adjustments related to ASU 2016-01 requires change in the fair value of equity securities to be recognized in current period net income as compared to periods prior to 1/1/18 in which such adjustments were recognized through other comprehensive income, a component of equity. Core pre-provision net revenue (Core PPNR) is a non-GAAP financial measure calculated by adjusting Core pre-tax income to add back provision for credit losses. Management believes that Core PPNR is a helpful financial metric because it enables the reader to assess the core business' ability to generate earnings to cover credit losses. ‘Repositioning’ is primarily related to the extinguishment of high-cost legacy debt, strategic activities and significant other one-time items. 52