
Exhibit 99.2 Ally Financial Inc. 1Q 2024 Earnings Review April 18, 2024 Contact Ally Investor Relations at (866) 710-4623 or investor.relations@ally.com

1Q 2024 Preliminary Results Forward-Looking Statements and Additional Information This presentation and related communications should be read in conjunction with the financial statements, notes, and other information contained in our Annual Reports on Form 10-K, Quarterly Reports on Form 10-Q, and Current Reports on Form 8-K. This information is preliminary and based on company and third-party data available at the time of the presentation or related communication. This presentation and related communications contain forward-looking statements within the meaning of the Private Securities Litigation Reform Act of 1995. These statements can be identified by the fact that they do not relate strictly to historical or current facts—such as statements about the outlook for financial and operating metrics and performance and future capital allocation and actions. Forward-looking statements often use words such as “believe,” “expect,” “anticipate,” “intend,” “pursue,” “seek,” “continue,” “estimate,” “project,” “outlook,” “forecast,” “potential,” “target,” “objective,” “trend,” “plan,” “goal,” “initiative,” “priorities,” or other words of comparable meaning or future-tense or conditional verbs such as “may,” “will,” “should,” “would,” or “could.” Forward-looking statements convey our expectations, intentions, or forecasts about future events, circumstances, or results. All forward-looking statements, by their nature, are subject to assumptions, risks, and uncertainties, which may change over time and many of which are beyond our control. You should not rely on any forward-looking statement as a prediction or guarantee about the future. Actual future objectives, strategies, plans, prospects, performance, conditions, or results may differ materially from those set forth in any forward-looking statement. Some of the factors that may cause actual results or other future events or circumstances to differ from those in forward-looking statements are described in our Annual Report on Form 10-K for the year ended December 31, 2023, our subsequent Quarterly Reports on Form 10-Q or Current Reports on Form 8-K, or other applicable documents that are filed or furnished with the U.S. Securities and Exchange Commission (collectively, our “SEC filings”). Any forward-looking statement made by us or on our behalf speaks only as of the date that it was made. We do not undertake to update any forward-looking statement to reflect the impact of events, circumstances, or results that arise after the date that the statement was made, except as required by applicable securities laws. You, however, should consult further disclosures (including disclosures of a forward-looking nature) that we may make in any subsequent SEC filings. This presentation and related communications contain specifically identified non-GAAP financial measures, which supplement the results that are reported according to U.S. generally accepted accounting principles (“GAAP”). These non-GAAP financial measures may be useful to investors but should not be viewed in isolation from, or as a substitute for, GAAP results. Differences between non-GAAP financial measures and comparable GAAP financial measures are reconciled in the presentation. Unless the context otherwise requires, the following definitions apply. The term “loans” means the following consumer and commercial products associated with our direct and indirect financing activities: loans, retail installment sales contracts, lines of credit, and other financing products excluding operating leases. The term “operating leases” means consumer- and commercial-vehicle lease agreements where Ally is the lessor and the lessee is generally not obligated to acquire ownership of the vehicle at lease-end or compensate Ally for the vehicle’s residual value. The terms “lend,” “finance,” and “originate” mean our direct extension or origination of loans, our purchase or acquisition of loans, or our purchase of operating leases, as applicable. The term “consumer” means all consumer products associated with our loan and operating-lease activities and all commercial retail installment sales contracts. The term “commercial” means all commercial products associated with our loan activities, other than commercial retail installment sales contracts. The term “partnerships” means business arrangements rather than partnerships as defined by law. 2
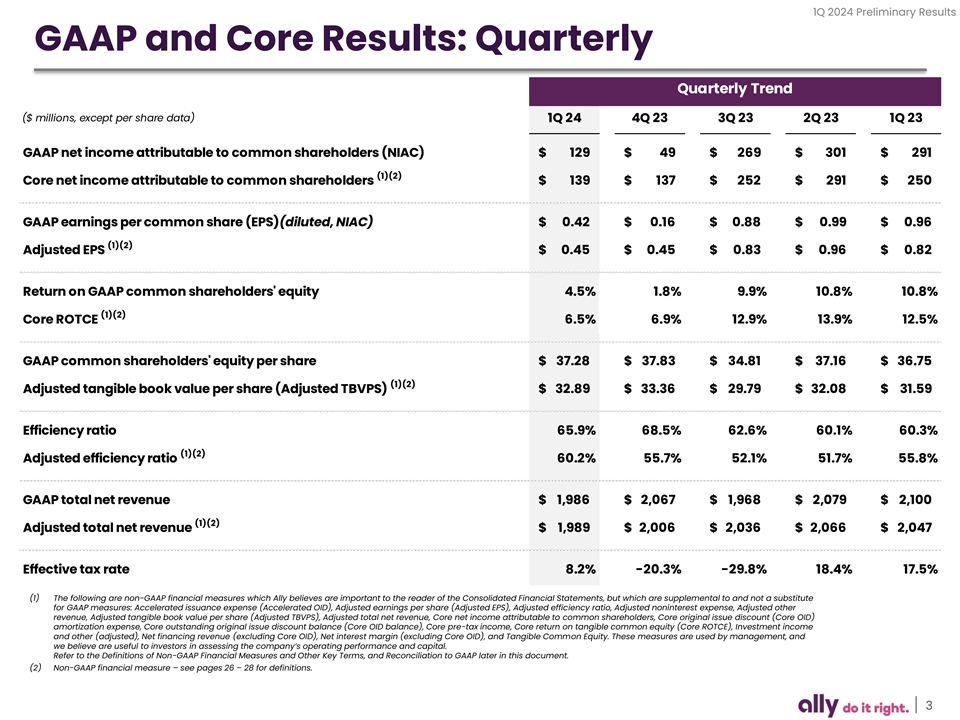
1Q 2024 Preliminary Results GAAP and Core Results: Quarterly Quarterly Trend ($ millions, except per share data) 1Q 24 4Q 23 3Q 23 2Q 23 1Q 23 GAAP net income attributable to common shareholders (NIAC) $ 1 29 $ 49 $ 269 $ 301 $ 2 91 (1)(2) Core net income attributable to common shareholders $ 1 39 $ 137 $ 252 $ 2 91 $ 250 GAAP earnings per common share (EPS)(diluted, NIAC) $ 0 .42 $ 0 .16 $ 0.88 $ 0.99 $ 0 .96 (1)(2) Adjusted EPS $ 0.45 $ 0.45 $ 0 .83 $ 0 .96 $ 0 .82 Return on GAAP common shareholders' equity 4.5% 1.8% 9.9% 10.8% 10.8% (1)(2) Core ROTCE 6.5% 6.9% 12.9% 13.9% 12.5% GAAP common shareholders' equity per share $ 37.28 $ 37.83 $ 34.81 $ 37.16 $ 36.75 (1)(2) Adjusted tangible book value per share (Adjusted TBVPS) $ 32.89 $ 33.36 $ 2 9.79 $ 32.08 $ 31.59 Efficiency ratio 65.9% 68.5% 62.6% 60.1% 60.3% (1)(2) Adjusted efficiency ratio 60.2% 55.7% 52.1% 51.7% 55.8% GAAP total net revenue $ 1,986 $ 2,067 $ 1,968 $ 2,079 $ 2,100 (1)(2) Adjusted total net revenue $ 1,989 $ 2,006 $ 2 ,036 $ 2,066 $ 2,047 Effective tax rate 8.2% -20.3% -29.8% 18.4% 17.5% (1) The following are non-GAAP financial measures which Ally believes are important to the reader of the Consolidated Financial Statements, but which are supplemental to and not a substitute for GAAP measures: Accelerated issuance expense (Accelerated OID), Adjusted earnings per share (Adjusted EPS), Adjusted efficiency ratio, Adjusted noninterest expense, Adjusted other revenue, Adjusted tangible book value per share (Adjusted TBVPS), Adjusted total net revenue, Core net income attributable to common shareholders, Core original issue discount (Core OID) amortization expense, Core outstanding original issue discount balance (Core OID balance), Core pre-tax income, Core return on tangible common equity (Core ROTCE), Investment income and other (adjusted), Net financing revenue (excluding Core OID), Net interest margin (excluding Core OID), and Tangible Common Equity. These measures are used by management, and we believe are useful to investors in assessing the company’s operating performance and capital. Refer to the Definitions of Non-GAAP Financial Measures and Other Key Terms, and Reconciliation to GAAP later in this document. (2) Non-GAAP financial measure – see pages 26 – 28 for definitions. 3

1Q 2024 Preliminary Results Purpose-Driven Culture Powered by our “LEAD” core values and “Do it Right” approach L E A D Look Execute with Act with Deliver externally excellence professionalism results Communities Employees Customers Make an impact in the Invest in our people and “Do It Right” culture of communities in which we culture to drive purpose customer obsession live and work Delivering long-term value for all stakeholders 4

1Q 2024 Preliminary Results 1Q 2024 Quarterly Highlights $0.42 | $0.45 4.5% | 6.5% $2.0B | $2.0B 3.16% | 10.92% GAAP Adjusted Return on Core GAAP Adj. Total NIM Est. Retail (1) (1) (1) (2) (3) EPS EPS Common Equity RoTCE Net Revenue Net Revenue (ex. OID) Originated Yield 1Q Notable Items • Announced Michael Rhodes as CEO starting April 29 • Successfully closed sale of Ally Lending; total CET1 benefit of ~15bps • Deconsolidated $1.1 billion of retail auto loans through securitization market; CET1 benefit of 6bps, and includes a $15 million pre-tax earnings benefit recognized through provision expense • Revised FDIC special assessment; incremental fee of ~$10 million in 1Q ’24 – excluded from adjusted metrics 1Q Operational Highlights • Record 3.8 million consumer auto applications driving $9.8 billion of origination volume Dealer (3) • Retail auto originated yield of 10.92% with 40% of volume within highest credit quality tier Financial • 227bps retail auto net charge-offs, in-line with guidance Services • Insurance earned premiums of $349 million; continued momentum with new P&C OEM relationships • $145.1 billion of retail deposits, up $2.9 billion sourced from 3.1 million retail depositors, up 103 thousand QoQ Consumer & • 1.2 million active credit cardholders; balanced approach to growth with compelling return profile Commercial (4) Banking • Corporate Finance HFI portfolio of $10.1 billion and record 1Q profitability; 25-year anniversary (1) Non-GAAP financial measure. See pages 26 - 28 for definitions. (2) Calculated using a Non-GAAP financial measure. See pages 26 – 28 for definitions. (3) Estimated Retail Auto Originated Yield is a forward-looking financial measure. See page 29 for details. (4) Consumer and Commercial Banking activity is within ‘Corporate and Other’ and ‘Corporate Finance’. Note: Ally Bank, Member FDIC and Equal Housing Lender, which offers mortgage lending, and a variety of deposit and other banking products, a consumer credit card business, a corporate finance business for equity sponsors and middle-market companies. Additionally, we offer securities-brokerage and investment advisory services through Ally Invest. 5
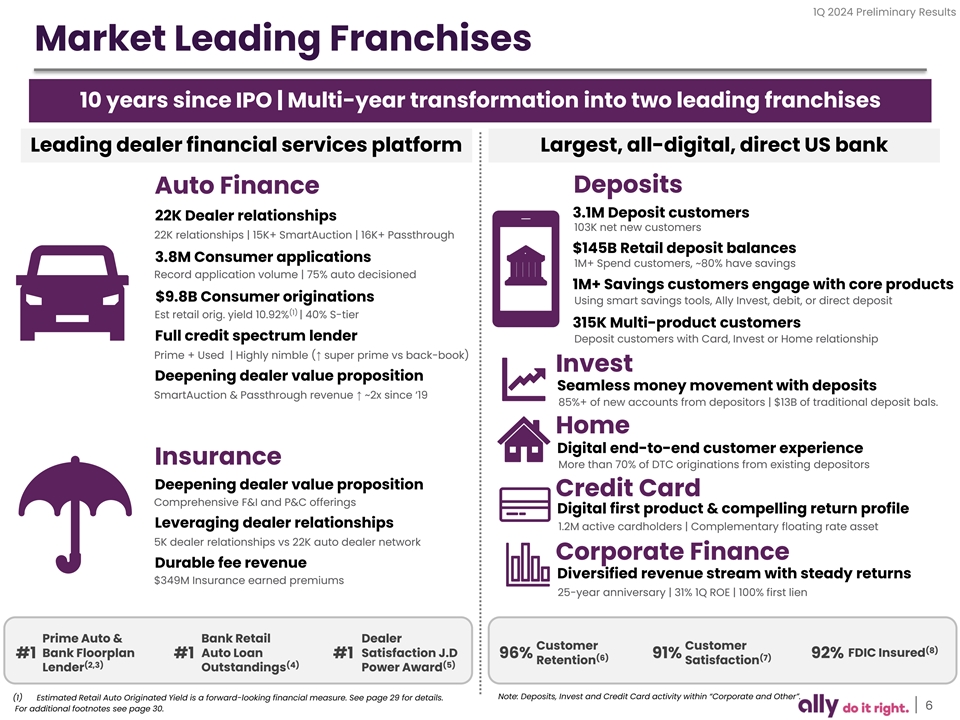
1Q 2024 Preliminary Results Market Leading Franchises 10 years since IPO | Multi-year transformation into two leading franchises Leading dealer financial services platform Largest, all-digital, direct US bank Auto Finance Deposits 3.1M Deposit customers 22K Dealer relationships 103K net new customers 22K relationships | 15K+ SmartAuction | 16K+ Passthrough $145B Retail deposit balances 3.8M Consumer applications 1M+ Spend customers, ~80% have savings Record application volume | 75% auto decisioned 1M+ Savings customers engage with core products $9.8B Consumer originations Using smart savings tools, Ally Invest, debit, or direct deposit (1) Est retail orig. yield 10.92% | 40% S-tier 315K Multi-product customers Full credit spectrum lender Deposit customers with Card, Invest or Home relationship Prime + Used | Highly nimble (↑ super prime vs back-book) Invest Deepening dealer value proposition Seamless money movement with deposits SmartAuction & Passthrough revenue ↑ ~2x since ‘19 85%+ of new accounts from depositors | $13B of traditional deposit bals. Home Digital end-to-end customer experience Insurance More than 70% of DTC originations from existing depositors Deepening dealer value proposition Credit Card Comprehensive F&I and P&C offerings Digital first product & compelling return profile Leveraging dealer relationships 1.2M active cardholders | Complementary floating rate asset 5K dealer relationships vs 22K auto dealer network Corporate Finance Durable fee revenue Diversified revenue stream with steady returns $349M Insurance earned premiums 25-year anniversary | 31% 1Q ROE | 100% first lien Prime Auto & Bank Retail Dealer Customer Customer (8) Bank Floorplan Auto Loan Satisfaction J.D FDIC Insured #1 #1 #1 96% 91% 92% (6) (7) Retention Satisfaction (2,3) (4) (5) Lender Outstandings Power Award Note: Deposits, Invest and Credit Card activity within “Corporate and Other”. (1) Estimated Retail Auto Originated Yield is a forward-looking financial measure. See page 29 for details. 6 For additional footnotes see page 30.

1Q 2024 Preliminary Results 1Q 2024 Financial Results Consolidated Income Statement - Quarterly Results Increase / (Decrease) vs. ($ millions; except per share data) 1Q 24 4Q 23 1Q 23 4Q 23 1Q 23 Net financing revenue $ 1,456 $ 1,493 $ 1,602 $ (37) $ (146) (1) 13 13 11 1 2 Core OID (1) 1,469 1,506 1 ,613 (36) (144) Net financing revenue (ex. Core OID) Other revenue $ 530 $ 574 $ 498 $ (44) $ 32 (2) (11) (74) (65) 63 54 Change in fair value of equity securities (1) Adjusted other revenue 5 19 500 433 19 86 Provision for credit losses $ 507 $ 587 $ 446 $ (80) $ 61 Memo: Net charge-offs 539 623 409 (84) 130 Includes $15M pre-tax benefit from retail auto loan sale Memo: Provision build / (release) (32) (36) 37 4 (69) (3) - 16 - (16) - Ally Lending Repositioning Items (1) 507 6 03 446 (96) 61 Adjusted provision for credit losses Noninterest expense $ 1,308 $ 1,416 $ 1,266 $ (108) $ 42 (2) FDIC Special Assessment (10) (38) - 28 (10) Repositioning Items (3) - (149) - 149 - Ally Lending Repositioning Items (1) 1 ,298 1 ,229 1,266 69 32 Adjusted noninterest expense Pre-tax income $ 171 $ 64 $ 388 $ 107 $ (217) Income tax expense / (benefit) 14 (13) 68 27 (54) Net income (loss) from discontinued operations - (1) (1) 1 1 Net income $ 157 $ 76 $ 319 $ 81 $ ( 162) Preferred dividends 28 27 28 1 - Net income attributable to common shareholders $ 129 $ 49 $ 291 $ 80 $ (162) GAAP EPS (diluted) $ 0.42 $ 0 .16 $ 0.96 $ 0.26 $ (0.54) (1) 0.03 0.03 0.03 0.00 0.00 Core OID, net of tax (2) (0.03) (0.19) ( 0.17) 0 .16 0 .14 Change in fair value of equity securities, net of tax (2) 0.02 0.10 0.00 (0.08) 0 .02 Repositioning, discontinued ops., and other, net of tax (3) - 0.34 - (0.34) 0 .34 Repositioning items (Ally Lending) (1) $ 0 .45 $ 0.45 $ 0.82 $ 0.00 $ ( 0.37) Adjusted EPS (1) Non-GAAP financial measure. See pages 26 – 28 for definitions. (2) Contains Non-GAAP financial measures and other financial measures. See pages 26 – 28 for definitions. (3) Repositioning items related to pending sale of Ally Lending in 4Q 2023. Contains Non-GAAP financial measures and other financial measures. See pages 26 – 28 for definitions. Note: Repositioning items excluding Ally Lending represent FDIC special assessment fee in 1Q ’24 and 4Q ’23 7
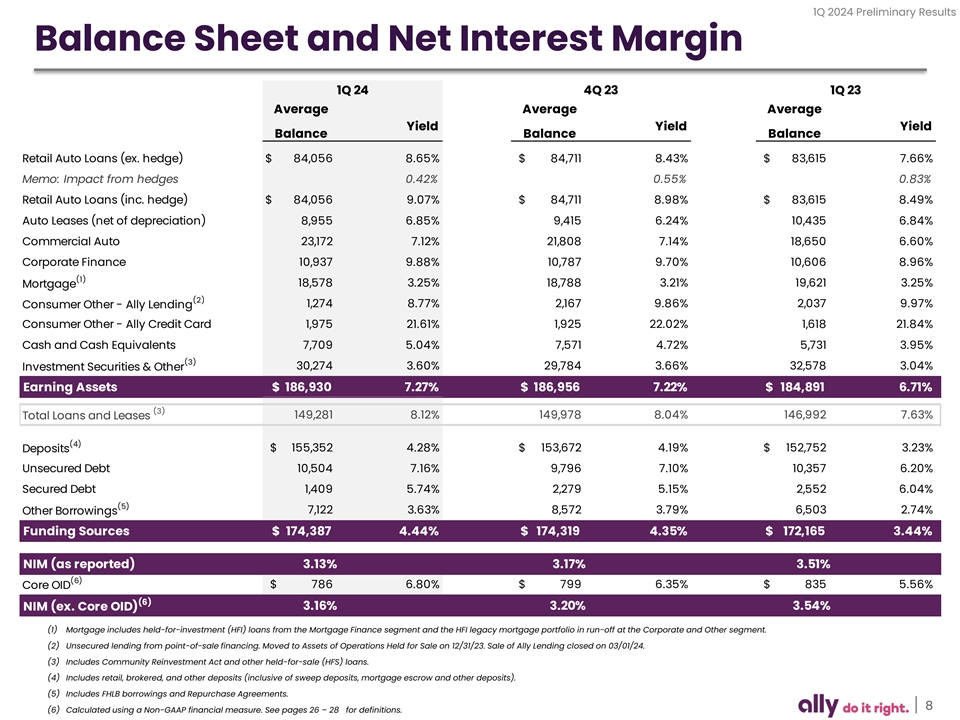
1Q 2024 Preliminary Results Balance Sheet and Net Interest Margin 1Q 24 4Q 23 1Q 23 Average Average Average Yield Yield Yield Balance Balance Balance Retail Auto Loans (ex. hedge) $ 84,056 8.65% $ 8 4,711 8.43% $ 83,615 7.66% Memo: Impact from hedges 0.42% 0.55% 0.83% Retail Auto Loans (inc. hedge) $ 8 4,056 9.07% $ 8 4,711 8.98% $ 83,615 8.49% Auto Leases (net of depreciation) 8 ,955 6.85% 9,415 6.24% 10,435 6.84% Commercial Auto 2 3,172 7.12% 2 1,808 7.14% 18,650 6.60% Corporate Finance 10,937 9.88% 10,787 9.70% 10,606 8.96% (1) 1 8,578 3.25% 18,788 3.21% 19,621 3.25% Mortgage (2) Consumer Other - Ally Lending 1 ,274 8.77% 2,167 9.86% 2 ,037 9.97% Consumer Other - Ally Credit Card 1,975 21.61% 1,925 22.02% 1,618 21.84% Cash and Cash Equivalents 7,709 5.04% 7 ,571 4.72% 5,731 3.95% (3) 30,274 3.60% 29,784 3.66% 32,578 3.04% Investment Securities & Other Earning Assets $ 186,930 7.27% $ 186,956 7.22% $ 184,891 6.71% (3) 149,281 8.12% 149,978 8.04% 146,992 7.63% Total Loans and Leases (4) $ 155,352 4.28% $ 153,672 4.19% $ 152,752 3.23% Deposits Unsecured Debt 10,504 7.16% 9,796 7.10% 10,357 6.20% Secured Debt 1,409 5.74% 2,279 5.15% 2,552 6.04% (5) 7,122 3.63% 8,572 3.79% 6,503 2.74% Other Borrowings Funding Sources $ 174,387 4.44% $ 174,319 4.35% $ 172,165 3.44% NIM (as reported) 3.13% 3.17% 3.51% (6) $ 786 6.80% $ 799 6.35% $ 835 5.56% Core OID (6) NIM (ex. Core OID) 3.16% 3.20% 3.54% (1) Mortgage includes held-for-investment (HFI) loans from the Mortgage Finance segment and the HFI legacy mortgage portfolio in run-off at the Corporate and Other segment. (2) Unsecured lending from point-of-sale financing. Moved to Assets of Operations Held for Sale on 12/31/23. Sale of Ally Lending closed on 03/01/24. (3) Includes Community Reinvestment Act and other held-for-sale (HFS) loans. (4) Includes retail, brokered, and other deposits (inclusive of sweep deposits, mortgage escrow and other deposits). (5) Includes FHLB borrowings and Repurchase Agreements. 8 (6) Calculated using a Non-GAAP financial measure. See pages 26 – 28 for definitions.
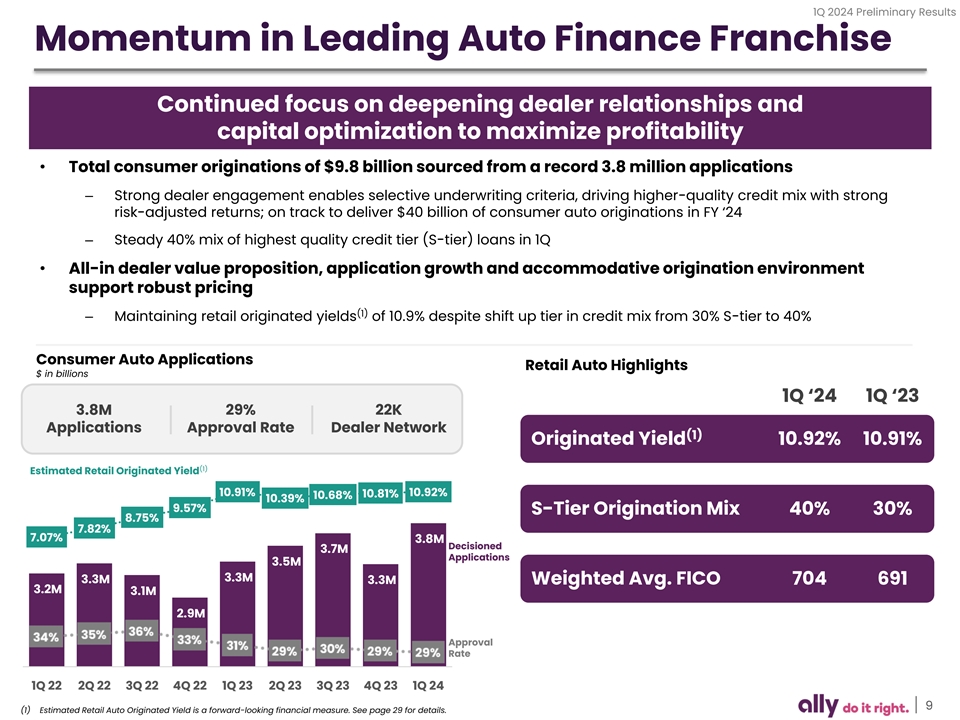
1Q 2024 Preliminary Results Momentum in Leading Auto Finance Franchise Continued focus on deepening dealer relationships and capital optimization to maximize profitability • Total consumer originations of $9.8 billion sourced from a record 3.8 million applications – Strong dealer engagement enables selective underwriting criteria, driving higher-quality credit mix with strong risk-adjusted returns; on track to deliver $40 billion of consumer auto originations in FY ‘24 – Steady 40% mix of highest quality credit tier (S-tier) loans in 1Q • All-in dealer value proposition, application growth and accommodative origination environment support robust pricing (1) – Maintaining retail originated yields of 10.9% despite shift up tier in credit mix from 30% S-tier to 40% Consumer Auto Applications Retail Auto Highlights $ in billions 1Q ‘24 1Q ‘23 3.8M 29% 22K Applications Approval Rate Dealer Network Retail Portfolio Yield 9.05% 8.48% (1) Originated Yield 10.92% 10.91% (1) Estimated Retail Originated Yield 10.91% 10.92% 10.81% 10.68% 10.39% Retail Portfolio Yield 9.05% 8.48% 9.57% S-Tier Origination Mix 40% 30% 8.75% 7.82% 7.07% 3.8M Decisioned 3.7M Applications 3.5M Retail Portfolio Yield 9.05% 8.48% 3.3M 3.3M 3.3M Weighted Avg. FICO 704 691 3.2M 3.1M 2.9M Approval Rate 1Q 22 2Q 22 3Q 22 4Q 22 1Q 23 2Q 23 3Q 23 4Q 23 1Q 24 9 (1) Estimated Retail Auto Originated Yield is a forward-looking financial measure. See page 29 for details.
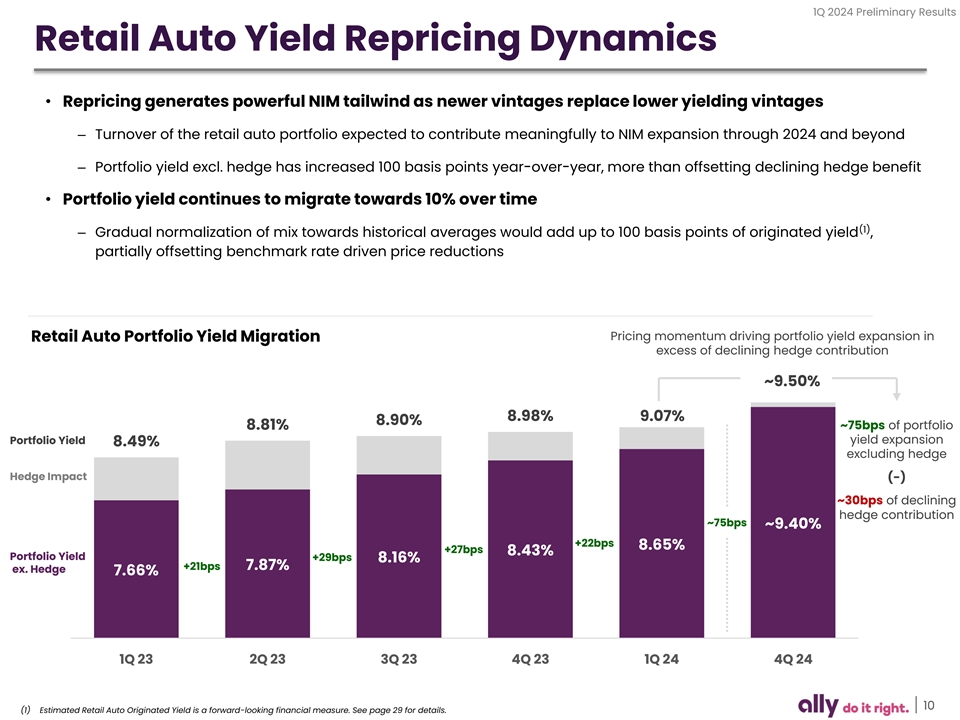
1Q 2024 Preliminary Results Retail Auto Yield Repricing Dynamics • Repricing generates powerful NIM tailwind as newer vintages replace lower yielding vintages%+ – Turnover of the retail auto portfolio expected to contribute meaningfully to NIM expansion through 2024 and beyond – Portfolio yield excl. hedge has increased 100 basis points year-over-year, more than offsetting declining hedge benefit • Portfolio yield continues to migrate towards 10% over time (1) – Gradual normalization of mix towards historical averages would add up to 100 basis points of originated yield , partially offsetting benchmark rate driven price reductions Pricing momentum driving portfolio yield expansion in Retail Auto Portfolio Yield Migration excess of declining hedge contribution ~9.50% 8.98% 9.07% 8.90% ~75bps of portfolio 8.81% Portfolio Yield yield expansion 8.49% excluding hedge Hedge Impact (-) ~30bps of declining hedge contribution ~75bps ~9.40% +22bps 8.65% +27bps 8.43% Portfolio Yield +29bps 8.16% +21bps 7.87% ex. Hedge 7.66% 1Q 23 2Q 23 3Q 23 4Q 23 1Q 24 4Q 24 10 (1) Estimated Retail Auto Originated Yield is a forward-looking financial measure. See page 29 for details.
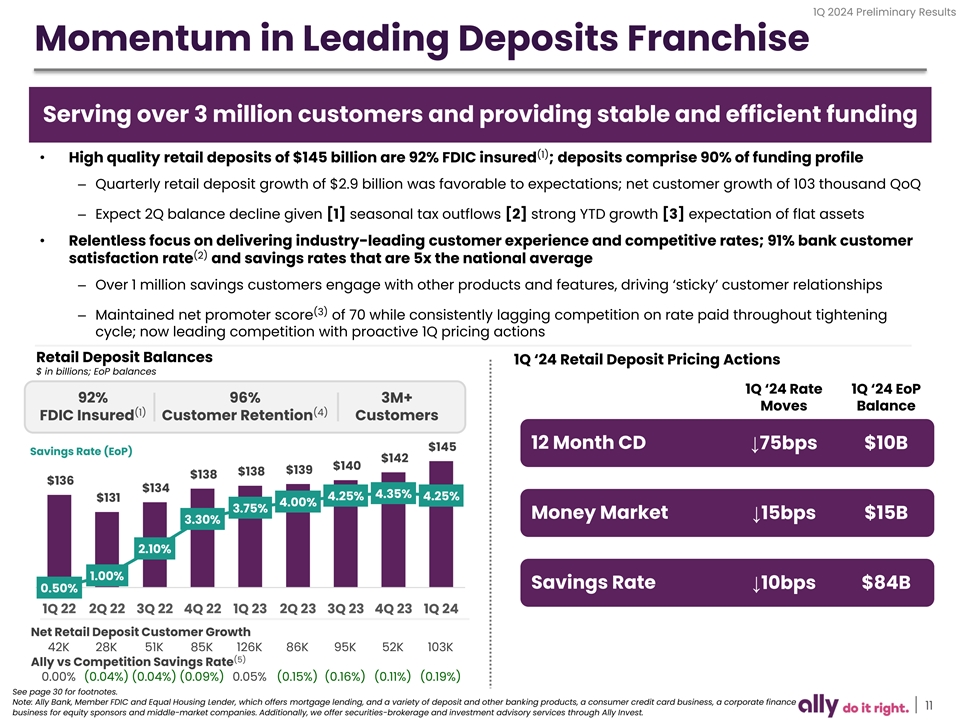
1Q 2024 Preliminary Results Momentum in Leading Deposits Franchise Serving over 3 million customers and providing stable and efficient funding (1) • High quality retail deposits of $145 billion are 92% FDIC insured ; deposits comprise 90% of funding profile – Quarterly retail deposit growth of $2.9 billion was favorable to expectations; net customer growth of 103 thousand QoQ – Expect 2Q balance decline given [1] seasonal tax outflows [2] strong YTD growth [3] expectation of flat assets • Relentless focus on delivering industry-leading customer experience and competitive rates; 91% bank customer (2) satisfaction rate and savings rates that are 5x the national average – Over 1 million savings customers engage with other products and features, driving ‘sticky’ customer relationships (3) – Maintained net promoter score of 70 while consistently lagging competition on rate paid throughout tightening cycle; now leading competition with proactive 1Q pricing actions Retail Deposit Balances 1Q ‘24 Retail Deposit Pricing Actions $ in billions; EoP balances 1Q ‘24 Rate 1Q ‘24 EoP 92% 96% 3M+ Moves Balance (1) (4) FDIC Insured Customer Retention Customers Retail Portfolio Yield 9.05% 8.48% 12 Month CD↓75bps $10B $145 Savings Rate (EoP) $142 $140 $139 $138 $138 $136 $134 4.35% 4.25% 4.25% $131 4.00% 9.05% 8.48% 3.75% Retail Portfolio Yield Money Market $15B ↓15bps 3.30% 2.10% 1.00% Retail Portfolio Yield 9.05% 8.48% Savings Rate↓10bps $84B 0.50% 1Q 22 2Q 22 3Q 22 4Q 22 1Q 23 2Q 23 3Q 23 4Q 23 1Q 24 Net Retail Deposit Customer Growth 42K 28K 51K 85K 126K 86K 95K 52K 103K (5) Ally vs Competition Savings Rate 0.00% (0.04%) (0.04%) (0.09%) 0.05% (0.15%) (0.16%) (0.11%) (0.19%) See page 30 for footnotes. Note: Ally Bank, Member FDIC and Equal Housing Lender, which offers mortgage lending, and a variety of deposit and other banking products, a consumer credit card business, a corporate finance 11 business for equity sponsors and middle-market companies. Additionally, we offer securities-brokerage and investment advisory services through Ally Invest.

1Q 2024 Preliminary Results Capital (1) Capital Ratios and Risk-Weighted Assets • 1Q ‘24 CET1 ratio of 9.4% and TCE / TA ratio of 5.5% ($ billions) • $3.8B of CET1 capital above FRB requirement of 7.0% Total Capital (Regulatory Minimum + SCB) 12.5% 12.5% 12.5% 12.5% 12.4% Ratio Tier 1 Ratio 10.8% – 9.0% internal operating target 10.7% 10.7% 10.8% 10.7% CET1 Ratio 9.4% 9.4% 9.3% 9.3% 9.2% • Capital management actions in 1Q ‘24 – Closed sale of Ally Lending contributing ~15bps of CET1 benefit Risk $162 $161 $159 $158 $158 Weighted – Deconsolidated $1.1B of seasoned retail auto loans from Assets balance sheet (1Q ‘24 benefit of 6bps) • Phased in another 25% of CECL impact – 18bps of impact to CET1; expect full phase in by 1Q ‘25 1Q 23 2Q 23 3Q 23 4Q 23 1Q 24 • Announced 2Q ’24 common dividend of $0.30 per share Note: For more details on the final rules to address the impact of CECL on regulatory capital by allowing BHCs and banks, including Ally, to delay and subsequently phase-in its impact, see page 29. (1) Adjusted Tangible Book Value per Share TBV/Share $46 (1) ex. OCI $44 $41 OCI $13 (2) $5 $13 Impact $36 $35 Adjusted $33 $33 $32 (1) $31 TBV/Share $27 $27 $25 $24 $21 1Q 14 1Q 15 1Q 16 1Q 17 1Q 18 1Q 19 1Q 20 1Q 21 1Q 22 1Q 23 1Q 24 End of Period Shares Outstanding 480M 482M 483M 462M 433M 400M 373M 372M 327M 301M 304M (1) Contains a Non-GAAP financial measure. See pages 26 – 28 for definitions. 12 (2) Prior period OCI impacts are not material to Adjusted Tangible Book Value per Share and therefore not shown.
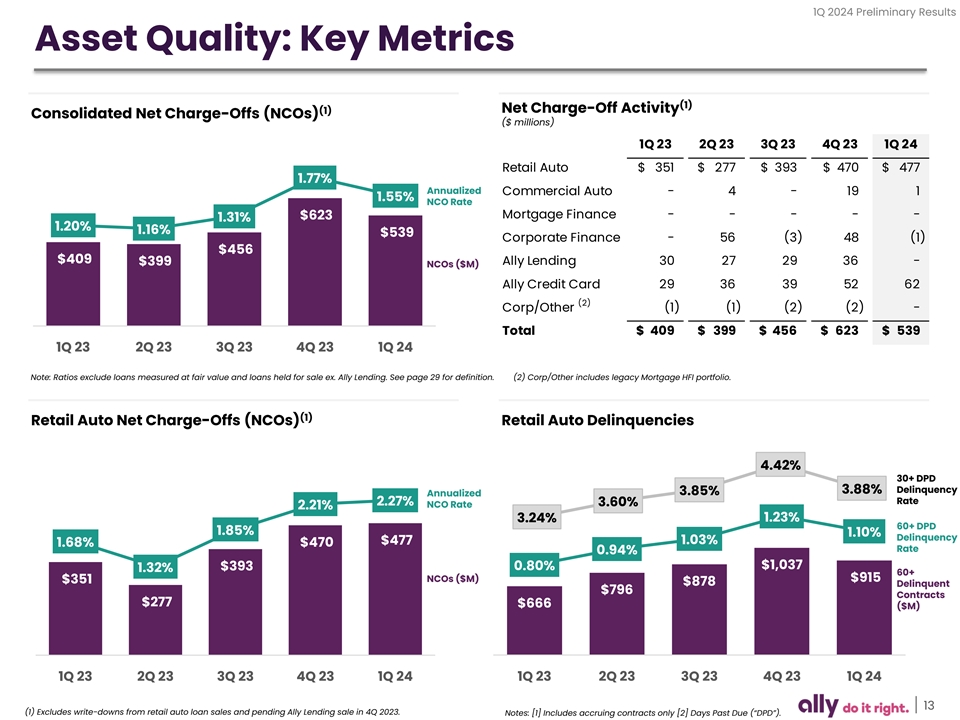
1Q 2024 Preliminary Results Asset Quality: Key Metrics (1) Net Charge-Off Activity (1) Consolidated Net Charge-Offs (NCOs) ($ millions) 1Q 23 2Q 23 3Q 23 4Q 23 1Q 24 Retail Auto $ 3 51 $ 2 77 $ 3 93 $ 470 $ 477 1.77% Annualized Commercial Auto - 4 - 19 1 1.55% NCO Rate Mortgage Finance - - - - - $623 1.31% 1.20% 1.16% $539 Corporate Finance - 56 (3) 48 (1) $456 $409 $399 Ally Lending 30 27 29 36 - NCOs ($M) Ally Credit Card 29 36 39 52 62 (2) Corp/Other (1) (1) (2) (2) - Total $ 409 $ 3 99 $ 4 56 $ 623 $ 539 1Q 23 2Q 23 3Q 23 4Q 23 1Q 24 Note: Ratios exclude loans measured at fair value and loans held for sale ex. Ally Lending. See page 29 for definition. (2) Corp/Other includes legacy Mortgage HFI portfolio. (1) Retail Auto Net Charge-Offs (NCOs) Retail Auto Delinquencies 4.42% 30+ DPD 3.88% Delinquency 3.85% Annualized Rate 2.27% 3.60% NCO Rate 2.21% 1.23% 3.24% 60+ DPD 1.85% 1.10% Delinquency 1.03% $477 1.68% $470 Rate 0.94% $1,037 $393 0.80% 1.32% 60+ NCOs ($M) $915 $351 $878 Delinquent $796 Contracts $277 $666 ($M) 1Q 23 2Q 23 3Q 23 4Q 23 1Q 24 1Q 23 2Q 23 3Q 23 4Q 23 1Q 24 13 (1) Excludes write-downs from retail auto loan sales and pending Ally Lending sale in 4Q 2023. Notes: [1] Includes accruing contracts only [2] Days Past Due (“DPD”).

1Q 2024 Preliminary Results Asset Quality: Coverage and Reserves • Retail Auto and Consolidated coverage rate flat QoQ at 3.65% and 2.57%, respectively – Decrease in consolidated coverage from 3Q ‘23 to 4Q ‘23 driven by Ally Lending’s move to Assets of Operations Held for Sale and specific reserves that did not need to be replenished in Corporate Finance and Commercial Auto • Retail auto coverage levels ~30 basis points higher than CECL Day 1 – Evolution of portfolio mix shift over time (↓ new, ↑ used); base case assumption of flat coverage while continuing to monitor and assess loss trends and the macroeconomic environment • Reserve setting process based on a 12-month reasonable and supportable period with a 24-month reversion to mean for macroeconomic variables – Utilize consensus blue chip unemployment rate with peak UER of 4.1%; 24-month reversion to ~6% historical mean Consolidated Coverage Retail Auto Coverage ($ billions) ($ billions) Reserve (%) 3.65% 3.65% 3.62% 3.62% 3.60% 2.74% 2.73% 2.72% 3.34% Reserve (%) 2.57% 2.57% $3.1 $3.1 $3.1 $3.1 $3.0 Reserve ($) $3.8 $3.8 $3.8 2.03% Reserve ($) $3.6 $3.6 $2.4 $2.6 CECL 1Q 23 2Q 23 3Q 23 4Q 23 1Q 24 CECL 1Q 23 2Q 23 3Q 23 4Q 23 1Q 24 Day 1 Day 1 Note: Coverage rate calculations exclude fair value adjustment for loans in hedge accounting relationships. Note: Coverage rate calculations exclude fair value adjustment for loans in hedge accounting relationships. 14
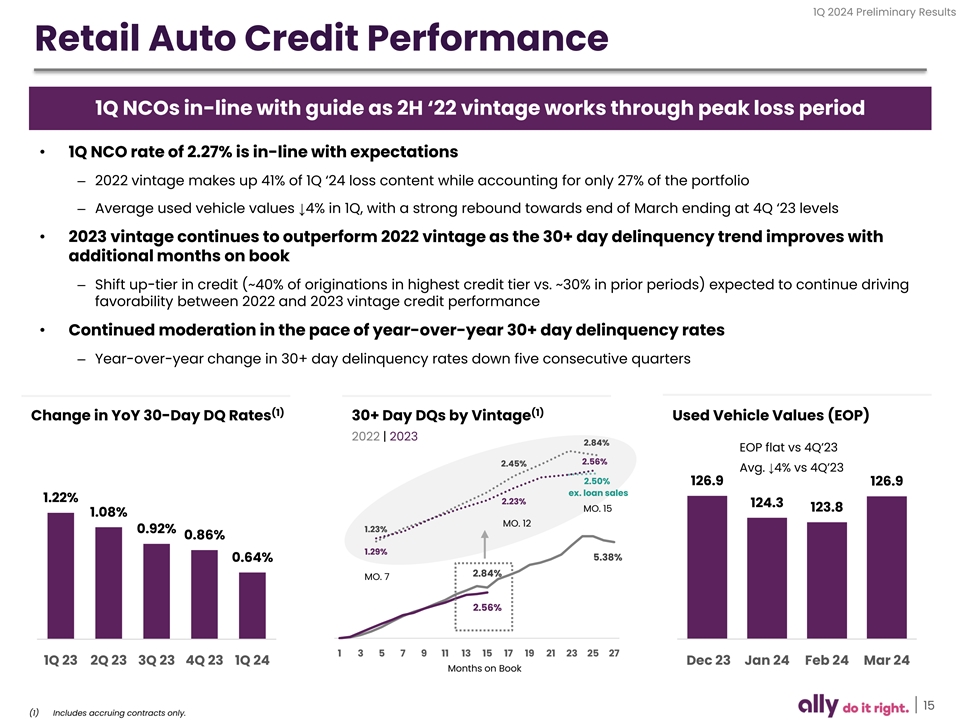
1Q 2024 Preliminary Results Retail Auto Credit Performance 1Q NCOs in-line with guide as 2H ‘22 vintage works through peak loss period • 1Q NCO rate of 2.27% is in-line with expectations – 2022 vintage makes up 41% of 1Q ‘24 loss content while accounting for only 27% of the portfolio – Average used vehicle values ↓4% in 1Q, with a strong rebound towards end of March ending at 4Q ‘23 levels • 2023 vintage continues to outperform 2022 vintage as the 30+ day delinquency trend improves with additional months on book – Shift up-tier in credit (~40% of originations in highest credit tier vs. ~30% in prior periods) expected to continue driving favorability between 2022 and 2023 vintage credit performance • Continued moderation in the pace of year-over-year 30+ day delinquency rates – Year-over-year change in 30+ day delinquency rates down five consecutive quarters (1) (1) Change in YoY 30-Day DQ Rates 30+ Day DQs by Vintage Used Vehicle Values (EOP) 2022 | 2023 2.84% EOP flat vs 4Q’23 2.56% 2.45% Avg. ↓4% vs 4Q’23 2.50% 126.9 126.9 ex. loan sales 1.22% 2.23% 124.3 MO. 15 123.8 1.08% MO. 12 1.23% 0.92% 0.86% 1.29% 5.38% 0.64% 2.84% MO. 7 2.56% 1 3 5 7 9 11 13 15 17 19 21 23 25 27 1Q 23 2Q 23 3Q 23 4Q 23 1Q 24 Dec 23 Jan 24 Feb 24 Mar 24 Months on Book 15 (1) Includes accruing contracts only.
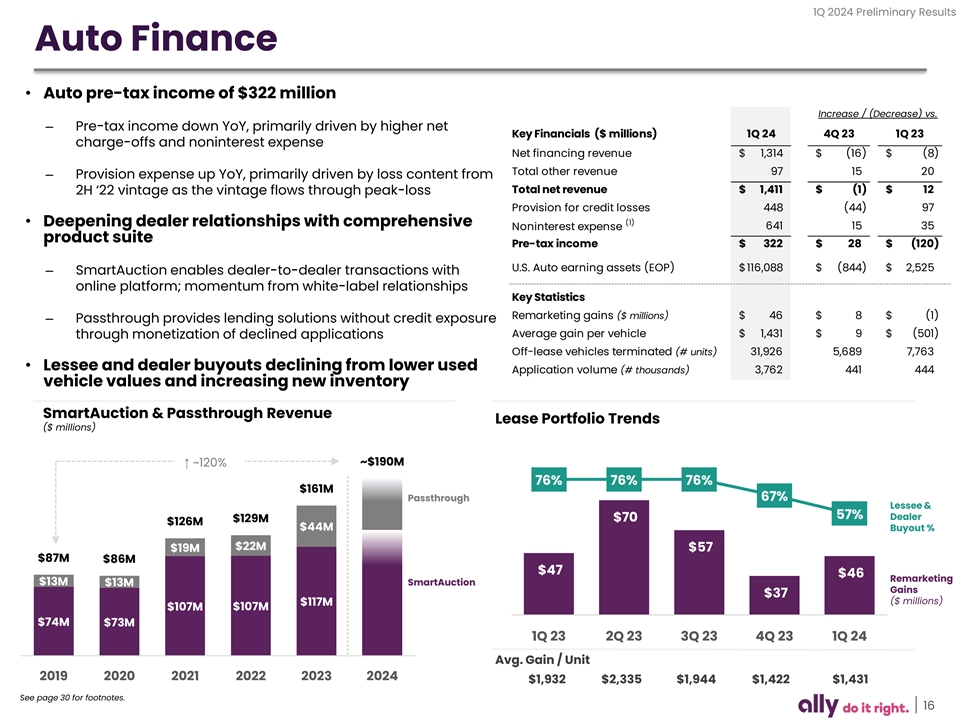
1Q 2024 Preliminary Results Auto Finance • Auto pre-tax income of $322 million Increase / (Decrease) vs. – Pre-tax income down YoY, primarily driven by higher net Key Financials ($ millions) 1Q 24 4Q 23 1Q 23 charge-offs and noninterest expense Net financing revenue $ 1,314 $ (16) $ (8) Total other revenue 97 15 20 – Provision expense up YoY, primarily driven by loss content from Total net revenue $ 1,411 $ (1) $ 12 2H ‘22 vintage as the vintage flows through peak-loss Provision for credit losses 448 (44) 97 (1) • Deepening dealer relationships with comprehensive 641 15 35 Noninterest expense product suite Pre-tax income $ 3 22 $ 28 $ (120) U.S. Auto earning assets (EOP) $ 116,088 $ (844) $ 2,525 – SmartAuction enables dealer-to-dealer transactions with online platform; momentum from white-label relationships Key Statistics Remarketing gains ($ millions) $ 46 $ 8 $ (1) – Passthrough provides lending solutions without credit exposure Average gain per vehicle $ 1,431 $ 9 $ ( 501) through monetization of declined applications Off-lease vehicles terminated (# units) 3 1,926 5,689 7,763 • Lessee and dealer buyouts declining from lower used Application volume (# thousands) 3,762 441 444 vehicle values and increasing new inventory SmartAuction & Passthrough Revenue Lease Portfolio Trends ($ millions) ~$190M ↑ ~120% 76% 76% 76% $161M Passthrough 67% Lessee & 57% Dealer $70 $129M $126M $44M Buyout % $22M $19M $57 $87M $86M $47 $46 Remarketing $13M SmartAuction $13M Gains $37 ($ millions) $117M $107M $107M $74M $73M 1Q 23 2Q 23 3Q 23 4Q 23 1Q 24 Avg. Gain / Unit 2019 2020 2021 2022 2023 2024 $1,932 $2,335 $1,944 $1,422 $1,431 See page 30 for footnotes. 16
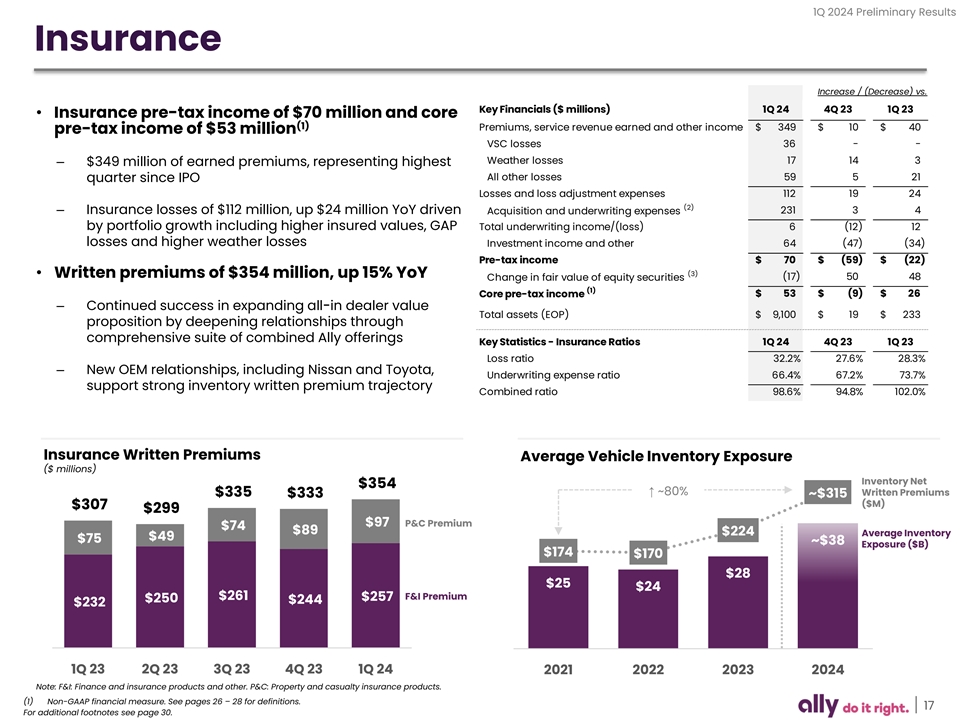
1Q 2024 Preliminary Results Insurance Increase / (Decrease) vs. Key Financials ($ millions) 1Q 24 4Q 23 1Q 23 • Insurance pre-tax income of $70 million and core (1) Premiums, service revenue earned and other income $ 349 $ 10 $ 40 pre-tax income of $53 million VSC losses 36 - - Weather losses 17 14 3 – $349 million of earned premiums, representing highest All other losses 59 5 21 quarter since IPO Losses and loss adjustment expenses 112 19 24 (2) 231 3 4 – Insurance losses of $112 million, up $24 million YoY driven Acquisition and underwriting expenses by portfolio growth including higher insured values, GAP Total underwriting income/(loss) 6 ( 12) 12 losses and higher weather losses Investment income and other 64 (47) (34) Pre-tax income $ 70 $ (59) $ (22) (3) • Written premiums of $354 million, up 15% YoY (17) 50 48 Change in fair value of equity securities (1) Core pre-tax income $ 53 $ (9) $ 26 – Continued success in expanding all-in dealer value Total assets (EOP) $ 9,100 $ 19 $ 233 proposition by deepening relationships through comprehensive suite of combined Ally offerings Key Statistics - Insurance Ratios 1Q 24 4Q 23 1Q 23 Loss ratio 32.2% 27.6% 28.3% – New OEM relationships, including Nissan and Toyota, Underwriting expense ratio 66.4% 67.2% 73.7% support strong inventory written premium trajectory Combined ratio 98.6% 94.8% 102.0% Insurance Written Premiums Average Vehicle Inventory Exposure ($ millions) Inventory Net $354 ↑ ~80% Written Premiums $335 ~$315 $333 ($M) $307 $299 $97 P&C Premium $74 $89 $224 Average Inventory $49 $75 ~$38 Exposure ($B) $174 $170 $28 $25 $24 $261 F&I Premium $257 $250 $244 $232 1Q 23 2Q 23 3Q 23 4Q 23 1Q 24 2021 2022 2023 2024 Note: F&I: Finance and insurance products and other. P&C: Property and casualty insurance products. (1) Non-GAAP financial measure. See pages 26 – 28 for definitions. 17 For additional footnotes see page 30.

1Q 2024 Preliminary Results Corporate Finance Increase/(Decrease) vs. • Corporate Finance pre-tax income of $90 million Key Financials ($ millions) 1Q 24 4Q 23 1Q 23 – Net financing revenue up YoY reflecting slightly higher Net financing revenue $ 111 $ 6 $ 8 average balances and higher income spreads Other revenue 23 - ( 6) – Continued strength in Other revenue, however down YoY, driven Total net revenue 134 6 2 Provision for credit losses (1) (18) (16) by elevated fee income in prior year period (2) Noninterest expense 45 13 - – 1Q ROE of 31%; 24% average ROE over the past 5 years Pre-tax income $ 90 $ 11 $ 18 (3) 0 0 0 • Held-for-investment loans of $10.1B, up 1% YoY Change in fair value of equity securities (1) $ 90 $ 11 $ 18 Core pre-tax income – Well-diversified, high-quality, ~100% first-lien, floating rate loans Total Assets (EOP) 10,410 $ (802) $ 184 – CRE exposure of $1.4B is limited and performing well • Focused on credit and operational risk management – Criticized assets and non-accrual loans percentage remain near historically low levels, 12% and <1%, respectively Diversified Loan Portfolio Held for Investment Loans (as of 3/31/24) ($ billions; EOP) All Other $10.9 $10.6 $10.1 $10.1 $10.0 7% Chemicals & Metals 2% Wholesale Services 1% Construction 45% Financial Services 0% Paper & Publishing 14% Other Services 0% Other 13% Health Services 1% Retail Trade 0% Food & Beverage Manufacturing 7% Machinery Equipment 6% Auto & Transportation 2% Other Manufacturing 1Q 23 2Q 23 3Q 23 4Q 23 1Q 24 (1) Non-GAAP financial measure. See pages 26 – 28 for definitions. 18 For additional footnotes see page 30.
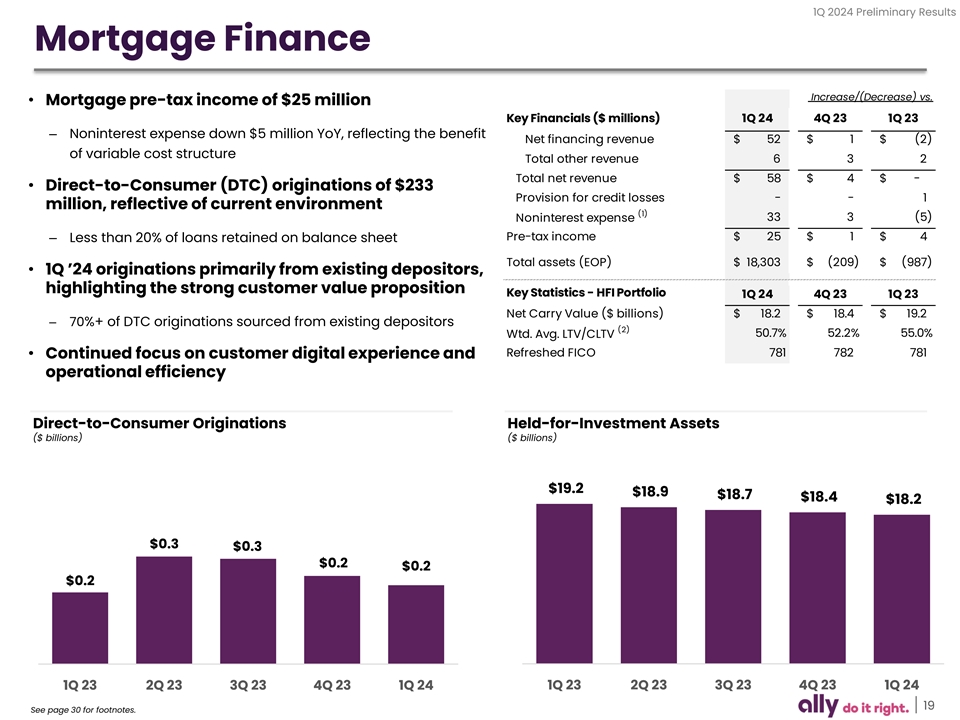
1Q 2024 Preliminary Results Mortgage Finance Increase/(Decrease) vs. • Mortgage pre-tax income of $25 million Key Financials ($ millions) 1Q 24 4Q 23 1Q 23 – Noninterest expense down $5 million YoY, reflecting the benefit Net financing revenue $ 52 $ 1 $ ( 2) of variable cost structure Total other revenue 6 3 2 Total net revenue $ 58 $ 4 $ - • Direct-to-Consumer (DTC) originations of $233 Provision for credit losses - - 1 million, reflective of current environment (1) 33 3 (5) Noninterest expense Pre-tax income $ 25 $ 1 $ 4 – Less than 20% of loans retained on balance sheet Total assets (EOP) $ 18,303 $ (209) $ (987) • 1Q ’24 originations primarily from existing depositors, highlighting the strong customer value proposition Key Statistics - HFI Portfolio 1Q 24 4Q 23 1Q 23 Net Carry Value ($ billions) $ 18.2 $ 18.4 $ 19.2 – 70%+ of DTC originations sourced from existing depositors (2) 50.7% 52.2% 55.0% Wtd. Avg. LTV/CLTV Refreshed FICO 781 782 781 • Continued focus on customer digital experience and operational efficiency Direct-to-Consumer Originations Held-for-Investment Assets ($ billions) ($ billions) $19.2 $18.9 $18.7 $18.4 $18.2 $0.3 $0.3 $0.2 $0.2 $0.2 1Q 23 2Q 23 3Q 23 4Q 23 1Q 24 1Q 23 2Q 23 3Q 23 4Q 23 1Q 24 19 See page 30 for footnotes.

1Q 2024 Preliminary Results Financial Outlook FY 2024 3.25% - 3.30% Net Interest Margin Exit rate 3.40% - 3.50% (1) Adj. Other Revenue↑9% - 12% YoY (2) Controllable↓>1% YoY (1) Adj. Noninterest Expense Total ↑ less than 2% YoY Retail Auto NCO ~2.0% Consolidated NCO 1.4% - 1.5% Average Earning Assets Flat YoY (3) Tax Rate 15% (1) Non-GAAP financial measures. See pages 26 – 28 for definitions. (2) Defined as total operating expenses excluding FDIC fees and certain insurance expenses (losses and commissions). 20 (3) Assumes statutory U.S. Federal tax rate of 21%.

Supplemental
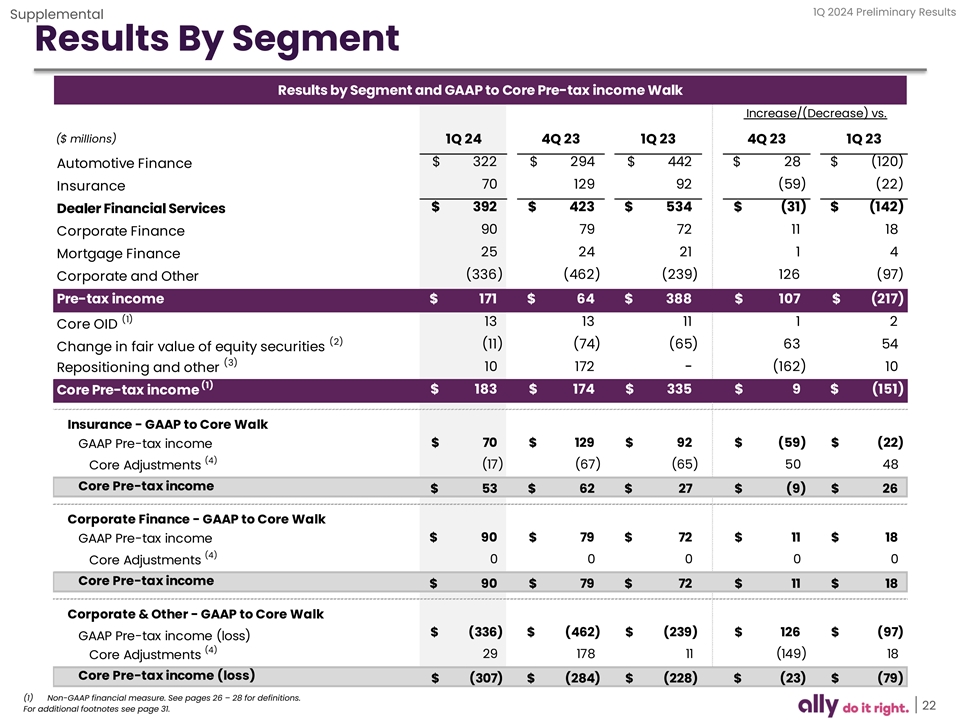
1Q 2024 Preliminary Results Supplemental Results By Segment Results by Segment and GAAP to Core Pre-tax income Walk Increase/(Decrease) vs. ($ millions) 1Q 24 4Q 23 1Q 23 4Q 23 1Q 23 $ 3 22 $ 294 $ 442 $ 28 $ (120) Automotive Finance 70 1 29 92 (59) ( 22) Insurance $ 3 92 $ 4 23 $ 5 34 $ (31) $ (142) Dealer Financial Services 90 79 72 11 18 Corporate Finance 25 24 21 1 4 Mortgage Finance (336) ( 462) (239) 1 26 (97) Corporate and Other Pre-tax income $ 1 71 $ 64 $ 3 88 $ 1 07 $ (217) (1) 13 13 11 1 2 Core OID (2) (11) (74) (65) 63 54 Change in fair value of equity securities (3) Repositioning and other 10 172 - ( 162) 10 (1) $ 1 83 $ 1 74 $ 335 $ 9 $ (151) Core Pre-tax income Insurance - GAAP to Core Walk $ 70 $ 129 $ 92 $ ( 59) $ (22) GAAP Pre-tax income (4) Core Adjustments (17) (67) (65) 50 48 Core Pre-tax income $ 53 $ 62 $ 27 $ (9) $ 26 Corporate Finance - GAAP to Core Walk $ 90 $ 79 $ 72 $ 11 $ 18 GAAP Pre-tax income (4) Core Adjustments 0 0 0 0 0 Core Pre-tax income $ 90 $ 79 $ 72 $ 11 $ 18 Corporate & Other - GAAP to Core Walk $ (336) $ (462) $ (239) $ 1 26 $ ( 97) GAAP Pre-tax income (loss) (4) 29 178 11 (149) 18 Core Adjustments Core Pre-tax income (loss) $ ( 307) $ (284) $ (228) $ ( 23) $ ( 79) (1) Non-GAAP financial measure. See pages 26 – 28 for definitions. 22 For additional footnotes see page 31.

1Q 2024 Preliminary Results Supplemental Corporate and Other st Corporate & Other Results • Sale of Ally Lending closed March 1 ($ millions) Increase/(Decrease) vs. Key Financials 1Q 24 4Q 23 1Q 23 • Pre-tax loss of $336 million and Core pre-tax loss (1) Net financing revenue $ (50) $ (24) $ (147) of $307 million 20 (29) 13 Total other revenue – Net financing revenue lower YoY driven by higher interest Total net revenue ( 30) (53) (134) 60 (18) (21) Provision for credit losses expense 246 (161) (16) Noninterest expense – Provision expense lower YoY largely driven by the sale of Pre-tax income (loss) $ (336) $ 126 $ (97) Ally Lending and slower portfolio growth in Credit Card (1) 13 1 2 Core OID (2) 10 (162) 10 Repositioning items • Total assets of $40 billion, down $5 billion YoY (3) 6 13 6 Change in fair value of equity securities primarily driven by the sale of Ally Lending and (1) Core pre-tax income (loss) $ (307) $ ( 23) $ (79) runoff within the securities portfolio Cash & securities $ 31,990 $ 479 $ (3,669) (4) 1,940 (105) (1,403) Held-for-investment loans, net Ally Financial Rating Details (5) - (1,975) - Assets of Operations, Held for sale LT Debt ST Debt Outlook (6) (719) ( 100) (196) Intercompany loan 7,240 (48) (103) Other Fitch BBB- F3 Stable Total assets $ 4 0,451 $ (1,749) $ (5,371) Moody's Baa3 P-3 Negative Ally Invest 1Q 24 4Q 23 1Q 23 Net Funded Accounts (k) 526 523 523 S&P BBB- A-3 Stable Average Customer Trades Per Day (k) 30.0 23.4 29.1 DBRS BBB R-2H Stable Total Customer Cash Balances $ 1,395 $ 1,454 $ 1,622 Total Net Customers Assets $ 16,020 $ 1 5,164 $ 14,060 Note: Ratings as of 3/31/2024. Our borrowing costs & access to the capital markets could be negatively impacted if our credit ratings are downgraded or otherwise fail to meet investor expectations or demands. Ally Credit Card 1Q 24 4Q 23 1Q 23 Gross Receivable Growth (EOP) $ (28) $ 118 $ 41 Outstanding Balance (EOP) $ 1,962 $ 1,990 $ 1,640 NCO % 12.5% 10.9% 7.2% Active Cardholders (k) 1,222 1,222 1,097 (1) Non-GAAP financial measure. See pages 26 – 28 for definitions. 23 For additional footnotes see page 31.

1Q 2024 Preliminary Results Supplemental Funding and Liquidity Core funded with stable deposits and strong liquidity position Funding Composition Total Available Liquidity ($ billions) (End of Period) Unsecured Debt Cash and Equivalents FHLB / Other FHLB Unused Pledged Borrowing Capacity Secured Debt FRB Discount Window Pledged Capacity Total Deposits Unencumbered Highly Liquid Securities (1) Loan to Deposit Ratio Available Liquidity vs. Uninsured Deposits 3.7x 4.0x 5.6x 5.5x 5.8x 95% 96% 98% 98% 95% (1) Total loans and leases divided by total deposits. 24
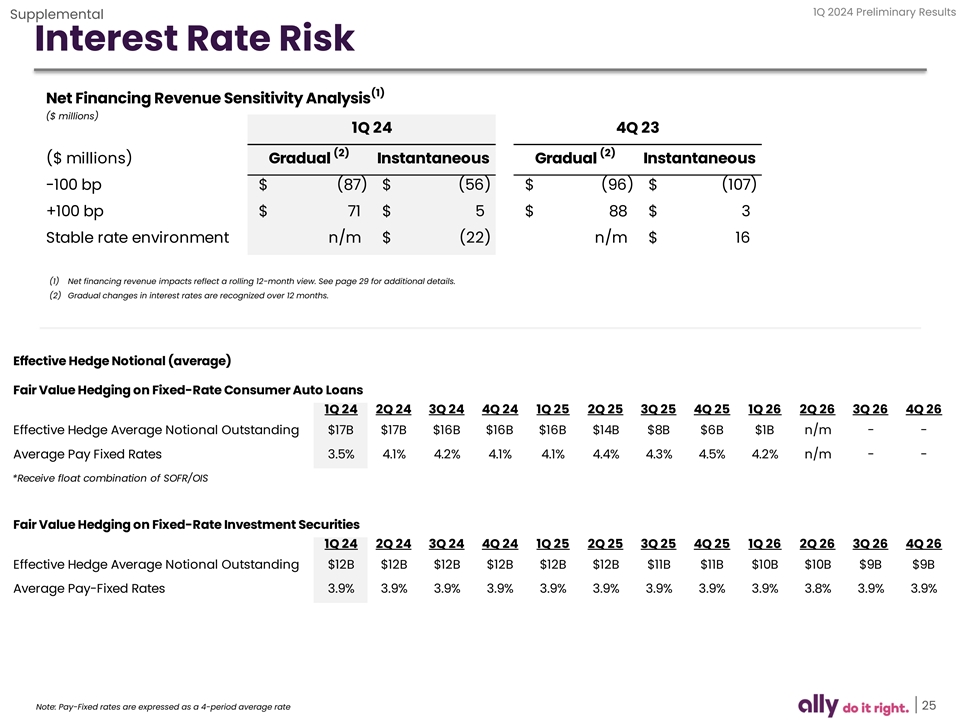
1Q 2024 Preliminary Results Supplemental Interest Rate Risk (1) Net Financing Revenue Sensitivity Analysis ($ millions) 1Q 24 4Q 23 (2) (2) ($ millions) Gradual Instantaneous Gradual Instantaneous -100 bp $ ( 87) $ (56) $ (96) $ (107) +100 bp $ 71 $ 5 $ 88 $ 3 Stable rate environment n/m $ (22) n/m $ 16 (1) Net financing revenue impacts reflect a rolling 12-month view. See page 29 for additional details. (2) Gradual changes in interest rates are recognized over 12 months. Effective Hedge Notional (average) Fair Value Hedging on Fixed-Rate Consumer Auto Loans 1Q 24 2Q 24 3Q 24 4Q 24 1Q 25 2Q 25 3Q 25 4Q 25 1Q 26 2Q 26 3Q 26 4Q 26 Effective Hedge Average Notional Outstanding $17B $17B $16B $16B $16B $14B $8B $6B $1B n/m - - Average Pay Fixed Rates 3.5% 4.1% 4.2% 4.1% 4.1% 4.4% 4.3% 4.5% 4.2% n/m - - *Receive float combination of SOFR/OIS Fair Value Hedging on Fixed-Rate Investment Securities 1Q 24 2Q 24 3Q 24 4Q 24 1Q 25 2Q 25 3Q 25 4Q 25 1Q 26 2Q 26 3Q 26 4Q 26 Effective Hedge Average Notional Outstanding $12B $12B $12B $12B $12B $12B $11B $11B $10B $10B $9B $9B Average Pay-Fixed Rates 3.9% 3.9% 3.9% 3.9% 3.9% 3.9% 3.9% 3.9% 3.9% 3.8% 3.9% 3.9% 25 Note: Pay-Fixed rates are expressed as a 4-period average rate
1Q 2024 Preliminary Results Supplemental Notes on Non-GAAP Financial Measures The following are non-GAAP financial measures which Ally believes are important to the reader of the Consolidated Financial Statements, but which are supplemental to and not a substitute for GAAP measures: Accelerated issuance expense (Accelerated OID), Adjusted earnings per share (Adjusted EPS), Adjusted efficiency ratio, Adjusted noninterest expense, Adjusted other revenue, Adjusted tangible book value per share (Adjusted TBVPS), Adjusted total net revenue, Core net income attributable to common shareholders, Core original issue discount (Core OID) amortization expense, Core outstanding original issue discount balance (Core OID balance), Core pre-tax income, Core return on tangible common equity (Core ROTCE), Investment income and other (adjusted), Net financing revenue (excluding Core OID), Net interest margin (excluding Core OID), and Tangible Common Equity. These measures are used by management, and we believe are useful to investors in assessing the company’s operating performance and capital. For calculation methodology, refer to the Reconciliation to GAAP later in this document. 1) Accelerated issuance expense (Accelerated OID) is the recognition of issuance expenses related to calls of redeemable debt. 2) Adjusted earnings per share (Adjusted EPS) is a non-GAAP financial measure that adjusts GAAP EPS for revenue and expense items that are typically strategic in nature or that management otherwise does not view as reflecting the operating performance of the company. Management believes Adjusted EPS can help the reader better understand the operating performance of the core businesses and their ability to generate earnings. In the numerator of Adjusted EPS, GAAP net income attributable to common shareholders is adjusted for the following items: (1) excludes discontinued operations, net of tax, as Ally is primarily a domestic company and sales of international businesses and other discontinued operations in the past have significantly impacted GAAP EPS, (2) adds back the tax-effected non-cash Core OID, (3) adjusts for tax-effected repositioning and other which are primarily related to the extinguishment of high-cost legacy debt, strategic activities and significant other one- time items, (4) change in fair value of equity securities, (5) excludes significant discrete tax items that do not relate to the operating performance of the core businesses, and adjusts for preferred stock capital actions that have been taken by the company to normalize its capital structure, as applicable for respective periods. See page 32 for calculation methodology and details. 3) Adjusted efficiency ratio is a non-GAAP financial measure that management believes is helpful to readers in comparing the efficiency of its core banking and lending businesses with those of its peers. See page 35 for calculation details. (1) In the numerator of Adjusted efficiency ratio, total noninterest expense is adjusted for Rep and warrant expense, Insurance segment expense, and repositioning and other which are primarily related to the extinguishment of high-cost legacy debt, strategic activities, restructuring and significant other one-time items, as applicable for respective periods. (2) In the denominator, total net revenue is adjusted for Core OID and Insurance segment revenue. See page 17 for the combined ratio for the Insurance segment which management uses as a primary measure of underwriting profitability for the Insurance segment. 4) Adjusted noninterest expense is a non-GAAP financial measure that adjusts GAAP noninterest expense for repositioning items. Management believes adjusted noninterest expense is a helpful financial metric because it enables the reader better understand the business' expenses excluding nonrecurring items. See page 36 for calculation methodology and details. 5) Adjusted other revenue is a non-GAAP financial measure that adjusts GAAP other revenue for OID expenses, repositioning, and change in fair value of equity securities. Management believes adjusted other revenue is a helpful financial metric because it enables the reader to better understand the business' ability to generate other revenue. See page 36 for calculation methodology and details. 6) Adjusted provision for credit losses is a non-GAAP financial measure that adjusts GAAP provision for credit losses for repositioning items. Management believes adjusted provision for credit losses is a helpful financial metric because it enables the reader to better understand the business’ expenses excluding nonrecurring items. See page 36 for calculation methodology and details. 26

1Q 2024 Preliminary Results Supplemental Notes on Non-GAAP Financial Measures 7) Adjusted tangible book value per share (Adjusted TBVPS) is a non-GAAP financial measure that reflects the book value of equity attributable to shareholders even if Core OID balance were accelerated immediately through the financial statements. As a result, management believes Adjusted TBVPS provides the reader with an assessment of value that is more conservative than GAAP common shareholder’s equity per share. Adjusted TBVPS generally adjusts common equity for: (1) goodwill and identifiable intangibles, net of DTLs and (2) tax-effected Core OID balance to reduce tangible common equity in the event the corresponding discounted bonds are redeemed/tendered. Note: In December 2017, tax-effected Core OID balance was adjusted from a statutory U.S. Federal tax rate of 35% to 21% (“rate”) as a result of changes to U.S. tax law. The adjustment conservatively increased the tax-effected Core OID balance and consequently reduced Adjusted TBVPS as any acceleration of the non-cash charge in future periods would flow through the financial statements at a 21% rate versus a previously modeled 35% rate. See page 34 for calculation methodology and details. 8) Adjusted total net revenue is a non-GAAP financial measure that management believes is helpful for readers to understand the ongoing ability of the company to generate revenue. For purposes of this calculation, GAAP net financing revenue is adjusted by excluding Core OID to calculate net financing revenue ex. core OID. GAAP other revenue is adjusted for OID expenses, repositioning, and change in fair value of equity securities to calculate adjusted other revenue. Adjusted total net revenue is calculated by adding net financing revenue ex. core OID to adjusted other revenue. See pages 36 for calculation methodology and details. 9) Core net income attributable to common shareholders is a non-GAAP financial measure that serves as the numerator in the calculations of Adjusted EPS and Core ROTCE and that, like those measures, is believed by management to help the reader better understand the operating performance of the core businesses and their ability to generate earnings. Core net income attributable to common shareholders adjusts GAAP net income attributable to common shareholders for discontinued operations net of tax, tax-effected Core OID expense, tax-effected repositioning and other primarily related to the extinguishment of high-cost legacy debt and strategic activities and significant other, preferred stock capital actions, significant discrete tax items and tax-effected changes in equity investments measured at fair value, as applicable for respective periods. See pages 32 – 33 for calculation methodology and details. 10) Core original issue discount (Core OID) amortization expense is a non-GAAP financial measure for OID and is believed by management to help the reader better understand the activity removed from: Core pre-tax income (loss), Core net income (loss) attributable to common shareholders, Adjusted EPS, Core ROTCE, Adjusted efficiency ratio, Adjusted total net revenue, and Net financing revenue (excluding Core OID). Core OID is primarily related to bond exchange OID which excludes international operations and future issuances. Core OID for all periods shown is applied to the pre-tax income of the Corporate and Other segment. See page 36 for calculation methodology and details. 11) Core outstanding original issue discount balance (Core OID balance) is a non-GAAP financial measure for outstanding OID and is believed by management to help the reader better understand the balance removed from Core ROTCE and Adjusted TBVPS. Core OID balance is primarily related to bond exchange OID which excludes international operations and future issuances. See page 36 for calculation methodology and details. 12) Core pre-tax income is a non-GAAP financial measure that adjusts pre-tax income from continuing operations by excluding (1) Core OID, and (2) change in fair value of equity securities (change in fair value of equity securities impacts the Insurance and Corporate Finance segments), and (3) Repositioning and other which are primarily related to the extinguishment of high-cost legacy debt, strategic activities and significant other one-time items, as applicable for respective periods or businesses. Management believes core pre-tax income can help the reader better understand the operating performance of the core businesses and their ability to generate earnings. See page 23 for calculation methodology and details. 27
1Q 2024 Preliminary Results Supplemental Notes on Non-GAAP Financial Measures 13) Core return on tangible common equity (Core ROTCE) is a non-GAAP financial measure that management believes is helpful for readers to better understand the ongoing ability of the company to generate returns on its equity base that supports core operations. For purposes of this calculation, tangible common equity is adjusted for Core OID balance and net DTA. Ally’s Core net income attributable to common shareholders for purposes of calculating Core ROTCE is based on the actual effective tax rate for the period adjusted for significant discrete tax items including tax reserve releases, which aligns with the methodology used in calculating adjusted earnings per share. See page 33 for calculation details. (1) In the numerator of Core ROTCE, GAAP net income attributable to common shareholders is adjusted for discontinued operations net of tax, tax-effected Core OID, tax-effected repositioning and other which are primarily related to the extinguishment of high-cost legacy debt, strategic activities and significant other one- time items, change in fair value of equity securities, significant discrete tax items, and preferred stock capital actions, as applicable for respective periods. (2) In the denominator, GAAP shareholder’s equity is adjusted for goodwill and identifiable intangibles net of DTL, Core OID balance, and net DTA. 14) Investment income and other (adjusted) is a non-GAAP financial measure that adjusts GAAP investment income and other for repositioning, and the change in fair value of equity securities. Management believes investment income and other (adjusted) is a helpful financial metric because it enables the reader to better understand the business' ability to generate investment income. 15) Net financing revenue excluding core OID is calculated using a non-GAAP measure that adjusts net financing revenue by excluding Core OID. The Core OID balance is primarily related to bond exchange OID which excludes international operations and future issuances. Management believes net financing revenue ex. Core OID is a helpful financial metric because it enables the reader to better understand the business' ability to generate revenue. See pages 36 for calculation methodology and details. 16) Net interest margin excluding core OID is calculated using a non-GAAP measure that adjusts net interest margin by excluding Core OID. The Core OID balance is primarily related to bond exchange OID which excludes international operations and future issuances. Management believes net interest margin ex. Core OID is a helpful financial metric because it enables the reader to better understand the business' profitability and margins. See page 8 for calculation methodology and details. 17) Tangible Common Equity is a non-GAAP financial measure that is defined as common stockholders’ equity less goodwill and identifiable intangible assets, net of deferred tax liabilities. Ally considers various measures when evaluating capital adequacy, including tangible common equity. Ally believes that tangible common equity is important because we believe readers may assess our capital adequacy using this measure. Additionally, presentation of this measure allows readers to compare certain aspects of our capital adequacy on the same basis to other companies in the industry. For purposes of calculating Core return on tangible common equity (Core ROTCE), tangible common equity is further adjusted for Core OID balance and net deferred tax asset. See pages 34 for calculation methodology and details. 28
1Q 2024 Preliminary Results Supplemental Notes on Other Financial Measures 1) Change in fair value of equity securities impacts the Insurance, Corporate Finance and Corporate and Other segments. The change reflects fair value adjustments to equity securities that are reported at fair value. Management believes the change in fair value of equity securities should be removed from select financial measures because it enables the reader to better understand the business’ ongoing ability to generate revenue and income. 2) Customer retention rate is the annualized 3-month rolling average of 1 minus the monthly attrition rate; excludes escheatment. 3) Estimated impact of CECL on regulatory capital per final rule issued by U.S. banking agencies - In December 2018, the FRB and other U.S. banking agencies approved a final rule to address the impact of CECL on regulatory capital by allowing BHCs and banks, including Ally, the option to phase in the day-one impact of CECL over a three-year period. In March 2020, the FRB and other U.S. banking agencies issued an interim final rule that became effective on March 31, 2020 and provided an alternative option for banks to temporarily delay the impacts of CECL, relative to the incurred loss methodology for estimating the allowance for loan losses, on regulatory capital. A final rule that was largely unchanged from the March 2020 interim final rule was issued by the FRB and other U.S. banking agencies in August 2020, and became effective in September 2020. For regulatory capital purposes, these rules permitted us to delay recognizing the estimated impact of CECL on regulatory capital until after a two-year deferral period, which for us extended through December 31, 2021. Beginning on January 1, 2022, we are required to phase in 25% of the previously deferred estimated capital impact of CECL, with an additional 25% to be phased in at the beginning of each subsequent year until fully phased in by the first quarter of 2025. Under these rules, firms that adopt CECL and elect the five-year transition will calculate the estimated impact of CECL on regulatory capital as the day-one impact of adoption plus 25% of the subsequent change in allowance during the two-year deferral period, which according to the final rule approximates the impact of CECL relative to an incurred loss model. We adopted this transition option during the first quarter of 2020, and beginning January 1, 2022 are phasing in the regulatory capital impacts of CECL based on this five-year transition period. 4) Estimated retail auto originated yield is a financial measure determined by calculating the estimated average annualized yield for loans originated during the period. At this time there currently is no comparable GAAP financial measure for Estimated Retail Auto Originated Yield and therefore this forecasted estimate of yield at the time of origination cannot be quantitatively reconciled to comparable GAAP information. 5) Interest rate risk modeling – We prepare our forward-looking baseline forecasts of net financing revenue taking into consideration anticipated future business growth, asset/liability positioning, and interest rates based on the implied forward curve. The analysis is highly dependent upon a variety of assumptions including the repricing characteristics of retail deposits with both contractual and non-contractual maturities. We continually monitor industry and competitive repricing activity along with other market factors when contemplating deposit pricing actions. Please see our SEC filings for more details. 6) Net charge-off ratios are calculated as annualized net charge-offs divided by average outstanding finance receivables and loans excluding loans measured at fair value and loans held-for-sale. 7) Repositioning is primarily related to the extinguishment of high-cost legacy debt, strategic activities, restructuring, amounts related to nonrecurring business transactions or pending transactions, and significant other one-time items. 8) U.S. consumer auto originations ▪ New Retail – standard and subvented rate new vehicle loans; Lease – new vehicle lease originations; Used – used vehicle loans; Growth – total originations from non-GM/Stellantis dealers and direct-to-consumer loans. Note: Stellantis N.V. (“Stellantis”) announced January 17, 2021, following completion of the merger of Peugeot S.A. (“Groupe PSA”) and Fiat Chrysler Automobiles N.V. (“FCA”) on January 16, 2021, the combined company was renamed Stellantis; Nonprime – originations with a FICO® score of less than 620 29

1Q 2024 Preliminary Results Supplemental Additional Notes Page – 6 | Market Leading Franchises (2) ‘Prime Auto Lender’ - Source: PIN Navigator Data & Analytics, a business division of J.D. Power. The credit scores provided within these reports have been provided by FICO® Risk Score, Auto 08 FICO® is a registered trademark of Fair Isaac Corporation in the United States and other countries. Ally management defines retail auto market segmentation (unit based) for consumer automotive loans primarily as those loans with a FICO® Score (or an equivalent score) at origination by the following: Super-prime 720+, Prime 620 – 719, Nonprime less than 620 (3) ‘Bank Floorplan Lender’ - Source: Company filings, including WFC and HBAN. (4) ‘Retail Auto Loan Outstandings’ - Source: Big Wheels Auto Finance Data 2022. (5) ‘#1 Dealer Satisfaction among Non-Captive Lenders with Sub-Prime Credit’ - Source: J.D. Power. (6) Customer retention rate is the annualized 3-month rolling average of 1 minus the monthly attrition rate; excludes escheatment. (7) Bank customer satisfaction rate is calculated with data collected during 1Q 2024 in the Ally Relationship Survey and represents Top 2 Box results on a 7-point satisfaction score. (8) FDIC insured percentage excludes affiliate and intercompany deposits. Page – 11 | Momentum in Leading Deposits Franchise (1) FDIC insured percentage excludes affiliate and intercompany deposits. (2) Bank customer satisfaction rate is calculated with data collected during 1Q 2024 in the Ally Relationship Survey and represents Top 2 Box results on a 7-point satisfaction score. (3) Net Promoter Score is calculated with data collected during 1Q 2024 in the Ally Relationship Survey using standard Bain NPS methodology. (4) Customer retention rate is the annualized 3-month rolling average of 1 minus the monthly attrition rate; excludes escheatment. (5) Competition savings rate defined as average EOP savings rate from five select high yield savings peers. Page – 16 | Auto Finance (1) Noninterest expense includes corporate allocations of $285 million in 1Q 2024, $288 million in 4Q 2023, and $271 million in 1Q 2023. Page – 17 | Insurance (2) Acquisition and underwriting expenses includes corporate allocations of $24 million in 1Q 2024, $22 million in 4Q 2023, and $24 million in 1Q 2023. (3) Change in fair value of equity securities impacts the Insurance segment. The change reflects fair value adjustments to equity securities that are reported at fair value. Management believes the change in fair value of equity securities should be removed from select financial measures because it enables the reader to better understand the business’ ongoing ability to generate revenue and income. Page – 18 | Corporate Finance (2) Noninterest expense includes corporate allocations of $16 million in 1Q 2024, $13 million in 4Q 2023, and $15 million in 1Q 2023. (3) Change in fair value of equity securities impacts the Corporate Finance segment. The change reflects fair value adjustments to equity securities that are reported at fair value. Management believes the change in fair value of equity securities should be removed from select financial measures because it enables the reader to better understand the business’ ongoing ability to generate revenue and income. Page – 19 | Mortgage Finance (1) Noninterest expense includes corporate allocations of $21 million in 1Q 2024, $19 million in 4Q 2023, and $24 million in 1Q 2023. (2) 1st lien only. Updated home values derived using a combination of appraisals, Broker price opinion (BPOs), Automated Valuation Models (AVMs) and Metropolitan Statistical Area (MSA) level house price indices. 30
1Q 2024 Preliminary Results Supplemental Additional Notes Page – 22 | Results by Segment (2) Change in fair value of equity securities impacts the Insurance, Corporate Finance and Corporate and Other segments. The change reflects fair value adjustments to equity securities that are reported at fair value. Management believes the change in fair value of equity securities should be removed from select financial measures because it enables the reader to better understand the business’ ongoing ability to generate revenue and income. (3) Repositioning and other which are primarily related to the extinguishment of high-cost legacy debt, strategic activities, restructuring, and significant other one-time items, as applicable for respective periods or businesses. (4) Includes adjustments for non-GAAP measures Core OID expense, change in fair value of equity securities, and repositioning. Page – 23 | Corporate and Other (2) Repositioning and other which are primarily related to the extinguishment of high-cost legacy debt, strategic activities, restructuring, and significant other one-time items, as applicable for respective periods or businesses. (3) Change in fair value of equity securities impacts the Corporate and Other segments. The change reflects fair value adjustments to equity securities that are reported at fair value. Management believes the change in fair value of equity securities should be removed from select financial measures because it enables the reader to better understand the business’ ongoing ability to generate revenue and income. (4) HFI legacy mortgage portfolio and HFI Ally Credit Card portfolio 1Q 2024 and 4Q 2023 and includes HFI Ally Lending in 1Q 2023. (5) Amounts related to Ally Lending; Ally Lending sale closed on 3/1/2024. (6) Intercompany loan related to activity between Insurance and Corporate for liquidity purposes from the wind down of the Demand Notes program. Includes loans held-for-sale. 31
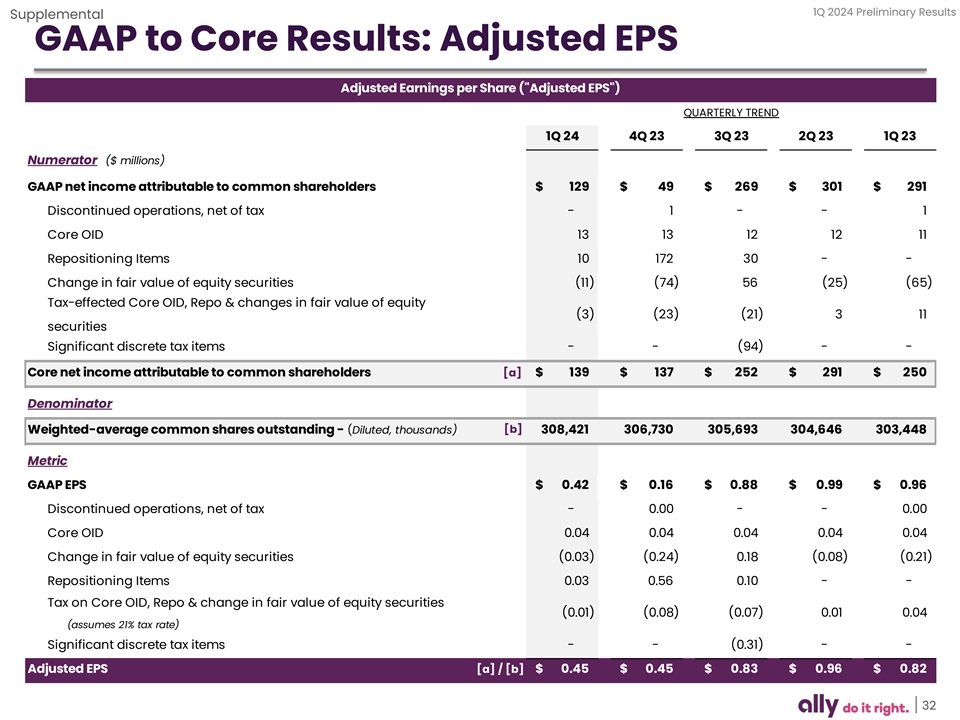
1Q 2024 Preliminary Results Supplemental GAAP to Core Results: Adjusted EPS Adjusted Earnings per Share ( Adjusted EPS ) QUARTERLY TREND 1Q 24 4Q 23 3Q 23 2Q 23 1Q 23 Numerator ($ millions) GAAP net income attributable to common shareholders $ 129 $ 49 $ 269 $ 3 01 $ 291 Discontinued operations, net of tax - 1 - - 1 Core OID 13 13 12 12 11 Repositioning Items 10 172 30 - - Change in fair value of equity securities (11) (74) 56 (25) (65) Tax-effected Core OID, Repo & changes in fair value of equity (3) ( 23) (21) 3 11 securities Significant discrete tax items - - ( 94) - - Core net income attributable to common shareholders [a] $ 139 $ 137 $ 252 $ 291 $ 250 Denominator Weighted-average common shares outstanding - (Diluted, thousands) [b] 308,421 306,730 305,693 304,646 303,448 Metric GAAP EPS $ 0.42 $ 0.16 $ 0.88 $ 0.99 $ 0.96 Discontinued operations, net of tax - 0.00 - - 0.00 Core OID 0.04 0.04 0.04 0.04 0.04 Change in fair value of equity securities (0.03) ( 0.24) 0.18 (0.08) ( 0.21) Repositioning Items 0.03 0.56 0.10 - - Tax on Core OID, Repo & change in fair value of equity securities (0.01) ( 0.08) (0.07) 0.01 0.04 (assumes 21% tax rate) Significant discrete tax items - - (0.31) - - Adjusted EPS [a] / [b] $ 0.45 $ 0 .45 $ 0.83 $ 0.96 $ 0.82 32
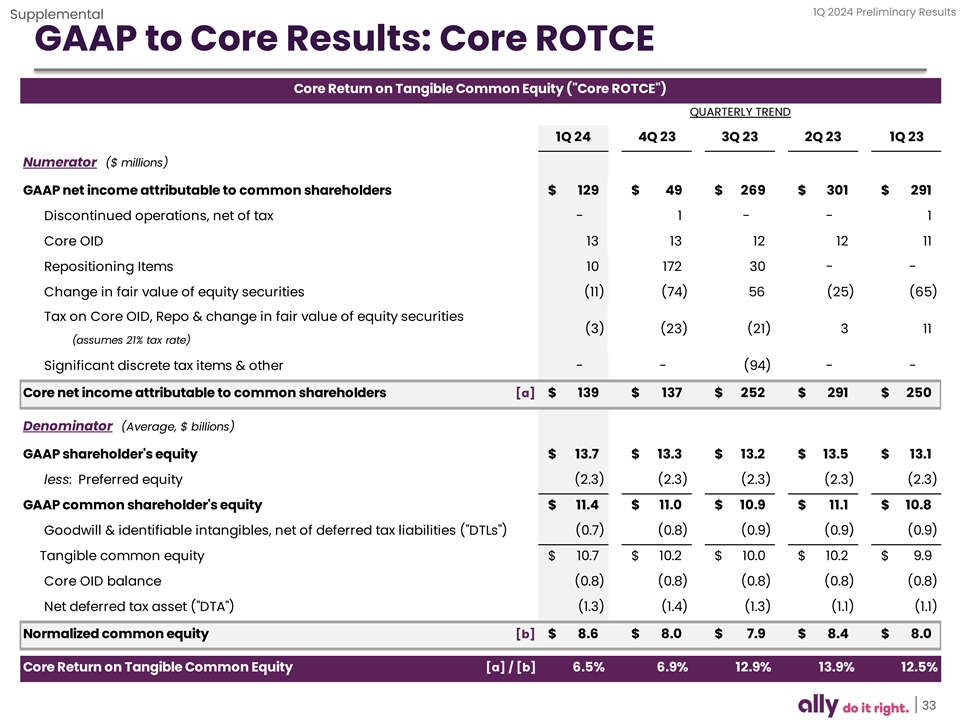
1Q 2024 Preliminary Results Supplemental GAAP to Core Results: Core ROTCE Core Return on Tangible Common Equity ( Core ROTCE ) QUARTERLY TREND 1Q 24 4Q 23 3Q 23 2Q 23 1Q 23 Numerator ($ millions) GAAP net income attributable to common shareholders $ 1 29 $ 49 $ 269 $ 301 $ 291 Discontinued operations, net of tax - 1 - - 1 Core OID 13 13 12 12 11 Repositioning Items 10 1 72 30 - - Change in fair value of equity securities (11) (74) 56 (25) ( 65) Tax on Core OID, Repo & change in fair value of equity securities (3) (23) (21) 3 11 (assumes 21% tax rate) Significant discrete tax items & other - - (94) - - Core net income attributable to common shareholders [a] $ 139 $ 137 $ 252 $ 2 91 $ 250 Denominator (Average, $ billions) GAAP shareholder's equity $ 13.7 $ 13.3 $ 13.2 $ 13.5 $ 13.1 less: Preferred equity (2.3) (2.3) (2.3) (2.3) (2.3) GAAP common shareholder's equity $ 11.4 $ 11.0 $ 10.9 $ 11.1 $ 1 0.8 Goodwill & identifiable intangibles, net of deferred tax liabilities ( DTLs ) (0.7) (0.8) (0.9) (0.9) (0.9) Tangible common equity $ 10.7 $ 10.2 $ 10.0 $ 10.2 $ 9.9 Core OID balance (0.8) (0.8) (0.8) (0.8) (0.8) Net deferred tax asset ( DTA ) (1.3) (1.4) (1.3) (1.1) (1.1) Normalized common equity [b] $ 8.6 $ 8 .0 $ 7. 9 $ 8 .4 $ 8 .0 Core Return on Tangible Common Equity [a] / [b] 6.5% 6.9% 12.9% 13.9% 12.5% 33
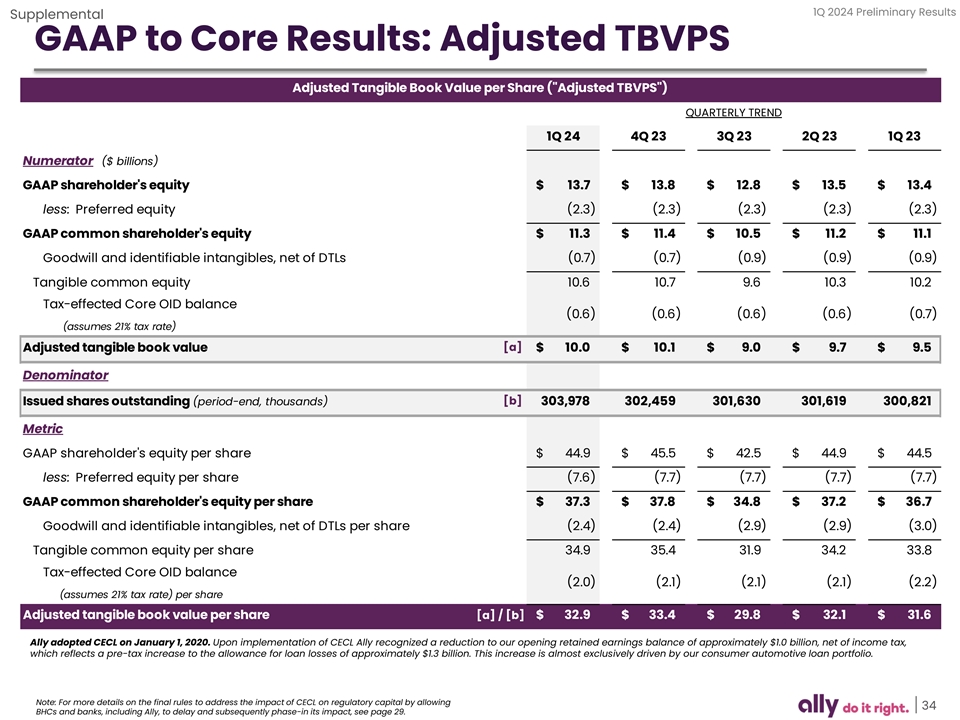
1Q 2024 Preliminary Results Supplemental GAAP to Core Results: Adjusted TBVPS Adjusted Tangible Book Value per Share ( Adjusted TBVPS ) QUARTERLY TREND 1Q 24 4Q 23 3Q 23 2Q 23 1Q 23 Numerator ($ billions) GAAP shareholder's equity $ 13.7 $ 13.8 $ 12.8 $ 13.5 $ 13.4 less: Preferred equity (2.3) (2.3) (2.3) (2.3) (2.3) GAAP common shareholder's equity $ 11.3 $ 11.4 $ 10.5 $ 1 1.2 $ 11.1 Goodwill and identifiable intangibles, net of DTLs (0.7) (0.7) (0.9) (0.9) (0.9) Tangible common equity 10.6 1 0.7 9.6 10.3 10.2 Tax-effected Core OID balance ( 0.6) ( 0.6) ( 0.6) (0.6) (0.7) (assumes 21% tax rate) [a] Adjusted tangible book value $ 10.0 $ 10.1 $ 9.0 $ 9.7 $ 9.5 Denominator Issued shares outstanding (period-end, thousands) [b] 3 03,978 302,459 301,630 301,619 300,821 Metric GAAP shareholder's equity per share $ 44.9 $ 45.5 $ 42.5 $ 44.9 $ 44.5 less: Preferred equity per share (7.6) (7.7) (7.7) (7.7) (7.7) GAAP common shareholder's equity per share $ 37.3 $ 37.8 $ 34.8 $ 37.2 $ 3 6.7 Goodwill and identifiable intangibles, net of DTLs per share (2.4) (2.4) (2.9) (2.9) (3.0) Tangible common equity per share 34.9 35.4 31.9 34.2 33.8 Tax-effected Core OID balance (2.0) (2.1) (2.1) (2.1) (2.2) (assumes 21% tax rate) per share Adjusted tangible book value per share [a] / [b] $ 32.9 $ 33.4 $ 29.8 $ 3 2.1 $ 31.6 Ally adopted CECL on January 1, 2020. Upon implementation of CECL Ally recognized a reduction to our opening retained earnings balance of approximately $1.0 billion, net of income tax, which reflects a pre-tax increase to the allowance for loan losses of approximately $1.3 billion. This increase is almost exclusively driven by our consumer automotive loan portfolio. Note: For more details on the final rules to address the impact of CECL on regulatory capital by allowing 34 BHCs and banks, including Ally, to delay and subsequently phase-in its impact, see page 29.
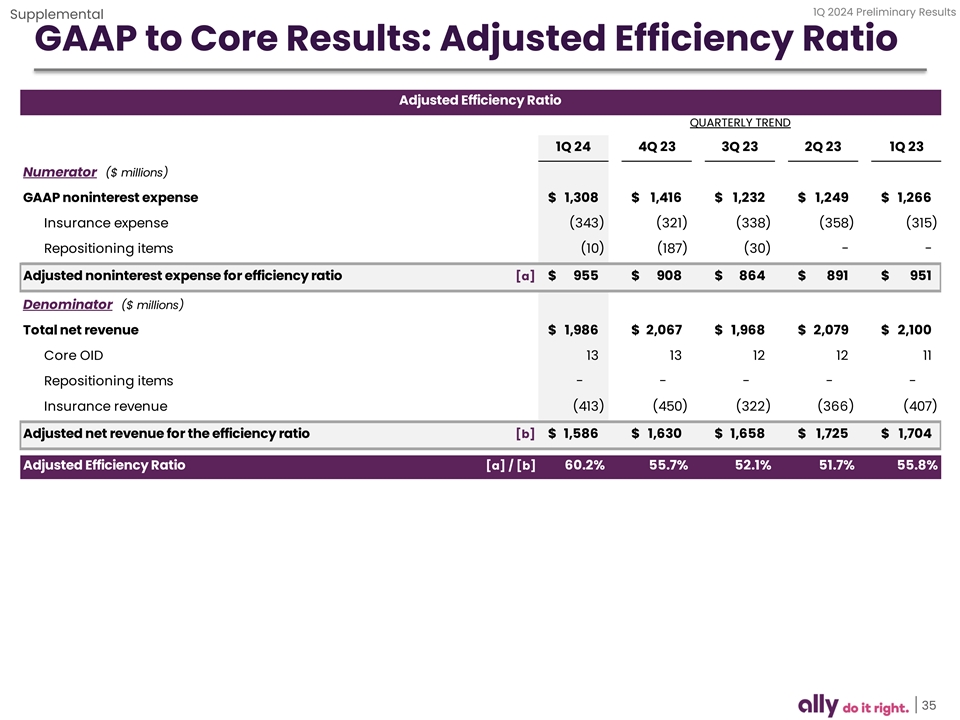
1Q 2024 Preliminary Results Supplemental GAAP to Core Results: Adjusted Efficiency Ratio Adjusted Efficiency Ratio QUARTERLY TREND 1Q 24 4Q 23 3Q 23 2Q 23 1Q 23 Numerator ($ millions) GAAP noninterest expense $ 1,308 $ 1,416 $ 1,232 $ 1,249 $ 1 ,266 Insurance expense (343) (321) ( 338) (358) (315) Repositioning items (10) (187) (30) - - Adjusted noninterest expense for efficiency ratio [a] $ 955 $ 908 $ 8 64 $ 891 $ 951 Denominator ($ millions) Total net revenue $ 1 ,986 $ 2,067 $ 1,968 $ 2,079 $ 2,100 Core OID 13 13 12 12 11 Repositioning items - - - - - Insurance revenue (413) ( 450) ( 322) (366) (407) Adjusted net revenue for the efficiency ratio [b] $ 1,586 $ 1 ,630 $ 1,658 $ 1,725 $ 1,704 Adjusted Efficiency Ratio [a] / [b] 60.2% 55.7% 52.1% 51.7% 55.8% 35

1Q 2024 Preliminary Results Supplemental Non-GAAP Reconciliations ($ millions) QUARTERLY TREND Net Financing Revenue (ex. Core OID) 1Q 24 4Q 23 3Q 23 2Q 23 1Q 23 GAAP Net Financing Revenue $ 1,456 $ 1,493 $ 1 ,533 $ 1,573 $ 1,602 Core OID 13 13 12 12 11 Net Financing Revenue (ex. Core OID) [a] $ 1,469 $ 1,506 $ 1,545 $ 1 ,585 $ 1 ,613 Adjusted Other Revenue GAAP Other Revenue $ 530 $ 574 $ 435 $ 5 06 $ 498 Accelerated OID & repositioning items - - - - - Change in fair value of equity securities ( 11) (74) 56 (25) (65) Adjusted Other Revenue [b] $ 5 19 $ 5 00 $ 491 $ 481 $ 433 Adjusted Total Net Revenue Adjusted Total Net Revenue [a]+[b] $ 1,989 $ 2,006 $ 2,036 $ 2,066 $ 2,047 Adjusted Provision for Credit Losses GAAP Provision for Credit Losses $ 507 $ 587 $ 508 $ 427 $ 446 Repositioning - 16 - - - Adjusted Provision for Credit Losses $ 507 $ 603 $ 508 $ 427 $ 446 Adjusted NIE (ex. Repositioning) GAAP Noninterest Expense $ 1 ,308 $ 1,416 $ 1,232 $ 1 ,249 $ 1,266 Repositioning (10) (187) (30) - - Adjusted NIE (ex. Repositioning) $ 1,298 $ 1,229 $ 1,202 $ 1 ,249 $ 1,266 Original issue discount amortization expense GAAP original issue discount amortization expense $ 17 $ 16 $ 15 $ 15 $ 15 Other OID (3) (3) ( 3) (3) (3) Core original issue discount (Core OID) amortization expense $ 13 $ 13 $ 12 $ 12 $ 11 Outstanding original issue discount balance GAAP outstanding original issue discount balance $ ( 815) $ (831) $ ( 847) $ ( 863) $ (878) Other outstanding OID balance 35 39 42 45 48 Core outstanding original issue discount balance (Core OID balance) $ (779) $ (793) $ (806) $ (818) $ ( 830) Note: Change in fair value of equity securities impacts the Insurance, Corporate Finance and Corporate and Other segments. The change reflects fair value adjustments to equity securities that are reported at fair value. Management believes the change in fair value of equity securities should be removed from select financial measures because it enables the reader to better understand the business’ ongoing ability to generate revenue and income. 36